Hindustan National Glass - Business...
20
Amnish Aggarwal ([email protected]); Tel: +91 22 3982 5404 Hindustan National Glass Initiating Coverage SECTOR: GLASS & GLASS PRODUCTS Profitable growth
Transcript of Hindustan National Glass - Business...

Amnish Aggarwal ([email protected]); Tel: +91 22 3982 5404
Hindustan National Glass
Initiating CoverageSECTOR: GLASS & GLASS PRODUCTS
Profitable growth
Hindustan National Glass & Industries
230 July 2010
Contents
Page No.
Market leadership through acquisitions ............................................................. 4-5
Best placed to cater to demand surge from user industries .............................. 6-9
Container glass industry volumes to grow in double digits ................................. 10
Changing industry dynamics, cost control to enhance profitability ............... 11-12
Also a play on the booming housing/construction segment ................................ 13
16% PAT CAGR over FY10-12; growth to accelerate post FY12 ................ 14-15
Buy with a target of Rs325 – 51% upside ........................................................... 16
Financials and valuation .................................................................................. 17-18
STOCK DATA
52-Week Range (Rs) 275/116
Major Shareholders (as of March 2010) %Promoter 74.2Domestic Inst 0.4Foreign 0.0Others 25.5
Average Daily TurnoverVolume ('000 shares) 106.1Value (Rs million) 23.11/6/12 Month Rel. Performance (%) -3/-17/581/6/12 Month Abs. Performance (%) -1/-7/75
KEY FINANCIALS
Shares Outstanding (m) 87.3
Market Cap. (Rs b) 18.8
Market Cap. (US$ b) 0.4
Past 3 yrs. Sales Growth (%) 37.8
Past 3 yrs. NP Growth (%) 66.8
Dividend Payout (%) 5.5Dividend Yield (%) 0.8
Y/E MARCH 2009 2010 2011E 2012E
Sales (Rs m) 13,251 13,867 15,686 17,494
EBITDA (Rs m) 2,699 3,116 3,982 4,703
NP (Rs m) 1,493 1,582 2,081 2,123
EPS (Rs) 21.4 22.7 28.6 29.2
EPS Growth (%) 6.0 26.2 2.0
BV/Share (Rs) 107.1 119.4 146.7 168.4
P/E (x) 10.0 9.5 7.5 7.4
P/BV (x) 2.0 1.8 1.5 1.3
EV/EBITDA (x) 2.8 2.5 1.8 2.2
EV/Sales (x) 0.3 0.3 0.2 0.4
RoE (%) 16.0 15.2 16.2 14.4
RoCE (%) 18.2 18.6 19.4 19.1
STOCK PERFORMANCE (1 YEAR)
SECTOR: GLASS & GLASS PRODUCTS
330 July 2010
Hindustan National GlassRs215 Initiating Coverage: BuyBSE SENSEX S&P CNX BLOOMBERG REUTERS
17,868 5,368 HNGI IN HNGI.BO
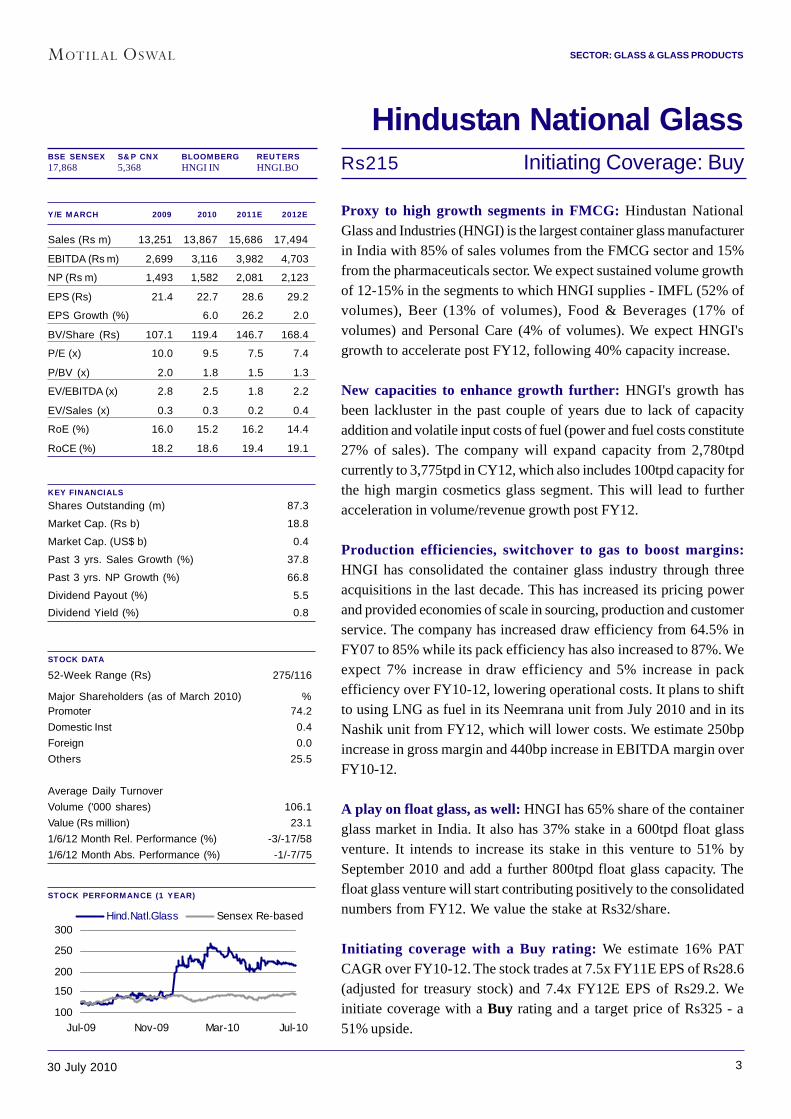
Proxy to high growth segments in FMCG: Hindustan NationalGlass and Industries (HNGI) is the largest container glass manufacturerin India with 85% of sales volumes from the FMCG sector and 15%from the pharmaceuticals sector. We expect sustained volume growthof 12-15% in the segments to which HNGI supplies - IMFL (52% ofvolumes), Beer (13% of volumes), Food & Beverages (17% ofvolumes) and Personal Care (4% of volumes). We expect HNGI'sgrowth to accelerate post FY12, following 40% capacity increase.
New capacities to enhance growth further: HNGI's growth hasbeen lackluster in the past couple of years due to lack of capacityaddition and volatile input costs of fuel (power and fuel costs constitute27% of sales). The company will expand capacity from 2,780tpdcurrently to 3,775tpd in CY12, which also includes 100tpd capacity forthe high margin cosmetics glass segment. This will lead to furtheracceleration in volume/revenue growth post FY12.
Production efficiencies, switchover to gas to boost margins:HNGI has consolidated the container glass industry through threeacquisitions in the last decade. This has increased its pricing powerand provided economies of scale in sourcing, production and customerservice. The company has increased draw efficiency from 64.5% inFY07 to 85% while its pack efficiency has also increased to 87%. Weexpect 7% increase in draw efficiency and 5% increase in packefficiency over FY10-12, lowering operational costs. It plans to shiftto using LNG as fuel in its Neemrana unit from July 2010 and in itsNashik unit from FY12, which will lower costs. We estimate 250bpincrease in gross margin and 440bp increase in EBITDA margin overFY10-12.
A play on float glass, as well: HNGI has 65% share of the containerglass market in India. It also has 37% stake in a 600tpd float glassventure. It intends to increase its stake in this venture to 51% bySeptember 2010 and add a further 800tpd float glass capacity. Thefloat glass venture will start contributing positively to the consolidatednumbers from FY12. We value the stake at Rs32/share.
Initiating coverage with a Buy rating: We estimate 16% PATCAGR over FY10-12. The stock trades at 7.5x FY11E EPS of Rs28.6(adjusted for treasury stock) and 7.4x FY12E EPS of Rs29.2. Weinitiate coverage with a Buy rating and a target price of Rs325 - a51% upside.
100
150
200
250
300
Jul-09 Nov-09 Mar-10 Jul-10
Hind.Natl.Glass Sensex Re-based
Hindustan National Glass & Industries
430 July 2010
Market leadership through acquisitions
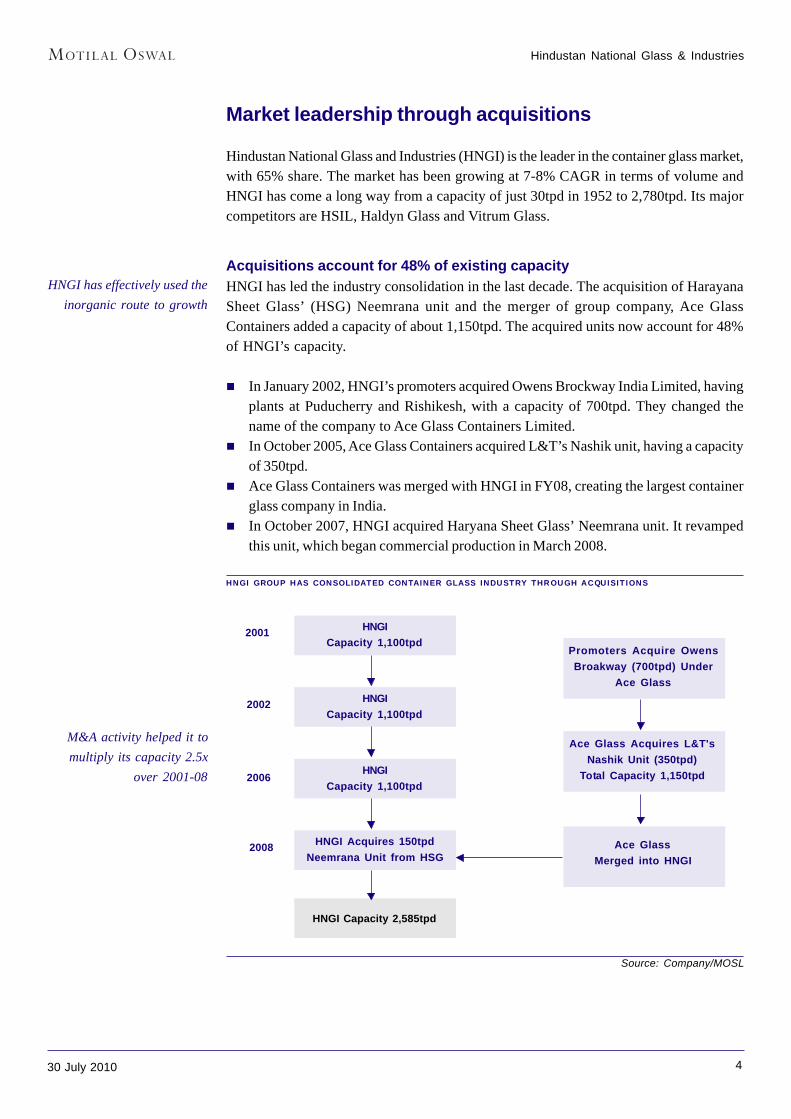
Hindustan National Glass and Industries (HNGI) is the leader in the container glass market,with 65% share. The market has been growing at 7-8% CAGR in terms of volume andHNGI has come a long way from a capacity of just 30tpd in 1952 to 2,780tpd. Its majorcompetitors are HSIL, Haldyn Glass and Vitrum Glass.
Acquisitions account for 48% of existing capacityHNGI has led the industry consolidation in the last decade. The acquisition of HarayanaSheet Glass’ (HSG) Neemrana unit and the merger of group company, Ace GlassContainers added a capacity of about 1,150tpd. The acquired units now account for 48%of HNGI’s capacity.
In January 2002, HNGI’s promoters acquired Owens Brockway India Limited, havingplants at Puducherry and Rishikesh, with a capacity of 700tpd. They changed thename of the company to Ace Glass Containers Limited.In October 2005, Ace Glass Containers acquired L&T’s Nashik unit, having a capacityof 350tpd.Ace Glass Containers was merged with HNGI in FY08, creating the largest containerglass company in India.In October 2007, HNGI acquired Haryana Sheet Glass’ Neemrana unit. It revampedthis unit, which began commercial production in March 2008.
HNGI GROUP HAS CONSOLIDATED CONTAINER GLASS INDUSTRY THROUGH ACQUISITIONS
Source: Company/MOSL
Ace Glass Acquires L&T'sNashik Unit (350tpd)
Total Capacity 1,150tpd
HNGI Capacity 2,585tpd
HNGICapacity 1,100tpd
HNGICapacity 1,100tpd
HNGICapacity 1,100tpd
HNGI Acquires 150tpdNeemrana Unit from HSG
Promoters Acquire OwensBroakway (700tpd) Under
Ace Glass
Ace GlassMerged into HNGI
2001
2002
2006
2008
HNGI has effectively used theinorganic route to growth
M&A activity helped it tomultiply its capacity 2.5x
over 2001-08
Hindustan National Glass & Industries
530 July 2010
Source: Company/MOSL
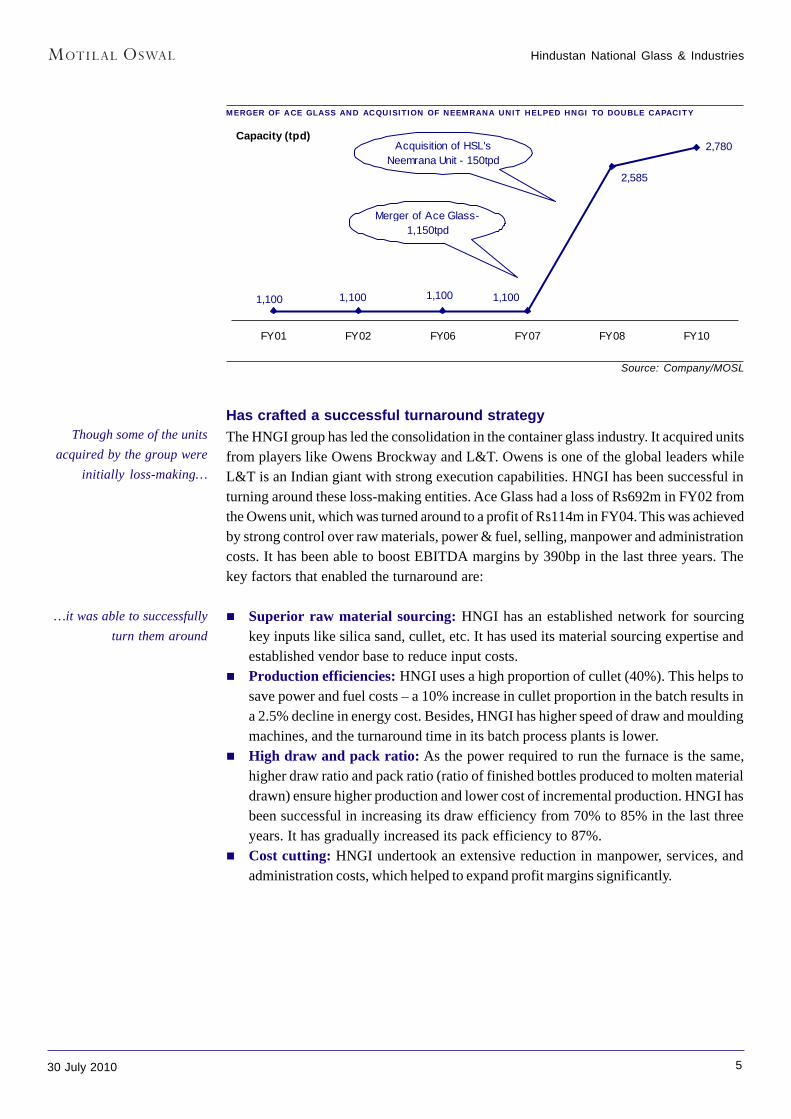
Has crafted a successful turnaround strategyThe HNGI group has led the consolidation in the container glass industry. It acquired unitsfrom players like Owens Brockway and L&T. Owens is one of the global leaders whileL&T is an Indian giant with strong execution capabilities. HNGI has been successful inturning around these loss-making entities. Ace Glass had a loss of Rs692m in FY02 fromthe Owens unit, which was turned around to a profit of Rs114m in FY04. This was achievedby strong control over raw materials, power & fuel, selling, manpower and administrationcosts. It has been able to boost EBITDA margins by 390bp in the last three years. Thekey factors that enabled the turnaround are:
Superior raw material sourcing: HNGI has an established network for sourcingkey inputs like silica sand, cullet, etc. It has used its material sourcing expertise andestablished vendor base to reduce input costs.Production efficiencies: HNGI uses a high proportion of cullet (40%). This helps tosave power and fuel costs – a 10% increase in cullet proportion in the batch results ina 2.5% decline in energy cost. Besides, HNGI has higher speed of draw and mouldingmachines, and the turnaround time in its batch process plants is lower.High draw and pack ratio: As the power required to run the furnace is the same,higher draw ratio and pack ratio (ratio of finished bottles produced to molten materialdrawn) ensure higher production and lower cost of incremental production. HNGI hasbeen successful in increasing its draw efficiency from 70% to 85% in the last threeyears. It has gradually increased its pack efficiency to 87%.Cost cutting: HNGI undertook an extensive reduction in manpower, services, andadministration costs, which helped to expand profit margins significantly.
MERGER OF ACE GLASS AND ACQUISITION OF NEEMRANA UNIT HELPED HNGI TO DOUBLE CAPACITY
Capacity (tpd)2,780
2,585
1,1001,1001,1001,100
FY01 FY02 FY06 FY07 FY08 FY10
Merger of Ace Glass- 1,150tpd
Acquisition of HSL's Neemrana Unit - 150tpd
Though some of the unitsacquired by the group were
initially loss-making…
…it was able to successfullyturn them around
Hindustan National Glass & Industries
630 July 2010
Best placed to cater to demand surge from user industries
HNGI is a play on strong volume growth in segments like IMFL, beer, food, dairy, softdrinks, pharmaceuticals and personal care. It is the only player in the container glassindustry with a pan India presence, enabling it to serve user industries across geographies.It is setting up a 650tpd capacity at Naidupeta to cater to the high growth South Indiamarket. It is also setting up an additional 100tpd capacity in Nashik to cater to the high-margin cosmetics segment. We estimate 6.5% volume CAGR over FY10-12, which wouldincrease to 23% CAGR over FY12-14 buoyed by capacity expansions.
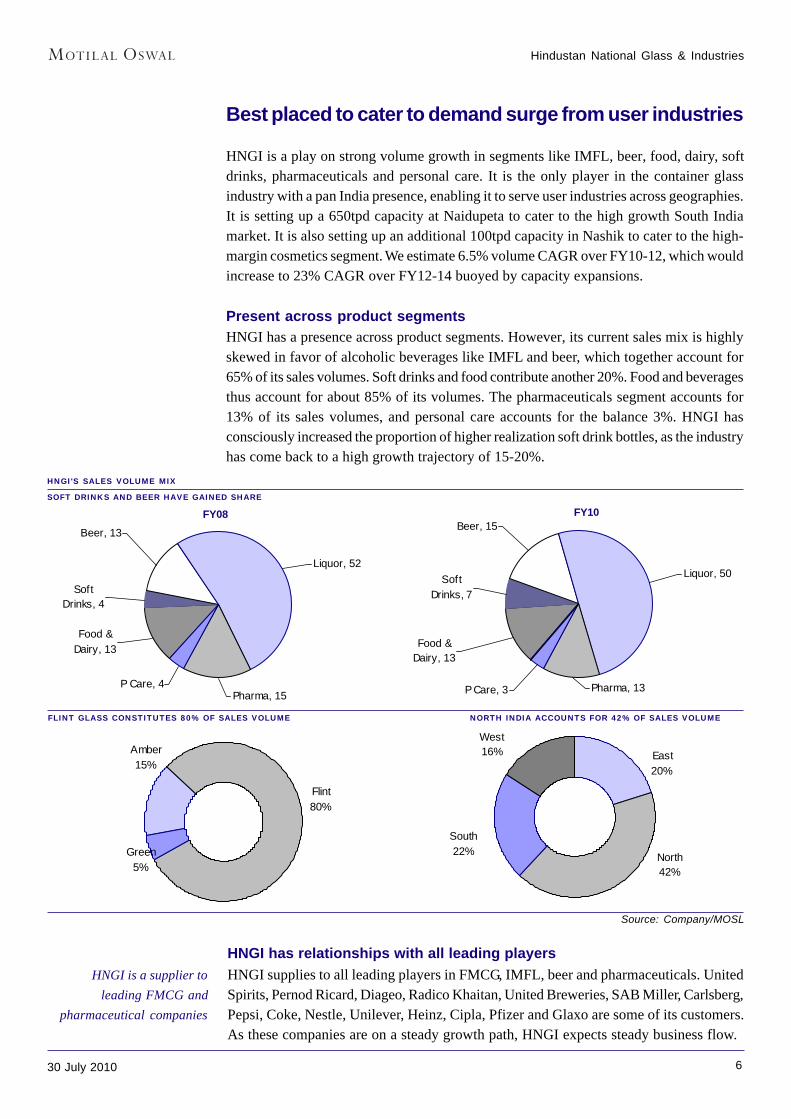
Present across product segmentsHNGI has a presence across product segments. However, its current sales mix is highlyskewed in favor of alcoholic beverages like IMFL and beer, which together account for65% of its sales volumes. Soft drinks and food contribute another 20%. Food and beveragesthus account for about 85% of its volumes. The pharmaceuticals segment accounts for13% of its sales volumes, and personal care accounts for the balance 3%. HNGI hasconsciously increased the proportion of higher realization soft drink bottles, as the industryhas come back to a high growth trajectory of 15-20%.
HNGI'S SALES VOLUME MIX
SOFT DRINKS AND BEER HAVE GAINED SHARE
FLINT GLASS CONSTITUTES 80% OF SALES VOLUME NORTH INDIA ACCOUNTS FOR 42% OF SALES VOLUME
Source: Company/MOSL
HNGI has relationships with all leading playersHNGI supplies to all leading players in FMCG, IMFL, beer and pharmaceuticals. UnitedSpirits, Pernod Ricard, Diageo, Radico Khaitan, United Breweries, SAB Miller, Carlsberg,Pepsi, Coke, Nestle, Unilever, Heinz, Cipla, Pfizer and Glaxo are some of its customers.As these companies are on a steady growth path, HNGI expects steady business flow.
Soft Drinks, 7
Food & Dairy, 13
Beer, 15
Pharma, 13P Care, 3
Liquor, 50
P Care, 4
Liquor, 52
Food & Dairy, 13
Soft Drinks, 4
Pharma, 15
Beer, 13
Amber15%
Flint80%
Green5%
West16% East
20%
North42%
South22%
FY10FY08
HNGI is a supplier toleading FMCG and
pharmaceutical companies
Hindustan National Glass & Industries
730 July 2010
Source: Company/MOSL
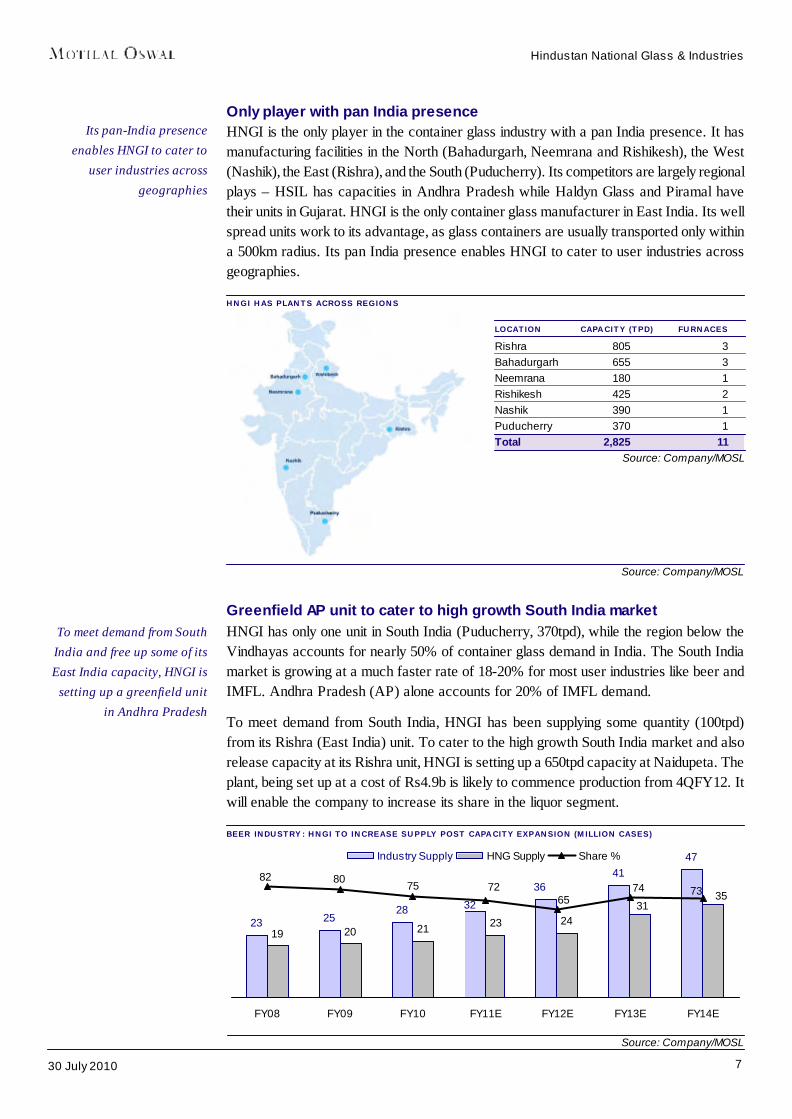
Greenfield AP unit to cater to high growth South India marketHNGI has only one unit in South India (Puducherry, 370tpd), while the region below theVindhayas accounts for nearly 50% of container glass demand in India. The South Indiamarket is growing at a much faster rate of 18-20% for most user industries like beer andIMFL. Andhra Pradesh (AP) alone accounts for 20% of IMFL demand.
To meet demand from South India, HNGI has been supplying some quantity (100tpd)from its Rishra (East India) unit. To cater to the high growth South India market and alsorelease capacity at its Rishra unit, HNGI is setting up a 650tpd capacity at Naidupeta. Theplant, being set up at a cost of Rs4.9b is likely to commence production from 4QFY12. Itwill enable the company to increase its share in the liquor segment.
BEER INDUSTRY: HNGI TO INCREASE SUPPLY POST CAPACITY EXPANSION (MILLION CASES)
Only player with pan India presenceHNGI is the only player in the container glass industry with a pan India presence. It hasmanufacturing facilities in the North (Bahadurgarh, Neemrana and Rishikesh), the West(Nashik), the East (Rishra), and the South (Puducherry). Its competitors are largely regionalplays – HSIL has capacities in Andhra Pradesh while Haldyn Glass and Piramal havetheir units in Gujarat. HNGI is the only container glass manufacturer in East India. Its wellspread units work to its advantage, as glass containers are usually transported only withina 500km radius. Its pan India presence enables HNGI to cater to user industries acrossgeographies.
HNGI HAS PLANTS ACROSS REGIONS LOCATION CAPACITY (TPD) FURNACESRishra 805 3Bahadurgarh 655 3Neemrana 180 1Rishikesh 425 2Nashik 390 1Puducherry 370 1Total 2,825 11
Source: Company/MOSL
Source: Company/MOSL
23 2528
4147
19 20 21 23 24
36
3235
31
7465
72758082
73
FY08 FY09 FY10 FY11E FY12E FY13E FY14E
Industry Supply HNG Supply Share %
Its pan-India presenceenables HNGI to cater to
user industries acrossgeographies
To meet demand from SouthIndia and free up some of itsEast India capacity, HNGI is
setting up a greenfield unitin Andhra Pradesh
Hindustan National Glass & Industries
830 July 2010
Source: Company/MOSL
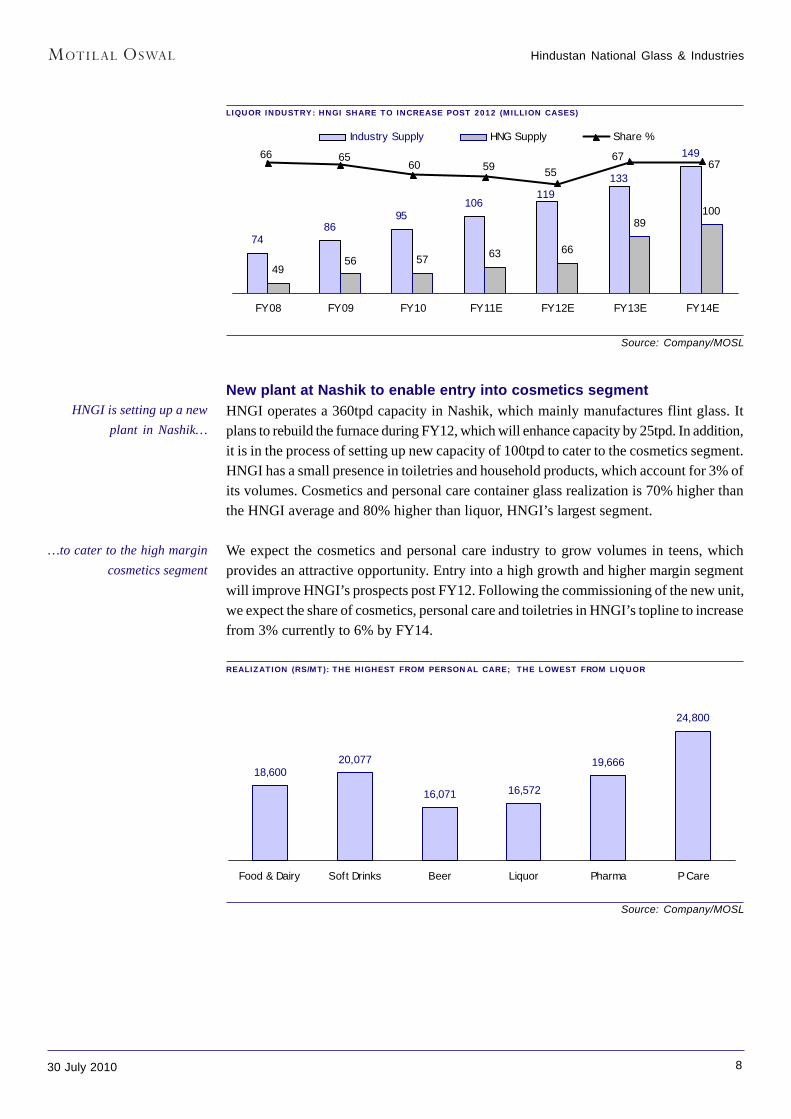
New plant at Nashik to enable entry into cosmetics segmentHNGI operates a 360tpd capacity in Nashik, which mainly manufactures flint glass. Itplans to rebuild the furnace during FY12, which will enhance capacity by 25tpd. In addition,it is in the process of setting up new capacity of 100tpd to cater to the cosmetics segment.HNGI has a small presence in toiletries and household products, which account for 3% ofits volumes. Cosmetics and personal care container glass realization is 70% higher thanthe HNGI average and 80% higher than liquor, HNGI’s largest segment.
We expect the cosmetics and personal care industry to grow volumes in teens, whichprovides an attractive opportunity. Entry into a high growth and higher margin segmentwill improve HNGI’s prospects post FY12. Following the commissioning of the new unit,we expect the share of cosmetics, personal care and toiletries in HNGI’s topline to increasefrom 3% currently to 6% by FY14.
REALIZATION (RS/MT): THE HIGHEST FROM PERSONAL CARE; THE LOWEST FROM LIQUOR
LIQUOR INDUSTRY: HNGI SHARE TO INCREASE POST 2012 (MILLION CASES)
Source: Company/MOSL
7486
95106
149
4956 57 63 66
89100
133119
6766 65
60 59 5567
FY08 FY09 FY10 FY11E FY12E FY13E FY14E
Industry Supply HNG Supply Share %
18,60020,077
16,071 16,572
19,666
24,800
Food & Dairy Soft Drinks Beer Liquor Pharma P Care
HNGI is setting up a newplant in Nashik…
…to cater to the high margincosmetics segment
Hindustan National Glass & Industries
930 July 2010
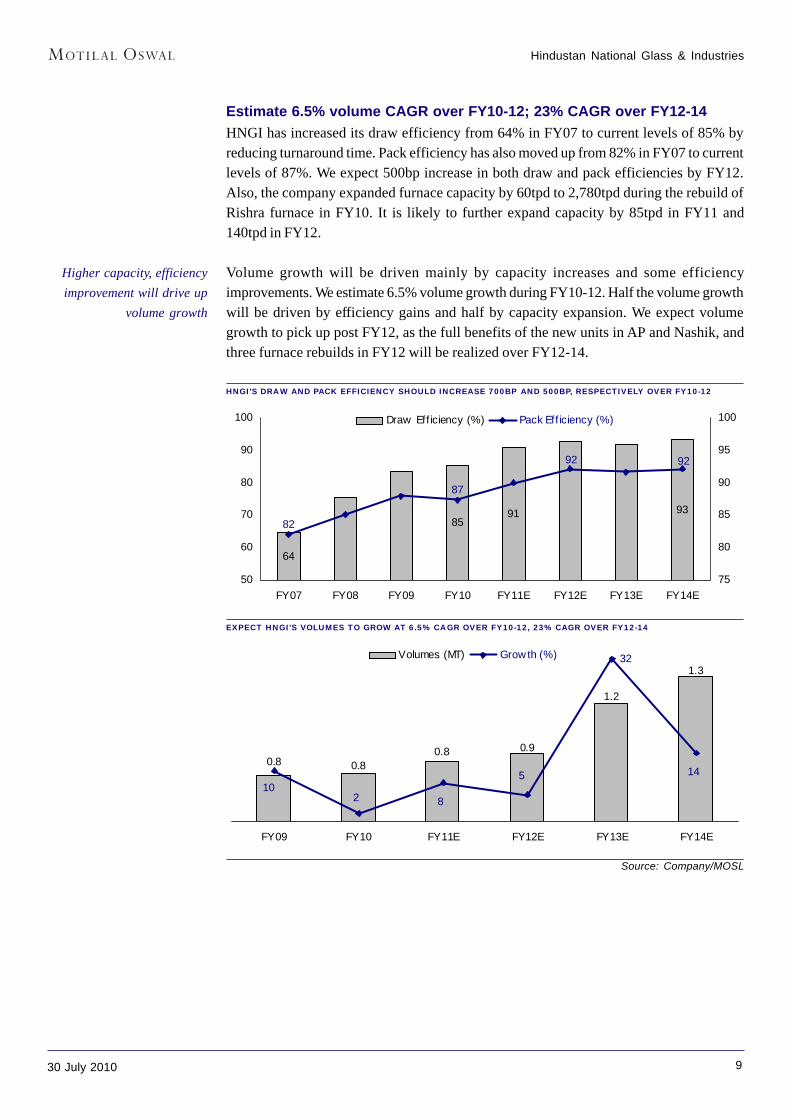
Estimate 6.5% volume CAGR over FY10-12; 23% CAGR over FY12-14HNGI has increased its draw efficiency from 64% in FY07 to current levels of 85% byreducing turnaround time. Pack efficiency has also moved up from 82% in FY07 to currentlevels of 87%. We expect 500bp increase in both draw and pack efficiencies by FY12.Also, the company expanded furnace capacity by 60tpd to 2,780tpd during the rebuild ofRishra furnace in FY10. It is likely to further expand capacity by 85tpd in FY11 and140tpd in FY12.
Volume growth will be driven mainly by capacity increases and some efficiencyimprovements. We estimate 6.5% volume growth during FY10-12. Half the volume growthwill be driven by efficiency gains and half by capacity expansion. We expect volumegrowth to pick up post FY12, as the full benefits of the new units in AP and Nashik, andthree furnace rebuilds in FY12 will be realized over FY12-14.
HNGI'S DRAW AND PACK EFFICIENCY SHOULD INCREASE 700BP AND 500BP, RESPECTIVELY OVER FY10-12
EXPECT HNGI'S VOLUMES TO GROW AT 6.5% CAGR OVER FY10-12, 23% CAGR OVER FY12-14
Source: Company/MOSL
64
91 938582
87
92 92
50
60
70
80
90
100
FY07 FY08 FY09 FY10 FY11E FY12E FY13E FY14E75
80
85
90
95
100Draw Eff iciency (%) Pack Eff iciency (%)
0.8
1.2
0.80.8 0.9
1.3
102 8
5 14
32
FY09 FY10 FY11E FY12E FY13E FY14E
Volumes (MT) Growth (%)
Higher capacity, efficiencyimprovement will drive up
volume growth
Hindustan National Glass & Industries
1030 July 2010
Container glass industry volumes to grow in double digits
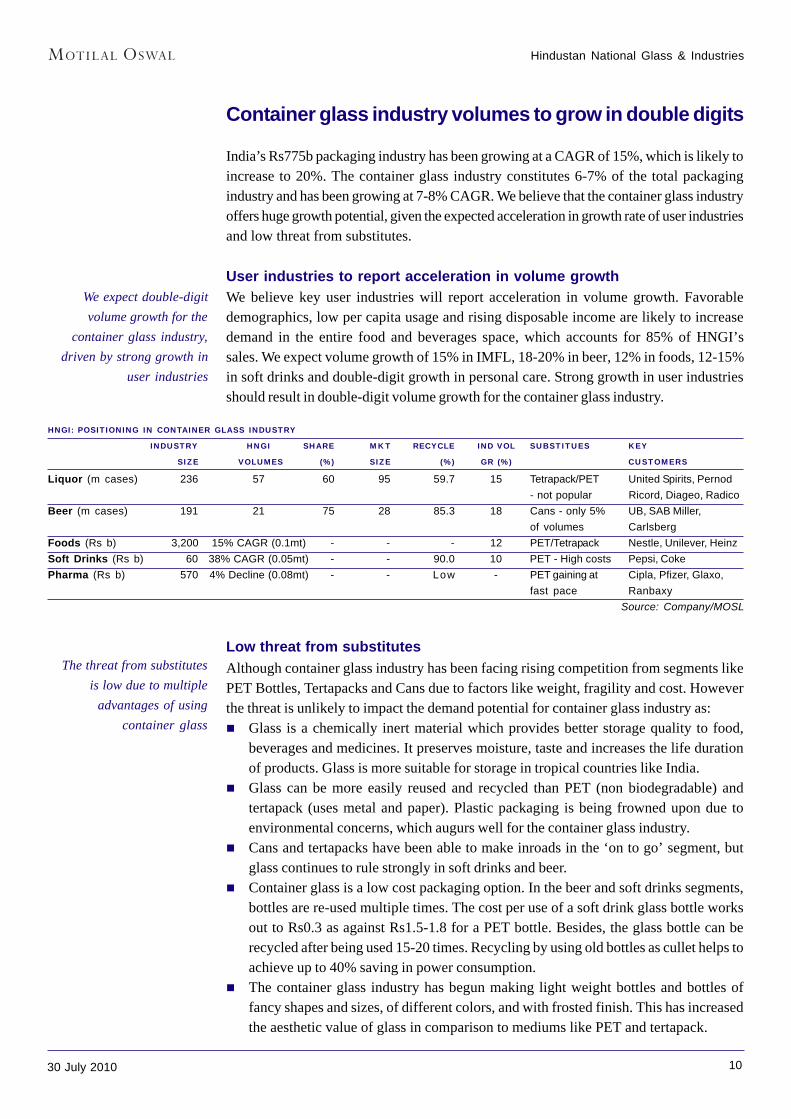
India’s Rs775b packaging industry has been growing at a CAGR of 15%, which is likely toincrease to 20%. The container glass industry constitutes 6-7% of the total packagingindustry and has been growing at 7-8% CAGR. We believe that the container glass industryoffers huge growth potential, given the expected acceleration in growth rate of user industriesand low threat from substitutes.
User industries to report acceleration in volume growthWe believe key user industries will report acceleration in volume growth. Favorabledemographics, low per capita usage and rising disposable income are likely to increasedemand in the entire food and beverages space, which accounts for 85% of HNGI’ssales. We expect volume growth of 15% in IMFL, 18-20% in beer, 12% in foods, 12-15%in soft drinks and double-digit growth in personal care. Strong growth in user industriesshould result in double-digit volume growth for the container glass industry.
HNGI: POSITIONING IN CONTAINER GLASS INDUSTRY
INDUSTRY HNGI SHARE MKT RECYCLE IND VOL SUBSTITUES KEY
SIZE VOLUMES (%) SIZE (%) GR (%) CUSTOMERS
Liquor (m cases) 236 57 60 95 59.7 15 Tetrapack/PET United Spirits, Pernod- not popular Ricord, Diageo, Radico
Beer (m cases) 191 21 75 28 85.3 18 Cans - only 5% UB, SAB Miller,of volumes Carlsberg
Foods (Rs b) 3,200 15% CAGR (0.1mt) - - - 12 PET/Tetrapack Nestle, Unilever, HeinzSoft Drinks (Rs b) 60 38% CAGR (0.05mt) - - 90.0 10 PET - High costs Pepsi, CokePharma (Rs b) 570 4% Decline (0.08mt) - - Low - PET gaining at Cipla, Pfizer, Glaxo,
fast pace RanbaxySource: Company/MOSL
Low threat from substitutesAlthough container glass industry has been facing rising competition from segments likePET Bottles, Tertapacks and Cans due to factors like weight, fragility and cost. Howeverthe threat is unlikely to impact the demand potential for container glass industry as:
Glass is a chemically inert material which provides better storage quality to food,beverages and medicines. It preserves moisture, taste and increases the life durationof products. Glass is more suitable for storage in tropical countries like India.Glass can be more easily reused and recycled than PET (non biodegradable) andtertapack (uses metal and paper). Plastic packaging is being frowned upon due toenvironmental concerns, which augurs well for the container glass industry.Cans and tertapacks have been able to make inroads in the ‘on to go’ segment, butglass continues to rule strongly in soft drinks and beer.Container glass is a low cost packaging option. In the beer and soft drinks segments,bottles are re-used multiple times. The cost per use of a soft drink glass bottle worksout to Rs0.3 as against Rs1.5-1.8 for a PET bottle. Besides, the glass bottle can berecycled after being used 15-20 times. Recycling by using old bottles as cullet helps toachieve up to 40% saving in power consumption.The container glass industry has begun making light weight bottles and bottles offancy shapes and sizes, of different colors, and with frosted finish. This has increasedthe aesthetic value of glass in comparison to mediums like PET and tertapack.
We expect double-digitvolume growth for the
container glass industry,driven by strong growth in
user industries
The threat from substitutesis low due to multiple
advantages of usingcontainer glass

Hindustan National Glass & Industries
1130 July 2010
Changing industry dynamics, cost control to enhanceprofitability
HNGI has reported EBITDA margin expansion of 480bp over FY06-10. It is the mostprofitable container glass manufacturer in India. Its EBIT margin for FY10 was 15.5% asagainst 11.2% for HSIL. We believe that HNGI will benefit from increasing economies ofscale, pricing power, efficient raw material sourcing and shift towards natural gas, whichwill further boost EBITDA margin by 440bp over FY10-12.
Consolidation increases pricing powerThe HNGI-led industry consolidation has increased its pricing power. It has 50% of India’scontainer glass capacity and 65% market share. Realization increased 17% in FY09, ashigher input costs forced the company to increase prices. However, prices did not declinein FY10, despite abatement in raw material inflation. Though user base is concentrated,HNGI’s pan India presence and large volumes give it pricing power.
HNGI: CONTAINER GLASS REALIZATION TO INCREASE AT 5.5% CAGR
Source: Company/MOSL
Emerging as a packaging solutions providerHNGI is transforming itself from a container glass supplier to a packaging solution provider.It has introduced narrow neck press and blow process (NNPB), which allows uniformdistribution of molten glass. This gives lighter but stronger bottles. This has ensured higherper ton realization for HNGI while reducing the per bottle cost for the customer (upto33% lower weight, lower transport cost, less breakage). By offering customized packagingsolutions in close coordination with the customer, HNGI has been able to protect/enhanceits margins. This has been the key factor in ensuring 2% increase in realization per ton inFY10 despite 17% price increase in FY09. We believe that focus on being a solutionssupplier will further reduce volatility in realizations.
Cost control initiativesHNGI’s gross margin (including power and fuel cost) has largely remained flat whileEBITDA margin has expanded by 480bp over the last four years. The company has beenable to maintain its gross margin despite sharp increase in input costs of power, fuel andsoda ash. EBITDA margin expansion has been driven by reduction in manufacturingexpenses and selling costs. We list below its various cost control measures:
1%
6%
17%
2%
6% 6% 5% 5%
FY07 FY08 FY09 FY10 FY11E FY12E FY13E FY14E
50% of India’s containerglass capacity and 65%
market share gives HNGIpricing power
Its transformation into apackaging solutions
provider will help reducevolatility in realizations
Hindustan National Glass & Industries
1230 July 2010
Increase in the fleet of own trucks (70 currently)Plant automation, with reduction in unskilled manpowerWaste heat recovery projectsSourcing of equipment from subsidiary, Glass Equipment India Limited, resulting inlower capital costIncrease in proportion of cullet (broken glass) in batch mix from 55% in FY07 tocurrent levels of 91%, resulting in lower power and fuel costSourcing amber sand for Rishra unit from Bankura, where its vendors have set up agrinding unit: This has reduced the cost of sand for that unit by 40%. HNGI is lookingat following a similar strategy for its other units.
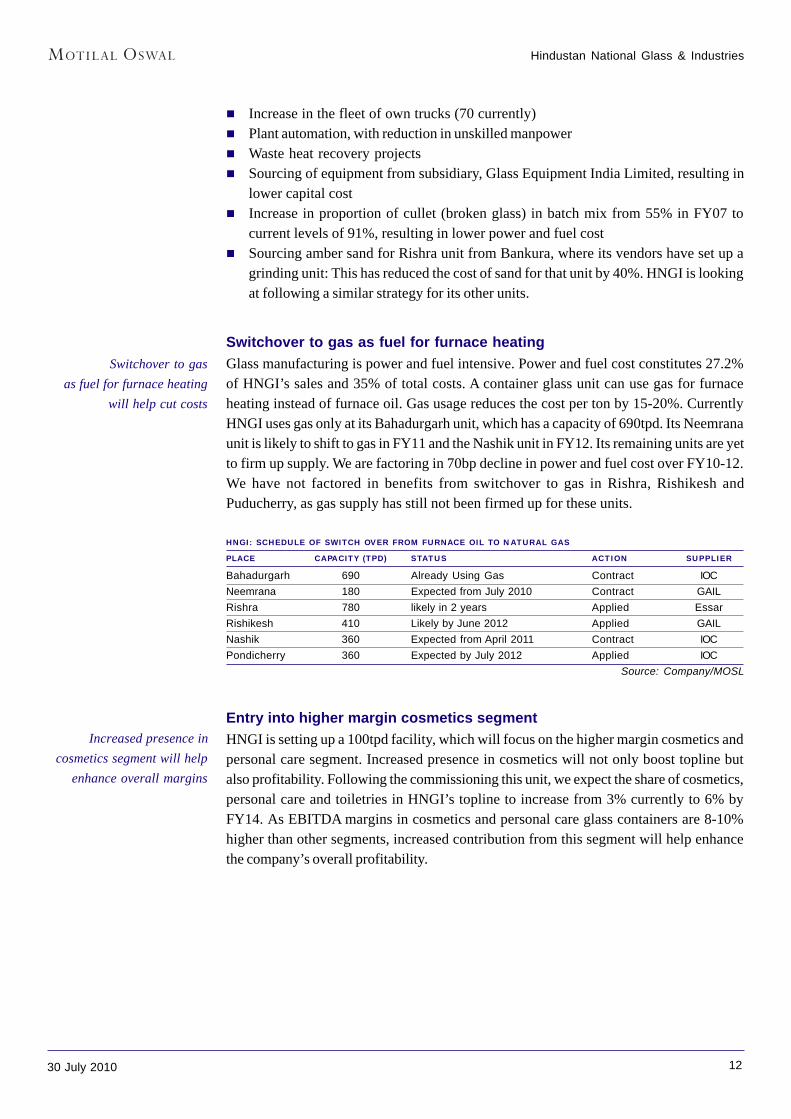
Switchover to gas as fuel for furnace heatingGlass manufacturing is power and fuel intensive. Power and fuel cost constitutes 27.2%of HNGI’s sales and 35% of total costs. A container glass unit can use gas for furnaceheating instead of furnace oil. Gas usage reduces the cost per ton by 15-20%. CurrentlyHNGI uses gas only at its Bahadurgarh unit, which has a capacity of 690tpd. Its Neemranaunit is likely to shift to gas in FY11 and the Nashik unit in FY12. Its remaining units are yetto firm up supply. We are factoring in 70bp decline in power and fuel cost over FY10-12.We have not factored in benefits from switchover to gas in Rishra, Rishikesh andPuducherry, as gas supply has still not been firmed up for these units.
HNGI: SCHEDULE OF SWITCH OVER FROM FURNACE OIL TO NATURAL GAS
PLACE CAPACITY (TPD) STATUS ACTION SUPPLIER
Bahadurgarh 690 Already Using Gas Contract IOCNeemrana 180 Expected from July 2010 Contract GAILRishra 780 likely in 2 years Applied EssarRishikesh 410 Likely by June 2012 Applied GAILNashik 360 Expected from April 2011 Contract IOCPondicherry 360 Expected by July 2012 Applied IOC
Source: Company/MOSL
Entry into higher margin cosmetics segmentHNGI is setting up a 100tpd facility, which will focus on the higher margin cosmetics andpersonal care segment. Increased presence in cosmetics will not only boost topline butalso profitability. Following the commissioning this unit, we expect the share of cosmetics,personal care and toiletries in HNGI’s topline to increase from 3% currently to 6% byFY14. As EBITDA margins in cosmetics and personal care glass containers are 8-10%higher than other segments, increased contribution from this segment will help enhancethe company’s overall profitability.
Switchover to gasas fuel for furnace heating
will help cut costs
Increased presence incosmetics segment will help
enhance overall margins
Hindustan National Glass & Industries
1330 July 2010
Also a play on the booming housing/constructionsegment
The HNGI group has set up a 600tpd float glass unit at Halol in Gujarat, marking its entryinto the float glass segment in India. HNGI has 37% stake in the float glass venture, HNGFloat Glass Limited, with an option to increase it to 51% by September 2010 at an additionalinvestment of Rs170m.
Float glass has high growth potentialFloat glass has emerged as the preferred flat glass products. It accounts for 90% of totalconsumption with 12% CAGR in demand. Demand potential looks encouraging as:
Per capita consumption is only 0.8kg as against 8kg in China and 10kg in USA.We note that usage of glass in housing as well as commercial buildings is on the risedue to rising focus on aesthetics and time saving.In Eleventh Five Year Plan, the Planning Commission estimates the number of urbandwelling units to increase from 58.8m in 2006-07 to 66.1m in 2011-12, an annualincrease of around 1.5m units during the period.
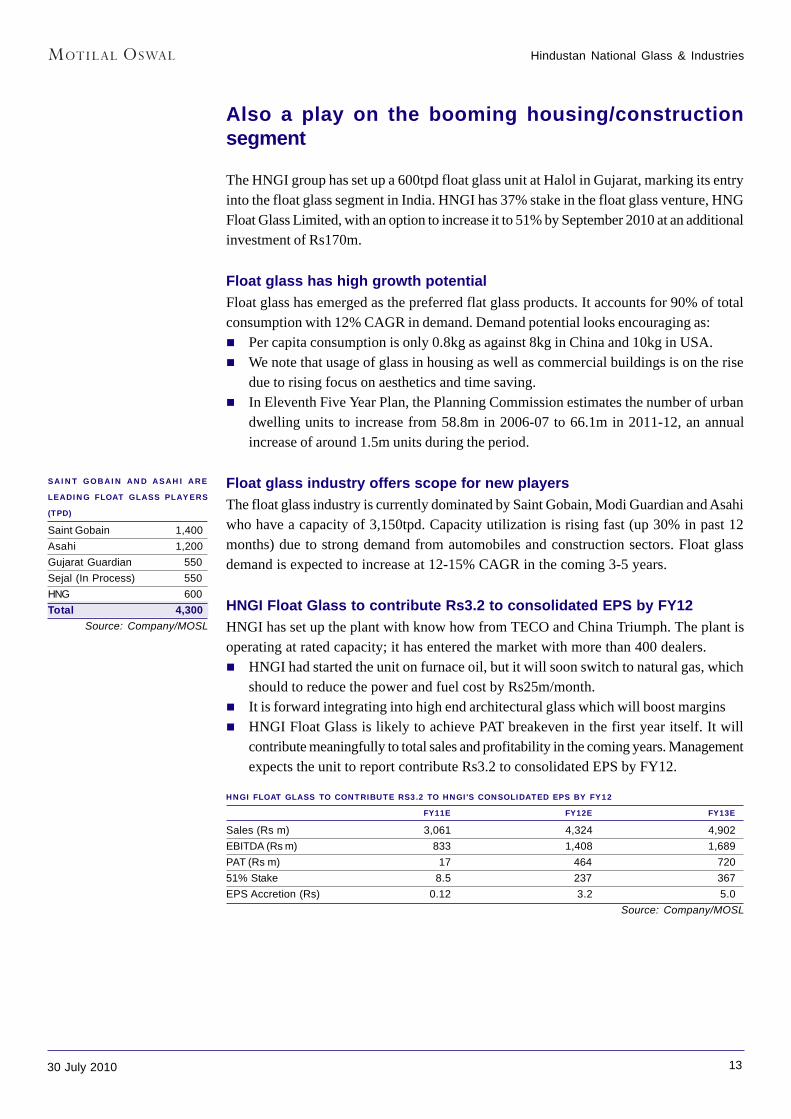
Float glass industry offers scope for new playersThe float glass industry is currently dominated by Saint Gobain, Modi Guardian and Asahiwho have a capacity of 3,150tpd. Capacity utilization is rising fast (up 30% in past 12months) due to strong demand from automobiles and construction sectors. Float glassdemand is expected to increase at 12-15% CAGR in the coming 3-5 years.
HNGI Float Glass to contribute Rs3.2 to consolidated EPS by FY12HNGI has set up the plant with know how from TECO and China Triumph. The plant isoperating at rated capacity; it has entered the market with more than 400 dealers.
HNGI had started the unit on furnace oil, but it will soon switch to natural gas, whichshould to reduce the power and fuel cost by Rs25m/month.It is forward integrating into high end architectural glass which will boost marginsHNGI Float Glass is likely to achieve PAT breakeven in the first year itself. It willcontribute meaningfully to total sales and profitability in the coming years. Managementexpects the unit to report contribute Rs3.2 to consolidated EPS by FY12.
HNGI FLOAT GLASS TO CONTRIBUTE RS3.2 TO HNGI'S CONSOLIDATED EPS BY FY12
FY11E FY12E FY13E
Sales (Rs m) 3,061 4,324 4,902EBITDA (Rs m) 833 1,408 1,689PAT (Rs m) 17 464 72051% Stake 8.5 237 367EPS Accretion (Rs) 0.12 3.2 5.0
Source: Company/MOSL
SAINT GOBAIN AND ASAHI ARE
LEADING FLOAT GLASS PLAYERS
(TPD)
Saint Gobain 1,400Asahi 1,200Gujarat Guardian 550Sejal (In Process) 550HNG 600Total 4,300
Source: Company/MOSL
Hindustan National Glass & Industries
1430 July 2010
16% PAT CAGR over FY10-12; growth to accelerate postFY12
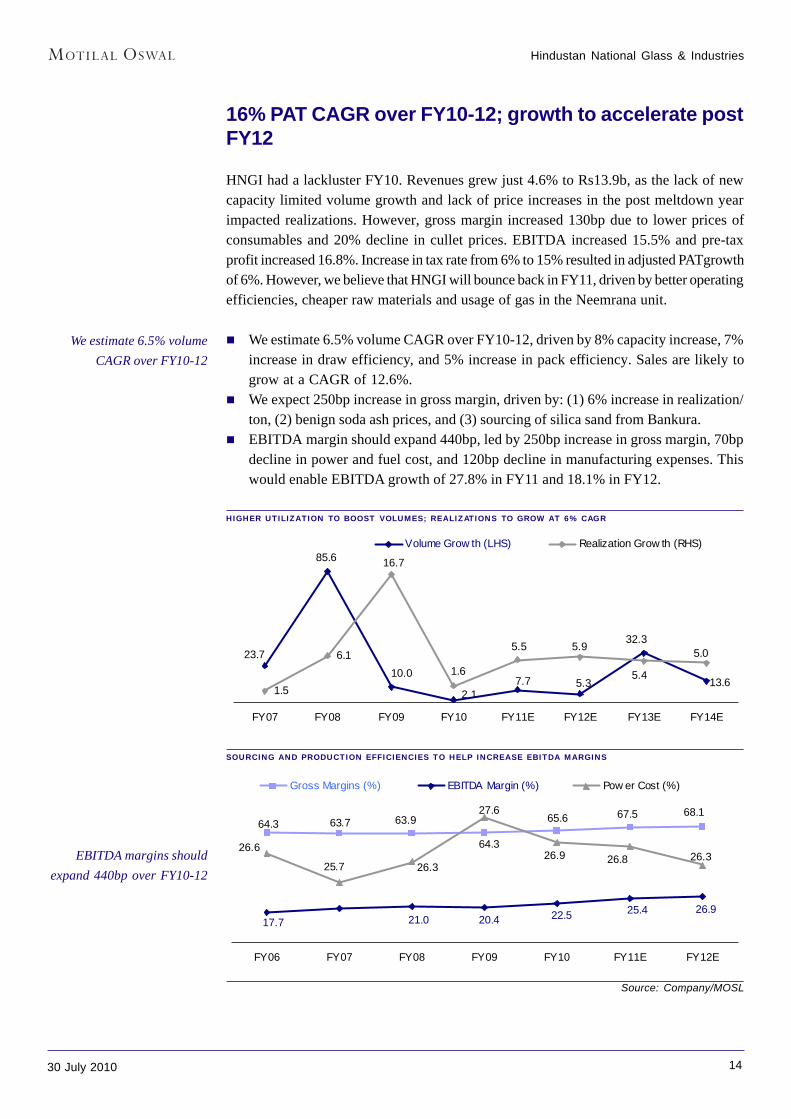
HNGI had a lackluster FY10. Revenues grew just 4.6% to Rs13.9b, as the lack of newcapacity limited volume growth and lack of price increases in the post meltdown yearimpacted realizations. However, gross margin increased 130bp due to lower prices ofconsumables and 20% decline in cullet prices. EBITDA increased 15.5% and pre-taxprofit increased 16.8%. Increase in tax rate from 6% to 15% resulted in adjusted PATgrowthof 6%. However, we believe that HNGI will bounce back in FY11, driven by better operatingefficiencies, cheaper raw materials and usage of gas in the Neemrana unit.
We estimate 6.5% volume CAGR over FY10-12, driven by 8% capacity increase, 7%increase in draw efficiency, and 5% increase in pack efficiency. Sales are likely togrow at a CAGR of 12.6%.We expect 250bp increase in gross margin, driven by: (1) 6% increase in realization/ton, (2) benign soda ash prices, and (3) sourcing of silica sand from Bankura.EBITDA margin should expand 440bp, led by 250bp increase in gross margin, 70bpdecline in power and fuel cost, and 120bp decline in manufacturing expenses. Thiswould enable EBITDA growth of 27.8% in FY11 and 18.1% in FY12.
HIGHER UTILIZATION TO BOOST VOLUMES; REALIZATIONS TO GROW AT 6% CAGR
23.7
85.6
10.0 1.67.7 5.3
32.3
13.61.5
6.1
16.7
2.1
5.5 5.9
5.4
5.0
FY07 FY08 FY09 FY10 FY11E FY12E FY13E FY14E
Volume Grow th (LHS) Realization Grow th (RHS)
SOURCING AND PRODUCTION EFFICIENCIES TO HELP INCREASE EBITDA MARGINS
64.3 63.7 63.9
64.3
65.6 67.5 68.1
17.7 21.0 20.4 22.5 25.4 26.9
26.325.7
26.626.9 26.8 26.3
27.6
FY06 FY07 FY08 FY09 FY10 FY11E FY12E
Gross Margins (%) EBITDA Margin (%) Pow er Cost (%)
Source: Company/MOSL
We estimate 6.5% volumeCAGR over FY10-12
EBITDA margins shouldexpand 440bp over FY10-12
Hindustan National Glass & Industries
1530 July 2010
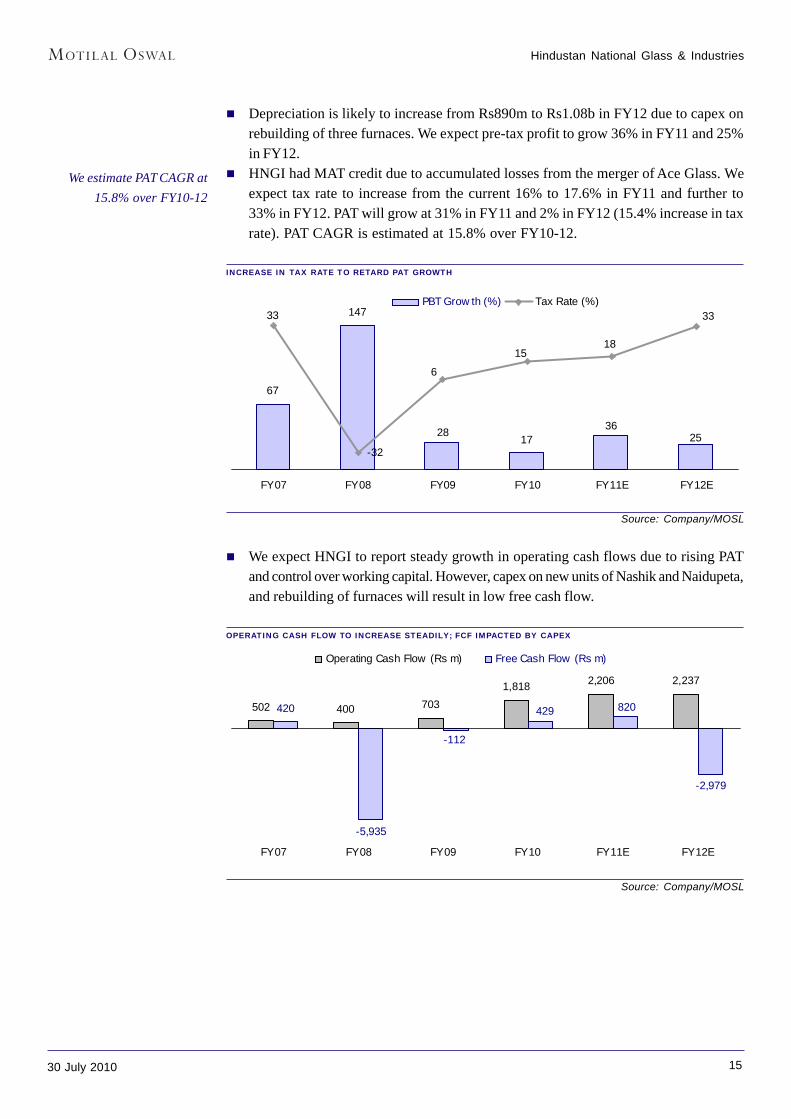
Depreciation is likely to increase from Rs890m to Rs1.08b in FY12 due to capex onrebuilding of three furnaces. We expect pre-tax profit to grow 36% in FY11 and 25%in FY12.HNGI had MAT credit due to accumulated losses from the merger of Ace Glass. Weexpect tax rate to increase from the current 16% to 17.6% in FY11 and further to33% in FY12. PAT will grow at 31% in FY11 and 2% in FY12 (15.4% increase in taxrate). PAT CAGR is estimated at 15.8% over FY10-12.
INCREASE IN TAX RATE TO RETARD PAT GROWTH
67
147
2817
3625
-32
33
18
33
15
6
FY07 FY08 FY09 FY10 FY11E FY12E
PBT Grow th (%) Tax Rate (%)
Source: Company/MOSL
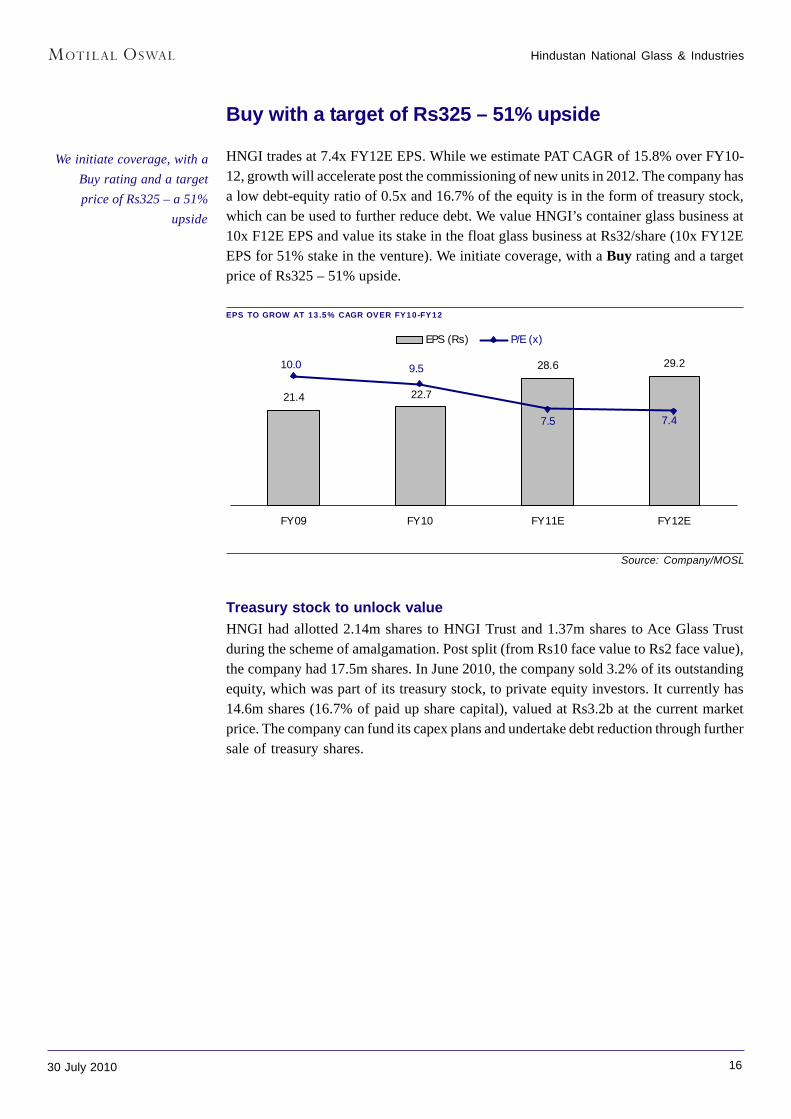
We expect HNGI to report steady growth in operating cash flows due to rising PATand control over working capital. However, capex on new units of Nashik and Naidupeta,and rebuilding of furnaces will result in low free cash flow.
OPERATING CASH FLOW TO INCREASE STEADILY; FCF IMPACTED BY CAPEX
Source: Company/MOSL
502 400 7031,818 2,206 2,237
420
-5,935
-2,979
-112
429 820
FY07 FY08 FY09 FY10 FY11E FY12E
Operating Cash Flow (Rs m) Free Cash Flow (Rs m)
We estimate PAT CAGR at15.8% over FY10-12
Hindustan National Glass & Industries
1630 July 2010
Buy with a target of Rs325 – 51% upside
HNGI trades at 7.4x FY12E EPS. While we estimate PAT CAGR of 15.8% over FY10-12, growth will accelerate post the commissioning of new units in 2012. The company hasa low debt-equity ratio of 0.5x and 16.7% of the equity is in the form of treasury stock,which can be used to further reduce debt. We value HNGI’s container glass business at10x F12E EPS and value its stake in the float glass business at Rs32/share (10x FY12EEPS for 51% stake in the venture). We initiate coverage, with a Buy rating and a targetprice of Rs325 – 51% upside.
EPS TO GROW AT 13.5% CAGR OVER FY10-FY12
Source: Company/MOSL
Treasury stock to unlock valueHNGI had allotted 2.14m shares to HNGI Trust and 1.37m shares to Ace Glass Trustduring the scheme of amalgamation. Post split (from Rs10 face value to Rs2 face value),the company had 17.5m shares. In June 2010, the company sold 3.2% of its outstandingequity, which was part of its treasury stock, to private equity investors. It currently has14.6m shares (16.7% of paid up share capital), valued at Rs3.2b at the current marketprice. The company can fund its capex plans and undertake debt reduction through furthersale of treasury shares.
21.4
28.6 29.2
22.7
9.5
7.5 7.4
10.0
FY09 FY10 FY11E FY12E
EPS (Rs) P/E (x)
We initiate coverage, with aBuy rating and a targetprice of Rs325 – a 51%
upside
Hindustan National Glass & Industries
1730 July 2010
Financials and Valuation
INCOME STATEMENT (RS MILLION)
Y/E MARCH 2007 2008 2009 2010 2011E 2012E
Net Sales 5,189 10,213 13,110 13,599 15,454 17,234Other Operating Inc 62 103 140 267 233 260Total Revenue 5,251 10,316 13,251 13,867 15,686 17,494
Change (%) 96.5 28.4 4.6 13.1 11.5Total Expenditure 4,225 8,146 10,552 10,751 11,705 12,791
EBITDA 1,026 2,170 2,699 3,116 3,982 4,703Change (%) 111.6 24.4 15.5 27.8 18.1Margin (%) 19.5 21.0 20.4 22.5 25.4 26.9
Depreciation 331 701 747 861 972 1,058Int. and Fin. Charges 191 235 434 472 540 561Financial Other Income 0 8 77 78 57 85
Profit before Taxes 503 1,242 1,593 1,861 2,527 3,169Change (%) 146.7 28.3 16.8 35.8 25.4Margin (%) 9.6 12.0 12.0 13.4 16.1 18.1
Tax 168 -393 100 279 446 1,046Tax Rate (%) 33.3 -31.6 6.3 15.0 17.7 33.0
Adjusted PAT 336 1,635 1,493 1,582 2,081 2,123Change (%) 387.0 -8.6 6.0 31.5 2.0Margin (%) 6.4 15.8 11.3 11.4 13.3 12.1
Non-rec. Income 0 -31 -416 -31 582 0Reported PAT 336 1,603 1,077 1,552 2,663 2,123
BALANCE SHEET (RS MILLION)
Y/E MARCH 2007 2008 2009 2010 2011E 2012E
Share Capital 110 175 175 175 175 175Reserves 2,170 8,461 9,177 10,253 12,637 14,533Net Worth 2,280 8,636 9,352 10,428 12,812 14,708Loans 2,477 4,187 5,073 5,657 7,021 9,071Deffered Tax Liabilities 453 181 418 697 742 898Sources of Funds 5,210 13,004 14,843 16,782 20,575 24,677
Gross Block 5,596 12,575 13,790 16,615 17,317 19,525Less: Accum. Depn. 2,247 4,103 4,725 5,452 6,453 7,540Net Fixed Assets 3,349 8,471 9,065 11,163 10,864 11,985Capital WIP 365 451 820 275 1,960 6,055Investments 109 1,146 1,046 1,471 1,623 1,623
Curr. Assets, L&A 2,312 4,820 6,479 6,603 9,121 8,249Inventory 933 1,641 2,158 2,099 2,286 2,455Account Receivables 898 1,645 2,272 2,201 2,413 2,597Cash and Bank Balance 6 168 114 47 2,104 784Loans and Adv 474 1,365 1,935 2,256 2,318 2,413Curr. Liab. and Prov. 924 1,885 2,567 2,730 2,993 3,236Account Payables 708 1,486 1,988 1,756 1,867 2,035Provisions 216 399 579 974 1,127 1,201Net Current Assets 1,387 2,935 3,912 3,874 6,128 5,014Application of Funds 5,210 13,004 14,843 16,782 20,575 24,677E: MOSL Estimates
Hindustan National Glass & Industries
1830 July 2010
Financials and Valuation
RATIOS
Y/E MARCH 2007 2008 2009 2010 2011E 2012E
Basic (Rs)EPS 6.1 18.7 21.4 22.7 28.6 29.2Cash EPS 0.4 33.5 32.1 35.0 41.9 43.7BV/Share 206.5 494.4 107.1 119.4 146.7 168.4DPS 0.2 0.9 1.2 1.7 2.9 2.9Payout % 3.8 5.0 5.5 7.6 10.0 9.8
Valuation (x)P/E 10.0 9.5 7.5 7.4Cash P/E 6.7 6.1 5.1 4.9EV/Sales 0.3 0.3 0.2 0.4EV/EBITDA 2.8 2.5 1.8 2.2P/BV 2.0 1.8 1.5 1.3Dividend Yield (%) 0.5 0.8 1.3 1.3
Return Ratios (%)RoE 14.7 18.9 16.0 15.2 16.2 14.4RoCE 19.7 16.7 18.2 18.6 19.4 19.1
Working Capital RatiosDebtor (Days) 62 58 63 58 56 54Asset Turnover (x) 1.0 0.8 0.9 0.8 0.8 0.7
Leverage RatioDebt/Equity (x) 1.1 0.5 0.5 0.5 0.5 0.6
CASH FLOW STATEMENT (RS MILLION)
Y/E MARCH 2008 2009 2010 2011E 2012E
OP/(loss) before Tax 2,170 2,699 3,116 3,982 4,703Interest Received 8 77 78 57 85Interest Paid -235 -434 -472 -540 -561Direct Taxes Paid 393 -100 -279 -446 -1,046(Incr)/Decr in WC -1,386 -1,031 -29 -198 -205CF from Operations 949 1,210 2,415 2,855 2,976
(Incr)/Decr in FA -7,064 -1,585 -2,279 -2,387 -6,303(Pur)/Sale of Investments -1,037 100 -425 -153 0CF from Invest. -8,101 -1,484 -2,704 -2,540 -6,303
Change in Equity 4,834 -259 -325 -29 -29Incr/(Decr) in Debt 1,710 886 584 1,364 2,050Dividend Paid 82 102 151 249 199Others 687 -509 -188 157 -212CF from Fin. Activity 7,313 220 223 1,741 2,008
Incr/Decr of Cash 161 -54 -67 2,056 -1,319Add: Opening Balance 6 168 114 47 2,104Closing Balance 168 114 47 2,103 784E: MOSL Estimates

Hindustan National Glass & Industries
1930 July 2010
N O T E S

This report is for the personal information of the authorized recipient and does not construe to be any investment, legal or taxation advice to you. Motilal OswalSecurities Limited (hereinafter referred as MOSt) is not soliciting any action based upon it. This report is not for public distribution and has been furnished to you solelyfor your information and should not be reproduced or redistributed to any other person in any form.
The report is based upon information that we consider reliable, but we do not represent that it is accurate or complete, and it should not be relied upon such. MOSt orany of its affiliates or employees shall not be in any way responsible for any loss or damage that may arise to any person from any inadvertent error in the informationcontained in this report. MOSt or any of its affiliates or employees do not provide, at any time, any express or implied warranty of any kind, regarding any matterpertaining to this report, including without limitation the implied warranties of merchantability, fitness for a particular purpose, and non-infringement. The recipients ofthis report should rely on their own investigations.
MOSt and/or its affiliates and/or employees may have interests/ positions, financial or otherwise in the securities mentioned in this report. To enhance transparency,MOSt has incorporated a Disclosure of Interest Statement in this document. This should, however, not be treated as endorsement of the views expressed in the report.
Disclosure of Interest Statement Hindustan National Glass & Industries1. Analyst ownership of the stock No2. Group/Directors ownership of the stock No3. Broking relationship with company covered No4. Investment Banking relationship with company covered No
This information is subject to change without any prior notice. MOSt reserves the right to make modifications and alternations to this statement as may be requiredfrom time to time. Nevertheless, MOSt is committed to providing independent and transparent recommendations to its clients, and would be happy to provideinformation in response to specific client queries.
For more copies or other information, contactInstitutional: Navin Agarwal. Retail: Manish Shah
Phone: (91-22) 39825500 Fax: (91-22) 22885038. E-mail: [email protected]
Motilal Oswal Securities Ltd, 3rd Floor, Hoechst House, Nariman Point, Mumbai 400 021


![Untitled-3 [] & Industries Limited (HSIL). The same year, Soma Textiles & Industries ... to Hyderabad to head the glass division of Hindustan Sanitaryware & Industries](https://static.fdocuments.net/doc/165x107/5b01db6d7f8b9af1148ecb99/untitled-3-industries-limited-hsil-the-same-year-soma-textiles-industries.jpg)