Technical Chart Book - RAYMOND · PDF fileLast 10 yrs. │7 • PE Chart │8 ... QE and...
55
1│Page Portfolio & Technical Strategy Group‐ 901‐529‐3776 © 2014 Raymond James & Associates, Inc., member New York Stock Exchange/SIPC. All rights reserved. International Headquarters: The Raymond James Financial Center | 880 Carillon Parkway | St. Petersburg, Florida 33716 | 800-248-8863 RAYMOND JAMES Technical Strategy Team - Technical Chart Book RAYMOND JAMES Wednesday, April 25, 2018 -Technical Chart Book - Providing Investors with timely data and technical observations on a broad spectrum of asset classes.
Transcript of Technical Chart Book - RAYMOND · PDF fileLast 10 yrs. │7 • PE Chart │8 ... QE and...

1│Page
Portfolio&TechnicalStrategyGroup‐ 901‐529‐3776
© 2014 Raymond James & Associates, Inc., member New York Stock Exchange/SIPC. All rights reserved.International Headquarters:The Raymond James Financial Center | 880 Carillon Parkway | St. Petersburg, Florida 33716 | 800-248-8863
RAYMOND JAMES Technical Strategy Team - Technical Chart Book
RAYMOND JAMES
Wednesday, April 25, 2018
-Technical Chart Book -
Providing Investors with timely data and technical observations on a broad spectrum of asset classes.

© 2014 Raymond James & Associates, Inc., member New York Stock Exchange/SIPC. All rights reserved.International Headquarters:The Raymond James Financial Center | 880 Carillon Parkway | St. Petersburg, Florida 33716 | 800-248-8863
2│Page
Wednesday, April 25, 2018
RAYMOND JAMES Technical Strategy Team – Technical Chart Book
Table of Contents
S&P 500 │Pages 3-16
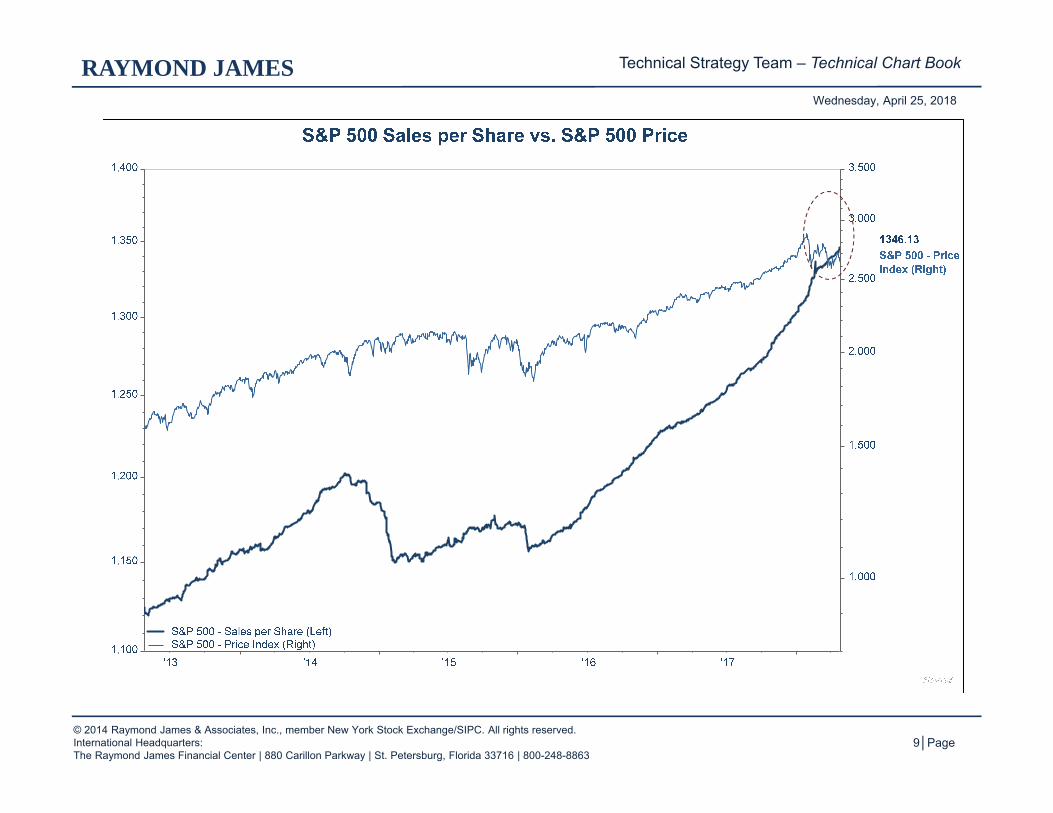
• Long Term Chart │4• 5 year Chart Trend Channel │5• Chart Support / Resistance │6• Average returns / Long Term vs. Last 10 yrs. │7• PE Chart │8• S&P 500 Revenues vs. S&P 500 Price │9
Federal Reserve – QE & Fed’s Balance Sheet │10-14
Major Mkt. Series│15-17
Various Indicators: Dow Theory, Semiconductors, Copper, VIX, and NYSE Short Interest│18-23
S&P Sectors│24-27• Energy• Materials• Industrials• Consumer Discretionary• Consumer Staples• Health Care• Financials• Information Technology• Telecommunication Services• Utilities
S&P Sectors / Relative Strength vs. S&P 500│28-31• Energy• Materials• Industrials• Consumer Discretionary• Consumer Staples• Health Care• Financials• Information Technology• Telecommunication Services• Utilities
S&P Style: Growth vs. Value│32-33• S&P Composite 1500 – Growth vs. Value• S&P 500 – Growth vs. Value• S&P Mid Cap 400 – Growth vs. Value• S&P Small Cap 600 – Growth vs. Value
International Markets│34-40
US Dollar, Interest Rates, Commodities│41-47
Economic Charts│48-52

© 2014 Raymond James & Associates, Inc., member New York Stock Exchange/SIPC. All rights reserved.International Headquarters:The Raymond James Financial Center | 880 Carillon Parkway | St. Petersburg, Florida 33716 | 800-248-8863
3│Page
Wednesday, April 25, 2018
RAYMOND JAMES Technical Strategy Team – Technical Chart Book
U.S. Equity Markets – The S&P 500
4│Page
RAYMOND JAMESWednesday, April 25, 2018
'29 '31 '33 '35 '37 '39 '41 '43 '45 '47 '49 '51 '53 '55 '57 '59 '61 '63 '65 '67 '69 '71 '73 '75 '77 '79 '81 '83 '85 '87 '89 '91 '93 '95 '97 '99 '01 '03 '05 '07 '09 '11 '13 '15 '17
445566778899 1010
2020
3030
404050506060707080809090 100100
200200
300300
400400500500600600700700800800900900 1,0001,000
2,0002,000
3,0003,000
4,0004,000
2670.14
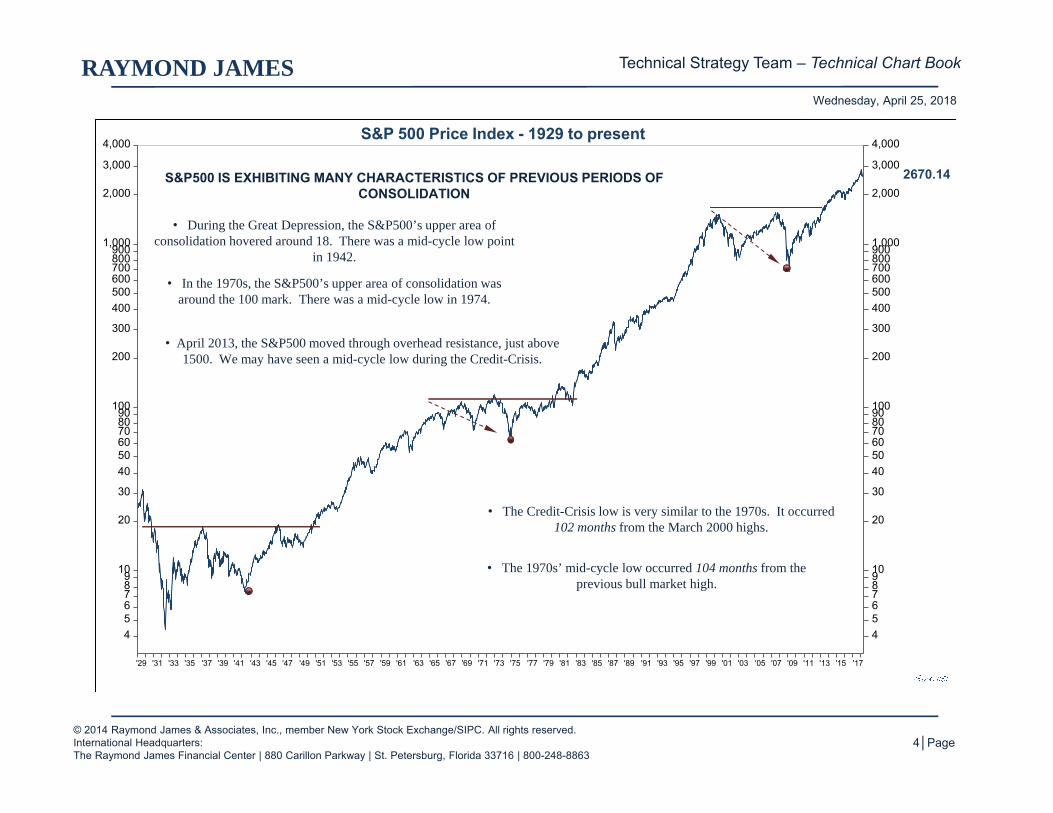
S&P 500 Price Index - 1929 to present
S&P500 IS EXHIBITING MANY CHARACTERISTICS OF PREVIOUS PERIODS OF CONSOLIDATION
• During the Great Depression, the S&P500’s upper area of consolidation hovered around 18. There was a mid-cycle low point
in 1942.
• In the 1970s, the S&P500’s upper area of consolidation was around the 100 mark. There was a mid-cycle low in 1974.
• April 2013, the S&P500 moved through overhead resistance, just above 1500. We may have seen a mid-cycle low during the Credit-Crisis.
• The Credit-Crisis low is very similar to the 1970s. It occurred 102 months from the March 2000 highs.
• The 1970s’ mid-cycle low occurred 104 months from the previous bull market high.
Technical Strategy Team – Technical Chart Book
© 2014 Raymond James & Associates, Inc., member New York Stock Exchange/SIPC. All rights reserved.International Headquarters:The Raymond James Financial Center | 880 Carillon Parkway | St. Petersburg, Florida 33716 | 800-248-8863
RAYMOND JAMES
© 2014 Raymond James & Associates, Inc., member New York Stock Exchange/SIPC. All rights reserved.International Headquarters:The Raymond James Financial Center | 880 Carillon Parkway | St. Petersburg, Florida 33716 | 800-248-8863
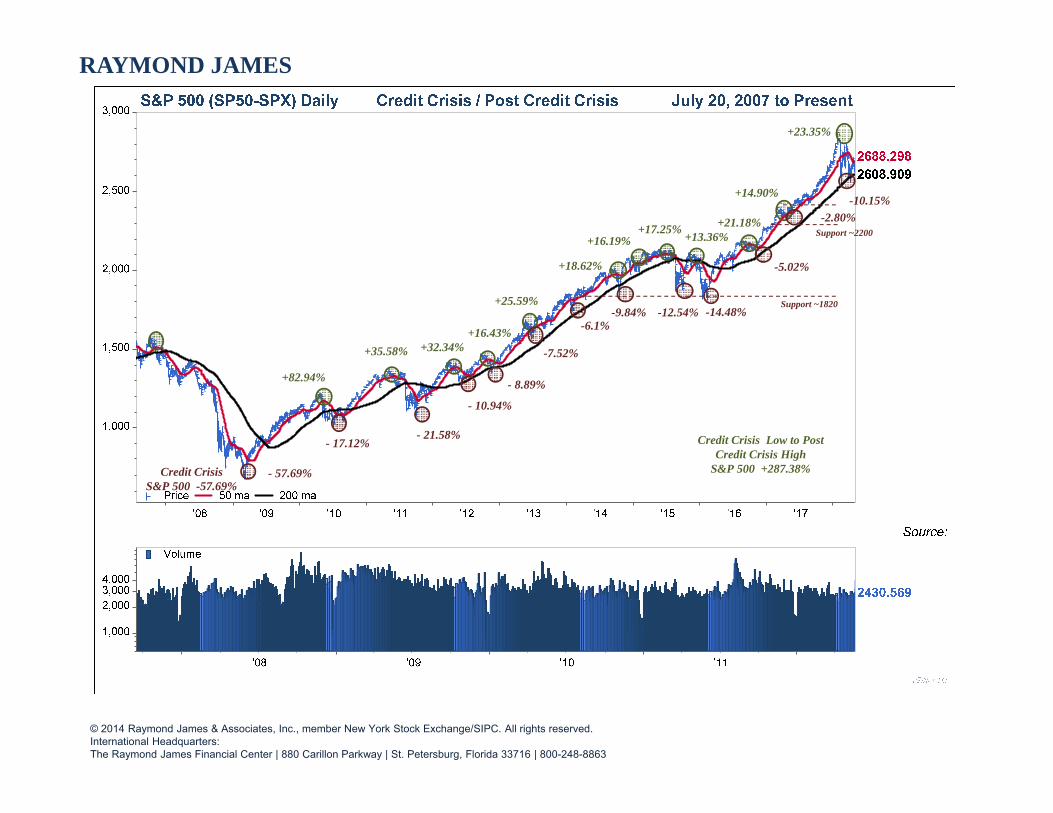
+82.94%
+35.58% +32.34%
- 17.12%- 21.58%
- 10.94%
Credit Crisis S&P 500 -57.69%
Support ~1820
+16.43%
- 8.89%
+25.59%
-7.52%
+16.19%
- 57.69%
Credit Crisis Low to Post Credit Crisis High
S&P 500 +287.38%
-6.1%
+18.62%
-9.84%
+17.25%
-12.54%
+13.36%
-14.48%
+21.18%
-5.02%
+14.90%
Support ~2200
+23.35%
-2.80%-10.15%

May Jun Jul Aug Sep Oct Nov Dec Jan Feb Mar Apr2,200
2,300
2,400
2,500
2,600
2,700
2,800
2,900
3,000
2623.240 2608.908
2688.297
Source:
S&P 500 (SP50-SPX) 1 Year Daily
Price 50 ma 200 ma
May Jun Jul Aug Sep Oct Nov Dec Jan Feb Mar Apr
1,000
2,0003,0004,000
2430.569Volume
© 2014 Raymond James & Associates, Inc., member New York Stock Exchange/SIPC. All rights reserved.International Headquarters:The Raymond James Financial Center | 880 Carillon Parkway | St. Petersburg, Florida 33716 | 800-248-8863
6│Page
Wednesday, April 25, 2018
RAYMOND JAMES Technical Strategy Team – Technical Chart Book

7│Page
RAYMOND JAMESWednesday, April 25, 2018
Technical Strategy Team – Technical Chart Book
© 2014 Raymond James & Associates, Inc., member New York Stock Exchange/SIPC. All rights reserved.International Headquarters:The Raymond James Financial Center | 880 Carillon Parkway | St. Petersburg, Florida 33716 | 800-248-8863
***These PE figures are compiled by FactSet and may vary from other data vendors by calculation methods.

8│Page
RAYMOND JAMESWednesday, April 25, 2018
Technical Strategy Team – Technical Chart Book
© 2014 Raymond James & Associates, Inc., member New York Stock Exchange/SIPC. All rights reserved.International Headquarters:The Raymond James Financial Center | 880 Carillon Parkway | St. Petersburg, Florida 33716 | 800-248-8863
'29 '32 '35 '38 '41 '44 '47 '50 '53 '56 '59 '62 '65 '68 '71 '74 '77 '80 '83 '86 '89 '92 '95 '98 '01 '04 '07 '10 '13 '16-60
-40
-20
0
20
40
60
-1.46
Avg Return Last 10Yrs: 7.0%
Avg Return: 7.4%
Source:
9│Page
RAYMOND JAMESWednesday, April 25, 2018
Technical Strategy Team – Technical Chart Book
© 2014 Raymond James & Associates, Inc., member New York Stock Exchange/SIPC. All rights reserved.International Headquarters:The Raymond James Financial Center | 880 Carillon Parkway | St. Petersburg, Florida 33716 | 800-248-8863

© 2014 Raymond James & Associates, Inc., member New York Stock Exchange/SIPC. All rights reserved.International Headquarters:The Raymond James Financial Center | 880 Carillon Parkway | St. Petersburg, Florida 33716 | 800-248-8863
10│Page
Wednesday, April 25, 2018
RAYMOND JAMES Technical Strategy Team – Technical Chart Book
The Federal Reserve: QE and The Fed’s Balance Sheet
11│Page
RAYMOND JAMESWednesday, April 25, 2018
Technical Strategy Team – Technical Chart Book
© 2014 Raymond James & Associates, Inc., member New York Stock Exchange/SIPC. All rights reserved.International Headquarters:The Raymond James Financial Center | 880 Carillon Parkway | St. Petersburg, Florida 33716 | 800-248-8863
'08 '09 '10 '11 '12 '13 '14 '15 '16 '17500
1,000
1,500
2,000
2,500
3,000
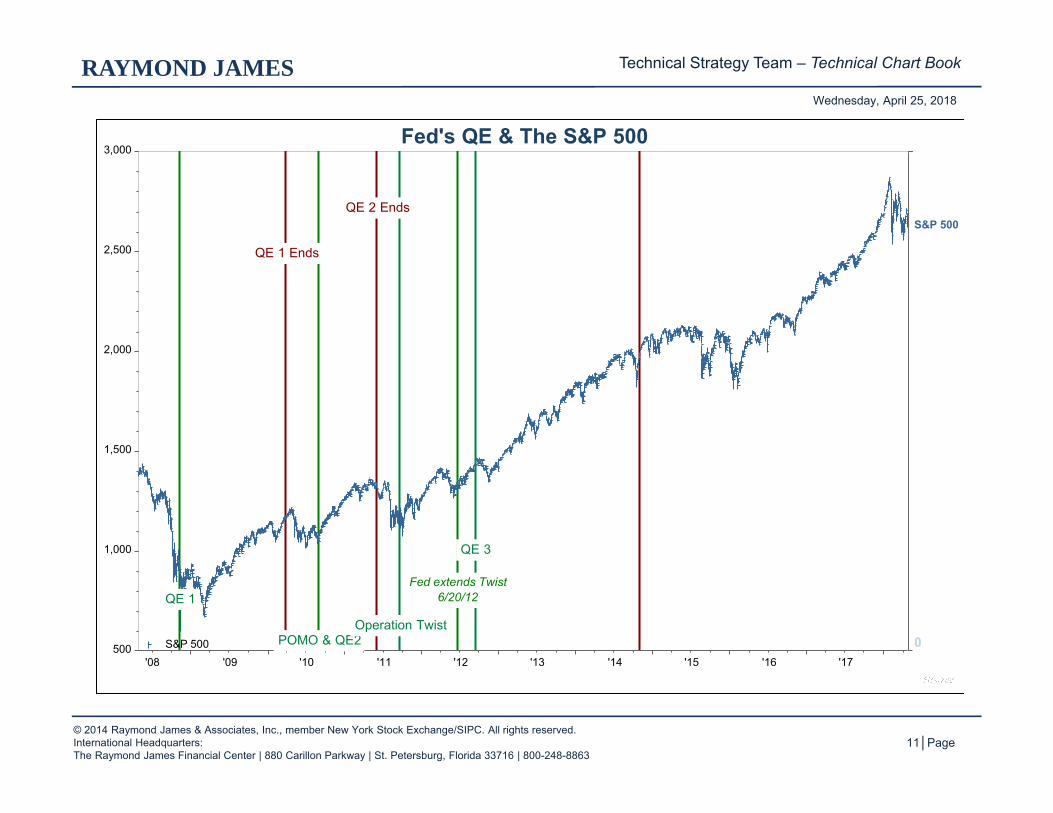
QE 1
POMO & QE2
QE 2 Ends
Operation Twist
Fed extends Twist6/20/12
QE 1 Ends
QE 3
0
S&P 500
Fed's QE & The S&P 500
S&P 500

12│Page
RAYMOND JAMESWednesday, April 25, 2018
Technical Strategy Team – Technical Chart Book
© 2014 Raymond James & Associates, Inc., member New York Stock Exchange/SIPC. All rights reserved.International Headquarters:The Raymond James Financial Center | 880 Carillon Parkway | St. Petersburg, Florida 33716 | 800-248-8863

13│Page
RAYMOND JAMESWednesday, April 25, 2018
Technical Strategy Team – Technical Chart Book
© 2014 Raymond James & Associates, Inc., member New York Stock Exchange/SIPC. All rights reserved.International Headquarters:The Raymond James Financial Center | 880 Carillon Parkway | St. Petersburg, Florida 33716 | 800-248-8863

14│Page
RAYMOND JAMESWednesday, April 25, 2018
Technical Strategy Team – Technical Chart Book
© 2014 Raymond James & Associates, Inc., member New York Stock Exchange/SIPC. All rights reserved.International Headquarters:The Raymond James Financial Center | 880 Carillon Parkway | St. Petersburg, Florida 33716 | 800-248-8863
'07 '08 '09 '10 '11 '12 '13 '14 '15 '16 '17
1,000,000
1,500,000
2,000,000
2,500,000
3,000,000
3,500,000
4,000,000
4,500,000
5,000,000
1,000
1,500
2,000
2,500
3,000
Assets of All FedReserveBanks=$4385903.00
S&P 500
Expansion of the Fed's Balance Sheet vs. the S&P 500
S&P 500 - Price Index (Right)H.4.1- Assets Of All Federal Reserve Banks, Total Assets (Mil $) - United States (Left)

© 2014 Raymond James & Associates, Inc., member New York Stock Exchange/SIPC. All rights reserved.International Headquarters:The Raymond James Financial Center | 880 Carillon Parkway | St. Petersburg, Florida 33716 | 800-248-8863
15│Page
Wednesday, April 25, 2018
RAYMOND JAMES Technical Strategy Team – Technical Chart Book
U.S. Major Markets Series

May Jun Jul Aug Sep Oct Nov Dec Jan Feb Mar Apr18,000
19,000
20,000
21,000
22,000
23,000
24,000
25,000
26,000
27,000
23673.64824024.13024597.896
DJ Industrial Average24-Apr-2017 to 25-Apr-2018 (Daily)1 Year - Daily Last: 24024.13
50 Day Moving Average 200 Day Moving Agerage Price(DJII-USA)
May Jun Jul Aug Sep Oct Nov Dec Jan Feb Mar Apr5,000
5,500
6,000
6,500
7,000
7,500
8,000
6823.2516991.587
7213.391
NASDAQ Composite Index24-Apr-2017 to 25-Apr-2018 (Daily)1 Year - Daily Last: 6991.59
50 Day Moving Average 200 Day Moving Agerage Price(COMP)
16│Page
RAYMOND JAMESWednesday, April 25, 2018
Technical Strategy Team – Technical Chart Book
© 2014 Raymond James & Associates, Inc., member New York Stock Exchange/SIPC. All rights reserved.International Headquarters:The Raymond James Financial Center | 880 Carillon Parkway | St. Petersburg, Florida 33716 | 800-248-8863
May Jun Jul Aug Sep Oct Nov Dec Jan Feb Mar Apr8,000
8,500
9,000
9,500
10,000
10,500
11,000
11,500
12,000
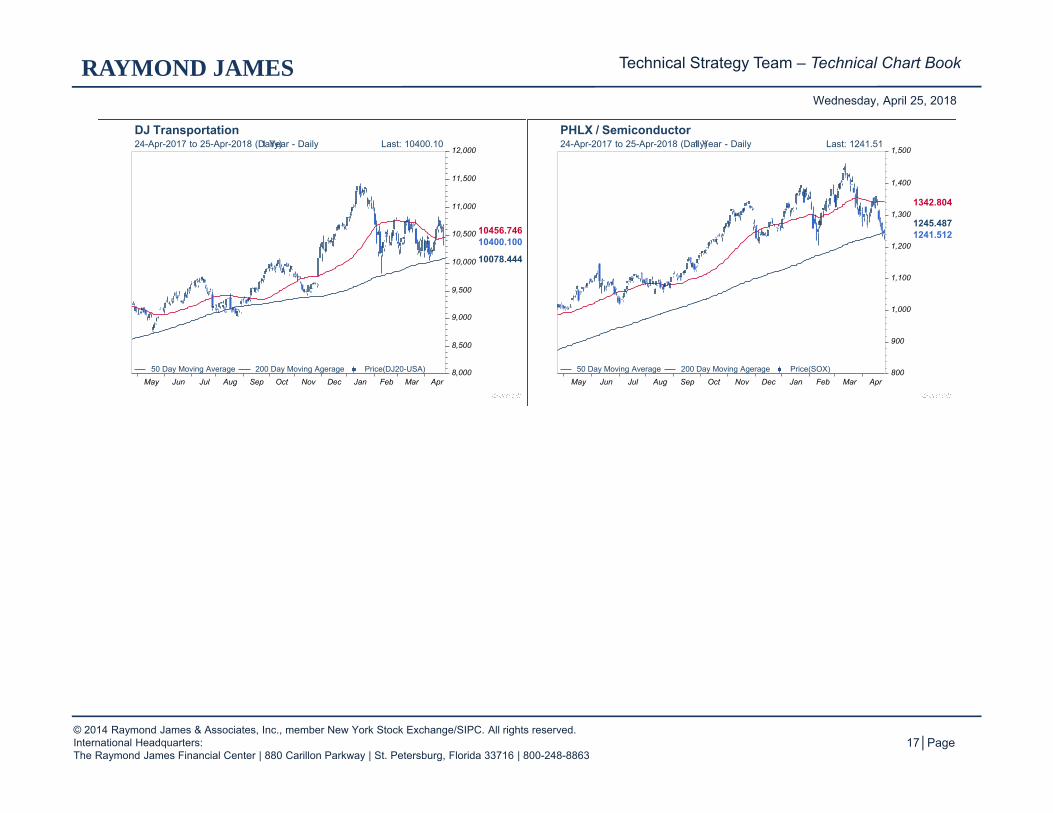
10078.444
10400.10010456.746
DJ Transportation24-Apr-2017 to 25-Apr-2018 (Daily)1 Year - Daily Last: 10400.10
50 Day Moving Average 200 Day Moving Agerage Price(DJ20-USA)May Jun Jul Aug Sep Oct Nov Dec Jan Feb Mar Apr
800
900
1,000
1,100
1,200
1,300
1,400
1,500
1241.5121245.487
1342.804
PHLX / Semiconductor24-Apr-2017 to 25-Apr-2018 (Daily)1 Year - Daily Last: 1241.51
50 Day Moving Average 200 Day Moving Agerage Price(SOX)
17│Page
RAYMOND JAMESWednesday, April 25, 2018
Technical Strategy Team – Technical Chart Book
© 2014 Raymond James & Associates, Inc., member New York Stock Exchange/SIPC. All rights reserved.International Headquarters:The Raymond James Financial Center | 880 Carillon Parkway | St. Petersburg, Florida 33716 | 800-248-8863
© 2014 Raymond James & Associates, Inc., member New York Stock Exchange/SIPC. All rights reserved.International Headquarters:The Raymond James Financial Center | 880 Carillon Parkway | St. Petersburg, Florida 33716 | 800-248-8863
18│Page
Wednesday, April 25, 2018
RAYMOND JAMES Technical Strategy Team – Technical Chart Book
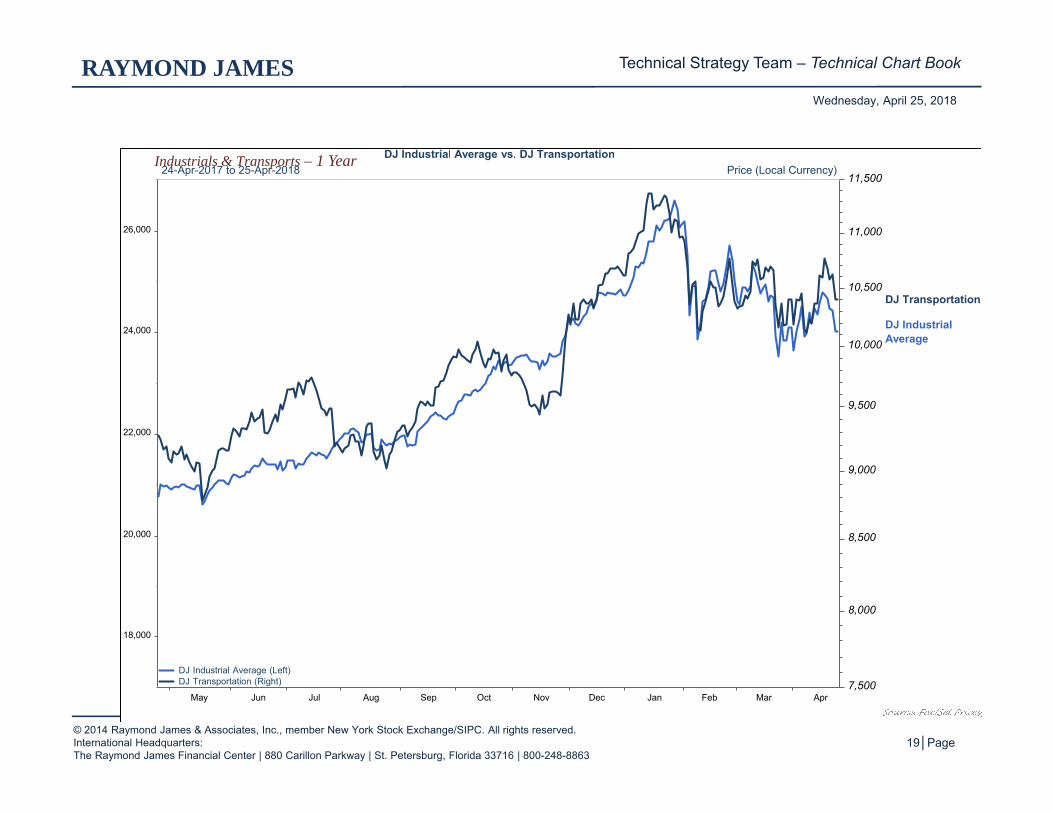
Dow Theory: Transports vs. Industrials
Semiconductors vs. the S&P 500
Copper vs. the S&P 500
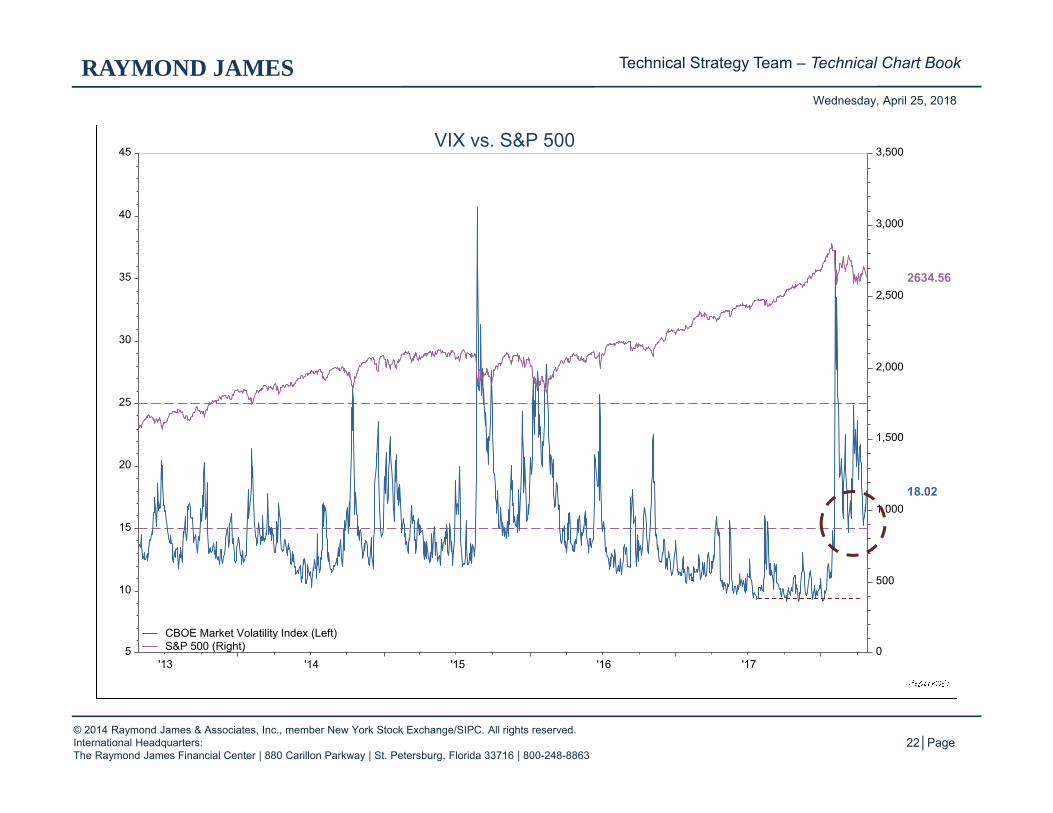
Sentiment: VIX vs. S&P 500
Sentiment: Short Interest
19│Page
RAYMOND JAMESWednesday, April 25, 2018
May Jun Jul Aug Sep Oct Nov Dec Jan Feb Mar Apr
18,000
20,000
22,000
24,000
26,000
7,500
8,000
8,500
9,000
9,500
10,000
10,500
11,000
11,500
DJ IndustrialAverage
DJ Transportation
DJ Industrial Average vs. DJ Transportation24-Apr-2017 to 25-Apr-2018 Price (Local Currency)
DJ Industrial Average (Left)DJ Transportation (Right)
Technical Strategy Team – Technical Chart Book
Industrials & Transports – 1 Year
© 2014 Raymond James & Associates, Inc., member New York Stock Exchange/SIPC. All rights reserved.International Headquarters:The Raymond James Financial Center | 880 Carillon Parkway | St. Petersburg, Florida 33716 | 800-248-8863

© 2014 Raymond James & Associates, Inc., member New York Stock Exchange/SIPC. All rights reserved.International Headquarters:The Raymond James Financial Center | 880 Carillon Parkway | St. Petersburg, Florida 33716 | 800-248-8863
20│Page
Wednesday, April 25, 2018
RAYMOND JAMES Technical Strategy Team – Technical Chart Book
S&P 500 and Semiconductors – 5 year view

© 2014 Raymond James & Associates, Inc., member New York Stock Exchange/SIPC. All rights reserved.International Headquarters:The Raymond James Financial Center | 880 Carillon Parkway | St. Petersburg, Florida 33716 | 800-248-8863
21│Page
Wednesday, April 25, 2018
RAYMOND JAMES Technical Strategy Team – Technical Chart Book
Taking the Market’s pulse with “Dr. Copper”
Copper - 6 month chart
© 2014 Raymond James & Associates, Inc., member New York Stock Exchange/SIPC. All rights reserved.International Headquarters:The Raymond James Financial Center | 880 Carillon Parkway | St. Petersburg, Florida 33716 | 800-248-8863
22│Page
Wednesday, April 25, 2018
RAYMOND JAMES Technical Strategy Team – Technical Chart Book
'13 '14 '15 '16 '175
10
15
20
25
30
35
40
45
0
500
1,000
1,500
2,000
2,500
3,000
3,500
18.02
2634.56
VIX vs. S&P 500
CBOE Market Volatility Index (Left)S&P 500 (Right)

'08 '09 '10 '11 '12 '13 '14 '15 '16 '175,000
10,000
15,000
20,000
25,000
30,000
35,000
40,000
500
1,000
1,500
2,000
2,500
3,000
3,500
15749.92
S&P 500 - PriceIndex (Right)
Nyse, Short Interest, Millions Of Shares - United States (Left)S&P 500 - Price Index (Right)
© 2014 Raymond James & Associates, Inc., member New York Stock Exchange/SIPC. All rights reserved.International Headquarters:The Raymond James Financial Center | 880 Carillon Parkway | St. Petersburg, Florida 33716 | 800-248-8863
23│Page
Wednesday, April 25, 2018
RAYMOND JAMES Technical Strategy Team – Technical Chart Book

© 2014 Raymond James & Associates, Inc., member New York Stock Exchange/SIPC. All rights reserved.International Headquarters:The Raymond James Financial Center | 880 Carillon Parkway | St. Petersburg, Florida 33716 | 800-248-8863
24│Page
Wednesday, April 25, 2018
RAYMOND JAMES Technical Strategy Team – Technical Chart Book
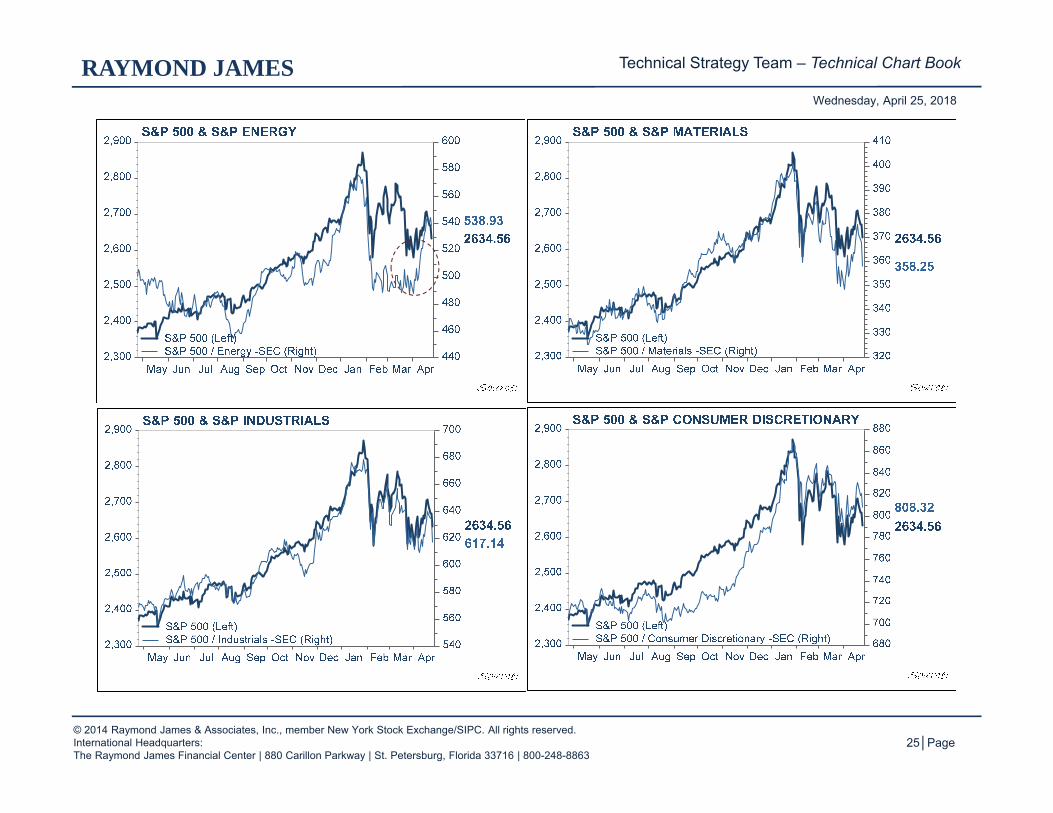
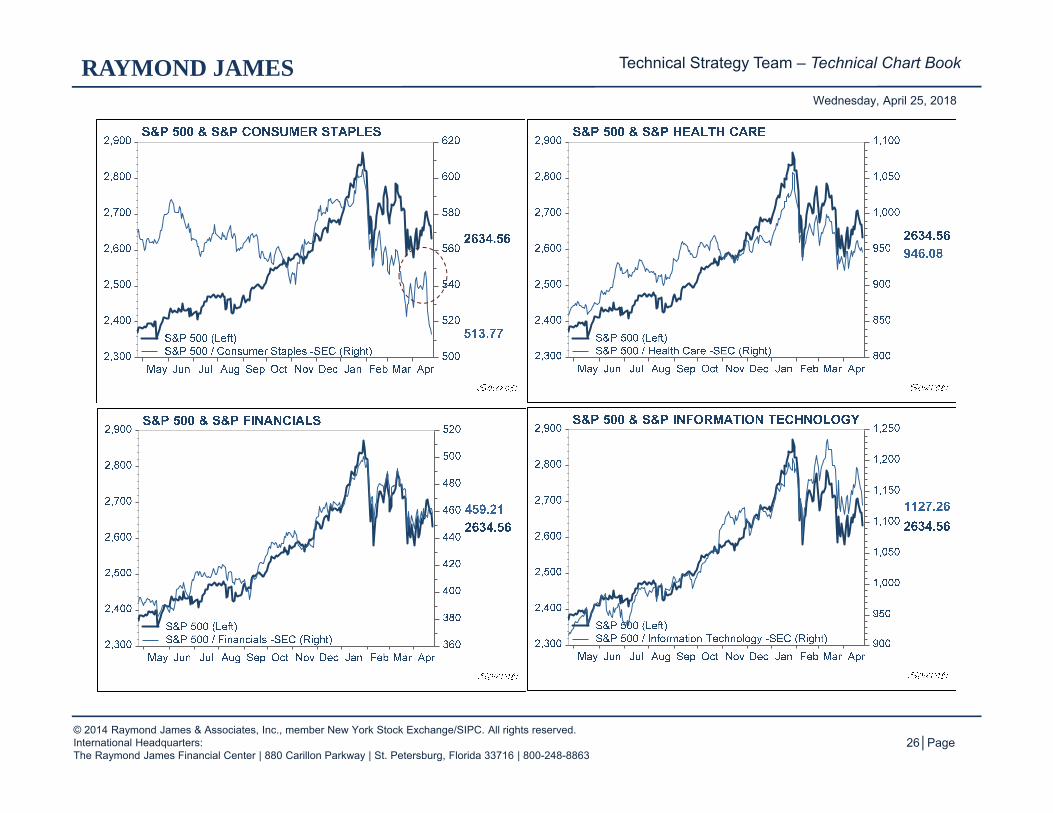
S&P 500 Sector Series
S&P 500 Sectors:
• Energy• Materials• Industrials• Consumer Discretionary• Consumer Staples• Health Care• Financials• Information Technology• Telecommunication Services• Utilities
© 2014 Raymond James & Associates, Inc., member New York Stock Exchange/SIPC. All rights reserved.International Headquarters:The Raymond James Financial Center | 880 Carillon Parkway | St. Petersburg, Florida 33716 | 800-248-8863
25│Page
Wednesday, April 25, 2018
RAYMOND JAMES Technical Strategy Team – Technical Chart Book
© 2014 Raymond James & Associates, Inc., member New York Stock Exchange/SIPC. All rights reserved.International Headquarters:The Raymond James Financial Center | 880 Carillon Parkway | St. Petersburg, Florida 33716 | 800-248-8863
26│Page
Wednesday, April 25, 2018
RAYMOND JAMES Technical Strategy Team – Technical Chart Book

© 2014 Raymond James & Associates, Inc., member New York Stock Exchange/SIPC. All rights reserved.International Headquarters:The Raymond James Financial Center | 880 Carillon Parkway | St. Petersburg, Florida 33716 | 800-248-8863
27│Page
Wednesday, April 25, 2018
RAYMOND JAMES Technical Strategy Team – Technical Chart Book
May Jun Jul Aug Sep Oct Nov Dec Jan Feb Mar Apr2,300
2,400
2,500
2,600
2,700
2,800
2,900
230
240
250
260
270
280
290
300
256.91
2634.56
S&P 500 & S&P UTILITIES
S&P 500 (Left)S&P 500 / Utilities -SEC (Right)

© 2014 Raymond James & Associates, Inc., member New York Stock Exchange/SIPC. All rights reserved.International Headquarters:The Raymond James Financial Center | 880 Carillon Parkway | St. Petersburg, Florida 33716 | 800-248-8863
28│Page
Wednesday, April 25, 2018
RAYMOND JAMES Technical Strategy Team – Technical Chart Book
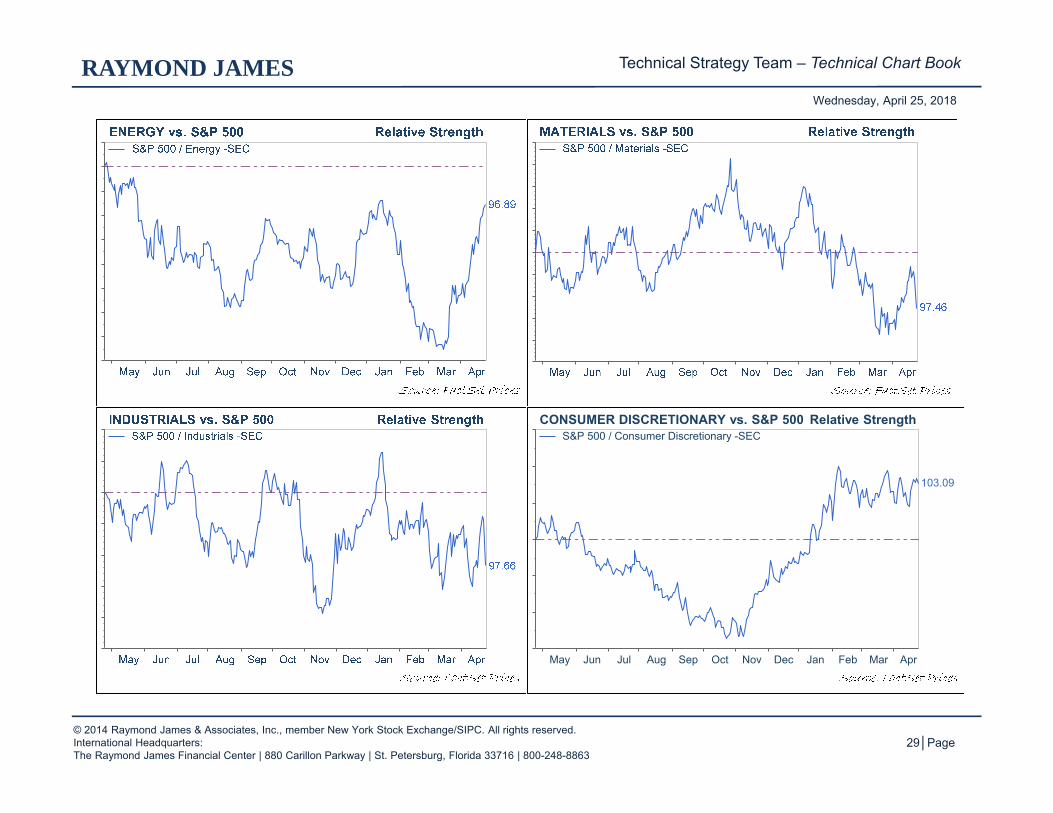
S&P 500 Sector Series – Relative Strength
S&P 500 Sectors:
• Energy• Materials• Industrials• Consumer Discretionary• Consumer Staples• Health Care• Financials• Information Technology• Telecommunication Services• Utilities
© 2014 Raymond James & Associates, Inc., member New York Stock Exchange/SIPC. All rights reserved.International Headquarters:The Raymond James Financial Center | 880 Carillon Parkway | St. Petersburg, Florida 33716 | 800-248-8863
29│Page
Wednesday, April 25, 2018
RAYMOND JAMES Technical Strategy Team – Technical Chart Book
May Jun Jul Aug Sep Oct Nov Dec Jan Feb Mar Apr
103.09
CONSUMER DISCRETIONARY vs. S&P 500 Relative StrengthS&P 500 / Consumer Discretionary -SEC

© 2014 Raymond James & Associates, Inc., member New York Stock Exchange/SIPC. All rights reserved.International Headquarters:The Raymond James Financial Center | 880 Carillon Parkway | St. Petersburg, Florida 33716 | 800-248-8863
30│Page
Wednesday, April 25, 2018
RAYMOND JAMES Technical Strategy Team – Technical Chart Book
May Jun Jul Aug Sep Oct Nov Dec Jan Feb Mar Apr
110.85
INFORMATION TECHNOLOGY vs. S&P 500 Relative StrengthS&P 500 / Information Technology -SEC

© 2014 Raymond James & Associates, Inc., member New York Stock Exchange/SIPC. All rights reserved.International Headquarters:The Raymond James Financial Center | 880 Carillon Parkway | St. Petersburg, Florida 33716 | 800-248-8863
31│Page
Wednesday, April 25, 2018
RAYMOND JAMES Technical Strategy Team – Technical Chart Book
© 2014 Raymond James & Associates, Inc., member New York Stock Exchange/SIPC. All rights reserved.International Headquarters:The Raymond James Financial Center | 880 Carillon Parkway | St. Petersburg, Florida 33716 | 800-248-8863
32│Page
Wednesday, April 25, 2018
RAYMOND JAMES Technical Strategy Team – Technical Chart Book
Style analysis: Growth vs. Value
• S&P Composite 1500 – Growth vs. Value• S&P 500 – Growth vs. Value• S&P Mid Cap 400 – Growth vs. Value• S&P Small Cap 600 – Growth vs. Value

© 2014 Raymond James & Associates, Inc., member New York Stock Exchange/SIPC. All rights reserved.International Headquarters:The Raymond James Financial Center | 880 Carillon Parkway | St. Petersburg, Florida 33716 | 800-248-8863
33│Page
Wednesday, April 25, 2018
RAYMOND JAMES Technical Strategy Team – Technical Chart Book

© 2014 Raymond James & Associates, Inc., member New York Stock Exchange/SIPC. All rights reserved.International Headquarters:The Raymond James Financial Center | 880 Carillon Parkway | St. Petersburg, Florida 33716 | 800-248-8863
34│Page
Wednesday, April 25, 2018
RAYMOND JAMES Technical Strategy Team – Technical Chart Book
International Markets Series

'13 '14 '15 '16 '17
800
1,000
1,200
1,400
1,600
1,800
1547.1901561.9801568.285
MSCI World Index24-Apr-2013 to 25-Apr-2018 (Daily) 5 Year - Daily Last: 1561.98
50 Day Moving Average 200 Day Moving Agerage Price(WO-MSX)
35│Page
RAYMOND JAMESWednesday, April 25, 2018
Technical Strategy Team – Technical Chart Book
© 2014 Raymond James & Associates, Inc., member New York Stock Exchange/SIPC. All rights reserved.International Headquarters:The Raymond James Financial Center | 880 Carillon Parkway | St. Petersburg, Florida 33716 | 800-248-8863
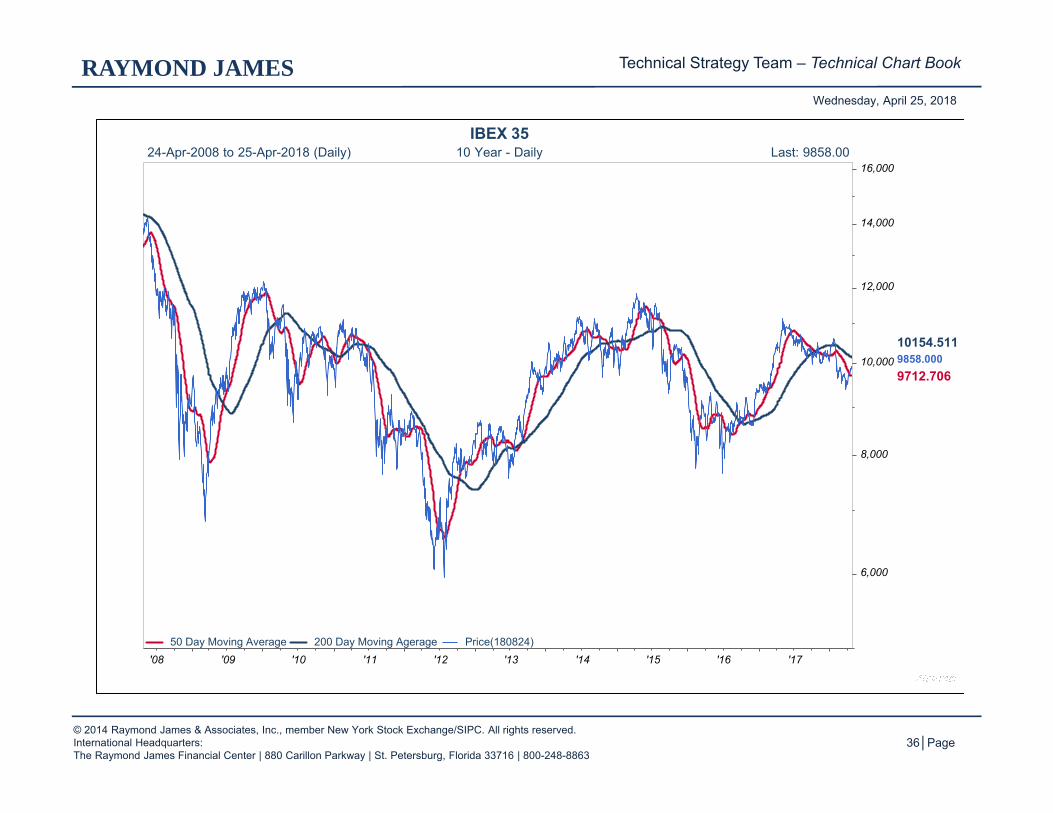
'08 '09 '10 '11 '12 '13 '14 '15 '16 '17
6,000
8,000
10,000
12,000
14,000
16,000
9712.7069858.00010154.511
IBEX 3524-Apr-2008 to 25-Apr-2018 (Daily) 10 Year - Daily Last: 9858.00
50 Day Moving Average 200 Day Moving Agerage Price(180824)
36│Page
RAYMOND JAMESWednesday, April 25, 2018
Technical Strategy Team – Technical Chart Book
© 2014 Raymond James & Associates, Inc., member New York Stock Exchange/SIPC. All rights reserved.International Headquarters:The Raymond James Financial Center | 880 Carillon Parkway | St. Petersburg, Florida 33716 | 800-248-8863
37│Page
RAYMOND JAMESWednesday, April 25, 2018
Technical Strategy Team – Technical Chart Book
© 2014 Raymond James & Associates, Inc., member New York Stock Exchange/SIPC. All rights reserved.International Headquarters:The Raymond James Financial Center | 880 Carillon Parkway | St. Petersburg, Florida 33716 | 800-248-8863

'08 '09 '10 '11 '12 '13 '14 '15 '16 '17
2,000
2,500
3,000
3,500
4,000
4,500
5,000
5,500
6,000
3117.9743211.5753311.100
China - SSE Composite Index24-Apr-2008 to 25-Apr-2018 (Daily) 10 Year - Daily Last: 3117.97
50 Day Moving Average 200 Day Moving Agerage Price(SHANG-SHG)
38│Page
RAYMOND JAMESWednesday, April 25, 2018
Technical Strategy Team – Technical Chart Book
© 2014 Raymond James & Associates, Inc., member New York Stock Exchange/SIPC. All rights reserved.International Headquarters:The Raymond James Financial Center | 880 Carillon Parkway | St. Petersburg, Florida 33716 | 800-248-8863
China’s Shanghai Composite Index

May Jun Jul Aug Sep Oct Nov Dec Jan Feb Mar Apr10,500
11,000
11,500
12,000
12,500
13,000
13,500
14,000
12309.84912422.30012659.957
Germany DAX (TR)24-Apr-2017 to 25-Apr-2018 (Daily)1 Year - Daily Last: 12422.30
50 Day Moving Average 200 Day Moving Agerage Price(DAX-XEX)
39│Page
RAYMOND JAMESWednesday, April 25, 2018
May Jun Jul Aug Sep Oct Nov Dec Jan Feb Mar Apr6,800
7,000
7,200
7,400
7,600
7,800
8,000
7204.509
7393.5427425.400
FTSE 100 / England24-Apr-2017 to 25-Apr-2018 (Daily) 1 Year - Daily Last: 7425.40
50 Day Moving Average 200 Day Moving Agerage Price(180555)
Technical Strategy Team – Technical Chart Book
© 2014 Raymond James & Associates, Inc., member New York Stock Exchange/SIPC. All rights reserved.International Headquarters:The Raymond James Financial Center | 880 Carillon Parkway | St. Petersburg, Florida 33716 | 800-248-8863

40│Page
RAYMOND JAMESWednesday, April 25, 2018
Technical Strategy Team – Technical Chart Book
© 2014 Raymond James & Associates, Inc., member New York Stock Exchange/SIPC. All rights reserved.International Headquarters:The Raymond James Financial Center | 880 Carillon Parkway | St. Petersburg, Florida 33716 | 800-248-8863

© 2014 Raymond James & Associates, Inc., member New York Stock Exchange/SIPC. All rights reserved.International Headquarters:The Raymond James Financial Center | 880 Carillon Parkway | St. Petersburg, Florida 33716 | 800-248-8863
41│Page
Wednesday, April 25, 2018
RAYMOND JAMES Technical Strategy Team – Technical Chart Book
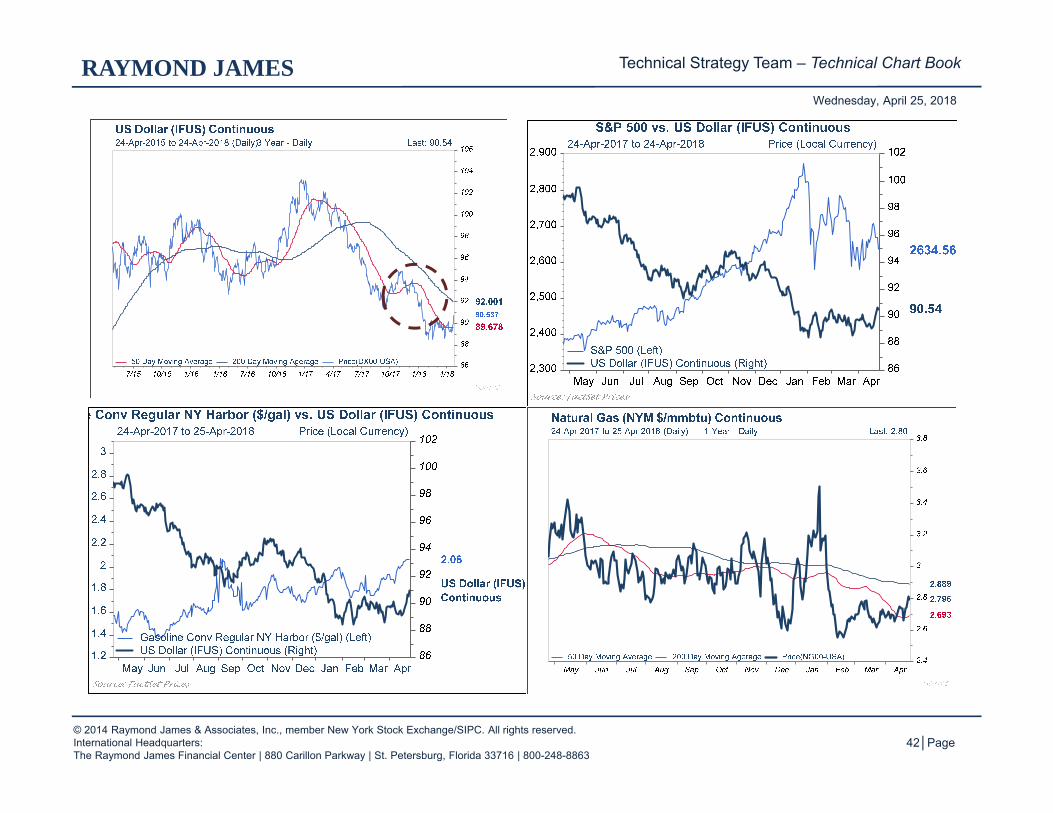
The U.S. Dollar, Interest Rates, Commodities, etc.
42│Page
RAYMOND JAMESWednesday, April 25, 2018
Technical Strategy Team – Technical Chart Book
© 2014 Raymond James & Associates, Inc., member New York Stock Exchange/SIPC. All rights reserved.International Headquarters:The Raymond James Financial Center | 880 Carillon Parkway | St. Petersburg, Florida 33716 | 800-248-8863

43│Page
RAYMOND JAMESWednesday, April 25, 2018
Technical Strategy Team – Technical Chart Book
© 2014 Raymond James & Associates, Inc., member New York Stock Exchange/SIPC. All rights reserved.International Headquarters:The Raymond James Financial Center | 880 Carillon Parkway | St. Petersburg, Florida 33716 | 800-248-8863
7/15 10/15 1/16 4/16 7/16 10/16 1/17 4/17 7/17 10/17 1/18 4/1820
30
40
50
60
70
80
67.77
73.62
Oil - Crude and Brent
Crude Oil WTI (NYM $/bbl) ContinuousBrent Crude (IFEU $/bbl) Continuous
7/16 10/16 1/17 4/17 7/17 10/17 1/18 4/18-1
0
1
2
3
4
5
6
7
8
6.16
Spread b/t brent and crude oilBrent Crude Oil (ICE $/bbl) - Price - Crude Oil (NYM $/bbl) - Price

44│Page
RAYMOND JAMESWednesday, April 25, 2018
Technical Strategy Team – Technical Chart Book
7/15 10/15 1/16 4/16 7/16 10/16 1/17 4/17 7/17 10/17 1/18 4/181
1.05
1.1
1.15
1.2
1.25
1.3
1.202
1.2171.230
U.S. Dollar per Euro24-Apr-2015 to 25-Apr-2018 (Daily) 3 Year - Daily Last: 1.22
50 Day Moving Average 200 Day Moving Agerage Price(EURUSD)
10 year Weekly chart
© 2014 Raymond James & Associates, Inc., member New York Stock Exchange/SIPC. All rights reserved.International Headquarters:The Raymond James Financial Center | 880 Carillon Parkway | St. Petersburg, Florida 33716 | 800-248-8863

45│Page
RAYMOND JAMESWednesday, April 25, 2018
Technical Strategy Team – Technical Chart Book
© 2014 Raymond James & Associates, Inc., member New York Stock Exchange/SIPC. All rights reserved.International Headquarters:The Raymond James Financial Center | 880 Carillon Parkway | St. Petersburg, Florida 33716 | 800-248-8863
46│Page
RAYMOND JAMESWednesday, April 25, 2018
Technical Strategy Team – Technical Chart Book
© 2014 Raymond James & Associates, Inc., member New York Stock Exchange/SIPC. All rights reserved.International Headquarters:The Raymond James Financial Center | 880 Carillon Parkway | St. Petersburg, Florida 33716 | 800-248-8863

47│Page
RAYMOND JAMESWednesday, April 25, 2018
Technical Strategy Team – Technical Chart Book
© 2014 Raymond James & Associates, Inc., member New York Stock Exchange/SIPC. All rights reserved.International Headquarters:The Raymond James Financial Center | 880 Carillon Parkway | St. Petersburg, Florida 33716 | 800-248-8863
May Jun Jul Aug Sep Oct Nov Dec Jan Feb Mar Apr3.1
3.2
3.3
3.4
3.5
3.6
3.7
3.8
3.9
4.0
3.71
Corn - Spot Price - Central Illinois No 2 Yellow ($/Bu)Max: 3.88 (10-JUL-17), Min: 3.19 (11-OCT-17), Last: 3.71 (25-APR-18)

© 2014 Raymond James & Associates, Inc., member New York Stock Exchange/SIPC. All rights reserved.International Headquarters:The Raymond James Financial Center | 880 Carillon Parkway | St. Petersburg, Florida 33716 | 800-248-8863
48│Page
Wednesday, April 25, 2018
RAYMOND JAMES Technical Strategy Team – Technical Chart Book
Economic Data

49│Page
RAYMOND JAMESWednesday, April 25, 2018
4/15 7/15 10/15 1/16 4/16 7/16 10/16 1/17 4/17 7/17 10/17 1/18 4/18200
250
300
350
400
450
500Consumer Inflation Expectations vs Unleaded Gas price
Usa Consumer - Expected Inflation Rate, Stock Or Quantum, % Balance - United States (Right)S&P GSCI Unleaded Gasoline - Commodity Index (Left)
Technical Strategy Team – Technical Chart Book
© 2014 Raymond James & Associates, Inc., member New York Stock Exchange/SIPC. All rights reserved.International Headquarters:The Raymond James Financial Center | 880 Carillon Parkway | St. Petersburg, Florida 33716 | 800-248-8863

© 2014 Raymond James & Associates, Inc., member New York Stock Exchange/SIPC. All rights reserved.International Headquarters:The Raymond James Financial Center | 880 Carillon Parkway | St. Petersburg, Florida 33716 | 800-248-8863
50│Page
Wednesday, April 25, 2018
RAYMOND JAMES Technical Strategy Team – Technical Chart Book

© 2014 Raymond James & Associates, Inc., member New York Stock Exchange/SIPC. All rights reserved.International Headquarters:The Raymond James Financial Center | 880 Carillon Parkway | St. Petersburg, Florida 33716 | 800-248-8863
51│Page
Wednesday, April 25, 2018
RAYMOND JAMES Technical Strategy Team – Technical Chart Book
© 2014 Raymond James & Associates, Inc., member New York Stock Exchange/SIPC. All rights reserved.International Headquarters:The Raymond James Financial Center | 880 Carillon Parkway | St. Petersburg, Florida 33716 | 800-248-8863
52│Page
Wednesday, April 25, 2018
RAYMOND JAMES Technical Strategy Team – Technical Chart Book
53│Page
RAYMOND JAMESWednesday, April 25, 2018
Technical Strategy Team – Technical Chart Book
© 2014 Raymond James & Associates, Inc., member New York Stock Exchange/SIPC. All rights reserved.International Headquarters:The Raymond James Financial Center | 880 Carillon Parkway | St. Petersburg, Florida 33716 | 800-248-8863
Past performance does not guarantee future results. There is no assurance these trends will continue. The market value of securities fluctuates and you may incur a profit or a loss. This analysis does not include transaction costs and tax considerations. If included these costs would reduce an investor’s return.
Material is provided for informational purposes only and does not constitute a recommendation. It has been obtained from sources believed to be reliable, but accuracy is not guaranteed.
International investing involves additional risks such as currency fluctuations, differing financial accounting standards, and possible political and economic instability. These risks are greater in emerging markets.
Commodities are generally considered speculative because of the significant potential for investment loss. Commodities are volatile investments and should only form a small part of a diversified portfolio. There may be sharp price fluctuations even during periods when prices overall are rising.
MACD – The moving average convergence divergence is a trend-following momentum indicator that shows the relationship between two moving averages of prices. The MACD is typically calculated by subtracting the 26-day exponential moving average (EMA) from the 12-day EMA. A nine-day EMA of the MACD, called the "signal line", is then plotted on top of the MACD, functioning as a trigger for buy and sell signals.
MACD Signal - Signal line crossovers are the most common MACD signals. A bullish crossover occurs when the MACD turns up and crosses above the signal line. A bearish crossover occurs when the MACD turns down and crosses below the signal line.
MACD Divergence - Divergences form when the MACD diverges from the price action of the underlying security. A bullish divergence forms when a security records a lower low and the MACD forms a higher low. A bearish divergence forms when a security records a higher high and the MACD forms a lower high.
S&P 500 - The S&P 500 is an unmanaged index of 500 widely held stocks. It is not possible to invest directly in an index.
NASDAQ Composite Index – The NASDAQ Composite Index is a broad-based capitalization-weighted index of stocks in all three NASDAQ tiers: Global Select, Global Market and Capital Market.
DJ Industrial Average – The Dow Jones Industrial Average is a price-weighted average of 30 blue-chip stocks that are generally the leaders in their industry.
Russell 2000 - The Russell 2000 Index is comprised of the smallest 2000 companies in the Russell 3000 Index, representing approximately 8% of the Russell 3000 total market capitalization.
DJ Transportation - The Dow Jones Transportation Average is a price-weighted average of 20 U.S. transportation stocks.
PHLX / Semiconductor - The Philadelphia Semiconductor Index is a modified capitalization-weighted index comprised of companies that are involved in the design, distribution, manufacturing, and sale of semiconductors.
54│Page
RAYMOND JAMESWednesday, April 25, 2018
Technical Strategy Team – Technical Chart Book
© 2014 Raymond James & Associates, Inc., member New York Stock Exchange/SIPC. All rights reserved.International Headquarters:The Raymond James Financial Center | 880 Carillon Parkway | St. Petersburg, Florida 33716 | 800-248-8863
CBOE Market Volatility Index - The Chicago Board Options Exchange Volatility Index reflects a market estimate of future volatility, based on the weighted average of the implied volatilities for a wide range of strike prices.
MSCI The World Index - The MSCI World Index is designed to measure the equity market performance of developed markets. It tracks 23 countries including the United States.
Spain IBEX 35 - The IBEX 35 is the official index of the Spanish Continuous Market. The index is comprised of the 35 most liquid stocks traded on the Continuous market.
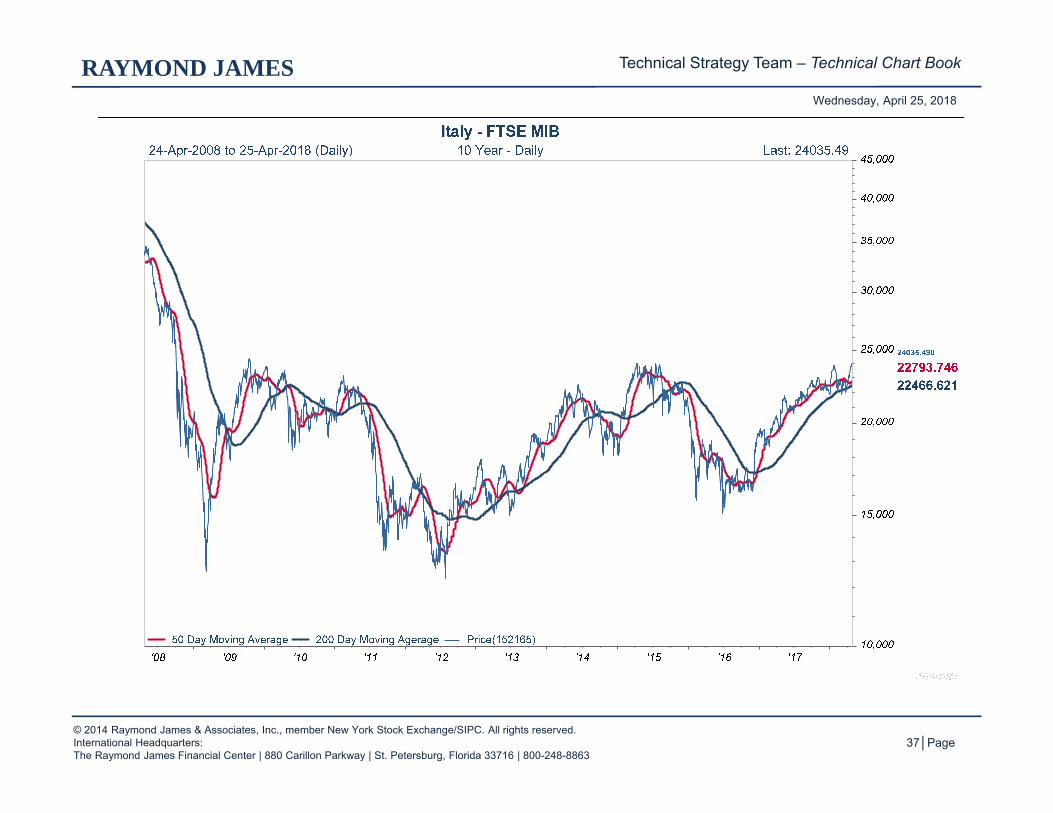
Italy FTSE MIB - The FTSE MIB Index is comprised of the 40 most liquid stocks traded on the Borsa Italiana.
U.S. Dollar per Euro – The Euro US Dollar Spot Exchange Rate is the price of 1 EUR in USD 1. The euro is the official currency of the European Economic & Monetary Union. It is quoted in the # of USD per euro. 2. The US dollar is the official currency of the United States of America. The spot rate is by convention always equal to one. This is the value against which all other spot rates are measured.
Germany DAX (TR) - The German Stock Index is a total return index of 30 selected German blue chip stocks traded on the Frankfurt Stock Exchange.
France CAC 40 - The CAC 40 Index is a narrow-based, modified capitalization-weighted index of 40 companies listed on the Paris Bourse.
FTSE 100 Index - The FTSE 100 Index is a capitalization-weighted index of the 100 most highly capitalized companies traded on the London Stock Exchange.
S&P/TSX Composite - The S&P/TSX, the Toronto Stock Exchange Composite Index, is a capitalization-weighted index designed to measure market activity of stocks listed on the TSX.
Japan Nikkei 225 - The Nikkei-225 Stock Average is a price-weighted average of 225 top-rated Japanese companies listed on the Tokyo Stock Exchange.
S&P ASX 200 / Australia - The S&P/ASX 200 measures the performance of the 200 largest index-eligible stocks listed on the ASX by float-adjusted market capitalization.
KOSPI Composite Index / Korea - The KOSPI Index is a capitalization-weighted index of all common shares on the Korean Stock Exchanges.
FTSE Xinhua China 25 - The FTSE China 25 Index includes the top 25 Chinese companies by total market cap.
Global 10Y Treasury Yields - The average yields of 10 year government bonds for the countries of: The United States of America, Japan, United Kingdom, Germany, and Canada.
French 10 Year Yield - German 10 Year Yield – The difference between average yield of France’s 10 year government bond and German’s 10 year government bond.

55│Page
RAYMOND JAMESWednesday, April 25, 2018
Technical Strategy Team – Technical Chart Book
© 2014 Raymond James & Associates, Inc., member New York Stock Exchange/SIPC. All rights reserved.International Headquarters:The Raymond James Financial Center | 880 Carillon Parkway | St. Petersburg, Florida 33716 | 800-248-8863
Spanish 10 Year Yield - German 10 Year Yield - The difference between average yield of Spain’s 10 year government bond and German’s 10 year government bond.
Spanish & Italian 10 Year Yields – The average yields of Spanish and Italian 10 year government bonds.
QE or Quantitative Easing is unconventional monetary policy used by central banks to stimulate the national economy when conventional monetary policy has become ineffective
Price Earnings Ratio (P/E) is the price of the stock divided by its earnings per share.
Standard deviation is a measure of the dispersion of a set of data from its mean. The more spread apart the data, the higher the deviation.
Fibonacci retracement is a term used in technical analysis that refers to potential areas of support (price stops going lower) or resistance (price stops going higher). Fibonacci retracement use horizontal lines to indicate areas of support or resistance at the key Fibonacci levels before it continues in the original direction. These levels are created by drawing a trendline between two extreme points and then dividing the vertical distance by the key Fibonacci ratios of 23.6%, 38.2%, 50%, 61.8% and 100%.
A moving average is an indicator frequently used in technical analysis showing the average value of a security’s price over a set period. Moving averages are generally used to measure momentum and define areas of possible support and resistance.
The S&P Composite 1500 is a investable U.S. equity benchmark that combines three leading indices, the S&P 500, the S&) MidCap 400, and the S&) SmallCap600 to cover approximately 90% of the U.S. market capitalization.
The S&P MidCap 400 provides investors with a benchmark for mid-sized companies. The index covers over 7% of the U.S. equity market and seeks to rema8in an accurate measure of mid-sized companies, reflection the risk and return characteristics of the broader mid-cap universe on an on-going basis.
The S&P SmallCap 600 covers approximately 3% of the domestic equities market Measuring the small cap segment of the market that is typically renowned for poor trading liquidity and financial instability, the index is designed to be an efficient portfolio of companies that meet specific inclusion criteria to ensure that they are investable and finically viable.
The SSE Composite Index is an index of all stocks (A shares and B shares) that are traded in the Shanghai Stock Exchange.