Software Project Visualization Using Task Oriented Metaphors

Research Ideas and Outcomes 4: e25742doi: 10.3897/rio.4.e25742
Reviewable v1
Research Article
Task-based assessment of visualization tools for the
comparison of biological taxonomies
Lilliana Sancho-Chavarria , Fabian Beck , Daniel Weiskopf , Erick Mata-Montero‡ School of Computing, Costa Rica Institute of Technology, Cartago, Costa Rica§ Institute for Computer Science and Business Information Systems, University of Duisburg-Essen, Essen, Germany| VISUS, University of Stuttgart, Stuttgart, Germany
Corresponding author: Lilliana Sancho-Chavarria ([email protected]), Fabian Beck ([email protected]), Daniel Weiskopf ([email protected]), Erick Mata-Montero ([email protected])
Received: 12 Apr 2018 | Published: 12 Apr 2018
Citation: Sancho-Chavarria L, Beck F, Weiskopf D, Mata-Montero E (2018) Task-based assessmentof visualization tools for the comparison of biological taxonomies. Research Ideas and Outcomes 4: e25742. https://doi.org/10.3897/rio.4.e25742
Abstract
Maintenance and curation of large-sized biological taxonomies are complex and laboriousactivities. Information visualization systems use interactive visual interfaces to facilitateanalytical reasoning on complex information. Several approaches such as treemaps,indented lists, cone trees, radial trees, and many others have been used to visualize andanalyze a single taxonomy. In addition, methods such as edge drawing, animation, andmatrix representations have been used for comparing trees. Visualizing similarities anddifferences between two or more large taxonomies is harder than the visualization of asingle taxonomy. On one hand, less space is available on the screen to display each tree;on the other hand, differences should be highlighted. The comparison of two alternativetaxonomies and the analysis of a taxonomy as it evolves over time provide fundamentalinformation to taxonomists and global initiatives that promote standardization andintegration of taxonomic databases to better document biodiversity and support itsconservation. In this work we assess how ten user visualization tasks for the curation ofbiological taxonomies are supported by several visualization tools. Tasks include theidentification of conditions such as congruent taxa, splits, merges, and new species added
‡ § | ‡
© Sancho-Chavarria L et al. This is an open access article distributed under the terms of the Creative Commons AttributionLicense (CC BY 4.0), which permits unrestricted use, distribution, and reproduction in any medium, provided the original authorand source are credited.

to a taxonomy. We consider tools that have gone beyond the prototype stage, that havebeen described in peer-reviewed publications, or are in current use. We conclude with theidentification of challenges for future development of taxonomy comparison tools.
Keywords
Information visualization, biodiversity informatics, taxonomy, taxonomy comparison tools.
1. Introduction
Biological taxonomies are hierarchical structures that represent classifications of livingorganisms. Taxonomists, herbaria, natural history museums, and biodiversity initiativesworldwide classify biodiversity according to literature and other sources of informationavailable to them, and to a choice of criteria that they recognize as valid. Consequently, it isnot surprising that different classifications emerge and that there is disagreement in thescientific community about which classification is correct. To resolve these conflicts,taxonomists perform studies―called revisions―that could lead to other variants of theclassifications. Taxonomists and global initiatives eventually need to reconcile thesemultiplicity in order to properly document biodiversity. Therefore, differences and similaritiesbetween such alternative taxonomies have to be identified. Since taxonomies can be largeand the number of changes substantial, the support of software tools to carry out thisendeavor becomes indispensable.
In this article we analyze information visualization tools designed to support comparison ofbiological taxonomies. We reviewed the tools and contrast them with ten user visualizationtasks that we characterized in a previous work (Sancho-Chavarria et al. 2016). Section 2presents a brief description of the reviewed tools and the list of ten user visualization taskswhich we use as software requirements for the visual comparison of taxonomic changes.Section 3 describes the methodology used to assess the tools. Section 4 presents theassessment of the tools. Finally, Section 5 discusses future challenges and presentsconclusions.
2. Background
The comparison of alternative classifications has long been a research topic in informationvisualization (Graham and Kennedy 2010). In this work we are interested in assessing howtools for the comparison of biological taxonomies support previously characterized usertasks.
A hierarchy comparison tool is expected to receive as input at least two hierarchies andfacilitate the visualization of similarities and differences. These similarities and differencescould be indicated manually by experts, inferred by the software itself, or both. We consider
2 Sancho-Chavarria L et al

that the process for the comparison and curation of taxonomies involves three componentsas illustrated in Fig. 1. The purpose of the Inference component is to compute thedifferences and similarities between taxonomies. To do so, sometimes the software wouldrequire the taxonomic history of the species, that is, how a species has been classifiedthrough time; however that history is not commonly available in databases so that expert-provided inferences are required in order to be able to visualize the relationships betweentaxonomies. In that case, instead that the software carries out the inference on its own, therelationships will have to be manually indicated by experts. The Visualization component isresponsible for the visual representation of the taxonomies and makes use of theinformation provided by the Inference component for the purpose of presenting thedifferences and similarities. After users analyze the results of the comparison, it seemsnatural to think about an Edition component. The objective of this component is to allowusers to change taxonomies as they deem necessary. Users can then go in a visualization/edition cycle until they reach a satisfying point.
We reviewed literature on tree visualization and comparison and identified informationvisualization tools for the comparison of biological taxonomies. Then we selected tools thathave gone beyond the prototype stage and have been described in peer-reviewedpublications or that are in current use. As a result, TreeJuxtaposer (Munzner et al. 2003),TaxVis (Graham and Kennedy 2007, Graham et al. 2008, Graham and Kennedy 2010),The Taxonomic Tree Tool (Lin and Wang 2013), and ProvenanceMatrix (Dang et al. 2015)were selected. Although these tools compare biological taxonomies, it is important tohighlight that they do not share the same user requirements. Furthermore, in thisassessment we have considered a list of ten user tasks that go beyond the originalrequirements of each of these tools. However, we believe these are the tools that moreclosely address those requirements. This comparison is critical in order to understand howthe reviewed tools satisfy the requirements as well as to obtain an overview of approachesand missing functionality. The following paragraphs present a summary of features of eachtool.
2.1 The tools
TreeJuxtaposer was created for the visual comparison of large trees, especiallyphylogenies, although it could be applied to other domains (Munzner et al. 2003).TreeJuxtaposer's main goal is the automatic detection and visualization of structuraldifferences among hierarchies. It uses a similarity measure that computes the best
Figure 1.
Components of the process for the comparison of biological taxonomies.
Task-based assessment of visualization tools for the comparison of biological ... 3

corresponding node for each internal node and each leaf node. The hierarchical structureis represented by a rectilinear layout similar to a dendrogram and classifications are placedside by side, fitting the size of the screen without the use of scrolling. It relies on color tovisualize similarities and differences. Fig. 2 shows an example of the representation usedby TreeJuxtaposer. It shows the structural differences between two taxonomies,emphasized through colored-coded edges. TreeJuxtaposer implements an accordion-typedistortion technique as the focus+context mechanism that supports the concept ofguaranteed visibility of selected areas. Brushing and linking facilitate visual exploration: theselected node and the best corresponding nodes in all other trees are temporarilyhighlighted. Users can also apply the linked navigation option in order to compareanalogous areas in each tree, so that subtrees underneath the best corresponding nodesin other trees are resized and synchronized with the selected subtree.
TaxVis (Graham and Kennedy 2007) is a tool designed to explore relationships betweenmultiple taxonomic trees through concept relationships. A concept is defined as a uniquecombination of (name, author, and date). TaxVis inputs are a set of hierarchies and a set ofconcept relations given by expert taxonomists (Graham et al. 2008). The main visualizationrequirements are: to track siblings and parents of a genus across hierarchies, to trackchildren of a particular higher-level node across the hierarchies, and to compare theamount of levels across hierarchies (Graham et al. 2000). Fig. 3 illustrates the multiple treeview that holds the taxonomies being compared; this illustrates the main panel where usersinteract and identify relationships among taxa. A hierarchy is represented in a set-basedvisualization rather that in a node-link metaphor. Multiple taxonomies are placed from top tobottom within the panel and each taxonomy is also displayed in a top-down fashion withlower rank taxa drawn underneath their parent taxa, in an icicle plot style. Each taxon isrepresented by a rectangular box. When users select a taxon, the corresponding conceptsin the alternative classifications are highlighted with color and edges; for instance, by
Figure 2.
An abstract representation of TreeJuxtaposer´s environment for taxonomy comparison.
4 Sancho-Chavarria L et al

selecting a genus, users can visualize the corresponding species of that genus as well asthe location of those species in the other classifications. When users select a taxon, it ismoved to the top of the displayed fragment of the classification, at the same time that thedescendant taxa are displayed underneath it, and they are highlighted within the otherclassifications. Concept relationships such as congruent (=), non-congruent (≠), contains(⊃), is contained in (⊂), and overlaps (∩) (Graham and Kennedy 2007) are represented bycolor coded lines. The tool includes other views, such as a list of all taxa names within thedata sets, attributes of a selected taxon, a control panel to regulate various properties ofthe display and interaction, and a history of selected comparisons. Complementary toTaxVis is the Concept Relationship Editor―CRE (Graham et al. 2008), a separate tool thatallows the edition of concept relationships between two classifications.
The Taxonomic Tree Tool―TTT (Lin and Wang 2013) is a web-based application designedto compare and edit classifications. In TTT there are two types of users: general users andregistered users. General users can access public information on the web site such aspublic classifications, public tree comparison cases, news, and statistics: registered userscan additionally upload and edit their own classifications and compute tree comparisons.Tree comparisons can be visualized either through indented trees or through a node-linkdiagram in D3. In the indented tree layout, the comparison tree (CT) and the reference tree(RT) are placed side by side. Each tree has its own vertical scrollbar and scrolling is notsynchronized between trees. At first, the trees appear compressed, that is, only the rootnode of each tree is displayed and a plus sign indicates that the node can be expanded tothe next tree level. For each node the visualization includes rank, taxa, and a set of glyphsthat depict relationships between nodes in the two compared classifications. Fig. 4illustrates the case of comparing two fictitious taxonomies T1 (CT) and T2 (RT). Thelegend in the figure explains the meaning of the glyphs. The ancestor relation indicateswhether the two compared taxa have the same ancestor route: 1 means same route and 0
Figure 3.
An abstract representation of TaxVis´s environment for taxonomy comparison.
Task-based assessment of visualization tools for the comparison of biological ... 5

stands for different routes. Nominal relations indicate how names are related. A green circleindicates that the name refers to exactly the same name and corresponds to the sametaxon in both trees. A blue circle indicates that the corresponding taxa is a synonym, and ared circle shows no relation between both nodes. Similar to the ancestor’s case, thedescendant relations evidence how related descendants are; for instance, it revealswhether the descendants´ branches are congruent (exactly the same), one branch of a treeis included in, or excluded from the other tree. Finally, the multiple links glyph indicates thata taxon in the CT has more than one relation to taxa in the RT. For example, family"Felidae" in both taxonomies indicate same ancestror, nominal and descendant relations inboth hierarchies,
In the node-link layout, differences are color-coded. Users can filter by view type andvisualize either overlaps, differences or both.
ProvenanceMatrix (Dang et al. 2015) is a visualization tool for exploring and analyzing theoutcomes of taxonomic alignments (merges) generated with the reasoning toolkit EULER/X(Chen et al. 2014). EULER/X takes as input two taxonomies and a set of expert assertionsthat relate concepts between taxonomies at the leaf level. Experts express assertionsthrough region connection calculus (RCC-5) relations such as equals, includes, is includedin, overlaps, or disjoint (Franz et al. 2008). The reasoning toolkit produces alternativeoutcomes that can be visualized with ProvenanceMatrix. As shown in Fig. 5,ProvenanceMatrix uses a matrix to represent the relationships that may exist betweenelements from two taxonomies. Taxonomies are displayed along the axes of the matrix.The taxonomy on the horizontal axis can be displayed by using different orderings of thetaxonomic concepts. Taxonomies can be displayed either in depth-first search, breadth-firstor similarity ordering. In a similarity-based order the concepts are ordered by similarity oftheir articulation sets. Hierarchical parent-child relationships within each tree are drawnthrough lines that are painted over the matrix cells, and identation also helps to show
Figure 4.
An abstract representation of TTT´s environment for taxonomy comparison.
6 Sancho-Chavarria L et al
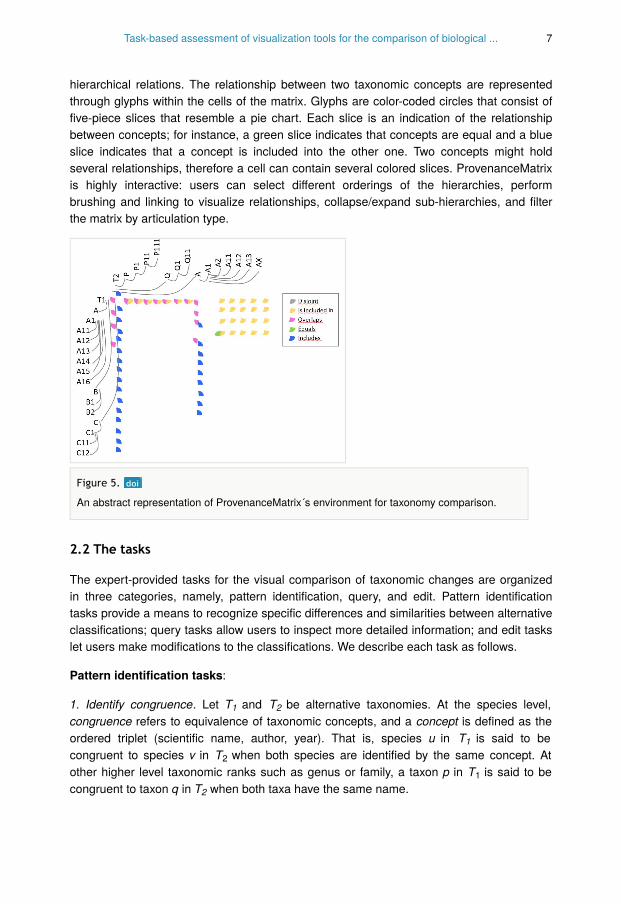
hierarchical relations. The relationship between two taxonomic concepts are representedthrough glyphs within the cells of the matrix. Glyphs are color-coded circles that consist offive-piece slices that resemble a pie chart. Each slice is an indication of the relationshipbetween concepts; for instance, a green slice indicates that concepts are equal and a blueslice indicates that a concept is included into the other one. Two concepts might holdseveral relationships, therefore a cell can contain several colored slices. ProvenanceMatrixis highly interactive: users can select different orderings of the hierarchies, performbrushing and linking to visualize relationships, collapse/expand sub-hierarchies, and filterthe matrix by articulation type.
2.2 The tasks
The expert-provided tasks for the visual comparison of taxonomic changes are organizedin three categories, namely, pattern identification, query, and edit. Pattern identificationtasks provide a means to recognize specific differences and similarities between alternativeclassifications; query tasks allow users to inspect more detailed information; and edit taskslet users make modifications to the classifications. We describe each task as follows.
Pattern identification tasks:
1. Identify congruence. Let T and T be alternative taxonomies. At the species level,congruence refers to equivalence of taxonomic concepts, and a concept is defined as theordered triplet (scientific name, author, year). That is, species u in T is said to becongruent to species v in T when both species are identified by the same concept. Atother higher level taxonomic ranks such as genus or family, a taxon p in T is said to becongruent to taxon q in T when both taxa have the same name.
1 2
1
2
1
2
Figure 5.
An abstract representation of ProvenanceMatrix´s environment for taxonomy comparison.
Task-based assessment of visualization tools for the comparison of biological ... 7
2. Identify corrections. Differences between alternative taxonomies are due to revisions orto authors using different classification criteria. We consider the following four types ofcorrections: splits, merges, moves, and typos.
a) Identify splits: A split occurs when taxonomists divide one concept into two or moreconcepts. It is more likely that experts propose splits at lower level ranks, such as at family,genus, or species level. For instance, concept u in taxonomy T can be split into concepts v, v , ... v in taxonomyT , where either u = v or u is a synonym of v , and v , ... v are
new concepts. An inference algorithm for the identification of splits would need thetaxonomic history of the involved species.
b) Identify merges: A merge occurs when taxonomists combine two or more concepts intoone. It is more likely that experts propose merging concepts at lower level ranks, such as atthe family, genus, or species level. For instance, concepts u , u , ... u in taxonomy T cancorrespond to concept v in taxonomy T . At the species level, concepts u , u , ... u areregistered as synonyms for concept v.
c) Identify moves: A concept can be identified as moved when it appears re-classified inanother position of an alternative taxonomy; that is, a concept u in T is re-classified asconcept v in T when parent(u) ≠ parent(v). An inference algorithm for the identification ofmoves would need the taxonomic history of the involved concepts.
d) Identify typos: A typo is a misspelling of a name.
3. Identify additions. Additions occur when new concepts are added to a taxonomy. In otherwords, concept v has been added to T if v ∈ T and v ∉ T .
4. Overview changes. This task presents an overview of corrections and additions asstated in items 2 and 3 above.
5. Summarize. This task refers to obtaining a numerical understanding of change betweentaxonomies T and T , for example, with respect to number of species, number of splitcases, number of merge cases, amount and percentage of species added.
Query tasks:
6. Find inconsistencies. Inconsistencies are due to circumstances that go beyond thedifferent types of corrections described above and that refer to violations of rules (e.g.,repeated names within one taxonomy or missing names in a newer version of a taxonomy).
7. Filter. This task refers to finding cases that satisfy certain conditions. Through filtercriteria users can visualize selected pieces of information. For example, filtering by authoror by date.
8. Retrieve details. The goal of his task is to retrieve the attributes of a particular concept.For example, retrieve the details of a concept with name "Passiflora coriacea" will displaydata such as, author, year, and its list of synonyms.
1
1 2 n 2 1 1 2 n
1 2 n 1
2 1 2 n
1
2
2 2 1
1 2
8 Sancho-Chavarria L et al

9. Focus. Navigate to an area of interest, in order to see the information in greater detail.
Edit task:
10. Edit. The goal of this task is to allow users to make changes in the classifications afteranalyzing the results of the comparison.
3. Methodology
Our starting point has been a list of tasks for the curation of biological taxonomies(Sancho-Chavarria et al. 2016). This task characterization resulted from a two-stagesystematization process that involved literature review and interviews to experts. In the firststage experts were interviewed and provided information in order to derive a draft list oftasks. In the second stage, tasks were revised by the experts, and after a careful analysiswe obtained the final list. These tasks were described in the previous section.
For this work we investigated tools for comparing biological taxonomies. As stated above,TreeJuxtaposer, TaxVis, The Taxonomic Tree Tool (TTT), and ProvenanceMatrix wereselected considering that these are tools that go beyond the prototype stage, have beendescribed in peer-reviewed publications, or are currently in use. Given that only TTT wasavailable online, we contacted authors in order to confirm that we had suitable sources ofinformation. Four out of the six contacted authors shared additional materials, such as linksto the InfoVis 2003 Contest on Visualization and Pair Wise Comparison of Trees, users'guide of the tools, and links to source code. Since some tools were rather old andtechnology requirements were difficult to fulfill to make them run, publications, guides andpresentations were our main sources of information.
To systematize the analysis we use the rating criteria indicated in Fig. 6. An "explicit" rate isgiven when the tool provides an explicit mechanism to carry out the task; an "implicit" rateis given when users can accomplish the task by doing visual exploration and navigation;and, the "not addressed" rate is given when the tool does not support the task.
Figure 6.
Rating criteria for the analysis of the evaluated tools.
Task-based assessment of visualization tools for the comparison of biological ... 9

We built tables that present the assessment of each tool with respect to the tasks.Afterwards, we contacted authors again, shared the draft assessment of their tool andasked them for feedback. Three out of six authors replied. Authors agreed with most of theassessment results, they commented each evaluation and explained cases that theyconsidered required more accuracy or detail. Lastly, we incorporated authors' feedback andperformed a final analysis and assessment.
4. Assessment
This section presents the results of contrasting the four reviewed tools and the list of tenuser tasks. The assessment is organized by task category.
4.1 Pattern identification tasks
1. Identify congruence. As summarized in Fig. 7, most reviewed tools provide functionalityto carry out this task. Brushing and linking, coloring, and the use of glyphs are commonstrategies for the identification of congruent relationships between alternativeclassifications. The identification of congruence is considered explicit in TaxVis, TTT, andProvenanceMatrix. TaxVis relies on expert-provided information for the identification ofcongruence and users can visualize congruent relationships through exploration as well asbrushing and linking. TTT calculates nominal relations that provide users with theinformation to infer congruence; nominal relations are represented through color-codedglyphs. In ProvenanceMatrix relations are given by experts and congruence is alsoidentified by color-coded glyphs. TreeJuxtaposer does not handle attributes, so it does notconsider concepts and does not have the mechanisms for the identification of congruence.Nonetheless, users can identify equal scientific names by browsing and doing visualexploration on the marked areas.
2. Identify corrections. Possible types of corrections are: splits, merges, moves, and typos.
a) Identify splits
Let us recall that according to the definition of split in the list of requirements, a split occursin a classification by decision of human experts. In order to identify that a taxon has beensplit, it is required to know its taxonomic history; that is, whether in the past it belonged to amore general concept. From our literature review we observed that the identification ofsplits was not a distinct requirement for any of the assessed tools, therefore none of thetools address this task in an explicit way (see Fig. 8). However, since TaxVis includes
Figure 7.
Result of the assessment for task identify congruence.
10 Sancho-Chavarria L et al

concept relations given by experts, this tool can allow the identification of splits in animplicit way because taxonomists provide the relations that correspond to splits thatoccurred in the past. When selecting a taxon, concept relations are listed and are alsodrawn between the alternative classifications; thus, users can recognize splits by exploringthe taxonomies and inspecting the provided taxon history. ProvenanceMatrix displaysconcept relations equals, includes, is included in, and overlaps, hence users might discoversplits through a laborious exploration of these relations, although the tool does not addresssplits as such. In brief, we consider splits are implicit in TaxVis and not addressed in theother reviewed tools because the taxonomic history of taxa is not included in the data.
b) Identify merges
Analogous to the split subtask, the identification of merges was not a distinct requirementfor the reviewed tools. A merged taxon can be determined by tracing its synonyms or whenthe concept relations are directly indicated. Since concept relations are given by experts inTaxVis, merges can be identified implicitly through visual exploration of correspondencesbetween taxa. Merges do not occur in evolutionary trees, thus they are not considered inTreeJuxtaposer. TTT distinguishes synonyms by means of nominal relations but this is notenough to be able to visually find merges. Merges in ProvenanceMatrix might bediscovered by a cumbersome exploration of the concept relations equals, includes, isincluded in, and overlaps, but the tool does not address splits as such. A summary of theratings is presented in Fig. 9.
c) Identify moves
A taxon can be moved by a taxonomist to another position within the classification when,according to expert criteria, the taxon should be re-classified. Fig. 10 summarizes theassessment of the tools for this task. TreeJuxtaposer visualises structural changes amongtaxonomies via color-coded edges, therefore a re-classified taxon can be implicitlyrecognized by visual exploration of the classifications. TaxVis also supports this task in animplicit way by means of the visual exploration of expert-introduced concept relations.Other tools do not address this task. TTT does not provide functionality for the identification
Figure 8.
Result of the assessment for the task identify splits.
Figure 9.
Result of the assessment for the task identify merges.
Task-based assessment of visualization tools for the comparison of biological ... 11

of cases where species within the Reference Tree (RT) have been classified under adifferent taxon in the Comparison Tree (CT). ProvenanceMatrix displays concept relations:equals, includes, is included in, overlaps, and disjoint. Through laborious exploration of thedata users might discover the re-classification of species, however, the tool does notaddress taxon moves as such.
d) Identify typos
None of the tools contains functionality to support this task.
3. Identify additions
In one way or another all tools support this task. In TreeJuxtaposer, added nodes aremarked in red color, the task is supported in an explicit way. In TaxVis, when selecting anon-leaf node, its corresponding descendants are highlighted within the alternativetaxonomies; so, users can identify additions, in an implicit way, by performing visualidentification of differences. In TTT, the red glyphs that represent no ancestor relation andthe red glyps that indicate no nominal relation imply that new nodes have been added; thuswe consider that TTT supports this task in an explicit way. In ProvenanceMatrix, this task isalso approached in an explicit way: non-congruent nodes indicated in red color correspondto new nodes added to the taxonomy.
4. Overview changes
All tools visualize changes, but most of them do not exactly comply with the definition oftask overview changes in the list of requirements (see Fig. 11). TaxVis' visualization ofchange is closer to this definition because users can identify splits, merges, and additionswith little effort in an implicit way. TreeJuxtaposer's main focus is the visualization oftopological changes, and for this it relies on color-coding, TTT visualizes several changeconditions through color-coded and shape-coded glyphs, and ProvenanceMatrix usescolor-coded glyphs; thus, our assessment is not addressed but with the observation thatthey provide similar functionality.
Figure 10.
Result of the assessment for the task identify moves.
Figure 11.
Result of the assessment for the task overview changes.
12 Sancho-Chavarria L et al

5. Summarize.
All tools present at least some basic numerical information in an explicit way.TreeJuxtaposer approaches this task through the find function and displays the amount ofnamed nodes within a selected taxonomy. TaxVis displays the amount of subtaxa of aselected taxa and its percentage relationship with respect to a compared classification.TTT provides a wide range of statistics on taxons and on structure. Statistics on taxa areamount of orders, classes, families, genera, and species. Statistics on structure alsoindicate amount of equal taxa, amount of overlapped taxa, and amount of unmatched taxafor each taxonomic rank. ProvenanceMatrix provides a bubble chart that visualizes theproportion of each type of articulation.
4.2 Query tasks
6. Find inconsistencies
None of the tools supports this task.
7. Filter
TaxVis and ProvenanceMatrix support this task in an explicit way, whereas TreeJuxtaposerand TTT do not support it at all. TaxVis has a filter relations menu that allows thevisualization of congruent, contains, included, overlaps, and is not congruent with relations.TreeJuxtaposer does not handle attributes, therefore it cannot filter attributes.ProvenanceMatrix provides filtering through different types of articulations.
8. Retrieve details
All tools support this task in an explicit way. TreeJuxtaposer includes a search by namemechanism. TaxVis retrieves the information of a node after selecting it. TTT provides asearch-by scientific name feature. ProvenanceMatrix retrieves the data through a mouse-over operation and also pictures are retrieved from Wikipedia.
9. Focus
All tools except TTT feature focus mechanisms explicitly. TreeJuxtaposer achieves this taskthrough features such as guaranteed visibility, accordion, lens and mouse pointer. InTaxVis this tasks is performed through increasing the size of selection. ProvenanceMatrixapproaches this task by collapse, expand, resize, and order by features.
4.3 Edit task
10. Edit
The comparison through visualization provides users with an understanding of differencesand similarities between taxonomies, and afterwards editing becomes necessary. Only TTTprovides functionality for this task, and it is explicit. Although TaxVis and ProvenanceMatrix
Task-based assessment of visualization tools for the comparison of biological ... 13

do not approach this task, they both have complementary tools for this functionality. TaxVisedition complementary tool is the Concept Relationship Editor (CRE) andProvenanceMatrix´s is EULER/X ‒ a multi-taxonomy alignment tool. The assessment ispresented in Fig. 12.
5. Conclusions
The assessment of the four biological taxonomies comparison tools reveals distinctapproaches among tools, as well as different levels of support for the defined tasks.Considering approaches, TreeJuxtaposer uses dendrograms and focuses on visualizingstructural differences; TaxVis uses an adjacent set-based type layout and its main focus ison visualizing a genus-corresponding species within the other classifications; TTT usesindented lists and concentrates on visualizing similarities and differences through ancestor,descendant, and nominal relations; and ProvenanceMatrix implements a matrix approachto visualize the correspondences between taxonomies after applying expert assertions torelate concepts. All tools take advantage of color to highlight similarities and diferences.
Regarding the defined tasks, Fig. 13 presents a summary that contrasts tasks and tools. Alltools allow users to retrieve the available details of a taxon (task 8), and all tools presentsome sort of numerical summary of the data (task 5). Identify congruence (task 1), identifyadditions (task 3), and focus (task 9) are supported by most tools. It should be mentionedthat the identification of congruence also reveals the identification of its complement, thatis, the identification of non-congruency, which consequently exposes differences as well.Identify corrections (task 2) is either not addressed at all or implicitly addressed by thetools; thereby, identify splits and identify merges are implicitly addressed by one tool,identify moves is implicitly addressed by two tools, and identify typos is not addressed atall. We noticed that the most common differences visualized by the tools correspond tonodes added and non-congruent nodes. All tools visualize changes, but most of them donot comply with the definition of the task overview changes (task 4). Regarding the taskfind inconsistencies (task 6), none of the tools incorporates functionality to address it. Filter(task 7) is provided by two tools. Edit is explicitly addressed in one tool whereas two othertools have complementary software to accomplish this task.
Figure 12.
Result of the assessment for the task edit.
14 Sancho-Chavarria L et al

As mentioned before, the assessed tools respond to requirements established at the timethey were conceived. However, given that they are hierarchy comparison tools, they havecertainly a correspondence with several of the expert-provided tasks described above,although they also present several gaps that are indicated in Fig. 13. First, tasks for theidentification of specific types of change ―such as splits and merges― are supported(partially) only by TaxVis, in spite of the importance pointed out by interviewed taxonomists;thus, the consideration of these tasks in future work is mandatory. Second, the taskoverview changes consists of an integral overview of differences between the comparedtaxonomies but given the lack of support for the specific types of change discussed above,we conclude that it is not supported by any of the tools. Third, it is surprising that neitheridentify typos nor find inconsistencies are supported by the assessed tools. A reason maybe that these tasks are more on the side of data cleaning than on taxonomy comparison;nevertheless, they are included in our list of tasks since users need to have reliable data inorder to accomplish taxonomic comparison and analysis. Fourth, the task filter is regularlyencountered in information visualization tools (Graham and Kennedy 2010), yet, it is absentin several of the assessed tools. Fifth, edit, which is a task that would allow users to modifya taxonomy after analyzing the results of the comparison, is only included in one of thetools and considered by two other tools in a separate piece of software. Sixth, all toolspresent restrictions to perform the automatic identification of similarities and differences.Given that taxon names are not enough to establish differences and similarities, attributes(such as author's name, year or synonyms) are required for the identification ofcongruence, splits or merges, and to perform filtering and edition. Furthermore, most toolshave to rely on expert-provided relationships between taxa since databases usually lack ofdata about the taxonomic history of concepts. This data limitation represents a challengefor future work.
Figure 13.
Summary of the assessment, contrasting tasks and tools.
Task-based assessment of visualization tools for the comparison of biological ... 15

In summary, this work reveals lack of support for certain tasks in the assessed tools;specifically for identify splits, identify merges, identify moves, identify inconsistencies andedit. Given the importance of these tasks for taxonomic work, this clearly suggests thatfuture work should investigate suitable visualization approaches to fill these gaps.
Acknowledgements
The authors would like to thank Nico Franz, Martin Graham, Jessie Kennedy, and TamaraMunzner for their feedback on available sources of information and on our draftassessment of the tools.
References
• Chen M, Yu S, Franz N, Bowers S, Ludaescher B (2014) Euler/X: a toolkit for logic-based taxonomy integration. arXiv. 2014;1402:1992. URL: http://arxiv.org/abs/1402.1992
• Dang T, Franz N, Ludäscher B, Forbes AG (2015) ProvenanceMatrix: A VisualizationTool for Multi-Taxonomy Alignments. vol. 1456. CEUR Workshop Proceedings, 13-24pp.
• Franz N, Peet R, Weakley A (2008) On the Use of Taxonomic Concepts in Support ofBiodiversity Research and Taxonomy. Systematics Association Special Volumes. 61-84pp. https://doi.org/10.1201/9781420008562.ch5
• Graham M, Kennedy J, Hand C (2000) A Comparison of Set-Based and Graph-BasedVisualisations of Overlapping Classification Hierarchies. Proceedings of the WorkingConference on Advanced Visual Interfaces 2000. ACM Press, Palermo, Italy, 41-50 pp.https://doi.org/10.1145/345513.345243
• Graham M, Kennedy J (2007) Visual exploration of alternative taxonomies throughconcepts. Ecological Informatics 2 (3): 248‑261. https://doi.org/10.1016/j.ecoinf.2007.07.004
• Graham M, Craig P, Kennedy J (2008) Visualisation to Aid Biodiversity Studies throughAccurate Taxonomic Reconciliation. In: A. Gray KJaJS (Ed.) Lecture Notes in ComputerScience. vol. 5071. Proc. of British National Conference on Database Systems: SharingData, Information and Knowledge, Cardiff, United Kingdom, 280-291 pp. https://doi.org/10.1007/978-3-540-70504-8_29
• Graham M, Kennedy J (2010) A Survey of Multiple Tree Visualisation. InformationVisualization 9 (4): 235‑252. https://doi.org/10.1057/ivs.2009.29
• Lin C, Wang J (2013) Taxonomic Tree Tool. http://ttt.biodinfo.org/. Accessed on:2017-8-30.
• Munzner T, Guimbretière F, Tasiran S, Zhang L, Zhou Y (2003) TreeJuxtaposer:Scalable Tree Comparison using Focus+Context with Guaranteed Visibility. ACMTransactions on Graphics 22 (3): 453-462. https://doi.org/10.1145/882262.882291
• Sancho-Chavarria L, Beck F, Mata-Montero E, Weiskopf D (2016) Visual Comparison ofBiological Taxonomies: A Task Characterization. Poster session presented at EuroVis2016.
16 Sancho-Chavarria L et al