Tools for Visualization and Labeling
32
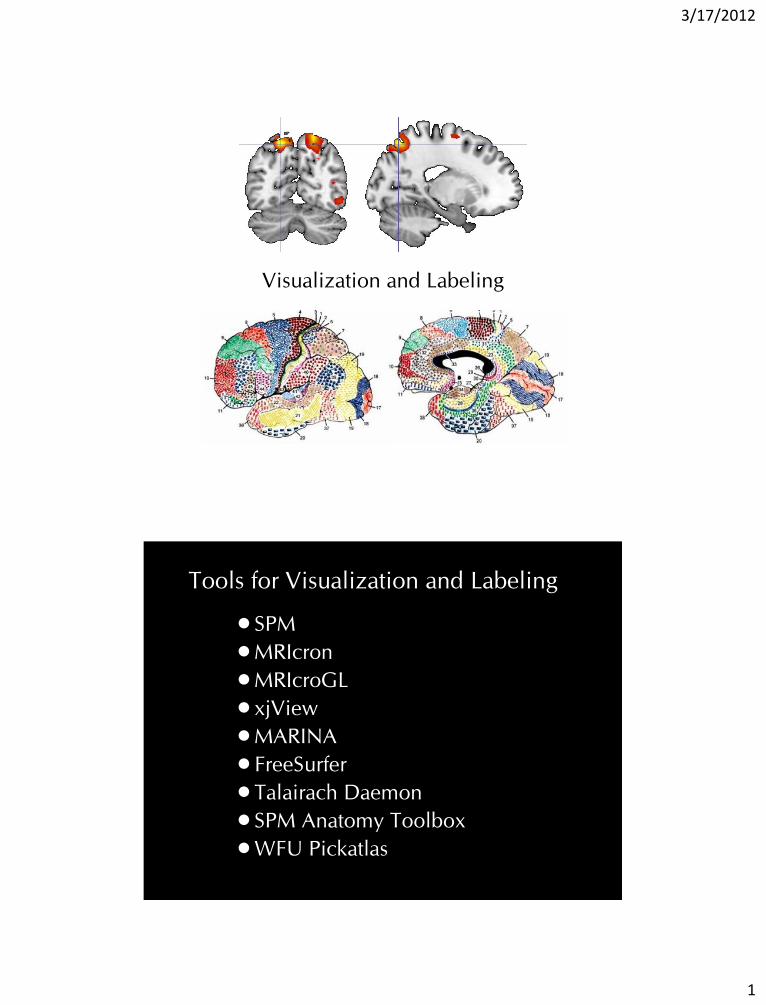
3/17/2012 1 Visualization and Labeling • SPM • MRIcron • MRIcroGL • xjView • MARINA • FreeSurfer • Talairach Daemon • SPM Anatomy Toolbox • WFU Pickatlas Tools for Visualization and Labeling
Transcript of Tools for Visualization and Labeling
3/17/2012
1
Visualization and Labeling
•SPM
•MRIcron
•MRIcroGL
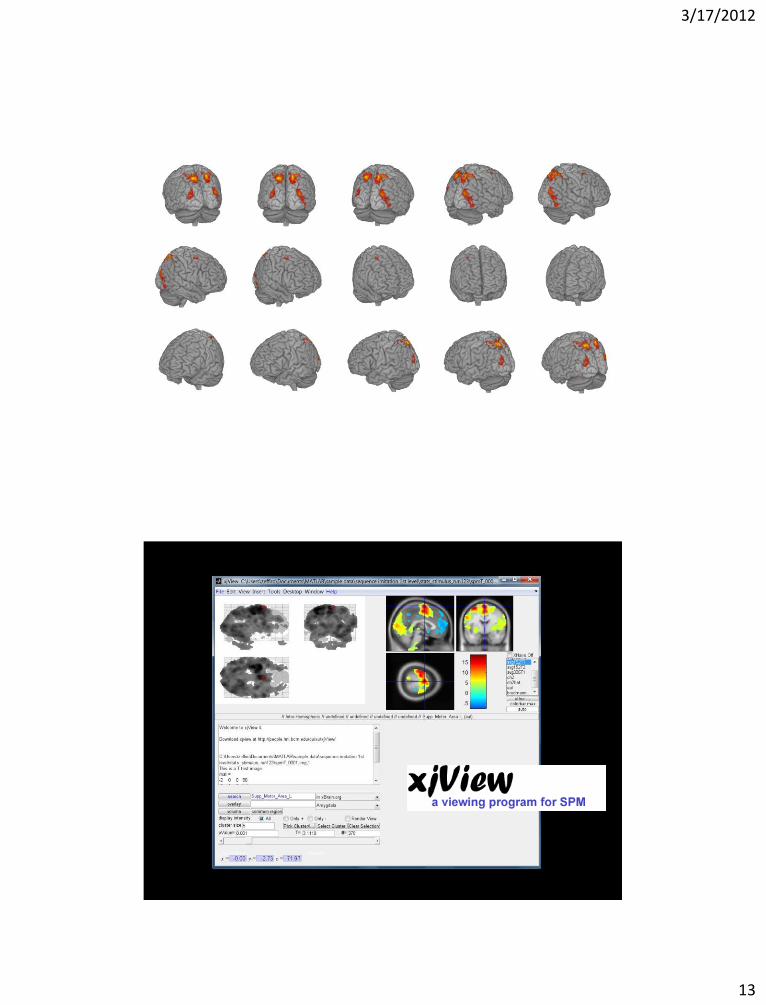
•xjView
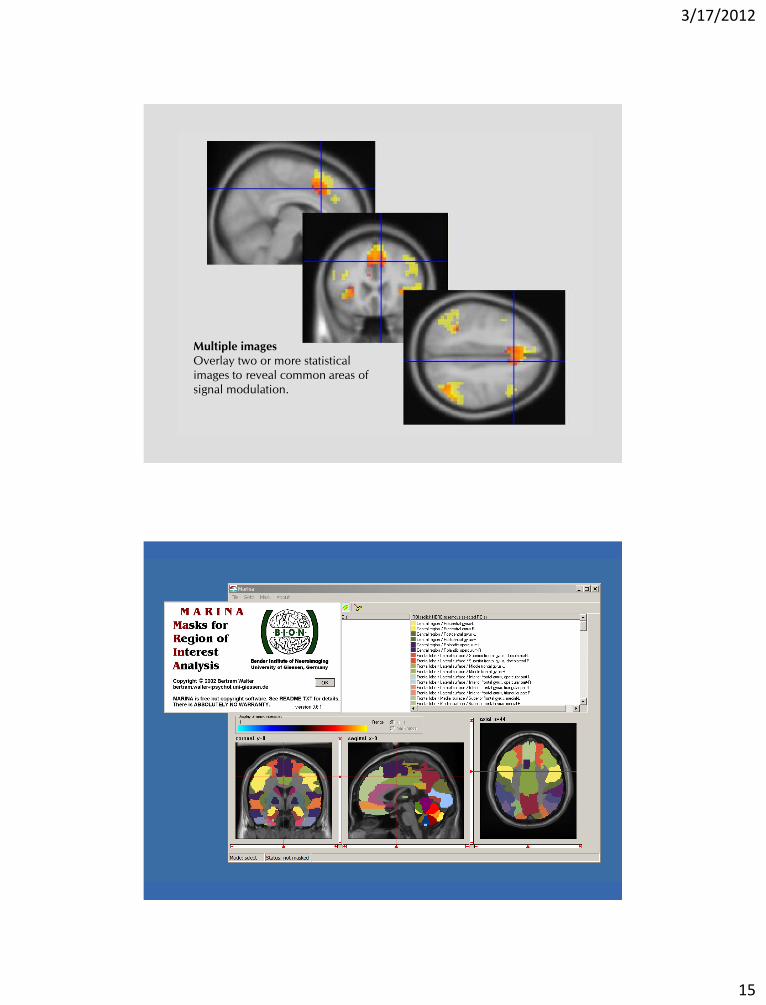
•MARINA
•FreeSurfer
•Talairach Daemon
•SPM Anatomy Toolbox
•WFU Pickatlas
Tools for Visualization and Labeling
3/17/2012
2
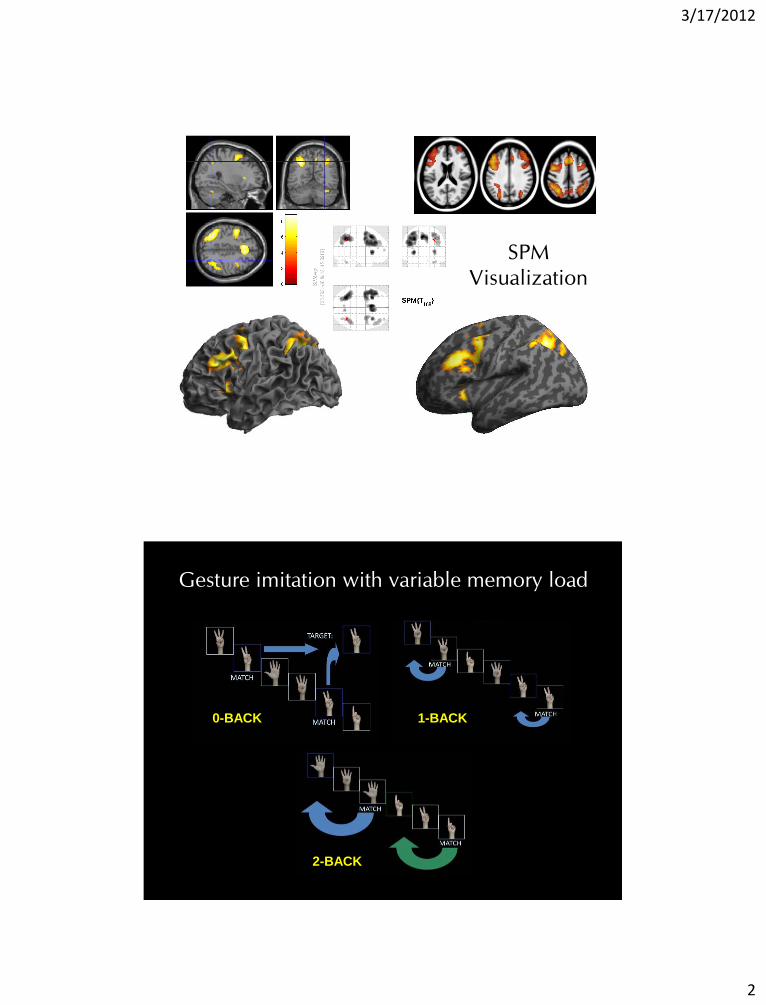
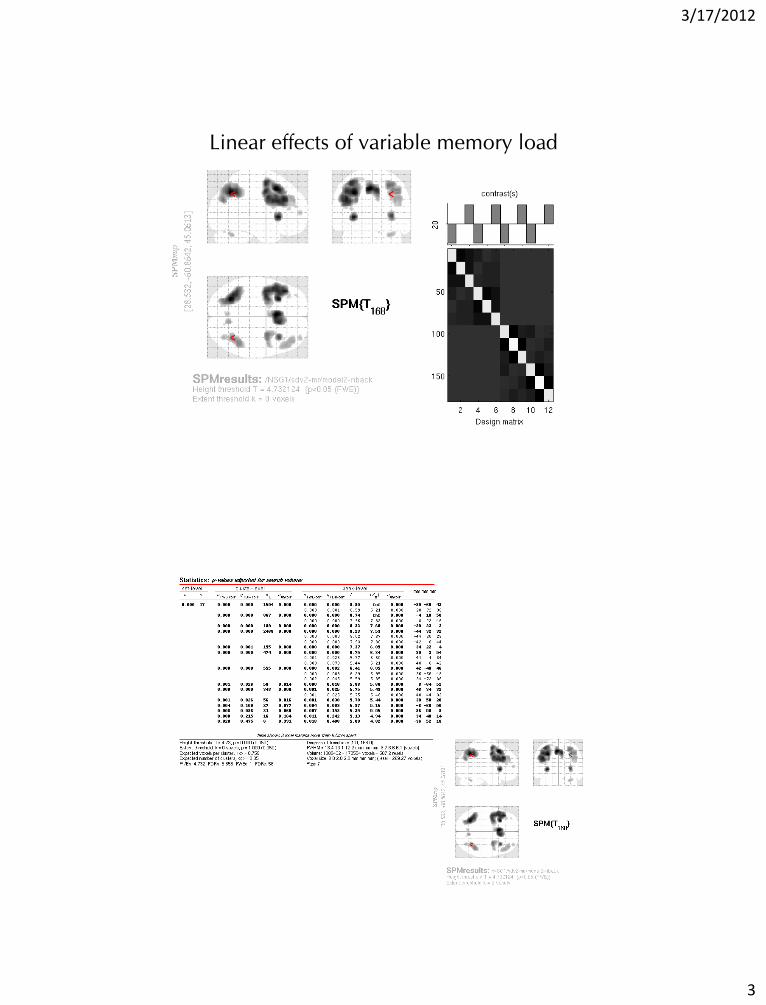
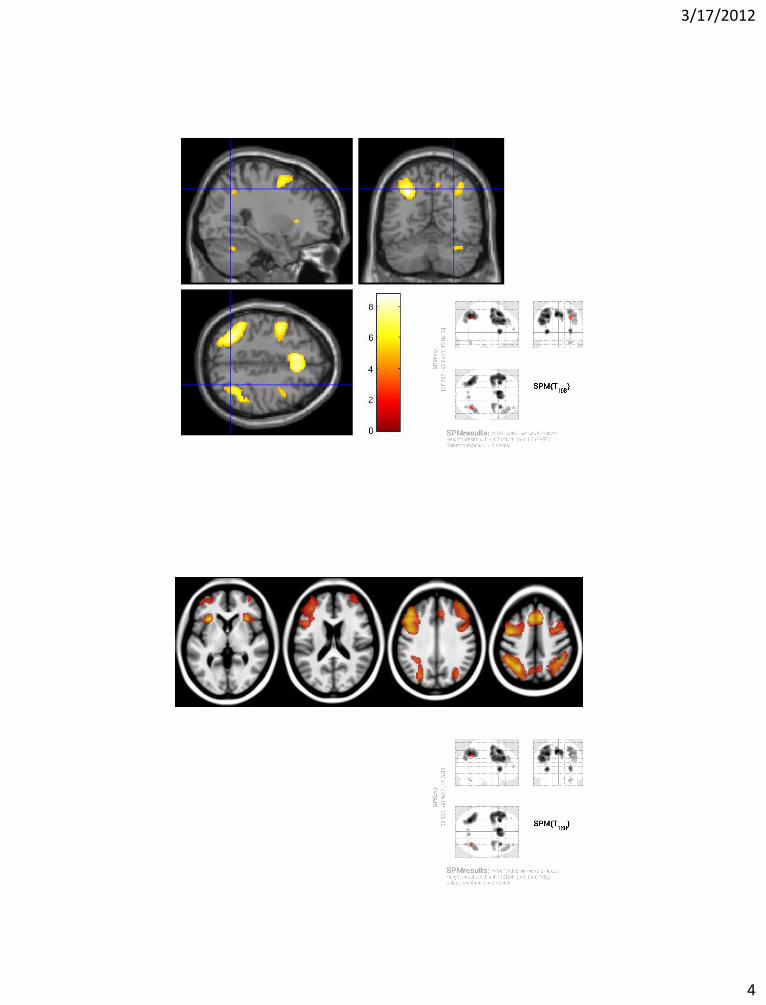
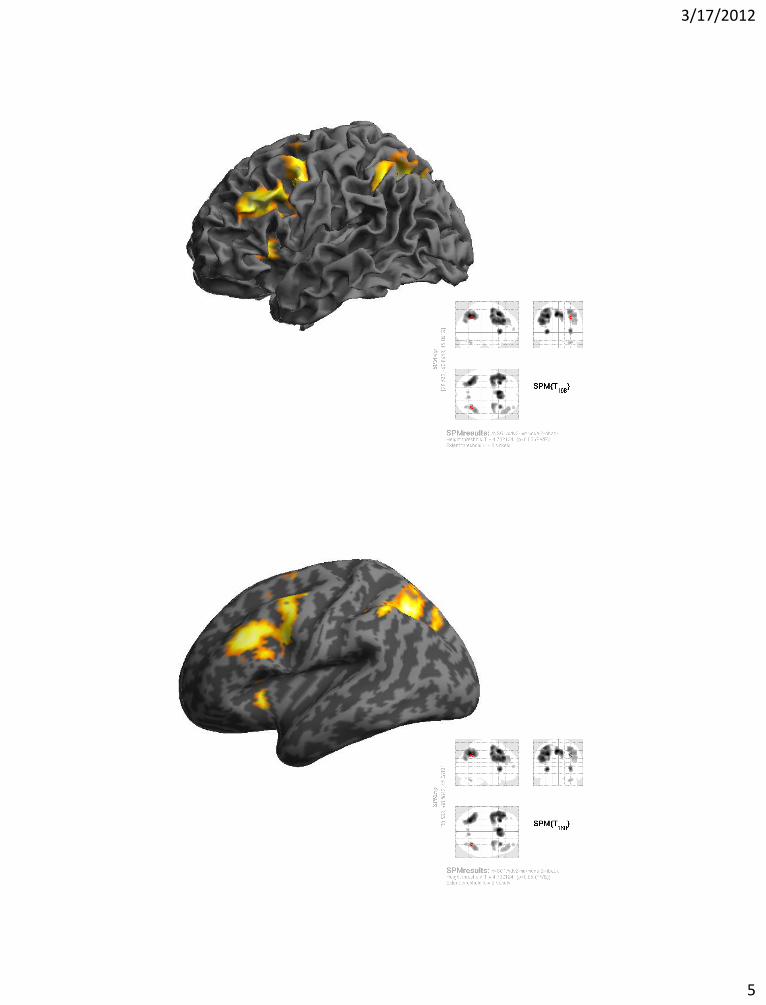
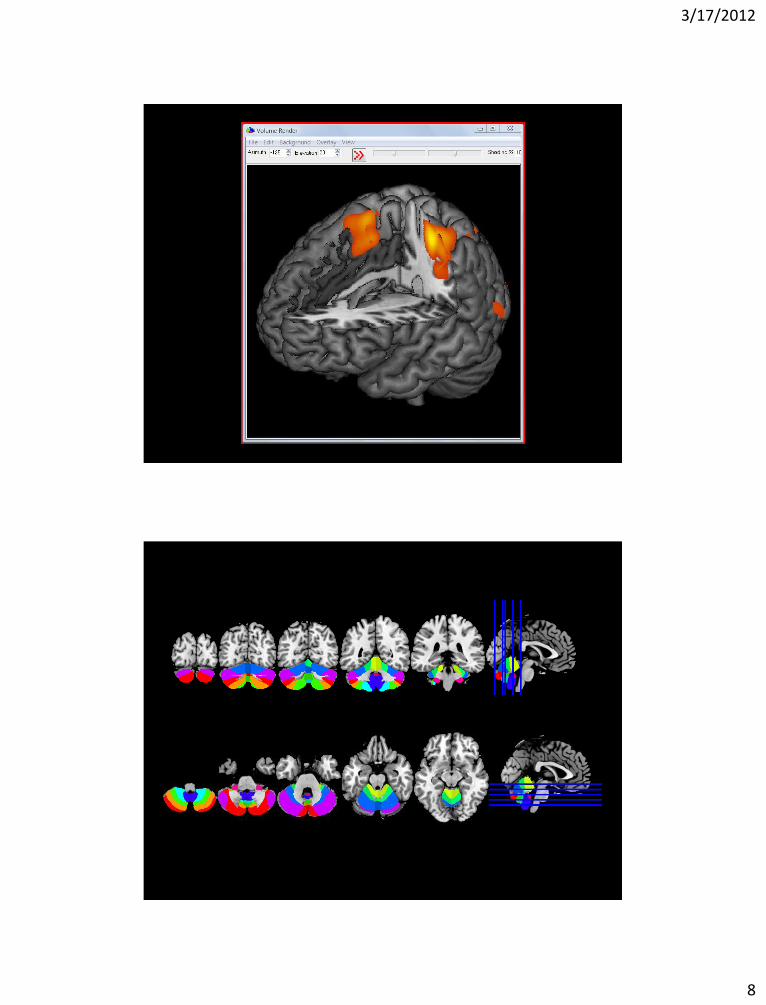
SPM
Visualization
0-BACK 1-BACK
2-BACK
Gesture imitation with variable memory load
3/17/2012
3
Linear effects of variable memory load
3/17/2012
4
3/17/2012
5

3/17/2012
6
3/17/2012
7
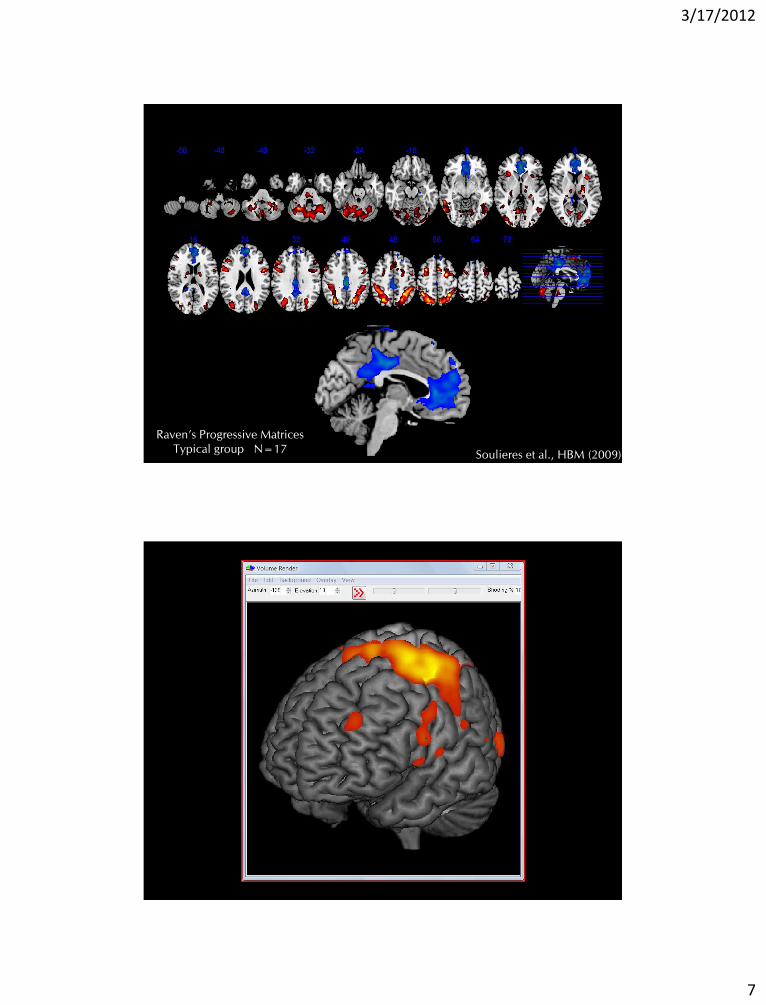
Raven’s Progressive Matrices
Typical group N=17 Soulières et al., HBM (2009)
3/17/2012
8
3/17/2012
9
3/17/2012
10
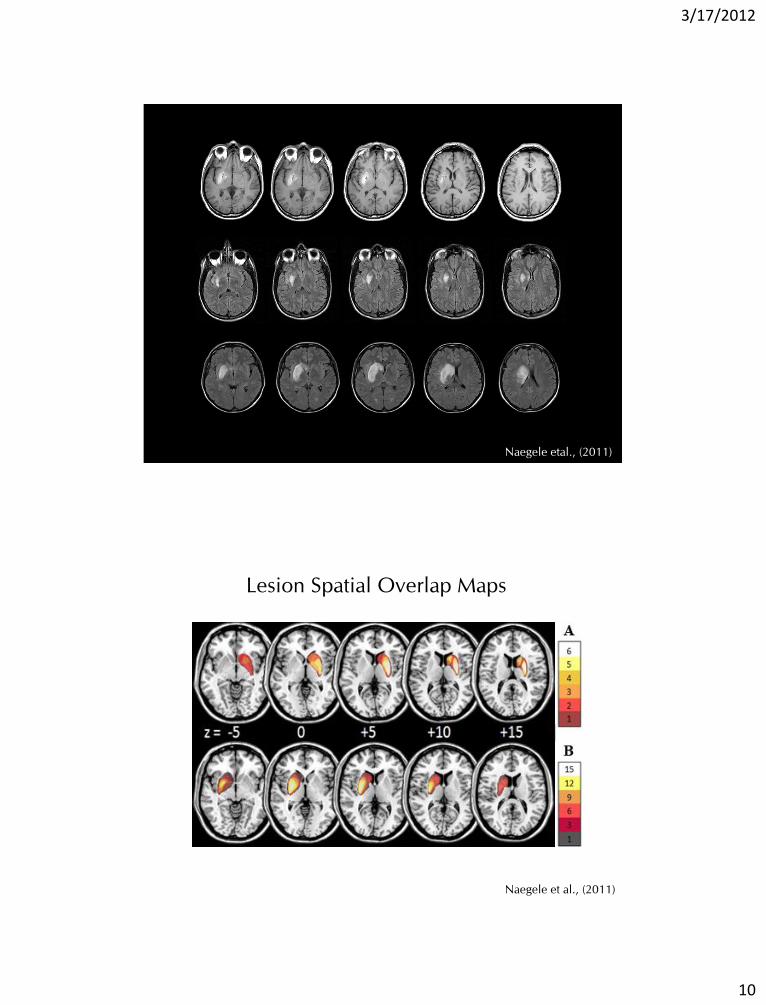
Naegele etal., (2011)
Naegele et al., (2011)
Lesion Spatial Overlap Maps
3/17/2012
11
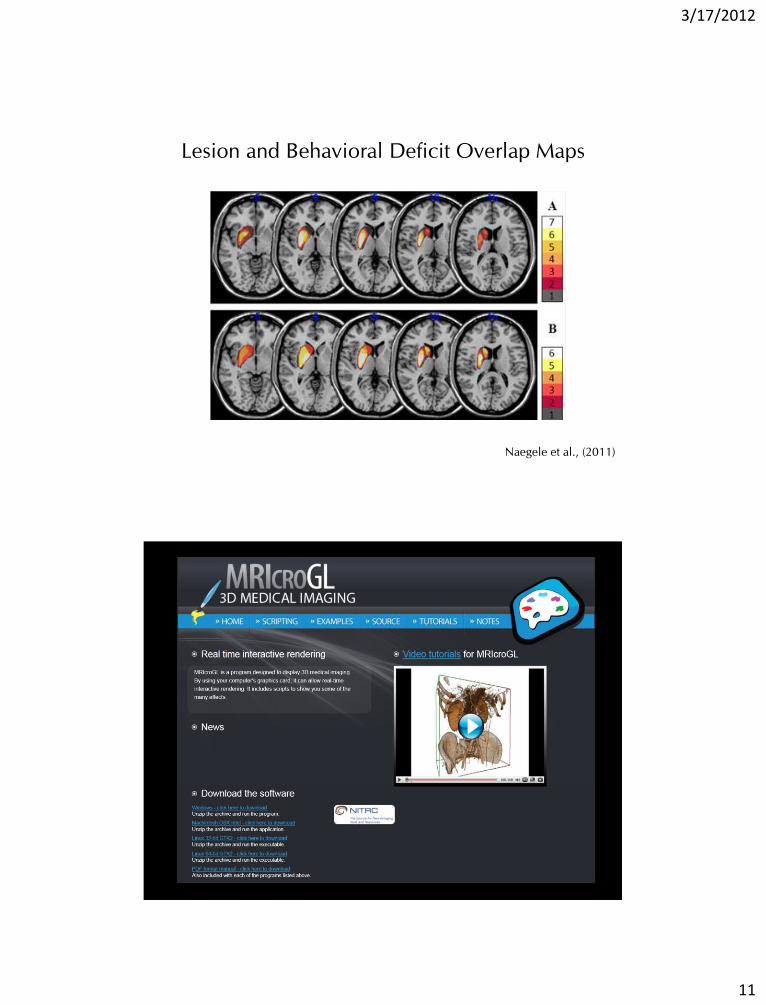
Naegele et al., (2011)
Lesion and Behavioral Deficit Overlap Maps
3/17/2012
12
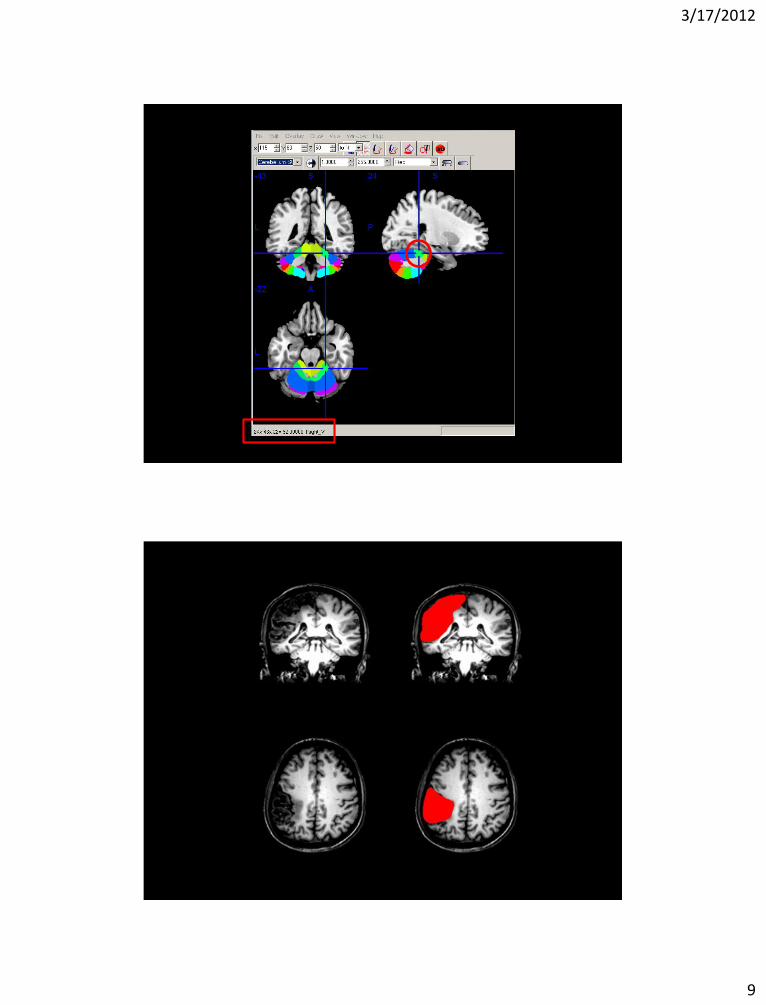
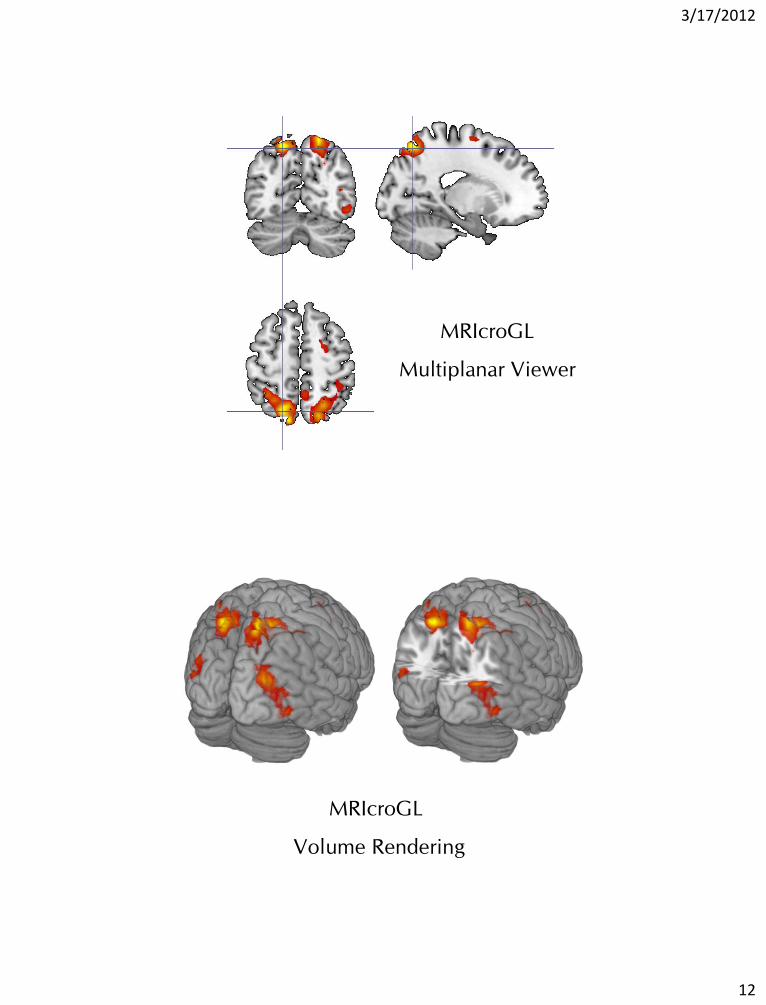
MRIcroGL
Multiplanar Viewer
MRIcroGL
Volume Rendering
3/17/2012
13
3/17/2012
14
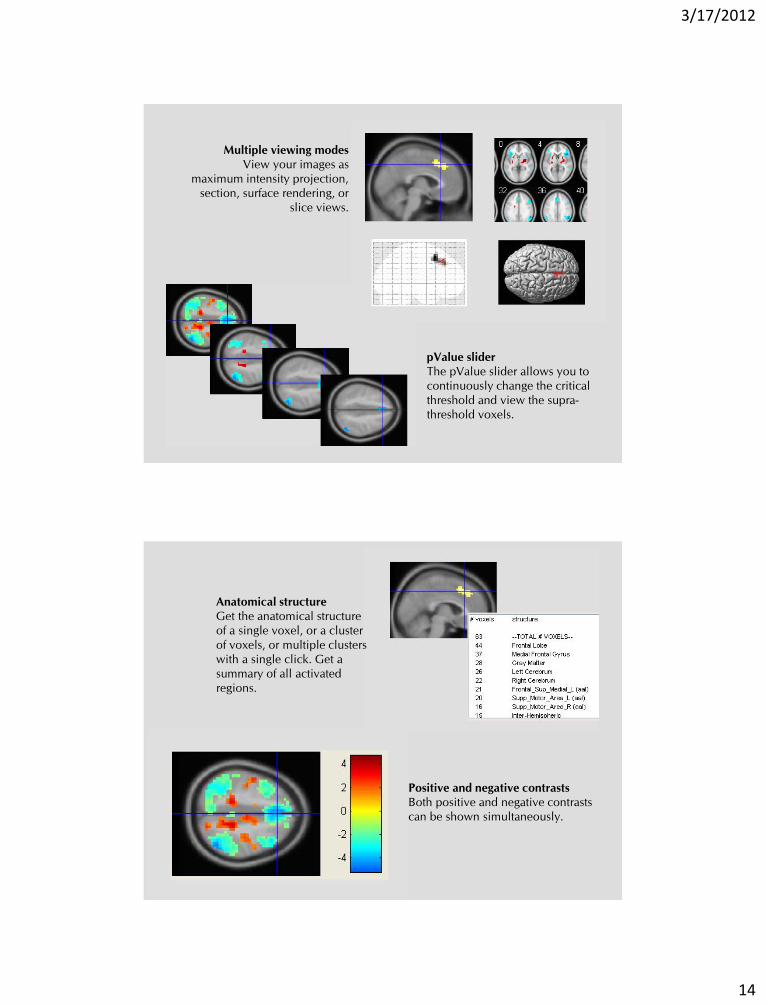
Multiple viewing modes
View your images as
maximum intensity projection,
section, surface rendering, or
slice views.
pValue slider
The pValue slider allows you to
continuously change the critical
threshold and view the supra-
threshold voxels.
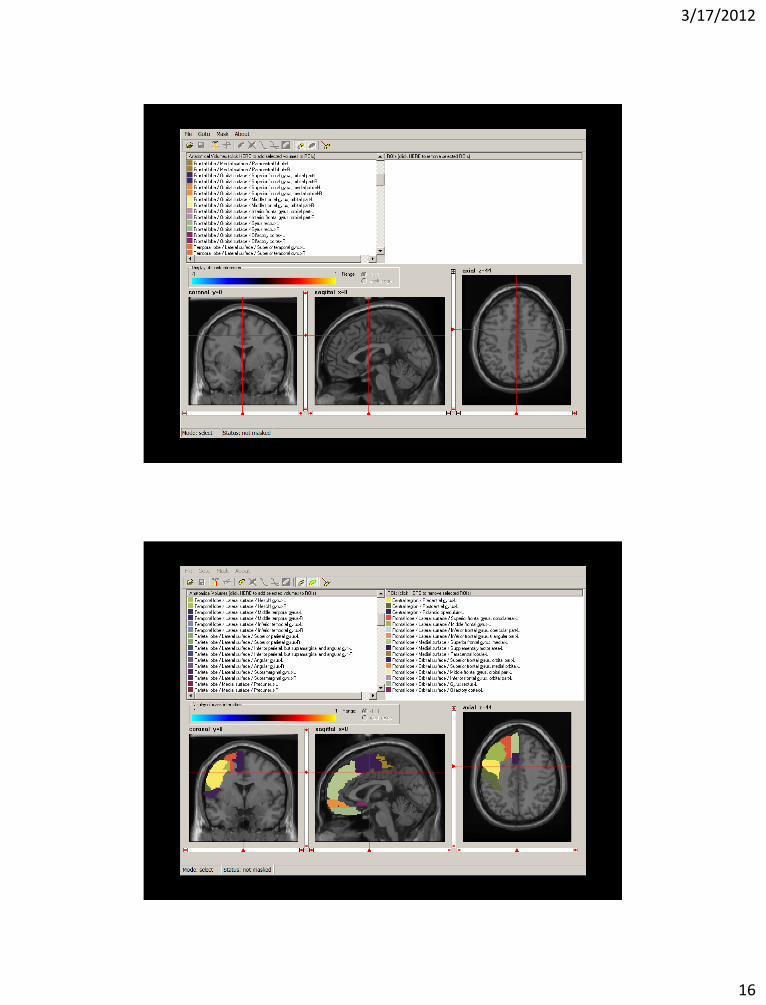
Anatomical structure
Get the anatomical structure
of a single voxel, or a cluster
of voxels, or multiple clusters
with a single click. Get a
summary of all activated
regions.
Positive and negative contrasts
Both positive and negative contrasts
can be shown simultaneously.
3/17/2012
15
Multiple images
Overlay two or more statistical
images to reveal common areas of
signal modulation.
3/17/2012
16
3/17/2012
17
3/17/2012
18
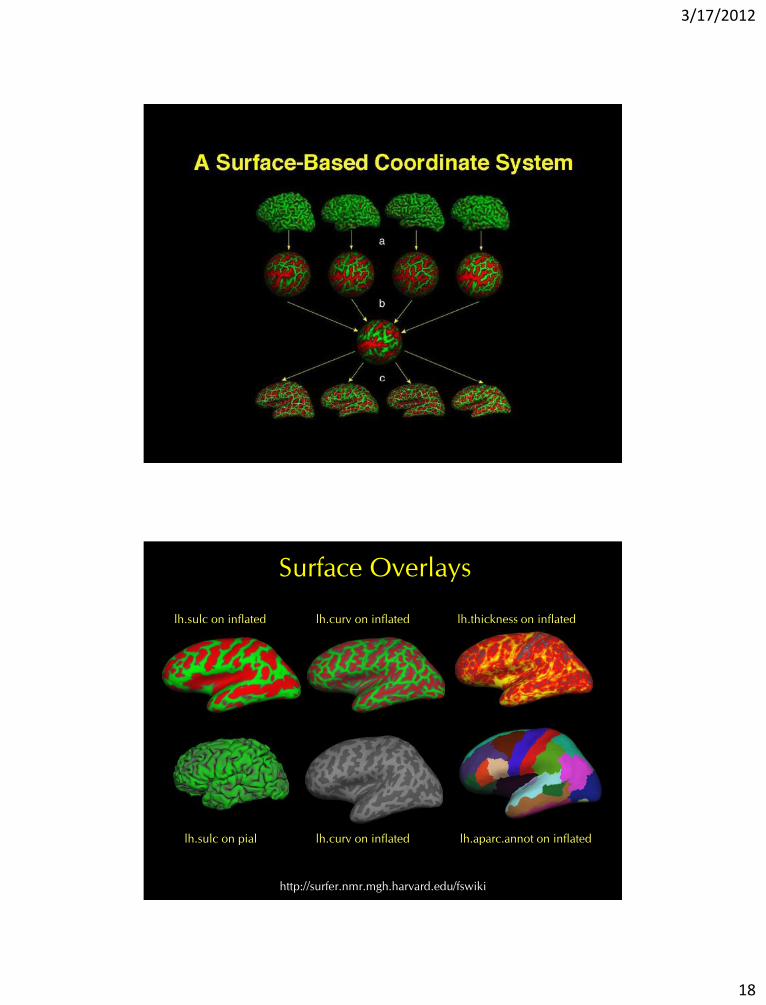
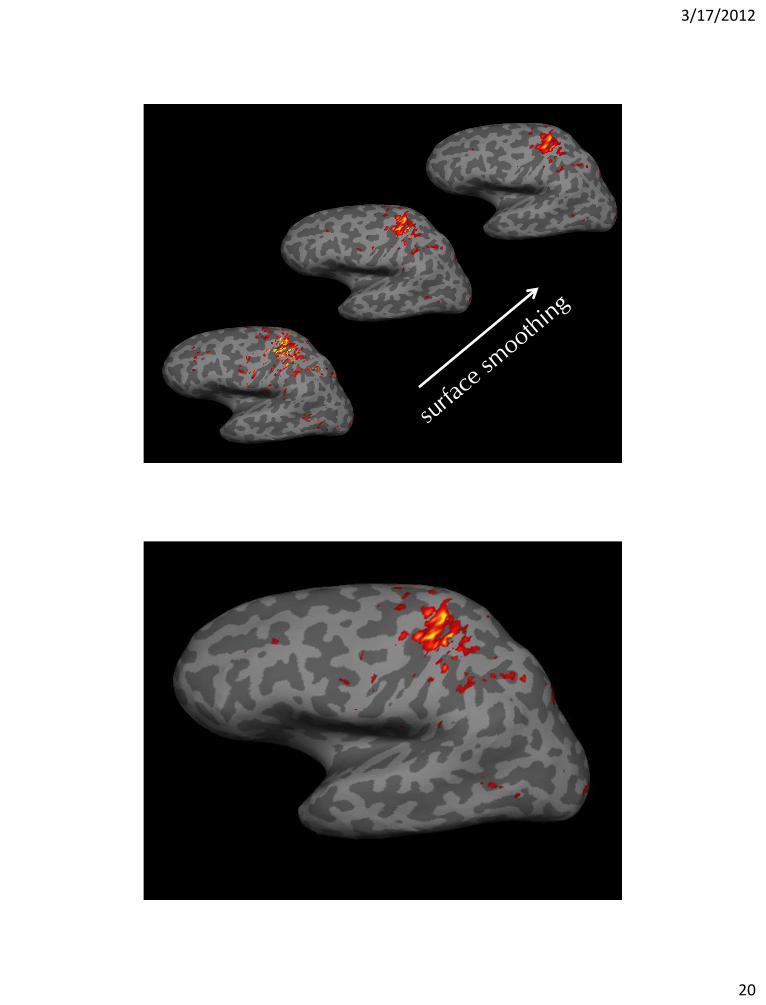
Surface Overlays
lh.sulc on inflated lh.curv on inflated lh.thickness on inflated
lh.sulc on pial lh.aparc.annot on inflated lh.curv on inflated
http://surfer.nmr.mgh.harvard.edu/fswiki
3/17/2012
19
3/17/2012
20
3/17/2012
21
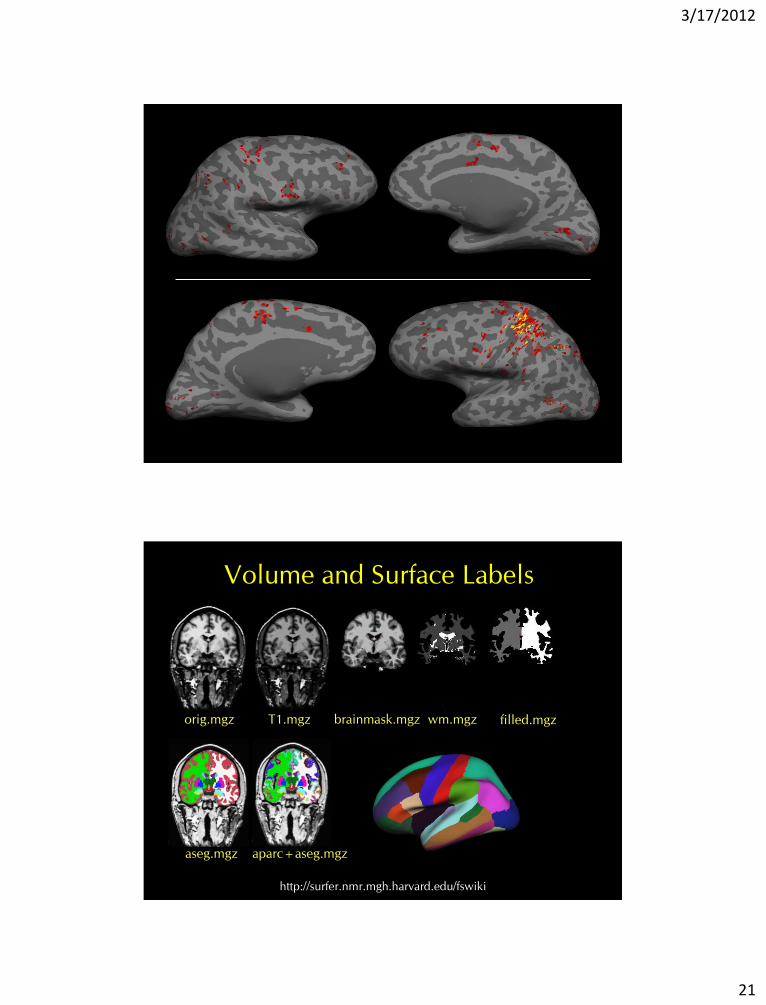
Volume and Surface Labels
orig.mgz
aseg.mgz
T1.mgz brainmask.mgz wm.mgz filled.mgz
aparc+aseg.mgz
http://surfer.nmr.mgh.harvard.edu/fswiki
3/17/2012
22
3/17/2012
23
The Talairach software, generally known as the
Talairach Daemon, includes three components:
Talairach Client: a Java application for finding
individual and batch labels as well as command-line
tools for accessing the daemon.
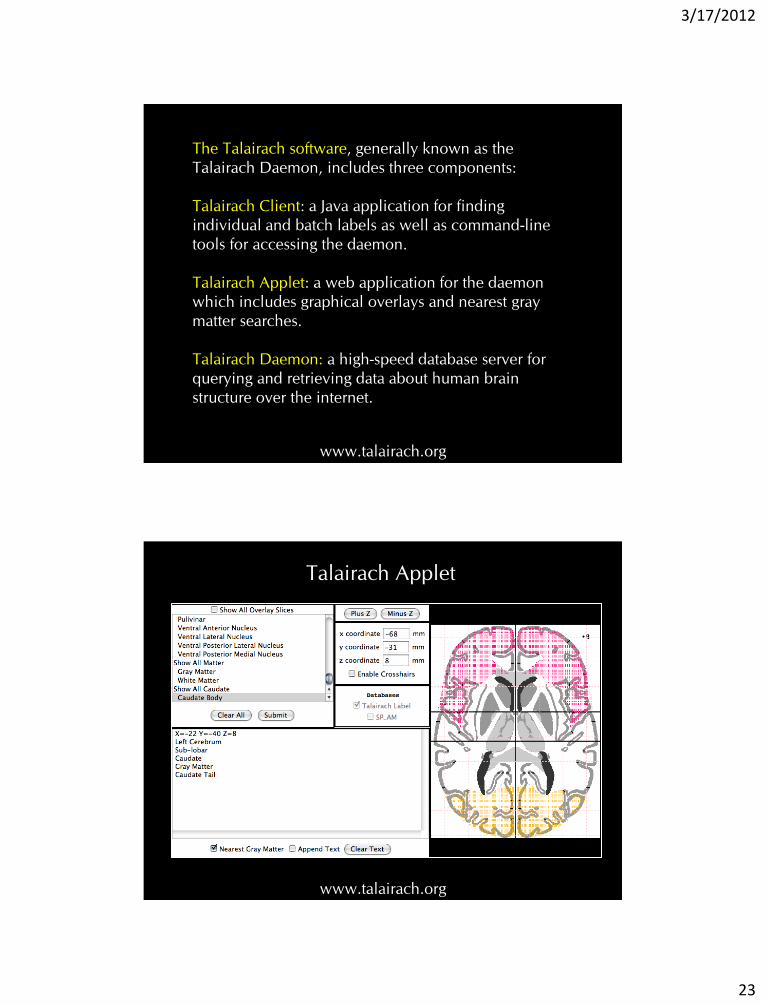
Talairach Applet: a web application for the daemon
which includes graphical overlays and nearest gray
matter searches.
Talairach Daemon: a high-speed database server for
querying and retrieving data about human brain
structure over the internet.
www.talairach.org
Talairach Applet
www.talairach.org
3/17/2012
24
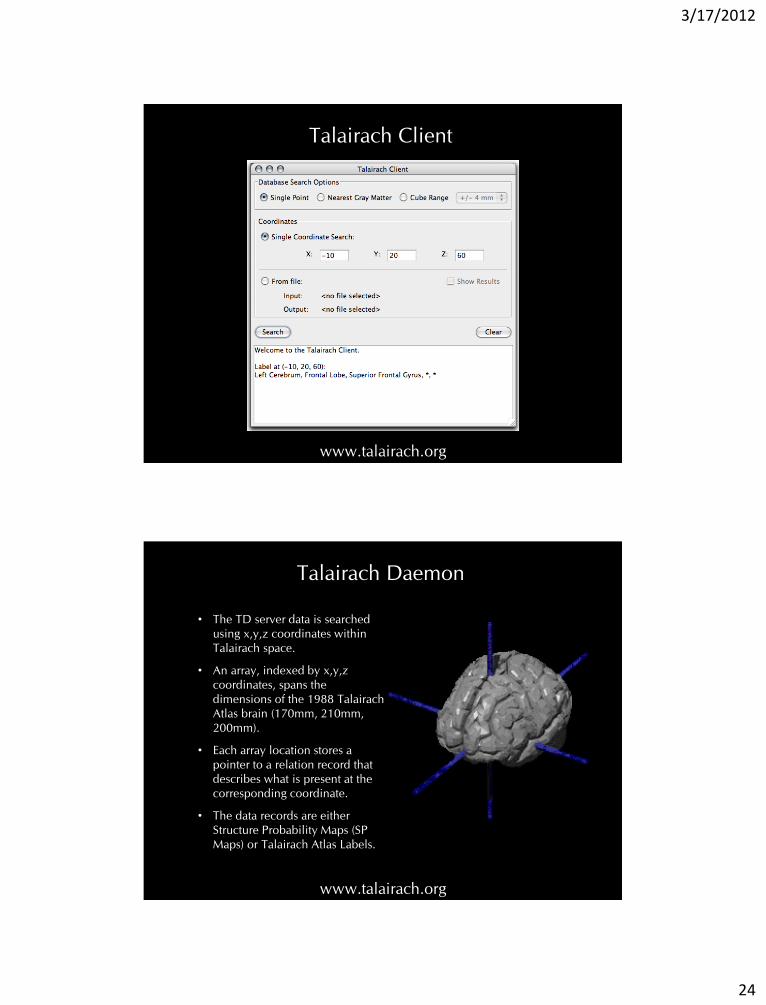
Talairach Client
www.talairach.org
Talairach Daemon
www.talairach.org
• The TD server data is searched
using x,y,z coordinates within
Talairach space.
• An array, indexed by x,y,z
coordinates, spans the
dimensions of the 1988 Talairach
Atlas brain (170mm, 210mm,
200mm).
• Each array location stores a
pointer to a relation record that
describes what is present at the
corresponding coordinate.
• The data records are either
Structure Probability Maps (SP
Maps) or Talairach Atlas Labels.
3/17/2012
25
SPM Anatomy Toolbox
http://www.fz-juelich.de/inm/inm-1/DE/Forschung/_docs/SPMAnantomyToolbox/SPMAnantomyToolbox_node.html/
3/17/2012
26
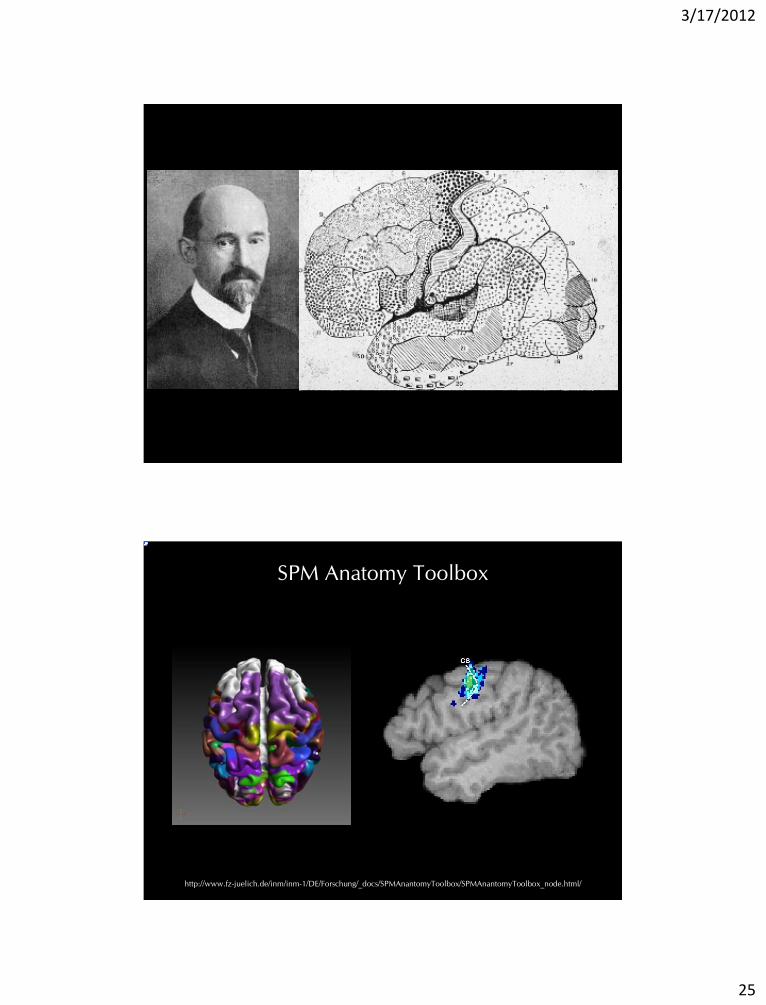
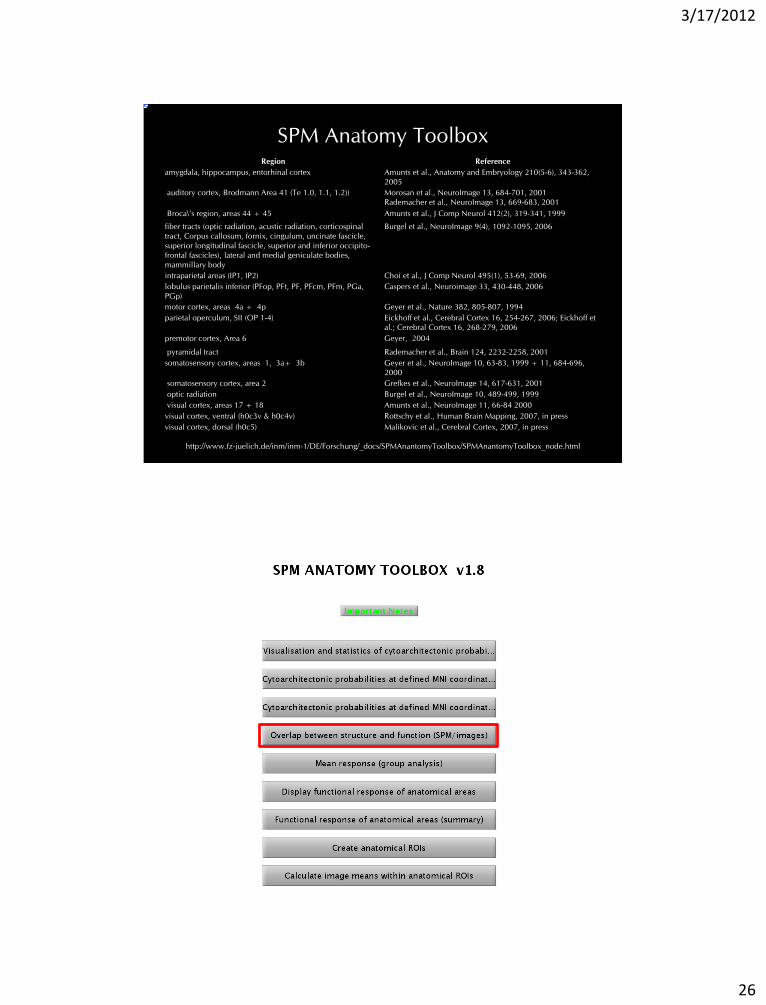
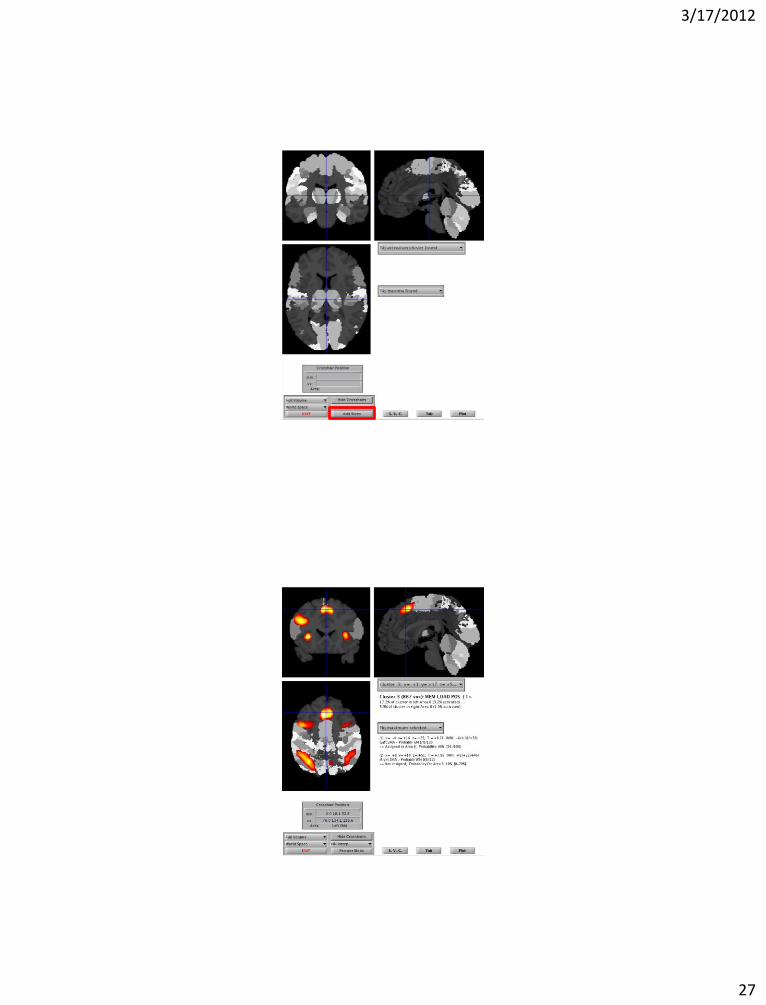
SPM Anatomy Toolbox
http://www.fz-juelich.de/inm/inm-1/DE/Forschung/_docs/SPMAnantomyToolbox/SPMAnantomyToolbox_node.html
Region Reference
amygdala, hippocampus, entorhinal cortex Amunts et al., Anatomy and Embryology 210(5-6), 343-362,
2005
auditory cortex, Brodmann Area 41 (Te 1.0, 1.1, 1.2)) Morosan et al., NeuroImage 13, 684-701, 2001
Rademacher et al., NeuroImage 13, 669-683, 2001
Broca\'s region, areas 44 + 45 Amunts et al., J Comp Neurol 412(2), 319-341, 1999
fiber tracts (optic radiation, acustic radiation, corticospinal
tract, Corpus callosum, fornix, cingulum, uncinate fascicle,
superior longitudinal fascicle, superior and inferior occipito-
frontal fascicles), lateral and medial geniculate bodies,
mammillary body
Bürgel et al., NeuroImage 9(4), 1092-1095, 2006
intraparietal areas (IP1, IP2) Choi et al., J Comp Neurol 495(1), 53-69, 2006
lobulus parietalis inferior (PFop, PFt, PF, PFcm, PFm, PGa,
PGp)
Caspers et al., Neuroimage 33, 430-448, 2006
motor cortex, areas 4a + 4p Geyer et al., Nature 382, 805-807, 1994
parietal operculum, SII (OP 1-4) Eickhoff et al., Cerebral Cortex 16, 254-267, 2006; Eickhoff et
al.; Cerebral Cortex 16, 268-279, 2006
premotor cortex, Area 6 Geyer, 2004
pyramidal tract Rademacher et al., Brain 124, 2232-2258, 2001
somatosensory cortex, areas 1, 3a+ 3b Geyer et al., NeuroImage 10, 63-83, 1999 + 11, 684-696,
2000
somatosensory cortex, area 2 Grefkes et al., NeuroImage 14, 617-631, 2001
optic radiation Bürgel et al., NeuroImage 10, 489-499, 1999
visual cortex, areas 17 + 18 Amunts et al., NeuroImage 11, 66-84 2000
visual cortex, ventral (h0c3v & h0c4v) Rottschy et al., Human Brain Mapping, 2007, in press
visual cortex, dorsal (h0c5) Malikovic et al., Cerebral Cortex, 2007, in press
3/17/2012
27
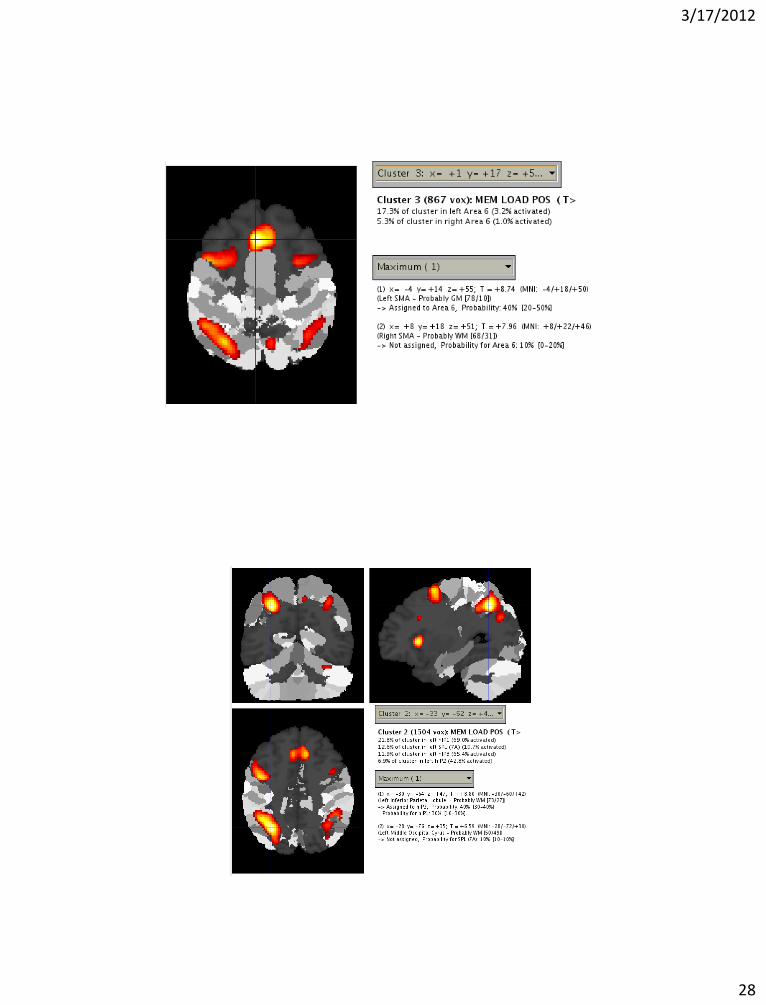
3/17/2012
28
3/17/2012
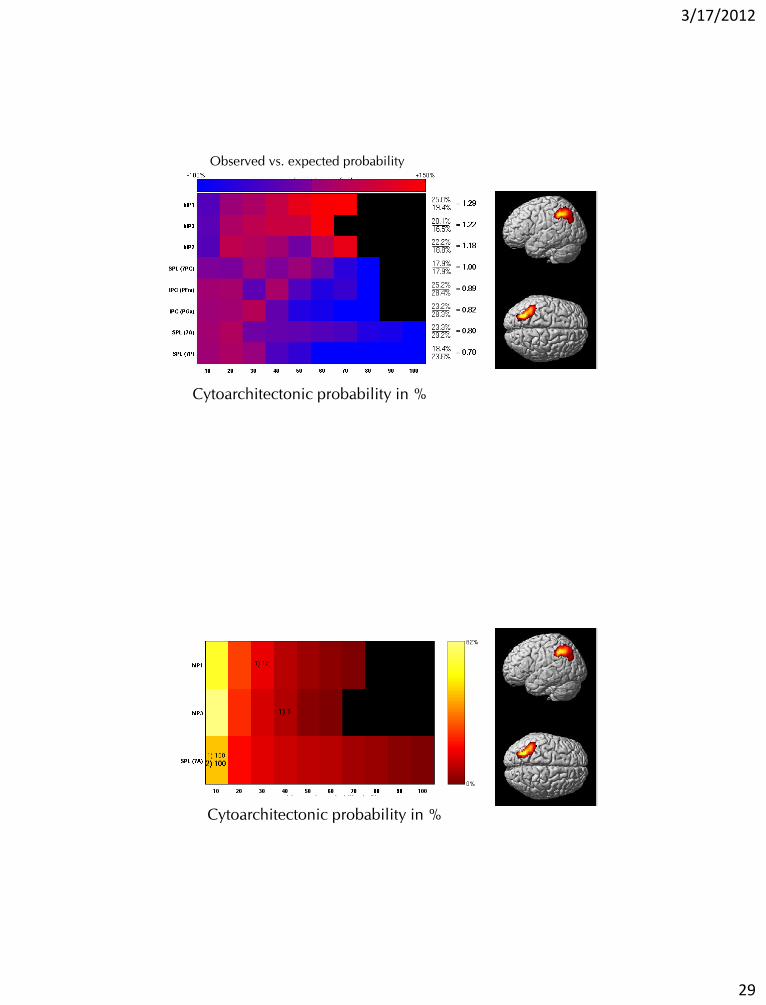
29
Cytoarchitectonic probability in %
Observed vs. expected probability
Cytoarchitectonic probability in %
3/17/2012
30
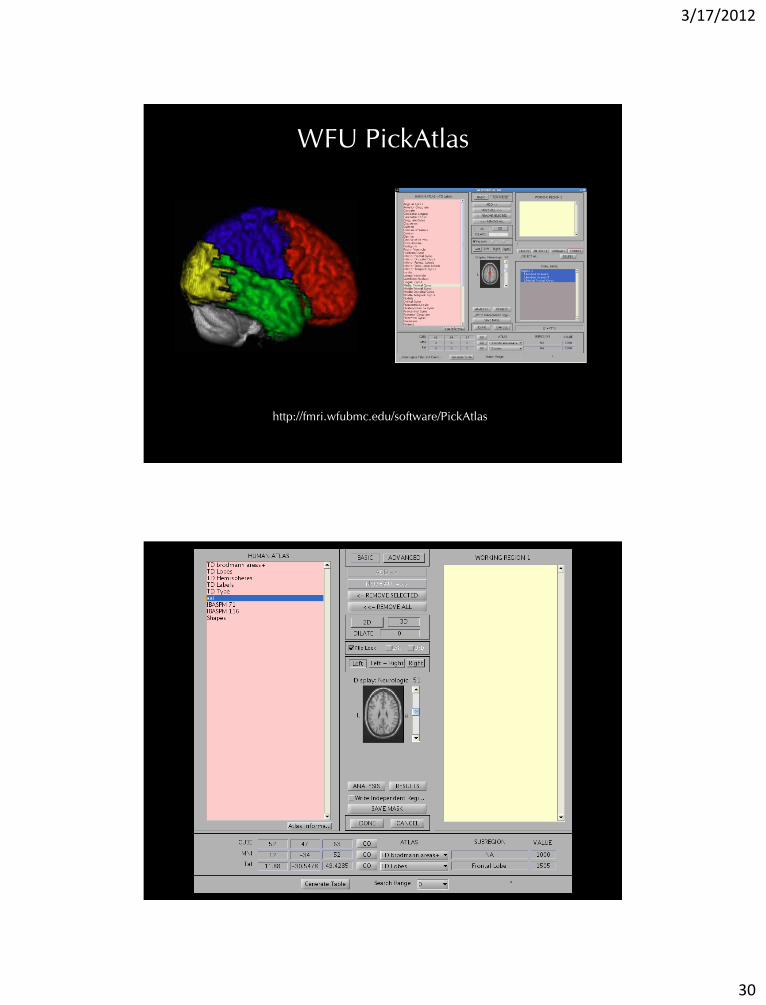
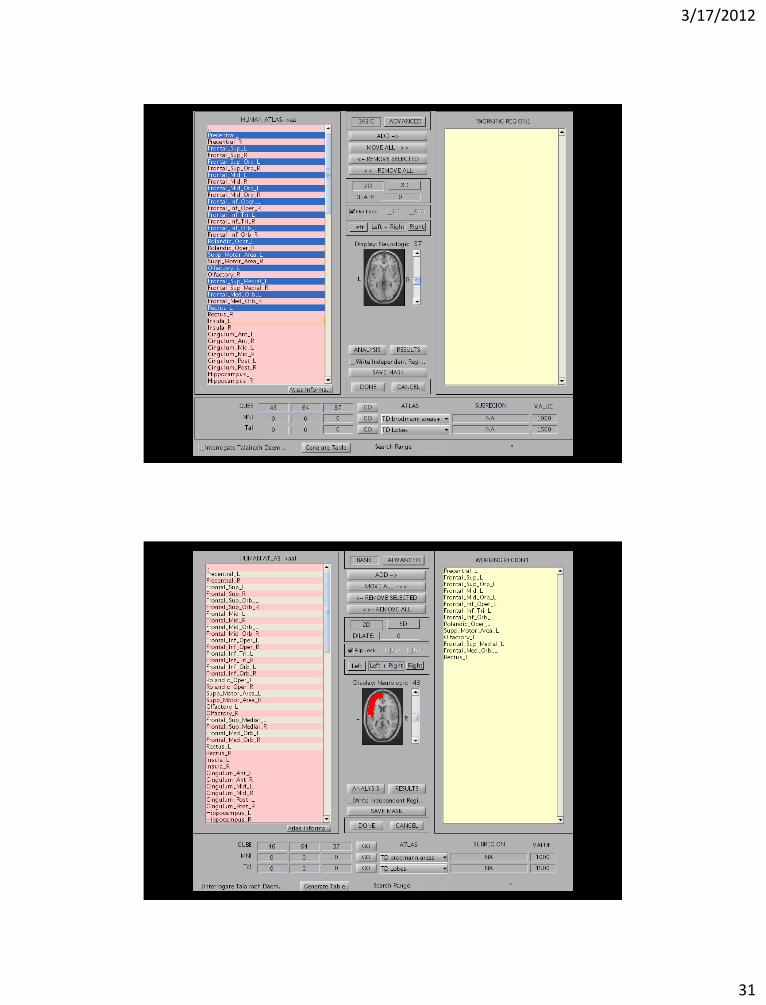
WFU PickAtlas
http://fmri.wfubmc.edu/software/PickAtlas
3/17/2012
31
3/17/2012
32
•SPM
•MRIcron
•MRIcroGL
•xjView
•MARINA
•FreeSurfer
•Talairach Daemon
•SPM Anatomy Toolbox
•WFU Pickatlas
Tools for Visualization and Labeling