TADASHI MATSUMOTO - UNECE Homepage · Compact city policies: a comparative assessment TADASHI...
29
Compact city policies: a comparative assessment TADASHI MATSUMOTO Organisation for Economic Co-operation and Development (OECD) Presentation at the UNECE-OECD seminar September 26, 2012, Geneva
Transcript of TADASHI MATSUMOTO - UNECE Homepage · Compact city policies: a comparative assessment TADASHI...
Compact city policies: a comparative assessment
TADASHI MATSUMOTO
Organisation for Economic Co-operation and Development
(OECD)
Presentation at the UNECE-OECD seminar
September 26, 2012, Geneva
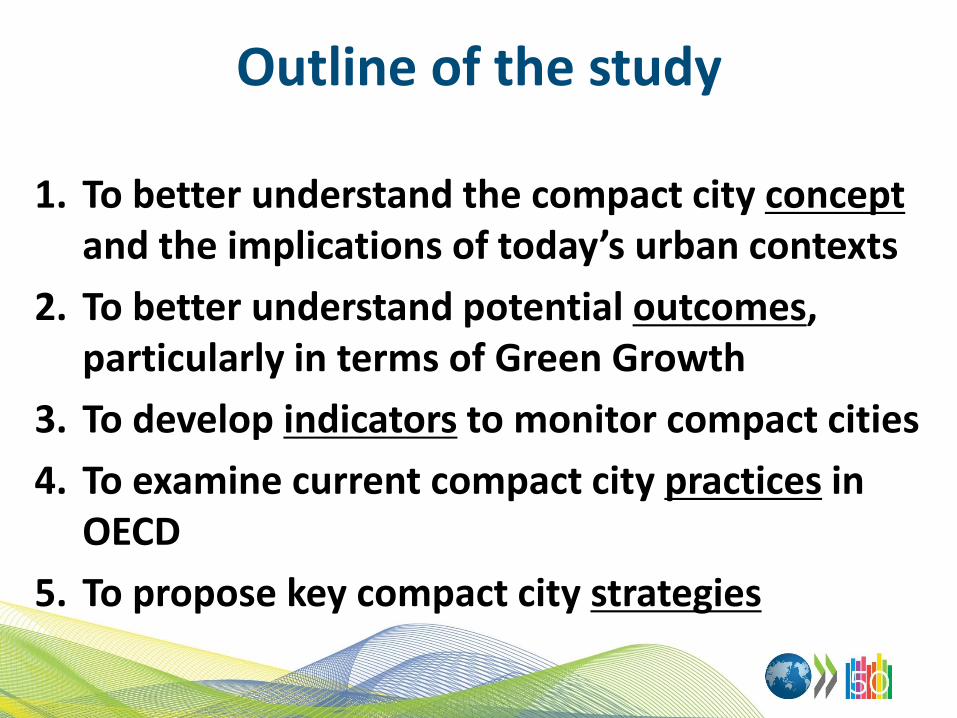
Outline of the study
1. To better understand the compact city concept and the implications of today’s urban contexts
2. To better understand potential outcomes, particularly in terms of Green Growth
3. To develop indicators to monitor compact cities
4. To examine current compact city practices in OECD
5. To propose key compact city strategies
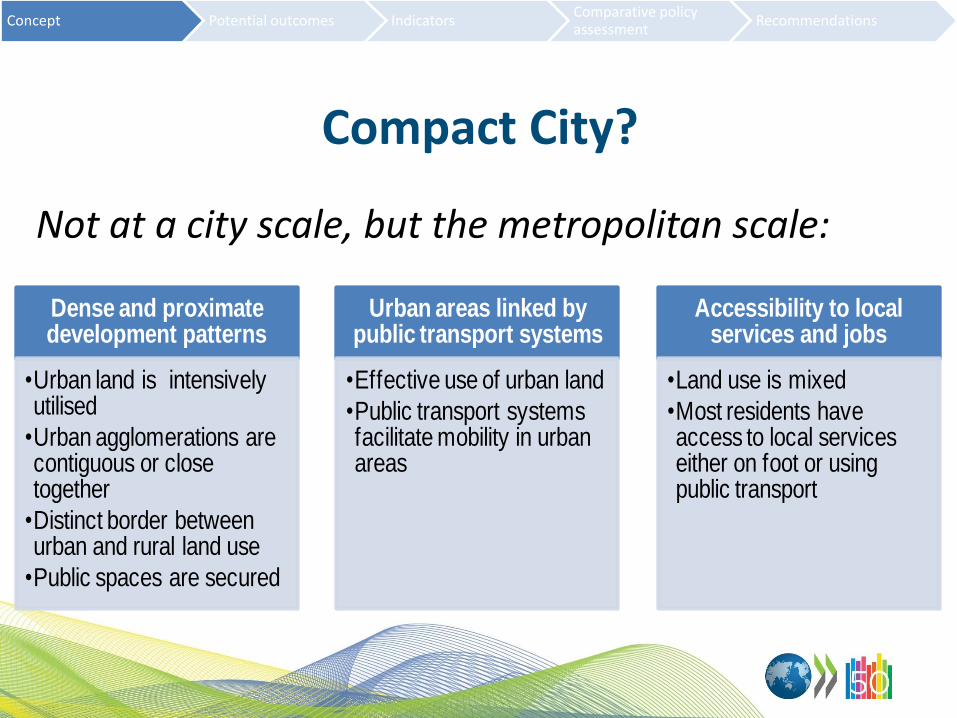
Compact City?
Not at a city scale, but the metropolitan scale:
Dense and proximate development patterns
•Urban land is intensively utilised
•Urban agglomerations are contiguous or close together
•Distinct border between urban and rural land use
•Public spaces are secured
Urban areas linked by public transport systems
•Effective use of urban land
•Public transport systems facilitate mobility in urban areas
Accessibility to local services and jobs
•Land use is mixed
•Most residents have access to local services either on foot or using public transport
Concept Potential outcomes Indicators Comparative policy assessment
Recommendations
Misconception?
• Compact urban development as a component of the compact city
• Size of a compact city
• A polycentric urban structure in a compact city
• Building forms and open space in a compact city
Concept Potential outcomes Measuring the performance
Comparative policy assessment
Recommendations
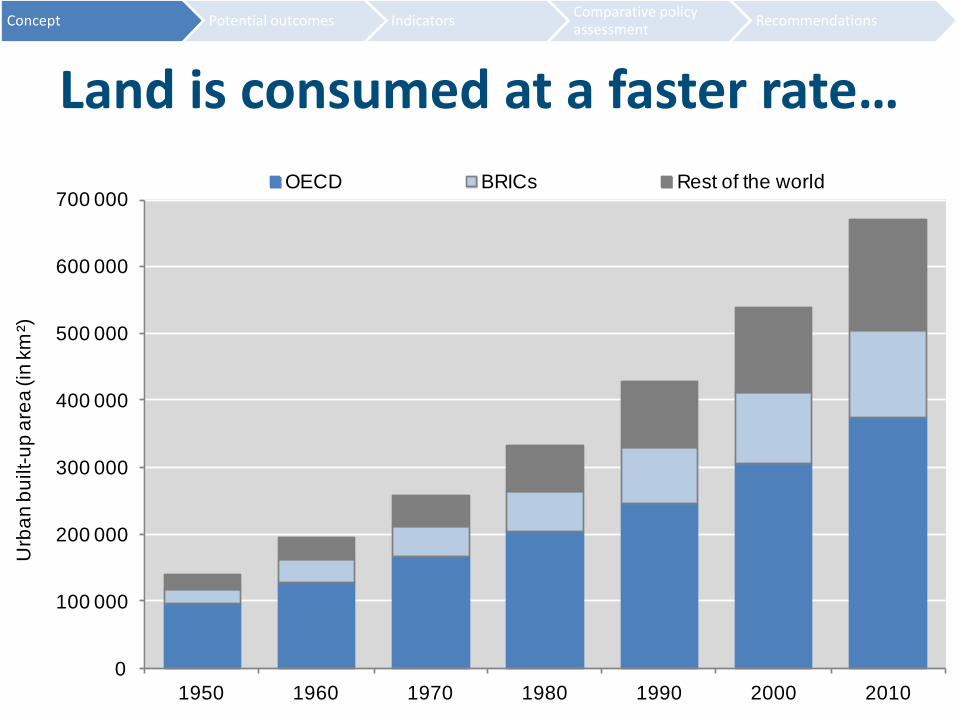
Land is consumed at a faster rate…
0
100 000
200 000
300 000
400 000
500 000
600 000
700 000
1950 1960 1970 1980 1990 2000 2010
Urb
an
bu
ilt-
up
are
a (in
km
²)
OECD BRICs Rest of the world
Concept Potential outcomes Indicators Comparative policy assessment
Recommendations
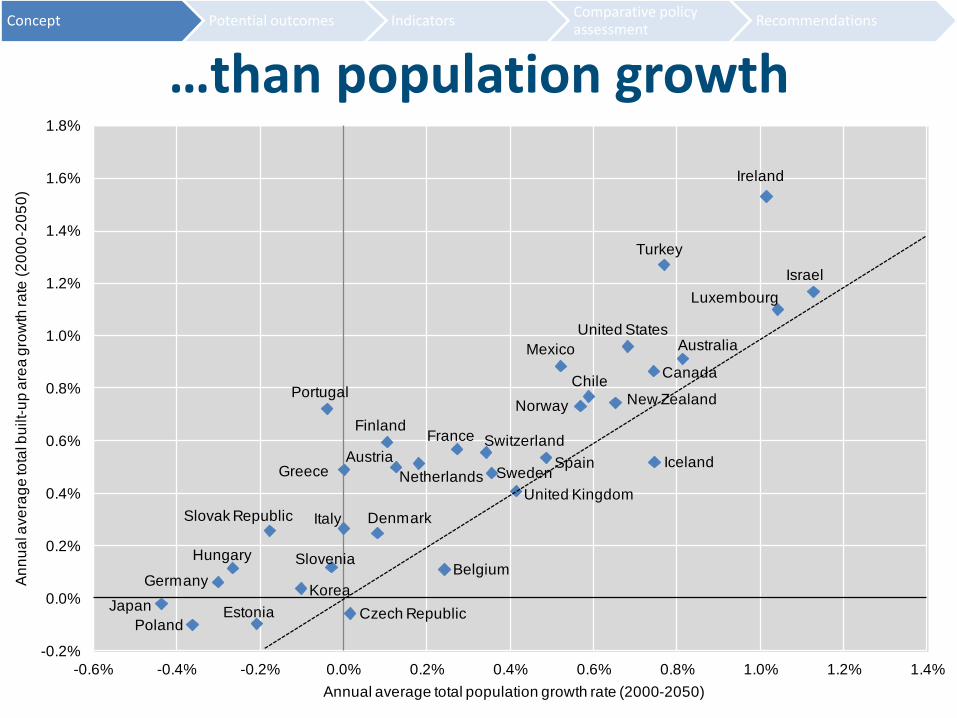
…than population growth
Australia
Austria
Belgium
CanadaChile
Czech Republic
Denmark
Estonia
FinlandFrance
Germany
Greece
Hungary
Iceland
Ireland
Israel
Italy
JapanKorea
Luxembourg
Mexico
Netherlands
New ZealandNorway
Poland
Portugal
Slovak Republic
Slovenia
SpainSweden
Switzerland
Turkey
United Kingdom
United States
-0.2%
0.0%
0.2%
0.4%
0.6%
0.8%
1.0%
1.2%
1.4%
1.6%
1.8%
-0.6% -0.4% -0.2% 0.0% 0.2% 0.4% 0.6% 0.8% 1.0% 1.2% 1.4%
An
nu
al a
ve
rag
e to
tal b
uilt-
up
are
a g
row
th ra
te (
20
00
-20
50
)
Annual average total population growth rate (2000-2050)
Concept Potential outcomes Indicators Comparative policy assessment
Recommendations

Energy price affects location choice
60
70
80
90
100
110
120
130
140
150
Re
al i
nd
ex fo
r in
du
str
y a
nd
ho
use
ho
ld
Coal Electricity (kWh) Oil Products Total energy
Concept Potential outcomes Indicators Comparative policy assessment
Recommendations
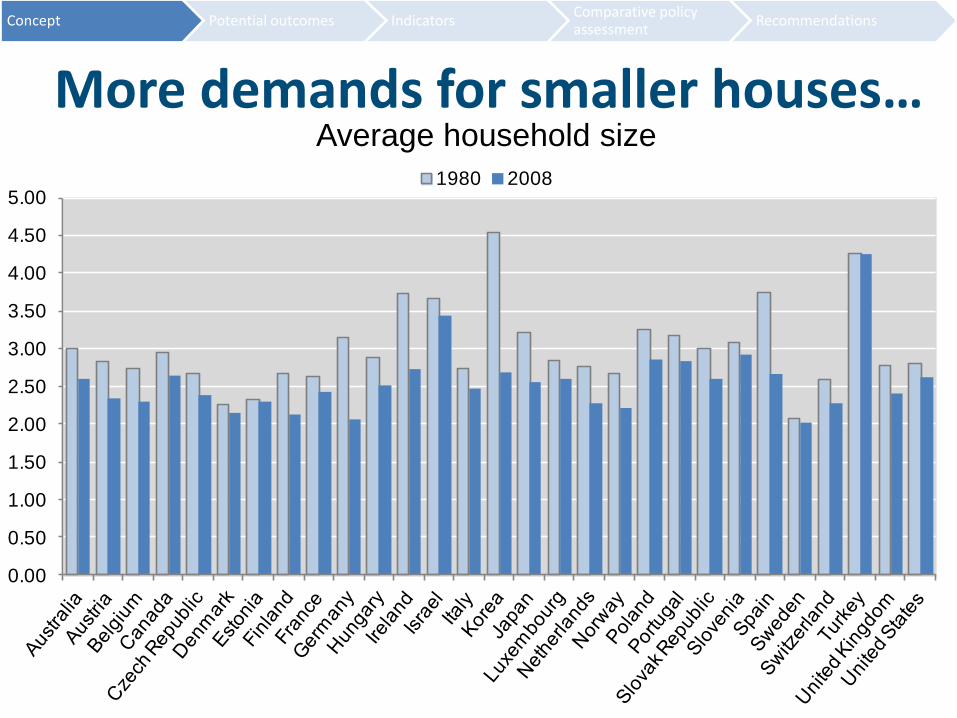
More demands for smaller houses… Average household size
0.00
0.50
1.00
1.50
2.00
2.50
3.00
3.50
4.00
4.50
5.001980 2008
Concept Potential outcomes Indicators Comparative policy assessment
Recommendations
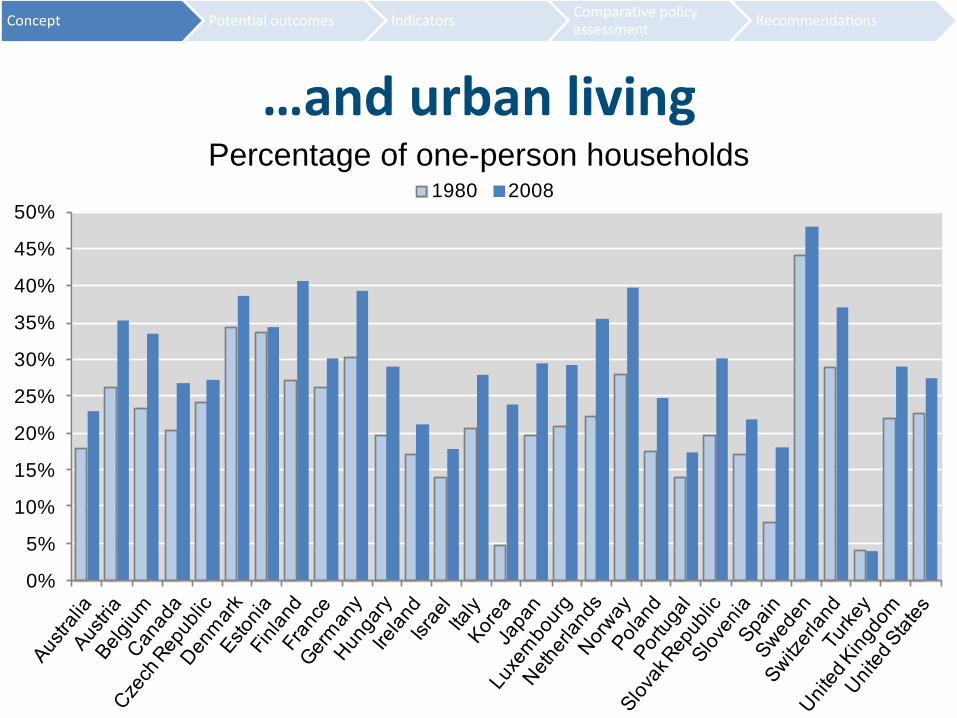
…and urban living Percentage of one-person households
0%
5%
10%
15%
20%
25%
30%
35%
40%
45%
50%1980 2008
Concept Potential outcomes Indicators Comparative policy assessment
Recommendations
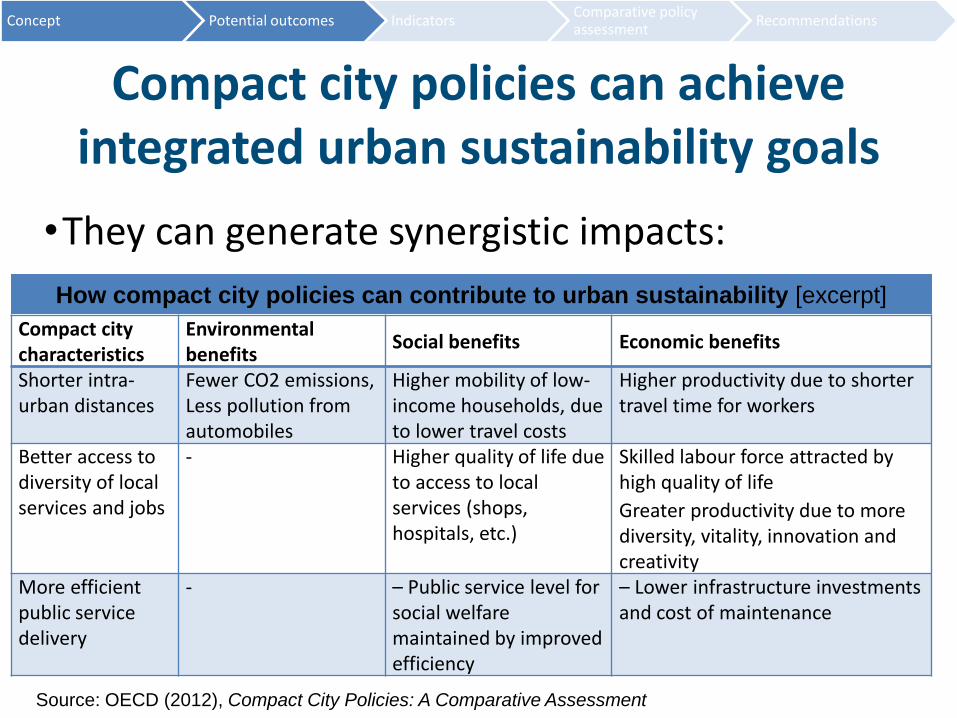
Compact city policies can achieve integrated urban sustainability goals
Compact city characteristics
Environmental benefits
Social benefits Economic benefits
Shorter intra-urban distances
Fewer CO2 emissions, Less pollution from automobiles
Higher mobility of low-income households, due to lower travel costs
Higher productivity due to shorter travel time for workers
Better access to diversity of local services and jobs
- Higher quality of life due to access to local services (shops, hospitals, etc.)
Skilled labour force attracted by high quality of life
Greater productivity due to more diversity, vitality, innovation and creativity
More efficient public service delivery
- – Public service level for social welfare maintained by improved efficiency
– Lower infrastructure investments and cost of maintenance
Source: OECD (2012), Compact City Policies: A Comparative Assessment
•They can generate synergistic impacts:
Concept Potential outcomes Indicators Comparative policy assessment
Recommendations
How compact city policies can contribute to urban sustainability [excerpt]
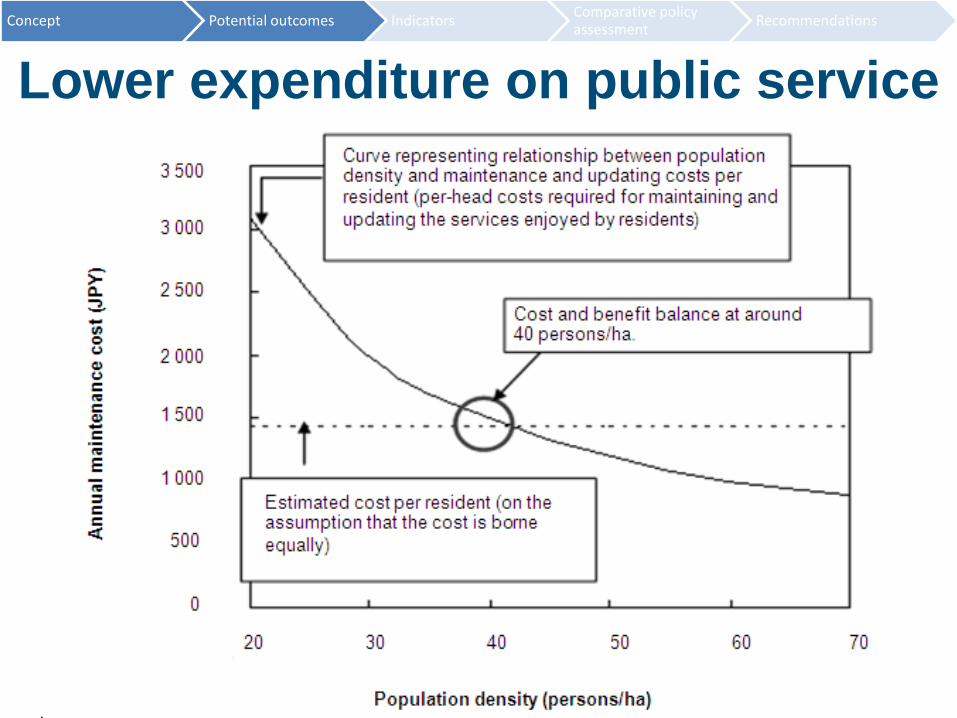
Lower expenditure on public service
Concept Potential outcomes Indicators Comparative policy assessment
Recommendations
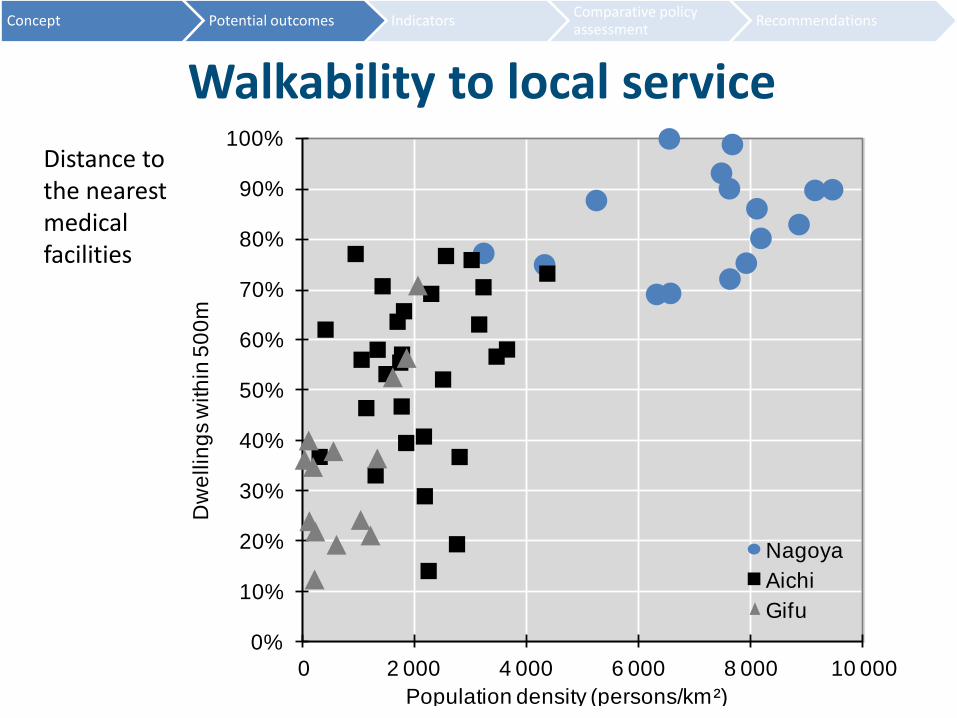
Walkability to local service
Distance to the nearest medical facilities
0%
10%
20%
30%
40%
50%
60%
70%
80%
90%
100%
0 2 000 4 000 6 000 8 000 10 000
Dw
ellin
gs w
ith
in 5
00
m
Population density (persons/km²)
Nagoya
Aichi
Gifu
Concept Potential outcomes Indicators Comparative policy assessment
Recommendations
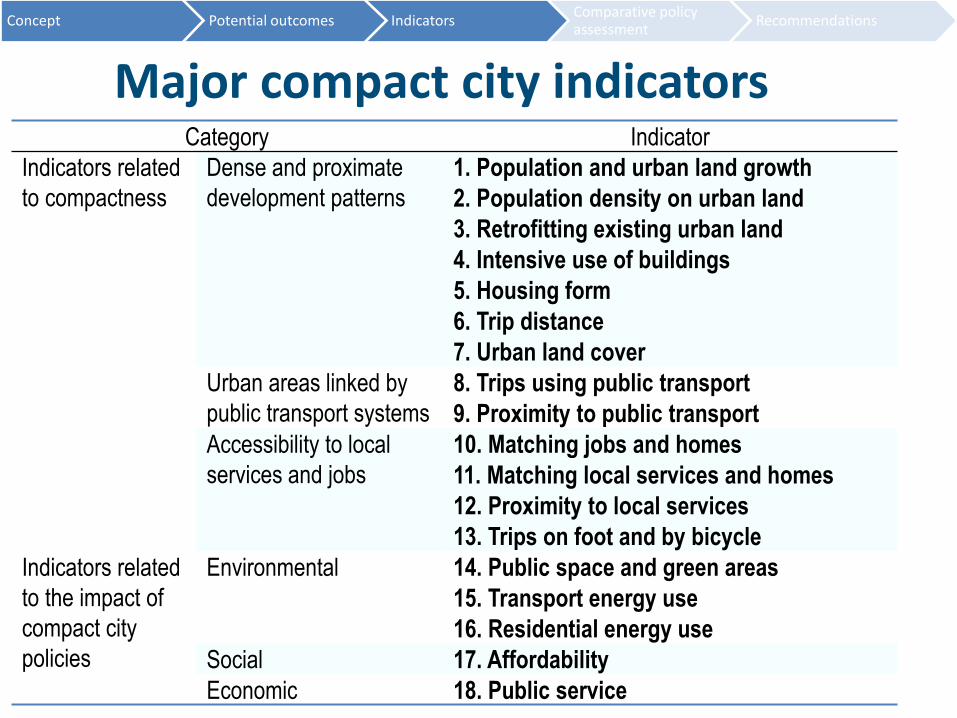
Major compact city indicators Category Indicator
Indicators related
to compactness
Dense and proximate
development patterns
1. Population and urban land growth
2. Population density on urban land
3. Retrofitting existing urban land
4. Intensive use of buildings
5. Housing form
6. Trip distance
7. Urban land cover
Urban areas linked by
public transport systems
8. Trips using public transport
9. Proximity to public transport
Accessibility to local
services and jobs
10. Matching jobs and homes
11. Matching local services and homes
12. Proximity to local services
13. Trips on foot and by bicycle
Indicators related
to the impact of
compact city
policies
Environmental 14. Public space and green areas
15. Transport energy use
16. Residential energy use
Social 17. Affordability
Economic 18. Public service
Concept Potential outcomes Indicators Comparative policy assessment
Recommendations
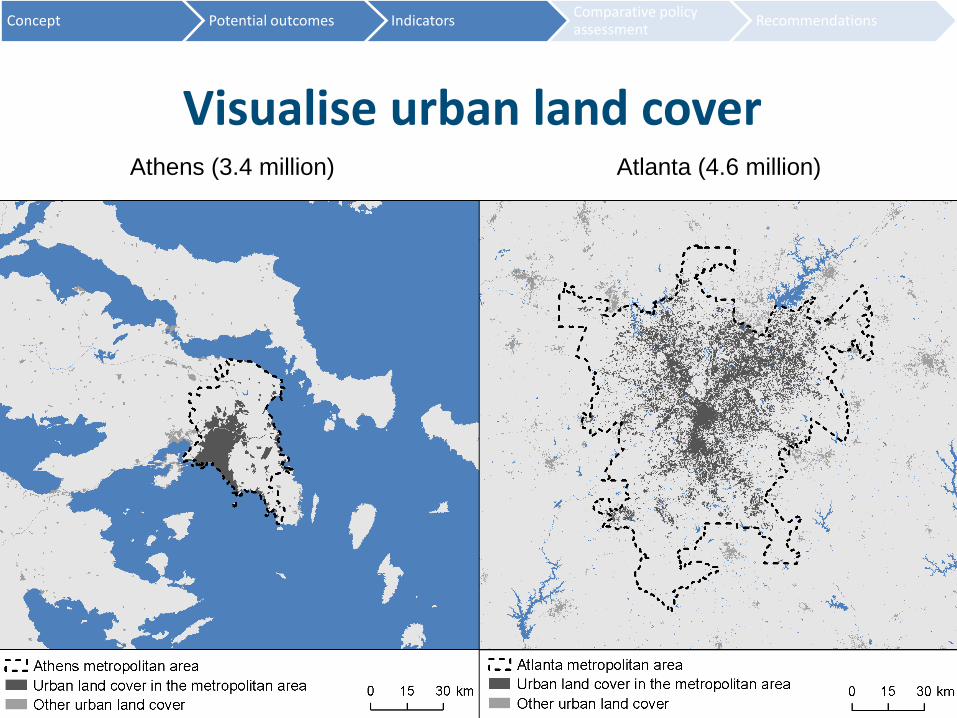
Visualise urban land cover Athens (3.4 million) Atlanta (4.6 million)
Concept Potential outcomes Indicators Comparative policy assessment
Recommendations
Concept Potential outcomes Indicators Comparative policy assessment
Recommendations
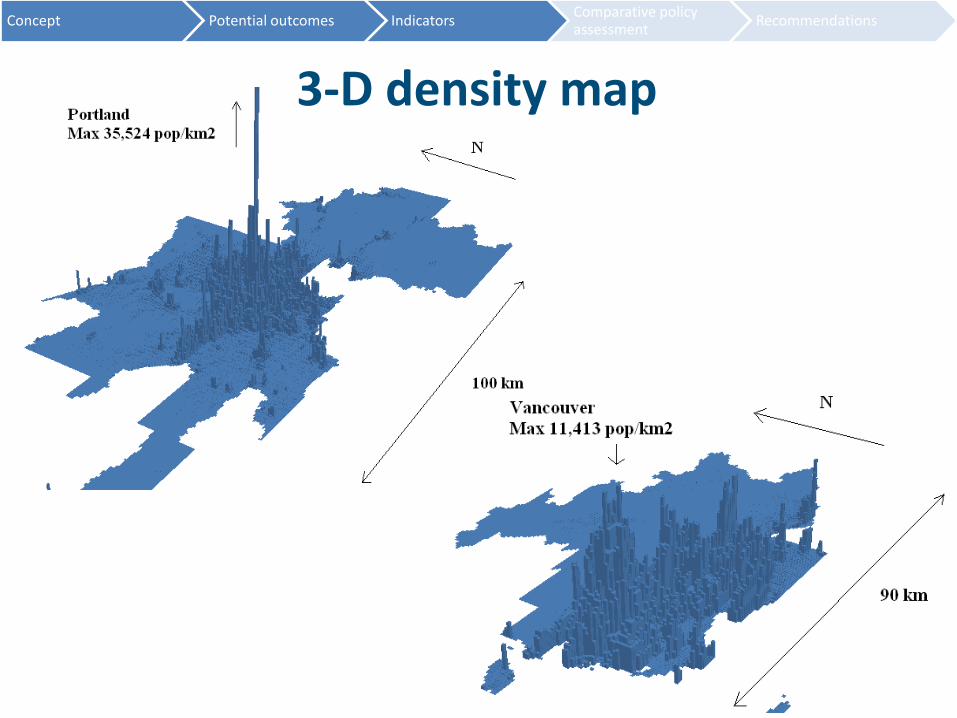
3-D density map
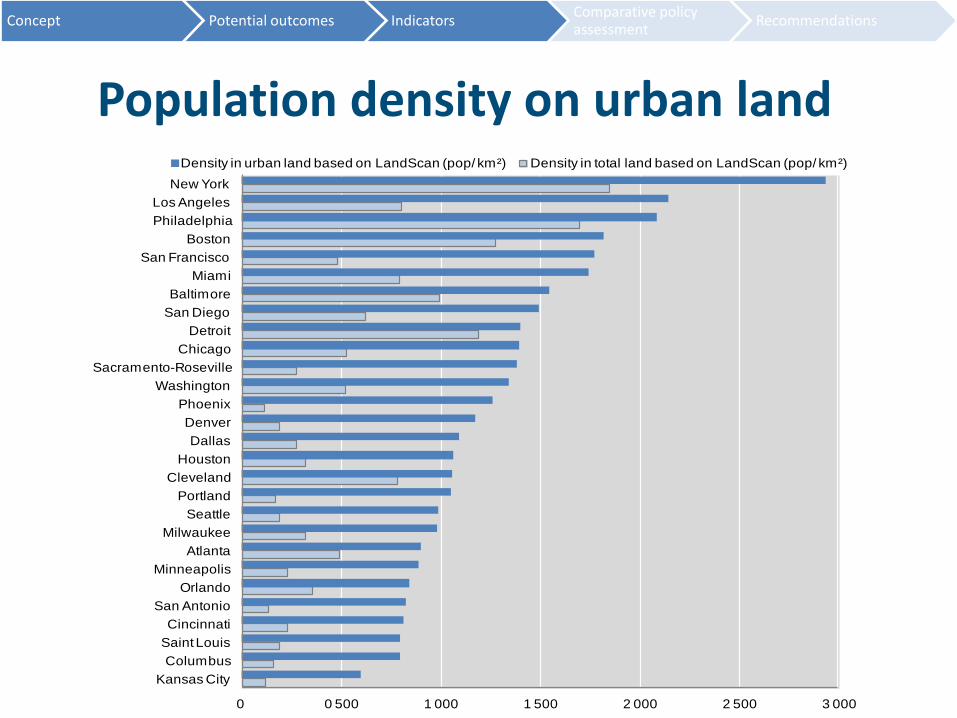
Population density on urban land
0 0 500 1 000 1 500 2 000 2 500 3 000
Kansas City
Columbus
Saint Louis
Cincinnati
San Antonio
Orlando
Minneapolis
Atlanta
Milwaukee
Seattle
Portland
Cleveland
Houston
Dallas
Denver
Phoenix
Washington
Sacramento-Roseville
Chicago
Detroit
San Diego
Baltimore
Miami
San Francisco
Boston
Philadelphia
Los Angeles
New York
Density in urban land based on LandScan (pop/ km²) Density in total land based on LandScan (pop/ km²)
Concept Potential outcomes Indicators Comparative policy assessment
Recommendations
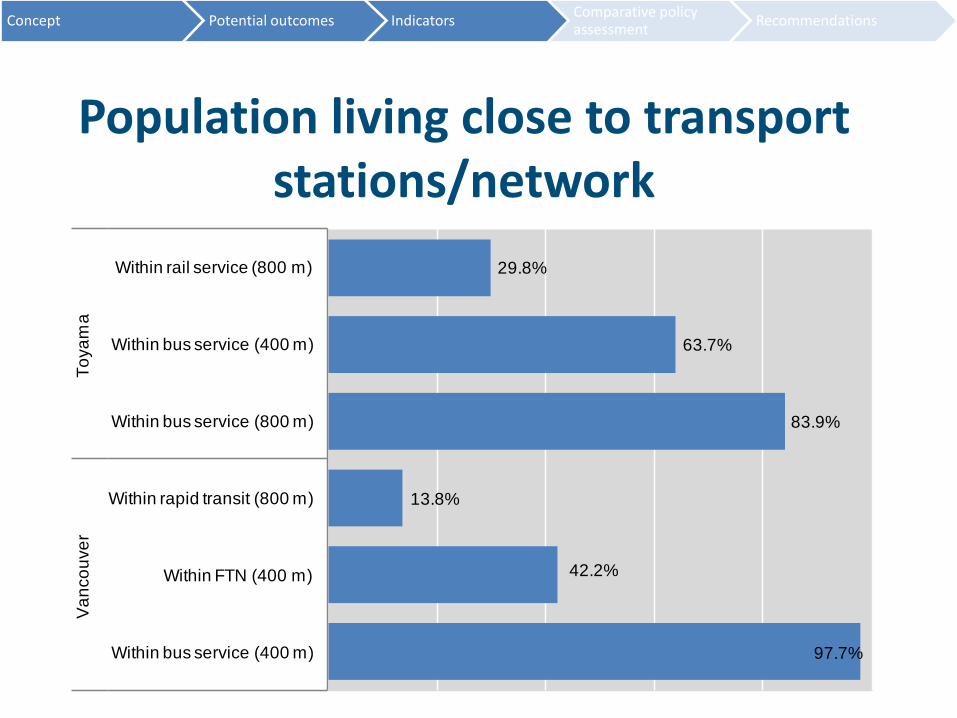
Population living close to transport stations/network
97.7%
42.2%
13.8%
83.9%
63.7%
29.8%
Within bus service (400 m)
Within FTN (400 m)
Within rapid transit (800 m)
Within bus service (800 m)
Within bus service (400 m)
Within rail service (800 m)
Va
nco
uve
rT
oya
ma
Concept Potential outcomes Indicators Comparative policy assessment
Recommendations
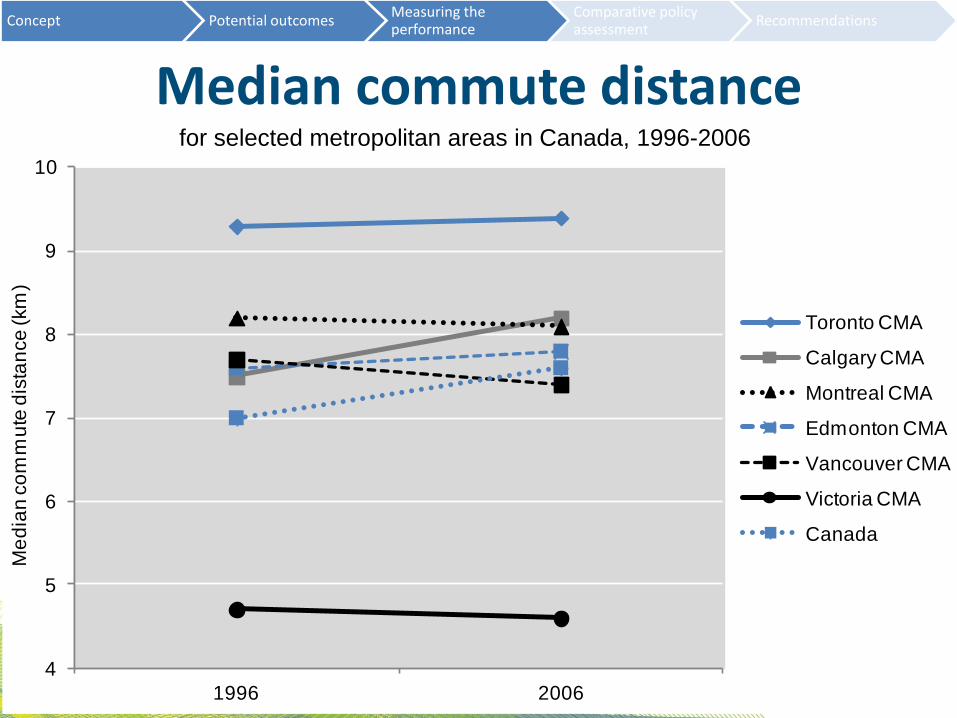
Median commute distance
4
5
6
7
8
9
10
1996 2006
Me
dia
n c
om
mu
te d
ista
nce
(km
)
Toronto CMA
Calgary CMA
Montreal CMA
Edmonton CMA
Vancouver CMA
Victoria CMA
Canada
for selected metropolitan areas in Canada, 1996-2006
Concept Potential outcomes Measuring the performance
Comparative policy assessment
Recommendations
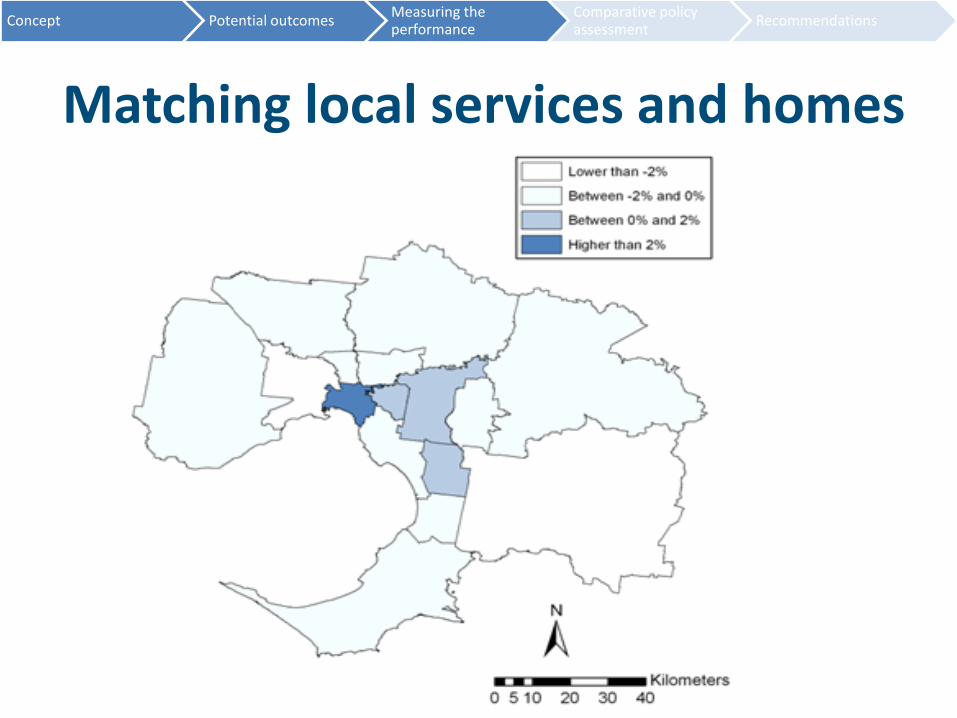
Matching local services and homes
Concept Potential outcomes Measuring the performance
Comparative policy assessment
Recommendations
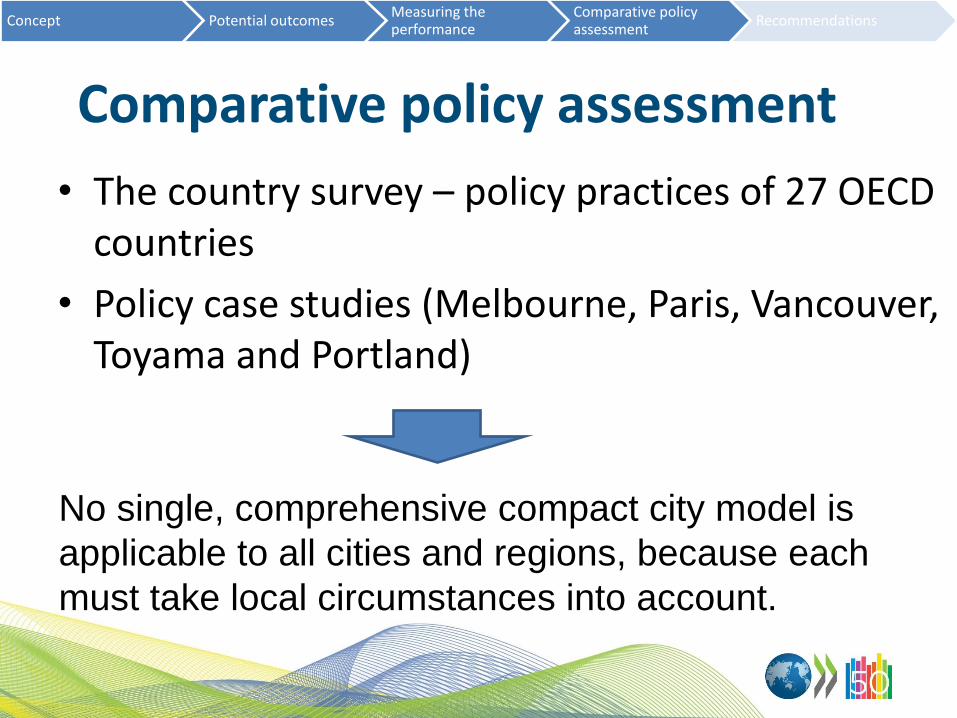
Comparative policy assessment
• The country survey – policy practices of 27 OECD countries
• Policy case studies (Melbourne, Paris, Vancouver, Toyama and Portland)
Concept Potential outcomes Measuring the performance
Comparative policy assessment
Recommendations
No single, comprehensive compact city model is
applicable to all cities and regions, because each
must take local circumstances into account.
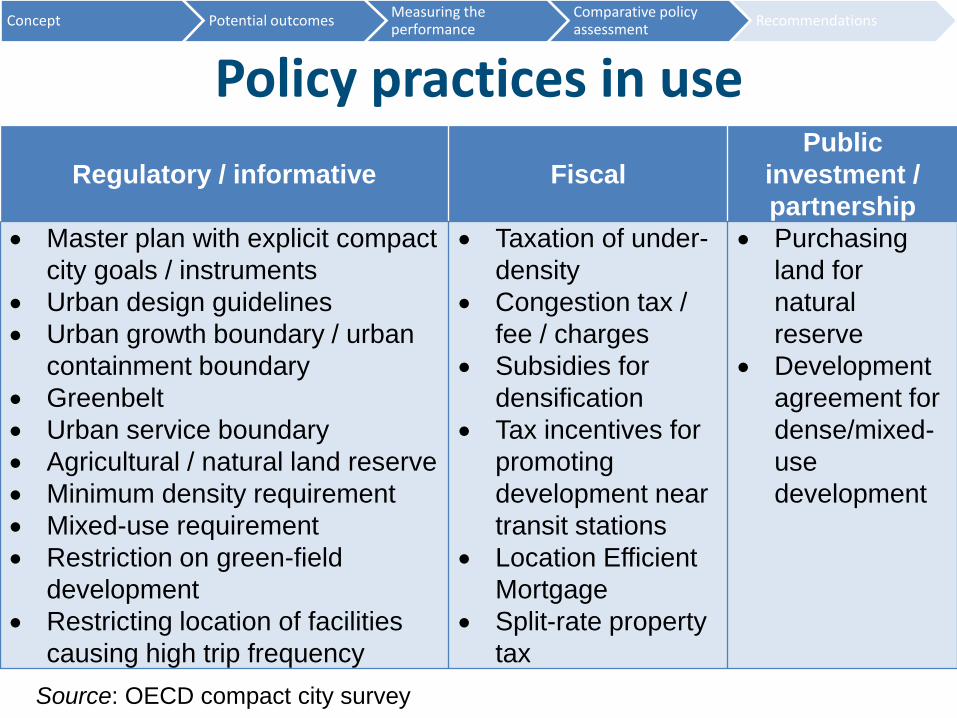
Policy practices in use
Regulatory / informative Fiscal
Public
investment /
partnership
Master plan with explicit compact
city goals / instruments
Urban design guidelines
Urban growth boundary / urban
containment boundary
Greenbelt
Urban service boundary
Agricultural / natural land reserve
Minimum density requirement
Mixed-use requirement
Restriction on green-field
development
Restricting location of facilities
causing high trip frequency
Taxation of under-
density
Congestion tax /
fee / charges
Subsidies for
densification
Tax incentives for
promoting
development near
transit stations
Location Efficient
Mortgage
Split-rate property
tax
Purchasing
land for
natural
reserve
Development
agreement for
dense/mixed-
use
development
Source: OECD compact city survey
Concept Potential outcomes Measuring the performance
Comparative policy assessment
Recommendations
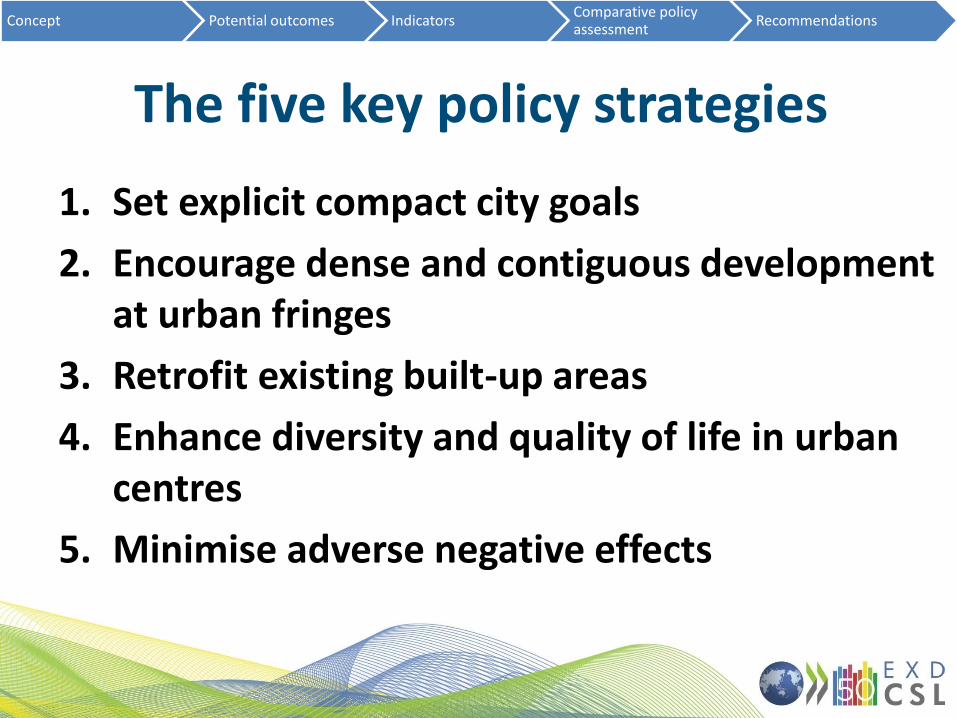
The five key policy strategies
1. Set explicit compact city goals
2. Encourage dense and contiguous development at urban fringes
3. Retrofit existing built-up areas
4. Enhance diversity and quality of life in urban centres
5. Minimise adverse negative effects
Concept Potential outcomes Indicators Comparative policy assessment
Recommendations
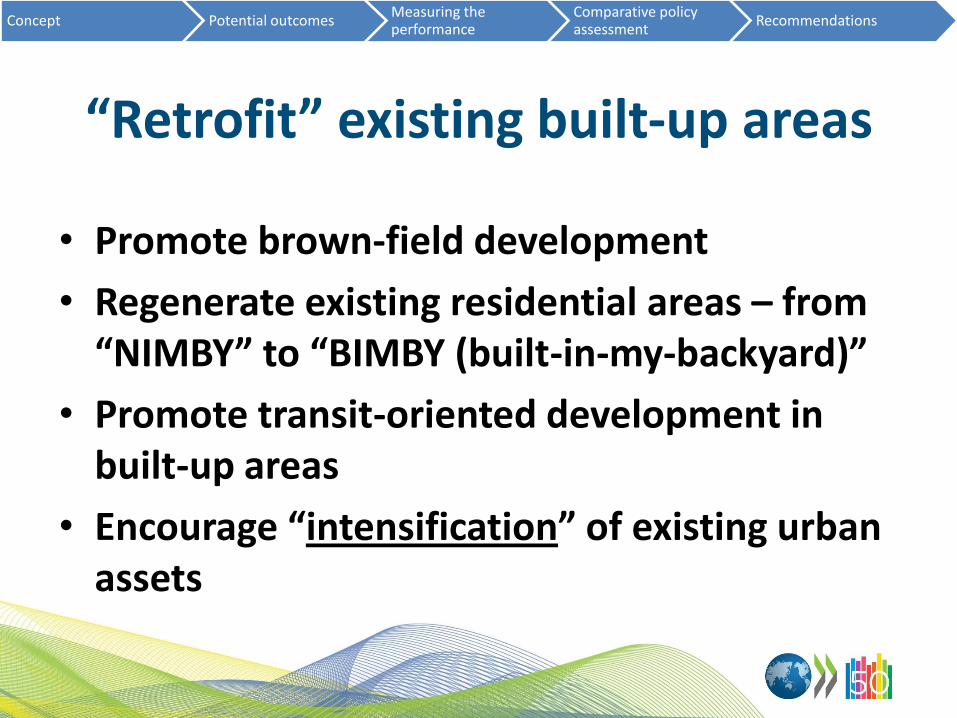
“Retrofit” existing built-up areas
• Promote brown-field development
• Regenerate existing residential areas – from “NIMBY” to “BIMBY (built-in-my-backyard)”
• Promote transit-oriented development in built-up areas
• Encourage “intensification” of existing urban assets
Concept Potential outcomes Measuring the performance
Comparative policy assessment
Recommendations
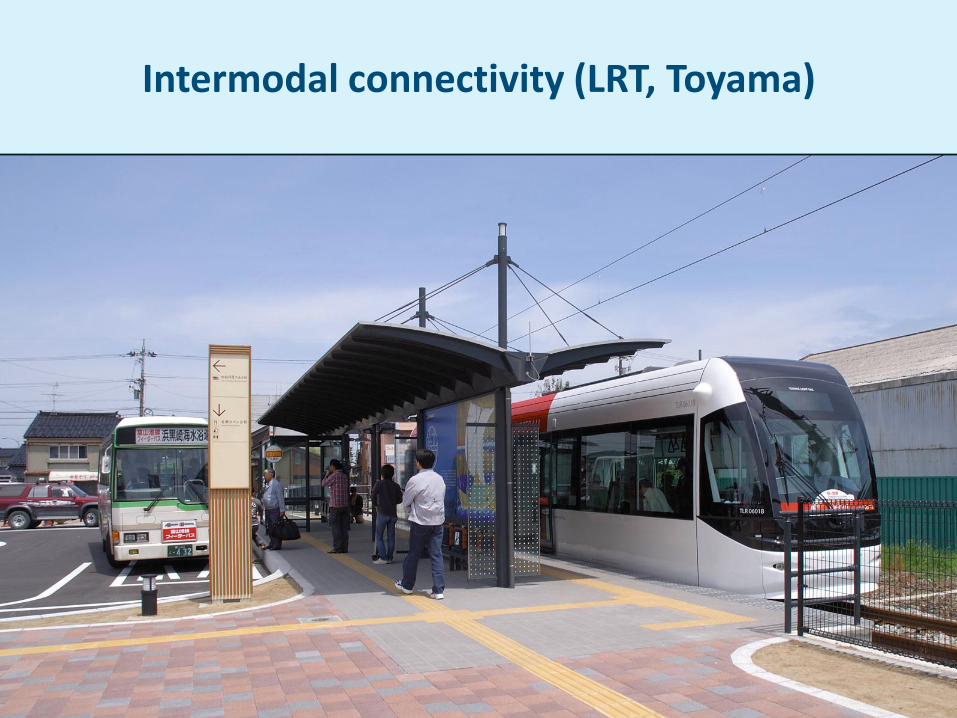
Intermodal connectivity (LRT, Toyama)
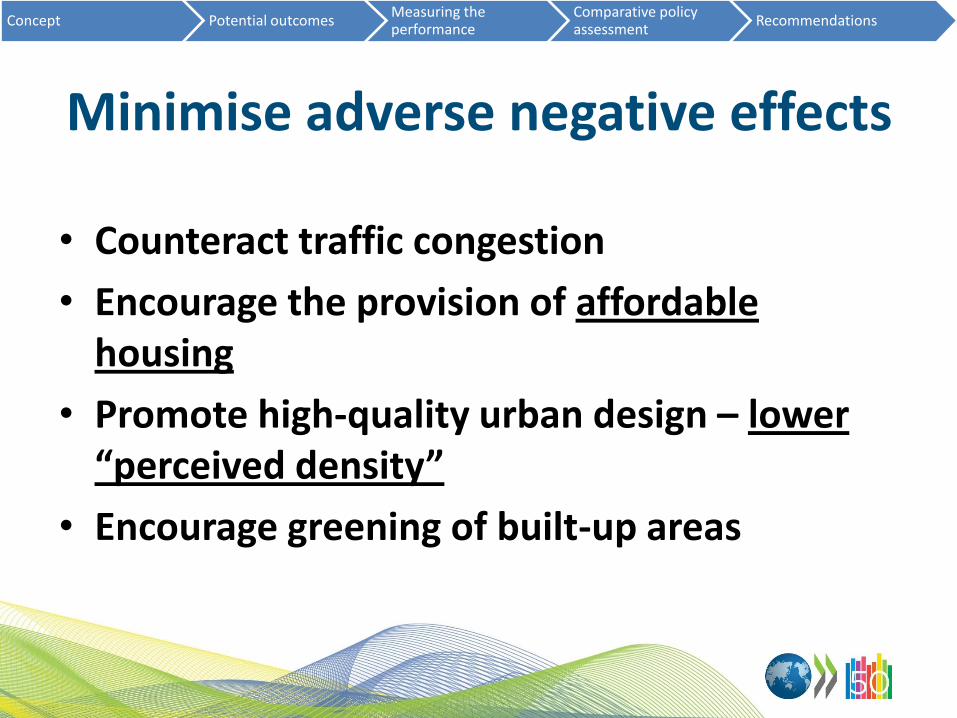
Minimise adverse negative effects
• Counteract traffic congestion
• Encourage the provision of affordable housing
• Promote high-quality urban design – lower “perceived density”
• Encourage greening of built-up areas
Concept Potential outcomes Measuring the performance
Comparative policy assessment
Recommendations

Retrofitting built-up areas + housing affordability (Laneway Housing, Vancouver)
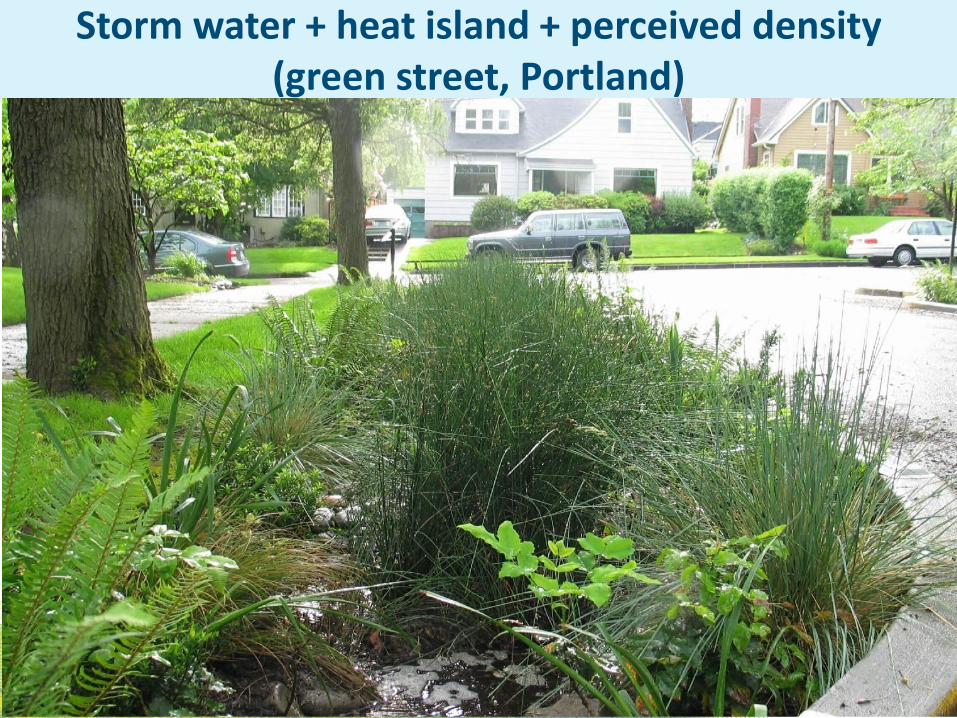
Storm water + heat island + perceived density (green street, Portland)
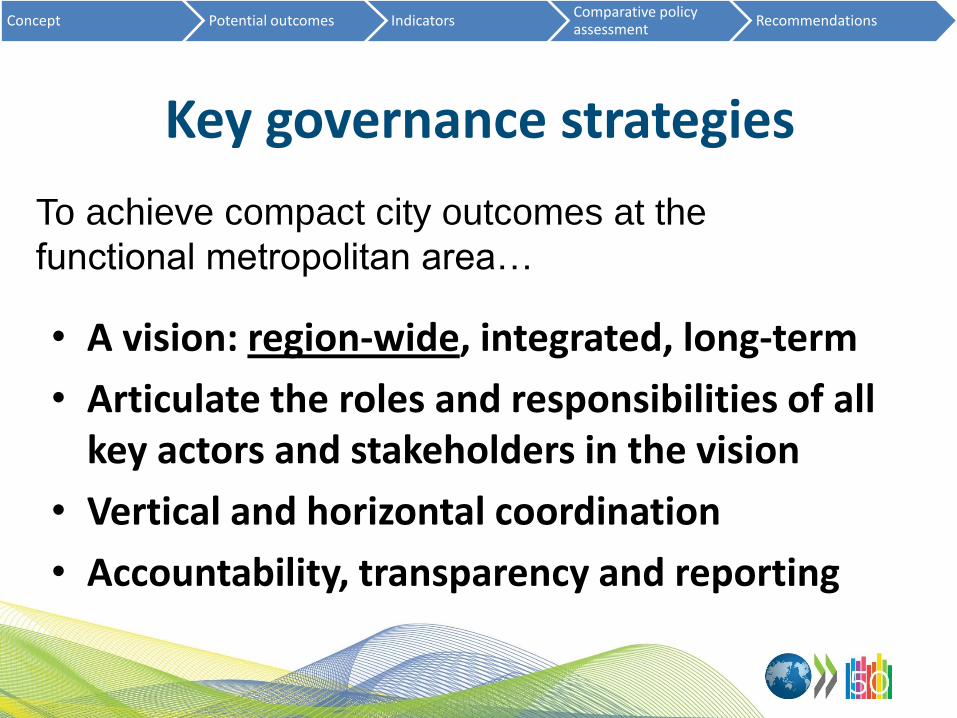
Key governance strategies
• A vision: region-wide, integrated, long-term
• Articulate the roles and responsibilities of all key actors and stakeholders in the vision
• Vertical and horizontal coordination
• Accountability, transparency and reporting
Concept Potential outcomes Indicators Comparative policy assessment
Recommendations
To achieve compact city outcomes at the
functional metropolitan area…
Find out more:
OECD (2012), Compact City Policies: A Comparative
Assessment, OECD Green Growth Studies, OECD
Publishing.
http://dx.doi.org/10.1787/9789264167865-en
Also visit our website:
www.oecd.org/regional/compactcity


![[Tadashi Yamashita] Dynamic Nunchaku(Bookos.org)](https://static.fdocuments.net/doc/165x107/55cf9b7b550346d033a63f13/tadashi-yamashita-dynamic-nunchakubookosorg.jpg)