SWOT Analysis, Priorities, and Competitive Factor … SWOT Analysis report presents the results of...
37
SWOT Analysis, Priorities, and Competitive Factor Analysis 2015-16 Report SPPE ● Strategic Planning and Performance Excellence (210) 485-0750 www.alamo.edu/planning 1
Transcript of SWOT Analysis, Priorities, and Competitive Factor … SWOT Analysis report presents the results of...

SWOT Analysis, Priorities, and
Competitive Factor Analysis
2015-16 Report
SPPE ● Strategic Planning and Performance Excellence (210) 485-0750 www.alamo.edu/planning
1

SWOT Analysis, Priorities, and Competitive Factor Analysis 2015-16 Report
Table of Contents Page
I. Executive Summary 3
II. SWOT Analysis 6
SWOT Analysis Results (Top 5) 6
SWOT Analysis Top Results by Stakeholder Category 7
SWOT Analysis Top Results by Campus 8
III. Alamo Colleges Priorities (What to Address, Preserve, and Avoid) 9
Top Priorities for the Alamo Colleges by Stakeholder Category 11
Top Priorities for the Alamo Colleges by Campus 12
IV. Competitive Factor Analysis 13
Overall Competitive Factor Analysis Results 13
Competitive Factor Analysis Top Results by Stakeholder Category 15
Competitive Factor Analysis Top Results by Campus 15
V. Appendices 16
Appendix A. Sample of SWOT Analysis Survey 17
Appendix B. Frequency Distribution of Responses to SWOT Survey by Stakeholder Category 25
Appendix C. Frequency Distribution of Responses to SWOT Survey by Campus 28
Appendix D. Frequency Distribution of Responses to Priorities by Stakeholder Category 31
Appendix E. Frequency Distribution of Responses to Priorities by Campus 33
Appendix F. Frequency Distribution of Responses to Competitive Factors by Stakeholder Category
35
Appendix G. Frequency Distribution of Responses to Competitive Factors by Campus 36
Appendix H. Comments Provided by Survey Respondents 37
2

I. Executive Summary This SWOT Analysis report presents the results of the Fall 2015 online survey on the Alamo Colleges’ strengths, weaknesses, opportunities, and threats. The report includes a list of priorities for the Alamo Colleges identified by survey respondents as well as a list of competitive factors related to area institutions of higher education. This information is provided prior to the Spring 2016 Alamo Colleges stakeholders’ strategic planning retreat as a tool for the review, update, and reaffirmation of the strategic plan. The Survey The online survey (sample in Appendix A) addressed the following areas: Strengths: What are the top 3 things that the Alamo Colleges do well? Weaknesses: What are the top 3 things that the Alamo Colleges should improve? Opportunities: What opportunities could the Alamo Colleges take advantage of in the next three years? Threats: What is changing in the environment which could adversely affect the Alamo Colleges? Priorities 1: What should the Alamo Colleges address immediately? Priorities 2: What should the Alamo Colleges preserve at all costs? Priorities 3: What future direction or decision should the Alamo Colleges avoid at all costs? Competitive Factors 1: What do the Alamo Colleges do better than other institutions of higher education in the area? Competitive Factors 2: What do other institutions of higher education in the area do better than the Alamo Colleges? The Respondents 114 Alamo Colleges stakeholders completed the online survey. The distribution of respondents according to seven stakeholder categories and six campuses was the following:
Adjunct Faculty
Full-Time Faculty
Vice Chancellor or College President
District Staff or Administrator
College Staff or
Administrator
Community Member Student Total
SAC 2 2 7 2 13 SPC 1 3 7 1 12 PAC 2 1 1 1 6 1 12 NVC 4 1 1 7 3 16 NLC 4 6 2 12 DSO 2 35 37 Community 12 12 Total 13 7 4 36 33 12 9 114
Methodology Collected responses to multiple choice questions were tabulated by stakeholder category and campus. Responses to open-ended questions were synthesized, categorized, and tabulated by stakeholder category and campus. The identified Alamo Colleges strengths, weaknesses, opportunities, threats, priorities, and competitive factors are presented below.
3

Highlights of Results by Stakeholder Category 1. Top SWOT Results: Stakeholder S W O T
Adjunct Faculty Affordability/value; Student support services; Instruction quality; Technology.
Employee support (benefits, development).
Articulation agreements with four-year institutions.
Student/citizen issues (poor preparation, illiteracy, LEP).
Full-Time Faculty Affordability/value; Instruction quality.
Collaboration between district and colleges; Communication (internal, external).
Articulation agreements with four-year institutions; Establish/strengthen partnerships.
Funding reductions.
Vice Chancellor or College President Instruction quality.
Collaboration between district and colleges; Communication (internal, external); Funding.
Articulation agreements with four-year institutions; Establish/strengthen partnerships; Technology (demand for new technologies, distance education, etc.); Dual credit program revenue increase; Annexation leading to increased enrollment and revenue.
Funding reductions.
District Staff or Administrator
Affordability/value; Economic and workforce development (training, education, programs, support); Student centeredness.
Collaboration between district and colleges.
Articulation agreements with four-year institutions; Workforce needs (capitalize on workforce demands for emerging industry programs, trained/skilled workers by existing and incoming industries/companies).
Funding reductions.
College Staff or Administrator
Affordability/value; Instruction quality.
Communication (internal, external); Collaboration between district and colleges.
Articulation agreements with four-year institutions.
Funding reductions; High school misalignment with colleges.
Community Member
Affordability/value; Economic and workforce development (training, education, programs, support).
Communication (internal, external); Collaboration among colleges; Collaboration between district and colleges.
Articulation agreements with four-year institutions; Workforce needs (capitalize on workforce demands for emerging industry programs, trained/skilled workers by existing and incoming industries/companies).
High school misalignment with colleges.
Student Affordability/value; Leadership.
Facilities.
Articulation agreements with four-year institutions; Workforce needs (capitalize on workforce demands for emerging industry programs, trained/skilled workers by existing and incoming industries/companies).
High school misalignment with colleges.
S = Strengths; W = Weaknesses; O = Opportunities; T = Threats
4

2. Top Priorities and Competitive Factors: ADDRESS = Priorities 1: What should the Alamo Colleges address immediately? PRESERVE = Priorities 2: What should the Alamo Colleges preserve at all costs? AVOID = Priorities 3: What future direction or decision should the Alamo Colleges avoid at all costs? C1 = Competitor Factors 1: What does the Alamo Colleges do better than other institutions of higher education in the area? C2 = Competitor Factors 2: What do other institutions of higher education in the area do better than the Alamo Colleges?
Stakeholder ADDRESS PRESERVE AVOID C1 C2
Adjunct Faculty
Leadership Issues (inclusiveness, top-down decision making, trust).
Quality Education. Excessive Initiatives. Small Classes. Image/Prestige.
Full-Time Faculty
Leadership Issues (inclusiveness, top-down decision making, trust).
Student-Centered Focus; Quality Education.
District Centeredness. Affordability. Marketing.
Vice Chancellor or College President
Leadership Issues (inclusiveness, top-down decision making, trust).
Accessibility. Excessive Initiatives. Value. Image/Prestige;
Marketing.
District Staff or Administrator
Personnel Issues (capacity, capability, resources, morale, hiring).
Student-Centered Focus.
Excessive Initiatives. Affordability. Image/Prestige
College Staff or Administrator
Leadership Issues (inclusiveness, top-down decision making, trust).
Student-Centered Focus; College Cultures/ Autonomy.
Excessive Initiatives. Affordability. Image/Prestige
Community Member
Collaboration, Coordination. Affordability.
Excessive Initiatives; Weakening Curriculum/Course Content, Value, and Standards.
Affordability. Image/Prestige
Student
Personnel Issues (capacity, capability, resources, morale, hiring); Budgeting/Funding
Affordability.
Single Accreditation; Neglect of Developmental Education.
Affordability. Program/Courses Variety.
5

II. SWOT Analysis The overall top five Alamo Colleges strengths and weaknesses as well as the overall top five opportunities and threats to the Alamo Colleges appear, along with their relative frequencies, in the following chart. SWOT Analysis Overall Results (Top 5)
Top 5 Strengths - Affordability/value, 21.1%*
- Student centeredness, 7.5%
- Instruction quality, 7.5%
- Student support services, 6.8%
- Economic and workforce development
(training, education, programs, support), 6.2%
Top 5 Weaknesses - Collaboration between district and colleges, 13.6%
- Communication (internal, external), 11.5%
- Collaboration among colleges, 7.3%
- Employee support (benefits, development), 6.4%
- Process improvement, 5.2%
Budgeting/resource allocation, 5.2%
Top 5 Opportunities - Articulation agreements with four-year
institutions, 20.6%
- Workforce needs (capitalize on workforce
demands for emerging industry programs,
trained/skilled workers by existing and
incoming industries/companies), 14.1%
- Establish/strengthen partnerships, 11.9%
- Technology (demand for new technologies,
distance education, etc.), 10.3%
- Dual credit program revenue increase, 9.6%
Top 5 Threats - Funding reductions, 17.2%
- High school misalignment with colleges, 15.0%
- Student/citizen issues (poor preparation, illiteracy,
LEP), 10.0%
- Competition from other higher education
institutions, 9.4%
- Accreditation requirements, 7.8%
* Percentages indicate proportion of responses within each cell.
6

The top SWOT Analysis results are presented by stakeholder category and campus in the following two tables. See Appendices B and C for a complete frequency distribution of all SWOT Analysis results. SWOT Analysis Top Results by Stakeholder Category
Top
Strength Top
Weakness Top
Opportunity Top
Threat
Adjunct Faculty Affordability/value. Employee support (benefits, development).
Articulation agreements with four-year institutions.
Student/citizen issues (poor preparation, illiteracy, LEP).
Full-Time Faculty Affordability/value. Communication
(internal, external).
Articulation agreements with four-year institutions; Establish/strengthen partnerships.
Funding reductions.
Vice Chancellor or College President
Instruction quality. Collaboration between district and colleges.
Articulation agreements with four-year institutions; Establish/strengthen partnerships; Technology (demand for new technologies, distance education, etc.); Dual credit program revenue increase; Annexation leading to increased enrollment and revenue.
Funding reductions.
College Staff or Administrator Affordability/value. Communication
(internal, external). Articulation agreements with four-year institutions. Funding reductions.
District Staff or Administrator Affordability/value.
Collaboration between district and colleges.
Workforce needs (capitalize on workforce demands for emerging industry programs, trained/skilled workers by existing and incoming industries/companies).
Funding reductions.
Student Affordability/value. Facilities. Articulation agreements with four-year institutions.
High school misalignment with colleges.
Community Member
Affordability/value; Economic and workforce development.
Communication (internal, external); Collaboration among colleges.
Articulation agreements with four-year institutions; Workforce needs (capitalize on workforce demands for emerging industry programs, trained/skilled workers by existing and incoming industries/companies)
High school misalignment with colleges.
7
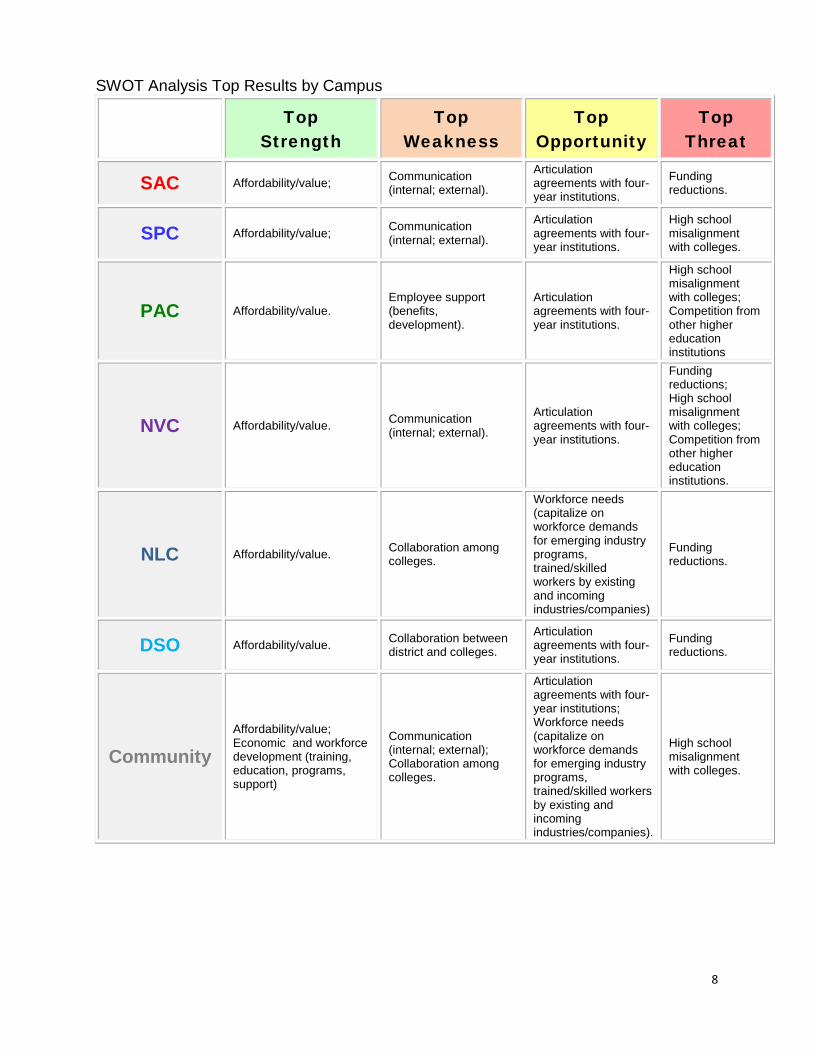
SWOT Analysis Top Results by Campus
Top
Strength Top
Weakness Top
Opportunity Top
Threat
SAC Affordability/value; Communication (internal; external).
Articulation agreements with four-year institutions.
Funding reductions.
SPC Affordability/value; Communication (internal; external).
Articulation agreements with four-year institutions.
High school misalignment with colleges.
PAC Affordability/value. Employee support (benefits, development).
Articulation agreements with four-year institutions.
High school misalignment with colleges; Competition from other higher education institutions
NVC Affordability/value. Communication (internal; external).
Articulation agreements with four-year institutions.
Funding reductions; High school misalignment with colleges; Competition from other higher education institutions.
NLC Affordability/value. Collaboration among colleges.
Workforce needs (capitalize on workforce demands for emerging industry programs, trained/skilled workers by existing and incoming industries/companies)
Funding reductions.
DSO Affordability/value. Collaboration between district and colleges.
Articulation agreements with four-year institutions.
Funding reductions.
Community Affordability/value; Economic and workforce development (training, education, programs, support)
Communication (internal; external); Collaboration among colleges.
Articulation agreements with four-year institutions; Workforce needs (capitalize on workforce demands for emerging industry programs, trained/skilled workers by existing and incoming industries/companies).
High school misalignment with colleges.
8

III. Alamo Colleges Priorities The following three tables include the Alamo Colleges priorities and frequency distributions regarding what the institution should address, preserve, and avoid.
1. What should the Alamo Colleges address immediately?
NUMBER OF RESPONSES %
Leadership Issues (inclusiveness, top-down decision making, trust) 25 22.5% Personnel Issues (capacity, capability, resources, morale, hiring) 18 16.2% Budgeting/Funding 11 9.9% Collaboration/Coordination 10 9.0% Recruitment/Enrollment 9 8.1% Compensation 7 6.3% Accountability 5 4.5% Completion/Graduation 5 4.5% Process Improvement/Student Support Services 5 4.5% Communication 4 3.6% Innovation 4 3.6% Employee Development 3 2.7% Retention 2 1.8% New-Initiative Issues 1 0.9% Technology Issues 1 0.9% Accreditation issues 1 0.9% Total 111 100.0%
9

2. What should the Alamo Colleges preserve at all costs?
NUMBER OF RESPONSES %
Affordability 19 17.4% Student-Centered Focus 19 17.4% Quality Education 18 16.5% Accessibility 11 10.1% College Cultures/Autonomy 10 9.2% Faculty (autonomy, diversity, support) 7 6.4% Employee Development/Benefits 6 5.5% College Collaboration/Communication 5 4.6% Program/Course Offerings 4 3.7% Image/Integrity 3 2.8% Small Class Sizes 3 2.8% Vision/Mission/Values/Alamo Way 2 1.8% Community Commitment/Outreach 1 0.9% Services 1 0.9% Total 109 100.0%
3. What future direction or decision should the Alamo Colleges avoid at all costs?
NUMBER OF RESPONSES %
Excessive Initiatives 33 30.3% Weakening Curriculum/Course Content Value/Standards 16 14.7% District Centeredness 13 11.9% Single Accreditation 12 11.0% Neglect of Developmental Education 8 7.3% Faculty Issues (reduction, replacement, marginalization) 5 4.6% Over-standardization/-consolidation 5 4.6% Staffing/Resource Inefficiencies 4 3.7% Tuition/Fees Increases 4 3.7% College/Building Expansion 3 2.8% Imposing Leadership/Management Concepts 2 1.8% Limiting Innovation/Focus 2 1.8% Not Serving All Populations 2 1.8% Funding Issues 0 0.0% Technology Issues 0 0.0% Total 109 100.0%
10

The top priorities for the Alamo Colleges are divided by stakeholder category and campus in the following two tables. Top Priorities for the Alamo Colleges by Stakeholder Category
1. What the Alamo
Colleges should address
immediately
2. What the Alamo Colleges
should preserve at all
costs
3. What the Alamo Colleges should avoid at
all costs
Adjunct Faculty
Leadership Issues (inclusiveness, top-down decision making, trust).
Quality Education. Excessive Initiatives.
Full-Time Faculty
Leadership Issues (inclusiveness, top-down decision making, trust).
Student-Centered Focus; Quality Education. District Centeredness.
Vice Chancellor or College President
Leadership Issues (inclusiveness, top-down decision making, trust).
Accessibility. Excessive Initiatives.
College Staff or Administrator
Leadership Issues (inclusiveness, top-down decision making, trust).
Student-Centered Focus; College Cultures/Autonomy.
Excessive Initiatives.
District Staff or Administrator
Personnel Issues (capacity, capability, resources, morale, hiring).
Student-Centered Focus. Excessive Initiatives.
Student
Personnel Issues (capacity, capability, resources, morale, hiring) Budgeting/Funding
Affordability. Single Accreditation; Neglect of Developmental Education
Community Member
Collaboration/ Coordination Affordability.
Excessive Initiatives; Weakening Curriculum/Course Content Value/Standards.
11

Top Priorities for the Alamo Colleges by Campus 1. What the
Alamo Colleges should
address immediately
2. What the Alamo
Colleges should
preserve at all costs
3. What the Alamo Colleges should avoid at
all costs
SAC Recruitment/Enrollment. Quality Education. Excessive Initiatives.
SPC Leadership Issues (inclusiveness, top-down decision making, trust).
College Cultures/Autonomy. Single Accreditation.
PAC Leadership Issues (inclusiveness, top-down decision making, trust).
Accessibility. Excessive Initiatives.
NVC Leadership Issues (inclusiveness, top-down decision making, trust).
Quality Education. Excessive Initiatives; District Centeredness.
NLC
Personnel Issues (capacity, capability, resources, morale, hiring);
Affordability. Excessive Initiatives.
DSO Leadership Issues (inclusiveness, top-down decision making, trust).
Student-Centered Focus. Excessive Initiatives.
Community Collaboration/ Coordination. Affordability.
Excessive Initiatives; Weakening Curriculum/Course Content Value/Standards.
12

IV. Competitive Factor Analysis The analysis of responses on competitive factors revealed that the Alamo Colleges are stronger than area schools of higher education in offering affordability, accessibility, small classes, dual credit, workforce development and technical programs, value, quality education, student centeredness, student support services and partnerships, whereas competing schools in our area have more effective image/prestige, fundraising and alumni support, marketing, employee/faculty support, completion/graduation, program/courses variety, and processes. Overall Competitive Factor Analysis Results
What Alamo Colleges Do Better Than Competitors
NUMBER OF RESPONSES %
Affordability 67 23.3% Accessibility 32 11.1% Small Classes 29 10.1% Dual Credit 25 8.7% Workforce Development/Technical Programs 24 8.4% Value 21 7.3% Quality Education 19 6.6% Student Centeredness 18 6.3% Student Support/Services 15 5.2% Partnerships 12 4.2% Community Outreach/Support 9 3.1% Flexibility/Agility 7 2.4% Program/Courses Variety 7 2.4% Employee/faculty support 1 0.3% Innovation 1 0.3% Total 287 100.0%
13

What Competitors Do Better Than Alamo Colleges
NUMBER OF RESPONSES %
Image/Prestige 53 19.9% Fundraising/Alumni Support 38 14.3% Marketing 34 12.8% Employee/Faculty Support 28 10.5% Completion/Graduation 25 9.4% Program/Courses Variety 18 6.8% Processes 16 6.0% Student Support/Services 14 5.3% Quality Education 13 4.9% Student Retention 12 4.5% Innovation 10 3.8% Internships 2 0.8% Student Centeredness 1 0.4% Utilization of human resources 1 0.4% Employee compensation 1 0.4% Total 266 100.0%
14

Competitive factor analysis results are presented by stakeholder category and by campus in the following two tables. Competitive Factor Analysis Top Results by Stakeholder Category
Competitive Factor Analysis Top Results by Campus
What Alamo Colleges Do Better Than
Competitors
What Competitors Do Better Than Alamo
Colleges SAC Affordability. Image/Prestige.
SPC Affordability. Marketing.
PAC Affordability. Image/Prestige.
NVC Affordability; Small classes. Image/Prestige.
NLC Affordability. Image/Prestige.
DSO Affordability. Image/Prestige.
Community Affordability. Image/Prestige.
What Alamo Colleges Do Better Than Competitors
What Competitors Do Better Than Alamo
Colleges Adjunct Faculty Small classes. Image/Prestige.
Full-Time Faculty Affordability. Marketing.
Vice Chancellor or College President
Value. Image/Prestige; Marketing
College Staff or Administrator
Affordability. Image/Prestige.
District Staff or Administrator
Affordability. Image/Prestige.
Student Affordability. Program/Courses variety.
Community Member Affordability. Image/Prestige.
15

V. Appendices
Appendix A. Sample of SWOT Analysis Survey (Page 17) Appendix B. Frequency Distribution of Responses to SWOT Survey by Stakeholder Category (Page 25) Appendix C. Frequency Distribution of Responses to SWOT Survey by Campus (Page 28) Appendix D. Frequency Distribution of Responses to Priorities by Stakeholder Category (Page 31) Appendix E. Frequency Distribution of Responses to Priorities by Campus (Page 33) Appendix F. Frequency Distribution of Responses to Competitive Factors by Stakeholder Category (Page 35) Appendix G. Frequency Distribution of Responses to Competitive Factors by Campus (Page 36) Appendix H. Comments Provided by Survey Respondents (Page 37)
16

Appendix A. Sample of SWOT Analysis Survey
The Alamo Way: Always Inspire, Always Improve
2015-2016 SWOT Analysis Survey What is a SWOT analysis? SWOT analysis is the tool we use to evaluate organizational strengths, weaknesses, opportunities, and threats. The strengths and weaknesses represent internal factors. The strengths refer to competitive advantages or core competencies that give the Alamo Colleges a better position in meeting the needs of students and the community. Weaknesses refer to any limitations the Alamo Colleges might face in developing or implementing a strategy. Opportunities and threats are external factors that can negatively impact the Alamo Colleges' operation. Opportunities refer to external favorable conditions that could produce positive outcomes for the Alamo Colleges, whereas threats refer to external negative conditions or barriers that may prevent the Alamo Colleges from reaching stated goals and objectives. Knowing each SWOT element will help us develop suitable strategies to more effectively meet the needs of our students and the community.
Please complete this SWOT analysis survey from your perspective/role as a leader or supporter of the Alamo Colleges system (all colleges and District Support Operations combined). Your input will help shape the future of the Alamo Colleges. All responses will be collected together to produce a summary report, thereby ensuring your anonymity. If you have any questions, contact Dr. Carlos Ayala
at (210) 485-0750.
1. Indicate your affiliation. SAC
SPC
PAC
NVC
NLC
District (District Support Operation
Not an employee of Alamo College 2. Indicate your occupation category
Full-Time Faculty
Adjunct Faculty
Vice Chancellor or College President
College Staff or Administrator
District Staff or Administrator
Student at one of the Alamo Colleges
17
Community Member (not an Alamo Colleges employee or studen
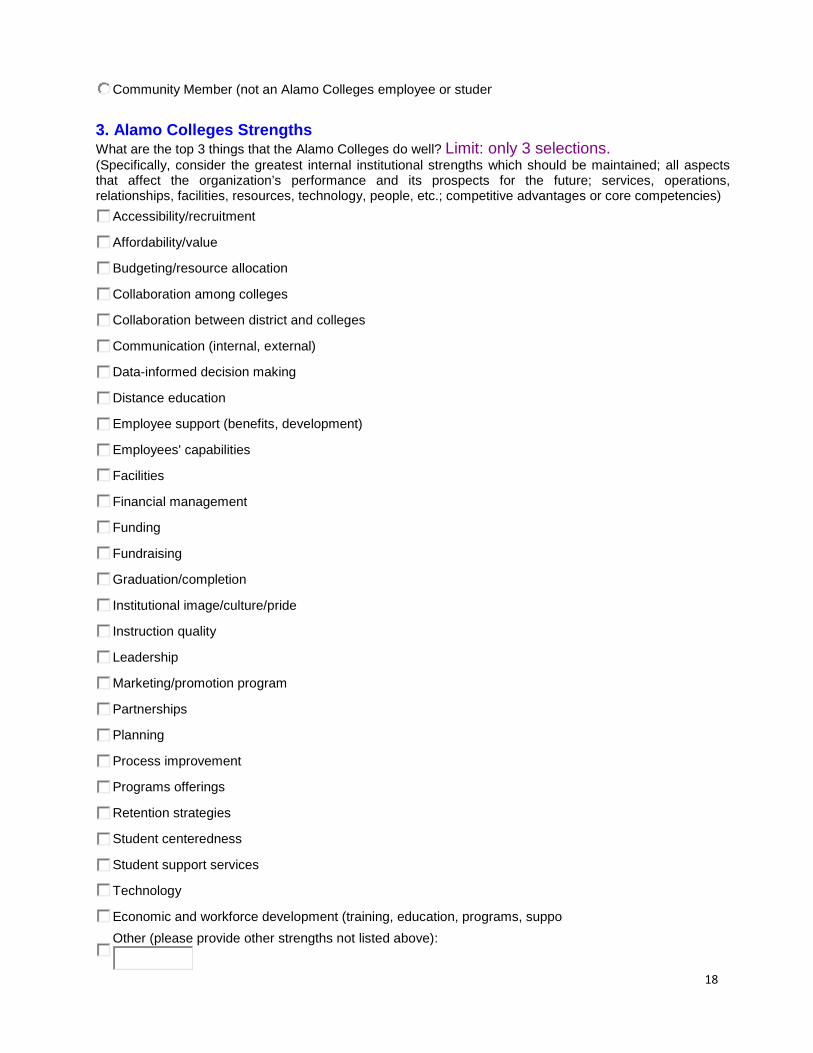
3. Alamo Colleges Strengths What are the top 3 things that the Alamo Colleges do well? Limit: only 3 selections. (Specifically, consider the greatest internal institutional strengths which should be maintained; all aspects that affect the organization’s performance and its prospects for the future; services, operations, relationships, facilities, resources, technology, people, etc.; competitive advantages or core competencies)
Accessibility/recruitment
Affordability/value
Budgeting/resource allocation
Collaboration among colleges
Collaboration between district and colleges
Communication (internal, external)
Data-informed decision making
Distance education
Employee support (benefits, development)
Employees' capabilities
Facilities
Financial management
Funding
Fundraising
Graduation/completion
Institutional image/culture/pride
Instruction quality
Leadership
Marketing/promotion program
Partnerships
Planning
Process improvement
Programs offerings
Retention strategies
Student centeredness
Student support services
Technology
Economic and workforce development (training, education, programs, suppor
Other (please provide other strengths not listed above):
18

4. Alamo Colleges Weaknesses What are the top 3 things that the Alamo Colleges should improve? Limit: only 3 selections. (Specifically, consider the greatest internal institutional areas for improvement; all aspects that limit or negatively affect the organization’s performance and its prospects for the future; services, operations, relationships, facilities, resources, technology, people, etc.; competitive advantages or core competencies)
Accessibility/recruitment
Affordability/value
Budgeting/resource allocation
Collaboration among colleges
Collaboration between district and colleges
Communication (internal, external)
Data-informed decision making
Distance education
Employee support (benefits, development)
Employees' capabilities
Facilities
Financial management
Funding
Fundraising
Graduation/completion
Institutional image/culture/pride
Instruction quality
Leadership
Marketing/promotion program
Partnerships
Planning
Process improvement
Programs offerings
Retention strategies
Student centeredness
Student support services
Technology
Economic and workforce development (training, education, programs, suppor
Other (please provide other weaknesses not listed above):
19

5. Opportunities for the Alamo Colleges What opportunities could the Alamo Colleges take advantage of in the next three years? Limit: only 3 selections. (Specifically, consider the most important EXTERNAL opportunities; all favorable conditions in the current and future operating environments, e.g., social, cultural, demographic, economic, political, legal, local, state, national, global, etc.; the full range of stakeholders)
Annexation leading to increased enrollment and revenue
Articulation agreements with four-year institutions
Demographic changes
Dual credit program revenue increase
Establish/strengthen partnerships
Global initiatives
Political changes
Slow economy prompting higher enrollments
Socio-cultural changes
Sustainability trends
Technology (demand for new technologies, distance education, etc.)
Workforce needs (capitalize on workforce demands for emerging industry programs, trained/skille workers by existing and incoming industries/companies)
Other (please provide other external opportunities not listed above):
6. Threats to the Alamo Colleges What is changing in the environment which could adversely affect the Alamo Colleges? Limit: only 3 selections. (Specifically, consider all EXTERNAL threats to the organization; all Alamo Colleges current and likely future operating environments, e.g., social, cultural, demographic, economic, political, legal, local, state, national, global, etc.; all conditions or barriers that may prevent the Alamo Colleges from fulfilling the mission or achieving the vision)
Accountability requirements
Accreditation requirements
Alternative energy issues
Community's disengagement/complacency
Community's negative image about community colleges
Competition from other higher education institutions
Demographic changes
Economic downturn
Funding reductions
Globalization
High school dropout rates
20

High school misalignment with colleges
Inflation/cost of living
Lawsuits and bad press
Legal/regulatory changes
Limited Nursing/Allied Health instructor availability
Political changes
Population growth
Poverty
Student/citizen issues (poor preparation, illiteracy, LEP)
Technology changes
Other (please provide other external threats not listed above
7. Alamo Colleges Priorities A. What should the Alamo Colleges address immediately? Limit: only 1 selection.
Accountability
Budgeting/Funding
Collaboration/Coordination
Communication
Compensation
Completion/Graduation
Employee Development
Innovation
Leadership Issues (inclusiveness, top-down decision making, trust)
New-Initiative Issues
Personnel Issues (capacity, capability, resources, morale, hiring)
Process Improvement/Student Support Services
Recruitment/Enrollment
Retention
Technology Issues
Other (please indicate here what must be addressed other than the above choices
B. What should the Alamo Colleges preserve at all costs? Limit: only 1 selection. Accessibility
Affordability
College Collaboration/Communication 21

College Cultures/Autonomy
Community Commitment/Outreach
Employee Development/Benefits
Faculty (autonomy, diversity, support)
Image/Integrity
Leadership Opportunities
Program/Course Offerings
Quality Education
Services
Small Class Sizes
Student-Centered Focus
Vision/Mission/Values/Alamo Way
Other (please indicate here what must be preserved other than the above choices
C. What future direction or decision should the Alamo Colleges avoid at all costs? Limit: only 1 selection.
College/Building Expansion
District Centeredness
Excessive Initiatives
Faculty Issues (reduction, replacement, marginalization)
Funding Issues
Imposing Leadership/Management Concepts
Limiting Innovation/Focus
Neglect of Developmental Education
Not Serving All Populations
Over-standardization/-consolidation
Single Accreditation
Staffing/Resource Inefficiencies
Technology Issues
Tuition/Fees Increases
Weakening Curriculum/Course Content Value/Standards
Other (please indicate here what must be avoided other than the above choices
8. Alamo Colleges Competition A. What do the Alamo Colleges do better than other institutions of higher education in the area? Limit: only 3 selections.
22

Accessibility
Affordability
Community Outreach/Support
Dual Credit
Flexibility/Agility
Partnerships
Program/Courses Variety
Quality Education
Small Classes
Student Centeredness
Student Support/Services
Value
Workforce Development/Technical Programs
Other (please indicate here other things that Alamo Colleges does better
B. What do other institutions of higher education in the area do better than the Alamo Colleges? Limit: only 3 selections.
Completion/Graduation
Employee/Faculty Support
Fundraising/Alumni Support
Image/Prestige
Innovation
Marketing
Processes
Program/Courses Variety
Quality Education
Student Centeredness
Student Retention
Student Support/Services
Other (please indicate here other things that area institutions do better than the Alamo Colleges
9. Comments (Optional)
23

Finish
24
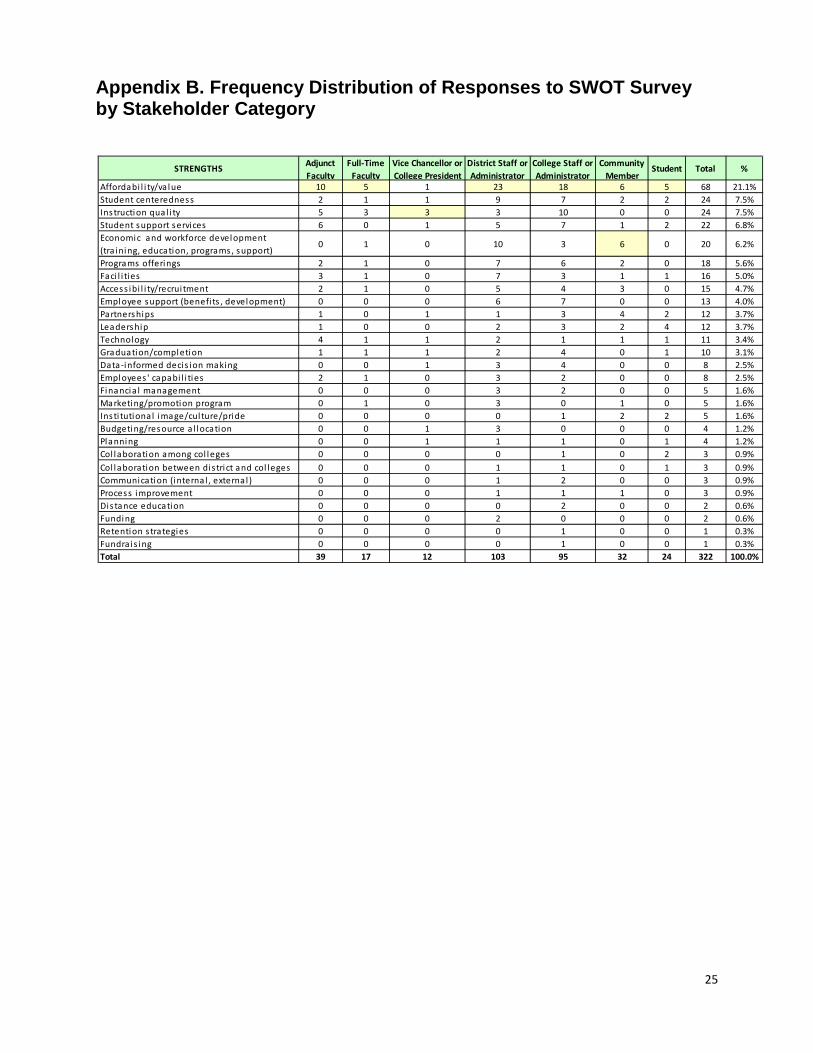
Appendix B. Frequency Distribution of Responses to SWOT Survey by Stakeholder Category
STRENGTHS Adjunct Faculty
Full-Time Faculty
Vice Chancellor or College President
District Staff or Administrator
College Staff or Administrator
Community Member
Student Total %
Affordabi l i ty/va lue 10 5 1 23 18 6 5 68 21.1%Student centeredness 2 1 1 9 7 2 2 24 7.5%Instruction qual i ty 5 3 3 3 10 0 0 24 7.5%Student support services 6 0 1 5 7 1 2 22 6.8%Economic and workforce development (tra ining, education, programs, support)
0 1 0 10 3 6 0 20 6.2%
Programs offerings 2 1 0 7 6 2 0 18 5.6%Faci l i ties 3 1 0 7 3 1 1 16 5.0%Access ibi l i ty/recrui tment 2 1 0 5 4 3 0 15 4.7%Employee support (benefi ts , development) 0 0 0 6 7 0 0 13 4.0%Partnerships 1 0 1 1 3 4 2 12 3.7%Leadership 1 0 0 2 3 2 4 12 3.7%Technology 4 1 1 2 1 1 1 11 3.4%Graduation/completion 1 1 1 2 4 0 1 10 3.1%Data-informed decis ion making 0 0 1 3 4 0 0 8 2.5%Employees ' capabi l i ties 2 1 0 3 2 0 0 8 2.5%Financia l management 0 0 0 3 2 0 0 5 1.6%Marketing/promotion program 0 1 0 3 0 1 0 5 1.6%Insti tutional image/cul ture/pride 0 0 0 0 1 2 2 5 1.6%Budgeting/resource a l location 0 0 1 3 0 0 0 4 1.2%Planning 0 0 1 1 1 0 1 4 1.2%Col laboration among col leges 0 0 0 0 1 0 2 3 0.9%Col laboration between dis trict and col leges 0 0 0 1 1 0 1 3 0.9%Communication (internal , external ) 0 0 0 1 2 0 0 3 0.9%Process improvement 0 0 0 1 1 1 0 3 0.9%Distance education 0 0 0 0 2 0 0 2 0.6%Funding 0 0 0 2 0 0 0 2 0.6%Retention s trategies 0 0 0 0 1 0 0 1 0.3%Fundra is ing 0 0 0 0 1 0 0 1 0.3%Total 39 17 12 103 95 32 24 322 100.0%
25
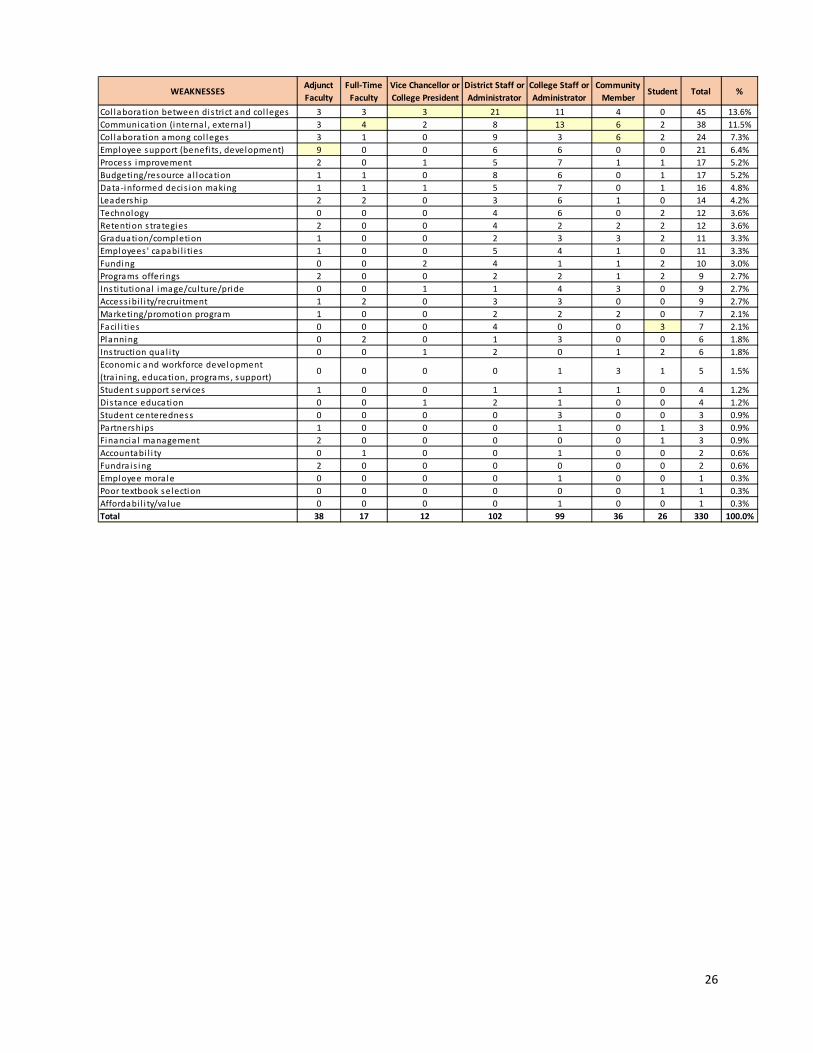
WEAKNESSESAdjunct Faculty
Full-Time Faculty
Vice Chancellor or College President
District Staff or Administrator
College Staff or Administrator
Community Member
Student Total %
Col laboration between dis trict and col leges 3 3 3 21 11 4 0 45 13.6%Communication (internal , external ) 3 4 2 8 13 6 2 38 11.5%Col laboration among col leges 3 1 0 9 3 6 2 24 7.3%Employee support (benefi ts , development) 9 0 0 6 6 0 0 21 6.4%Process improvement 2 0 1 5 7 1 1 17 5.2%Budgeting/resource a l location 1 1 0 8 6 0 1 17 5.2%Data-informed decis ion making 1 1 1 5 7 0 1 16 4.8%Leadership 2 2 0 3 6 1 0 14 4.2%Technology 0 0 0 4 6 0 2 12 3.6%Retention s trategies 2 0 0 4 2 2 2 12 3.6%Graduation/completion 1 0 0 2 3 3 2 11 3.3%Employees ' capabi l i ties 1 0 0 5 4 1 0 11 3.3%Funding 0 0 2 4 1 1 2 10 3.0%Programs offerings 2 0 0 2 2 1 2 9 2.7%Insti tutional image/cul ture/pride 0 0 1 1 4 3 0 9 2.7%Access ibi l i ty/recrui tment 1 2 0 3 3 0 0 9 2.7%Marketing/promotion program 1 0 0 2 2 2 0 7 2.1%Faci l i ties 0 0 0 4 0 0 3 7 2.1%Planning 0 2 0 1 3 0 0 6 1.8%Instruction qual i ty 0 0 1 2 0 1 2 6 1.8%Economic and workforce development (tra ining, education, programs, support)
0 0 0 0 1 3 1 5 1.5%
Student support services 1 0 0 1 1 1 0 4 1.2%Distance education 0 0 1 2 1 0 0 4 1.2%Student centeredness 0 0 0 0 3 0 0 3 0.9%Partnerships 1 0 0 0 1 0 1 3 0.9%Financia l management 2 0 0 0 0 0 1 3 0.9%Accountabi l i ty 0 1 0 0 1 0 0 2 0.6%Fundra is ing 2 0 0 0 0 0 0 2 0.6%Employee morale 0 0 0 0 1 0 0 1 0.3%Poor textbook selection 0 0 0 0 0 0 1 1 0.3%Affordabi l i ty/va lue 0 0 0 0 1 0 0 1 0.3%Total 38 17 12 102 99 36 26 330 100.0%
26

OPPORTUNITIESAdjunct Faculty
Full-Time Faculty
Vice Chancellor or College President
District Staff or Administrator
College Staff or Administrator
Community Member
Student Total %
Articulation agreements with four-year insti tutions
8 3 2 16 21 8 6 64 20.6%
Workforce needs (capi ta l i ze on workforce demands for emerging industry programs, tra ined/ski l led workers by exis ting and incoming industries/companies )
4 1 0 17 9 8 5 44 14.1%
Establ i sh/strengthen partnerships 2 3 2 11 10 6 3 37 11.9%Technology (demand for new technologies , dis tance education, etc.)
4 2 2 8 12 3 1 32 10.3%
Dual credi t program revenue increase 2 0 2 12 7 4 3 30 9.6%Annexation leading to increased enrol lment and revenue
4 0 2 13 8 1 0 28 9.0%
Demographic changes 5 0 1 5 8 3 0 22 7.1%Susta inabi l i ty trends 3 2 1 4 8 0 2 20 6.4%
Slow economy prompting higher enrol lments1 1 0 2 3 1 2 10 3.2%
Global ini tiatives 1 0 0 6 2 0 1 10 3.2%Socio-cul tura l changes 3 0 0 1 1 0 1 6 1.9%Pol i tica l changes 0 0 0 4 1 1 0 6 1.9%Establ i sh/strengthen partnerships2 0 0 0 0 2 0 0 2 0.6%Total 37 12 12 99 92 35 24 311 100.0%
THREATSAdjunct Faculty
Full-Time Faculty
Vice Chancellor or College President
District Staff or Administrator
College Staff or Administrator
Community Member
Student Total %
Funding reductions 6 4 4 22 18 1 0 55 17.2%High school misa l ignment with col leges 5 1 1 12 15 9 5 48 15.0%Student/ci ti zen i ssues (poor preparation, i l l i teracy, LEP)
8 0 0 8 7 6 3 32 10.0%
Competi tion from other higher education insti tutions
2 2 2 6 13 4 1 30 9.4%
Accredi tation requirements 3 1 0 7 11 1 2 25 7.8%Community's disengagement/complacency 2 1 0 8 6 4 1 22 6.9%Community's negative image about community col leges
0 2 0 6 5 3 2 18 5.6%
Accountabi l i ty requirements 4 1 0 7 2 3 0 17 5.3%Legal/regulatory changes 1 1 1 2 5 0 0 10 3.1%Inflation/cost of l iving 0 0 0 3 3 1 3 10 3.1%Technology changes 0 1 0 4 3 1 1 10 3.1%Economic downturn 4 0 0 1 1 1 1 8 2.5%Poverty 1 0 1 2 1 0 1 6 1.9%High school dropout rates 0 0 0 1 2 1 2 6 1.9%Limited Nurs ing/Al l ied Heal th instructor ava i labi l i ty
1 1 0 1 0 1 1 5 1.6%
Population growth 0 0 0 0 3 0 1 4 1.3%Global i zation 1 0 0 3 0 0 0 4 1.3%Pol i tica l changes 1 0 0 2 0 0 0 3 0.9%Lawsuits and bad press 0 0 1 1 1 0 0 3 0.9%Demographic changes 0 0 0 1 2 0 0 3 0.9%Alternative energy i ssues 0 0 0 0 0 0 0 0 0.0%Total 39 15 10 97 98 36 24 319 100.0%
27
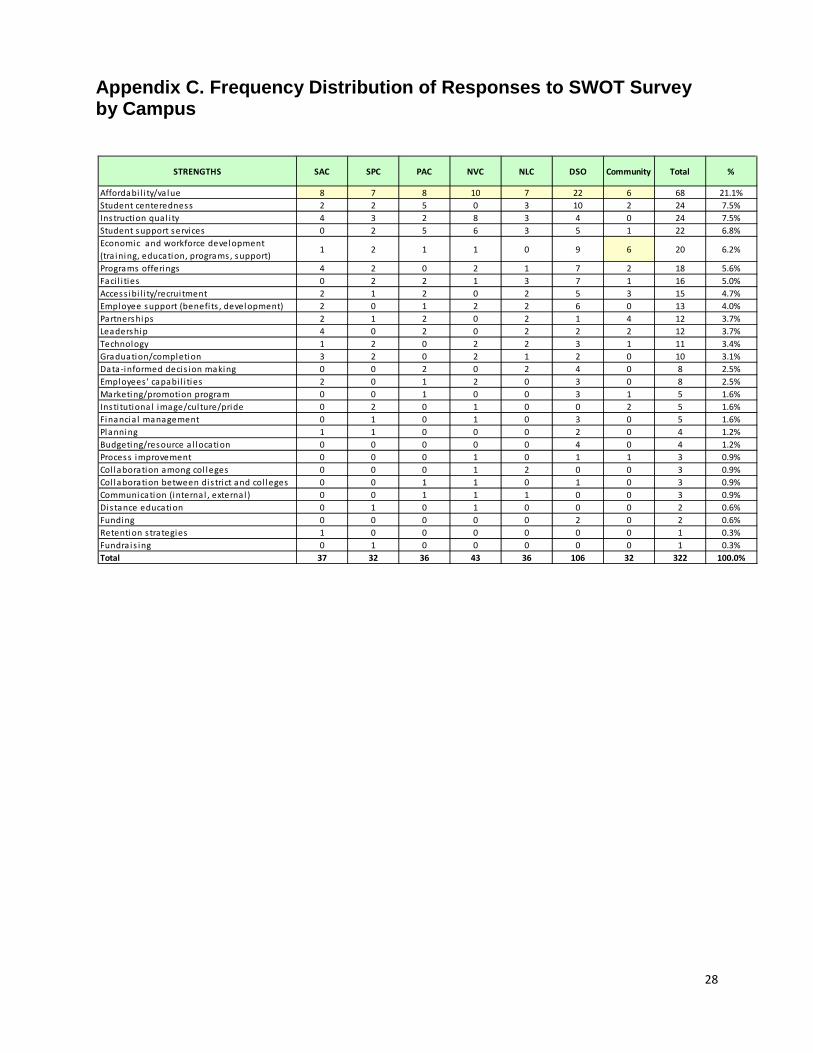
Appendix C. Frequency Distribution of Responses to SWOT Survey by Campus
STRENGTHS SAC SPC PAC NVC NLC DSO Community Total %
Affordabi l i ty/va lue 8 7 8 10 7 22 6 68 21.1%Student centeredness 2 2 5 0 3 10 2 24 7.5%Instruction qual i ty 4 3 2 8 3 4 0 24 7.5%Student support services 0 2 5 6 3 5 1 22 6.8%Economic and workforce development (tra ining, education, programs, support)
1 2 1 1 0 9 6 20 6.2%
Programs offerings 4 2 0 2 1 7 2 18 5.6%Faci l i ties 0 2 2 1 3 7 1 16 5.0%Access ibi l i ty/recrui tment 2 1 2 0 2 5 3 15 4.7%Employee support (benefi ts , development) 2 0 1 2 2 6 0 13 4.0%Partnerships 2 1 2 0 2 1 4 12 3.7%Leadership 4 0 2 0 2 2 2 12 3.7%Technology 1 2 0 2 2 3 1 11 3.4%Graduation/completion 3 2 0 2 1 2 0 10 3.1%Data-informed decis ion making 0 0 2 0 2 4 0 8 2.5%Employees ' capabi l i ties 2 0 1 2 0 3 0 8 2.5%Marketing/promotion program 0 0 1 0 0 3 1 5 1.6%Insti tutional image/cul ture/pride 0 2 0 1 0 0 2 5 1.6%Financia l management 0 1 0 1 0 3 0 5 1.6%Planning 1 1 0 0 0 2 0 4 1.2%Budgeting/resource a l location 0 0 0 0 0 4 0 4 1.2%Process improvement 0 0 0 1 0 1 1 3 0.9%Col laboration among col leges 0 0 0 1 2 0 0 3 0.9%Col laboration between dis trict and col leges 0 0 1 1 0 1 0 3 0.9%Communication (internal , external ) 0 0 1 1 1 0 0 3 0.9%Distance education 0 1 0 1 0 0 0 2 0.6%Funding 0 0 0 0 0 2 0 2 0.6%Retention s trategies 1 0 0 0 0 0 0 1 0.3%Fundra is ing 0 1 0 0 0 0 0 1 0.3%Total 37 32 36 43 36 106 32 322 100.0%
28

WEAKNESSES SAC SPC PAC NVC NLC DSO Community Total %
Col laboration between dis trict and col leges 3 5 3 5 4 21 4 45 13.6%Communication (internal , external ) 5 6 3 6 3 9 6 38 11.5%Col laboration among col leges 1 0 0 2 6 9 6 24 7.3%Employee support (benefi ts , development) 3 0 4 3 5 6 0 21 6.4%Process improvement 2 2 1 4 2 5 1 17 5.2%Budgeting/resource a l location 4 1 2 1 1 8 0 17 5.2%Data-informed decis ion making 4 1 5 1 0 5 0 16 4.8%Leadership 1 4 1 3 1 3 1 14 4.2%Technology 0 1 3 2 2 4 0 12 3.6%Retention s trategies 2 0 0 3 1 4 2 12 3.6%Graduation/completion 0 0 2 2 2 2 3 11 3.3%Employees ' capabi l i ties 3 2 0 0 0 5 1 11 3.3%Funding 1 1 0 1 1 5 1 10 3.0%Programs offerings 0 1 3 2 1 1 1 9 2.7%Insti tutional image/cul ture/pride 2 2 0 0 0 2 3 9 2.7%Access ibi l i ty/recrui tment 2 1 1 2 0 3 0 9 2.7%Marketing/promotion program 1 0 1 0 1 2 2 7 2.1%Faci l i ties 1 1 1 0 0 4 0 7 2.1%Planning 1 0 3 1 0 1 0 6 1.8%Instruction qual i ty 0 0 2 1 0 2 1 6 1.8%Economic and workforce development (tra ining, education, programs, support)
0 1 1 0 0 0 3 5 1.5%
Student support services 0 0 0 1 1 1 1 4 1.2%Distance education 0 1 0 0 0 3 0 4 1.2%Student centeredness 0 1 0 2 0 0 0 3 0.9%Partnerships 0 0 0 2 1 0 0 3 0.9%Financia l management 0 0 0 1 2 0 0 3 0.9%Accountabi l i ty 2 0 0 0 0 0 0 2 0.6%Fundra is ing 1 0 0 1 0 0 0 2 0.6%Employee morale 0 0 0 0 1 0 0 1 0.3%Poor textbook selection 0 0 0 1 0 0 0 1 0.3%Affordabi l i ty/va lue 0 1 0 0 0 0 0 1 0.3%Total 39 32 36 47 35 105 36 330 100.0%
29

OPPORTUNITIES SAC SPC PAC NVC NLC DSO Community Total %
Articulation agreements with four-year insti tutions
10 7 8 11 4 16 8 64 20.6%
Workforce needs (capi ta l i ze on workforce demands for emerging industry programs, tra ined/ski l led workers by exis ting and incoming industries/companies )
3 2 4 4 6 17 8 44 14.1%
Establ i sh/strengthen partnerships 6 1 5 5 3 11 6 37 11.9%Technology (demand for new technologies , dis tance education, etc.)
3 6 4 3 3 10 3 32 10.3%
Dual credi t program revenue increase 2 2 5 3 2 12 4 30 9.6%Annexation leading to increased enrol lment and revenue
3 1 2 5 2 14 1 28 9.0%
Demographic changes 3 1 4 1 5 5 3 22 7.1%Susta inabi l i ty trends 2 3 4 5 2 4 0 20 6.4%Slow economy prompting higher enrol lments 2 1 0 2 2 2 1 10 3.2%Global ini tiatives 0 1 0 2 1 6 0 10 3.2%Socio-cul tura l changes 1 1 0 1 2 1 0 6 1.9%Pol i tica l changes 0 0 0 1 0 4 1 6 1.9%Establ i sh/strengthen partnerships 0 1 0 0 1 0 0 2 0.6%Total 35 27 36 43 33 102 35 311 100.0%
THREATS SAC SPC PAC NVC NLC DSO Community Total %
Funding reductions 8 4 5 7 6 24 1 55 17.2%High school misa l ignment with col leges 5 6 6 7 3 12 9 48 15.0%Student/ci ti zen i ssues (poor preparation, i l l i teracy, LEP)
4 2 1 6 5 8 6 32 10.0%
Competi tion from other higher education insti tutions
3 3 6 7 2 5 4 30 9.4%
Accredi tation requirements 2 2 4 4 5 7 1 25 7.8%Community's disengagement/complacency 3 1 1 3 2 8 4 22 6.9%Community's negative image about community col leges
3 2 2 3 0 5 3 18 5.6%
Accountabi l i ty requirements 2 1 1 0 3 7 3 17 5.3%Legal/regulatory changes 2 2 3 1 0 2 0 10 3.1%Inflation/cost of l iving 2 1 0 0 3 3 1 10 3.1%Technology changes 0 3 2 0 0 4 1 10 3.1%Economic downturn 2 1 0 2 1 1 1 8 2.5%Poverty 1 0 1 0 1 3 0 6 1.9%High school dropout rates 0 1 2 0 1 1 1 6 1.9%Limited Nurs ing/Al l ied Heal th instructor ava i labi l i ty
1 1 0 1 0 1 1 5 1.6%
Population growth 0 0 0 2 2 0 0 4 1.3%Global i zation 0 0 0 1 0 3 0 4 1.3%Pol i tica l changes 0 1 0 0 0 2 0 3 0.9%Lawsuits and bad press 0 0 0 1 1 1 0 3 0.9%Demographic changes 0 1 0 0 1 1 0 3 0.9%Alternative energy i ssues 0 0 0 0 0 0 0 0 0.0%Total 38 32 34 45 36 98 36 319 100.0%
30

Appendix D. Frequency Distribution of Responses to Priorities by Stakeholder Category
WHAT AC MUST ADDRESSAdjunct Faculty
Full-Time Faculty
Vice Chancellor or College President
District Staff or Administrator
College Staff or Administrator
Community Member
Student Total %
Leadership Issues (inclus iveness , top-down decis ion making, trust)
4 3 2 4 10 1 1 25 22.5%
Personnel Is sues (capaci ty, capabi l i ty, resources , mora le, hi ring)
1 0 0 9 6 0 2 18 16.2%
Budgeting/Funding 0 0 1 6 2 0 2 11 9.9%Col laboration/Coordination 2 0 1 2 2 3 0 10 9.0%Recrui tment/Enrol lment 1 1 0 2 4 0 1 9 8.1%Compensation 3 0 0 3 1 0 0 7 6.3%Accountabi l i ty 2 1 0 1 1 0 0 5 4.5%Completion/Graduation 0 0 0 1 1 2 1 5 4.5%Process Improvement/Student Support Services
0 0 0 1 3 1 0 5 4.5%
Communication 0 1 0 0 0 2 1 4 3.6%Innovation 0 0 0 1 2 1 0 4 3.6%Employee Development 0 0 0 2 0 0 1 3 2.7%Retention 0 0 0 1 0 1 0 2 1.8%New-Ini tiative Issues 0 0 0 0 0 1 0 1 0.9%Technology Issues 0 0 0 1 0 0 0 1 0.9%Accreditation i ssues 0 0 0 0 1 0 0 1 0.9%Total 13 6 4 34 33 12 9 111 100.0%
WHAT AC MUST PRESERVEAdjunct Faculty
Full-Time Faculty
Vice Chancellor or College President
District Staff or Administrator
College Staff or Administrator
Community Member
Student Total %
Affordabi l i ty 2 0 0 5 5 4 3 19 17.4%Student-Centered Focus 0 2 1 8 7 1 0 19 17.4%Qual i ty Education 4 2 1 4 4 2 1 18 16.5%Access ibi l i ty 0 0 2 5 3 1 0 11 10.1%Col lege Cul tures/Autonomy 0 0 0 2 7 1 0 10 9.2%Faculty (autonomy, divers i ty, support) 3 1 0 1 2 0 0 7 6.4%Employee Development/Benefi ts 0 0 0 3 3 0 0 6 5.5%Col lege Col laboration/Communication 0 0 0 1 2 2 0 5 4.6%Program/Course Offerings 0 0 0 2 0 1 1 4 3.7%Image/Integri ty 1 0 0 1 0 0 1 3 2.8%Smal l Class Sizes 2 0 0 0 0 0 1 3 2.8%Vis ion/Miss ion/Values/Alamo Way 0 0 0 1 0 0 1 2 1.8%Community Commitment/Outreach 1 0 0 0 0 0 0 1 0.9%Services 0 0 0 1 0 0 0 1 0.9%Leadership Opportuni ties 0 0 0 0 0 0 0 0 0.0%Total 13 5 4 34 33 12 8 109 100.0%
31
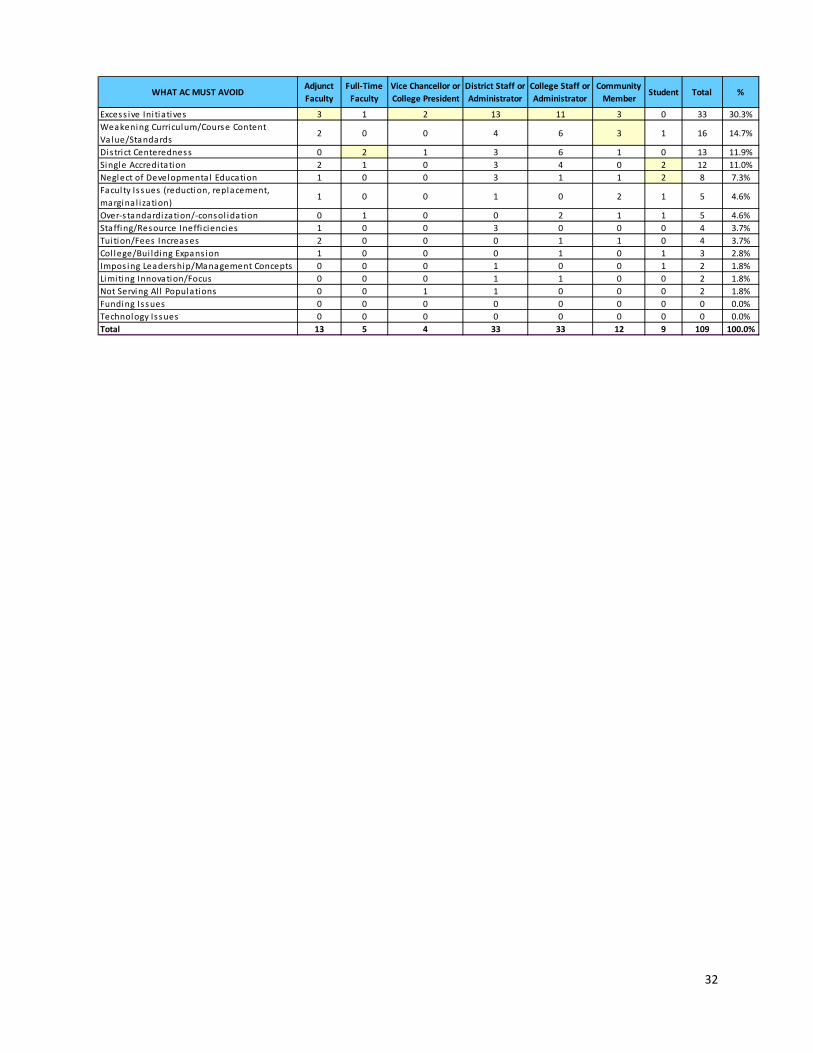
WHAT AC MUST AVOIDAdjunct Faculty
Full-Time Faculty
Vice Chancellor or College President
District Staff or Administrator
College Staff or Administrator
Community Member
Student Total %
Excess ive Ini tiatives 3 1 2 13 11 3 0 33 30.3%Weakening Curriculum/Course Content Va lue/Standards
2 0 0 4 6 3 1 16 14.7%
District Centeredness 0 2 1 3 6 1 0 13 11.9%Single Accredi tation 2 1 0 3 4 0 2 12 11.0%Neglect of Developmenta l Education 1 0 0 3 1 1 2 8 7.3%Faculty Issues (reduction, replacement, margina l i zation)
1 0 0 1 0 2 1 5 4.6%
Over-s tandardization/-consol idation 0 1 0 0 2 1 1 5 4.6%Staffing/Resource Inefficiencies 1 0 0 3 0 0 0 4 3.7%Tuition/Fees Increases 2 0 0 0 1 1 0 4 3.7%Col lege/Bui lding Expans ion 1 0 0 0 1 0 1 3 2.8%Impos ing Leadership/Management Concepts 0 0 0 1 0 0 1 2 1.8%Limiting Innovation/Focus 0 0 0 1 1 0 0 2 1.8%Not Serving Al l Populations 0 0 1 1 0 0 0 2 1.8%Funding Issues 0 0 0 0 0 0 0 0 0.0%Technology Issues 0 0 0 0 0 0 0 0 0.0%Total 13 5 4 33 33 12 9 109 100.0%
32

Appendix E. Frequency Distribution of Responses to Priorities by Campus
WHAT AC MUST ADDRESS SAC SPC PAC NVC NLC DSO Community Total %
Leadership Issues (inclus iveness , top-down decis ion making, trust)
3 5 3 7 2 4 1 25 22.5%
Personnel Is sues (capaci ty, capabi l i ty, resources , mora le, hi ring)
1 2 0 2 4 9 0 18 16.2%
Budgeting/Funding 1 1 2 0 0 7 0 11 9.9%Col laboration/Coordination 0 0 1 2 2 2 3 10 9.0%Recrui tment/Enrol lment 4 0 3 0 0 2 0 9 8.1%Compensation 0 0 0 3 1 3 0 7 6.3%Accountabi l i ty 0 2 1 1 0 1 0 5 4.5%Completion/Graduation 0 0 1 0 1 1 2 5 4.5%Process Improvement/Student Support Services
1 0 1 0 1 1 1 5 4.5%
Communication 1 0 0 0 1 0 2 4 3.6%Innovation 0 1 0 1 0 1 1 4 3.6%Employee Development 1 0 0 0 0 2 0 3 2.7%Retention 0 0 0 0 0 1 1 2 1.8%New-Ini tiative Issues 0 0 0 0 0 0 1 1 0.9%Technology Issues 0 0 0 0 0 1 0 1 0.9%Accreditation i ssues 1 0 0 0 0 0 0 1 0.9%Total 13 11 12 16 12 35 12 111 100.0%
WHAT AC MUST PRESERVE SAC SPC PAC NVC NLC DSO Community Total %
Affordabi l i ty 3 1 1 1 4 5 4 19 17.4%Student-Centered Focus 1 2 2 3 1 9 1 19 17.4%Qual i ty Education 4 1 2 4 0 5 2 18 16.5%Access ibi l i ty 0 0 3 1 1 5 1 11 10.1%Col lege Cul tures/Autonomy 0 4 1 2 0 2 1 10 9.2%Faculty (autonomy, divers i ty, support) 3 1 0 0 2 1 0 7 6.4%Employee Development/Benefi ts 1 1 1 0 0 3 0 6 5.5%Col lege Col laboration/Communication 0 0 0 0 2 1 2 5 4.6%Program/Course Offerings 0 0 1 1 0 1 1 4 3.7%Image/Integri ty 0 0 1 0 1 1 0 3 2.8%Smal l Class Sizes 1 0 0 1 1 0 0 3 2.8%Vis ion/Miss ion/Values/Alamo Way 0 1 0 0 0 1 0 2 1.8%Community Commitment/Outreach 0 0 0 1 0 0 0 1 0.9%Services 0 0 0 0 0 1 0 1 0.9%Leadership Opportuni ties 0 0 0 0 0 0 0 0 0.0%Total 13 11 12 14 12 35 12 109 100.0%
33

WHAT AC MUST AVOID SAC SPC PAC NVC NLC DSO Community Total %
Excess ive Ini tiatives 3 2 5 3 3 14 3 33 30.3%Weakening Curriculum/Course Content Va lue/Standards
2 1 2 2 2 4 3 16 14.7%
District Centeredness 2 1 1 3 2 3 1 13 11.9%Single Accredi tation 2 5 1 1 0 3 0 12 11.0%Neglect of Developmenta l Education 1 1 0 2 0 3 1 8 7.3%Faculty Issues (reduction, replacement, margina l i zation)
0 0 0 0 2 1 2 5 4.6%
Over-s tandardization/-consol idation 1 0 1 2 0 0 1 5 4.6%Staffing/Resource Inefficiencies 0 0 0 0 1 3 0 4 3.7%Tuition/Fees Increases 1 0 0 1 1 0 1 4 3.7%Col lege/Bui lding Expans ion 0 0 1 2 0 0 0 3 2.8%Impos ing Leadership/Management Concepts 1 0 0 0 0 1 0 2 1.8%Limiting Innovation/Focus 0 0 0 0 1 1 0 2 1.8%Not Serving Al l Populations 0 0 0 0 0 2 0 2 1.8%Funding Issues 0 0 0 0 0 0 0 0 0.0%Technology Issues 0 0 0 0 0 0 0 0 0.0%Total 13 10 11 16 12 35 12 109 100.0%
34

Appendix F. Frequency Distribution of Responses to Competitive Factors by Stakeholder Category
WHAT AC DOES BETTER THAN COMPETITORSAdjunct Faculty
Full-Time Faculty
Vice Chancellor or College President
District Staff or Administrator
College Staff or Administrator
Community Member
Student Total %
Affordabi l i ty 7 5 1 23 16 8 7 67 23.3%Access ibi l i ty 2 1 2 13 10 3 1 32 11.1%Smal l Classes 8 2 0 3 9 2 5 29 10.1%Dual Credi t 2 1 1 8 7 6 0 25 8.7%Workforce Development/Technica l Programs 2 0 1 8 5 7 1 24 8.4%Value 3 0 3 9 4 1 1 21 7.3%Qual i ty Education 3 1 0 4 9 1 1 19 6.6%Student Centeredness 2 3 1 5 5 0 2 18 6.3%Student Support/Services 2 1 0 3 6 0 3 15 5.2%Partnerships 1 0 1 2 5 2 1 12 4.2%Community Outreach/Support 0 0 0 2 5 1 1 9 3.1%Flexibi l i ty/Agi l i ty 1 0 0 3 2 1 0 7 2.4%Program/Courses Variety 3 0 0 1 0 2 1 7 2.4%Employee/facul ty support 0 0 0 0 1 0 0 1 0.3%Innovation 0 0 0 1 0 0 0 1 0.3%Total 36 14 10 85 84 34 24 287 100.0%
WHAT COMPETITORS DO BETTER THAN ACAdjunct Faculty
Full-Time Faculty
Vice Chancellor or College President
District Staff or Administrator
College Staff or Administrator
Community Member
Student Total %
Image/Prestige 12 1 2 15 14 7 2 53 19.9%Fundra is ing/Alumni Support 4 0 1 12 12 6 3 38 14.3%Marketing 4 3 2 7 13 3 2 34 12.8%Employee/Facul ty Support 5 2 1 9 9 1 1 28 10.5%Completion/Graduation 2 0 0 9 7 3 4 25 9.4%Program/Courses Variety 3 1 1 3 5 0 5 18 6.8%Processes 0 1 0 9 5 1 0 16 6.0%Student Support/Services 0 0 0 6 4 2 2 14 5.3%Qual i ty Education 3 0 1 6 1 1 1 13 4.9%Student Retention 0 0 0 4 4 1 3 12 4.5%Innovation 0 2 0 1 4 2 1 10 3.8%Internships 0 0 0 0 1 1 0 2 0.8%Student Centeredness 0 0 0 1 0 0 0 1 0.4%Uti l i zation of human resources 0 1 0 0 0 0 0 1 0.4%Employee compensation 0 0 0 1 0 0 0 1 0.4%Total 33 11 8 83 79 28 24 266 100.0%
35

Appendix G. Frequency Distribution of Responses to Competitive Factors by Campus
WHAT AC DOES BETTER THAN COMPETITORS SAC SPC PAC NVC NLC DSO Community Total %
Affordabi l i ty 9 7 5 8 7 23 8 67 23.3%Access ibi l i ty 4 3 2 1 5 14 3 32 11.1%Smal l Classes 7 3 0 8 6 3 2 29 10.1%Dual Credi t 0 3 2 6 1 7 6 25 8.7%Workforce Development/Technica l Programs 1 1 2 4 0 9 7 24 8.4%Value 3 1 0 3 2 11 1 21 7.3%Qual i ty Education 2 1 2 5 4 4 1 19 6.6%Student Centeredness 1 3 4 3 1 6 0 18 6.3%Student Support/Services 0 5 4 2 1 3 0 15 5.2%Partnerships 3 1 3 0 1 2 2 12 4.2%Community Outreach/Support 1 0 3 0 2 2 1 9 3.1%Flexibi l i ty/Agi l i ty 2 0 2 0 0 2 1 7 2.4%Program/Courses Variety 0 0 1 2 1 1 2 7 2.4%Employee/facul ty support 1 0 0 0 0 0 0 1 0.3%Innovation 0 0 0 0 0 1 0 1 0.3%Total 34 28 30 42 31 88 34 287 100.0%
WHAT COMPETITORS DO BETTER THAN AC SAC SPC PAC NVC NLC DSO Community Total %
Image/Prestige 7 3 6 9 7 14 7 53 19.9%Fundra is ing/Alumni Support 4 3 4 3 6 12 6 38 14.3%Marketing 6 5 4 7 2 7 3 34 12.8%Employee/Facul ty Support 5 3 4 3 2 10 1 28 10.5%Completion/Graduation 3 4 3 1 3 8 3 25 9.4%Program/Courses Variety 2 2 5 4 2 3 0 18 6.8%Processes 2 1 2 1 0 9 1 16 6.0%Student Support/Services 1 0 0 2 3 6 2 14 5.3%Qual i ty Education 1 0 2 1 2 6 1 13 4.9%Student Retention 2 1 0 2 2 4 1 12 4.5%Innovation 1 2 0 3 1 1 2 10 3.8%Internships 0 0 0 1 0 0 1 2 0.8%Student Centeredness 0 0 0 0 0 1 0 1 0.4%Uti l i zation of human resources 0 1 0 0 0 0 0 1 0.4%Employee compensation 0 0 0 0 0 1 0 1 0.4%Total 34 25 30 37 30 82 28 266 100.0%
36

Appendix H. Comments Provided by Survey Respondents
Campus Stakeholder Category Comment
SAC College Staff or Administrator
We must increase accountability and be willing to let people go if they are not fulfilling their job responsibilities...after we have tried to develop them appropriately.
SAC Student While the Alamo Colleges is wonderful, there is some I wish I had the ability to pick more than one answer. We don't have to focus on one problem at a time. Departments already pick one of these initiatives; they should just be monitored better for actual results. The system will never be perfect, but this is a good step to helping as many students as possible.
SPC Adjunct Faculty Not sure how to put it but our greatest weakness/threat/challenge is the way the district's top leadership, including the Board, dismiss, disrespect, and disenfranchise the faculty. Trust is practically non-existent.
NVC Adjunct Faculty Construction of a child daycare center at NVC would provide an opportunity for more students to attend and be retained by NVC.
NVC College Staff or Administrator
It seems each option should be available for each item (ex: if a strength checkbox, should also be available as a weakness, if a better than others box, should also be a better than us option).
NVC Full-Time Faculty
Please base strategic planning on actual SWOT analysis at least partially. Last year the SWOT was posted and we only discussed the Institutes! No one at the table (including a high ranking district employee) or the table next to us had a proper and clear image of what the Institutes would be and we spent all day on how to promote it and advertise it to the community! There was a complete disconnect between the SWOT analysis and the actual planning! Please don’t dismiss your employees’ voices and concerns to fit an agenda because otherwise, what is the point?
NVC Student This survey only scratches the surface of the real problems. For example the lack of properly trained staff for emergencies or the inability for ADA access. Elevators that do not work for those who need them. Inability to select text books that do not have a good explanation of the material. A serious lack of tutors to help for STEM subjects. For some subjects and/or campuses too rely on multiple choice exams.
NLC Adjunct Faculty Most students have LOW reading comprehension which hinders the learning process in a college class. They have little historical frame of reference, so can't "connect the dots" in class discussions.
NLC Adjunct Faculty My perception is that faculty are very concerned about students being able to "pack” i.e. bring weapons on campus. If this occurs in any form, I will resign.
DSO District Staff or Administrator
Ask employees if they would rather attend a Covey or FOCUS PDCA session or have those funds used for raises or compensation. The priorities are wrong- take care of your employees first; bring the salaries to where they should be per the results of the Hays study (which also cost a lot of money). THEN spend money on these initiatives.
DSO District Staff or Administrator
In my opinion, the biggest risk to Alamo Colleges is the lack of critical skill sets to drive the process improvements and initiatives we are wanting. Our processes are wrought with inefficiencies and lack of communication between departments, which increases the frustration of our students and employees. Everyone seems to know what the problems are, but no one knows how to fix them. We have a tendency to move people around the district and put them in positions for which they are not qualified. At the same time, we can't attract people with the necessary skill sets because our pay ranges are so low we can't even get people to apply. We have archaic HR processes that do nothing to incentivize employees to perform. And there appears to be no accountability when goals or objectives are not met. Look at the admissions and enrollment processes. It has been broken for years and has caused an extreme amount of frustration for students. Yet, everyone just looks at the problem and points the finger at someone else or blames Banner. These are issues that no amount of 4DX and FOCUS PDCA training are going to fix. We need to get the right people with the right skill sets (at the right pay) to effectively drive change. Unfortunately, the politics of the organization will most likely prevent that.
37