Swimming fundamentals: turning performance of … · Zoology 114 (2011) 348–359 Contents lists...
12
Zoology 114 (2011) 348–359 Contents lists available at SciVerse ScienceDirect Zoology jou rnal h om epa g e: www . elsevier.de/zool Swimming fundamentals: turning performance of leopard sharks (Triakis semifasciata) is predicted by body shape and postural reconfiguration Marianne E. Porter a,∗ , Cassandra M. Roque b , John H. Long Jr. a a Biology Department, Vassar College, 124 Raymond Ave, Poughkeepsie, NY 12604, USA b Comparative and Evolutionary Physiology, Department of Ecology and Evolutionary Biology, 321 Steinhaus Hall, University of California, Irvine, 92697-2525, USA a r t i c l e i n f o Article history: Received 12 August 2010 Received in revised form 4 April 2011 Accepted 16 June 2011 Keywords: Body form Body posture Body bending Maneuverability Yaw turning a b s t r a c t Turns are essential maneuvers that sharks employ when foraging, feeding, and migrating. How well any individual performs in turning is determined, in part, by the static form and postural reconfigura- tion of its body. Since the importance of postural reconfiguration in determining turning performance is not well understood, our goal was to examine how body form and posture correlate with turning performance in juvenile leopard sharks, Triakis semifasciata. From videos of sharks turning laterally in yaw, performance was measured as turning radius, turning angle, angular speed of the head, and translational speed of the body along its path. Body form variables included the body’s length, mass, width, second moment of area, and mass moment of inertia. Postural variables included body- bending coefficient, body flexion at different longitudinal positions, and lag time between body flexion and turning of the center of rotation. Using step-wise linear regression followed by multiple regres- sion, each performance variable was regressed onto three pools of independent variables: (i) all form variables alone, (ii) all postural variables alone, and (iii) a combination of all form and postural vari- ables. From these correlations, it appears that turning performance may be controlled primarily by the magnitude and timing of the flexion of the body. In other words, sharks alter how they turn by changing the pattern in which they bend their bodies; the body acts as a dynamically reconfiguring rudder. © 2011 Elsevier GmbH. All rights reserved. 1. Introduction In animal locomotion, turns are fundamental components of the category of proximal behaviors called maneuvers. Maneuvers, in turn, are characterized mechanically by either translational and/or rotational accelerations of an animal’s center of mass (Webb, 2004). In fishes, maneuvers are caused by the forces and torques created by a body whose muscles interact with internal skeletal elements and external fluid, a coupled force system that together changes the body’s shape dynamically (Long, 1998; Long et al., 2002a). Changes in the shape of the body, seen as bending in body-caudal fin swim- mers (Webb, 1984), are particularly dramatic in turns, when rapid, asymmetric, and transient body bends maneuver fish in escape responses, feeding, foraging, mating, and migration (Webb and Fairchild, 2001; Wu and Wang, 2010). Our goal is to understand how variation in turning performance, measured by the movement of the fish in an external frame of reference, is related to body shape ∗ Corresponding author. Tel.: +1 845 437 7441; fax: +1 845 437 7315. E-mail address: [email protected] (M.E. Porter). and changes in body shape, measured as form and posture in an anatomical frame of reference. Body shape has three components (Long et al., 2010): (i) form, the static shape of the fish as if it were gliding and holding its body straight; (ii) posture, a type of transient shape change imposed on the static form that can be momentary, such as bending the body during a turn, or maintained, such as altering midline curvature or lateral amplitude at different steady swimming speeds (Long, 1995; Long et al., 2002b); and (iii) undulation, periodically repeating changes in body shape that create traveling waves of flexure, that are usually but not always propulsive, and that are overlaid on top of form and posture (Root et al., 2007). Each type of shape changes on a different time scale: form changes during development and evolution, posture changes over behavioral time, and undulation changes over propulsive time. This study focuses on how form and posture interact to modulate performance of turns in yaw. In a yaw turn, the fish rotates about an axis that is perpendic- ular to the horizontal plane. A yaw turn causes a change in the fish’s heading, where change in heading is the most efficient way to describe volitional movement, as demonstrated by stochastic differential modeling of Kuhlia mugil (Gautrais et al., 2009). More- over, the change in heading of fish-like robots is the key control 0944-2006/$ – see front matter © 2011 Elsevier GmbH. All rights reserved. doi:10.1016/j.zool.2011.06.001
Transcript of Swimming fundamentals: turning performance of … · Zoology 114 (2011) 348–359 Contents lists...

Ss
Ma
b
a
ARRA
KBBBMY
1
ctrIbabimarFho
0d
Zoology 114 (2011) 348– 359
Contents lists available at SciVerse ScienceDirect
Zoology
jou rna l h om epa g e: www . elsev ier .de /zool
wimming fundamentals: turning performance of leopard sharks (Triakisemifasciata) is predicted by body shape and postural reconfiguration
arianne E. Portera,∗, Cassandra M. Roqueb, John H. Long Jr. a
Biology Department, Vassar College, 124 Raymond Ave, Poughkeepsie, NY 12604, USAComparative and Evolutionary Physiology, Department of Ecology and Evolutionary Biology, 321 Steinhaus Hall, University of California, Irvine, 92697-2525, USA
r t i c l e i n f o
rticle history:eceived 12 August 2010eceived in revised form 4 April 2011ccepted 16 June 2011
eywords:ody formody postureody bendinganeuverability
aw turning
a b s t r a c t
Turns are essential maneuvers that sharks employ when foraging, feeding, and migrating. How wellany individual performs in turning is determined, in part, by the static form and postural reconfigura-tion of its body. Since the importance of postural reconfiguration in determining turning performanceis not well understood, our goal was to examine how body form and posture correlate with turningperformance in juvenile leopard sharks, Triakis semifasciata. From videos of sharks turning laterallyin yaw, performance was measured as turning radius, turning angle, angular speed of the head,and translational speed of the body along its path. Body form variables included the body’s length,mass, width, second moment of area, and mass moment of inertia. Postural variables included body-bending coefficient, body flexion at different longitudinal positions, and lag time between body flexionand turning of the center of rotation. Using step-wise linear regression followed by multiple regres-
sion, each performance variable was regressed onto three pools of independent variables: (i) all formvariables alone, (ii) all postural variables alone, and (iii) a combination of all form and postural vari-ables. From these correlations, it appears that turning performance may be controlled primarily bythe magnitude and timing of the flexion of the body. In other words, sharks alter how they turn bychanging the pattern in which they bend their bodies; the body acts as a dynamically reconfiguringrudder.© 2011 Elsevier GmbH. All rights reserved.
. Introduction
In animal locomotion, turns are fundamental components of theategory of proximal behaviors called maneuvers. Maneuvers, inurn, are characterized mechanically by either translational and/orotational accelerations of an animal’s center of mass (Webb, 2004).n fishes, maneuvers are caused by the forces and torques createdy a body whose muscles interact with internal skeletal elementsnd external fluid, a coupled force system that together changes theody’s shape dynamically (Long, 1998; Long et al., 2002a). Changes
n the shape of the body, seen as bending in body-caudal fin swim-ers (Webb, 1984), are particularly dramatic in turns, when rapid,
symmetric, and transient body bends maneuver fish in escapeesponses, feeding, foraging, mating, and migration (Webb andairchild, 2001; Wu and Wang, 2010). Our goal is to understand
ow variation in turning performance, measured by the movementf the fish in an external frame of reference, is related to body shape∗ Corresponding author. Tel.: +1 845 437 7441; fax: +1 845 437 7315.E-mail address: [email protected] (M.E. Porter).
944-2006/$ – see front matter © 2011 Elsevier GmbH. All rights reserved.oi:10.1016/j.zool.2011.06.001
and changes in body shape, measured as form and posture in ananatomical frame of reference.
Body shape has three components (Long et al., 2010): (i) form,the static shape of the fish as if it were gliding and holding its bodystraight; (ii) posture, a type of transient shape change imposed onthe static form that can be momentary, such as bending the bodyduring a turn, or maintained, such as altering midline curvatureor lateral amplitude at different steady swimming speeds (Long,1995; Long et al., 2002b); and (iii) undulation, periodically repeatingchanges in body shape that create traveling waves of flexure, thatare usually but not always propulsive, and that are overlaid on topof form and posture (Root et al., 2007). Each type of shape changeson a different time scale: form changes during development andevolution, posture changes over behavioral time, and undulationchanges over propulsive time. This study focuses on how form andposture interact to modulate performance of turns in yaw.
In a yaw turn, the fish rotates about an axis that is perpendic-ular to the horizontal plane. A yaw turn causes a change in the
fish’s heading, where change in heading is the most efficient wayto describe volitional movement, as demonstrated by stochasticdifferential modeling of Kuhlia mugil (Gautrais et al., 2009). More-over, the change in heading of fish-like robots is the key control
ology 114 (2011) 348– 359 349
veoahlitt
tcttotrpsbtf
2
2
fitvts
iAeaada
tctsfisa
mau(fiob
staSdoft
Fig. 1. Screening and analysis of volitional yaw turns in the leopard shark, Tri-akis semifasciata. (A) A total of 118 turns from 9 individuals were videotaped andscreened. The turns with each individual’s maximal bending coefficient, Bb , wereselected for analysis (n = 9). The asterisk indicates the mean value of Bb for all trials.(B) Each turn was analyzed by first manually digitizing seven points on the bodybeginning 1 s before the turn and ending after the turn was complete. Every shark
M.E. Porter et al. / Zo
ariable for orientation to and navigation up light gradients (Longt al., 2004). The speed of the heading change is used as a measuref agility in fish (Walker, 2000). Explosive changes in heading char-cterize the yaw-based escape maneuvers in fish and are linkedydromechanically, via momentum flux of the bending body, to
ocomotor performance (Tytell and Lauder, 2008). Change in head-ng can be controlled by the bending of the body (Porter et al., 2009),he motion of the caudal fin (Nguyen et al., 2009), or the motion ofhe head (Wu et al., 2008; Wu and Wang, 2010).
What remains to be understood is if changes in posture, such ashe posture characterized during yaw turns by the body-bendingoefficient (Bb) which is derived from the simple ratio of the snout-o-tail chord length and the total length of the body, can predicturning performance (Fish et al., 2003). In sharks, form (morphol-gy) of the vertebral column and body predict the magnitude ofhe change in posture, Bb (Porter et al., 2009). Based on this cor-elation, we hypothesized that form and posture control turningerformance, where turning performance is measured by variablesuch as turning radius, angular head speed, angular change in theody’s center of rotation, and on-path speed of the body. To testhis prediction, we examined the routine, volitional yaw turns inreely swimming leopard sharks, T. semifasciata.
. Materials and methods
.1. Study animals and videotaping
Nine captive leopard sharks, T. semifasciata (Triakidae), werelmed on video. They varied in total body length (Lb) from 25.3o 48.5 cm (Table 1). The distribution of Lb is not normal, with indi-iduals clustering at the ends of the distribution; however, givenhat we were correlating variation in body shape with variation inwimming performance, we opted to use the entire size range.
Sharks were housed and maintained by staff at the Santa Mon-ca Pier Aquarium, Santa Monica, CA, USA. The Santa Monica Pierquarium Director and Head of Animal Husbandry approved thesexperiments. Filming of sharks took place at the aquarium, andquarium staff transferred the animals to and from the holdingnd filming tanks. We were interested in routine turning so weid not elicit startle responses. Animals were filmed immediatelyfter placement into the filming tank.
The filming tank had a footprint of 100 cm × 65 cm and was filledo a depth of 33 cm. The size of the tank and depth of the water werehosen to permit the sharks to swim freely and, at the same time,o encounter walls regularly. Without provocation, sharks routinelywam towards a wall and then turned abruptly. Each individual waslmed for a period lasting no longer than 15 min. Because the sharkswam volitionally, forward translational speed was not controllednd varied within and among individuals.
A video camera (Handycam HDR-HC5; Sony Corp., Tokyo, Japan)ounted 2 m above the tank recorded the free-swimming sharks
t 30 frames per second. The continuous recording for each individ-al was cut into multiple clips, each consisting of one turn in yawiMovie HD software, .mov format, 640 × 480 pixels, deinterlacedelds). A yaw turn was defined as a unidirectional, lateral motionf the head greater than 90◦, without pushing off the walls or theottom of the tank (Kajiura et al., 2003).
A total of 118 yaw turns were recorded (Fig. 1). From thisample we chose a single trial for each individual that exhibitedheir maximum body-bending coefficient (Bb; see Section 2.3 for
definition of this metric). Using LoggerPro version 4.0 (Vernieroftware & Technology, Beaverton, OR, USA), seven points on the
orsal midline of the body were manually digitized in each framef the sequence (Fig. 1). Anatomical landmarks were used for theollowing points: tip of rostrum (point 1), anterior margin of pec-oral fins (point 2), posterior margin of the pectoral fins (point 4),swam steadily, using body-caudal fin undulations, powering into the turn, whichwas unpowered. (C) The midline of the body, reconstructed in the frame shown in(B) from the digitized points, labeled from head (point 1) to tail (point 7).
middle of pelvic fin insertion (point 5), tip of caudal fin (point 7).In each frame, these five landmarks were digitized first, and thentwo points were placed midway between two landmarks: middleof the pectoral fins (point 3) and middle of the caudal region (point6). Digitizing began approximately 1 s before the initiation of theturn (Fig. 2A) to allow preparatory movements, if present, to beanalyzed.
Separately, we manually digitized body points (ImageJ software,NIH, USA) to measure the following morphological variables: totallength of the body (Lb; in cm), lateral distance between the pectoralfins, a measure of the width of the body (W; in cm). The finenessratio of the body (Fb) was calculated as the ratio of Lb to W (Porteret al., 2009).
All variable names, symbols, and units are listed in thesupplementary electronic Appendix A.
2.2. Kinematic analysis – performance variables
The first class of performance metrics used was based on thetranslational speed of a body point along its path before, during,and after a turn. For each point on each individual, its translational
−1
speed, U (cm s ), was measured using finite differences in dis-placement over time. The point with the lowest average U amongindividuals was used as the proxy for the bodies’ center of rota-tion (CR), since this was the point about which all other points
350 M.E. Porter et al. / Zoology 114 (2011) 348– 359
Fig. 2. Turning and turning performance. (A) Turning in yaw. Dorsal view of reconstructed midlines of individual 1 performing a volitional turn in yaw. Gray midlines indicatethe motion of the body prior to initiation of the turn. Colored and black midlines indicate the turn. The start of the turn (orange midline) can be defined by a number ofvariables, including the difference between the speed on the path of the rostrum, Ur , and the center of rotation, CR (see C), the angular speed of the head (see D), and theturning angle of the center of rotation (see Fig. 3A). Time of maximal flexion of the body is indicated by the red midline, when the most posterior joint is maximally flexedas measured by ˇ6, and by the blue midline, the time when the joint at the CR, point 3, is maximally flexed as measured by ˇ∗
3. The CR, point 3, is indicated on the coloredmidlines by the hollow circle. (B) The path of points on the midlines can be reconstructed and analyzed to quantify turning performance. The CR (pink line) is, by definition,the point on the body that undergoes the least average displacement among all individuals during the turn. Inset: Note that the CR moves to the left and then reversesdirection with a very small turning radius. The path of the tip of the rostrum (black line) also reverses direction, but with greater displacement and larger turning radius.The gray midlines between the CR and the tip of the rostrum indicate the yaw of the head. The path of the tip of the tail (gray line) does not reverse course in this analysiswindow, indicating, as shown by the midlines, that the shark has not resumed swimming. (C) Speed of the CR, Ucr (pink points), and the tip of the rostrum, Ur (black points),along their respective paths. During the turn, the speed of the two points deviates, with the rostrum traveling faster than the CR at almost all times. (D) The angular speed ofthe head in yaw, ω, is calculated as the rate of change in the angular position of the head. Note that most of the changes in the patterns of path and angular speed occur in awindow of approximately 1 s, from about 1 to 2 s. The example data shown here are from the turn of individual 3.
M.E. Porter et al. / Zoology 114 (2011) 348– 359 351
Table 1Body form of juvenile leopard sharks, Triakis semifasciata.
Shark Lb (cm) W (cm) Fb mb (kg) Ia (m4) CR PD k′E (m2) k′
b(m) Im (kg m2)
1 47.35 4.53 10.45 0.39 2.1E−07 3 0.235 9.2E−07 2.0E−06 0.00242 48.53 5.03 9.66 0.42 3.1E−07 2 0.26 1.3E−06 2.7E−06 0.00343 25.3 2.13 11.89 0.06 1.0E−08 3 0.28 1.5E−07 6.2E−07 0.00014 25.72 2.31 11.16 0.06 1.4E−08 3 0.27 2.1E−07 8.2E−07 0.00015 45.69 4.50 10.16 0.35 2.0E−07 4 0.24 9.6E−07 2.1E−06 0.00216 28.76 2.36 12.18 0.09 1.5E−08 2 0.27 1.9E−07 6.4E−07 0.00037 30.31 2.88 10.51 0.10 3.4E−08 4 0.26 3.7E−07 1.2E−06 0.00038 33.94 3.20 10.59 0.14 5.2E−08 4 0.27 4.5E−07 1.3E−06 0.00069 27.54 2.71 10.17 0.08 2.6E−08 3 0.265 3.5E−07 1.3E−06 0.0002
L area;s f iner
amVmovu(
aohats2aaiwa9t9t
tCCftvtg�ar(
2
Amacm(
I
Euler buckling, k′E (m2):
k′b = Ia
L3b
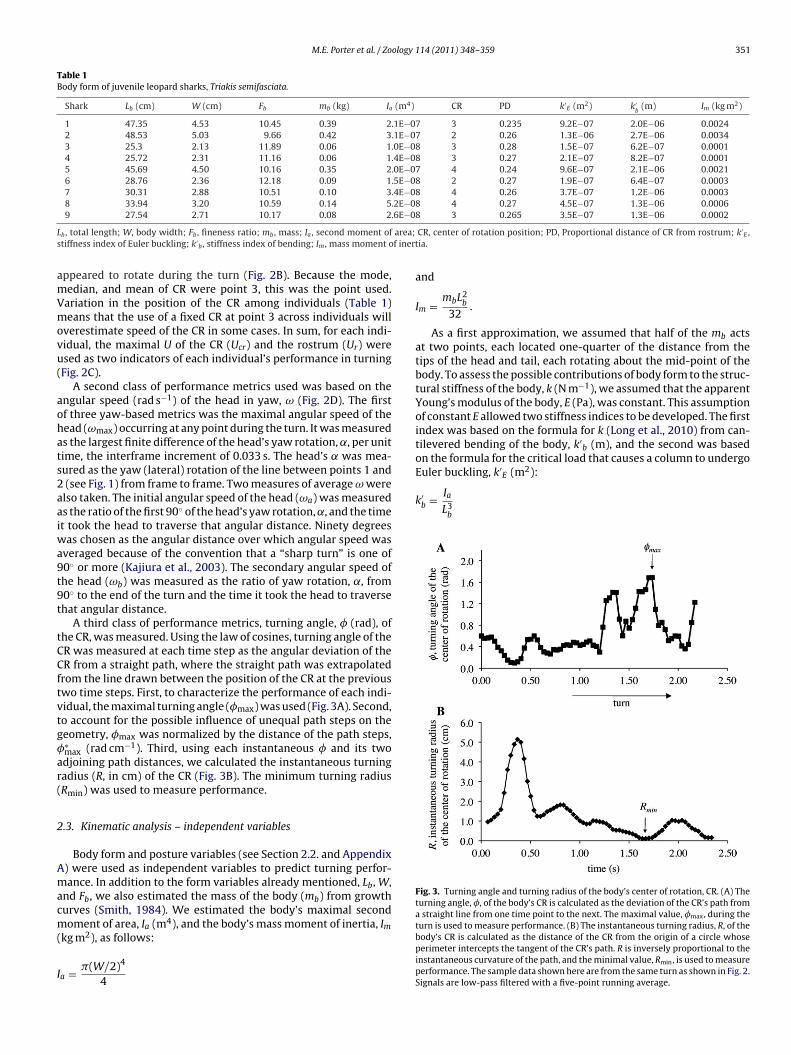
Fig. 3. Turning angle and turning radius of the body’s center of rotation, CR. (A) Theturning angle, �, of the body’s CR is calculated as the deviation of the CR’s path froma straight line from one time point to the next. The maximal value, �max, during theturn is used to measure performance. (B) The instantaneous turning radius, R, of the
b , total length; W, body width; Fb , fineness ratio; mb , mass; Ia , second moment oftiffness index of Euler buckling; k′
b , stiffness index of bending; Im , mass moment o
ppeared to rotate during the turn (Fig. 2B). Because the mode,edian, and mean of CR were point 3, this was the point used.ariation in the position of the CR among individuals (Table 1)eans that the use of a fixed CR at point 3 across individuals will
verestimate speed of the CR in some cases. In sum, for each indi-idual, the maximal U of the CR (Ucr) and the rostrum (Ur) weresed as two indicators of each individual’s performance in turningFig. 2C).
A second class of performance metrics used was based on thengular speed (rad s−1) of the head in yaw, ω (Fig. 2D). The firstf three yaw-based metrics was the maximal angular speed of theead (ωmax) occurring at any point during the turn. It was measureds the largest finite difference of the head’s yaw rotation, ˛, per unitime, the interframe increment of 0.033 s. The head’s ̨ was mea-ured as the yaw (lateral) rotation of the line between points 1 and
(see Fig. 1) from frame to frame. Two measures of average ω werelso taken. The initial angular speed of the head (ωa) was measureds the ratio of the first 90◦ of the head’s yaw rotation, ˛, and the timet took the head to traverse that angular distance. Ninety degrees
as chosen as the angular distance over which angular speed wasveraged because of the convention that a “sharp turn” is one of0◦ or more (Kajiura et al., 2003). The secondary angular speed ofhe head (ωb) was measured as the ratio of yaw rotation, ˛, from0◦ to the end of the turn and the time it took the head to traversehat angular distance.
A third class of performance metrics, turning angle, � (rad), ofhe CR, was measured. Using the law of cosines, turning angle of theR was measured at each time step as the angular deviation of theR from a straight path, where the straight path was extrapolated
rom the line drawn between the position of the CR at the previouswo time steps. First, to characterize the performance of each indi-idual, the maximal turning angle (�max) was used (Fig. 3A). Second,o account for the possible influence of unequal path steps on theeometry, �max was normalized by the distance of the path steps,∗max (rad cm−1). Third, using each instantaneous � and its twodjoining path distances, we calculated the instantaneous turningadius (R, in cm) of the CR (Fig. 3B). The minimum turning radiusRmin) was used to measure performance.
.3. Kinematic analysis – independent variables
Body form and posture variables (see Section 2.2. and Appendix) were used as independent variables to predict turning perfor-ance. In addition to the form variables already mentioned, Lb, W,
nd Fb, we also estimated the mass of the body (mb) from growthurves (Smith, 1984). We estimated the body’s maximal secondoment of area, Ia (m4), and the body’s mass moment of inertia, Im
kg m2), as follows:
a = �(W/2)4
4
CR, center of rotation position; PD, Proportional distance of CR from rostrum; k′E ,
tia.
and
Im = mbL2b
32.
As a first approximation, we assumed that half of the mb actsat two points, each located one-quarter of the distance from thetips of the head and tail, each rotating about the mid-point of thebody. To assess the possible contributions of body form to the struc-tural stiffness of the body, k (N m−1), we assumed that the apparentYoung’s modulus of the body, E (Pa), was constant. This assumptionof constant E allowed two stiffness indices to be developed. The firstindex was based on the formula for k (Long et al., 2010) from can-tilevered bending of the body, k′
b (m), and the second was basedon the formula for the critical load that causes a column to undergo
body’s CR is calculated as the distance of the CR from the origin of a circle whoseperimeter intercepts the tangent of the CR’s path. R is inversely proportional to theinstantaneous curvature of the path, and the minimal value, Rmin, is used to measureperformance. The sample data shown here are from the same turn as shown in Fig. 2.Signals are low-pass filtered with a five-point running average.
352 M.E. Porter et al. / Zoology 114 (2011) 348– 359
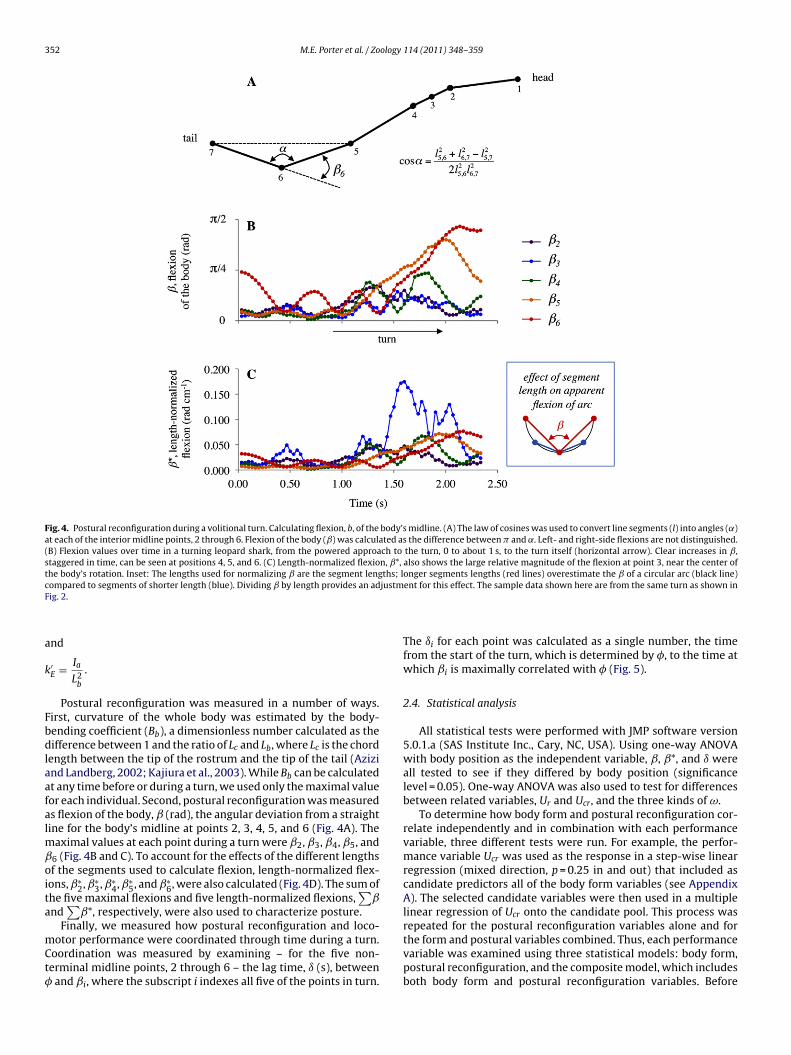
Fig. 4. Postural reconfiguration during a volitional turn. Calculating flexion, b, of the body’s midline. (A) The law of cosines was used to convert line segments (l) into angles (˛)at each of the interior midline points, 2 through 6. Flexion of the body (ˇ) was calculated as the difference between � and ˛. Left- and right-side flexions are not distinguished.(B) Flexion values over time in a turning leopard shark, from the powered approach to the turn, 0 to about 1 s, to the turn itself (horizontal arrow). Clear increases in ˇ,staggered in time, can be seen at positions 4, 5, and 6. (C) Length-normalized flexion, ˇ*, also shows the large relative magnitude of the flexion at point 3, near the center ofthe body’s rotation. Inset: The lengths used for normalizing ̌ are the segment lengths; longer segments lengths (red lines) overestimate the ̌ of a circular arc (black line)c justmF
a
k
Fbdlaafalmˇoita
mCt�
ompared to segments of shorter length (blue). Dividing ̌ by length provides an adig. 2.
nd
′E = Ia
L2b
.
Postural reconfiguration was measured in a number of ways.irst, curvature of the whole body was estimated by the body-ending coefficient (Bb), a dimensionless number calculated as theifference between 1 and the ratio of Lc and Lb, where Lc is the chord
ength between the tip of the rostrum and the tip of the tail (Azizind Landberg, 2002; Kajiura et al., 2003). While Bb can be calculatedt any time before or during a turn, we used only the maximal valueor each individual. Second, postural reconfiguration was measureds flexion of the body, ̌ (rad), the angular deviation from a straightine for the body’s midline at points 2, 3, 4, 5, and 6 (Fig. 4A). The
aximal values at each point during a turn were ˇ2, ˇ3, ˇ4, ˇ5, and6 (Fig. 4B and C). To account for the effects of the different lengthsf the segments used to calculate flexion, length-normalized flex-ons, ˇ∗
2, ˇ∗3, ˇ∗
4, ˇ∗5, and ˇ∗
6, were also calculated (Fig. 4D). The sum ofhe five maximal flexions and five length-normalized flexions,
∑ˇ
nd∑
ˇ*, respectively, were also used to characterize posture.Finally, we measured how postural reconfiguration and loco-
otor performance were coordinated through time during a turn.oordination was measured by examining – for the five non-erminal midline points, 2 through 6 – the lag time, ı (s), between
and ˇi, where the subscript i indexes all five of the points in turn.
ent for this effect. The sample data shown here are from the same turn as shown in
The ıi for each point was calculated as a single number, the timefrom the start of the turn, which is determined by �, to the time atwhich ˇi is maximally correlated with � (Fig. 5).
2.4. Statistical analysis
All statistical tests were performed with JMP software version5.0.1.a (SAS Institute Inc., Cary, NC, USA). Using one-way ANOVAwith body position as the independent variable, ˇ, ˇ*, and ı wereall tested to see if they differed by body position (significancelevel = 0.05). One-way ANOVA was also used to test for differencesbetween related variables, Ur and Ucr, and the three kinds of ω.
To determine how body form and postural reconfiguration cor-relate independently and in combination with each performancevariable, three different tests were run. For example, the perfor-mance variable Ucr was used as the response in a step-wise linearregression (mixed direction, p = 0.25 in and out) that included ascandidate predictors all of the body form variables (see AppendixA). The selected candidate variables were then used in a multiplelinear regression of Ucr onto the candidate pool. This process wasrepeated for the postural reconfiguration variables alone and for
the form and postural variables combined. Thus, each performancevariable was examined using three statistical models: body form,postural reconfiguration, and the composite model, which includesboth body form and postural reconfiguration variables. Before
M.E. Porter et al. / Zoology 114 (2011) 348– 359 353
Fig. 5. Lag time, ı, between the start of the turn and the peak correlation betweenthe body’s turning angle, �, and the body’s flexion, ˇ. By comparing the ı values fornon-terminal points on the body, we can assess how the body acts as a dynamicrla
cb
wti
3
as0p
ataoi
Fig. 6. Dynamic rudder model of a turning shark. Before the turn starts, the turningangle of the CR is maximally correlated with the flexion of the caudal region of thebody. After the turn starts, the turning angle of the CR is maximally correlated withthe flexion of the precaudal region of the body (points 2 through 4). These differencesin timing suggest that the caudal region (points 5 and 6) initiates the turn and that
cant; in addition, mb and ˇ3 became significant.Speed on the path of the CR, Ucr, was not significantly predicted
by any body form variables alone; however, it was significantlypredicted by both the postural reconfiguration (p = 0.01) and the
Table 2Turning performance of juvenile leopard sharks, Triakis semifasciata (n = 9).
Mean S.E.
Rmin (cm) 0.18 0.035R∗
min(L) 0.006 0.0016
Ucr (cm s−1) 25.3 1.77U∗
cr (L s−1) 0.78 0.086Ur (cm s−1) 38.0 2.12U∗
r (L s−1) 1.16 0.106
�max (rad) 1.75 0.121�∗
max (rad cm−1) 4.37 0.439
udder to create and control the turning maneuver. For example, a positive ı value,ike the one shown in this example for body point 2, means that ̌ correlates with �fter the turn has been initiated. All flexion points are analyzed in a similar fashion.
andidate variables are selected, each model can be representedy the following general notations:
form : y = f (Fb, Ia, Im, k′b, k′
E, Lb, mb, W),
posture : y = f (Bb, Lc, ˇ2 . . . ˇ6, ˙ˇ, ˇ∗2 . . . ˇ∗
6, ˙ˇ∗i, ı2 . . . ı6),
composite : y = f (Fb, Ia, Im, k′b, k′
E, Lb, mb, W, Bb, Lc, ˇ2 . . . ˇ6,
˙ˇ, ˇ∗2 . . . ˇ∗
6, ˙ˇ∗i, ı2 . . . ı6),
here y denotes any of the eight response variables that measureurning performance, and f() denotes “some function of” thendependent variables in the accompanying set.
. Results
Lb of T. semifasciata in this study ranged from 25.3 to 48.35 cm,nd mb of the largest animal was 7 times greater than that of themallest (Table 1). The position of the CR had a mean of 3.1 (SD.78), a median of 3, and a mode of 3 (range 2–4). The proportionalosition of the CR had a mean of 0.261 of Lb (SD 0.0147) (Table 1).
Lb was significantly greater than W, and these body proportionsre reflected in the two-dimensional body shape as measured by
he fineness ratio, Fb. The lag, ı, between flexion of the body andngular motion at the CR decreased significantly along the lengthf the body (F4,40 = 4.994, p = 0.0023; Fig. 6). Maximal flexion, ˇ,ncreased significantly along the length of the body (F4,40 = 29.95,the precaudal region carries it out. Thus the body is a dynamic rudder, operatingover time to control these maximal volitional turns. Means ± standard error (n = 9).Lag, ı, decreases along the length of the body (F4,40 = 4.99; p = 0.0023).
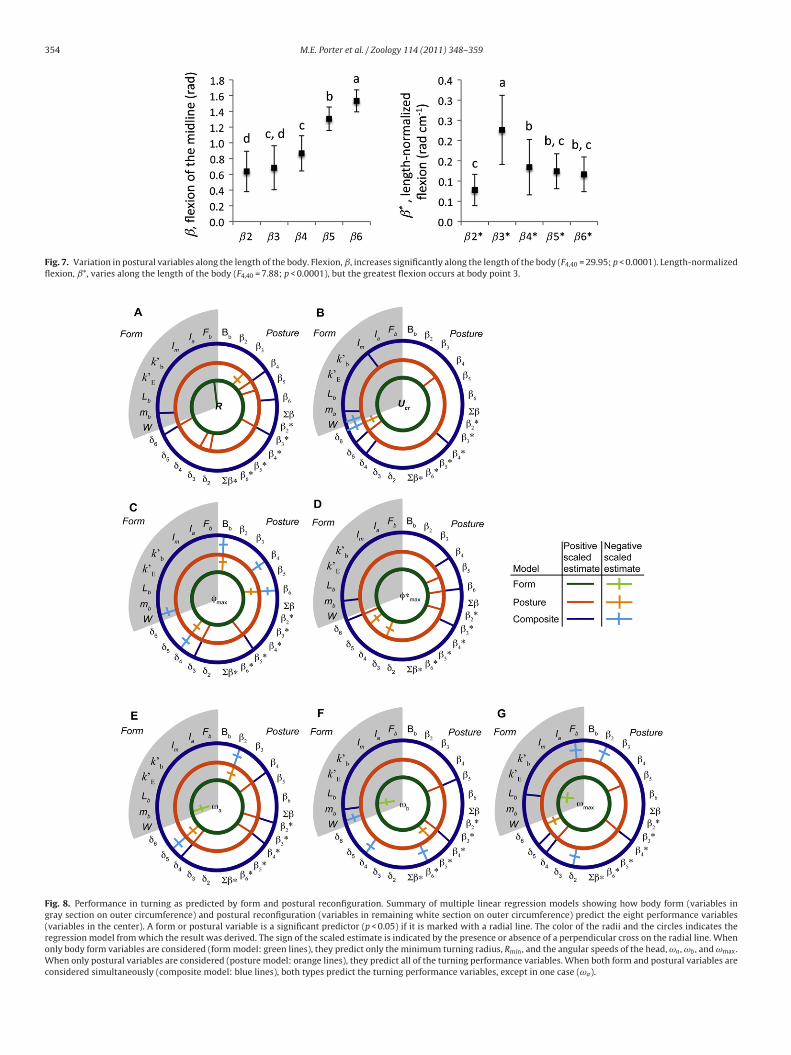
p < 0.0001; Fig. 7), and ˇ6 was more than double the magnitude ofˇ2. Length-normalized body flexion, ˇ*, also varied significantlydepending on the point along the body (F4,40 = 7.88, p < 0.0001;Fig. 7). Length-normalized flexion was greatest at point ˇ∗
3 anddecreased towards the tail. The speed of the rostrum, Ur, was signif-icantly faster than the speed at the CR, Ucr (F1,16 = 21.14, p = 0.0003;Table 2). Angular speeds of the head, ωa and ωb, were indistin-guishable, but were significantly lower than ωmax (F2,24 = 8.326;p < 0.0001; Table 2).
The minimum turning radius, Rmin, was significantly predictedby body form (p = 0.017), postural reconfiguration (p = 0.004), andthe composite model containing both body form and posturalreconfiguration variables (p < 0.0001; Table 3 and Fig. 8). Examin-ing body form, Rmin increased with increasing Fb. During posturalreconfiguration, Rmin increased with ˇ4, ˇ5, ı3, and ı6 while itdecreased with ˇ3. In the composite model, ˇ4 remained signifi-
∗
ωa (rad s−1) 3.26 0.406ωb (rad s−1) 3.27 0.338ωmax (rad s−1) 5.24 0.432
Variables normalized by body length are denoted with units of L, for body length.
354 M.E. Porter et al. / Zoology 114 (2011) 348– 359
Fig. 7. Variation in postural variables along the length of the body. Flexion, ˇ, increases significantly along the length of the body (F4,40 = 29.95; p < 0.0001). Length-normalizedflexion, ˇ*, varies along the length of the body (F4,40 = 7.88; p < 0.0001), but the greatest flexion occurs at body point 3.
Fig. 8. Performance in turning as predicted by form and postural reconfiguration. Summary of multiple linear regression models showing how body form (variables ingray section on outer circumference) and postural reconfiguration (variables in remaining white section on outer circumference) predict the eight performance variables(variables in the center). A form or postural variable is a significant predictor (p < 0.05) if it is marked with a radial line. The color of the radii and the circles indicates theregression model from which the result was derived. The sign of the scaled estimate is indicated by the presence or absence of a perpendicular cross on the radial line. Whenonly body form variables are considered (form model: green lines), they predict only the minimum turning radius, Rmin, and the angular speeds of the head, ωa , ωb , and ωmax.When only postural variables are considered (posture model: orange lines), they predict all of the turning performance variables. When both form and postural variables areconsidered simultaneously (composite model: blue lines), both types predict the turning performance variables, except in one case (ωa).

M.E. Porter et al. / Zoology 114 (2011) 348– 359 355
Table 3Predicting the minimum turning radius, Rmin, of juvenile leopard sharks, Triakissemifasciata (n = 9).
Body form
Variables F ratio p Scaled estimate
Fb 9.62 0.017 0.122
F ratio p r2
Whole model 9.62 0.017 0.579
Posture
Variables F ratio p Scaled estimate
�3 1087.38 0.019 −0.013�4 2510.67 0.013 0.020�5 275.46 0.038 0.008ˇ∗
3 35,339.97 0.003 0.101ı2 15,563.42 0.005 0.081ı3 6781.97 0.008 0.039ı6 13,904.42 0.005 0.057
F ratio p r2
Whole model 48,767.01 0.004 1.000
Body form and posture
Variables F ratio p Scaled estimate
mb 42.06 0.007 0.046ˇ4 12.08 0.040 0.025ˇ6 78.51 0.003 0.064ˇ∗
3 62.30 0.004 0.047ı6 559.96 0.000 0.106
F ratio p r2
Whole model 285.93 0.000 0.998
Independent variables that predict the response variable were selected from a poolof all independent variables using step-wise linear regression (p = 0.25 in; p = 0.25out). The selected variables were then modeled in a least-squares multiple linearrt
cmifˇw
p(arwtwatt
wtˇm�ta
c(Wm
Table 4Predicting the path speed, Ucr , of the center of rotation, in juvenile leopard sharks,Triakis semifasciata (n = 9).
Body form
Variables F ratio p Scaled estimate
– –
F ratio p r2
Whole model NS
Posture
Variables F ratio p Scaled estimate
ˇ4 78.64 0.003 10.070ˇ∗
5 4.50 0.124 −1.921ı4 8.60 0.061 2.817ı5 70.26 0.004 5.046ı6 60.14 0.005 −6.202
F ratio p r2
Whole model 29.12 0.010 0.980
Body form and posture
Variables F ratio p Scaled estimate
mb 9728.358 0.007 14.207W 9004.748 0.007 −19.563Im 1770.814 0.015 2.780ˇ∗
4 203,947.5 0.001 8.742ı4 20,893.14 0.004 2.370ı5 190,625.5 0.002 6.470ı6 60,211.24 0.003 −9.276
F ratio p r2
Whole model 78,833.95 0.003 1.000
Independent variables that predict the response variable were selected from a poolof all independent variables using step-wise linear regression (p = 0.25 in; p = 0.25out). The selected variables were then modeled in a least-squares multiple linear
egression. Note that this process returns some variables with independent effectsest values of p > 0.05; those variables should be treated cautiously.
omposite model (p = 0.003; Table 4 and Fig. 8). In the postureodel, ı5 significantly increased with Ucr, but ı6 decreased. Sim-
larly, ˇ4 increased with Ucr. In the composite model, three bodyorm variables changed significantly with Ucr (mb, W, and Im), and∗4 significantly increased. Both ı4 and ı5 increased significantlyhile ı6 decreased.
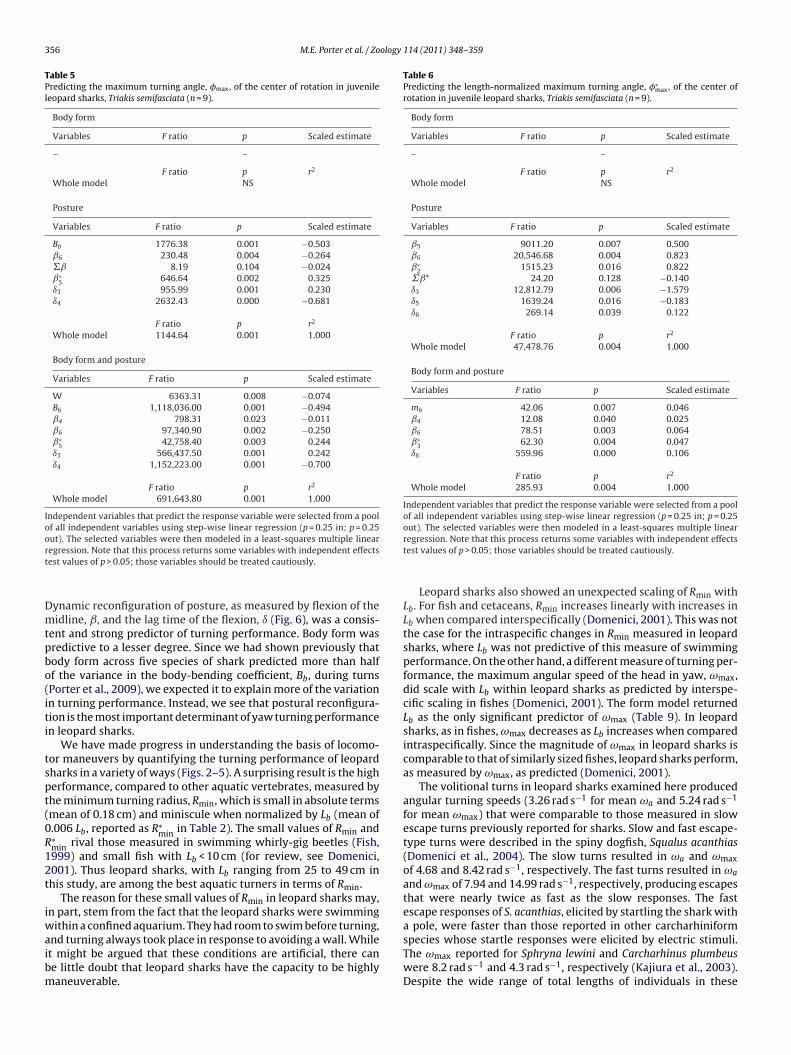
The maximal turning angle of the CR, �max, was significantlyredicted by both the posture (p < 0.0001) and the composite modelp < 0.0001; Table 5 and Fig. 8). In the posture model, Bb and ˇ6 werell negatively related to �max, while ˇ∗
5 was positively related. Ante-iorly on the body at ı3, there was a significant positive relationith �max, while more posteriorly at ı4, there was a negative rela-
ion. In the composite model body form, W increased significantlyith �max. Postural reconfiguration variables Bb, ˇ4, and ˇ6 were
ll negatively related to �max, but ˇ∗5 was positively related. The lag
ime variables showed the same statistical relation with �max as inhe posture model.
The length-normalized maximum turning angle of the CR, �∗max,
as significantly predicted by the posture model (p = 0.004) andhe composite model (p = 0.004; Table 6 and Fig. 8). Body flexion5, ˇ6, and ˇ∗
2 increased significantly with �∗max in the posture
odel. Lag time variables ı3 and ı5 significantly decreased with∗max. One body form variable, mb, was positively related to �∗
max inhe composite model. Posture variables ˇ4, ˇ6, ˇ∗
3, and �6 were alllso positively related to �∗
max.Primary angular speed of the head in yaw, ωa, was signifi-
antly predicted by body form (p = 0.002), postural reconfigurationp = 0.005), and the composite model (p = 0.001; Table 7 and Fig. 8).
was significantly and negatively related to ωa in the body formodel. In the posture model, ˇ2 was negatively related to ωa, but
regression. Note that this process returns some variables with independent effectstest values of p > 0.05; those variables should be treated cautiously.
ˇ4 was positively related. Both ˇ∗2 and ˇ∗
4 were positively relatedto ωa. Lag ı5 was negatively related to ωa. There were no signifi-cant body form variables in the composite model. Body flexion ˇ2was negatively related to ωa in the composite model; ˇ4, ˇ∗
2, andˇ∗
4 were all positively related to ωa as in the posture model.Secondary angular speed of the head in yaw, ωb, was signif-
icantly predicted by body form (p = 0.0028), posture (p = 0.0006),and the composite model (p = 0.011; Table 8 and Fig. 8). Mass ofthe body, mb, was negatively related to ωb in the body form model.Flexion variable ˇ5 was positively related in the posture model;however, ˇ∗
5 was negatively related while ˇ∗4 was positively related.
Two body form variables, mb and W, were significant in the com-posite model. Flexion variables ˇ5 and ˇ∗
4 were positively relatedbut ˇ∗
6 was negatively related to ωb.Body form (p = 0.034), posture (p = 0.0009), and the composite
model (p < 0.0001) significantly predicted maximum angular speedof the head, ωmax, during a yaw turn (Table 9 and Fig. 8). In the bodyform model, Lb was negatively related to ωmax. Length-normalizedflexion ˇ∗
4 was positively related to ωmax. Both ı4 and ı5 werepositively related to ωmax but ı6 was negatively related. In thecomposite model, two body form variables, Lb and Fb, significantlyinfluenced ωmax. Flexion variable ˇ2 was negatively related to ωmax,while ˇ∗
4 was positively related. In the composite model, ı2 wasnegatively related to ωmax, while ı4 and ı5 were positively related.
4. Discussion
In leopard sharks, turns are under the complex control of mul-tiple variables that describe how the body is reconfiguring (Fig. 8).
356 M.E. Porter et al. / Zoology 114 (2011) 348– 359
Table 5Predicting the maximum turning angle, �max, of the center of rotation in juvenileleopard sharks, Triakis semifasciata (n = 9).
Body form
Variables F ratio p Scaled estimate
– –
F ratio p r2
Whole model NS
Posture
Variables F ratio p Scaled estimate
Bb 1776.38 0.001 −0.503ˇ6 230.48 0.004 −0.264�ˇ 8.19 0.104 −0.024ˇ∗
5 646.64 0.002 0.325ı3 955.99 0.001 0.230ı4 2632.43 0.000 −0.681
F ratio p r2
Whole model 1144.64 0.001 1.000
Body form and posture
Variables F ratio p Scaled estimate
W 6363.31 0.008 −0.074Bb 1,118,036.00 0.001 −0.494ˇ4 798.31 0.023 −0.011ˇ6 97,340.90 0.002 −0.250ˇ∗
5 42,758.40 0.003 0.244ı3 566,437.50 0.001 0.242ı4 1,152,223.00 0.001 −0.700
F ratio p r2
Whole model 691,643.80 0.001 1.000
Independent variables that predict the response variable were selected from a poolof all independent variables using step-wise linear regression (p = 0.25 in; p = 0.25out). The selected variables were then modeled in a least-squares multiple linearrt
Dmtpbo(iti
tspt(0R12t
iwaibm
Table 6Predicting the length-normalized maximum turning angle, �∗
max, of the center ofrotation in juvenile leopard sharks, Triakis semifasciata (n = 9).
Body form
Variables F ratio p Scaled estimate
– –
F ratio p r2
Whole model NS
Posture
Variables F ratio p Scaled estimate
ˇ5 9011.20 0.007 0.500ˇ6 20,546.68 0.004 0.823ˇ∗
2 1515.23 0.016 0.822˙ˇ* 24.20 0.128 −0.140ı3 12,812.79 0.006 −1.579ı5 1639.24 0.016 −0.183ı6 269.14 0.039 0.122
F ratio p r2
Whole model 47,478.76 0.004 1.000
Body form and posture
Variables F ratio p Scaled estimate
mb 42.06 0.007 0.046ˇ4 12.08 0.040 0.025ˇ6 78.51 0.003 0.064ˇ∗
3 62.30 0.004 0.047ı6 559.96 0.000 0.106
F ratio p r2
Whole model 285.93 0.004 1.000
Independent variables that predict the response variable were selected from a poolof all independent variables using step-wise linear regression (p = 0.25 in; p = 0.25out). The selected variables were then modeled in a least-squares multiple linear
egression. Note that this process returns some variables with independent effectsest values of p > 0.05; those variables should be treated cautiously.
ynamic reconfiguration of posture, as measured by flexion of theidline, ˇ, and the lag time of the flexion, ı (Fig. 6), was a consis-
ent and strong predictor of turning performance. Body form wasredictive to a lesser degree. Since we had shown previously thatody form across five species of shark predicted more than halff the variance in the body-bending coefficient, Bb, during turnsPorter et al., 2009), we expected it to explain more of the variationn turning performance. Instead, we see that postural reconfigura-ion is the most important determinant of yaw turning performancen leopard sharks.
We have made progress in understanding the basis of locomo-or maneuvers by quantifying the turning performance of leopardharks in a variety of ways (Figs. 2–5). A surprising result is the higherformance, compared to other aquatic vertebrates, measured byhe minimum turning radius, Rmin, which is small in absolute termsmean of 0.18 cm) and miniscule when normalized by Lb (mean of.006 Lb, reported as R∗
min in Table 2). The small values of Rmin and∗min rival those measured in swimming whirly-gig beetles (Fish,999) and small fish with Lb < 10 cm (for review, see Domenici,001). Thus leopard sharks, with Lb ranging from 25 to 49 cm inhis study, are among the best aquatic turners in terms of Rmin.
The reason for these small values of Rmin in leopard sharks may,n part, stem from the fact that the leopard sharks were swimming
ithin a confined aquarium. They had room to swim before turning,nd turning always took place in response to avoiding a wall. While
t might be argued that these conditions are artificial, there cane little doubt that leopard sharks have the capacity to be highlyaneuverable.regression. Note that this process returns some variables with independent effectstest values of p > 0.05; those variables should be treated cautiously.
Leopard sharks also showed an unexpected scaling of Rmin withLb. For fish and cetaceans, Rmin increases linearly with increases inLb when compared interspecifically (Domenici, 2001). This was notthe case for the intraspecific changes in Rmin measured in leopardsharks, where Lb was not predictive of this measure of swimmingperformance. On the other hand, a different measure of turning per-formance, the maximum angular speed of the head in yaw, ωmax,did scale with Lb within leopard sharks as predicted by interspe-cific scaling in fishes (Domenici, 2001). The form model returnedLb as the only significant predictor of ωmax (Table 9). In leopardsharks, as in fishes, ωmax decreases as Lb increases when comparedintraspecifically. Since the magnitude of ωmax in leopard sharks iscomparable to that of similarly sized fishes, leopard sharks perform,as measured by ωmax, as predicted (Domenici, 2001).
The volitional turns in leopard sharks examined here producedangular turning speeds (3.26 rad s−1 for mean ωa and 5.24 rad s−1
for mean ωmax) that were comparable to those measured in slowescape turns previously reported for sharks. Slow and fast escape-type turns were described in the spiny dogfish, Squalus acanthias(Domenici et al., 2004). The slow turns resulted in ωa and ωmax
of 4.68 and 8.42 rad s−1, respectively. The fast turns resulted in ωa
and ωmax of 7.94 and 14.99 rad s−1, respectively, producing escapesthat were nearly twice as fast as the slow responses. The fastescape responses of S. acanthias, elicited by startling the shark witha pole, were faster than those reported in other carcharhiniformspecies whose startle responses were elicited by electric stimuli.
The ωmax reported for Sphryna lewini and Carcharhinus plumbeuswere 8.2 rad s−1 and 4.3 rad s−1, respectively (Kajiura et al., 2003).Despite the wide range of total lengths of individuals in these
M.E. Porter et al. / Zoology 114 (2011) 348– 359 357
Table 7Predicting the initial angular speed of the head, ωa , in yaw in turning juvenile leopardsharks, Triakis semifasciata (n = 9).
Body form
Variables F ratio p Scaled estimate
W 24.92 0.0016 −0.978
F ratio p r2
Whole model 24.92 0.002 0.781
Posture
Variables F ratio p Scaled estimate
ˇ2 4253.43 0.010 −0.864ˇ3 7.08 0.229 −0.023ˇ4 206.60 0.044 0.312ˇ∗
2 1729.79 0.015 0.744ˇ∗
4 728.96 0.024 0.787ı4 72.41 0.075 0.068ı5 882.02 0.021 −0.179
F ratio p r2
Whole model 21,330.05 0.005 1.000
Body form and posture
Variables F ratio p Scaled estimate
k′b
118.54 0.058 −0.028ˇ2 56,737.26 0.003 −0.858ˇ4 5966.49 0.008 0.348ˇ∗
2 25,048.50 0.004 0.731ˇ∗
4 10,385.90 0.006 0.736ı4 1158.99 0.019 0.071ı5 12,693.86 0.006 −0.175
F ratio p r2
Whole model 315,463.20 0.001 1.000
Independent variables that predict the response variable were selected from a poolof all independent variables using step-wise linear regression (p = 0.25 in; p = 0.25out). The selected variables were then modeled in a least-squares multiple linearrt
smitt
miRamtfll
pbpd4wtra
sos
Table 8Predicting the secondary angular speed of the head, ωb , in yaw in turning juvenileleopard sharks, Triakis semifasciata (n = 9).
Body Form
Variables F ratio p Scaled estimate
mb 7.67 0.028 −4.761
F ratio p r2
Whole model 7.67 0.028 0.523
Posture
Variables F ratio p Scaled estimate
ˇ5 60.57 0.003 1.473ˇ∗
4 79.16 0.004 3.447ˇ∗
5 4.55 0.019 −0.820ˇ∗
6 6.41 0.085 −0.930ı4 21.48 0.123 −0.641
F ratio p r2
Whole model 42.41 0.006 0.986
Body form and posture
Variables F ratio p Scaled estimate
mb 252.41 0.040 3.722W 184.38 0.047 −4.187ˇ5 1198.64 0.018 2.323�ˇ 85.93 0.068 0.466ˇ∗
4 4782.08 0.009 4.156ˇ∗
6 454.75 0.030 −2.971ı4 2272.82 0.013 −0.749
F ratio p r2
Whole model 5156.64 0.011 1.000
Independent variables that predict the response variable were selected from a poolof all independent variables using step-wise linear regression (p = 0.25 in; p = 0.25out). The selected variables were then modeled in a least-squares multiple linearregression. Note that this process returns some variables with independent effects
egression. Note that this process returns some variables with independent effectsest values of p > 0.05; those variables should be treated cautiously.
pecies (34.8 cm mean Lb of T. semifasciata in this study to 75.1 cmean Lb of S. lewini in Kajiura et al., 2003), these species share sim-
lar slow turning speeds but differ in their behavioral ecology, fromhe coastal migrations and benthic interactions of leopard sharkso the pelagic zone cruising of hammerheads.
When we examine performance measures together, we get aore complete picture of how leopard sharks turn. They can swim
n a straight line and then quickly turn “on a dime”, rotating with amin that approaches zero, do so with a large turning angle, �max,
rapid ωmax, and, before or after the braking required for such aaneuver, a high translational speed of the body’s center of rota-
ion, Ucr. Sharks vary their turning behavior (Table 2), with bodyexion variables, ̌ and ˇ*, both positively and negatively corre-
ated with the performance variables (Fig. 8).In terms of the control of turning behavior, the differences in
ositive and negative correlations of performance variables withoth form and postural variables mean that trade-offs in turningerformance abound (Fig. 9). For example, if a shark wanted toecrease Rmin, it might increase its maximal body flexion at points
and 6, ˇ4 and ˇ6, respectively (Fig. 8). However, in so doing, �ould decrease (Fig. 8). Choosing instead to maximize its ωmax,
he shark might increase the lag time at points 4 and 5, ı4 and ı5,espectively (Fig. 8). Those changes would also increase the Ucr but,t the same time, they would lower �max (Fig. 8).
Which aspects of turning performance matter most to leopard
harks depends on their ecological situation. Leopard sharks, whichccur inshore throughout the eastern Pacific of the northern hemi-phere, are constantly on the move, swimming with the tides intotest values of p > 0.05; those variables should be treated cautiously.
the muddy littoral zone to forage for benthic invertebrates andcoastal fishes (Ackerman et al., 2000). While foraging in narrowcoastal channels and shallow mud flats, leopard sharks likely rely ontheir ability to tightly maneuver within confined distances. Since,under these circumstances, elusive prey can be trapped in nar-row spaces, it is likely that leopard sharks take advantage of smallvalues of Rmin and large values of � at the expense of the speed-related variable ωmax. In deeper water situations, during daily tidalmovements or seasonal coastal movements, rotational and trans-lational speed are likely to be of primary concern, since neitherprey nor predators are limited by substrate interactions (Domenici,2001).
Individual leopard sharks in the Elkhorn Slough estuary of Cali-fornia differed in their use of habitat, with some preferring tidalchannels and others preferring mud flats; periods of active for-aging within a small area were often punctuated by rapid anddirected movements to a different habitat within the slough, oftenagainst the tides (Carlisle and Starr, 2009). A range of depths werechosen by the sharks while they remained in the slough fromspring to fall; many departed for more oceanic bays during thewinter while some adults and juveniles remained in the sloughthroughout the year (Carlisle and Starr, 2009). Littoral habitatswith channels, tides, and low water depths require high degreesof maneuverability to navigate. Couple those hydrological chal-lenges with the requirements of foraging for active invertebrateand vertebrate prey and it seems reasonable to predict that yaw
turning – and the ability to adjust turning performance based onecological circumstance – is a key behavior in the ecology of leopardsharks.
358 M.E. Porter et al. / Zoology 114 (2011) 348– 359
Table 9Predicting the maximum angular speed of the head, ωmax, in yaw in turning juvenileleopard sharks, Triakis semifasciata (n = 9).
Body form
Variables F ratio p Scaled estimate
Lb 6.94 0.034 −1.098
F ratio p r2
Whole model 6.94 0.034 0.498
Posture
Variables F ratio p Scaled estimate
ˇ∗2 3.11 0.220 0.280
ˇ∗4 119.04 0.008 2.293
ˇ∗5 8.39 0.101 −0.418
ı4 26.01 0.036 0.620ı5 45.01 0.022 0.675ı6 50.69 0.019 −0.747
F ratio p r2
Whole model 108.29 0.009 0.997
Body form and posture
Variables F ratio p Scaled estimate
Lb 121,915.40 0.002 0.392Fb 350,679.70 0.001 −0.705ˇ2 50,827.64 0.003 −0.231ˇ∗
4 3,092,143.00 0.000 2.496ı2 2369.48 0.013 −0.034ı4 171,339.30 0.002 0.420ı5 578,050.00 0.001 0.502
F ratio p r2
Whole model 1,275,544.00 0.001 1.000
Independent variables that predict the response variable were selected from a poolof all independent variables using step-wise linear regression (p = 0.25 in; p = 0.25out). The selected variables were then modeled in a least-squares multiple linearrt
obtnsalsio
svlebpsaBf
uactro
Fig. 9. Trade-offs and synergisms among the variables that characterize turningperformance. Trade-offs (antagonisms) are shown in the upper diagonals (whitebackground). Synergisms are shown in the lower diagonals (gray background). Ifform or posture variables appear in a pair, separated by a colon, it means that thosetwo variables are causally related. If a form or posture variable is present in anantagonist cell, it means that changes in that variable will simultaneously imposeopposite pressures on turning performance by affecting multiple variables by whichwe have measured turning performance. If a form or posture variable is present in
egression. Note that this process returns some variables with independent effectsest values of p > 0.05; those variables should be treated cautiously.
One interpretation of the observation that the angular speedf slow turns is similar across species and ecologies is that thatehavior is evolutionarily conserved. Conservation is a hypothesishat states that a trait arose in a shared ancestor and was neither lostor changed in descendent lineages. Conservation can occur whenelection pressures on the trait in question are constant across timend among species; conservation may also occur if the trait hasow heritability or is genetically linked to other traits experiencingtrong stabilizing selection. Which of these scenarios is more likelys impossible to say without careful investigations of the selectionn and genetics of natural populations of sharks.
Postural reconfiguration, as measured by Bb alone, has beenhown to predict turning velocity in other species of sharks. Greateralues of Bb were correlated with higher angular head speeds in S.ewini and C. plumbeus (ω = 8.2 rad s−1 and 4.3 rad s−1, respectively)ven though the turning radius was not significantly differentetween those species (Kajiura et al., 2003). We noted in thisresent study that when other postural variables were measured,uch as flexion, Bb was predictive of only one performance vari-ble, �max (Fig. 7). This suggests, at least for leopard sharks, thatb, a variable that accounts for the shape of the whole body, resultsrom the more mechanically proximal local body flexion.
Reconfiguration, or change in shape, occurs within an individ-al as it self-propels, maneuvers, and develops; reconfigurationlso occurs among populations as they evolve. Reconfiguration
an be mathematically partitioned into three types: (i) undula-ion, (ii) posture, and (iii) form (Long et al., 2010). While formeconfiguration, the change in the static shape of the body, occursver developmental and evolutionary time, individual differencesa synergist cell, it means that changes in that variable will simultaneously enhancemultiple variables of turning performance.
within a population allow assessment of form reconfiguration ata given time. Undulatory and postural reconfigurations, changesin the dynamic shape of the body, interact to produce steadylocomotion and maneuvers within or between behaviors. Analy-sis of the volitional turning of leopard sharks showed the greaterimportance of postural reconfiguration compared to undulatoryreconfiguration in generating this routine maneuver (Long et al.,2010). Intriguingly, in that same study postural reconfiguration,as measured by the maximal body-bending coefficient, Bb, wasuncorrelated with the stiffness index of cantilevered bending, k′
b, a
mechanically motivated measure of form.In summary, leopard sharks control their turning performance
by modulating the group of postural variables that include bodyflexion and the relative timing of that flexion. Turning performanceis also affected by form variables that cannot be modulated: bodymass, body width, body length, and fineness ratio. The general pic-ture that emerges is that the body reconfigures over different timescales and reconfiguration drives turning performance. With thisinformation, we may now begin to construct mechanical models ofturning in sharks. A model could include a mechanism for the sharkto flex its body, control the magnitude and timing of that flexionregionally, and have the reconfiguring body create inertial force,internal muscular and elastic force, and external fluid force cou-pled with the internal forces. By altering the parameters for bodyform, this model would allow us to test the relative importanceof form and posture, as well as differences in performance amongdifferent species of shark.
Acknowledgments
We thank the institution and people who made work on livesharks possible: Santa Monica Pier Aquarium, Santa Monica, CA

ology
(tbBfvSNJ
A
t
R
A
A
C
D
D
F
F
G
M.E. Porter et al. / Zo
Jose Bacallao and staff). Data collection went more smoothly withhe helping hands of Jessica Alvarez, Nick Tan, Sabreena Kas-ati, Andrew Clark, and Ruth Porter. A special thanks to the UCIiomechanics Group, especially the Summers and McHenry Labs
or their support and guidance. Funding for this research was pro-ided by grants from the American Elasmobranch Society and theociety of Integrative and Comparative Biology to M.E.P., and theational Science Foundation to Adam P. Summers (IBM-0317155),
.H.L. (DBI-0442269), and M.E.P. and J.H.L. (IOS-922605).
ppendix A. Supplementary data
Supplementary data associated with this article can be found inhe online version at doi:10.1016/j.zool.2011.06.001.
eferences
ckerman, J.T., Kondratieff, M.C., Matern, S.A., Cech, J.J., 2000. Tidal influence of sta-tial dynamics of leopard sharks, Triakis semifasciata, in Tomales Bay, California.Environ. Biol. Fishes 58, 33–43.
zizi, E., Landberg, T., 2002. Effects of metamorphosis on the aquatic escape responseof the two-lined salamander (Eurycea bislineata). J. Exp. Biol. 205, 841–849.
arlisle, A.B., Starr, R.M., 2009. Habitat use, residency, and seasonal distribution offemale leopard sharks Triakis semifasciata in Elkhorn Slough, California. Mar.Ecol. Prog. Ser. 380, 213–228.
omenici, P., 2001. The scaling of locomotor performance in predator–prey encoun-ters: from fish to killer whales. Comp. Physiol. Biochem. A 13, 169–182.
omenici, P., Standen, E.M., Levine, R.P., 2004. Escape manoeuvers in the spinydogfish (Squalus acanthias). J. Exp. Biol. 207, 2339–2349.
ish, F.E., 1999. Performance constraints on the maneuverability of flexible and rigidbiological systems. In: Proceedings of the 11th International Symposium onUnmanned Untethered Submersible Technology, Autonomous Undersea Sys-tems Institute, Durham, NH, pp. 394–406.
ish, F.E., Hurley, J., Costa, D.P., 2003. Maneuverability by the sea lion Zalophus cal-
ifornianus: turning performance of an unstable body design. J. Exp. Biol. 206,667–674.autrais, J., Jost, C., Soria, M., Campo, A., Motsch, S., Fournier, R., Blanco, S., Theraulaz,G., 2009. Analyzing fish movement as a persistent turning walker. J. Math. Biol.58, 429–445.
114 (2011) 348– 359 359
Kajiura, S.M., Forni, J.B., Summers, A., 2003. Maneuvering in juvenile carcharhinidand sphyrnid sharks: the role of the hammerhead shark cephalofoil. Zoology106, 19–28.
Long Jr., J.H., 1995. Morphology, mechanics, and locomotion: the relation betweenthe notochord and swimming motions in sturgeon. Environ. Biol. Fishes 44,199–211.
Long Jr., J.H., 1998. Muscles, elastic energy, and the dynamics of body stiffness inswimming eels. Am. Zool. 38, 771–792.
Long Jr., J.H., Adcock, B., Root, R.G., 2002a. Force transmission via axial tendonsin undulating fish: a dynamic analysis. Comp. Biochem. Physiol. A 133, 911–929.
Long Jr., J.H., Koob-Emunds, M., Sinwell, B., Koob, T.J., 2002b. The notochord of hag-fish Myxine glutinosa: visco-elastic properties and mechanical functions duringsteady swimming. J. Exp. Biol. 205, 3819–3831.
Long Jr., J.H., Lammert, A.C., Pell, C.A., Kemp, M., Strother, J.A., Crenshaw, H.C.,McHenry, M.J., 2004. A navigational primitive: biorobotic implementation ofcycloptic helical klinotaxis in planar motion. IEEE J. Oceanic Eng. 29, 795–806.
Long Jr., J.H., Porter, M.E., Root, R.G., Liew, C.W., 2010. Go reconfigure: howfish change shape as they swim and evolve. Integr. Comp. Biol. 50, 1120–1139.
Nguyen, Q.S., Heo, S., Park, H.C., Goo, N.S., Byun, D., 2009. Cruise and turning perfor-mance of an improved fish robot actuated by piezoceramic actuators. Proc. SPIE7288, 72880J.
Porter, M.E., Roque, C.M., Long Jr., J.H., 2009. Turning maneuvers in sharks: predictingbody curvature from axial morphology. J. Morph. 270, 954–965.
Root, R.G., Courtland, H.-W., Shepherd, W., Long Jr., J.H., 2007. Flapping flexible fish:periodic and secular body reconfigurations in swimming lamprey, Petromyzonmarinus. Exp. Fluids 43, 779–797.
Smith, S.E., 1984. Timing of vertebral-band deposition in tetracycline-injected leop-ard sharks. Trans. Am. Fish Soc. 113, 308–313.
Tytell, E.D., Lauder, G.V., 2008. Hydrodynamics of the escape response in bluegillsunfish, Lepomis macrochirus. J. Exp. Biol. 211, 3359–3369.
Walker, J.A., 2000. Does a rigid body limit maneuverability? J. Exp. Biol. 22,3391–3396.
Webb, P.W., 1984. Body form, locomotion, and foraging in aquatic vertebrates. Am.Zool. 24, 107–120.
Webb, P.W., 2004. Maneuverability—general issues. IEEE J. Oceanic Eng. 29, 547–555.Webb, P.W., Fairchild, A.G., 2001. Performance and maneuverability of three species
of teleostean fishes. Can. J. Zool. 79, 1866–1877.
Wu, C., Wang, L., 2010. Where is the rudder of a fish? The mechanism of swimmingand control of self-propelled fish school. Acta Mech. Sin. 26, 45–65.Wu, G., Yang, Y., Zeng, L., 2008. Routine turning maneuvers of koi carp Cyprinus
carpio koi: effects of turning rate on kinematics and hydrodynamics. J. Exp. Biol.210, 4379–4389.