Supply Chain Analysis of peri-urban dairy chain around ...
43
Supply Chain Analysis of peri-urban dairy chain around Addis Ababa, Ethiopia (Ethiopia) Wageningen UR, the Netherlands Olga van der Valk (LEI) April 2009 First Draft
Transcript of Supply Chain Analysis of peri-urban dairy chain around ...

Supply Chain Analysis of peri-urban dairy chain around Addis Ababa, Ethiopia (Ethiopia)
Wageningen UR, the Netherlands Olga van der Valk (LEI) April 2009
First Draft


1
Content
Introduction.....................................................................................................................4
Introduction.....................................................................................................................4 1.1 Research questions ...................................................................................................................4
2. Description of the formal dairy chain ...............................................................5 2.1 Introduction ..................................................................................................................................5 2.2 The informal dairy chain ...........................................................................................................5 2.3 Processing plants.......................................................................................................................6
2.3.1 Lame Dairy ...................................................................................... 8 2.3.2 Mama Milk / Sebata Agro Industry ..................................................... 9 2.3.3 Prime Milk Dairy ............................................................................... 9 2.3.4 Family Dairy ................................................................................... 10 2.3.5 Beral Milk ...................................................................................... 10
2.4 Dairy cooperatives ...................................................................................................................10 2.4.1 Ada’a Liben cooperative.................................................................. 10 2.4.2 Other cooperatives:........................................................................ 11
2.5 Non governmental dairy support programmes ...............................................................11 2.5.1 SNV .............................................................................................. 11 2.5.2 Land O’Lakes ................................................................................. 11
3. Product flow in formal chain............................................................................. 13 3.1 Supply ..........................................................................................................................................13
3.1.1 Selale area .................................................................................... 13 3.1.2 Debre Zeyt, Nazareth, Asella region ................................................. 14 3.1.3 Sebata area................................................................................... 15
3.2 Demand .......................................................................................................................................15 3.3 Mismatch between supply and demand.............................................................................15 3.4 Conclusion ..................................................................................................................................17
4. Organizational arrangements in the dairy chain .......................................... 18 4.1 Contracts between farmers and cooperative / trader ..................................................18
4.1.1 Quality control................................................................................ 19 4.2 Contracts between cooperative / Union and processors. ...........................................19
4.2.1 Quality control................................................................................ 20 4.2.2 Processing of rejected milk ............................................................. 20
5. Market and marketing of dairy products ....................................................... 21 5.1 Retail sector...............................................................................................................................21 5.2 Assortment and prices in Addis Ababa ..............................................................................21
5.2.1 Supermarkets ................................................................................ 22 5.2.2 Kiosks........................................................................................... 22 5.2.3 Dairy shops ................................................................................... 22
5.3 Customer preferences ............................................................................................................23

2
5.4 Product distribution and payment policies ....................................................................... 24 5.5 Markets outside Addis Ababa............................................................................................... 25
5.5.1 Urban markets in Ethiopia ............................................................... 26
6. Summary of dairy supply chain aspects ........................................................ 28
7. Conclusions ......................................................................................................... 30 7.1 Description of the formal dairy chain ................................................................................. 30 7.2 Performance of the dairy supply chain.............................................................................. 31
8. Recommendations ............................................................................................. 33 8.1 Amplifying the formal dairy market in Ethiopia................................................................ 33 8.2 Upgrading strategy for peri>urban farmers and cooperatives of farmers ............... 33 8.3 Proposals for further research: ........................................................................................... 34
References ................................................................................................................... 35
Annex 1: ILRI classification of dairy farming systems ............................................................... 1 Annex 2: Presentations and prices of dairy products in retail outlets .................................. 1 Annex 3: Population size of regions by religion and place of residence: 2007................. 2
Table 1: Small dairy processors in and around Addis Ababa.................................................. 7 Table 2: Raw milk collection in Selale area................................................................................. 14 Table 3: Raw milk collection in Debre Zeyt – Assela area...................................................... 14 Table 4: Raw milk collection in the Sebata area ....................................................................... 15 Table 5: Processed milk in 2006>2007 ....................................................................................... 16 Table 6: Calculation of fluctuation in supply and demand of raw milk ................................ 17 Table 7: Daily milk collection of Primary cooperative in Selale ............................................ 18 Table 8: Estimation of price down break: ................................................................................... 19 Table 9: Assortment in retail outlets in Addis Ababa ............................................................... 23 Table 10: Assortment in some retail outlets in Addis Ababa................................................. 23 Table 11: Size of main cities in Ethiopia...................................................................................... 26
3
Figure 1: Structure of the dairy chain .............................................................................................6 Figure 2: Milk processing in Ethiopia ..............................................................................................7 Figure 3: Lame Dairy Production......................................................................................................8 Figure 4: Fasting periods in Orthodox Church............................................................................15 Figure 5: Mismatch between demand and supply within the year ........................................17 Figure 6: Dairy consumption breakdown by product, Addis Ababa, 2006 ........................24 Figure 7: Population according to religion in Addis Ababa and Dire Dawa ........................25 Figure 8: Urban and rural population in Ethiopia according to religion ...............................26 Figure 9: Religion per region in Ethiopia ......................................................................................27 Figure 10: Urban population according to religion and region ..............................................27 Figure 11: Rural population according to religion and region................................................27
4
Introduction With more than 40 million head of cattle, Ethiopia has the largest number of livestock in any country in Africa. Despite this large number of animals, the consumption of milk per capita is amongst the lowest in the continent. There is an unmet and growing demand for fresh milk in urban centres whilst processing plants still operate at under>capacity. To ease this problem, donors and NGO’s undertake various support efforts aimed at strengthening production an improving access to markets; however there is hardly any rise in production and volume of marketed milk. While in the urban retail market (supermarkets), the perception exists that processed and packed dairy products are sold out quickly, small scale milk producers have difficulties entering the formal market chain. Thus for the 2009 BOCI program “Cluster based dairy development in Ethiopia” a supply chain analysis was conducted. The study consisted of a revision of available sources on the dairy market chain in Ethiopia, in particular of Addis Ababa; while a short mission to Ethiopia served to fill in gaps of information, by means of interviewing key stakeholders. The formal market chain is defined as follows: milk is produced and marketed through registered marketing channels, processed in established processing plants and put on the market in packed products. The main market for packed dairy products is Addis Ababa and neighbouring towns (Debre Zeyt). Other towns are relatively small and formal market is very small or non existing. The research concentrated on the Addis Ababa milk shed.
1.1 Research questions
Two research question were guiding the research: - How can the formal dairy supply chain in Ethiopia be described? - What are the factors influencing the apparent mismatch between supply and
demand in the formal market chain supplying the Addis Ababa market? Three areas of research are distinguished:
1. Market and marketing issues: number and type of outlets for dairy products; (fluctuation in) demand; price differentiation, product diversification, customer segmentation;
2. Organizational issues in the supply chain: distribution capacity and network; number and size of market players; structure of the chain; collection points, contracts; quality specification and price policies; link with the informal market;
3. Technological issues: infrastructure; quality of inputs; farming systems (zero>grazing, roughage)
The last area of research, that is, an inventory of technological bottlenecks, was not topic of the supply chain analysis. Inn the summary of dairy supply chain characteristics (chapter 6) findings from the literature study can be found, including technological aspects. The report is divided into several chapters. The first chapter following the introduction gives an overview of the market partners participating in the formal chain; starting with an overview of farming systems. The chapters 3 to 5 product flow; organizational issues and market respectively; while chapter 6 gives an overview of supply chain aspects for dairy products. Chapter 7 gives conclusions; chapter 8 recommendations.

5
2. Description of the formal dairy chain
2.1 Introduction
As part of the BO>CI dairy support project to Ethiopia in 2008, the different production systems in Ethiopia were characterized and analysed. Basically, dairy production was seen to be divided in four different productions systems: >>pastoralism, seasonally providing milk for pastoral communities in (semi)arid areas >>small scale, mixed crop>livestock production systems >>peri urban and urban dairy farms >>large scale dairy farming. Of these four systems, only the last two are currently engaged in the formal supply chain, which requires an amount of specialization into diary activities. Production from pastoralist areas is seasonal and too remote. Likewise, the rural smallholder mixed farming system does not allow for intensive dairy production. In the rural areas, local breeds are needed, suitable especially for ploughing. Their milk (with higher fact content) is economically more attractive for processing into traditional products (butter, cheese). As part of the BO CI research in 2008 a number of successful (small and medium scale) specialised dairy producers have been interviewed. Their main reasons for investing in dairy production were the nearness to markets, a constant market throughout the year and technical support, mainly from NGO’s. Peri>urban farmers have positively responded to market opportunities for dairy products in the growing urban centers. In a study done by ILRI in 2000, seven farming systems were distinguished (see Annex 1), with peri>urban, intra>urban and large dairy farms participating in the formal diary chain. Other small scale farms were seen to participate in the formal chain indirectly through delivering milk at collection points of the then state farm Dairy Development Enterprise.
2.2 The informal dairy chain
Only 2% of the milk produced in Ethiopia reaches the market through the formal dairy chain. The rest of the milk reaches the market via informal marketing channels. The informal market involves direct delivery of fresh milk by producers to consumers in the immediate neighborhood and sale to itinerant traders or individuals in nearby towns. In the informal market, milk may pass from producers to consumers directly or it may pass through two or more market agents. The informal system is characterized by no licensing requirement to operate, low cost of operations, high producer price compared to formal market and no regulation of operations (Redda, 2001). The traditional processing and trade of dairy products, especially traditional soured butter (ghee) and cottage cheese (ayib), dominate the Ethiopian dairy sector. Of the total milk produced only 5 % is marketed as liquid milk due to underdevelopment of infrastructure in the rural area (Tefera 2008). One form of developing the informal market towards a supply (and demand) of more industrialized dairy products is by stimulating small rural enterprises with smallholder, labour>

6
intensive processing technologies (such as hand>driven churners for butter production) (Ahmed, 2004).
One final aspect to be taken into account is the trade>off in employment when stimulating formal dairy chain : ILRI calculated that in the Kenyan formal dairy industry 0.2 to 0.4 jobs were created per 100 litres of milk handled daily, while the same amount creates employment for 2 to 3 informal traders in Kenya and Tanzania (ILRI, 2004, in D’Haese).
Figure 1: Structure of the dairy chain
Source: compiled by author based on primary data.
2.3 Processing plants
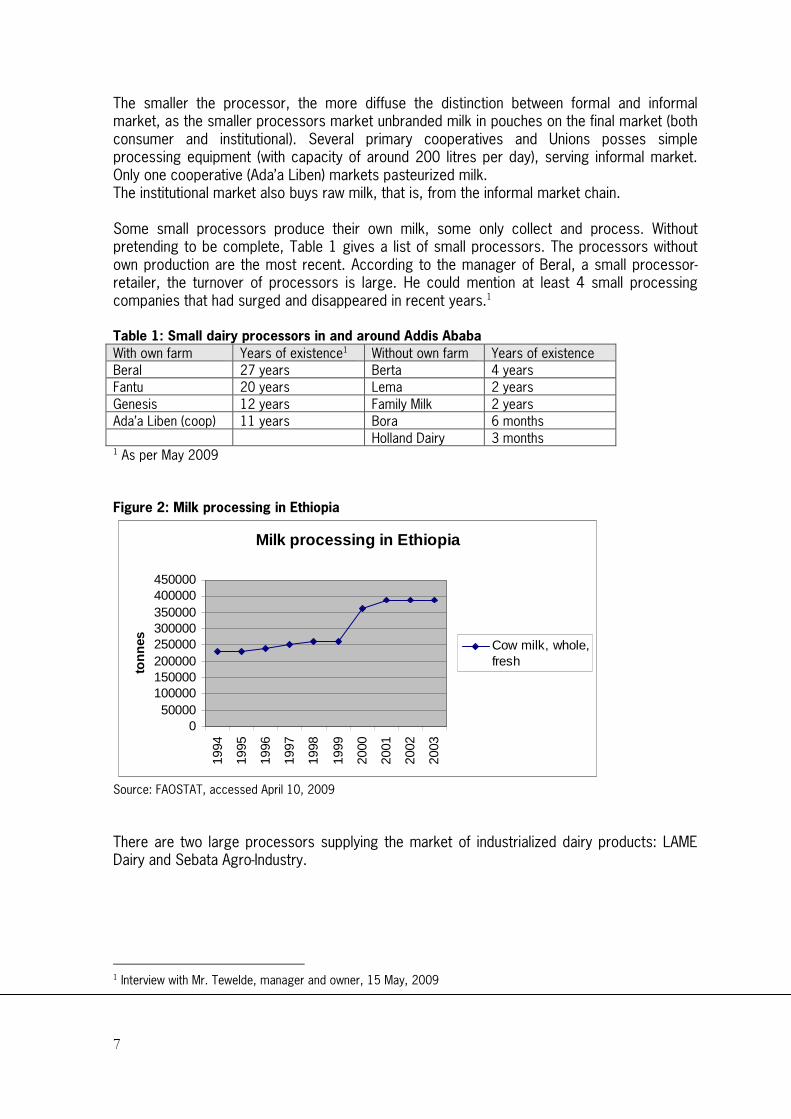
The formal dairy chain is defined in function of participating established processing plants, putting the processed and packed products in the market. Milk processing has experienced a sudden growth in 2000.
7
The smaller the processor, the more diffuse the distinction between formal and informal market, as the smaller processors market unbranded milk in pouches on the final market (both consumer and institutional). Several primary cooperatives and Unions posses simple processing equipment (with capacity of around 200 litres per day), serving informal market. Only one cooperative (Ada’a Liben) markets pasteurized milk. The institutional market also buys raw milk, that is, from the informal market chain.
Some small processors produce their own milk, some only collect and process. Without pretending to be complete, Table 1 gives a list of small processors. The processors without own production are the most recent. According to the manager of Beral, a small processor> retailer, the turnover of processors is large. He could mention at least 4 small processing companies that had surged and disappeared in recent years.1 Table 1: Small dairy processors in and around Addis Ababa
With own farm Years of existence1 Without own farm Years of existence
Beral 27 years Berta 4 years
Fantu 20 years Lema 2 years
Genesis 12 years Family Milk 2 years
Ada’a Liben (coop) 11 years Bora 6 months
Holland Dairy 3 months 1 As per May 2009
Figure 2: Milk processing in Ethiopia
Milk processing in Ethiopia
050000
100000150000200000250000300000350000400000450000
1994
1995
1996
1997
1998
1999
2000
2001
2002
2003
ton
nes Cow milk, whole,
fresh
Source: FAOSTAT, accessed April 10, 2009
There are two large processors supplying the market of industrialized dairy products: LAME Dairy and Sebata Agro>Industry.
1 Interview with Mr. Tewelde, manager and owner, 15 May, 2009

8
2.3.1 Lame Dairy
The LAME Dairy is a privatized state company. It was formally known as Shola; and before that the state owned Dairy Development Enterprise (DDE). The DDE was established in 1979 to operate the nationalized state farms, establish a milk collection network, process and market dairy products, provide advisory and limited technical service to farmers, and sell veterinary medicaments and feed to farmers (Ahmed, 2003). The enterprise collects milk for processing from different sources, including large commercial farms and collection centres that receive milk from smallholder producers (Eshetu Tefera, 2008). The enterprise operates 25 collection centers and chilling stations (centres with milk cool tanks) within a radius of 140km from Addis Ababa. These are located around Addis Ababa, 13 of them near Selale, 5 near Holeta and 7 around Debre Brehane (Mohammed et al., 2004). Having an original capacity of about 60.000 l/day; since its inception the enterprise has only utilized its full capacity during the four years period from 1987 to 1990 (Staal, 1995). Nowadays it processes about 25,000>30,000 l per day. Products sold include pasteurized milk, butter, soft cheese, yogurt, cream milk, formago (cheese) and ice cream (Ahmed, 2004). The reasons for low capacity utilization include management problem, financial difficulties, and unstable and low consumption levels of processed milk. In 2008 a new owner overtook the plant; starting new investments like a tanker to collect the milk. At present they produce pasteurized milk in 500 ml plastic pouches. See also figures on the different products produced by Lame Dairy during 2008>2009. These figures show that the production of pasteurized milk and yoghurt are core business, while butter and ayib are secondary. Gouda cheese is made during slack time in market demand. Ayib was reported to be made also whenever quality problems arise (the Lame Dairy processing equipment originates from 1947). Lame Dairy is upgrading its facilities to produce branded yoghurt in different presentations. Figure 3: Lame Dairy Production
Pasteurized milk
0100200300400500600700800
jul-0
8au
g-08
sep-
09oc
t-08
nov-
08de
c-08
jan-
09fe
b-09
mar
-09
apr-
09
Th
ou
san
ds
Butter
0
2
4
6
8
10
12
jul-0
8au
g-08
sep-
09oc
t-08
nov-
08de
c-08
jan-
09fe
b-09
mar
-09
apr-
09
Th
ou
san
ds
Cheese (Gouda)
0123456789
jul-0
8au
g-08
sep-
09oc
t-08
nov-
08de
c-08
jan-
09fe
b-09
mar
-09
apr-
09
Th
ou
san
ds

9
Yoghurt
0
1
1
2
2
3
3
4
jul-0
8au
g-08
sep-
09oc
t-08
nov-
08de
c-08
jan-
09fe
b-09
mar
-09
apr-
09
Th
ou
san
ds
Ayib
0
5
10
15
20
jul-0
8au
g-08
sep-
09oc
t-08
nov-
08de
c-08
jan-
09fe
b-09
mar
-09
apr-
09
Th
ou
san
ds
The largest suppliers of milk to Lame Dairy are two farmers unions namely: Selale Dairy Farmers in Chancho and Ada Liben in Dibre Ziyet each of which supplies between 6,000 to 10,000 litres of milk per day. Lame Dairy uses a structured pricing system in which bulk suppliers are given a higher price while farmers unions are contracted. (TechnoServe, 2006)
2.3.2 Mama Milk / Sebata Agro Industry
Like LAME Dairy, the Sebata Agro Industry is a former state farm with a capacity about 30000 l/day. It was established on April 1998 and is now the second largest processor. Around 6 000 > 10 000 litres of this milk comes from the owner’s own dairy farm (600 cows); 40 km west of Addis Ababa. Furthermore, the company raw material sources are smallholders with in 100 kilometres radius. This dairy processing enterprise is using some of quality standard measures such as HACCP (Hazard Analysis Critical Control Practice) in the processing and distribution of the products2. They have invested in UHT (Ultra High Temperature: long shelf life milk) processing facilities. New production lines produce 500 ml carton pouches (Tetra Fino Aseptic) and 250 ml portion packages (Tetra Brik Aseptic). UHT products are aseptically processed and packaged and give a shelf life of 6>12 months without the need for cooling during storage and transportation. Thus the new production lines form part of a strategy to even out the seasonalities in milk production and consumption. Major part of the milk processed is milk powder which is reconstituted into liquid milk (Tetra Pak Food for Development Office, 2006). Sebata Agro Industries operates the brand “MAMA”.
Small processors can be divided into companies having their own farms; and processors that only collect milk.
2.3.3 Prime Milk Dairy
▪ 100 dairy cow operation, production 10>15 liters daily; intention to grow to 300 cows ▪ started in 2006 ▪ Has own feed mill and biogas plant ▪ Delivers milk twice a day to 10 restaurants in town
2 http://www.business>ethiopia.com/achievements.html#milk
10
2.3.4 Family Dairy
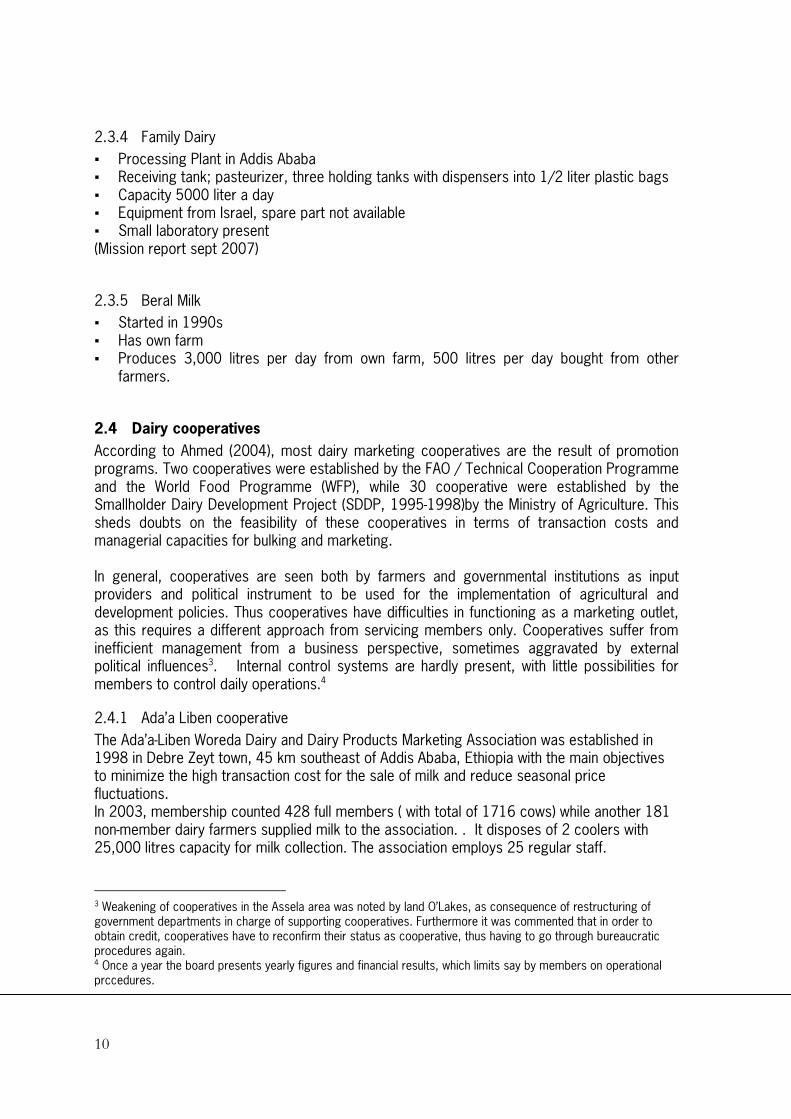
▪ Processing Plant in Addis Ababa ▪ Receiving tank; pasteurizer, three holding tanks with dispensers into 1/2 liter plastic bags ▪ Capacity 5000 liter a day ▪ Equipment from Israel, spare part not available ▪ Small laboratory present (Mission report sept 2007)
2.3.5 Beral Milk
▪ Started in 1990s ▪ Has own farm ▪ Produces 3,000 litres per day from own farm, 500 litres per day bought from other
farmers.
2.4 Dairy cooperatives
According to Ahmed (2004), most dairy marketing cooperatives are the result of promotion programs. Two cooperatives were established by the FAO / Technical Cooperation Programme and the World Food Programme (WFP), while 30 cooperative were established by the Smallholder Dairy Development Project (SDDP, 1995>1998)by the Ministry of Agriculture. This sheds doubts on the feasibility of these cooperatives in terms of transaction costs and managerial capacities for bulking and marketing. In general, cooperatives are seen both by farmers and governmental institutions as input providers and political instrument to be used for the implementation of agricultural and development policies. Thus cooperatives have difficulties in functioning as a marketing outlet, as this requires a different approach from servicing members only. Cooperatives suffer from inefficient management from a business perspective, sometimes aggravated by external political influences3. Internal control systems are hardly present, with little possibilities for members to control daily operations.4
2.4.1 Ada’a Liben cooperative
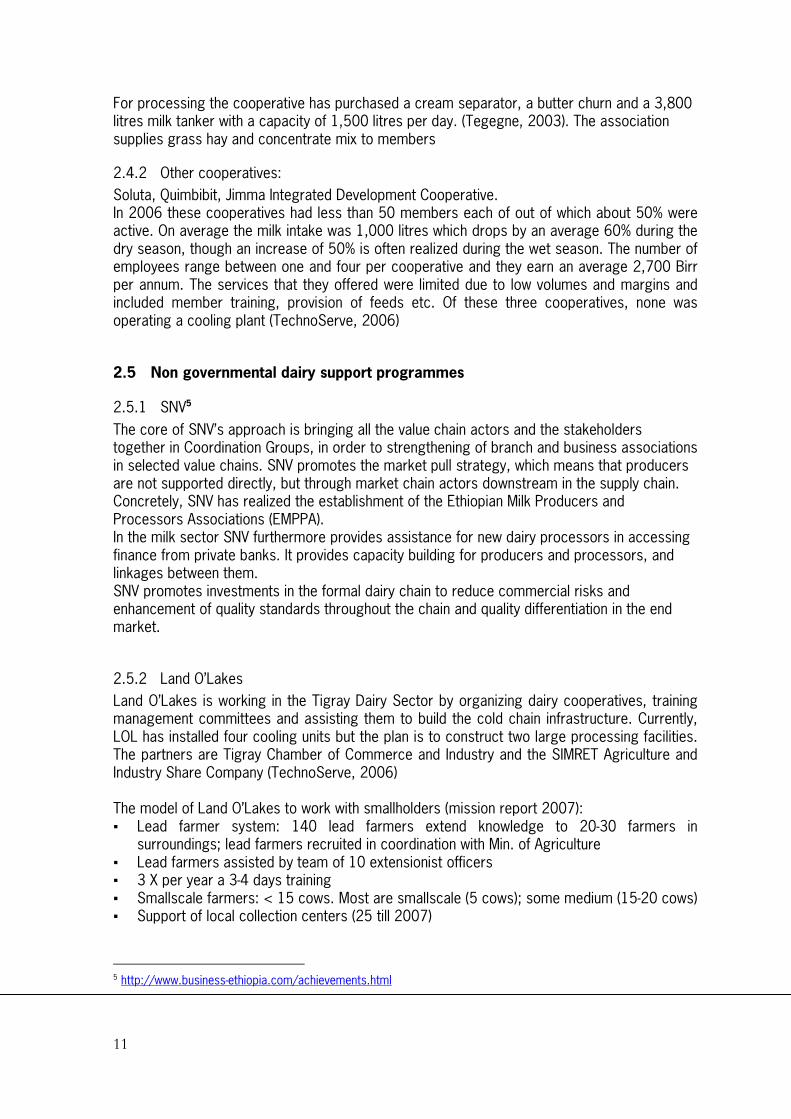
The Ada’a>Liben Woreda Dairy and Dairy Products Marketing Association was established in 1998 in Debre Zeyt town, 45 km southeast of Addis Ababa, Ethiopia with the main objectives to minimize the high transaction cost for the sale of milk and reduce seasonal price fluctuations. In 2003, membership counted 428 full members ( with total of 1716 cows) while another 181 non>member dairy farmers supplied milk to the association. . It disposes of 2 coolers with 25,000 litres capacity for milk collection. The association employs 25 regular staff.
3 Weakening of cooperatives in the Assela area was noted by land O’Lakes, as consequence of restructuring of government departments in charge of supporting cooperatives. Furthermore it was commented that in order to obtain credit, cooperatives have to reconfirm their status as cooperative, thus having to go through bureaucratic procedures again. 4 Once a year the board presents yearly figures and financial results, which limits say by members on operational prccedures.
11
For processing the cooperative has purchased a cream separator, a butter churn and a 3,800 litres milk tanker with a capacity of 1,500 litres per day. (Tegegne, 2003). The association supplies grass hay and concentrate mix to members
2.4.2 Other cooperatives:
Soluta, Quimbibit, Jimma Integrated Development Cooperative. In 2006 these cooperatives had less than 50 members each of out of which about 50% were active. On average the milk intake was 1,000 litres which drops by an average 60% during the dry season, though an increase of 50% is often realized during the wet season. The number of employees range between one and four per cooperative and they earn an average 2,700 Birr per annum. The services that they offered were limited due to low volumes and margins and included member training, provision of feeds etc. Of these three cooperatives, none was operating a cooling plant (TechnoServe, 2006)
2.5 Non governmental dairy support programmes
2.5.1 SNV5
The core of SNV’s approach is bringing all the value chain actors and the stakeholders together in Coordination Groups, in order to strengthening of branch and business associations in selected value chains. SNV promotes the market pull strategy, which means that producers are not supported directly, but through market chain actors downstream in the supply chain. Concretely, SNV has realized the establishment of the Ethiopian Milk Producers and Processors Associations (EMPPA). In the milk sector SNV furthermore provides assistance for new dairy processors in accessing finance from private banks. It provides capacity building for producers and processors, and linkages between them. SNV promotes investments in the formal dairy chain to reduce commercial risks and enhancement of quality standards throughout the chain and quality differentiation in the end market.
2.5.2 Land O’Lakes
Land O’Lakes is working in the Tigray Dairy Sector by organizing dairy cooperatives, training management committees and assisting them to build the cold chain infrastructure. Currently, LOL has installed four cooling units but the plan is to construct two large processing facilities. The partners are Tigray Chamber of Commerce and Industry and the SIMRET Agriculture and Industry Share Company (TechnoServe, 2006) The model of Land O’Lakes to work with smallholders (mission report 2007): ▪ Lead farmer system: 140 lead farmers extend knowledge to 20>30 farmers in
surroundings; lead farmers recruited in coordination with Min. of Agriculture ▪ Lead farmers assisted by team of 10 extensionist officers ▪ 3 X per year a 3>4 days training ▪ Smallscale farmers: < 15 cows. Most are smallscale (5 cows); some medium (15>20 cows) ▪ Support of local collection centers (25 till 2007)
5 http://www.business>ethiopia.com/achievements.html

12
▪ Change indicators at production level: milk yield, land management, hay and fodder production (yield and practices)
▪ Change indicators at collection center: quantity and income from sales ▪ Biggest impacts expected: improved market access and sales; on>farm production level
(udder health, mastitis) (Mission report sept 2007)
Milk imports in Ethiopia
0
500
1000
15002000
2500
3000
3500
1993
1994
1995
1996
1997
1998
1999
2000
2001
2002
2003
2004
2005
2006
Year
To
nn
es
Milk Whole EvpMilk Whole DriedMilk Whole CondMilk Skm of CowsMilk Skimmed Dry

13
3. Product flow in formal chain
3.1 Supply
There are three main areas around Addis Ababa, considered milk shed of the formal dairy chain in the capital:
- Selale area (Chancho): total production around - Debre Zeyt, Narazeth, Assella area - Cholula area
Two factors in the product flow are important to consider:
1. Dry and wet seasons. It is estimated that there is a 60% difference between the volume of milk production in dry and in wet season. Because of more availability of water, the production increases during the wet season (June to September). Small rains in April and May relieve the dry period (October – May) somewhat, though these are more erratic (there were no small rains in 2008).6 As a consequence, fat content of the milk produced in the dry period will be higher than in the wet season.
2. Climatologic conditions: the Sebata and Selale area are the highest regions, located at more than 2,000 metres above sea level. This means an average room temperature of 17>18° C. and a longer shelf life for milk products than for example Debre Zeyt, which is located at 1800 masl. with average room temperature of 21>23° C. Shelf life for ayib may be around 5 days in Selata region versus 3 days in Debre Zeyt. Without cooling installations, quality deterioration of raw milk before processing will be less in colder areas
3.1.1 Selale area
Main operators in the Selale area are Lame Diary, the Selale’s Farmers Union (18 Primary Cooperatives) and Mama Dairy. Recently, Lame Dairy has established three chilling centres (with cooling tank), while it also has established several collection centres along the road. With the purchase of chilling tank for transporting milk, Lame Dairy can now collect further away from Addis. According to the production department of the company, the further away from Addis, the more milk can be bought (probably because of less competition). With the chilling centres, the companies have ceased to pay less to farmers more distanced from the city. Total quantity of milk bought by Lame Dairy in this area is estimated at around 15,000 litres per day in the dry season up to 22,000 litres in the wet season. The Selale Union collects milk from its member cooperatives, 6,000 litres per day during the dry season and 10,000 during the wet season in 2008. Until 2006 the Union sold the milk to
6 On average, for every liter of milk, 5 liters of water intake by cow is needed (drinking and feed). With an average
yield of 7 liters per cow, in Ehtiopia cows will not get the 35 liters needed, not more than 10 liters maybe. Even though there are water point available, the intake of water by cows will depend on the farmer being in the possibility of bringing cattle to those points (maybe twice a day only).

14
Lame Dairy, but since two years it has started to sell to Berta and Family Dairy in equal quantities. This has led to a slightly higher price and less rejection of milk. During 2006 around 13% of all collected milk was rejected in Addis Ababa at factory gate of Lame Diary. According to the Union, in the fasting months, when the company has a low demand for milk, it would add alcohol to the milk so to reject it for quality reasons. The next important collector of milk in the Selale area is Mama Milk (Sebata Agroindustries). This company collects between 5,000 and 8,000 litres of milk per day. Table 2: Raw milk collection in Selale area
Dry season Rainy season Liters / day Liters / day Union 18 primary coops 6,000 10,000 Sold to: Berta 3,000 5,000 Family Dairy 3,000 5,000 3 chilling centers Lame Dairy 15,000 22,500 Mama Milk 5,000 7,500 Total region 26,000 40,000
3.1.2 Debre Zeyt, Nazareth, Asella region
In the milk shed around Debre Zeyt, the Ada’a Liben cooperative is a strong player with its own processing installations. About one third of the milk collected by the cooperative is processed, the rest is sold to Lame Dairy, of which Ada’a cooperative is preferred supplier. Other companies collecting milk in the Debre Zeyt area are Mama Milk (though the company is stronger in the Sebata area) and the smaller processors, such as Holland Dairy, Family Milk, Bora and Lema Family. Table 3: Raw milk collection in Debre Zeyt – Assela area
Dry season Rainy season Liters / day Liters / day Ada'a Liben Dairy coop 4,000 6,000 Sold to: Own processing 1,500 2,400 Lame Dairy 2,400 3,600 Mama Milk 2,000 3,000 Holland Dairy 2,000 3,000 Family Dairy 1,000 1,500 Bora 1,000 1,500 Lema Family 500 750 Total region 10,500 15,750

15
3.1.3 Sebata area
The Sebata area is dominated by Sebata Agro>Industries, that is, Mama Milk. Besides Mama milk, only some cooperatives and smaller farms operate in the area, who mainly sell to Mama Milk. Table 4: Raw milk collection in the Sebata area Dry season Rainy season Liters / day Liters / day Cooperatives 2,000 3,000 Sold to: Mama Milk 1,600 2,400 Family Dairy 400 600 Mama Milk 5,000 7,500 Nur Dairy Farm 1,000 1,500 Tilahun Farm 1,000 1,500 Total region 9,000 13,500
3.2 Demand
A study by Land O’Lakes on dairy consumers showed that the degree of compliance with fasting is very high, 68% on average. Calculations based on a survey held among consumers in Addis Ababa show that daily consumption of milk and other dairy products decreases by almost 60 percent during fasting periods. (Francesconi, 2009). During the fasting season of the Ethiopian Coptic Orthodox Church, Lame Dairy experiences between 30%>40% reduction in sales (TechoServe, 2006; interview Lame Dairy April 2009). A sudden drop in demand will be less in areas with more Muslim population, like in Nazareth, where a reverse trend was commented by a small milk processor with more in stead of less demand during April in comparison with the period after fasting (May). Figure 4: Fasting periods in Orthodox Church Jan Feb Mar Apr May Jun Jul Aug Sep Oct Nov Dec
55 days fasting 16 days 30 days fasting 1 0.7 0.7 1.25 1.25 1 1 0.85 1.25 1 1 0.7
The calendar of the orthodox Christian church involves three prolonged fasting periods per year, and two fasting days every week (Wednesday and Friday), for a total of more than 200 days. See Figure 4. During fasting days most orthodox Christians abstain from consuming products of animal origin. During the period immediately after Easter, and at the Ethiopian New Year (September), Christians will refrain from the usual fasting on Wednesday and Friday. Based on comments, thus an estimation has been made of the fluctuation in demand throughout the year. Demand was also reported to decline slightly during the wet season, as people tend to drink less when it is rainy.
3.3 Mismatch between supply and demand
In Figure 4, a variation quota has been assigned to each month in the year for the market in Addis Ababa, based on the number of fasting days during that period, and comments on increased milk products immediately afterwards.
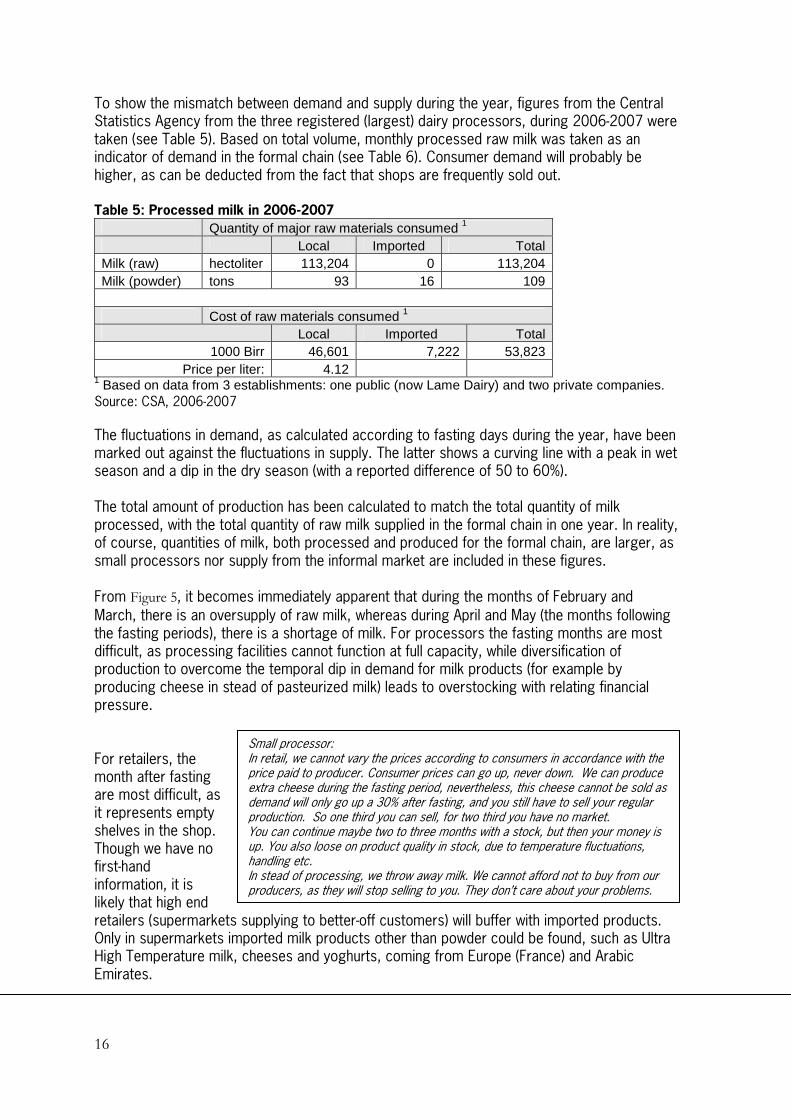
16
To show the mismatch between demand and supply during the year, figures from the Central Statistics Agency from the three registered (largest) dairy processors, during 2006>2007 were taken (see Table 5). Based on total volume, monthly processed raw milk was taken as an indicator of demand in the formal chain (see Table 6). Consumer demand will probably be higher, as can be deducted from the fact that shops are frequently sold out. Table 5: Processed milk in 200662007 Quantity of major raw materials consumed 1 Local Imported Total Milk (raw) hectoliter 113,204 0 113,204 Milk (powder) tons 93 16 109 Cost of raw materials consumed 1 Local Imported Total
1000 Birr 46,601 7,222 53,823 Price per liter: 4.12
1 Based on data from 3 establishments: one public (now Lame Dairy) and two private companies. Source: CSA, 2006>2007
The fluctuations in demand, as calculated according to fasting days during the year, have been marked out against the fluctuations in supply. The latter shows a curving line with a peak in wet season and a dip in the dry season (with a reported difference of 50 to 60%). The total amount of production has been calculated to match the total quantity of milk processed, with the total quantity of raw milk supplied in the formal chain in one year. In reality, of course, quantities of milk, both processed and produced for the formal chain, are larger, as small processors nor supply from the informal market are included in these figures. From Figure 5, it becomes immediately apparent that during the months of February and
March, there is an oversupply of raw milk, whereas during April and May (the months following the fasting periods), there is a shortage of milk. For processors the fasting months are most difficult, as processing facilities cannot function at full capacity, while diversification of production to overcome the temporal dip in demand for milk products (for example by producing cheese in stead of pasteurized milk) leads to overstocking with relating financial pressure. For retailers, the month after fasting are most difficult, as it represents empty shelves in the shop. Though we have no first>hand information, it is likely that high end retailers (supermarkets supplying to better>off customers) will buffer with imported products. Only in supermarkets imported milk products other than powder could be found, such as Ultra High Temperature milk, cheeses and yoghurts, coming from Europe (France) and Arabic Emirates.
Small processor: In retail, we cannot vary the prices according to consumers in accordance with the price paid to producer. Consumer prices can go up, never down. We can produce extra cheese during the fasting period, nevertheless, this cheese cannot be sold as demand will only go up a 30% after fasting, and you still have to sell your regular production. So one third you can sell, for two third you have no market. You can continue maybe two to three months with a stock, but then your money is up. You also loose on product quality in stock, due to temperature fluctuations, handling etc. In stead of processing, we throw away milk. We cannot afford not to buy from our producers, as they will stop selling to you. They don’t care about your problems.

17
Table 6: Calculation of fluctuation in supply and demand of raw milk lts X 1000 Jan Feb Mar Apr May Jun Jul Aug Sep Oct Nov Dec Total
Demand 968 677 677 1,209 1,209 968 968 822 1,209 968 968 677 11,320
Supply 825 770 800 850 950 1,050 1,150 1,200 1,150 1,050 950 850 11,595
Figure 5: Mismatch between demand and supply within the year
0
200,000
400,000
600,000
800,000
1,000,000
1,200,000
1,400,000
Jan
Feb Mar Apr
May Ju
n Jul
Aug Sep Oct NovDec
Supply
Demand
3.4 Conclusion
Two phenomenon are the result of the mismatch between supply and demand. First, the variation shows that there is a direct link between the formal and the informal market: the latter functions as a buffer. During the months of shortage of supply, the informal market will be at its smallest size, while in the months of abundance of supply, producers are forced to sell their milk through the informal chain. Second, the practice of buffering gives rise to the formation of spot markets with no development of vertical collaboration between market partners. The high fluctuation in product flow is thus a disincentive for quality differentiation in the chain. There are two examples most mentioned by market partners, both producers and processors. First that in the period of milk shortage (April, May) producers will default on contracts to find highest price, while rejected milk by one processor will be bought by another, affecting minimal quality standards in the chain. Another example refers to the period of oversupply, during which producers (cooperatives, Unions) are forced to take back milk rejected at factory gate and process it themselves for the informal market, resulting in loss of quality. It was reported that large processors will tamper with milk samples (adding more alcohol) so to be able to reject raw milk on quality grounds when supply is high and demand low.
18
4. Organizational arrangements in the dairy chain
4.1 Contracts between farmers and cooperative / trader
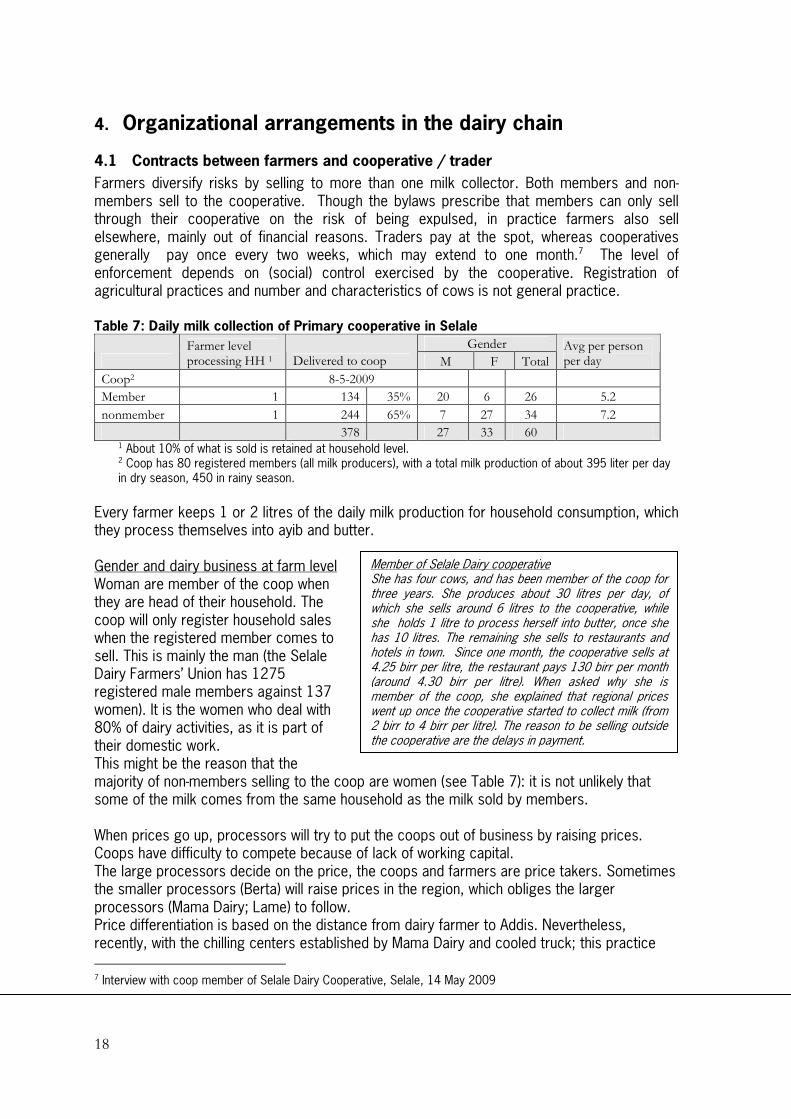
Farmers diversify risks by selling to more than one milk collector. Both members and non>members sell to the cooperative. Though the bylaws prescribe that members can only sell through their cooperative on the risk of being expulsed, in practice farmers also sell elsewhere, mainly out of financial reasons. Traders pay at the spot, whereas cooperatives generally pay once every two weeks, which may extend to one month.7 The level of enforcement depends on (social) control exercised by the cooperative. Registration of agricultural practices and number and characteristics of cows is not general practice. Table 7: Daily milk collection of Primary cooperative in Selale
Gender
Farmer level processing HH 1 Delivered to coop M F Total
Avg per person per day
Coop2 8-5-2009
Member 1 134 35% 20 6 26 5.2
nonmember 1 244 65% 7 27 34 7.2
378 27 33 60 1 About 10% of what is sold is retained at household level. 2 Coop has 80 registered members (all milk producers), with a total milk production of about 395 liter per day in dry season, 450 in rainy season.
Every farmer keeps 1 or 2 litres of the daily milk production for household consumption, which they process themselves into ayib and butter. Gender and dairy business at farm level Woman are member of the coop when they are head of their household. The coop will only register household sales when the registered member comes to sell. This is mainly the man (the Selale Dairy Farmers’ Union has 1275 registered male members against 137 women). It is the women who deal with 80% of dairy activities, as it is part of their domestic work. This might be the reason that the majority of non>members selling to the coop are women (see Table 7): it is not unlikely that some of the milk comes from the same household as the milk sold by members. When prices go up, processors will try to put the coops out of business by raising prices. Coops have difficulty to compete because of lack of working capital. The large processors decide on the price, the coops and farmers are price takers. Sometimes the smaller processors (Berta) will raise prices in the region, which obliges the larger processors (Mama Dairy; Lame) to follow. Price differentiation is based on the distance from dairy farmer to Addis. Nevertheless, recently, with the chilling centers established by Mama Dairy and cooled truck; this practice
7 Interview with coop member of Selale Dairy Cooperative, Selale, 14 May 2009
Member of Selale Dairy cooperative She has four cows, and has been member of the coop for three years. She produces about 30 litres per day, of which she sells around 6 litres to the cooperative, while she holds 1 litre to process herself into butter, once she has 10 litres. The remaining she sells to restaurants and hotels in town. Since one month, the cooperative sells at 4.25 birr per litre, the restaurant pays 130 birr per month (around 4.30 birr per litre). When asked why she is member of the coop, she explained that regional prices went up once the cooperative started to collect milk (from 2 birr to 4 birr per litre). The reason to be selling outside the cooperative are the delays in payment.

19
has become outdated: farmers get the same price, independently of distance of their location from Addis Ababa.
4.1.1 Quality control
Quality of milk is better (higher fat content) in the dry season than in the rainy season, because of water availability. On average, for every liter of milk, 5 liters of water intake by cow is needed (drinking and feed). With an average yield of 7 liters per cow, here cows will not get the 35 liters needed, not more than 10 liters maybe. Even though there are water point available, the intake of water by cows will depend on the farmer being in the possibility of bringing cattle to those points (maybe twice a day only). Most farmers bring their milk in plastic containers (“jerry cans”) of 25 to 40 litres. Some coops have aluminum containers of 55 liters (donated by Finida / SNV) available to their members. These are sterilized by the coop: one for morning milk, and one for evening milk. Price difference in container: plastic (400 birr); aluminum (50 liter) 1,200 birr. All quality control at field level (collection centre) is the so called platform testing quality control, done with simple equipment. An alcohol test verifies the acidity of milk, while the lactometer test determines the specific gravity to know fat content (to know whether water has been added). The milk is also tasted. There is no differentiation in payment to farmers for quality milk, mainly because there is no possibility to sell it differentiated according to quality. According to the Selale Farmer’s Union, it causes farmers to go for the minimum quality level (fat content).
4.2 Contracts between cooperative / Union and processors.
Contracts are made based on volumes, and price. Price is fixed for 3 to 6 months, but cooperatives commented three to five changes in price during the year, mainly adjustments in dry season when feed becomes scarce and production costs as well as milk prices go up, which is readjusted in the wet season when large volumes come into the market. In the case of the Selale Union, the Union pays the price set by the primary cooperative to members (with difference of 10 cents), which in turn follows local spot prices. Negotiation conditions in the Selale area improved with the entrance of new buyers>collectors. Table 8: Estimation of price down break:
Location Price / cost per liter (birr)
Payment by
Price to consumer 6
Factory gate 5.50 Processor to Union
Transport paid by Union Selale>Addis Abeba 0.25
Collection center Jate Dairy Coop (member of Selale
Dairy Farmers Union)
5.1 By Union to Primary coop
Coop Member, delivery collection center 5 Jate Coop to member
In Nazareth, the Awash Dairy Cooperative has a small collection centre – dairy shop where members come to bring their milk and consumers come to buy it. Members have a small booklets in which all milk delivered is registered. Two women manage the collection centre: one for the collection, one for sales to the public. Price paid to the producer is 4.75 at the shop, selling price to the consumer is 6 birr. The cooperative collects around 1,500 litres, of which it sells 300 out of the shop to customers, and 1,200 litres to Holland Dairy in Debre Zeyt (at 5 birr per litre).

20
It is the large processors (Lame Dairy and Mama Milk) that set price, though two years ago in the northern milk shed of Selale, it was Berta and Holland Dairy that increased price in order to gain market in the region. Cooperatives have also been reported to default on contracts in volume when there is shortage of milk in the market, selling elsewhere.8
4.2.1 Quality control
As noted previously, rejection rate of milk seems to be higher during times of abundance of supply. Formal arbitration procedures for quality control between market partners do not exist, nor enforcement on contracts or standards. The nearest accredited laboratory is said to be in Kampala. All processors use the same equipment to assess the quality of the milk (lactometer, alcohol test). The largest processors (Lame, Mama) have a small laboratory to do additional microbial and antibiotic tests. Processors do not differ payment for quality (fat content), though different qualities may be discernable by containers from coops at factory gate. Lame Dairy uses preferred suppliers for making cheese during the spring fasting period for quality reasons. These producers do not get a premium for their milk.
4.2.2 Processing of rejected milk
Rejected milk is generally processed into butter and ayib. The Jate Dairy Coop, member of the Selale Farmers’ Union notices that the ayib provided by the Union is of less quality than that processed and sold by the coop9. One reason is that production management differes per cooperative, another that the rejected milk used by the Union is not as fresh as the milk used by the primary coop. The coop is obliged by Union to sell Union’s products at local selling point, but they prefer not to, as their own products are better. Reportedly customers are used to the higher quality of the coop itself., even though the Union sells it at an inferior price (75 birr for butter, while coop at 85 birr).
8 Interview Production department Lame Dairy, 13 May 2009 9 To make 1 kilo of butter, the Union needs around 30 liters of fresh milk; versus 21 liters by the coop.

21
5. Market and marketing of dairy products
5.1 Retail sector
Within Ethiopia, supermarkets have gained presence during the last five years in Addis Ababa, especially in and around the richest area of the city (Bole) where the number of supermarkets doubled. The very first supermarket (Bambis, which is still in business) was established in Addis Ababa at the end of the Imperial regime (1930>1974). At the moment there are 22 supermarkets registered with the chamber of commerce of Addis Ababa. Outside Addis Ababa the number of supermarkets remains very limited. Supermarkets in Ethiopia appear to be concentrated in a few wealthy neighbourhoods (Bole area) of the capital city, as observed also in other poor countries (World Bank 2007: 126, cited in Francesconi, 2009). Table 1: Supermarkets in Addis Ababa Supermarket No.
branches Supermarket No. branches
Bambis 1 Felix 2
Showa plc 2 Ethiopian 2 Fantu 4
Shi Solomon 4 Hadiya Trading Enterprise 1
Seven Eleven 1 Leonardo 1
Negash Supermarket 1 Abrico 1
Addis Supermarket 1 Abadir 2
Shoppers’ Mart 3 Friendship 1
Novis 3 Total branches: 28
Source: Regoverning Markets, 2007
Due to a lack of adequate information it is not possible to quantify the share of supermarkets in the food retail sector of Addis Ababa. With respect to the dairy sector, however, primary data from a survey among consumers in Addis (Francesconi, 2009) shows that supermarkets sell on average 35,000 kg (in milk equivalent) of dairy products per day, accounting for an 11 percent share of the total dairy retailed in Addis Ababa in 2006.
Dairy outlet No. Sales (kg milk equiv.)
Share of total dairy retail
Share industrial dairy products*
Share traditional dairy
Supermarkets 22 35,000 11% 29% 2%
Other retailers ? 89% 61% 98% * 91% of dairy products sold in supermarket is industrially produced. Source: Francesconi, 2009
5.2 Assortment and prices in Addis Ababa
A quick survey among supermarkets and kiosks in Addis Ababa and Nazareth shows that consumer retail can be divided into three categories. An overview of the assortment in each

22
retail outlet surveyed10 can be found in Table 1. The different presentations and correspondent
prices for each product in each retail outlet can be found in Annex 2
According to Lame Dairy, supermarkets have grown in importance, and there are 70 retail outlets with a dairy section. Retail prices are higher, but only slightly. There are currently ten brands of pasteurized milk in the market. The last 10 years competition has become fierce, because of new entrants.11 Lame Dairy carries pasteurized milk, table butter (200 grs., cooking butter (1 kg), ayib, cheese (one mold only for supermarket and hotels), cream and yoghurt. Yoghurt is now distributed in bottles of 100 liters to the depots, where cups are filled. Lame Dairy has ordered processing facilities to make branded yoghurt cups, with a capacity of 1,000 liters per day.
5.2.1 Supermarkets
Supermarkets with larger surface and broad assortment (Bambis; Fantu; Abadir) have a relatively large section of cooled shelves and carry branded products usually from one specific processor. Besides national production, these shops also have imported dairy products, mostly cheeses and sometimes UHT milk (Abadir carries both tetra pack and bottled UHT milk, both from France). The national production includes tetra pack pasteurized milk (Bambis); assortment of cheeses (Fantu carries several smoked cheeses and provolone from own production) and sometimes non branded table and cosmetic butter. On entering the supermarkets, it is immediately visible that they target higher class and expatriates. Even in the supermarket, quality problems were visible, like the inflated top of Genesis yoghurt, whereas expiring data as registered on package was still 7 days away.
5.2.2 Kiosks
Kiosks are small grocery stores with one or two glass refrigerators mainly carrying unbranded plastic sachets of fresh milk, and butter. Cheese and ayib are also sold. In Nazareth, branded milk (Mama milk) was sold out at the end of the afternoon. Kiosks have closed (ordinary) refrigerators to store dairy products and soda water. For prices see also Table 10.
5.2.3 Dairy shops
Dairy shops in Addis Ababa resemble kiosks, only with relatively more assortment of dairy products. In Nazareth, the dairy shops only sell milk, butter, ayib and cheese. The 500 ml sachets of Ada’a Liben milk, sold in the Holland Dairy shop in Nazareth is wrongly labeled as 250ml.
10 Only mentioned shops were visited. As registration could not take place in the shop itself, we have no pretense of completeness of data. 11 Interview Mrs. Shewanesh, head marketing dept. lame Dairy, 13 May 2009

23
Table 9: Assortment in retail outlets in Addis Ababa
Product Abadir Bambis Beral Berta Fantu Shoppers
mart non branded X X Fresh milk
branded X national X UHT milk
imported X table X X X cosmetic X X
Butter cooking X
non branded X X branded X X
Yoghurt imported X
non branded X X X X X branded X X X
Cheese imported X X X X
Table 10: Assortment in some retail outlets in Addis Ababa
Retail outlet Product Description Unit Price (birr)
Holland dairy shop Fresh milk Sachets with brand Ada'a Coop 500ml 5.00
Kiosk Fresh milk Sachets with brand Mama milk 500ml 6.00
Holland dairy shop Cheese cottage (ayib) 1 kg 16.00
Holland dairy shop Cheese Gouda Genesis 1 kg 100.00
Holland dairy shop Yoghurt Holland Dairy plain cup 500ml 7.00
Holland dairy shop Yoghurt Holland Dairy plain cup 250ml 4.00
Holland dairy shop Yoghurt Holland Dairy flavoured cup 250ml 7.00
5.3 Customer preferences
In the study by Francesoni (2009), the main reasons for consumers in Addis Ababa (in household survey) for buying dairy from traditional outlets is that supermarkets are too far from home or simply unknown. But the most frequently given answer refers to culture and habits. Many households in Addis Ababa have been purchasing from urban farmers, itinerant traders and wet markets for generations, and tend to consider supermarkets as ‘fancy places for rich to shop’. Some consumers mention the superior taste and nutritional value (fat content) of raw (whole) milk from urban farmers in comparison to pasteurised milk from supermarkets. Price difference is not a main reason not to buy dairy in supermarkets. Those who do buy dairy in supermarkets mention especially the superior hygiene of products and stores and the cleanliness is mentioned as a reason to buy in supermarkets. (Francesconi, 2009, p 65.) See Figure 6.

24
Figure 6: Dairy consumption breakdown by product, Addis Ababa, 2006
Raw milk
Pasteurized milk 15%UHT milk 0%
Powder milk 8%
Fermented butter 38%
Pasteurized table butter 1%Ayib 6%
Source: Francesconi, 2009, p. 61.
The study by Land O’Lakes confirms the strong preference for traditional products and family / social traditions
- Low level of exposure to new products (LOL) - Stable demand for cheese and butter - Yogurt indicated by consumer to be limited in price and availability (LoL)
In general, the development of formal dairy markets depends on: ▪ employment and educational level of women (one additional year of education gives a 2%
increase of probability of buying in supermarket (Francesconi, 2009) ▪ purchase power (availability of refrigerator) ▪ penetration level of large supermarkets
5.4 Product distribution and payment policies
The largest processor, Lame Dairy Industries has 11 sales routes within a diameter of 20 km in Addis Ababa. Three of the routes sort to the higher classes (Bole area, where most of the supermarkets are situated), the rest to middle and low income areas (Piazza, Mercato). On each of the sales routes, a truck goes out at 5 am in the morning, returning at 12:00 to replenish stock according to orders received by the sales department. Only two of the trucks are refrigerated. On 4 of the 11 routes, depots are located, from which customers can purchase their products.12 In total Lame dairy distributes 25,000 liters of milk and 250 to 300 kilos of butter. Ayib, soft and hard (Gouda) cheeses are not distributed on daily basis. In total Lame Dairy sorts to 13 kiosks and 95 wholesalers. Of total products distributed, 25% goes through the depots; 15% to supermarkets and institutional market (hospitals, hotels, university), and 10% is distributed to individuals out of the truck. 12 Previously, Lame Dairy only had 4 distribution routes

25
Contracts are made for 3 or 6 months, or a year. The contract establishes amount, price and general delivery conditions. The company does not sell on consignment. There are three payment models: Advanced payment => about 12 % of all sales On credit => about 8% of all sales. In cash payment => rest of sales. Lame Dairy has tried to expand outside Addis from Mojo to Awassa and Nazareth, but the initiative was halted after technological problems occurred with the cooled truck.
5.5 Markets outside Addis Ababa
As noted before, variation in product flow can be mitigated by selling on end markets with different fasting periods. For example 75% of the population in Addis Ababa is orthodox, against 16% Muslim, while in Dire Dawa 37% is orthodox and 58% Muslim. Table 11 shows the main cities of Ethiopia, unfortunately no distinction according to religion could be found. Figures on rural and urban population according to religion in Ethiopia are shown in Figure 8. The figures that are the basis of all figures in this section can be found in Annex 3 and come from the CSA Census 2007. Figure 7: Population according to religion in Addis Ababa and Dire Dawa
Adis Ababa (urban)
Orthodox75%
Protestant8%
Islam16%
Other1%
Dire Dawa (urban)
Orthodox37%
Protestant4%
Islam58%
Other1%

26
Table 11: Size of main cities in Ethiopia
Main cities Ethiopia
population population
16761994 286562007 name
estimate census
Addis Ababa 2,084,588 2,738,248
Dire Dawa 164,851 342,827
Hawassa City 69,169 259,803
Adama (Nazret) 127,842 222,035
Bahir Dar 96,140 220,344
Mekele 96,938 215,546
Gonder 112,249 206,987
Harari 76,378 183,344
Dessie 97,314 151,094
Jimma 88,867 120,600
Shasheme .. 102,062
Bishoftu 73,372 100,114
Note: numbers from the 2007 census are preliminary results.
Source: CSA, Ethiopia
Figure 8: Urban and rural population in Ethiopia according to religion
Urban population Ethiopia
Orthodox59%Protestant
14%
Islam26%
Other1%
Rural population Ethiopia
Orthodox40%
Protestant20%
Islam35%
Other5%
5.5.1 Urban markets in Ethiopia
The regions of Amhara and Oromia have most population. Oromia has most people living in urban setting ( 3.37 million inhabitants), followed by Addis Ababa (2.74 million inhabitants)

27
Figure 9: Religion per region in Ethiopia
Religion per region in Ethiopia
05,000
10,00015,00020,00025,00030,000
Tig
ray
Afa
r R
egio
n
Am
hara
Oro
mia
Som
ali
Ben
isha
ng.
Snn
p
Gam
bela
Har
ari
Add
is A
baba
Spe
cial
Enu
mer
atio
n
Th
ou
san
ds
Other
Islam
Protestant
Orthodox
Figure 10: Urban population according to religion and region
Urban population per region
0
5001,000
1,5002,000
2,500
3,0003,500
4,000
Tigray
Amha
ra
Orom
ia
Somali
Snnp
Addis
Ababa
Th
ou
san
ds
Po
pu
lati
on Other
Islam
Protestant
Orthodox
Figure 11: Rural population according to religion and region
Rural population per region
0
5,000
10,000
15,000
20,000
25,000
Tigray
Amha
ra
Orom
ia
Somali
Snnp
Addis
Ababa
Th
ou
san
ds
Po
pu
lati
on Other
Islam
Protestant
Orthodox

28
6. Summary of dairy supply chain aspects
Marketing aspects ▪ Highly fluctuating demand because of fasting days ▪ Highly fluctuating supply in volume and quality because of wet and dry season ▪ Fragmented market at supply side ▪ Unreliable supplies: seasonal milk fluctuations across the seasons, unfair distribution of the
products between different outlets. Delays in collecting milk from the farmers to the processing plants and in delivering from the processors to the distributors lead to high incidences of spoilage.
▪ In a survey by D’Haese et al., farmers pointed out the fluctuation of the milk price as their main problem, followed by the prices of feed and quality control.
Market aspects ▪ Negative consumer perception of product quality and hygiene of (industrialized) dairy
products ▪ Low level of supermarket penetration as main retail outlet for formal market chain ▪ Low purchasing power of average Addis consumer ▪ Demand for milk is inelastic with respect to income and price (Getachew and Gashaw
2001, in Ahmed, 2003 p.5) ▪ Level of substitution (imports) ▪ A price sensitive market: consumer wants cheap products, cheap packaging material
needed (strategy: give impulse to out>of>home consumption). Makes it difficult to add value and differentiate consumers with brand?
▪ Out>of>home largely untapped ▪ Design of locally produced milk products not attractive compared to the imported
products. Organizational aspects: ▪ No (enforcement of) public quality standards in chain (production practices; hygiene,
product qualities) ▪ Absence of minimum quality standards set by industry. ▪ Unstructured market chain at producer level (smallscale farming) and consumption level
(large informal market). ▪ Low availability of quality input services (AI; credit; feed) ▪ Small scale farm management systems favouring use of exotic cattle breed and incursion
on informal market chain (directly to consumer with traditionally processed milk products (butter; ayib)
▪ Inefficiency of bulking: high transaction costs ▪ Weak entrepreneurial management and general operation of primary cooperatives and
Union’s, mixed with strong political influences. Technological bottlenecks: ▪ Almost no chilling and cold room facilities ▪ Faulty processing equipment in some processors resulting in leakage of the processed
products ▪ Transportation system without refrigeration leading to high incidences of spoilage.

29
▪ Withdrawal of stocks of some products (Lema milk) due to poor packaging and no effective advertising leading to regular losses.
Quality aspects ▪ The monitoring and control of the milk and dairy regarding quality still remains limited.
Deliveries are reviewed with an alcohol test and a gravity test to check on basic food safety and possible fraud (D’Haese, 2005). No bacteriological laboratories; quality control only using physical and chemical laboratories.
▪ Production practices (hygiene at milking, mastitis); ▪ No utensils to bring milk from farmer to collection center: milk vessels used (jerry cans or
aluminum) ▪ Local farmers have resistance against improved breeds, as the fat % of the milk is
perceived to be lower (Report Ethiopia Mission Sept 2007, p. 16) Farming aspects ▪ Unlike residue management, hay and silage making or adoption of forage legumes often
involves the introduction of a new crop into the farming system. How the new crop fits into the existing system is critical to successful introduction.
▪ A higher level of expenditure on feed does not represent a higher quality of milk; because of low>quality feed. Farmers with more cattle are likely to afford better feed and more care.
▪ Crossbreed cattle give higher yield per cow than zebu cattle, but the latter suffer from less milk contamination (probably due to higher adaptation to environment: feeding regime, temperature, diseases, water) D’Haese, 2005.
▪ Performance of dairy chain directly linked to performance of grain crop market chain and industry; and subsequently of animal feed prices.

30
7. Conclusions
7.1 Description of the formal dairy chain
The formal dairy chain is defined as the registered marketing channels through which milk is produced and processed in established processing plants and put on the market in packed products. In practice, the distinction between the formal and informal market is difficult to make. Several small processor are registered and pack their products, but without branding and with simple packaging (like yoghurt in plastic coffee cups). The formal peri>urban dairy chain around Addis Ababa is characterized by three main production areas: Selale tot the North of the capital (26 to 40,000 liters per day), Debre Zeyt and Assela to the South East (10 to 15,000 liters); and Sebata area to the South West (9 to 13,000 liters). Increased competition has led to the establishment of chilling centres so milk can be collected further away from Addis, and to better prices for farmers and cooperatives. Individual farmers diversify risk by selling to different buyers. Cooperatives generally pay more, but have longer payment periods (a standard 15 days, which may prolong into a month). Excusive selling to the cooperative by members is prescribed but hardly enforced. There are two large dairy processors (Lame dairy and Mama milk / Sebata Agro>Industries) collecting milk mostly from small>scale farmers in each of the areas, through collection centres along the main roads. Lame Dairy is a privatized state company and the oldest, while Sebata AgroIndustries has been a runner up with the brand Mama milk and the only company to have started with Ultra High Temperature (UTH) processing of pasteurized milk. For the last decennium, more (around 10) small processors have entered the market, half of which have their own dairy farm. Most also own at least one retail outlet (dairy shop). Cooperatives have also started to function as marketing channels for raw milk. Ada’a Liben cooperative in Debre Zeyt is the oldest and the only one with formal processing facilities (branded packaging of pasteurized milk). In general cooperatives in their operations suffer from the different functions that they are supposed to perform: political instrument for government (and donor) policies; service provision at discount to members, and efficient marketing. The retail market consists of around 28 supermarket outlets / dairy shops of different size, and numerous kiosks. Total amount of shops with a dairy section in Addis Ababa is estimated at 70. The smaller shops target the lower end market with unbranded product, mainly milk in 500 ml sachets, butter (table, cooking, cosmetic), ayib and some cheese, while the larger shops target higher end market and expatriates with an larger assortment of tetra packed fresh and (imported) UHT milk; (imported) yoghurts and different kinds of (imported) cheeses. In the latter case, prices to consumer are slightly higher. Most variation in price is found in yoghurt and cheese.

31
Contracts between market partners are made for a maximum period of one year. Agreements are made on volumes and price. Independently of the duration of the contract, price is adjusted three to five times a year according to spot market prices. Default on contracts by farmers / cooperatives occurs during period of scarcity of supply; and by processors during months of oversupply of raw milk. There is hardly any collaboration in chain (neither horizontal nor vertical). Quality control is almost exclusively done by platform testing with a lactometer for specific gravity and an alcohol test for measuring acidity of milk. No arbitration in quality control takes place. More detailed quality measurement (microbiological and antibiotic) only takes place at largest processing plants. There are no voluntary minimum quality standards set by the dairy industry. This means that milk rejected by one processors, may be accepted by another, undermining production for quality. There is no premium for quality milk.
7.2 Performance of the dairy supply chain
The high variation in both supply and demand of (fresh) milk is the main determinant for the formal dairy chain. It is this variation that affects performance of the chain and feasibility of entrepreneurial operations throughout the chain. Peaks in demand after fasting periods while supply suffers a dip during the dry period, lead to shortage of milk supply in Addis Ababa. During the fasting period, because of the lack of demand, producers suffer from low milk prices with high animal feed prices, especially in the months before Easter. The informal chain functions as a buffer for oversupply (peak in August) and undersupply (peak in April>May, right after Easter) in the formal market. As a result of the product flow variations, long term contracts in volume are difficult, and the formal milk supply chain functions mainly on spot market basis, with no fixed volumes between market partners nor price differentiation based on quality. Variations in demand and supply give rise to strong price fluctuations for farmers during the year, and commercial risk for farmers and other market actors. Availability of feed has direct influence on the performance of the formal dairy supply chain. Shortage of feed gives rise to high prices, affecting dairy farmers’ economy (feasibility if farmer has financial capacity to buy) and yield per cow (if farmer has no financial capacity to buy). Access to water sources and to land for grazing or production of own animal feed around Addis Ababa also influences feasibility, as having own production is by far cheaper than purchasing feed / concentrates. Performance of the dairy chain is affected by low technology level throughout the chain: scarce use of cooling facilities; use of old and simple small scale processing equipment, resulting in dubious hygiene conditions and wastage. Current strategies by processors to mitigate variations in supply and demand are: - Production of Ultra High Temperature (UHT) milk, which has longer shelf life (3 to 6
months). This is done by processor with largest market share, Mama Milk (Sebeta Agro>Industries). A non>exhaustive sampling of retail market outlets in Addis showed that UHT milk is mainly sold at larger supermarkets (Bambis, Abadir), supplying to wealthier

32
consumers, including expatriates. No UHT milk from Mama Milk was found in the short market survey done.
- The commented strategy of Mama Milk to add milk powder when producing liquid milk, might also serve to mitigate fluctuations in supply and demand.
- Bridging periods of dips in demand by processing of products with longer shelf life such as ayib and cheese (Lame dairy). This alternative is limited in accordance with (quality of) storage facilities and financial capacity of processor (carrying stock affects cash flows and financial position).
- Adjust processing capacity to average, and buy additional milk products during peaks in demand (smaller processors).
33
8. Recommendations As noted, the main factor affecting feasibility in the formal dairy supply chain is the variation in product flow because of temporal excess and scarcity of raw milk during the year. If the sudden drops in demand are mitigated, price fluctuation will be less, and a stable price will provide more incentive to farmers to invest in quality and equipment. Alternatives for variations in product flow are the diversification of markets towards urban markets with more Muslim population (good distribution network is needed) and export; (diversification of dairy products with extended shelf life and usage on fasting and non fasting days; and upgrading of storage and transportation technologies throughout the chain. For export, the current processors business do not comply with international standards (old / rudimentary facilities), maybe with the exception of Mama Milk (Sebata Agroindustry) which is establishing HACCP standards. Diversification of markets and dairy products with longer shelf life require heavy investments which will only be feasible to larger dairy processors. Smaller processors nor farmers are sufficiently organized to engage in joint investments. As a consequence, two different upgrading strategies are envisaged for upgrading feasibility and quality in the formal dairy chain.
8.1 Amplifying the formal dairy market in Ethiopia
The formal dairy market can be amplified by diversification of products and penetration of new markets (nationwide and export). To do this, new investments are needed in production methods and distribution systems. As said, UHT milk or powder milk is an option for bridging slack periods in demand in the Addis Ababa market. For the marketing of large UHT volumes, targeting the middle class (without refrigerator) rather than high end (niche) consumer segment is an option, with smaller packages targeting kiosks. The aim would be to work with high volume, high rotation and (relatively) low price, rather than for price differentiation. Products with higher shelf life enable amplifying the market outside of Addis Ababa where fasting practices are different. A strong distribution network is needed. Yoghurt is seen as an untapped market for market actors; with which new consumer segments can be addressed (the youth with drink yoghurt).
8.2 Upgrading strategy for peri6urban farmers and cooperatives of farmers
Income opportunities in more formal sales may be better, but as quality standards are higher, rejection rates are higher. As a consequence smallholders face the need for more asset specific investments and more risk. Feed (water) and variation (both in demand and in supply during the year) are main hurdles to overcome regarding feasibility. These have a direct link with geography; farm models (mixed agriculture of commodity cropping), land reallocation and performance of the grain supply chain.

34
For farmers, efficient bulking and up>scaling in the different phases of the supply chain appears to be a better strategy for amplifying the formal market, than strategies of adding value. Several studies note the consumer preference for informal products because of perceived higher quality. As farmers and cooperatives cannot compete with the lower transaction costs of large processors and their market position in the higher end customer segment; organizing supply by bulking at average quality standards close to home may be a better option. Transaction costs can be limited and specific costumer demands satisfied with the development of branded assortment of traditional products for local markets within the milk sheds. For cooperatives, more transparency in the links between the different commercial operations needs to be generated, as well as more insight in how these operations interrelate in costs and cash flows. To achieve this, the ownership relation between cooperatives and individual members needs to be well defined, that is, property rights and titles to assets need to be clear to all. It may be necessary to subdivide operations into separate companies managed by the cooperative but owned by specific members. Entering the formal chain is an incentive for increasing the number of cows and for investments in better breeds. This means that improving the informal chain by means of upgrading traditional processing technologies will lead to higher quality, entrepreneurship and more supply. Several market parties suggested stronger government regulation and enforcement, for example by forcing farmers only to sell milk to cooperatives or established processors, or by prohibiting unbranded dairy products, but this creates other problems (pushing all small scale enterprises out of business).
8.3 Proposals for further research:
1. Cost>benefit analysis comparing small>scale production (< 10 cows; estimated at 75% of all dairy farms around Addis) with large scale production (> 25 cows, estimated at 1%of all dairy farms)., including environmental pressure. The head of the production department of Lame Dairy commented that having own milk production is more costly than purchasing milk (with average price of 4.12 birr in 2006/2007)
2. Cost>benefit analysis for export potential; including purchasing power of regional markets (Middle East) and competition analysis of other milk producing countries (Kenya, Egypt).
3. Consumer behaviour to assess market potential of different dairy products: a. UHT milk with higher shelf life is also a viable option for low>income households
(without refrigerator). What is demand for UHT milk? In what presentations? 4. Analysis of land and water usage for crop and commodity production ; farming
systems; and long term development of Addis Ababa and peri>urban agricultural sector. 5. Analysis of link between performance of grain supply chain and dairy supply chain
(prices)

35
References Ahmed, Mohamed A.M.; Simeon Ehui, and Yemesrach Assefa (2004): “Dairy development in Ethiopia”, EPTD Discussion Paper No. 123, International Food Policy Research Institute D’Haese, Marijke; Gian>Nicola Francesconi and Ruerd Ruben (2005): “Network management for dairy productivity and quality in Ethiopia, Development Economics Group, Wageningen University. Tefera, Eshetu (2008): “The Role of dairy cooperatives in stimulating innovation and market oriented smallholders development: The case of Ada’a Dairy Cooperative, Central Ethiopia”, M. SC. thesis, Department of Rural Development and Agricultural Extension, School of Graduate Studies, Haramaya University.
Fransesconi, Gian Nicola (2009): “Cooperation for competition, Linking Ethiopian farmers to
markets”, PhD. thesis, Mansholt Graduate School of Social Sciences, Wageningen University.


1
Annex 1: ILRI classification of dairy farming systems Traditional crop / livestock farms in rural areas
Intensified dairy/crop livestock farms
Crop/livestock farms with intensive cropping
Specialized dairy farms Peri-urban farms in and around secondary towns
Intra urban Addis Urban secondary town
25-130 km from Addis (avg 68 km)
Around Addis 25-60 km from Addis 15 - 60 km from Addis 25-60 km from Addis “milk shed” around Addis
Smallholder farms with intensive dairy production system. Landholding 50% of traditional farms and milk production 15% higher.
Large farms with average holding of 8.9 ha
Grazed on own or rented land
zero grazing Grazing, some stallfeeding
Little or no specialised inputs (improved breeds, supplementary feed, housing, veterinary care, etc)
Experiences with dairy development projects under the Ministry of Agriculture; which influence on production system. Improved genotypes, artificial insemination, improved forages, concentrate feeding, housing, calf bucket feeding and early weaning are common practices.
Cropping system more intensive, with a frequent use of fertilisers. Use of supplementary feeds to animals
Frequent use specialised inputs such as improved genotypes, artificial insemination, forage production, improved housing, concentrate feeding, veterinary care, etc.
Grazing, stall-fed roughages; basal diet is hay; agro-industrial by-product. Commercial concentrate rations used by large farms. Use of non-conventional feed resources like hulls of pulse and other crops, traditional brewery and alcohol residues, poultry waste, vegetable and fruit wastes
Stall-feeding based on purchased hay, agro-industrial by-products and concentrates.
Cross bred and high grade cows; highest level exotic blood
High level exotic blood
Average 4 cows Average 4 cows; but Farms and herds are 25% larger than the traditional crop / livestock farmers
Average 17 cows Average 5 cows Average 2 cows
Daily sales of fresh milk to DDE. Excess milk is processed into butter and a local cottage cheese (known as Ayib) and sold in local markets.
Fresh milk is sold to the DDE. Rare practice of making dairy products.
Daily sales of fresh milk > 30 litres; primarily to local informal markets or DDE. Additional off-farm activities often generate more income than livestock.
High yield per cow; sold directly to local market
Milk sold to local markets or DDE; or processed into butter / ayib. Off-farm activities represent 2/3 of their income
Source: Azage Tegegne, Million Tadesse, Alemu Yami and Yoseph Mekasha (2000): “Market-oriented Urban and Peri-Urban Dairy Systems, processed by author.


1
Annex 2: Presentations and prices of dairy products in retail outlets Retail outlet Product Description Unit Price Lt/kg Beral Shop Fresh milk sealed white plastic bag pasteurized 500ml 4.00 8.00 Berta Fresh milk sealed white plastic bag 500ml 5.00 10.00 Bambis Fresh milk Skimmed milk 1% fat tetra pack 1 lt 10.35 10.35 Bambis Fresh milk Skimmed milk 1% fat tetra pack 0.5 lt 5.25 10.50 Bambis Fresh milk Pasteurized 2.6% fat tetra pack 1 lt 10.35 10.35 Bambis Fresh milk Pasteurized 2.6% fat tetra pack 0.5 lt 5.25 10.50 Shopper's mart UHT milk Semi-skimmed 1.5% fat 1 lt 30.00 30.00 Abadir UHT milk Semi-skimmed; low fat etc. French 1 lt 24.50 24.50 Abadir UHT milk Semi-skimmed; bottle, French 1 lt 30.90 30.90 Berta Butter Cooking butter (fermented) 1 kg 65.00 65.00 Beral Shop Butter Cosmetic for hair 50 grs 5.00 100.00 Berta Butter Cosmetic for hair 100 grs 12.00 120.00 Beral Shop Butter table butter 200grs 18.00 90.00 Berta Butter table butter 200grs 18.00 90.00 Abadir Butter unsalted table butter 1 kg 85.00 85.00 Abadir Butter table butter 200grs 17.00 85.00 Beral Shop Yoghurt plastic (coffee) cup 120ml 3.00 24.90 Berta Yoghurt plastic (coffee) cup 120ml 4.00 33.20 Bambis Yoghurt Flavoured Mama plastic cup 150 ml 4.95 32.70 Bambis Yoghurt Genesis cup 300 ml 8.65 25.95 Shopper's mart Yoghurt Holland Dairy plain cup 500ml 9.00 18.00 Abadir Yoghurt Holland Dairy plain cup 500ml 8.57 17.14 Abadir Yoghurt Holland Dairy plain cup 250ml 5.50 22.00 Shopper's mart Yoghurt Holland Dairy flavoured cup 250ml 8.50 34.00 Abadir Yoghurt Holland Dairy flavoured cup 250ml 9.00 36.00 Abadir Yoghurt Imported yoghurt flav (French) 4 cups 200ml 39.50 197.50 Beral Shop Cheese Provolone 1 kg 24.00 Berta Cheese Provolone 1 kg 60.00 Bambis Cheese Provolone 1 kg 90.00 Fantu Cheese Provolone 1 kg 69.00 Berta Cheese mozarella 1 kg 53.50 Bambis Cheese mozarella 1 kg 83.00 Berta Cheese cottage (ayib) 1 kg 24.00 Bambis Cheese recotta 1 kg 55.00 Abadir Cheese recotta 1 kg 55.00 Shopper's mart Cheese Gouda Holland Dairy 1 kg 120.00 Fantu Cheese Gouda Lame Dairy 1 kg 90.00 Abadir Cheese Gouda Lame Dairy 1 kg 120.00 Abadir Cheese Gouda imported 1 kg 490.00 Abadir Cheese Feta 1 kg 160.00

2
Annex 3: Population size of regions by religion and place of residence: 2007
COUNTRY – Total Urban + Rural Urban Rural All Persons 73,918,505 100% 11,956,170 100% 61,962,335 100% Orthodox 32,138,126 43% 7,070,932 59% 25,067,194 40% Protestant 13,746,787 19% 1,614,145 14% 12,132,642 20% Islam 25,045,550 34% 3,098,275 26% 21,947,275 35% Other* 2,966,632 4% 172,818 1% 2,793,814 5% TIGRAY Region All Persons 4,314,456 100% 842,723 100% 3,471,733 100% Orthodox 4,123,087 96% 764,996 91% 3,358,091 97% Protestant 3,635 0% 2,775 0% 860 0% Muslim/Islam 171,219 4% 70,221 8% 100,998 3% Other 16,515 0% 4,731 1% 11,784 0% AFAR Region All Persons 1,411,092 100% 188,973 100% 1,222,119 100% Orthodox 54,675 4% 37,349 20% 17,326 1% Protestant 9,344 1% 4,903 3% 4,441 0% Muslim/Islam 1,324,050 94% 145,995 77% 1,178,055 96% Other 23,023 2% 726 0% 22,297 2% AMHARA Region All Persons 17,214,056 100% 2,112,220 100% 15,101,836 100% Orthodox 14,208,067 83% 1,667,487 79% 12,540,580 83% Protestant 30,240 0% 21,416 1% 8,824 0% Muslim/Islam 2,952,775 17% 414,476 20% 2,538,299 17% Other 22,974 0% 8,841 0% 14,133 0% OROMIA Region All Persons 27,158,471 100% 3,370,040 100% 23,788,431 100% Orthodox 8,269,813 30% 1,725,432 51% 6,544,381 28% Protestant 4,818,842 18% 588,427 17% 4,230,415 18% Muslim/Islam 12,886,961 47% 1,006,436 30% 11,880,525 50% Other 1,182,855 4% 49,745 1% 1,133,110 5% SOMALI Region All Persons 4,439,147 100% 621,210 100% 3,817,937 100% Orthodox 27,893 1% 25,612 4% 2,281 0% Protestant 2,635 0% 2,289 0% 346 0% Muslim/Islam 4,369,426 98% 584,302 94% 3,785,124 99% Other 39,193 1% 9,007 1% 30,186 1% BENISHANGUL - GUMUZ Region All Persons 670,847 100% 97,965 100% 572,882 100% Orthodox 221,168 33% 50,175 51% 170,993 30% Protestant 90,272 13% 17,914 18% 72,358 13% Muslim/Islam 304,432 45% 28,514 29% 275,918 48% Other 54,975 8% 1,362 1% 53,613 9% SNNP Region All Persons 15,042,531 100% 1,545,710 100% 13,496,821 100% Orthodox 2,995,555 20% 596,600 39% 2,398,955 18% Protestant 8,346,046 55% 698,997 45% 7,647,049 57% Muslim/Islam 2,118,977 14% 197,044 13% 1,921,933 14% Other 1,581,953 11% 53,069 3% 1,528,884 11%

3
GAMBELA Region All Persons 306,916 100% 77,878 100% 229,038 100% Orthodox 51,454 17% 19,499 25% 31,955 14% Protestant 215,092 70% 47,089 60% 168,003 73% Muslim/Islam 14,919 5% 6,434 8% 8,485 4% Other 25,451 8% 4,856 6% 20,595 9% HARARI Region All Persons 183,344 100% 99,321 100% 84,023 100% Orthodox 49,704 27% 48,224 49% 1,480 2% Protestant 6,311 3% 6,091 6% 220 0% Muslim/Islam 126,488 69% 44,253 45% 82,235 98% Other 841 0% 753 1% 88 0% ADDIS ABABA All Persons 2,738,248 100% 2,738,248 100% Orthodox 2,044,481 75% 2,044,481 75% Protestant 212,806 8% 212,806 8% Muslim/Islam 443,821 16% 443,821 16% Other 37,140 1% 37,140 1% DIRE DAWA All Persons 342,827 100% 232,854 100% 109,973 100% Orthodox 87,629 26% 87,246 37% 383 0% Protestant 9,583 3% 9,523 4% 60 0% Muslim/Islam 243,188 71% 133,720 57% 109,468 100% Other 2,427 1% 2,365 1% 62 0% SPECIAL ENUMERATION AREAS All Persons 96,570 100% 29,028 100% 67,542 100% Orthodox 4,600 5% 3,831 13% 769 1% Protestant 1,981 2% 1,915 7% 66 0% Muslim/Islam 89,294 92% 23,059 79% 66,235 98% Other 695 1% 223 1% 472 1% * Other: Catholic, traditional and other Source: CSA, Census 2007, preliminary