
Scottish Dairy Supply Chain Greenhouse Gas Emissions ...
53
SCOTTISH DAIRY SUPPLY CHAIN GREENHOUSE GAS EMISSIONS Dec 2010 Methodology report
Transcript of Scottish Dairy Supply Chain Greenhouse Gas Emissions ...
SCOTTISH DAIRY SUPPLY CHAIN GREENHOUSE GAS EMISSIONS
Dec 2010 Methodology report

Table of Contents
1 INTRODUCTION ................................................................................................................................... 1
1.1 PROJECT ................................................................................................................................................... 1 1.2 THIS DOCUMENT ........................................................................................................................................ 1
2 METHOD SUMMARY ............................................................................................................................ 2
2.1 MODEL REQUIREMENTS ............................................................................................................................... 2 2.2 SUMMARY OF APPROACH ............................................................................................................................. 2 2.3 LIMITATIONS ............................................................................................................................................. 2
3 UNIT OF ANALYSIS ............................................................................................................................... 4
3.1 DAIRY PRODUCTS ....................................................................................................................................... 4 3.2 DAIRY SECTOR ........................................................................................................................................... 4 3.3 DATA YEAR ............................................................................................................................................... 4
4 SYSTEM BOUNDARY ............................................................................................................................. 5
4.2 BOUNDARY INCLUSIONS AND EXCLUSIONS ....................................................................................................... 6
5 GREENHOUSE GASES ............................................................................................................................ 8
5.1 SCOPE ...................................................................................................................................................... 8 5.2 GLOBAL WARMING POTENTIAL (GWP) FACTORS .............................................................................................. 8
6 ALLOCATION ........................................................................................................................................ 9
6.1 ON FARM - BEEF, MILK, LEATHER ................................................................................................................... 9 6.2 DRAFT POWER ........................................................................................................................................... 9 6.3 MANURE .................................................................................................................................................. 9 6.4 RAW MILK EMISSIONS TO DAIRY PRODUCTS .................................................................................................... 10
7 CRADLE-TO-FARM GATE MODEL ........................................................................................................ 11
7.1 CLASSIFICATION OF FARM TYPES .................................................................................................................. 11 7.2 FARM INPUTS ASSUMPTIONS ...................................................................................................................... 12 7.3 ENTERIC & MANURE STORAGE (CH4 & N2O) ................................................................................................. 24 7.4 SUMMARY OF RESULTS .............................................................................................................................. 30
8 DAIRY PROCESSOR MODELS ............................................................................................................... 31
8.1 RAW MILK ALLOCATION ............................................................................................................................. 31 8.2 SUMMARY OF INPUTS AND CRADLE-TO-GATE RESULTS ..................................................................................... 34
9 DISTRIBUTION, USE & END-OF-LIFE .................................................................................................... 41
9.1 DISTRIBUTION & RETAIL ............................................................................................................................. 41 9.2 USE ....................................................................................................................................................... 42 9.3 END-OF-LIFE ........................................................................................................................................... 42
10 SUMMARY OF CRADLE-TO-GRAVE RESULTS ........................................................................................ 43
11 QUALITY ASSURANCE ......................................................................................................................... 44
11.1 INTERNAL QUALITY ASSURANCE ................................................................................................................... 44 11.2 EXTERNAL REVIEW .................................................................................................................................... 44
12 APPENDIX 1 - WORKS CITED ............................................................................................................... 45
Tables
Table 1: Summary of cradle-to-farm gate emissions source to be included in footprint ....................... 6 Table 2: Summary of processing emissions to be included or excluded ................................................ 7 Table 3: Summary of downstream emissions to be include/excluded ................................................... 7 Table 4: Global Warming Potentials (GWP) of GHGs in IPCC 2nd and 4th Assessment Reports .............. 8 Table 5: Economic share of dairy farm outputs ...................................................................................... 9 Table 6: Percentage of female dairy animals by age group for three yield classes .............................. 11 Table 7: Milk chemical properties by contract type (% w/w) ............................................................... 12 Table 8: Typical adult dairy cow feed intake – kg, as fed ..................................................................... 12 Table 9: Adult dairy cow feed intake – kg DM per kg milk ................................................................... 13 Table 10: Replacement heifer feed intake per animal per year – kg, as fed ........................................ 13 Table 11: Annual replacement feed intake (kg DM) per kg milk produced by herd ............................. 13 Table 12: Feed composition (by % wet mass) from questionnaire and Defra statistics (2007) ........... 14 Table 13: Concentrate ingredient assumptions .................................................................................... 15 Table 14: UK soybean meal import assumptions (2007) ...................................................................... 16 Table 15: Concentrate feed ingredient transport assumptions ........................................................... 18 Table 16: Forage composition assumptions ......................................................................................... 19 Table 17: Farm electricity use assumptions .......................................................................................... 20 Table 18: Farm heating fuel assumptions ............................................................................................. 20 Table 19: Farm heating fuel assumptions ............................................................................................. 21 Table 20: Veterinary spend assumptions .............................................................................................. 21 Table 21: Livestock water consumption ............................................................................................... 22 Table 22: Water use assumptions ......................................................................................................... 22 Table 23: Silage wrap assumptions ....................................................................................................... 22 Table 24: Silage wrap (kg plastic film) consumption per kg milk .......................................................... 23 Table 25: Farm refrigerant leakage assumptions ................................................................................. 23 Table 26: Live body weights (kg) for different yield and age classes .................................................... 24 Table 27: Average dairy weight gain (kg/animal/day) (McBain, et al., 2009) ....................................... 25 Table 28: Percentage of time spent grazing ......................................................................................... 25 Table 29: Average digestibility of different feed types: following (Gerber, et al., 2010) ..................... 25 Table 30: Average digestibility of diets ................................................................................................. 25 Table 31: Average milk yields per dairy cow, following (McBain, et al., 2009) ................................... 26 Table 32: Fat content of milk (Carbon Trust, 2010) .............................................................................. 26 Table 33: Gross energy results (MJ/day) .............................................................................................. 26 Table 34: Methane conversion factors: following (Gerber, et al., 2010) .............................................. 27 Table 35: Enteric methane emissions (kgCH4) per animal per year, by yield (IPCC, 2006) ................... 27 Table 36: Prevalence of manure management systems in Scotland .................................................... 28 Table 37: Methane emissions (kgCH4) from manure storage, per animal per year ............................. 28 Table 38: Direct nitrous oxide emissions (kgN2O) from manure storage, per animal per year ........... 28 Table 39: Indirect nitrous oxide emissions (kgN2O) from manure storage, per animal per year ........ 29 Table 40: Summary of milk emissions (kgCO2e/kg), by herd yield & Scottish average ........................ 30 Table 41: Dry mass assumptions for liquid milk ................................................................................... 31 Table 42: Dry mass assumptions for all dairy products (Feitz et al. 2007) ........................................... 31 Table 43: Milk emissions (to farm gate) per kg of final dairy products ................................................ 31 Table 44: Relative GWP impact and EOL recycling rates of different packaging materials .................. 33 Table 45: Average recycled content of packaging materials ................................................................ 33 Table 46: Cradle-to-gate GHG emissions .............................................................................................. 34 Table 47: Liquid milk processing assumptions & results to processor gate ......................................... 35 Table 48: Cheese processing assumptions and results summary (cradle-to-processor gate) .............. 36 Table 49: Butter processing assumptions and results summary (cradle-to-processor gate) ............... 37

Table 50: Yoghurt processing assumptions and results summary (cradle-to-processor gate) ............. 38 Table 51: Cream processing assumptions and results summary (cradle-to-processor gate) ............... 39 Table 52: Ice cream processing assumptions and results summary (cradle-to-processor gate) .......... 40 Table 53: Key distribution assumptions & summary of results ............................................................ 41 Table 54: Product use assumptions ...................................................................................................... 42 Table 55: Food wastage assumptions ................................................................................................... 42 Table 56: Summary of cradle-to-grave emissions (kgCO2e/kg) for six products .................................. 43
Figures Figure 1: Summary of cradle-to-gate milk emissions (kgCO2e/kg), by yield group .............................. 30 Figure 2: Simplified cheese production inputs and outputs (in wet and dry mass - DM) .................... 32 Figure 3: How allocation decisions (by dry mass, value or mass) influence results ............................. 32 Figure 4: Cradle-to-processor gate GHG emissions totals (kgCO2e/kg) for six products ...................... 34 Figure 5: Summary of cradle-to-grave emissions for six products ....................................................... 43

1
1 Introduction
1.1 Project The objective of this research project was to estimate the life cycle GHG emissions associated with Scottish dairy products’ in order to identify the main opportunities for reducing emissions while maintaining or improving economic productivity. The specific objectives are to:
1.Describe key inputs to and outputs from Scottish dairy products’ supply chains 2.Summarise methodologies and data sources available to estimate life cycle GHG
emissions 3.Assess life cycle GHG emissions associated with each Scottish dairy product supply
chain 4.Identify opportunities for each Scottish supply chain to reduce GHG emissions
The original project tender – and more details of the project – can be accessed via the project website: http://www.dairyfootprint.org.
1.2 This document This document details the methodological approach used in the footprint analysis and was the project output which was reviewed by The Carbon Trust as part of quality assurance. The aim of making this report available was to provide a useful resource of information for dairy industry and increase confidence in results. A summary of the results are provided at the end of each sector – however the main results and interpretation document is separate.
2
2 Method summary
2.1 Model requirements The methodology has been designed to enable total emissions associated with the production of Scottish dairy products to be expressed in two ways: A product-level breakdown of emissions per unit of Scottish dairy product; A sector-level estimate of total emissions from the production of dairy products. Additionally analysis needed to be sufficiently granular and Scotland-specific to enable mitigation options to be highlighted.
2.2 Summary of approach The modelling approach draws heavily on four documents: PAS2050; the Guidelines for the Carbon Footprinting of UK Dairy Products (hereafter called the Dairy Guidelines); UK Greenhouse Gas Inventory 1990-2007 (AEA Technology, 2009); and a recent global assessment of dairy emissions by the FAO (Gerber, et al., 2010). These methodologies have already been widely consulted on by a range of stakeholders and the use of their boundaries and assumptions enables a degree of comparability with existing and future footprint studies (see limitations section below). Significant conflicts between methods are explored within this text, however final decisions on which approach to take were decided in discussion with reviewers. The main differences regarded study boundaries (i.e. what emissions are included or excluded) and emissions allocation methods (e.g. how to apportion emissions between beef and milk outputs). Both these issues are explored in more detail in Section 6. Because of the scope of the study and project time constraints the majority of data has been sourced from industry, governmental and academic publications – as opposed to collecting new primary data from individual companies. The latter approach is required for detailed product carbon footprinting but is very resource intensive.
2.3 Limitations The objectives of the study mean that simplifications were necessary to achieve sector-wide estimates of a broad range of emissions sources and sinks. It is important to remember that it was not intended that the study deliver detailed product carbon footprints for the many 100s of dairy products which make up the Scottish supply chain, but rather guide industry efforts to focus in on emissions ‘hot spots’ and explore mitigation options. The method outlined in this document is consistent with these aims and constraints but would not be suitable for the following applications: The results of this analysis could not be used to make an unqualified claim about the ‘average emissions intensity’ of all Scottish dairy products. This would require considerable primary data collection efforts, rather than reliance on secondary data. DairyCo have commissioned a very large study to do just this for cradle-to-gate emissions only. Similarly, the results of this study could not be used to say that, for instance, Scottish milk has lower/higher emissions than the UK average. Result uncertainty was not quantified as part of this work – and so a claim of better performance would be difficult to substantiate.
3
The results of this analysis could not be used for detailed tracking of sector emissions changes over time – again due to uncertainties inherent in such a high level assessment. Changes in emissions would be better tracked via different means e.g. individual product & company GHG reporting.

4
3 Unit of analysis Emissions are expressed in the following:
3.1 Dairy products The results of this analysis are presented at the following stages:
•kgCO2-equivalent per litre of milk at farm gate •kgCO2-equiavlent per kg of dairy product (full life cycle)
3.1.1 Product groups Based on dairy utilisation statistics for Scotland (by volume of milk)1, emissions have been calculated for the following seven product groups:
•Liquid milk •Cream •Butter •Cheese •Yoghurt •Ice cream
Due to time constraints most analytical and research effort was focused on product groups which are most significant for Scotland (i.e. liquid milk and cheese). Any limitations of calculations are fully documented in later sections.
3.2 Dairy sector At the national level, emissions will be expressed in tCO2-equivalent per year.
3.3 Data year Data was sourced from 2007, 2008 and 2009 (due to availability constraints). Where possible 2007 data was preferred as this is the latest year for which a devolved national GHG inventory is available for Scotland (and so would enable the results to be expressed in the context of national GHG emissions).
1 DairyCo

5
4 System boundary This footprint study addresses all stages of the dairy supply chain – from farm production through to consumer use and disposal.
4.1.1 Imported & exported milk Scotland’s dairy supply chain relies almost exclusively on milk from Scottish dairy farms (Weir, 2009) (DTZ, 2007). It is understood that some milk is imported from Northern Ireland and England - and that year-to-year this will vary dependant on economic factors1. However no reliable data source was found on typical quantities and distances so the effect of this has not been modelled i.e. it is assumed that all milk used in Scottish dairy products is produced in Scotland. Based on the small volumes of milk involved and the relatively small contribution raw milk freight has on life cycle emissions, this was not seen as a major deficiency in the model.
4.1.2 Tertiary and further processing This study only calculates the emissions associated with the production of primary and secondary dairy products – i.e. it does not address emissions associated with the many thousands of food products which use primary or secondary dairy products as an ingredient e.g. pizza, ready meals, confectionary, etc.
4.1.3 Imported & exported dairy products This study does not quantify emissions associated with the production of final dairy products imported into Scotland (i.e. the purpose of this study is not to measure the footprint of Scotland’s dairy consumption). The footprint study does, however, include non-Scottish emissions which occur as a result of Scottish dairy product distribution, use & disposal.
4.1.4 Dairy beef A proportion of dairy farm emissions have been allocated to dairy beef production (see allocation method in Section 6), however this project does not provide lifecycle results for dairy beef (e.g. kgCO2e/kg beef).
4.1.5 Organic milk There are 31 organic farms in Scotland – their output represents 2% of milk production and farms achieve an average yield of approximately 6,500 litres per cow per year2. It had been originally proposed that the study would model organic milk production separately. However, during method development it was decided that creating an additional organic model was not the best use of project resources for four main reasons:
•It represents a small fraction of Scottish milk supply – and no other dairy farming system was being modelled explicitly
•There was limited industry-average data on organic systems •The broad scope of this research was not the best forum for a detailed comparison
between GHG impacts of different farming systems (for the reasons outlined in the section above on limitations)
1 Karen Wonnacott, DairyCo – Personal communications 2 Personal communications, Stuart Martin (Scottish Organic Milk)

6
•The division of dairy farming between organic or non-organic was over-simplistic, divisive and unhelpful: the messages for all farmers, regardless of system, are the same: e.g. reduce dependence on inputs, increase milk yield, etc.
So, instead, the analysis categorised Scottish farming by average yield (high, medium or low - see later sections for detailed explanation).
4.2 Boundary inclusions and exclusions Original decisions on which emissions sources to include and exclude were based on an extensive literature review (see references in Section 12). The requirements of PAS2050 are to include all emissions sources (i.e. be complete), although in practice a significant proportion of small sources (i.e. <1%) are estimated. This section summarises the boundary inclusions and exclusions of this study. The rationale is provided for any exclusion decisions.
4.2.1 Cradle-to-farm gate Published dairy life cycle studies consistently report that the majority of emissions are associated with agricultural production stages (see Table 1). As a result the main focus of this work will be the development of a Scottish milk production model.
Table 1: Summary of cradle-to-farm gate emissions source to be included in footprint
GHG source/sink Description Boundary Exclusion rationale
Production of inputs
Fertiliser production Included Pesticides & herbicides Included Dairy farm electricity Included Veterinary products Included Cleaning products Excluded Insignificant Purchased seeds Excluded Insignificant Livestock feed Included Bedding straw Excluded No data Water Included Livestock transport Excluded Insignificant Production of machinery Excluded PAS2050 excludes
Fuel combustion on farm
Machinery & farm vehicles Included Buildings Included
Livestock, manure & soils emissions
Application of inorganic N Included Application of organic N Included Deposition of manures Included Enteric fermentation Included Manure management Included Nitrogen fixing crops Included Crop residues Included
Soil carbon Excluded PAS2050 excludes Land use change During feed production Included
Waste management
Milk Excluded No data, insignificant Water Included Silage wrap Included
Other Refrigerant gas leaks Included Staff commuting Excluded PAS2050 excludes

7
4.2.2 Dairy processing Only primary and secondary processing has been considered. The emissions sources for dairy processing are summarised below.
Table 2: Summary of processing emissions to be included or excluded GHG source/sink Description Boundary Exclusion rationale Production of inputs
Electricity use at processor Included Product packaging Included Refrigerant gas Included Cleaning products Included Water Included Major ingredients e.g. salt, sugar Included Production of machinery Excluded PAS2050 excludes
Fuel combustion Raw milk freight from farms Included Inter-processor freight Excluded No data Buildings (e.g. steam creation) Included
Fugitive emissions Inter-processor freight refrigerant Excluded No data Processing plant refrigerant Included
Waste management
Out-of-date products Excluded No data Other waste Included Waste water Included
Other Business travel Excluded No data Staff commuting Excluded PAS2050 excludes
4.2.3 Distribution, use & product end-of-life Distribution was modelled for products going via retail. The main emissions sources are summarised below.
Table 3: Summary of downstream emissions to be include/excluded
Life cycle stage Emissions source Boundary Exclusion rationale Distribution Transport fuel Included
Transport refrigerant gas leaks Included RDC1 energy use Included RDC refrigerant leaks Included Retail/wholesale energy use Included Retail/wholesale refrigerant leaks Included Disposal of waste dairy products Excluded No data
Use Refrigeration energy Included Refrigerant leaks Included Consumer transport to retail Excluded PAS2050 excludes
Product end-of-life
Waste food disposal Included Packaging disposal Included
1 RDC: Regional distribution centre. Not considered in liquid milk product.

8
5 Greenhouse gases
5.1 Scope The assessment will include all relevant greenhouses gases in IPCC 4th Assessment Report.
5.2 Global warming potential (GWP) factors The UK’s 2007 national greenhouse gas inventory (AEA Technology, 2009) uses IPCC Second Assessment Report (1995)1 (SAR) global warming potential factors for the conversion of non-CO2 gases into carbon dioxide equivalents (CO2e). The use of these older GWP factors is a requirement of the Kyoto Protocol and the current UNFCCC Reporting Guidelines (UNFCCC, 2006)2. Unfortunately, this approach is currently at odds with product footprinting standards (e.g. PAS2050), which require that the latest GWPs are used (i.e. Fourth Assessment Report – AR4 (2007)). The implication being that sector-level emissions calculations which are comparable with national inventory reports and targets, would not be consistent with a product carbon footprint. The differences for some sectors – e.g. dairy – will be significant, as non-CO2 gases are significant (see differences in GWP factors in Table 4).
Table 4: Global Warming Potentials (GWP) of GHGs in IPCC 2nd and 4th Assessment Reports
Greenhouse gas SAR GWP AR4 GWP Difference Carbon dioxide 1 1 n/a Methane 21 25* +19% Nitrous oxide 310 298 -4%
Note*: See Section 5.2.1 below for discussion. The decision was made to calculate product carbon footprints using AR4 global warming potential factors where possible3.
5.2.1 Methane from biogenic sources The Dairy Guidelines (Carbon Trust, 2010) note that CH4 produced from a non-fossil biogenic carbon source has a lower effective GWP of 22.25. This is because it is originally derived from atmospheric carbon dioxide, and so results in the removal of CO2 from the atmosphere. However, this adjusted GWP for biogenic methane is, to our knowledge, not used in any other product footprint method or standard (including the International Dairy Federation LCA guidelines (International Dairy Federation, 2010). The product footprint results therefore use the IPCC AR4 global warming potential factor for non-fossil biogenic methane. The authors would encourage wider discussions on this GHG accounting issue as it materially affects the results.
1 http://www.ipcc.ch/publications_and_data/publications_and_data_reports.htm 2 http://unfccc.int/national_reports/annex_i_ghg_inventories/reporting_requirements 3 Some secondary sources of emissions factors used were themselves not derived using AR4 Global Warming Potential and so could not be updated

9
6 Allocation1
6.1 On farm - Beef, milk, leather PAS2050 uses economic value to allocate emissions between co-products (including farm co-products in this project). This study will adhere to this method and use industry data of relative product values e.g. Economic Report on Scottish Agriculture (RERAD, 2009), SAC handbook (McBain, et al., 2009) (see Table 5).
Table 5: Economic share of dairy farm outputs
Yield Calving period
Value of milk
/cow/yr
Value of cull cow /
yr
% Scottish cows2
Milk allocation
Cull cow allocation3
Low £1,184 £150 28% 88.8% 11.2% All year £1,217 £150 15% Spring £1,142 £150 9% Autumn £1,192 £150 4% Medium £1,614 £150 60% 91.6% 8.4% All year £1,659 £150 38% Spring £1,557 £150 16% Autumn £1,626 £150 6% High £2,044 £150 11% 93.4% 6.7% All year £2,101 £150 8% Spring £1,972 £150 2% Autumn £2,059 £150 1% Scotland average £1,614 £150 100% 91.1% 8.8%
6.2 Draft power This is not applicable to Scotland’s dairy sector, and so is not considered.
6.3 Manure
6.3.1 Storage Emissions from manure storage are fully allocated to the dairy system. This excludes an effective credit that a farmer would get for exporting manure (e.g. in that case emissions are allocated to the manure user not the farmer).
1 “Dairy herds produce a mix of goods and services that cannot easily be disaggregated into individual processes. For example, a dairy cow produces milk, manure, capital services, and eventually meat when it is slaughtered. In LCA, we need to use specific techniques to attribute relative shares of GHG emissions to each of these goods and services.” (Gerber, et al., 2010) 2 For source of this data see Section 7.1.1 on assumptions on Scottish dairy herd structure 3 Values sourced from SAC Farm Management Handbook 2009/10. Due to the way that this analysis is modelling livestock and feed emissions, the allocation is based on the relative value of ‘milk’ and ‘cull cow’ only (i.e. not including calves).

10
6.3.2 Application to soils One of the challenges of undertaking a sector-level footprint assessment is the correct allocation of manure application emissions (mainly N2O) to dairy system (as opposed to other products also produced on land receiving manure e.g. crops for human consumption). To overcome this challenge, emissions from manure application have been calculated using feed production emissions factors that already include these emissions. For example, the Carbon Trust (2010) feed emissions factor for silage includes nitrous oxide (N2O) emissions for the application of organic and inorganic nitrogen. As a result, emissions from fertiliser and manure application were not modelled explicitly and so there was no need for allocation.
6.4 Raw milk emissions to dairy products This study uses methods and assumptions outlined in the Dairy Guidelines (Carbon Trust, 2010) to calculate the allocation of milk production emissions to dairy co-products on the basis of dry mass, and allocation of energy and water use emissions to co-products. These assumptions were themselves derived from (Generation of an Industry-Specific Physico-Chemical Allocation Matrix, 2007).

11
7 Cradle-to-farm gate model
7.1 Classification of farm types To calculate cradle-to-farm gate emissions Scottish dairy farms were split into three groups based on the average milk yields achieved per cow per year. Yield was chosen as it is most closely related to the milk footprint. Other possible characteristics e.g. calving time, geographic location and organic status were initially considered but not pursued. Average farm milk yields were classified as follows:
•Low (<6,500 litres per cow per year) •Medium (6,500-8,500 litres per cow per year) •High (>8,500 litres per cow per year)
Within each farming system, dairy livestock populations (all females and males for breeding) will be allocated to one of the groups below. This is consistent with the Dairy Guidelines:
•Dairy Cattle > 2 years •Dairy Cattle 1-2 years •Dairy Cattle < 1 year •Bulls > 2 years •Bulls 1-2 years
7.1.1 Dairy herd demography These assumptions were developed by dairy experts at Laurence Gould based on typical replacement rates and local industry knowledge.
Table 6: Percentage of female dairy animals by age group for three yield classes
Herd yield type <1yr 1-2yrs >2yrs All females
Low (<6,500) 16% 14% 70% 100% Medium (>6,500,<8,500) 18% 16% 66% 100% High (>8,500) 20% 18% 62% 100%
The number of males used for breeding was estimated based on the 2007 total Scotland dairy bull population (Scottish Government, 2008), allocated to milk yield class based on dairy cow (>2 years) numbers.

12
7.1.2 Dairy livestock numbers & milk production
7.1.3 The number of dairy cows1 in Scotland was assumed to be 197,9902. Milk output was assumed to be 1,272.4 million litres3. This equates to an average yield of 6,626 litres of milk per dairy cow per year. These estimates were used to allocate total Scottish enteric and manure storage emissions to milk.
7.1.4 Raw milk properties Assumptions on the characteristics of unprocessed milk are defined below. Fat, protein and dry mass assumptions are taken from the Dairy Guidelines (Carbon Trust, 2010). Density value was taken from the DairyCo Pocketbook 2009.
Table 7: Milk chemical properties by contract type (% w/w)
Product Dry mass % Fat % Kg/litre Raw milk 12.5 4 1.03
7.2 Farm inputs assumptions
7.2.1 Feed The characteristics of a dairy farm’s feeding regime are a significant driver of the farm’s emissions profile4, so it was important to develop a reasonably sophisticated model to quantify these impacts. This section summarises the assumptions used to quantify the types and quantities of feed used by Scottish dairy farms.
7.2.1.1 Feed quantities per litre milk Adult cow feed intake was derived from the SAC Farm Handbook 2009/10 (see Table 8). These
values were then combined with typical dry matter content assumptions to calculate feed intake per litre of milk (see
Table 9).
Table 8: Typical adult dairy cow feed intake – kg, as fed Yield group Yield
(l/cow/yr) Roughages
(kg) Concentrate
(kg) Grazing
days Grazing
(kg)5 Total (kg)
Low 5,500 7,928 1,056 192 13,662 22,646
Medium 7,500 8,237 2,114 169 12,036 22,387
High 9,500 8,787 3,427 119 8,458 20,671
Dry matter - 24% 88%6 - 18% -
1 Dairy cow definition is same as June Census: Cows & heifers in milk + cows in calf but not in milk 2 June Census dairy cow numbers, 2007 3 Scottish Agriculture Input, Output and Incomes Statistics, 2007: 1,272.4 million litres (1,310 million kg). 4 Particularly in respect to the enteric CH4 (methane) emissions. 5 Grazing days converted to mass (kg) of grass using assumption of 13kgDM/cow/day (source: Grass budgeting guidance “Grass challenge for dairy farmers Note 2a” from Northern Ireland Department of Agriculture and Rural Development 6 Derived from concentrate mix in Table 12

13
Table 9: Adult dairy cow feed intake – kg DM per kg milk Yield group Roughages
(kg) Concentrate
(kg) Grazing
(kg) Total (kg)
Low 0.371 0.174 0.460 1.006 Medium 0.283 0.256 0.297 0.836 High 0.238 0.328 0.165 0.731
Replacement feed intake was derived from SAC Farm Handbook 2009/10 (see Table 12). These values were then combined with Scottish dairy herd assumptions to calculate typical feed intake per kg of milk produced by herd (Table 13).
Table 10: Replacement heifer feed intake per animal per year – kg, as fed
Hay (kg) Silage (kg) Concentrates (kg)
Grazing (kg)
Total (kg)
Typical feed intake 232 2,969 512 8,032 11,744 Typical dry matter 85% 25% 88% 18% -
Table 11: Annual replacement feed intake (kg DM) per kg milk produced by herd
Yield group
Hay (kgDM) Grass silage (kgDM)
Concentrates & other (kgDM)
Grazing (kgDM)
Total (kgDM)
Low 0.018 0.069 0.042 0.134 0.262 Medium 0.016 0.059 0.036 0.115 0.226 High 0.015 0.056 0.034 0.109 0.214

14
7.2.1.2 Feed composition & emissions factors To assess the broad categories of ‘grazing’, ‘forages’ (mainly grass silage) and ‘concentrates’, a more detailed split of feed ingredients was required to adequately model the emissions associated with the production of concentrates and forages. Regardless of the location of production (e.g. on farm or purchased), secondary sources of emissions factors were used to estimate emissions associated with the production of feeds. This is because the range of feeds used across the dairy industry makes the development of new Scotland-specific factors for each one prohibitive. These cradle-to-farm gate emissions factors include all relevant farm emissions sources e.g. energy use, input production, soil emissions, and downstream processing (e.g. energy and other ingredients). Emissions factors for these ingredients were sourced from the Carbon Trust Feed Database (Carbon Trust, 2010) and Cranfield agricultural LCA (Williams, et al., 2006) and adjusted to dry matter (see Table 15). Concentrates Assumptions for the composition of concentrates (dairy blends and compounds) fed to dairy cattle were derived from a questionnaire sent to a major feed manufacturer who provides a significant amount of feed to the Scottish dairy sector (Table 14). The questionnaire results were sense-checked against Defra livestock feed statistics1 (which cover all feeds, not just dairy). The nutritional composition was not available from either source. Table 12: Feed composition (by % wet mass) from questionnaire and Defra statistics (2007)
Ingredient Project survey Barley 10% Wheat 14% Wheat feed 13% Distillers maize 9% Biscuit meal 6% Sugar beet pulp 9% Soya meal 16% Rapeseed 14% Palm kernels 3% Minerals 3% Sunflower 2% Molasses 4% Fat 1% Total 100%
1 http://www.defra.gov.uk/evidence/statistics/foodfarm/food/animalfeed/index.htm

15
Concentrate feed emissions factors are for on farm production only – i.e. they do not include any further transport or processing. These additional emissions were estimated separately – see sections below.
Table 13: Concentrate ingredient assumptions
Group Description %DM kgCO2e/kgDM Emissions factor source Starch All 86 0.33 Derived from below & Table 12
Barley 86 0.46 Carbon Trust – average of all 5 barley factors Wheat 86 0.47 Carbon Trust – average of all 6 wheat factors Wheat feed 88 0.14 Carbon Trust – average of all 6 wheat factors Molasses 75 0.15 Carbon Trust – ‘beet molasses’
Protein All 90 0.87 Derived from below & Table 12 Distillers maize 90 0.03 Carbon Trust – ‘distillers grains’ Biscuit meal 88 0.03 No data. Carbon Trust – ‘brewers grains’ proxy Soya 90 4.26 See section below Rapeseed 90 0.47 Carbon Trust – ‘winter’ & ‘spring OSR meal’ Sunflower 90 0.47 No data. Carbon Trust ‘OSR meal’ as proxy
Fibre All 90 0.08 Derived from below and Table 12 Sugar beet pulp 90 0.03 Carbon Trust – ‘sugar beet’ Soya hulls 90 0.10 Cranfield LCI1 (Williams, et al., 2006) Palm kernels 90 0.10 No data. Cranfield LCI ‘soya hull’ as proxy
Soybean meal calculations Land use change emissions associated with the production of soybean meal were estimated using the assumptions detailed in Table 16. These were derived from FAO2 trade data and land use change emissions factors from Gerber et al. (2010). Scottish soybean meal imports were assumed to be similar to UK as no sub-national data was available.
1 Derived from Cranfield LCI data ‘soya meal (with hulls)’ minus ‘soya meal (no hulls)’: http://www.cranfield.ac.uk/sas/naturalresources/research/projects/is0205.html 2 http://faostat.fao.org/site/537/DesktopDefault.aspx?PageID=537

16
Tabl
e 14
: UK
soyb
ean
mea
l im
port
ass
umpt
ions
(200
7)1
Sour
ce
Tonn
es im
port
ed
into
UK
Shar
e
(by
mas
s)
Land
use
cha
nge
assu
mpt
ions
2 LU
C em
issi
ons
kgCO
2e/k
g
Prod
ucti
on
emis
sion
s kg
CO2e
/kg
Tota
l em
issi
ons
kgCO
2e/k
g
Tota
l em
issi
ons
kgCO
2e/k
gDM
A
rgen
tina
999,
107
48%
Pa
rtia
lly a
ssoc
iate
d w
ith th
e co
nver
sion
of p
astu
re a
nd s
hrub
la
nd to
cro
plan
d
0.93
0.
21
1.14
1.
27
Braz
il 73
7,76
7 35
%
Entir
ely
asso
ciat
ed w
ith
defo
rest
atio
n 7.
69
0.22
7.
91
8.79
Net
herl
ands
22
6,57
2 11
%
Ass
ume
46%
Arg
entin
a an
d 50
%
Braz
il so
urce
d3 4.
25
0.21
4.
51
5.01
Oth
ers
133,
089
6%
No
land
use
cha
nge
0 0.
26
0.26
0.
29
Tota
l/A
vera
ge
2,09
6,53
5 10
0%
3.
83
4.26
1 HM
RC 2
007
(htt
ps:/
/ww
w.u
ktra
dein
fo.c
om):
“23
04:O
il-ca
ke a
nd o
ther
sol
id r
esid
ues,
whe
ther
or n
ot g
roun
d or
in th
e fo
rm o
f pel
lets
, res
ultin
g fr
om th
e ex
trac
tion
of s
oya-
bean
oil”
2 G
erbe
r et
al,
2010
3 F
AO
STA
T, 2
007
trad
e m
atri
x

17
Feed processing A feed processing energy overhead was applied to concentrate feeds using data from a Carbon Trust review of the sector (Carbon Trust, 2010): 85 kWh/tonne. The Carbon Trust study found 28% of this energy was in the form of electricity – and the rest by a combination of gas and oil (assumed to be 50:50 mix for the purposes of this analysis). Using these assumptions, a processing ‘emissions overhead’ of 0.031 kgCO2e per kg of processed feed was added to the model. Scotland-specific energy data was not used as the Scottish dairy sector uses feeds not only produced in Scotland.

18
Feed
tran
spor
t Tr
ansp
ort e
mis
sion
s ar
e ty
pica
lly a
sm
all p
art o
f agr
icul
tura
l pro
duct
foot
prin
ts, s
o th
is e
mis
sion
s so
urce
was
not
mod
elle
d in
det
ail.
The
tabl
e be
low
se
ts o
ut a
ssum
ptio
ns f
or d
ista
nces
and
mod
es f
or t
he v
ario
us c
once
ntra
te i
ngre
dien
ts.
Impo
rted
fee
ds w
ere
mod
elle
d fo
r ro
utes
fro
m a
sin
gle
coun
try
whi
ch s
uppl
ies
the
larg
est
prop
ortio
n of
UK
impo
rts.
It w
as a
ssum
ed a
ll go
ods
wer
e sh
ippe
d in
bul
k an
d co
me
from
tha
t co
untr
y’s
maj
or
port
to S
outh
ampt
on. D
ista
nces
for
inte
rnal
truc
king
of f
eeds
tuff
s in
cou
ntry
of o
rigi
n w
ere
base
d on
Eco
inve
nt g
uide
lines
(Nem
ecek
, et a
l., 2
007)
.
Tabl
e 15
: Con
cent
rate
feed
ingr
edie
nt tr
ansp
ort a
ssum
ptio
ns
Leg
1 Le
g 2
Leg
3 In
gred
ient
Fr
om
Mod
e Km
M
ode
Km
Ass
umpt
ion
Mod
e Km
A
ssum
ptio
n Ba
rley
U
K A
rtic
11
4
W
heat
U
K A
rtic
11
4
W
heat
feed
U
K A
rtic
11
4
M
olas
ses
UK
Art
ic
114
Dis
tille
rs m
aize
U
K A
rtic
11
4
Bi
scui
t mea
l U
K A
rtic
11
4
So
ya
Sout
h A
mer
ica
Art
ic
700
Ship
9,
653
Sant
os to
Sou
tham
pton
A
rtic
80
3 So
utha
mpt
on to
Cen
tral
Sco
t.
Rape
seed
U
K A
rtic
11
4
Su
nflo
wer
S
Euro
pe
Art
ic
800
Ship
3,
391
Mar
seill
es to
Sou
tham
pton
A
rtic
80
3 So
utha
mpt
on to
Cen
tral
Sco
t.
Suga
r be
et p
ulp
UK
Art
ic
114
Soya
hul
ls
Sout
h A
mer
ica
Art
ic
700
Ship
9,
653
Sant
os to
Sou
tham
pton
A
rtic
80
3 So
utha
mpt
on to
Cen
tral
Sco
t.
Palm
ker
nels
A
sia
Art
ic
500
Ship
15
,420
Ja
kart
a to
Sou
tham
pton
A
rtic
80
3 So
utha
mpt
on to
Cen
tral
Sco
t.

19
Forages Forage intake assumptions are summarised in Table 18. The vast majority of forages were assumed to be produced on farm or locally, so no additional transport burden was modelled.
Table 16: Forage composition assumptions
Description % of mix
(by mass)1
%DM kgCO2e/ kgDM
Emissions factor source
All 100% 30% 0.28 Derived from below Barley straw 5% 86% -0.06 Cranfield LCI – ‘barley straw’ Grass silage 80% 25% 0.30 Cranfield LCI – ‘dairy lowland silage’ Whole-crop wheat 15% 40% 0.29 Carbon Trust – ‘wholecrop cereal’
Grazing An emissions factor for the production of dairy grazing was sourced from Cranfield LCI: 0.33kgCO2e/kgDM (assuming 18% dry matter content).
1 Expert judgement, Laurence Gould Partnership

20
7.2.2 Energy
7.2.2.1 Electricity Farm electricity consumption per kg of milk was estimated from spend data1 extracted from the Scottish Farm Accounts Survey (2007) – see Table 19. As Farm Accounts Survey data is at farm not dairy enterprise level, dairy-related consumption was derived using financial allocation of farm outputs. Electricity consumption figures were sense-checked against a survey of 100 dairy farms in Northern Ireland undertaken in 2007/8 by CAFRE2 and a review of farm energy use conducted by Warwick HRI for Defra3. It is worth noting that the latter study used a per cow electricity consumption factor (910kWh) which was significantly higher than those used in this study. The Farm Account Survey was considered the best source as it was Scotland-specific and the basis for the Warwick assumption was unreferenced and not expressed per kg of milk.
Table 17: Farm electricity use assumptions
Source Milk yield kWh/cow kWh/kg milk
FAS, 2007
Low 331 0.062 Medium 383 0.051 High 424 0.045 Average 375 0.055
CAFRE, 2007 Average 330 0.049 Defra, 2007 Average 910 0.190
7.2.2.2 Stationery fuel Farm heating fuel consumption per kg of milk was estimated from fuel spend data4 extracted from the Scottish Farm Accounts Survey (2007) – see Table 18. It was assumed that oil is the dominant fuel used on farms. The Warwick HRI study for Defra quoted above excludes this source as insignificant.
Table 18: Farm heating fuel assumptions
Source Milk yield Litres oil/kg milk FAS, 2007 Low 0.0069
Medium 0.0045 High 0.0051 Average 0.0053
1 Assumes £0.074/kWh (exVAT). Source: DECC energy price statistics - “Table 3.1.1 Prices of fuels purchased by manufacturing industry”. www.decc.gov.uk 2 http://www.ruralni.gov.uk/dairy_energy_report.pdf 3 http://www2.warwick.ac.uk/fac/sci/whri/research/climatechange/ 4 Assumes £0.334/litre of oil (exVAT). Source: DECC fuel price statistics – “Table 4.1.2 Average annual retail prices of petroleum products and a crude oil price index”. www.decc.gov.uk

21
7.2.2.3 Mobile fuel Field machinery fuel use was not modelled explicitly – instead emissions from this source are included within the scope of Carbon Trust conversion factors used to model feed production. The Farm Accounts Survey had additional information of ‘car fuel’ spend1. This data was used to estimate additional business-related transport emissions.
Table 19: Farm heating fuel assumptions
Source Milk yield Litres diesel/ kg milk
FAS, 2007 Low 0.0019 Medium 0.0018 High 0.0015 Weighted average 0.0018
7.2.3 Agrochemicals The production and soil emissions that result from the use of fertilisers, pesticides and herbicides was not modelled explicitly – instead emissions from these sources are included within the scope of Carbon Trust conversion factors used to model feed production.
7.2.4 Livestock transport Inter-farm movements of dairy replacements were excluded on the basis that it is not common practice to move young dairy animals around2. The onward transport of calves to the beef supply chain was also not included as these are out-of-scope (see Sections 4 System boundary and 4.1.4 Dairy beef).
7.2.5 Veterinary products An emissions estimate was developed based on average spend on veterinary goods and services per kg milk (source: Farm Accounts Survey, 2007). These were sense-checked against the SAC Farm Management Handbook (McBain, et al., 2009) and a study of Scottish Dairy Enterprise (Laurence Gould Partnership, 2007).
Table 20: Veterinary spend assumptions3
Source Milk yield £(exVAT) per kg milk FAS, 2007 Low 0.0054
Medium 0.0068 High 0.0058
SAC, 2009/10 Low 0.0097 Medium 0.0097 High 0.0097
LGP, 2006/7 Low 0.0067 Medium 0.0074 High 0.0073
1 Assumed diesel at £0.97/litre. Source: DECC Fuel price statistics, 2007 2 Laurence Gould Partnership expert judgement 3 Method based on Defra GHG Reporting Guidelines 2009, Annex 8 (Defra, 2009)

22
7.2.6 Water It was assumed that irrigation of pasture/crops is not practiced in Scotland. It was also assumed that water extracted on-site will be captured in dairy energy use data and so was not modelled separately. Mains water consumption was estimated from Scottish Farm Accounts Survey water spend data (2007). The results were sense-checked against DairyCo publication on water use (DairyCo, 2007).
Table 21: Livestock water consumption
Source Milk yield kg mains water per kg milk
FAS, 2007 Low 1.84 Medium 0.88 High 0.68 Average 1.06
DairyCo Average 5.93
Table 22: Water use assumptions
Variable Assumption Source Standing charge £776/year 2008/09. Business Stream. 25-30mm supply Supply charge £0.74/m3 2008/09. Business Stream. 1st 100,000 m3 Sewerage charge £1.26/m3 2008/09. Business Stream. All m3
7.2.7 Silage wrap The consumption of silage wrap (kg plastic film) was estimated using the assumptions detailed in Table 25, and gave the results in Table 26.
Table 23: Silage wrap assumptions
Variable Assumption Source Ratio of bale to clamp use in Scotland
70:30 Laurence Gould
Plastic use bale 1.3kg/tonne silage Defra waste factsheet1 Plastic use clamp 0.16kg/tonne silage Defra waste factsheet Silage (kg) per kg milk 2.63 – Low yield
1.94 – Medium yield 1.58 – High yield
Adult and young
Plastic type LDPE Recycled content 0% End-of-life Landfill – no info on LDPE
1 http://www.defra.gov.uk/environment/waste/topics/farm/documents/waste-minimisation.pdf

23
Table 24: Silage wrap (kg plastic film) consumption per kg milk
Variable Kg plastic film/kg milk Low 0.0025 Medium 0.0019 High 0.0015
7.2.8 Wastes
7.2.8.1 Milk No data was available on milk waste rates at farm.
7.2.8.2 Plastics Derived from silage wrap assumptions in Table 25 and results given in Table 26.
7.2.9 Refrigerant for bulk tanks Raw milk is stored on farm in bulk tanks prior to collection. These tanks are cooled using refrigerants, which can be potent global warming gases if they escape into the atmosphere. No references were found on these emissions sources in dairy farming and so an estimate of 8.4x10⁻⁸kg coolant per kg milk was developed based on the assumptions in Table 25. The production emissions of these refrigerants were excluded due to small quantities used and the assumption that use emissions dominate life cycle of these gases.
Table 25: Farm refrigerant leakage assumptions1 Variable Assumption Source Scottish milk production 1,310,177,556 kg/year Scottish Agriculture
Output Input and Income Statistics (2009) - year 20072
No. dairy enterprises 1,830 June Census, 2007 No. of tanks per enterprise
1 Assumption
Coolant capacity per tank 3kg Defra 2009 GHG Reporting Guidelines “Stand alone commercial application”
Refrigerant leak rate (operation)
2%
Mix of refrigerant gases used (by mass)
HFC 134a – 50% R404a – 50%
Assumption from literature review of common gases
Global warming potential of refrigerant mix
2,676 kgCO2e/kg coolant IPCC AR4 GWP factors (IPCC, 2007)
1 Method based on Defra GHG Reporting Guidelines 2009, Annex 8 (Defra, 2009) 2 http://www.scotland.gov.uk/Publications/2010/06/16144532/5

24
7.3 Enteric & manure storage (CH4 & N2O) The study uses IPCC (IPCC, 2006) Tier 2 equations (AEA Technology, 2009) to calculate livestock-related emissions from enteric fermentation (methane) and manure storage (methane & direct and indirect N2O). The emissions from the application of manure and slurry (and inorganic nitrogen) were estimated as part of the feed production emissions model (see Section 7.2).
7.3.1 Livestock population and energy requirements The first step in calculating methane and manure emissions is the calculation of the livestock population and energy requirements. The assumptions used in combination with IPCC (IPCC, 2006) equations are detailed below.
7.3.1.1 Assumptions Unless otherwise stated, assumptions from UK National Inventory Report (UK NIR)1 (AEA Technology, 2009) have been used in this study to calculate energy requirements. In the tables that follow, comparisons with UK NIR have been provided where possible. The assumptions are split into four main areas:
•Environment e.g. temperature •Animal & herd e.g. live body weights •Feed e.g. digestibility •Milk e.g. fat content
Environment The coefficient for calculating the Net Energy of Maintenance was adjusted in line with IPCC guidelines to take account of colder conditions in Scotland. The average winter temperature in dairy farming areas in Scotland was estimated from Met Office seasonal temperature charts to be 3.6oC. The UK average used in National Inventory Report is 5.9oC. Animal & herd Animal and herd assumptions were derived from a variety of sources including the SAC Farm Management Handbook, Laurence Gould Partnership (LGP) collated data and expert judgement and June Agricultural Census for Scotland. It was assumed that 85% of females are pregnant in any one year2.
Table 26: Live body weights (kg) for different yield and age classes
Milk yield < 1 year 1-2 years > 2 years (mature) Low 150 370 650
Medium 160 385 700 High 200 420 750
UK NIR 180 400-500 652
1 http://www.naei.org.uk/reports.php 2 Derived from Scottish June 2007 census of total dairy cows and heifers in calf divided by total mature females (Scottish Government, 2008).

25
Table 27: Average dairy weight gain (kg/animal/day) (McBain, et al., 2009)
Animal age SAC UK NIR < 1 year 0.63 0.6 1-2 years 0.62 0.3 > 2 years 0 0
Table 28: Percentage of time spent grazing1
Yield < 1 year 1-2 years > 2 years Low 38% 53% 53% Medium 38% 53% 46% High 38% 53% 33% NIR 46% 43% 46%
Feed Average feed digestibility was derived from assumptions on the digestibility of feed constituents and typical feed profiles for different ages and yields (see Section 7.2.1). Table 29: Average digestibility of different feed types: following (Gerber, et al., 2010)
Feed type Digestibility (DE%) Hay2 71% Silage3 71% Concentrates3 84% Grazing4 75%
Table 30: Average digestibility of diets
Animal age Low Medium High > 2 year 74.02% 74.38% 74.75% 1-2 years 73.72% < 1 year 76.87% UK NIR 73.59%
1 Developed using expert judgement (Laurence Gould Partnership) and SAC Management Handbook 2 Gerber et al (2010). Table A2.5. Western Europe conserved grass value 3 Derived from Gerber et al (2010) Table A2.6 using project-specific concentrate mix 4 Gerber et al (2010). Table A2.5. Western Europe fresh grass value

26
Milk
Table 31: Average milk yields per dairy cow1, following (McBain, et al., 2009)
Yield group Litres/year Kg/day Low 5,500 15.52 Medium 7,500 21.16 High 9,500 26.80 UK NIR - 19.40
Table 32: Fat content of milk (Carbon Trust, 2010)
Fat % All yields 4.00 UK NIR 4.06
7.3.1.2 Gross energy results
Table 33: Gross energy results (MJ/day)
Age Animal type Low Medium High < 1 year Cattle (non-lactating cows) 62.74 64.76 75.43 1- 2 year Cattle (non-lactating cows) 132.56 134.36 141.34
Cattle (lactating cows) 270.56 316.57 368.47 Cattle (bulls) 89.18 90.24 94.79
> 2 years Cattle (non-lactating cows) 140.88 146.55 150.02 Cattle (lactating cows) 297.42 347.14 393.75 Cattle (bulls) 90.94 94.04 94.80
UK NIR Dairy Cattle 266.86
1 Dairy cow census definition: Cows & heifers in milk + cows in calf but not in milk

27
7.3.2 Emissions factors
7.3.2.1 Enteric fermentation Methane conversion factor The IPCC methane conversion factor (Ym) is the percent of gross energy in feed converted to methane. Ym was calculated for each age group using project specific feed digestibility assumptions1.
Table 34: Methane conversion factors: following (Gerber, et al., 2010)
Age Yield Ym < 1 year All 5.84 1 - 2 years All 5.99 > 2 years Low 5.98
Medium 5.96 High 5.94
UK NIR All 6.00
Table 35: Enteric methane emissions (kgCH4) per animal per year, by yield (IPCC, 2006) Milk yield class Animal age Animal type Low Medium High < 1 year Cattle (non-lactating cows) 24.02 24.80 28.88 1- 2 year Cattle (non-lactating cows) 52.11 52.82 55.56
Cattle (lactating cows) 106.36 124.45 144.84 Cattle (bulls) 35.06 35.47 37.26
> 2 years Cattle (non-lactating cows) 55.24 57.29 58.47 Cattle (lactating cows) 116.63 135.72 153.47 Cattle (bulls) 35.66 36.76 36.95
UK NIR Dairy cattle - All 105.02 Non-dairy cattle - All 42.95
1 Ym = 9.75 – 0.05 * Digestibility Rate
28
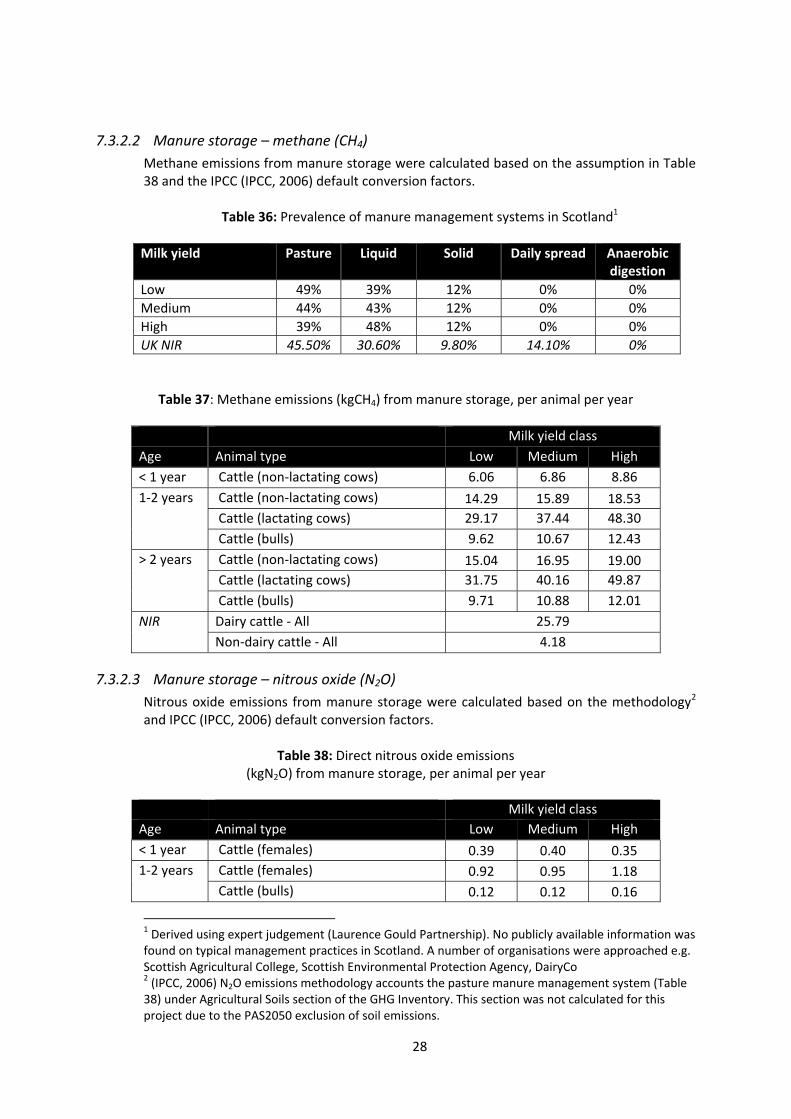
7.3.2.2 Manure storage – methane (CH4) Methane emissions from manure storage were calculated based on the assumption in Table 38 and the IPCC (IPCC, 2006) default conversion factors.
Table 36: Prevalence of manure management systems in Scotland1 Milk yield Pasture Liquid Solid Daily spread Anaerobic
digestion Low 49% 39% 12% 0% 0% Medium 44% 43% 12% 0% 0% High 39% 48% 12% 0% 0% UK NIR 45.50% 30.60% 9.80% 14.10% 0%
Table 37: Methane emissions (kgCH4) from manure storage, per animal per year
Milk yield class Age Animal type Low Medium High < 1 year Cattle (non-lactating cows) 6.06 6.86 8.86 1-2 years Cattle (non-lactating cows) 14.29 15.89 18.53
Cattle (lactating cows) 29.17 37.44 48.30 Cattle (bulls) 9.62 10.67 12.43
> 2 years Cattle (non-lactating cows) 15.04 16.95 19.00 Cattle (lactating cows) 31.75 40.16 49.87 Cattle (bulls) 9.71 10.88 12.01
NIR Dairy cattle - All 25.79 Non-dairy cattle - All 4.18
7.3.2.3 Manure storage – nitrous oxide (N2O) Nitrous oxide emissions from manure storage were calculated based on the methodology2 and IPCC (IPCC, 2006) default conversion factors.
Table 38: Direct nitrous oxide emissions
(kgN2O) from manure storage, per animal per year
Milk yield class Age Animal type Low Medium High < 1 year Cattle (females) 0.39 0.40 0.35 1-2 years Cattle (females) 0.92 0.95 1.18
Cattle (bulls) 0.12 0.12 0.16
1 Derived using expert judgement (Laurence Gould Partnership). No publicly available information was found on typical management practices in Scotland. A number of organisations were approached e.g. Scottish Agricultural College, Scottish Environmental Protection Agency, DairyCo 2 (IPCC, 2006) N2O emissions methodology accounts the pasture manure management system (Table 38) under Agricultural Soils section of the GHG Inventory. This section was not calculated for this project due to the PAS2050 exclusion of soil emissions.

29
> 2 years Cattle (females) 0.88 0.88 0.97 Cattle (bulls) 0.15 0.16 0.20
Table 39: Indirect nitrous oxide emissions
(kgN2O) from manure storage, per animal per year
Milk yield class Age Animal type Low Medium High < 1 year Cattle (females) 0.29 0.30 0.26 1-2 years Cattle (females) 0.69 0.72 0.90
Cattle (bulls) 0.09 0.09 0.12 > 2 years Cattle (females) 0.66 0.66 0.73
Cattle (bulls) 0.12 0.12 0.15
7.3.3 Soil carbon changes in existing agricultural land Due to data availability and scientific uncertainties, changes in soil carbon in existing agricultural systems are currently excluded from the Dairy Guidelines and UK National Inventory (AEA Technology, 2009).

30
7.4 Summary of results
Table 40: Summary of milk emissions (kgCO2e/kg), by herd yield & Scottish average
Emissions source Description Low Medium High Scotland Livestock Enteric fermentation 0.55 0.47 0.44 0.49
Manure storage 0.26 0.23 0.22 0.23 Feed production Grass silage 0.12 0.10 0.08 0.10
Pasture 0.17 0.12 0.08 0.13 Other feeds 0.11 0.14 0.18 0.14
Other Building energy 0.06 0.04 0.04 0.05 Services & water 0.01 0.01 0.01 0.01 Silage wrap <0.01 <0.01 <0.01 <0.01
TOTAL 1.28 1.11 1.06 1.14
Figure 1: Summary of cradle-to-gate milk emissions (kgCO2e/kg), by yield group
31
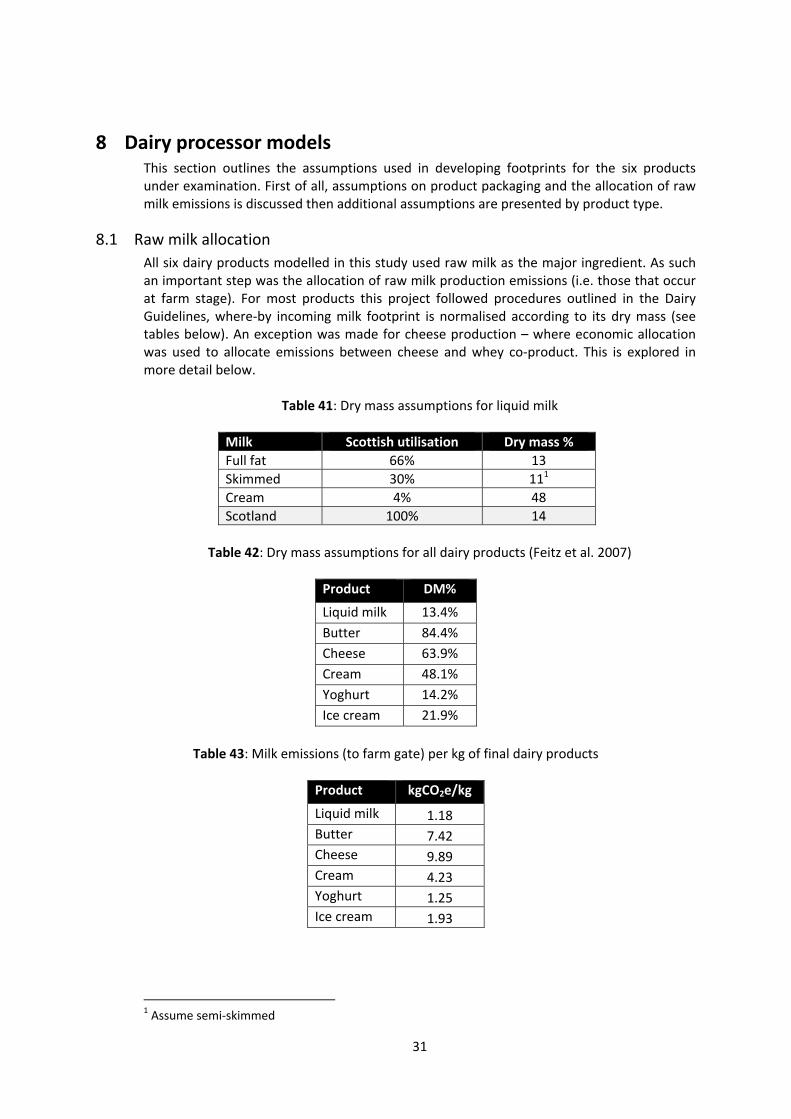
8 Dairy processor models This section outlines the assumptions used in developing footprints for the six products under examination. First of all, assumptions on product packaging and the allocation of raw milk emissions is discussed then additional assumptions are presented by product type.
8.1 Raw milk allocation All six dairy products modelled in this study used raw milk as the major ingredient. As such an important step was the allocation of raw milk production emissions (i.e. those that occur at farm stage). For most products this project followed procedures outlined in the Dairy Guidelines, where-by incoming milk footprint is normalised according to its dry mass (see tables below). An exception was made for cheese production – where economic allocation was used to allocate emissions between cheese and whey co-product. This is explored in more detail below.
Table 41: Dry mass assumptions for liquid milk
Milk Scottish utilisation Dry mass % Full fat 66% 13 Skimmed 30% 111 Cream 4% 48 Scotland 100% 14
Table 42: Dry mass assumptions for all dairy products (Feitz et al. 2007)
Product DM%
Liquid milk 13.4% Butter 84.4% Cheese 63.9% Cream 48.1% Yoghurt 14.2% Ice cream 21.9%
Table 43: Milk emissions (to farm gate) per kg of final dairy products
Product kgCO2e/kg
Liquid milk 1.18 Butter 7.42 Cheese 9.89 Cream 4.23 Yoghurt 1.25 Ice cream 1.93
1 Assume semi-skimmed

32
8.1.1 Accounting for whey co-product In dairy footprinting studies this is important as co-products occur on farm and during processing stages e.g. a significant Scottish dairy co-product is liquid whey from cheese manufacture (see Figure 2).
Figure 2: Simplified cheese production inputs and outputs (in wet and dry mass - DM)1
At processing stage, dairy footprinting guidelines (both from the Carbon Trust and IDF) recommend that emissions are allocated on a dry mass basis (the assumption being that this is a proxy for economic value). While this simplifies calculations and works with most dairy products, the authors of this study think that this proxy does not currently hold true in the cheese situation (where whey is often disposed of as a waste or as low/no value products). When the current footprint guidelines were applied to the whole industry in this study, a significant proportion of milk emissions were allocated to whey, regardless of end use (even if disposed of down public sewers). This is because, even though whey is dilute, it contains a significant quantity of dry matter in total. The net result is that, per kg, cheese had a lower footprint than might be reasonable (especially given that whey utilisation is an acknowledged waste issue2). If emissions were to be allocated along the lines of economic value, however, this would incentivise the full utilisation of co-products (i.e. those companies that dispose of whey as waste would have a much higher cheese footprint). The existing system provides no such incentive and is open to criticism.
Figure 3: How allocation decisions (by dry mass, value or mass) influence results
For this reason (and with the agreement of The Carbon Trust), this analysis allocated cheese/whey emissions on the basis of economic value. As no data was available at an industry-level on whey utilisation, estimates were used (and so is an area for data improvement).
1 Arla foods via Danish Food LCA: http://www.lcafood.dk/processes/industry/cheeseproduction.htm 2 See Box 8 in main report for details of forthcoming Scottish Enterprise study into whey valorisation

33
8.1.2 Packaging This section summarises assumptions used to estimate packaging emissions factors. Estimates were derived using the methods set out in PAS2050 Annex D.1. A variety of emissions factors sources for the production, recycling and disposal of materials were used (documented in footnotes). Recycling ‘credit’ was not calculated at end-of-life as it was included in packaging material production (see dairy processing section). This is in line for Carbon Trust Footprint Expert methodology. The study did not model transport of raw materials or bottle production & transport due to time constraints (i.e. it was assumed that material production/recycling is main source of emissions across life cycle).
Table 44: Relative GWP impact and EOL recycling rates of different packaging materials
Material Virgin kgCO2e/kg1
GHG saving recycling (%)
Recycling kgCO2e/kg2
Average EOL kgCO2e3
EOL recycling rate (UK)4
Glass 0.84 37%5 0.53 0.00 47% Plastic (HDPE) 2.83 80%6 0.50 0.02 3% Plastic film (LDPE) 2.166 81%6 0.44 0.02 3% Cartonboard 3.49 43%7 1.98 0.19 3%8 Aluminium 12.86 86%9 1.74 0.00 10% Paper 2.00 57%10 0.85 0.29 33% Polypropylene 4.41 88%11 0.53 0.02 3%
Table 45: Average recycled content of packaging materials
Product Av. recycled content12
Milk 1.9% Cheese 4.4% All industry13 2.9%
1 Source: Carbon Trust 2 Carbon Trust do not publish recycled factors for most materials so these figures were derived from published sources which detail GHG savings from recycling 3 Source: Average EOL factors, Carbon Trust. This covers average disposal emissions (e.g. landfill) 4 Household recycling rates from Carbon Trust 5 Derived from WRAP (2007): Assessment of the International Trading Markets for Recycled Container Glass and their Environmental Implications 6 Derived from US EPA (2006): Solid Waste Management and Greenhouse Gases A Life-Cycle Assessment of Emissions and Sinks 7 No Cartonboard data was available so assumed corrugate board and used Carbon Trust virgin/recycled factors 8 Assumed plastic as no carton board rate available 9 Derived from Bath Inventory of Carbon and Energy, version 1.6a 10 Derived from Ecoinvent v 2.0 11 Derived from RECOUP (2002): Recycling Plastic Bottles - The Energy Equation 12 Dairy UK packaging benchmark data. Recycled content assumptions were applied across all materials as no disaggregation was available. 13 This rate was applied across all other products: cream, ice cream, yoghurt & butter

34
8.2 Summary of inputs and cradle-to-gate results This section details processing inputs, outputs and assumptions. It also provides cradle-to-gate emissions for the six products being studied1 (see table and figure below).
Table 46: Cradle-to-gate GHG emissions
Input/output Milk Cheese Butter Cream Yoghurt Ice cream
Ingredients 1.19 9.94 7.49 4.27 1.26 1.99 Processing energy 0.09 0.22 0.06 0.00 0.29 0.44 Packaging 0.06 0.26 0.14 0.41 0.22 0.33 Other inputs 0.00 0.00 0.00 0.00 0.00 0.00 Wastes 0.00 0.00 0.00 0.00 0.00 0.01 Total 1.35 10.43 7.70 4.68 1.77 2.76
Figure 4: Cradle-to-processor gate GHG emissions totals (kgCO2e/kg) for six products
Emissions sources in subsequent sections have been colour coded to highlight hotspots:
•1% or less = Green, low priority •>1% < 10% = Amber, medium priority •10% or greater = Red, high priority
1 Footprint results given to two decimal places

35
8.2.
1 Li
quid
milk
Ta
ble
47: L
iqui
d m
ilk p
roce
ssin
g as
sum
ptio
ns &
res
ults
to p
roce
ssor
gat
e In
put/
outp
ut
Des
crip
tion
pe
r kg
milk
U
nits
kg
CO2e
/kg
%
Foot
note
s
Raw
milk
1.18
87
%
1 Pr
oces
sing
ene
rgy
Elec
tric
ity
0.08
kW
h
0.05
4%
2
Fuel
0.
21
kWh
0.05
3%
Tr
ansp
ort
Raw
milk
frei
ght
0.00
lit
res
dies
el
0.01
1%
3
Refr
iger
ant
HCF
C 5.
83E-
07
kg
0.00
0%
4,
5 H
FC
4.18
E-08
kg
0.
00
0%
Pack
agin
g To
tal,
of w
hich
…
22.8
g
0.06
5%
6
P
last
ic
17.8
g
0.05
4%
Gla
ss
2.5
g 0.
00
0%
C
arto
n 2.
5 g
0.01
1%
O
ther
inpu
ts
Wat
er
0.95
lit
res
0.00
0%
7
Proc
ess
chem
ical
s 2.
0 g
0.00
��
8
Was
te
Trad
e ef
fluen
t 0.
95
litre
0.
00
0%
9 La
ndfil
l was
te
4.0
g 0.
00
0%
9 TO
TAL
1.
35
100%
1 See
Sec
tion
13.1
on
raw
milk
em
issi
ons
allo
catio
n 2 T
otal
ene
rgy
data
from
Dai
ry U
K be
nchm
ark
data
(200
8) –
Fer
gus
McR
eyno
lds,
Per
sona
l com
mun
icat
ions
. Ene
rgy
split
bas
ed o
n U
NEP
“Cl
eane
r Pr
oduc
tion
Ass
essm
ent i
n D
airy
Pro
cess
ing”
. ‘Fu
el’ a
ssum
ed to
be
natu
ral g
as.
3 Der
ived
from
Dai
ry U
K, M
ilk R
oad
Map
dat
a –
Ferg
us M
cRey
nold
s, P
erso
nal c
omm
unic
atio
ns
4 F-G
as S
uppo
rt, I
nfor
mat
ion
Shee
t RA
C 2:
“G
uida
nce
for S
tatio
nary
Ref
rige
ratio
n &
Air
-Con
ditio
ning
”. H
CFC
assu
med
to b
e R2
2 (G
WP
1,81
0); H
FC a
ssum
ed to
be
50:5
0 bl
end
of R
134a
and
R40
4a (G
WP
2676
) 5 D
eriv
ed fr
om D
airy
UK,
Milk
Roa
d M
ap d
ata
– Fe
rgus
McR
eyno
lds,
Per
sona
l com
mun
icat
ions
6 A
vera
ge p
acka
ging
bur
den
per
kg o
f milk
was
est
imat
ed u
sing
Dai
ry U
K pa
ckag
ing
benc
hmar
ks d
ata
(tot
al m
ass)
and
WRA
P m
ilk L
CA re
port
whi
ch in
clud
es
assu
mpt
ions
on
mar
ket s
hare
by
pack
agin
g ty
pe: g
lass
11%
; pla
stic
: 78%
; car
ton:
11%
(WRA
P ‘L
ife c
ycle
ass
essm
ent o
f exa
mpl
e pa
ckag
ing
syst
ems
for
milk
’).
Pack
agin
g re
sults
incl
ude
end-
of-li
fe d
ispo
sal.
7 D
airy
UK
benc
hmar
k da
ta (2
008)
. Ass
umed
to b
e al
l mai
ns w
ater
. 8 D
eriv
ed fr
om D
airy
UK,
Milk
Roa
d M
ap d
ata
– Fe
rgus
McR
eyno
lds,
Per
sona
l com
mun
icat
ions
. Ass
umed
to b
e ‘a
vera
ge c
hem
ical
’ 9 D
airy
UK
benc
hmar
k da
ta (2
008)
. Ass
umed
to b
e m
ixed
pap
er/c
ard
com
mer
cial
was
te

36
8.2.
2 Ch
eese
Ch
eese
was
ass
umed
to b
e ch
edda
r as
this
mak
es u
p m
ajor
ity o
f Sco
ttis
h pr
oduc
tion.
Tabl
e 48
: Che
ese
proc
essi
ng a
ssum
ptio
ns a
nd r
esul
ts s
umm
ary
(cra
dle-
to-p
roce
ssor
gat
e)
Item
D
escr
ipti
on
per
kg c
hees
e U
nits
kg
CO2e
/kg
GH
G %
Fo
otno
tes
Raw
milk
9.89
95
%
1 En
ergy
El
ectr
icity
(pro
cess
ing)
0.
093
kWh
0.
06
1%
2, 3
Fuel
(pro
cess
ing)
0.
598
kWh
0.13
1%
3,
4
Elec
tric
ity (m
atur
ing)
0.
058
kWh
0.03
0%
5
Tran
spor
t Bu
lk m
ilk fr
eigh
t 0.
017
litre
s di
esel
0.
05
0%
6 Pa
ckag
ing
To
tal,
of w
hich
…
64
g
0.26
2%
7
P
last
ic
23
g
0.05
0%
Met
al
12
g
0.15
1%
Pap
er
30
g
0.06
1%
O
ther
inpu
ts
Wat
er
1.4
litre
s 0.
00
0%
8 Sa
lt 20
g
0.01
0%
9
Was
te
Trad
e ef
fluen
t 1.
3 lit
res
0.00
0%
3
Land
fill w
aste
4.
7 g
0.00
0%
3,
10
Tota
l
10.4
3 10
0%
1 See
Sec
tion
13.1
on
raw
milk
em
issi
ons
allo
catio
n 2 D
airy
UK
benc
hmar
k da
ta (2
008)
– F
ergu
s M
cRey
nold
s, P
erso
nal c
omm
unic
atio
ns
3 Ele
ctric
ity/f
uel s
plit
from
UN
EP “
Clea
ner
Prod
uctio
n A
sses
smen
t in
Dai
ry P
roce
ssin
g”. F
uel a
ssum
ed to
by
natu
ral g
as.
4 No
data
ava
ilabl
e. C
hees
es c
an b
e m
atur
ed u
p to
12
mon
ths
in c
ool.
5 Fro
m d
iscu
ssio
ns w
ith S
cott
ish
dair
y pr
oces
sor
who
pro
vide
d an
nual
ele
ctri
city
and
che
ese
tonn
age
for
larg
e st
ore
faci
lity
6 Der
ived
from
Dai
ry U
K, M
ilk R
oad
Map
dat
a –
Ferg
us M
cRey
nold
s, P
erso
nal c
omm
unic
atio
ns
7 Tot
al p
acka
ging
mas
s fr
om D
airy
UK
benc
hmar
king
(200
8). A
ssum
ptio
n on
mat
eria
l spl
it fr
om W
RAP
“UK
Pack
agin
g Be
nchm
ark
prod
uct a
naly
sis”
(20
05)
8 Ass
umed
to b
e al
l mai
ns w
ater
. Qua
ntity
from
Dai
ry U
K be
nchm
arki
ng (2
008)
9 A
ssum
ed to
be
pure
, vac
uum
dri
ed s
alt.
Est
imat
ed th
at s
alt a
dded
at u
p to
2%
by
mas
s of
pro
duct
. 10
Ass
umed
to b
e m
ixed
pap
er/c
ard
com
mer
cial
was
te

37
8.2.
3 Bu
tter
(sal
ted)
Tabl
e 49
: But
ter
proc
essi
ng a
ssum
ptio
ns a
nd r
esul
ts s
umm
ary
(cra
dle-
to-p
roce
ssor
gat
e)
In
put/
was
te
Des
crip
tion
pe
r kg
but
ter
Uni
ts
kgCO
2e/k
g %
GH
Gs
Foot
note
s Ra
w m
ilk
7.
42
96%
1
Ener
gy
Elec
tric
ity
0.06
4 kW
h
0.04
0%
2
Fuel
0.
086
kWh
0.02
0%
Tr
ansp
ort
Bulk
milk
frei
ght
0.02
2 lit
res
dies
el
0.07
1%
3
Pack
agin
g To
tal,
of w
hich
…
13.1
g
0.
14
2%
4
Alu
min
ium
11
.0
g
0.14
2%
Pap
er
2.2
g 0.
00
0%
Oth
er in
puts
W
ater
1.
0 lit
res
0.00
0%
5
Salt
13
g
0.00
0%
6
Was
te
Trad
e ef
fluen
t 1.
3 lit
res
0.00
0%
7
Land
fill
4.7
g 0.
00
0%
8 To
tal
7.
70
100%
1 See
Sec
tion
13.1
on
raw
milk
em
issi
ons
allo
catio
n 2 E
nerg
y to
tal a
nd s
plits
der
ived
from
Dan
ish
Food
LCA
and
Dai
ry G
uide
lines
res
ourc
e us
e al
loca
tion
met
hods
3 D
airy
UK,
Milk
Roa
d M
ap d
ata
– Fe
rgus
McR
eyno
lds,
Per
sona
l com
mun
icat
ions
4 A
ssum
ptio
ns o
n to
tal m
ass
and
mat
eria
l spl
it de
rive
d fr
om “
UK
Pack
agin
g Be
nchm
ark
prod
uct a
naly
sis”
, WRA
P (2
005)
5 A
ssum
ed to
be
all m
ains
wat
er
6 Ass
umed
to b
e pu
re, v
acuu
m d
ried
sal
t. Q
uant
ity e
stim
ated
from
rev
iew
of t
ypic
al s
altin
g le
vels
(% b
y m
ass)
7 N
o da
ta, s
o us
ed s
ame
assu
mpt
ion
as c
hees
e (c
onse
rvat
ive
assu
mpt
ion)
8 N
o da
ta, s
o us
ed s
ame
assu
mpt
ion
as c
hees
e (c
onse
rvat
ive
assu
mpt
ion)

38
8.2.
4 Yo
ghur
t (na
tura
l)
Tabl
e 50
: Yog
hurt
pro
cess
ing
assu
mpt
ions
and
res
ults
sum
mar
y (c
radl
e-to
-pro
cess
or g
ate)
Inpu
t/w
aste
D
escr
ipti
on
Val
ue
per
kg y
oghu
rt
kgCO
2e/k
g %
GH
Gs
Foot
note
Ra
w m
ilk
1.
25
70%
1
Ener
gy
Elec
tric
ity
0.32
5 kW
h
0.19
11
%
2 Fu
el
0.44
7 kW
h 0.
10
6%
3 Tr
ansp
ort
Bulk
milk
frei
ght
0.00
37
litre
s di
esel
0.
01
1%
4 Pa
ckag
ing
Tota
l, of
whi
ch …
53
.9
g 0.
22
ls%
5
P
last
ic
38.2
g
0.16
9%
6
M
etal
1.
9 g
0.02
1%
7
P
aper
13
.9
g 0.
03
2%
O
ther
inpu
ts
Wat
er
1.9
litre
s 0.
00
0%
8 W
aste
Tr
ade
efflu
ent
1.3
g 0.
00
0%
9 La
ndfil
l 4.
7 g
0.00
0%
10
To
tal
1.
77
100%
•N
o da
ta w
as a
vaila
ble
on r
efri
gera
nt e
mis
sion
s or
che
mic
al u
se. E
xclu
ded
as li
kely
to b
e in
sign
ifica
nt
•Add
ed s
wee
tene
rs, f
ruits
, etc
wer
e no
t inc
lude
d du
e to
lack
of d
ata
1 See
Sec
tion
13.1
on
raw
milk
em
issi
ons
allo
catio
n 2 D
eriv
ed fr
om m
ilk e
nerg
y re
quir
emen
ts a
nd a
ssum
ptio
ns o
utlin
ed in
Def
ra (2
007)
‘Im
pact
s of
food
pro
duct
ion
and
cons
umpt
ion’
Pg
68
3 Der
ived
from
milk
ene
rgy
requ
irem
ents
and
ass
umpt
ions
out
lined
in D
efra
(200
7) ‘I
mpa
cts
of fo
od p
rodu
ctio
n an
d co
nsum
ptio
n’ P
g 68
4 D
eriv
ed fr
om D
airy
UK,
Milk
Roa
d M
ap d
ata
– Fe
rgus
McR
eyno
lds,
Per
sona
l com
mun
icat
ions
5 A
ssum
ptio
n fr
om “
UK
Pack
agin
g Be
nchm
ark
prod
uct a
naly
sis”
, WRA
P (2
005)
6 A
ssum
e po
lypr
opyl
ene
7 Ass
ume
alum
iniu
m
8 Ass
umed
to b
e al
l mai
ns w
ater
9 N
o da
ta, s
o us
ed s
ame
assu
mpt
ion
as c
hees
e (c
onse
rvat
ive
assu
mpt
ion)
10
No
data
, so
used
sam
e as
sum
ptio
n as
che
ese
(con
serv
ativ
e as
sum
ptio
n)

39
8.2.
5 Cr
eam
Tabl
e 51
: Cre
am p
roce
ssin
g as
sum
ptio
ns a
nd r
esul
ts s
umm
ary
(cra
dle-
to-p
roce
ssor
gat
e)
In
put/
was
te
Des
crip
tion
V
alue
pe
r kg
cre
am
kgCO
2e/k
g G
HG
s %
Fo
otno
te
Raw
milk
4.23
90
%
1 En
ergy
El
ectr
icity
0.
0062
kW
h 0.
00
0%
2 Fu
el
0.00
36
kWh
0.00
0%
3
Tran
spor
t Bu
lk m
ilk fr
eigh
t 0.
0127
lit
res
dies
el
0.04
ng
4
Pack
agin
g Pl
astic
94
.7
g 0.
41
9%
5 O
ther
inpu
ts
Wat
er
0.2
litre
s 0.
00
0%
6 W
aste
Tr
ade
efflu
ent
1.3
litre
0.
00
0%
7 La
ndfil
l 4.
7 g
0.00
0%
8
Tota
l
4.68
10
0%
1 See
Sec
tion
13.1
on
raw
milk
em
issi
ons
allo
catio
n 2 D
eriv
ed fr
om D
anis
h Fo
od L
CA a
nd D
airy
Gui
delin
es r
esou
rce
allo
catio
n fa
ctor
s 3 D
eriv
ed fr
om D
anis
h Fo
od L
CA a
nd D
airy
Gui
delin
es r
esou
rce
allo
catio
n fa
ctor
s 4 D
eriv
ed fr
om D
airy
UK,
Milk
Roa
d M
ap d
ata
– Fe
rgus
McR
eyno
lds,
Per
sona
l com
mun
icat
ions
5 N
o da
ta a
vaila
ble,
ther
efor
e us
ed s
ame
assu
mpt
ion
as ic
e cr
eam
6 A
ssum
ed to
be
all m
ains
wat
er
7 No
data
, so
used
sam
e as
sum
ptio
n as
che
ese
(con
serv
ativ
e as
sum
ptio
n)
8 No
data
, so
used
sam
e as
sum
ptio
n as
che
ese
(con
serv
ativ
e as
sum
ptio
n)

40
8.2.
6 Ic
e cr
eam
Tabl
e 52
: Ice
cre
am p
roce
ssin
g as
sum
ptio
ns a
nd r
esul
ts s
umm
ary
(cra
dle-
to-p
roce
ssor
gat
e)
In
put/
was
te
Des
crip
tion
V
alue
U
nit p
er k
g ic
e cr
eam
kg
CO2e
/kg
% G
HG
s Fo
otno
te
Raw
milk
1.93
70
%
1 En
ergy
El
ectr
icity
0.
726
kWh
0.43
16
%
2 Fu
el
0.01
6 kW
h 0.
00
0%
3 Tr
ansp
ort
Bulk
milk
frei
ght
0.00
58
litre
s di
esel
0.
02
1%
4 Pa
ckag
ing
Plas
tic
76.4
g
0.33
12
%
5 O
ther
inpu
ts
Wat
er
4.5
litre
s 0.
00
0%
6 Su
gar
150
g 0.
05
2%
7 W
aste
Tr
ade
efflu
ent
3.4
litre
s 0.
00
0%
8 La
ndfil
l was
te
45.2
g
0.01
0%
9,
10
Tota
l
2.76
10
0%
•N
o ad
ditio
nal i
ngre
dien
ts (e
.g. f
ruit
or tr
ace
ingr
edie
nts)
wer
e m
odel
led.
1 See
Sec
tion
13.1
on
raw
milk
em
issi
ons
allo
catio
n 2 D
eriv
ed fr
om F
eitz
et a
l (20
07)
3 Der
ived
from
Fei
tz e
t al (
2007
) 4 D
eriv
ed fr
om D
airy
UK,
Milk
Roa
d M
ap d
ata
– Fe
rgus
McR
eyno
lds,
Per
sona
l com
mun
icat
ions
5 A
ssum
ed to
by
poly
prop
ylen
e. M
ass
is e
stim
ate
from
res
earc
h of
pac
kagi
ng s
peci
ficat
ions
e.g
. htt
p://
ww
w.li
anfu
.cc/
disp
lay.
asp?
id=5
3
6 Ass
umed
to b
e al
l mai
ns w
ater
. Qua
ntity
from
Inte
rnat
iona
l Fin
ance
Cor
pora
tion
‘Env
iron
men
tal,
Hea
lth, a
nd S
afet
y G
uide
lines
for D
airy
Pro
cess
ing’
7 D
eriv
ed fr
om U
nive
rsity
of D
elph
dat
a ht
tp:/
/ww
w.fo
odsc
i.uog
uelp
h.ca
/dai
ryed
u/ic
calc
.htm
l 8 In
tern
atio
nal F
inan
ce C
orpo
ratio
n ‘E
nvir
onm
enta
l, H
ealth
, and
Saf
ety
Gui
delin
es fo
r Dai
ry P
roce
ssin
g’
9 Inte
rnat
iona
l Fin
ance
Cor
pora
tion
‘Env
iron
men
tal,
Hea
lth, a
nd S
afet
y G
uide
lines
for D
airy
Pro
cess
ing’
10
Ass
umed
to b
e m
ixed
pap
er/c
ard
com
mer
cial
was
te

41
9 Distribution, use & end-of-life The Carbon Trust’s Footprint Expert tool was used to model distribution and use emissions. Product packaging and food disposal were modelled separately (see packaging assumptions section (8.1.1) for details of former).
9.1 Distribution & retail Distribution emissions sources include: vehicle fuel during transport from processor to point-of-sale; refrigerant leakage from chilled vehicles; regional Distribution Centre energy use; retail/wholesale store energy use and refrigerant leaks. For the purposes of this study it was assumed all products were consumed in the UK. Doorstep delivery was not modelled separately as it makes up a small and declining percentage of total sales (7%)1. Additionally it was assumed that all products went via retail and regional distribution centres (RDCs).
Table 53: Key distribution assumptions & summary of results
Variable Milk Butter Cheese Cream Yoghurt Ice
cream Total emissions, kgCO2e/kg 0.06 1.01 0.59 0.84 0.05 1.02 Road freight, kgCO2e/kg 0.02 0.02 0.02 0.02 0.02 0.02 Proportion of product via RDC 0% 100% 100% 100% 100% 100% Outbound distance (km)1 185 185 185 185 185 185 Empty backhaul distance (km) 2 185 185 185 185 185 185 Lorry type 33t 33t 33t 33t 33t 33t Lorry fuel Diesel Diesel Diesel Diesel Diesel Diesel Frozen (F), chill (C), ambient (A) C C C C C F Pallet type Euro Euro Euro Euro Euro Euro Load per pallet (kg)3 818 1,000 1,000 800 1,000 800 Average load utilisation (%)4 71% 71% 71% 71% 71% 71% RDC, kgCO2e/kg 0.00 0.01 0.01 0.01 0.01 0.02 Frozen, chilled or ambient? n/a C C C C F Retail, kgCO2e/kg 0.04 0.98 0.56 0.80 0.02 0.97 Frozen, chilled or ambient? C C C C C F Days in shop chiller/freezer5 1 5 5 5 5 10 ... % time in open door unit 100 100 100 100 100 50 ... % time in closed door unit 0 0 0 0 0 50
1 “Life cycle assessment of example packaging systems for milk”, WRAP (2010) 2 BFF conservative assumptions – no references found 3 Estimated using assumptions on product volume, product mass & pallet volume 4 Carbon Trust default assumption for 33t articulated lorry 5 Best Foot Forward assumptions – no references found

42
9.2 Use Use phase addresses only electricity use and refrigerant leaks (i.e. not cooking). For the calculation of electricity emissions is assumed all products are consumed in United Kingdom (i.e. UK grid average electricity). No industry-standard assumptions were found for typical storage times so these were estimated and sense-checked by Carbon Trust.
Table 54: Product use assumptions
Variable Milk
Butt
er
Chee
se
Crea
m
Yogh
urt
Ice
crea
m
Total emissions, kgCO2e/kg 0.01 0.15 0.07 0.04 0.04 0.13 Frozen, chilled or ambient? C C C C C F Product in fridge/freezer (days) 4 11 11 4 7.5 11 Portion size (g)2 250 5 30 15 150 75
1 Best Foot Forward estimate from shelf life information for typical product 3 From a variety of sources including http://www.milk.co.uk
9.3 End-of-life Disposal emissions of dairy food waste were estimated using assumptions on average wastage rates (see table below). For assumptions on product packaging end-of-life see Section 8.1.1.
Table 55: Food wastage assumptions
Variable Milk
Butt
er
Chee
se
Crea
m
Yogh
urt
Ice
crea
m
Food wastage rate 4 9% 9% 9% 9% 9% 9% Disposal route Sewer Landfill Landfill Sewer Sewer Landfill 4 ‘Waste arisings in the supply of food and drink to households in the UK’ – WRAP (2010)

43
10 Summary of cradle-to-grave results
Table 56: Summary of cradle-to-grave emissions (kgCO2e/kg) for six products
Life cycle stage Milk Cheese Butter Cream Yoghurt Ice cream Ingredient production 1.19 9.94 7.49 4.27 1.26 1.99 Processing & packaging 0.16 0.49 0.20 0.41 0.51 0.78 Distribution 0.06 0.59 1.01 0.84 0.52 1.06 Use & EOL 0.01 0.08 0.16 0.05 0.06 0.15 Total 1.4 11.1 8.9 5.6 2.4 4.0
Figure 5: Summary of cradle-to-grave emissions for six products

44
11 Quality assurance
11.1 Internal quality assurance Best Foot Forward will undertake standard analysis and report quality assurance procedures – e.g. cell-by-cell checking of spreadsheet model, references, assumptions, data sources, etc.
11.2 External review The Carbon Trust reviewed overall model approach, key assumptions, data sources and GHG accounting to ensure consistency with the draft Dairy Guidelines as far as is possible. The Carbon Trust also provided valuable insight during model development based on their significant experiences of carbon accounting in the UK dairy sector The Carbon Trust did not undertake a cell-by-cell check of spreadsheet model – this was undertaken by Best Foot Forward as part of normal Quality Assurance checks. Nor was the model certified e.g. to PAS2050 or Carbon Label. The Carbon Trust provided 7.5 days of support to the project. This amount of time provided an adequate level of review considering the overall aims of the project (i.e. to target hotspots and estimate supply-chain level emissions).

45
12 Appendix 1 - Works Cited ADAS. 2004. An evaluation of organic farming system research needs for Scotland. s.l. : Scottish Executive, 2004. ADAS Consulting Ltd. 1999. Energy use in organic farming systems. s.l. : Defra, 1999. ADAS. 2007. The Environmental Impact of Livestock Production. s.l. : Defra, 2007. AEA Technology. 2010. Climate Change Agreements - Results of the Fourth Target Period Assessment. s.l. : DECC, 2010. —. 2009. Climate Change Agreements: Results of Fourth Target Period Assessment. 2009. —. 2009. End User GHG Inventories for England, Scotland, Wales and Northern Ireland:1990, 2003 to 2007. s.l. : DECC, 2009. —. 2009. Greenhouse Gas Inventories for England, Scotland, Wales and Northern Ireland:1990 - 2007. s.l. : DECC, 2009. —. 2009. UK Greenhouse Gas Inventory, 1990 to 2007 Annual Report for submission under the Framework Convention on Climate Change. s.l. : DECC, 2009. —. 2010. UK Greenhouse Gas Inventory, 1990 to 2008 Annual Report for submission under the Framework Convention on Climate Change. s.l. : DECC, 2010. ATTRA. 2009. Comparing Energy Use in Conventional and Organic Cropping Systems. s.l. : National Sustainable Agriculture Information Service, 2009. Audsley, E, et al. 2009. An assessment of GHG emissions from the UK food system and the scope for reduction by 2050. s.l. : WWF, 2009. Azeez, G. 2009. Soil carbon and organic farming. s.l. : Soil Association, 2009. Bosworth, M E, Hummelmose, B and Christiansen, K. 2000. Cleaner Production Assessment of Dairy Processing. s.l. : UNEP, Danish EPA, 2000. British Standards Institute. 2009. Publicly available specification on assessing the life cycle greenhouse gas emissions of goods and services (PAS2050). 2009. Brunel University. 2008. Greenhouse Gas Impacts of Food Retailing. s.l. : Defra, 2008. Carbon footprinting - The science, challenges and benefits. Aumônier, S. 2008. 2008. Oxford Farming Conference. Carbon Trust. 2010. Footprint Expert Product Footprinting Tool. [Excel] s.l. : Carbon Trust, 2010. http://www.footprintexpert.com/Pages/default.aspx. v3.1. —. 2010. Guidelines for the Carbon Footprinting of Dairy Products in the UK. s.l. : Dairy UK & DairyCo, 2010. —. 2010. Industrial Energy Efficiency Accelerator - A guide to the animal feed milling sector. s.l. : Carbon Trust, 2010. College of Agriculture, Food & Rural Enterprise. 2005. Challenge Note 2A: Grass budgeting for dairy farmers. s.l. : Department of Agriculture and Rural Development, Northern Ireland, 2005. Confederation, Agricultural Industries. 2010. Industry structure. [Online] 2010. [Cited: 30 April 2010.] http://www.agindustries.org.uk. Dairy Energy Savings Ltd. Climate Change Agreement data. Fergus McReynolds, Personal communication. Dairy Supply Chain Forum. 2008. The Milk Roadmap. s.l. : Dairy Supply Chain Forum, 2008. —. 2009. The milk roadmap: One year down the road. s.l. : Dairy Supply Chain Forum, 2009. Dairy UK. Environmental benchmarking data. Fergus McReynolds, Personal communication. —. 2009. Sustainability Report. 2009. DairyCo. 2009. Dairy statistics - An insider's guide. s.l. : DairyCo, 2009. —. 2010. DairyCo - Datum. [Online] 2010. http://www.dairyco.co.uk. —. 2008. Distribution of Cows by Herd Size, Scotland. s.l. : DairyCo, 2008. —. 2007. Effective Use of Water on Dairy Farms. s.l. : MDC, 2007.

46
—. 2009. Ensuring a sustainable dairy supply chain. s.l. : DairyCo, 2009. —. 2008. Milk flow diagram. 2008. http://www.dairyco.net/datum/milk-supply/uk-milk-flow-diagram/uk-milk-flow-diagram.aspx. Defra. 2009. Energy Use on Farms; Results from the Farm Business Survey, 2007/08. s.l. : Defra, 2009. —. 2009. Farm practices survey. England farm size, type and regional results. s.l. : Defra, 2009. —. 2009. Feedingstuff prices. s.l. : Defra, 2009. —. 2010. GB Animal Feed Statistical Note. s.l. : Defra, 2010. —. 2002/3. Grain fed to livestock (England and Wales). s.l. : Defra, 2002/3. —. 2009. Guidance on how to measure and report your greenhouse gas emissions. 2009. —. 2008. Organic statistics UK. s.l. : Defra, 2008. —. 2010. Production of compounds, blends and other processed feedingstuffs in Great Britain. s.l. : Defra, 2010. —. 2010. Surveys of milk utilisation by dairies in England and Wales, Scotland and Northern Ireland. s.l. : Defra, 2010. —. 2010. The British Survey of Fertiliser Practice. s.l. : Defra, 2010. —. 2010. UK Availability, Disposals and Production of Milk and Milk Products 2009. s.l. : Defra, 2010. Department of Energy & Climate Change. 2009. UK Greenhouse Gas Inventory 1990 to 2007: Annual Report for submission under the Framework Convention on Climate Change. 2009. Dick, J., Smith, P., Smith, R., Lilly, A., Moxey,A., Booth, J., Campbell, C., Coulter, D. 2008. Calculating farm scale greenhouse gas emissions. 2008. Dragosits, U., et al. 2008. ) Implications of farm-scale methane mitigation measures for national methane emissions. s.l. : SAC and SEPA, 2008. DTZ. 2007. Scottish Primary Food and Drink Produce Processed in Scotland. s.l. : Scottish Executive, 2007. EPA Ireland. 2008. BAT Guidance Note on Best Available Techniques for the Dairy Processing Sector. 2008. ERM. 2010. Life cycle assessment of example packaging systems for milk. s.l. : WRAP, 2010. —. 2010. Life cycle assessment of example packaging systems for milk (doorstep). s.l. : WRAP, 2010. FCRN. 2010. Soil carbon sequestration workshop: Summary of discussion. s.l. : FCRN, 2010. Flysjöa, A, Cederberg, C and Dalsgaard, J. 2009. Carbon Footprint and Labelling of Dairy Products – Challenges and opportunities. s.l. : Joint Actions on Climate Chang, 2009. Food Standards Agency. 2010. Approved dairy premises in Scotland. [Online] 2010. http://www.food.gov.uk/foodindustry/farmingfood/milkandairy. Garnett, T. 2007. Meat and dairy production and consumption. s.l. : Centre for Environmental Strategy, 2007. Generation of an Industry-Specific Physico-Chemical Allocation Matrix. Feitz, A J, et al. 2007. 12 (2) 109 – 117, s.l. : Int J LCA , 2007. —. Lundie, S, et al. 2007. 2, s.l. : Int Journal of LCA, 2007, Vol. 12, pp. 109-117. Gerber, Pierre, et al. 2010. Greenhouse Gas Emissions from the Dairy Sector - A Life Cycle Assessment. s.l. : Food and Agriculture Organisation, 2010. Greenpeace. 2004. GM and dairy cowfeed. 2004. HGCA. 2010. UK Cereal Supply and Demand. s.l. : HGCA, 2010. Hopkins, A and Lobley, M. 2009. A Scientific Review of the Impact of UK Ruminant Livestock on Greenhouse Gas Emissions. s.l. : Centre for Rural Policy Research, 2009. IFC. 2007. Environmental, Health, and Safety Guidelines for Dairy Processing. s.l. : International Finance Corporation, 2007.

47
International Dairy Federation. 2010. A common carbon footprint approach for dairy (445/2010). s.l. : IDF, 2010. —. 2009. Environmental/Ecological impact of dairy sector: Literature review. s.l. : IDF, 2009. —. 2005. Guide on Life Cycle Assessment Towards Sustainability in the Dairy Chain. s.l. : IDF, 2005. International Organization for Standardization. ISO14067 - Standard for measuring and communicating the carbon footprint of products (draft). . Internet-based tools for behaviour change. Bottrill, C. 2007. 2007. European Council for Energy Efficient Economies. IPCC. 2007. Fourth Assessment Report: Climate Change. s.l. : IPCC, 2007. —. 2006. Guidelines for National Greenhouse Gas Inventories. Chapter 10: Emissions from livestock and manure management. National Greenhouse Gas Inventories Programme, Intergovernmental Panel on Climate Change. s.l. : http://www.ipcc-nggip.iges.or.jp/public/2006gl/vol4.html, 2006. —. 2006. Guidelines for National Greenhouse Gas Inventories. Chapter 11: N2O Emissions from Managed Soils. National Greenhouse Gas Inventories Programme, Intergovernmental Panel on Climate Change. s.l. : http://www.ipcc-nggip.iges.or.jp/public/2006gl/vol4.html, 2006. Land Use and Climate Change Group. 2010. Land Use Climate Change Report to Welsh Assembly Government. s.l. : Welsh Assembly Government, 2010. Laurence Gould Partnership. 2007. Dairy enterprise cost study for year ending. s.l. : Scottish Government, 2007. Lundie, S, hias Schulz, M and Peters, G. 2009. Fonterra carbon footprint measurement - Methodology report. s.l. : Fonterra, 2009. Lyne, A, et al. 2009. "Product Origin – Scotland": A Review of Industry Practice & Evidence. s.l. : RERAD, 2009. Manchester University. 2007. The Environmental, Social and Economic Impacts Associated with Liquid Milk Consumption in the UK and its Production. s.l. : Defra, 2007. McBain, C and Curry, J. 2009. The Farm Management Handbook 2009/10. s.l. : SAC Consulting, 2009. Nemecek, T, Kägi, T and Blaser, S. 2007. Life Cycle Inventories of Agricultural Production Systems. Final report ecoinvent v2.0 No.15. Dübendorf, CH : Swiss Centre for Life Cycle Inventories, 2007. New Zealand Institute of Chemistry. Environmental issues in dairy processing. —. Manufacture and use of cheese products. —. Milkfat products. Nix, J. 2010. Farm Management Pocketbook. s.l. : The Andersons Centre, 2010. Reay, G. 2008. Pesticide usage in Scotland - Arable crops. s.l. : Scottish Agricultural Science Agency, 2008. RERAD. 2010. Abstract of Scottish agricultural statistics 1982-2009. s.l. : Scottish Government, 2010. —. 2009. Economic report on Scottish agriculture. s.l. : Scottish Government, 2009. —. 2009. Farm incomes in Scotland 2007/8. s.l. : Scottish Government, 2009. —. 2009. Local Versus Global Markets for Scottish Food: Producers and Consumers What Difference Does it Make? s.l. : RERAD, 2009. —. 2008. Review into the Profitability of the Scottish Dairy Farm Sector. s.l. : RERAD, 2008. SAC Commercial Ltd. 2008. UK Marginal Abatement Cost Curves for the Agriculture and Land Use, Land-Use Change and Forestry Sectors out to 2022, with Qualitative Analysis of Options to 2050. 2008. SAC. 2008. The Impact of Increased Feed Costs on Scottish Agriculture. s.l. : SAC, 2008. Agriculture & Rural Development Factsheet.

48
SAI Platform. 2009. Discussion paper: Calculating GHG emissions in the dairy sector. s.l. : SAI Platform, 2009. Scottish Government. 2008. Climate change and Scottish agriculture: Report and recommendations of stakeholder group. 2008. —. 2009. Final results of the 2009 June Agricultural Census. s.l. : Scottish Government, 2009. —. Milk utilisation statistics, Scotland. Alistair McGregor, Personal communication. —. 2008. Scottish agricultural census summary sheets by geographic area, June 2007. s.l. : Scottish Government, 2008. —. 2010. Scottish agricultural census summary sheets by geographic area, June 2009. s.l. : Scottish Government, 2010. —. 2009. Scottish agriculture output, input and income statistics. 2009. Smith, H and Thanassoulis, J. 2008. The Milk Supply Chain Project. s.l. : University of Oxford, 2008. Soil Association. 2009. Organic Beef and Dairy Production: An introductory guide. s.l. : Soil Association, 2009. Struthers, G. 2009. Pesticide usage in Scotland - Grass and fodder. s.l. : Scottish Agricultural Science Agency, 2009. Thomassen, M, et al. 2008. Attributional and consequential LCA of milk production. s.l. : Int J Life Cycle Assess, 2008. UNFCCC. 2006. Updated UNFCCC reporting guidelines on annual inventories following incorporation of the provisions of decision 14/CP.11. 2006. University of Aberdeen. 2007. ECOSSE: Estimating Carbon in Organic Soils - Sequestration and Emissions: Final Report. s.l. : Scottish Executive, 2007. Warwick HRI. 2007. AC0401: Direct energy use in agriculture: opportunities for reducing fossil fuel inputs. s.l. : Defra, 2007. WBCSD/WRI. 2004. The Greenhouse Gas Protocol – A Corporate Accounting and Reporting Standard (Revised Edition). s.l. : WBCSD/WRI, 2004. —. 2010. The Greenhouse Gas Protocol – Product Life Cycle Accounting and Reporting Standard (draft). s.l. : WBCSD/WRI, 2010. —. 2010. The Greenhouse Gas Protocol – Scope 3 Accounting and Reporting Standard (draft). s.l. : WBCSD/WRI, 2010. Weidema, B, et al. 2008. Environmental Improvement Potentials of Meat and Dairy Products. s.l. : European Comission JRC, 2008. Weir, R. 2009. Mapping and Analysis of the Resilience of the Food Supply Chain in Scotland. s.l. : Scottish Government, 2009. Williams, A, Audsley, E and Sandars, D. 2006. Determining the environmental burdens and resource use in the production of agricultural and horticultural commodities. s.l. : Defra, 2006. World Resources Institute. 2006. The Land Use, Land-Use Change, and Forestry Guidance for GHG Project Accounting. 2006. WRAP. UK Packaging Benchmark Database. WRAP. [Online] WRAP. http://www.wrap.org.uk/retail/tools_for_change/uk_best_in_class/index.html.

© Crown copyright 2011
ISBN: 978-0-7559-9989-7 (web only)
APS Group Scotland DPPAS11243 (11/10)
w w w . s c o t l a n d . g o v . u k


![MACRO TRENDS REPORT€¦ · creates far lower greenhouse gas emissions when compared to that of dairy milk [17]. A glass of dairy milk is estimated to produce almost three times the](https://static.fdocuments.net/doc/165x107/6094ac4d88f09a096900190d/macro-trends-report-creates-far-lower-greenhouse-gas-emissions-when-compared-to.jpg)


