Dairy business value chain analysis in Lamjung district of...
12
Dairy business value chain analysis in Lamjung district of Nepal IJAM Dairy business value chain analysis in Lamjung district of Nepal Thaneshwar Bhandari Assistant Professor of Agricultural Economics, Department of Agricultural Economics, Tribhuvan University- Institute of Agriculture and Animal Science, Lamjung, Nepal. Email: [email protected], Telephone: +977-9841180343 Webpage: http://www.iaas.edu.np/site/lamjung-campus Among agricultural sub-sectors adopted, dairy business was one the most profitable agri- businesses in Nepal but past studies to support this statement was lacking in Lamjung district Nepal. The survey was carried out from April 2013 to January 2014 with the aim of analysing chain functions, capabilities of and support level of operational service providers, value addition, and market analysis of milk business actors. The study collected primary information from 97 respondents by using focus group discussion, key informant survey, observation and SWOT analysis. Results after using descriptive tools identified six chain functions. Estimated 33660 farming households milked 15272 tons raw milk annually but marketed only 13 percent milk and milk products in the 23 peri-urban local market-outlets through two routes: 784 tons milk fed through 7 small-scale chilling centres particularly cold chain process and 1201 tons through hot-milk base processing. Unmet 297 tons (32%) dairy products, all in processed form, were supplied from adjoining districts. The value addition analysis of cow milk showed that not only producers and processor added the largest cost share but also received the highest profit share among the succeeding agents. However, pricing and payments of dairy product were buyer-driven without making contract and no system of market sharing among the micro-actors. Key words: Dairy business, value chains, market outlet, margins, profitable, self-life, SWOT INTRODUCTION According to Community Livestock Development Project (CLDP) prediction for Nepal, an annual growth rate of milk products is 10 percent against past assumption of 11 percent growth in demand. Basis of analysis is growth trend of processed fluid milk demand from formal sector, population growth and income elasticity (FAO, 2010). Same report highlighted broader corners of milk production, collection, processing, marketing and distribution functions and their stakeholders but not provided location specific interventions implemented. One of the highly promising mill-hill districts for dairy business, by redirecting money from cities to rural areas, is Lamjung District which has significant share in national milk production and consumption because estimated 70% households of the total 42079 households keep 2-3 livestock units as integral part of the farming system in coordination of the crop and forestry sector (CBS, 2014; DLSO, 2013; CECI, 2011, and DDC, 2013). Statistics shows that buffalo population is 32% higher over cow number of 7991 in fiscal year 2011/12. About 19% cows International Journal of Agricultural Marketing Vol. 2(3), pp. 057-067, July, 2015. © www.premierpublishers.org. Research Article ISSN:2114-2734
Transcript of Dairy business value chain analysis in Lamjung district of...
Dairy business value chain analysis in Lamjung district of Nepal
IJAM
Dairy business value chain analysis in Lamjung district of Nepal
Thaneshwar Bhandari Assistant Professor of Agricultural Economics, Department of Agricultural Economics, Tribhuvan University- Institute of Agriculture and Animal Science, Lamjung, Nepal. Email: [email protected], Telephone: +977-9841180343 Webpage: http://www.iaas.edu.np/site/lamjung-campus
Among agricultural sub-sectors adopted, dairy business was one the most profitable agri-businesses in Nepal but past studies to support this statement was lacking in Lamjung district Nepal. The survey was carried out from April 2013 to January 2014 with the aim of analysing chain functions, capabilities of and support level of operational service providers, value addition, and market analysis of milk business actors. The study collected primary information from 97 respondents by using focus group discussion, key informant survey, observation and SWOT analysis. Results after using descriptive tools identified six chain functions. Estimated 33660 farming households milked 15272 tons raw milk annually but marketed only 13 percent milk and milk products in the 23 peri-urban local market-outlets through two routes: 784 tons milk fed through 7 small-scale chilling centres particularly cold chain process and 1201 tons through hot-milk base processing. Unmet 297 tons (32%) dairy products, all in processed form, were supplied from adjoining districts. The value addition analysis of cow milk showed that not only producers and processor added the largest cost share but also received the highest profit share among the succeeding agents. However, pricing and payments of dairy product were buyer-driven without making contract and no system of market sharing among the micro-actors.
Key words: Dairy business, value chains, market outlet, margins, profitable, self-life, SWOT
INTRODUCTION According to Community Livestock Development Project (CLDP) prediction for Nepal, an annual growth rate of milk products is 10 percent against past assumption of 11 percent growth in demand. Basis of analysis is growth trend of processed fluid milk demand from formal sector, population growth and income elasticity (FAO, 2010). Same report highlighted broader corners of milk production, collection, processing, marketing and distribution functions and their stakeholders but not provided location specific interventions implemented.
One of the highly promising mill-hill districts for dairy business, by redirecting money from cities to rural areas, is Lamjung District which has significant share in national milk production and consumption because estimated 70% households of the total 42079 households keep 2-3 livestock units as integral part of the farming system in coordination of the crop and forestry sector (CBS, 2014; DLSO, 2013; CECI, 2011, and DDC, 2013). Statistics shows that buffalo population is 32% higher over cow number of 7991 in fiscal year 2011/12. About 19% cows
International Journal of Agricultural Marketing Vol. 2(3), pp. 057-067, July, 2015. © www.premierpublishers.org.
Research Article
ISSN:2114-2734
P0p3
Rectangle
P0p3
Typewriter
0521-9965
Dairy business value chain analysis in Lamjung district of Nepal
Bhandari T 057 and 42% buffaloes are being milked and their collective milk production is 11631 tons. Growth rate of improve breeds over local breeds is 113% and raising local breeds seem reducing trend by 13% in the recent year (DoLS, 2013 and DLSO,2013). Nepalese Agriculture Perspective Plan (1995-2015) has prioritised "milk production" sub-sector as one of the best suitable outcome-base commodities for mid-hill districts in Nepal (MoAD, 2009). What are the types of value chain functions and value addition activities were there by the upstream and downstream chain actors, or any policy defect on sizable milk volume production and marketing? What level of supports are gaining from public/ civil society agencies to endorse backward and forward networks? How does private sector leading the milk business? Why does a few dairies only collecting very less milk from the inhabitants irrespective of large supply from adjoining districts? What types of milk products would be profitable in such a specified market situation? No past literatures have answered these issues. Therefore, researcher felt crucial to use value chain approach (VCA) as the best solution of sustainable milk business because VCA does not limit policy use at local level, district, country as well as links in the global level (Humphrey & Schmitz, 2001 and Humphrey,2006). Because VCA is a newly practicing market-base tool determining how business receives raw materials as input, add value to the raw materials through various processes, and sell finished products to the intended customers (GTZ, 2007; Poudel, 2008 and Keane, 2008). Since 2000s, value chain analysis has gained considerable popularity in Nepal (Banjara, 2007 and Bhandari, 2014). Value chain essentially represents enterprises where many producers and marketing companies work within their respective businesses to pursue one or more end markets (Porter, 1985 and Carmen & Demenus, 2009). Value chain participants cooperate to improve overall competitiveness of the final product, but may also be completely unaware of the linkages between their operation and other upstream or downstream participants (Kaplinksky and Morris, 2002, and Hoermann et al., 2010). Therefore, VCA encompass all of the factors of production including land, labor, capital, technology, and economic activities including input supply, production, transformation, transport, handling, marketing, and distribution necessary to create, sell, and deliver a product to an intended destination (Tchale and Keyser, 2010). The commodity chains are border-crossing value adding networks of labour and production processes whose end results are finished commodity at use (World Bank, 2012). Thus, specific objectives of the study were : i) identify dairy chain functions and capabilities of micro-actors; ii) to map micro actors and analyze opportunities and constraints under
dairy sub-sector; iii) quantify economics behind value addition in actors’ operations and market analysis of the milk products. MATERIALS AND METHODS Data source and collection methods Rapid market appraisal (RMA) tool supported collecting in-depth facts and first hand information from the primary informants. Key methods of RMA were: focus group discussion (FGD), key informant survey (KIS), observation, case study collection and validation workshop (SNV, 2010). Checklist preparation undertook for FGD and KIS as pre-field works as per relevancy of the organization and types of service they were rendering. Then, all checklists pre-tested with the non-group members of the Kunchha village and errors were corrected in it. Potential stakeholders to be visited and its itinerary prepared with the help of staffs at District Livestock Service Office (DLSO) Lamjung Nepal. Then, all particularly dairy entrepreneurs, farmer's group and cooperatives within the cow and buffalo pocket area consulted. Consulted other actors were Model dairy Yampaphant Tanahu, Safal Dairy Pokhara, District Cooperative Union Damauli and Division Cooperative Damauli which were major business suppliers of the dairy products. Researcher collected primary data in two seasons: flush season (June to July 2013) and lean season (January 2014) by using method of Upadhyay, Singh and Koirala (2000). In a latter case, same respondents consulted to confirm seasonal change, selling variability and quantity change. The study conducted ten FGDs: four with the farmers' group and six with primary milk producing cum selling cooperatives, altogether having 44 respondents each ranging 7 to 15 members. In a same vein, 47 Key Informant Survey (KIS) conducted by consulting: proprietors (of private dairy farm, private dairies, teashop and hotel), and managers of (line-agencies and Lamjung Chamber of Commerce). By observation method, FGD and KIS responses triangulated on investment at dairy animal-shed, counting dairy animal numbers, feed and fodder management, chilling centre, milk analysis and data-keeping system, and payment system. In addition to primary information, study also collected secondary data from published reports, journals, proceedings and web browsing of the related organization. Both shadow and market price of the labours, input and tool prices, and milk products at district level were also collected. Analytical methods In a beginning, cost of milk production (variable and
Dairy business value chain analysis in Lamjung district of Nepal
Int. J. Agric. Mark. 058
Milk Processing
Processed milkProcessed
products
Teashops
Private/Coops
run sales
Centres
Hotel &
restaurants Distributers
Private/coops
run sales
Centres
Hotel &
restaurants
Fat reached
(ghee, butter)
Cultured
( yoghurt, Lassi)
Heat desiccated
(Khowa, Peda)
Acid heat
coagulated
(Paneer, channa)
Universal
(ice cream)
Retailers/milk
booth
Distributers
Retailers/milk
booth
Household Consumption
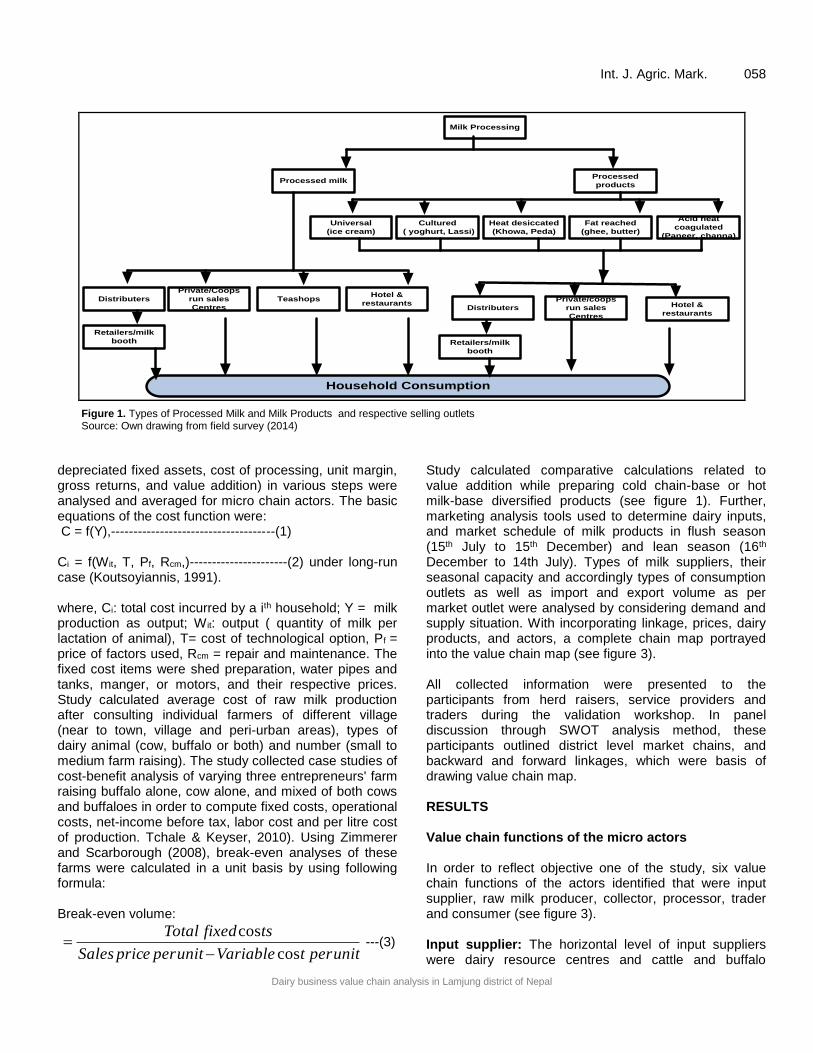
Figure 1. Types of Processed Milk and Milk Products and respective selling outlets Source: Own drawing from field survey (2014)
depreciated fixed assets, cost of processing, unit margin, gross returns, and value addition) in various steps were analysed and averaged for micro chain actors. The basic equations of the cost function were: C = f(Y),-------------------------------------(1) Ci = f(Wit, T, Pf, Rcm,)----------------------(2) under long-run case (Koutsoyiannis, 1991). where, Ci: total cost incurred by a ith household; Y = milk production as output; W it: output ( quantity of milk per lactation of animal), T= cost of technological option, Pf = price of factors used, Rcm = repair and maintenance. The fixed cost items were shed preparation, water pipes and tanks, manger, or motors, and their respective prices. Study calculated average cost of raw milk production after consulting individual farmers of different village (near to town, village and peri-urban areas), types of dairy animal (cow, buffalo or both) and number (small to medium farm raising). The study collected case studies of cost-benefit analysis of varying three entrepreneurs' farm raising buffalo alone, cow alone, and mixed of both cows and buffaloes in order to compute fixed costs, operational costs, net-income before tax, labor cost and per litre cost of production. Tchale & Keyser, 2010). Using Zimmerer and Scarborough (2008), break-even analyses of these farms were calculated in a unit basis by using following formula: Break-even volume:
unitpertVariableunitperpriceSales
tsfixedTotal
cos
cos
---(3)
Study calculated comparative calculations related to value addition while preparing cold chain-base or hot milk-base diversified products (see figure 1). Further, marketing analysis tools used to determine dairy inputs, and market schedule of milk products in flush season (15th July to 15th December) and lean season (16th December to 14th July). Types of milk suppliers, their seasonal capacity and accordingly types of consumption outlets as well as import and export volume as per market outlet were analysed by considering demand and supply situation. With incorporating linkage, prices, dairy products, and actors, a complete chain map portrayed into the value chain map (see figure 3). All collected information were presented to the participants from herd raisers, service providers and traders during the validation workshop. In panel discussion through SWOT analysis method, these participants outlined district level market chains, and backward and forward linkages, which were basis of drawing value chain map. RESULTS Value chain functions of the micro actors In order to reflect objective one of the study, six value chain functions of the actors identified that were input supplier, raw milk producer, collector, processor, trader and consumer (see figure 3). Input supplier: The horizontal level of input suppliers were dairy resource centres and cattle and buffalo
Dairy business value chain analysis in Lamjung district of Nepal
Bhandari T 059
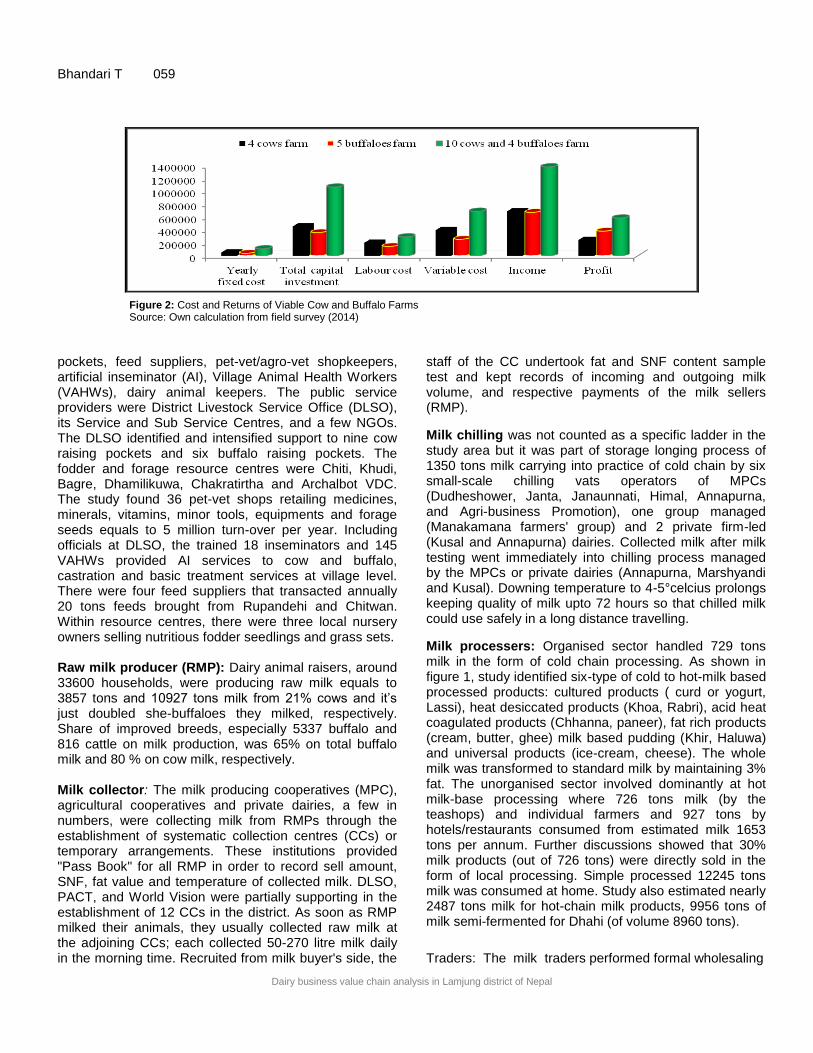
Figure 2: Cost and Returns of Viable Cow and Buffalo Farms Source: Own calculation from field survey (2014)
pockets, feed suppliers, pet-vet/agro-vet shopkeepers, artificial inseminator (AI), Village Animal Health Workers (VAHWs), dairy animal keepers. The public service providers were District Livestock Service Office (DLSO), its Service and Sub Service Centres, and a few NGOs. The DLSO identified and intensified support to nine cow raising pockets and six buffalo raising pockets. The fodder and forage resource centres were Chiti, Khudi, Bagre, Dhamilikuwa, Chakratirtha and Archalbot VDC. The study found 36 pet-vet shops retailing medicines, minerals, vitamins, minor tools, equipments and forage seeds equals to 5 million turn-over per year. Including officials at DLSO, the trained 18 inseminators and 145 VAHWs provided AI services to cow and buffalo, castration and basic treatment services at village level. There were four feed suppliers that transacted annually 20 tons feeds brought from Rupandehi and Chitwan. Within resource centres, there were three local nursery owners selling nutritious fodder seedlings and grass sets. Raw milk producer (RMP): Dairy animal raisers, around 33600 households, were producing raw milk equals to 3857 tons and 10927 tons milk from 21% cows and it’s just doubled she-buffaloes they milked, respectively. Share of improved breeds, especially 5337 buffalo and 816 cattle on milk production, was 65% on total buffalo milk and 80 % on cow milk, respectively. Milk collector: The milk producing cooperatives (MPC), agricultural cooperatives and private dairies, a few in numbers, were collecting milk from RMPs through the establishment of systematic collection centres (CCs) or temporary arrangements. These institutions provided "Pass Book" for all RMP in order to record sell amount, SNF, fat value and temperature of collected milk. DLSO, PACT, and World Vision were partially supporting in the establishment of 12 CCs in the district. As soon as RMP milked their animals, they usually collected raw milk at the adjoining CCs; each collected 50-270 litre milk daily in the morning time. Recruited from milk buyer's side, the
staff of the CC undertook fat and SNF content sample test and kept records of incoming and outgoing milk volume, and respective payments of the milk sellers (RMP).
Milk chilling was not counted as a specific ladder in the study area but it was part of storage longing process of 1350 tons milk carrying into practice of cold chain by six small-scale chilling vats operators of MPCs (Dudheshower, Janta, Janaunnati, Himal, Annapurna, and Agri-business Promotion), one group managed (Manakamana farmers' group) and 2 private firm-led (Kusal and Annapurna) dairies. Collected milk after milk testing went immediately into chilling process managed by the MPCs or private dairies (Annapurna, Marshyandi and Kusal). Downing temperature to 4-5°celcius prolongs keeping quality of milk upto 72 hours so that chilled milk could use safely in a long distance travelling.
Milk processers: Organised sector handled 729 tons milk in the form of cold chain processing. As shown in figure 1, study identified six-type of cold to hot-milk based processed products: cultured products ( curd or yogurt, Lassi), heat desiccated products (Khoa, Rabri), acid heat coagulated products (Chhanna, paneer), fat rich products (cream, butter, ghee) milk based pudding (Khir, Haluwa) and universal products (ice-cream, cheese). The whole milk was transformed to standard milk by maintaining 3% fat. The unorganised sector involved dominantly at hot milk-base processing where 726 tons milk (by the teashops) and individual farmers and 927 tons by hotels/restaurants consumed from estimated milk 1653 tons per annum. Further discussions showed that 30% milk products (out of 726 tons) were directly sold in the form of local processing. Simple processed 12245 tons milk was consumed at home. Study also estimated nearly 2487 tons milk for hot-chain milk products, 9956 tons of milk semi-fermented for Dhahi (of volume 8960 tons).
Traders: The milk traders performed formal wholesaling

Dairy business value chain analysis in Lamjung district of Nepal
Int. J. Agric. Mark. 060
Table 1. Value addition per litre of cow milk
Value addition indicators Producer Collector Processor Distributor Total
Production cost/buying price 23.0 32.8 40.3 50.0
Transport cost 0.0 1.2 2.5 0.0 3.7
Testing/ administrative cost 0.0 2.5 0.5 0.0 3.0
Processing cum chilling cost 0.0 1.0 2.2 0.3 3.5
Rent/ labour cost 3.0 0.3 1.3 0.5 5.0
Packaging and labeling 0.0 0.0 1.0 0.0 0.0
Total cost 26.0 37.8 47.9 50.8
Added cost (in NRs and %) 26.0 (66.2) 5.0 (12.6) 7.5 (19.1) 0.8 (2.0) 39.3 (100)
Sale price (NRs) 33.0 40.3 50.0 52.0
Sale byproduct (cream 1%) 0.0 0.0 4.0 0.0 4.0
Profit in NRs (sales price -cost) and 7.0 (21.3) 2.6 (6.3) 6.1 (12.3) 1.2 (2.3) 16.9
Added profit (%) 41.6 15.1 36.3 7.1 100
Note: Figures in parenthesis shows percentage Unit:- Nepalese Rupee (NRs): 1 US$ = 95 NRs
Source: Own estimates from field survey (2014)
and retailing as well as informal trading. Mostly cooperatives and few suppliers (Joshi and Hulaki) practiced wholesaling by selling dairy products relatively 6 to 12% cheaper than the retailers. Unlike it, study found majority of the milk retailing actors had no forward contract or cordial business relationship. Consumers: Study recognized 23 peri-urban areas (such as Besishahar, Bhoteodar, Sundarbazaar, Bhorletar, Udipur, and so on) as dairy product consumption outlets. General estimation of District Hotel Association and Chamber of Commerce and Industries (CCI) revealed that hotels, fast-food preparing restaurant, tea shops cum sweet-shops were major consumption outlets of processed products (Table 3 and figure 3). Chain supporters in the dairy-sectors Of the identified micro-actors getting services from the market chain supporters (meso-level and a few macro-level) are shown at right side of figure 3. The meso-level chain supporters were: Livestock Market Management Directorate (LMMD), Regional Livestock Directorate (RLD), Regional Livestock Service Training Centre (RLSTC), Regional Veterinary Lab, Division Cooperative Office, District Agriculture Coordination Committee, Commercial Banks, District Livestock Service Office (DLSO), District Development Committee (DDC), Cottage and Small Industries Committee, Institute of Agriculture and Animal Science (IAAS) Lamjung, Chamber of Commerce and Industries (CCI), Village Development Committee (VDC), Small Farmer Development Cooperatives Ltd, 41 committees of cow/buffaloes
pocket, 19 Dairy Farmers Coordination Committees, District Cooperative Union (DCU), 49 VAHWs, 9 AI trainers, Chess Nepal, World Vision-Area Development Program, and Private Dairy Association Tahanu, Chitwan and Kaski. Likewise, major macro-level chain supporters especially supporting in policy formulation and budgetary provision were: Ministry of Agricultural Development (MoAD), Ministry of Finance (MoF), Ministry of Supply and Commerce (MoSC), Department of Livestock Service (DoLS), Dairy Development Board (DDB), Nepal Agricultural Research Council (NARC), Project of Agricultural Commercialization and Trade, National Milk Development Board (NMDP), National Dairy Cooperative Union, National Animal Breeding Centre Pokhara, Federation of Chamber of Commerce and Industry (FNCCI), IAAS Rampur, and Central Banks. Economic analysis of dairy business Study used Equation (2) for computing cost of milk production, and returns with value addition generated by the micro actors. The further computation was income distribution among the value chain actors in terms of value share, margin, and cost of production of dairy products. Cost of production and returns: Figure 2 depicts average fixed cost, recurrent cost, net-income before tax, labor cost, and per liter cost of production of three farm sizes. Unit: Nepalese Rupee (NRs): 1 US$ = 95 NRs
Dairy business value chain analysis in Lamjung district of Nepal
Bhandari T 061
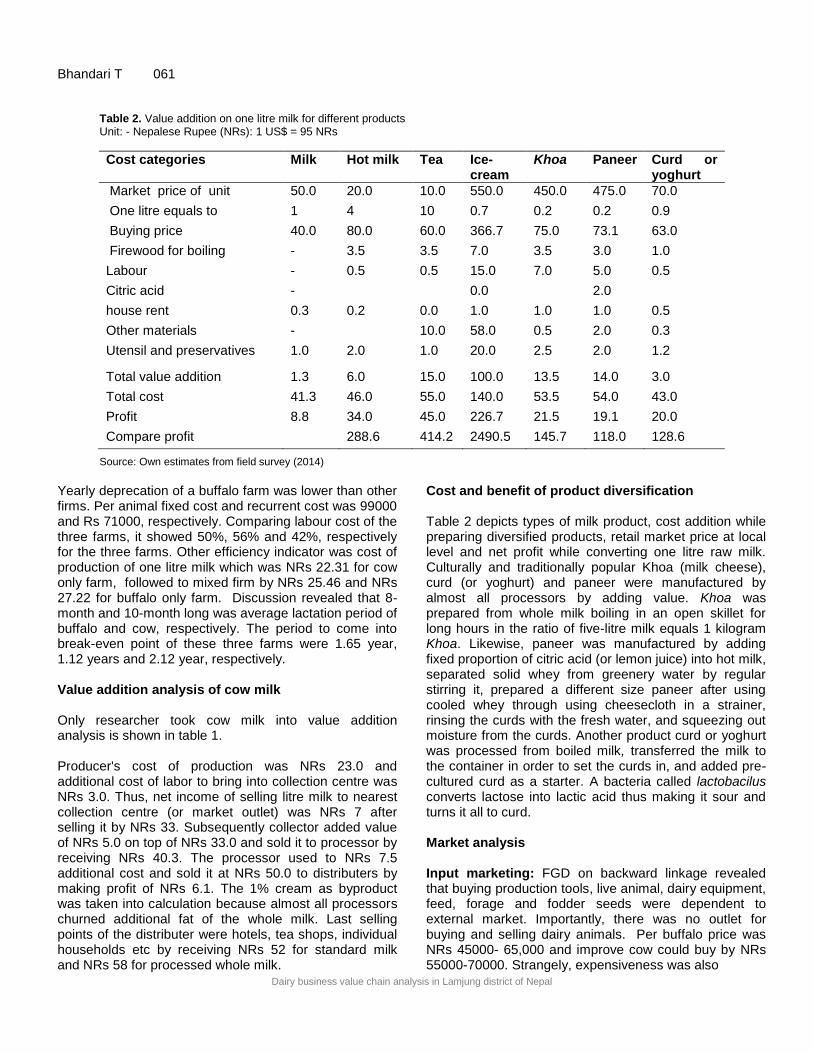
Table 2. Value addition on one litre milk for different products Unit: - Nepalese Rupee (NRs): 1 US$ = 95 NRs
Cost categories Milk Hot milk Tea Ice-cream
Khoa Paneer Curd or yoghurt
Market price of unit 50.0 20.0 10.0 550.0 450.0 475.0 70.0
One litre equals to 1 4 10 0.7 0.2 0.2 0.9
Buying price 40.0 80.0 60.0 366.7 75.0 73.1 63.0
Firewood for boiling - 3.5 3.5 7.0 3.5 3.0 1.0
Labour - 0.5 0.5 15.0 7.0 5.0 0.5
Citric acid - 0.0 2.0
house rent 0.3 0.2 0.0 1.0 1.0 1.0 0.5
Other materials - 10.0 58.0 0.5 2.0 0.3
Utensil and preservatives 1.0 2.0 1.0 20.0 2.5 2.0 1.2
Total value addition 1.3 6.0 15.0 100.0 13.5 14.0 3.0
Total cost 41.3 46.0 55.0 140.0 53.5 54.0 43.0
Profit 8.8 34.0 45.0 226.7 21.5 19.1 20.0
Compare profit 288.6 414.2 2490.5 145.7 118.0 128.6
Source: Own estimates from field survey (2014)
Yearly deprecation of a buffalo farm was lower than other firms. Per animal fixed cost and recurrent cost was 99000 and Rs 71000, respectively. Comparing labour cost of the three farms, it showed 50%, 56% and 42%, respectively for the three farms. Other efficiency indicator was cost of production of one litre milk which was NRs 22.31 for cow only farm, followed to mixed firm by NRs 25.46 and NRs 27.22 for buffalo only farm. Discussion revealed that 8-month and 10-month long was average lactation period of buffalo and cow, respectively. The period to come into break-even point of these three farms were 1.65 year, 1.12 years and 2.12 year, respectively. Value addition analysis of cow milk Only researcher took cow milk into value addition analysis is shown in table 1. Producer's cost of production was NRs 23.0 and additional cost of labor to bring into collection centre was NRs 3.0. Thus, net income of selling litre milk to nearest collection centre (or market outlet) was NRs 7 after selling it by NRs 33. Subsequently collector added value of NRs 5.0 on top of NRs 33.0 and sold it to processor by receiving NRs 40.3. The processor used to NRs 7.5 additional cost and sold it at NRs 50.0 to distributers by making profit of NRs 6.1. The 1% cream as byproduct was taken into calculation because almost all processors churned additional fat of the whole milk. Last selling points of the distributer were hotels, tea shops, individual households etc by receiving NRs 52 for standard milk and NRs 58 for processed whole milk.
Cost and benefit of product diversification Table 2 depicts types of milk product, cost addition while preparing diversified products, retail market price at local level and net profit while converting one litre raw milk. Culturally and traditionally popular Khoa (milk cheese), curd (or yoghurt) and paneer were manufactured by almost all processors by adding value. Khoa was prepared from whole milk boiling in an open skillet for long hours in the ratio of five-litre milk equals 1 kilogram Khoa. Likewise, paneer was manufactured by adding fixed proportion of citric acid (or lemon juice) into hot milk, separated solid whey from greenery water by regular stirring it, prepared a different size paneer after using cooled whey through using cheesecloth in a strainer, rinsing the curds with the fresh water, and squeezing out moisture from the curds. Another product curd or yoghurt was processed from boiled milk, transferred the milk to the container in order to set the curds in, and added pre-cultured curd as a starter. A bacteria called lactobacilus converts lactose into lactic acid thus making it sour and turns it all to curd. Market analysis Input marketing: FGD on backward linkage revealed that buying production tools, live animal, dairy equipment, feed, forage and fodder seeds were dependent to external market. Importantly, there was no outlet for buying and selling dairy animals. Per buffalo price was NRs 45000- 65,000 and improve cow could buy by NRs 55000-70000. Strangely, expensiveness was also
Dairy business value chain analysis in Lamjung district of Nepal
Int. J. Agric. Mark. 062
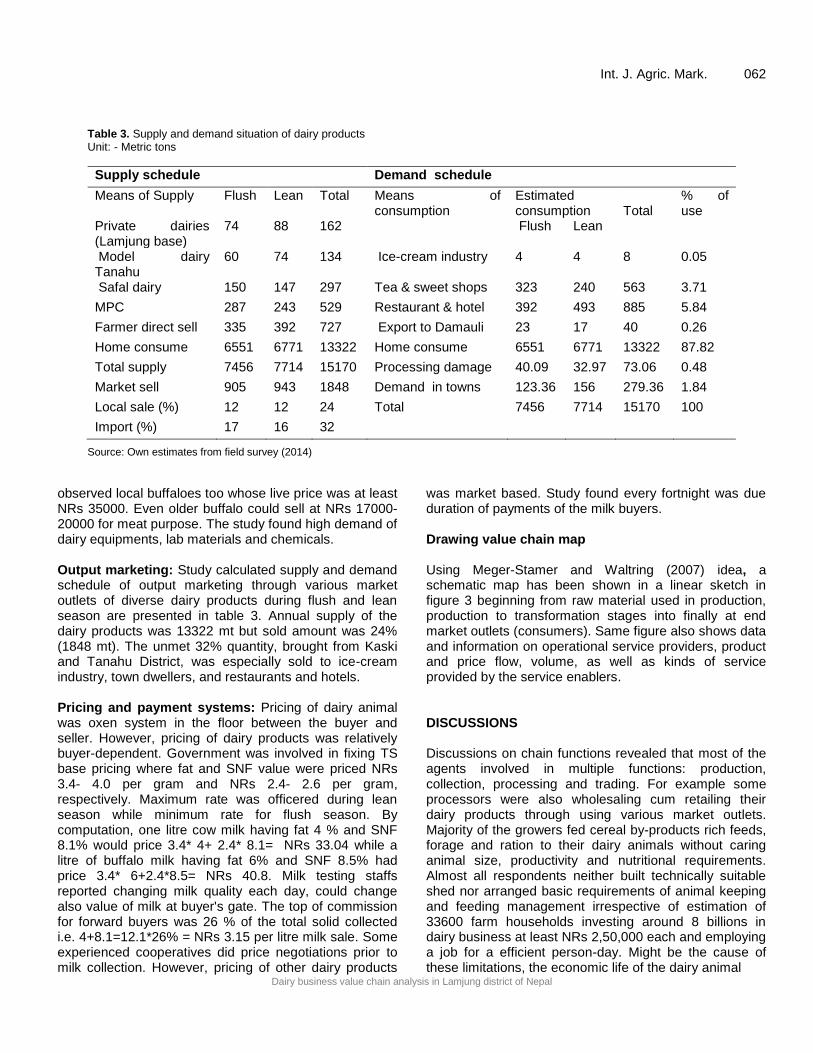
Table 3. Supply and demand situation of dairy products Unit: - Metric tons
Supply schedule Demand schedule
Means of Supply Flush Lean Total Means of consumption
Estimated consumption
Total
% of use
Private dairies (Lamjung base)
74 88 162 Flush Lean
Model dairy Tanahu
60 74 134 Ice-cream industry 4 4 8 0.05
Safal dairy 150 147 297 Tea & sweet shops 323 240 563 3.71
MPC 287 243 529 Restaurant & hotel 392 493 885 5.84
Farmer direct sell 335 392 727 Export to Damauli 23 17 40 0.26
Home consume 6551 6771 13322 Home consume 6551 6771 13322 87.82
Total supply 7456 7714 15170 Processing damage 40.09 32.97 73.06 0.48
Market sell 905 943 1848 Demand in towns 123.36 156 279.36 1.84
Local sale (%) 12 12 24 Total 7456 7714 15170 100
Import (%) 17 16 32
Source: Own estimates from field survey (2014)
observed local buffaloes too whose live price was at least NRs 35000. Even older buffalo could sell at NRs 17000- 20000 for meat purpose. The study found high demand of dairy equipments, lab materials and chemicals. Output marketing: Study calculated supply and demand schedule of output marketing through various market outlets of diverse dairy products during flush and lean season are presented in table 3. Annual supply of the dairy products was 13322 mt but sold amount was 24% (1848 mt). The unmet 32% quantity, brought from Kaski and Tanahu District, was especially sold to ice-cream industry, town dwellers, and restaurants and hotels. Pricing and payment systems: Pricing of dairy animal was oxen system in the floor between the buyer and seller. However, pricing of dairy products was relatively buyer-dependent. Government was involved in fixing TS base pricing where fat and SNF value were priced NRs 3.4- 4.0 per gram and NRs 2.4- 2.6 per gram, respectively. Maximum rate was officered during lean season while minimum rate for flush season. By computation, one litre cow milk having fat 4 % and SNF 8.1% would price 3.4* 4+ 2.4* 8.1= NRs 33.04 while a litre of buffalo milk having fat 6% and SNF 8.5% had price 3.4* 6+2.4*8.5= NRs 40.8. Milk testing staffs reported changing milk quality each day, could change also value of milk at buyer's gate. The top of commission for forward buyers was 26 % of the total solid collected i.e. 4+8.1=12.1*26% = NRs 3.15 per litre milk sale. Some experienced cooperatives did price negotiations prior to milk collection. However, pricing of other dairy products
was market based. Study found every fortnight was due duration of payments of the milk buyers. Drawing value chain map Using Meger-Stamer and Waltring (2007) idea, a schematic map has been shown in a linear sketch in figure 3 beginning from raw material used in production, production to transformation stages into finally at end market outlets (consumers). Same figure also shows data and information on operational service providers, product and price flow, volume, as well as kinds of service provided by the service enablers. DISCUSSIONS Discussions on chain functions revealed that most of the agents involved in multiple functions: production, collection, processing and trading. For example some processors were also wholesaling cum retailing their dairy products through using various market outlets. Majority of the growers fed cereal by-products rich feeds, forage and ration to their dairy animals without caring animal size, productivity and nutritional requirements. Almost all respondents neither built technically suitable shed nor arranged basic requirements of animal keeping and feeding management irrespective of estimation of 33600 farm households investing around 8 billions in dairy business at least NRs 2,50,000 each and employing a job for a efficient person-day. Might be the cause of these limitations, the economic life of the dairy animal

Dairy business value chain analysis in Lamjung district of Nepal
Bhandari T 063 Figure 3. Milk Sub-sector Value Chain Map in Lamjung District
,.
Inp
ut
Su
pp
ly
Raw
mil
k
P
rod
uct
ion
DLSO
(skill,
extensi
on
service
s
Coll
ecti
on
,
t
esti
ng a
nd
tran
sport
C
hil
lin
g a
nd
pro
cess
ing
Co
nsu
mp
tio
n
Functions Micro actors Support agencies
Tana
hu 34
tons
Hotel,
Restauran
t (No 523:
927 tons)
- Livestock Market
Management
Directorate
- Division Cooperative
Office, Damauli
-National Milk
Development Board
- DLSO (Chilling vat,
can, Analyzer_ -District Coops Union
-VDC and DDC (land,
grant)
-Commercial Banks
-CHESS Nepal
-World Vision-ADB
-Lamjung Chamber of
Commerce & Industries
(Business facilitation)
-Commercial Banks
-Small and Cottage
Industries Committee
- DLSO -IAAS Lamjung - VAHWs (45)
- AI trainers-17_ - Cow/Buffalo raising
Committee (19) -Local Tool
manufacturers - Commercial Banks - Reg. Livestock Service
Training Centre Pokhara
- Subproject PACT -MOAD/WB - National Animal
Breeding centre Pokhara
33
46
Tea shop
(No 267:
726 tons
Ice cream
Factory
(8 tons)
Used in
HHs
(13599
tons
Modal dairy
(134 tons)
Milk producing cooperatives,
livestock coordinating committees
(No 10: 529 tons)
Symbol Weak linkage Per litre milk price
Cooperative & private
chilling, processing and sale
centres (No 7: 650 tons)
45 34
Safal dairy
Pokhara
(297 tons_
Raw milk
retailing
(727 tons)
Private dairies
(No:4: 162 tons)
39
Strong linkage
50-70
37
Wh
ole
sale
an
d r
eta
il
ma
rket
ing
Farmers
(Nursery,
raising,
feed,
manageme
nt)
DLSO
(skill,
extension
services
Informal
traders
(Blacksmit
h breed
sellers)
Production skills, inputs, tools and machinery suppliers
Private farms
(No 3:75 tons) Milk producers
-Non/registered at DLSO
27573 milking animals
15160 tons)
Cow raising
cooperative
(No 1: 37 tons)
Pet-vets and Para-
vets (36) +tools
and equipments
suppliers
Rs
Dairy business value chain analysis in Lamjung district of Nepal
Int. J. Agric. Mark. 064 and milk quantity were substantially reducing over the subsequent lactations. Estimate showed local cow and buffalo had one-seventh and one-half level of milking capacity in comparison to their respective improved breeds, respectively during their lactation. Except a few local origins, most of the dairy tools cum equipments were importables of India and China which were highly expensive and technical skill-base. Also, there was no repairing person for dairy equipments. Majority of the pet-vet keepers and farmers mentioned food and mouth disease, mastitis, liver fluke, indigestion as economically important diseases. Study identified very less productivity of local breeds than that these had potential yield. It meant local breeds had nominal share on overall milk production. Unlike FAO study, far better position was reported in case average milk productivity of cow and buffalo because milk production per cow in the Hills was 435 litres and it was 812 litres for buffalo (FAO, 2010). Average quantity of milk of cow and buffalo per lactation was 534 litres and 537 litres, respectively, which was far behind the theoretical performance of the improved dairy animal (Broadway and Broadway, 2008). Unlike it, per day productivity of the improved cow was 10-12 litre milk upto 10 months while local breeds had 1.2 litres per day in a nine month’s lactation. Similarly, it was 5-6 litres for pure Murrah buffalo and 3-4 litre for cross Murrah in their seven-month long lactation. Farmers reported longer lactation period for local buffaloes in case of unsuccessful conception. The discussion prevailed that milch or pregnant breed were highly expensive and no readily availability. Whenever the raw milk brought into collection process, four issues repeatedly came into deterioration of whole milk. Some collection centres locating two to more hours' travel distance faced milk coagulation or souring because of lacking chilling facility especially collected it from newly established MPCs. Some MPCs/CCs were collecting very minimum milk quantity than that adjusting operating cost of chilling vat. Second issue reported by MPCs was malpractice of the sellers by selling: stale milk, immature (colostrums) or milk of animal treatment period. Third issue was frequent power cut-off in the chilling place that was disfunctioning some chilling vats. Some milk chilling operators faced electricity problem in lieu of delaying in transform two phase to three phased system. Using diesel plus repair and maintenance cost of chilling vat had been increased per litre chilling cost upto 11-15%. Fourth issue was not seriously following code of practice of routine sanitation of milk plant, utensils, and milking animal. From individual farmers to majority of the CC used dirty aluminum cans, jars or plastic gallon while bringing or milking, keeping milk, curds because of not having practice or awareness of using chilled Lorries in transportation.
Milk chilling was considered major function without forming a specific ladder in the study area but only 9 % raw milk of the total sale came into cold chain through six small scale chilling vats operated under MPCs and 2 private dairies. Other low cost option was using deep freeze or simple refrigerator. The processing capacity of organised sector (Such as private dairies and dairy cooperatives) was growing year after year and rate was higher for private dairies than MPCs. However, both actors underutilised (65-70% only) chilling and processing capacity. It was also revealed that the some actors were using relatively high-tech chilled to frozen products having long self-life (like ice cream, sweets and cheese). However, the size of the universal products market was disproportionately small in comparison to overall milk product consumed in the local market. Annually 11 tons fat-rich paneer was consumed inside the district with the daily supply made from local manufacturers. The cream demand of two ice-cream factories hardly fulfilled from internal production so was importing from other district. Unorganised sector was manufacturing and retailing temperature ambient low shelf-life products through using simple processing. For example, raw milk producers directly retailed dairy products to hotels, teashops or sweetshops without assuring quality. Yearly fluctuations in milk demand and supply during lean to flush season had adjustment problem of the processors in lieu of absence of bulk processing plant, no batch pasteurization practice, monopolistic competition in getting milk, and poor packaging and labelling practices of manufactured products, which ultimately increased distribution costs (see table 1). Study reported increased consumption of income elastic milk products in town dwellers. Drinking boiled milk in a morning or with lunch as well as dinner, using milk tea/coffee was traditional way of milk consumption in the study area. Almost 82% produced milk was consumed at home by using simple processing i.e just boiling and consuming or churning 2-3 days stale curd into buttermilk, butter and ghee under hot milk-base product making. This study estimated roughly 80 litres equivalent per capita milk consumption, which was relatively higher than national average of 57 litres (DLSO, 2013). It meant though own production or importing from other districts, per capita consumption was relatively higher than the national average (DLSO, 2013). The milk suppliers did not address quality concern of the consumer in the past but the Department of Food and Quality Control (DFTQ) sanctioned one milk company as defaulters in the presence of coliform in dairy products of last years' supply. Other points of distraction of keeping livestock was gradually increased over the years because of no younger's interest on farming irrespective of rapidly growing demand of dairy
Dairy business value chain analysis in Lamjung district of Nepal
Bhandari T 065 products in the peri-urban, urban and home-stay (because of yearly approximately 30 thousand tourist arrived in a district), and increasing labour wage over the year. As a major input provider of the public sector office, the DLSO was also supporting fodder seeds, grass-sets, tools, and veterinary services in a subsidized rate under extension support programme. DLSO had 18 high to junior level technicians for providing extension services through district office and 11 local service centres by annually allocating 30% budget at dairy sector of total annual programme. Considering high price of milch breed cow, DLSO Lamjung had nominal price support to yearly 40 improved cattle. Other public service providers and non-government organization (NGO) had joint programme of providing very nominal production inputs. Only one bank invest in agriculture was Agricultural Development Bank Ltd. Beshisahar, which only invested two millions loans in dairy sub-sector in the study area along with nominal support of animal insurance scheme. Figure 1 depicts three cases: raising buffalo alone in Sundarbazaar VDC-5, cow-alone farm in Bhalayakharka-2 and mixed of cows and buffaloes in Sundarbazaar-4. Discussions on average investment revealed that farmers used varying rate of current, working and long-term assets. Of the calculation of total cost investment, types of animal raising was also one of the causes of increase or decrease cost. For example dairy cattle as more efficient milk producer over milch buffalo by 30 % because of shorter calving interval and longer lactation length (Upadhya et al, 2000). Unlike the result, this study estimated 1.12 year i.e. two-lactation as pay-back period for a buffalo only farm (see figure 1) because of selling milk in higher price. Value addition of a litre cow milk analysis shown in table 2 revealed that cost price and market price spread was NRs 10 per litre at farm-get but difference was 3 times higher for buffalo milk (DLSO, 2013). Particularly costs addition and generating profit margins in each ladder had special meaning in value chain analysis. Profit in terms of sale price was the highest for milk suppliers (21%) followed by the processors (12%) and collectors (6%). Table 2 depicts total profit generation NRs 17 by adding total cost NRs 39.3 (i.e. NRs 23.0 production and NRs 16.2 marketing cost). The largest profit share was calculated for the raw milk producer (by 42%) by investing added cost of 66 %, followed by processor. Of the total 15272 tons milk produced, only 4.5% milk was handled by the collectors (3.5% from cooperatives and 1% by private dairies). Considering that statistic, farm-get revenue of the raw milk producer was Rs 504 millions (multiplied farm get
price of Rs 33.0). The collectors could receive NRs 27.88 million incomes and NRs 1.8 million net profit, organized processor handled 783 tons milk to earn NRs 39.15 millions income and NRs 4.8 million net income. Similar margins also reported by FAO (2010). PACT (2012) also reported the highest share to the raw milk producers in far-west districts. By analogy, producers and processors ultimately benefitted from the retail price paid by the consumers. Using economics of scale, this analysis also confirmed that cost of producing and processing milk would be substantially lower in case increasing firm size. Results presented in table 3 revealed that manufacturing seasonal item (like ice-cream) was highly profitable business followed by selling milk tea and hot milk in the same vain, Khoa and paneer were mild profitable items but making sweets from Khoa was highly profitable in comparison to selling standalone. These results were also supported in Indian context that diversified milk products had much more benefit than selling fluid milk (Export Victoria, 2009). Table 3 depicts milk supply and demand from market outlets in two seasons: flush season (July 15 to December 15) and lean season (Dec 16-Jul 14). Additional unmet dairy products demand than that marketed 1848 tons was 32 % that was imported from Tanahu and Kaski district. Major dairy products consumption outlets were: household consumption (87.82%), 267 tea cum/or sweet shops used 563 tons (3.7%), 523 numbers larger hotels, restaurants and home-stay used 885 tons (5.8%), individual households in peri-urban area used 2% milk, 2 ice-cream factories used 8 tons, 40 tons raw milk exported to Tahahu district (via Damauli Cooperatives), and 0.5% losses. Standard milk, raw milk sale and traditional subcontinent products such as Khoa, paneer, curd and ghee dominated local market sale but dairy product market was growing by 5 % annually because of rapid urbanization and increased income of those usual consumers. However, maintaining coordinated supply chain of such products was challenging job of current suppliers because of above said issues. Price fixation of dairy animal was based on lactation age, average milked quantity, udder quality, lactation length, behaviour, body structure and colour. Generally applied practice was selling breeds farmer to farmer especially within or nearby village. The fat and SNF value, which were applied throughout the country, were major factors of fixing fluid milk price (DDC, 2013 & PACT, 2012). Suspecting the milk adulteration because of fat and SNF value, however, FAO (2010) recommended cost of milk production and price inflation Although private dairy association (PDA) was not formulating in the study district, but adjoining district Tanahu and Pokhara had
Dairy business value chain analysis in Lamjung district of Nepal
Int. J. Agric. Mark. 066 dominant role of it on fixing milk product prices (DLSO, 2013). Unlike it, bargaining on milk pricing was adopted for unorganised sectors. There was no bargain in milk quality but price received of each dairy product had 20-30% higher at direct sell. CONCLUSIONS Input supply, milk production, collection and testing, processing, trade, and consumption were key value chain functions. Some ladders were under-specified because of multiple tasks conducted by the same agent. Mainly keeping dairy animals under traditional shed by feeding under-balanced feed were key factors of poor productivity of the breeds. Analysis confirmed that cost of producing and processing milk could lower if working under economics of scale. There were very few chain supporters substantially support value chain financing, however, 3 private dairy animal farms, 4 private dairies and 12 collection centres, 7 cooperatives and cow and farmers group at buffalo pocket centres were doing novel works on dairy business commercialization. In addition to its annual production of 15272 metric tons, around 32% milk was imported from adjoining districts to meet the growing demand of milk and milk product irrespective of outgoing 34 tons raw milk in Tanahu. Of the total milk marketed, processors handled only 729 tons milk for preparing low self- life products. The major consumption outlets of dairy products were hotels, teashops, town dwellers, ice cream factories and export Tanahu districts. Study also concluded inelastic demand and supply of local live breed but income elastic market demand of cross/improved one. Cost addition and generating profit margins in each ladder had special meaning in value chain analysis, which concluded that value capturing chain agents were raw milk producers and processors. However, pricing and payments of milk and milk product were buyer-driven without making contract and no system of market sharing among the micro-actors. No endorsement of dairy business plan, no strengthening backward linkage support (improved breed supply, modern equipments, and AI services), not caring scientific shed and feed management at producer level, not establishing large capacity milk processing plant within the district, no skill transfer for preparing diversified universal dairy products, and including other poor performance of secondary and tertiary marketing functions were major weakness of poor performance of the dairy business. Thus, new areas of investment are suggested to concerned operational service providers to boom share of dairy-sub sector in the national economy. Increased production by improving performance of existing animal (Feed, AI, management)
could easily substitute district milk demand and also can supply excess quantity. ACKNOWLEDGEMENTS Research Division at Tribhuvan University was highly grateful for granting competitive faculty research fund for these nobel results. The author would like to thank for those concerned respondents and stakeholders giving valuable information. Great thanks to Research Assistants: Amrit B.K., Anuja Rijal, Bhawana Bhattrai, Kumar Shrestha, Nabin Sedain and Sita Khanal for collecting parts of primary information. Finally, the author would like special thanks to all unanimous peer reviewers and editors of this article.
REFERENCES Banjara G (2007). Handmade paper in Nepal: Upgrading
value chain approach. GTZ Nepal (2nd edn), 1-24. Bhandari T. (2014). Analyzing dairy sub-sector value
chain in Far-Western terai districts of Nepal. J. of Inst. of Agr. and Anim. Scie. Rampur Campus, Nepal.
Broadway A, Broadway A. (2002). Marketing milk and milk products. In: Textbook of agribusiness management, Kalyani Publishers New Delhi.
Carmen L, Demenus W (2009). Value chains promotion guideline. Salvadorean Private Actors GTZ I: 7-15.
Central Bureau of Statistics (CBS) (2014). Population census of Nepal, Kathmandu Nepal.
Canadian Centre for International Studies and Cooperation (CECI) (2011) Dairy cooperatives in Nepal: Big changes for small communities. Final progress report, Kathmandu Nepal.
Christopher M (2005). Logistics and supply chain management: Creating value-adding networks. Pearson Education Limited, (3rd edn), pp 12-14.
Dairy Development Corporation (DDC) (2013). Annual progress report fiscal year 2012/13,Kathmandu, Nepal.
District Livestock Service Office (2014). Annual planning and progress report 2070/2071, Lamjung Nepal.
District Livestock Service Office (2013). Annual progress report 2012/13. Lamjung Nepal.
Department of Livestock Service (2013). Annual progress report 2011/2012, Lalitpur Nepal.
Export Victoria (2009). Market opportunities in Indian dairy value chain: A research study for the Victorian Government Business Office-India.
Food and Agricultural Organization (2010). Dairy sector study in Nepal, Kathmandu.
German Technical Cooperation (GTZ) (2007). Value links manual: The methodology of value chains promotion, German Technical Cooperation, 1st Edition, Eschborn, Germany.
Dairy business value chain analysis in Lamjung district of Nepal
Bhandari T 067
Hoermann B, Choudhary D, Choudhury D, Kollmair M
(2010). Integrated value chain development as a tool for poverty alleviation in rural mountain areas: An analytical and strategic framework. ICIMOD, Kathmandu.
Humphrey J. (2006). Global value chains in the agri-food sector. UNIDO, Vienna working paper: pp 13-52.
Humphrey J, Schmitz DH (2001). Governance in global value chains. Institute of Development Studies. IDS Bulletin 32(3), pp.1-5.
Kaplinksky R, Morris M (2002). A handbook for value chain research. Inst. of Dev. Studies. http://rmportal.net/library/content/frame/handbook-for-value-chain-research.pdf. Access on March 07, 2010.
Keane J (2008). A new approach to global value chain analysis. Overseas Development Institute, Working Paper (293), pp 2-11.
Koutsoyiannis A (1991). A modern microeconomics. 2nd Edition, Palgrave Macmillan
Meger-Stamer J, Waltring F (2007). Linking value chain
and the making markets works better for the poor concept. GTZ, Online access January 23, 2013.
Ministry of Agricultural Development (2009). Collection of agriculture related policies, acts, laws and bylaws". Kathmandu Nepal.
Project for Agricultural Commercialization and Trade
(2012). Value chain status of dairy in Far-Western Development region. MoAD, Kathmandu Nepal.
Poudel KL (2008). Total value chain management. In: Agribusiness Management. Himalayan College of Agricultural Science and Technology Kathmandu, pp. 291-297.
Pourter M (1985). Competitive advantage: Creating and sustaining superior performance. Accessed October 07, 2012.
Netherlands Development Organization (2010). Cardamom value chain analysis in the eastern Nepal.SNV Lalitpur, Nepal
Tchale H, Keyser J (2010). Quantitative value chain analysis: An application to Malawi. The World Bank Africa Region Policy Research Working Paper 5242.
Upadhyay R, Singh S, Koirala G (2000). A policy review on milk holidays. Research report series (44). Winrock International Kathmandu.
World Bank (2012). Facilitating smallholders' access to modern marketing chains. In: Agricultural Innovation Systems: An Investment Sourcebook. http://www.wb.org/publications. Online access January 23, 2013, pp. 52-58.
Zimmerer WZ, Scarborugh NM (2008). Essentials of Entrepreneurship and Small Business Management. 5th Edition, Pearson Education, Inc Publishing USA.
Accepted 17 April, 2015
Citation: Bhandari T (2015). Dairy business value chain analysis in Lamjung district of Nepal. International Journal of Agricultural Marketing, 2(3): 057-067.
Copyright: © 2015. Bhandari T. This is an open-access article distributed under the terms of the Creative Commons Attribution License, which permits unrestricted use, distribution, and reproduction in any medium, provided the original author and source are cited.