Summer 2021 Tourism and Hospitality Industry Survey Findings
23
Summer 2021 Tourism and Hospitality Industry Survey Findings
Transcript of Summer 2021 Tourism and Hospitality Industry Survey Findings
Summer 2021 Tourism and Hospitality Industry Survey Findings
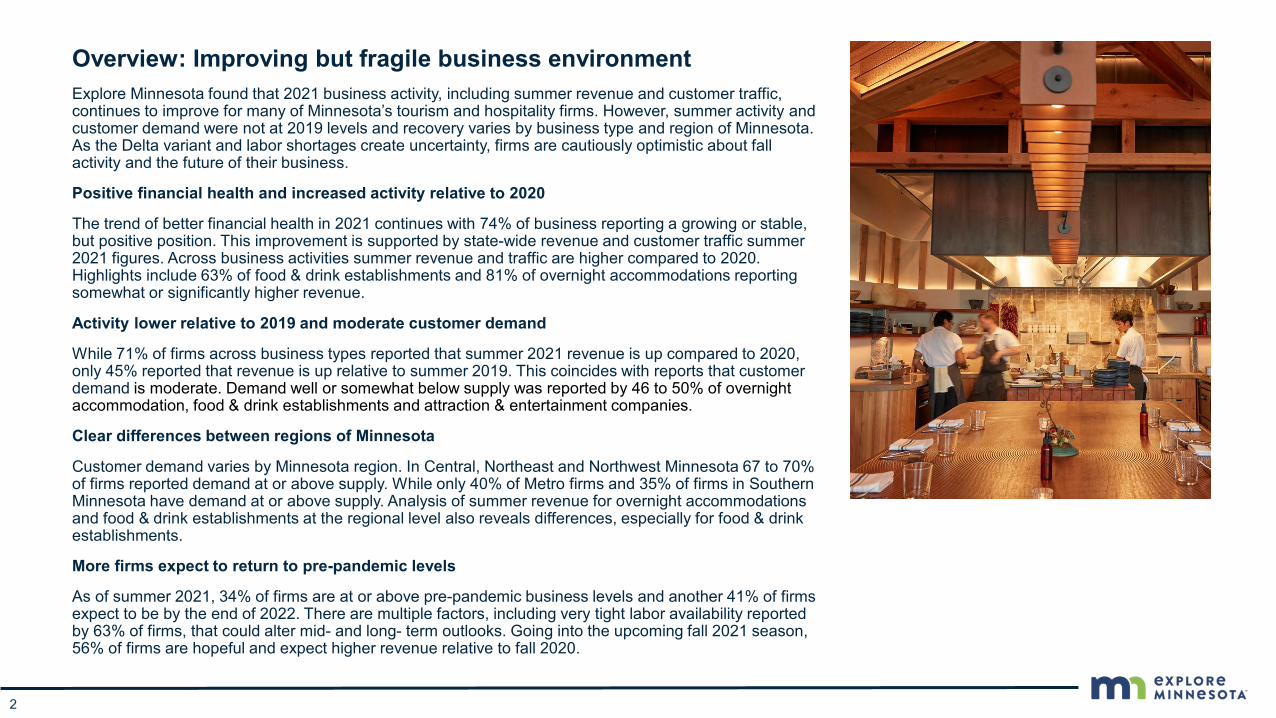
Overview: Improving but fragile business environmentExplore Minnesota found that 2021 business activity, including summer revenue and customer traffic, continues to improve for many of Minnesota’s tourism and hospitality firms. However, summer activity and customer demand were not at 2019 levels and recovery varies by business type and region of Minnesota. As the Delta variant and labor shortages create uncertainty, firms are cautiously optimistic about fall activity and the future of their business.
Positive financial health and increased activity relative to 2020
The trend of better financial health in 2021 continues with 74% of business reporting a growing or stable, but positive position. This improvement is supported by state-wide revenue and customer traffic summer 2021 figures. Across business activities summer revenue and traffic are higher compared to 2020. Highlights include 63% of food & drink establishments and 81% of overnight accommodations reporting somewhat or significantly higher revenue.
Activity lower relative to 2019 and moderate customer demand
While 71% of firms across business types reported that summer 2021 revenue is up compared to 2020, only 45% reported that revenue is up relative to summer 2019. This coincides with reports that customer demand is moderate. Demand well or somewhat below supply was reported by 46 to 50% of overnight accommodation, food & drink establishments and attraction & entertainment companies.
Clear differences between regions of Minnesota
Customer demand varies by Minnesota region. In Central, Northeast and Northwest Minnesota 67 to 70% of firms reported demand at or above supply. While only 40% of Metro firms and 35% of firms in Southern Minnesota have demand at or above supply. Analysis of summer revenue for overnight accommodations and food & drink establishments at the regional level also reveals differences, especially for food & drink establishments.
More firms expect to return to pre-pandemic levels
As of summer 2021, 34% of firms are at or above pre-pandemic business levels and another 41% of firms expect to be by the end of 2022. There are multiple factors, including very tight labor availability reported by 63% of firms, that could alter mid- and long- term outlooks. Going into the upcoming fall 2021 season, 56% of firms are hopeful and expect higher revenue relative to fall 2020.
2
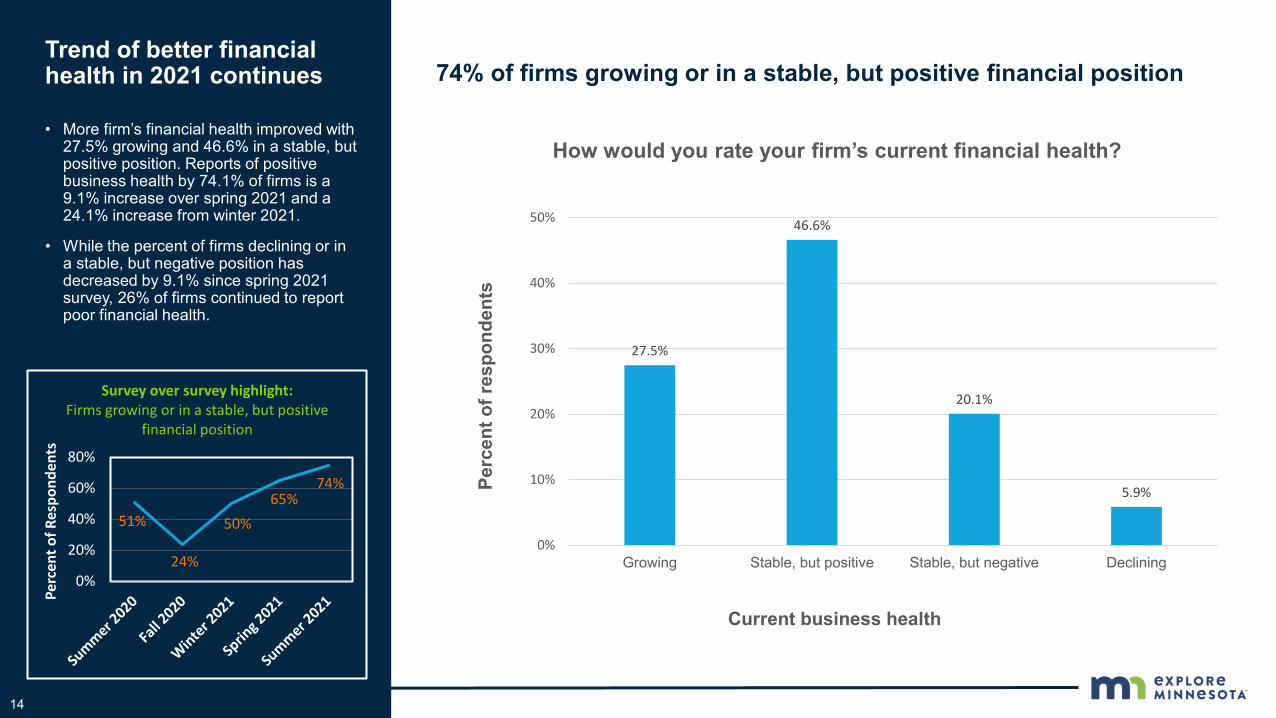
74% of firms growing or in a stable, but positive financial position Trend of better financial health in 2021 continues
• More firm’s financial health improved with 27.5% growing and 46.6% in a stable, but positive position. Reports of positive business health by 74.1% of firms is a 9.1% increase over spring 2021 and a 24.1% increase from winter 2021.
• While the percent of firms declining or in a stable, but negative position has decreased by 9.1% since spring 2021 survey, 26% of firms continued to report poor financial health.
14
27.5%
46.6%
20.1%
5.9%
0%
10%
20%
30%
40%
50%
Growing Stable, but positive Stable, but negative Declining
Perc
ent o
f res
pond
ents
Current business health
How would you rate your firm’s current financial health?
51%
24%
50%65%
74%
0%
20%
40%
60%
80%
Perc
ent o
f Res
pond
ents
Survey over survey highlight: Firms growing or in a stable, but positive
financial position
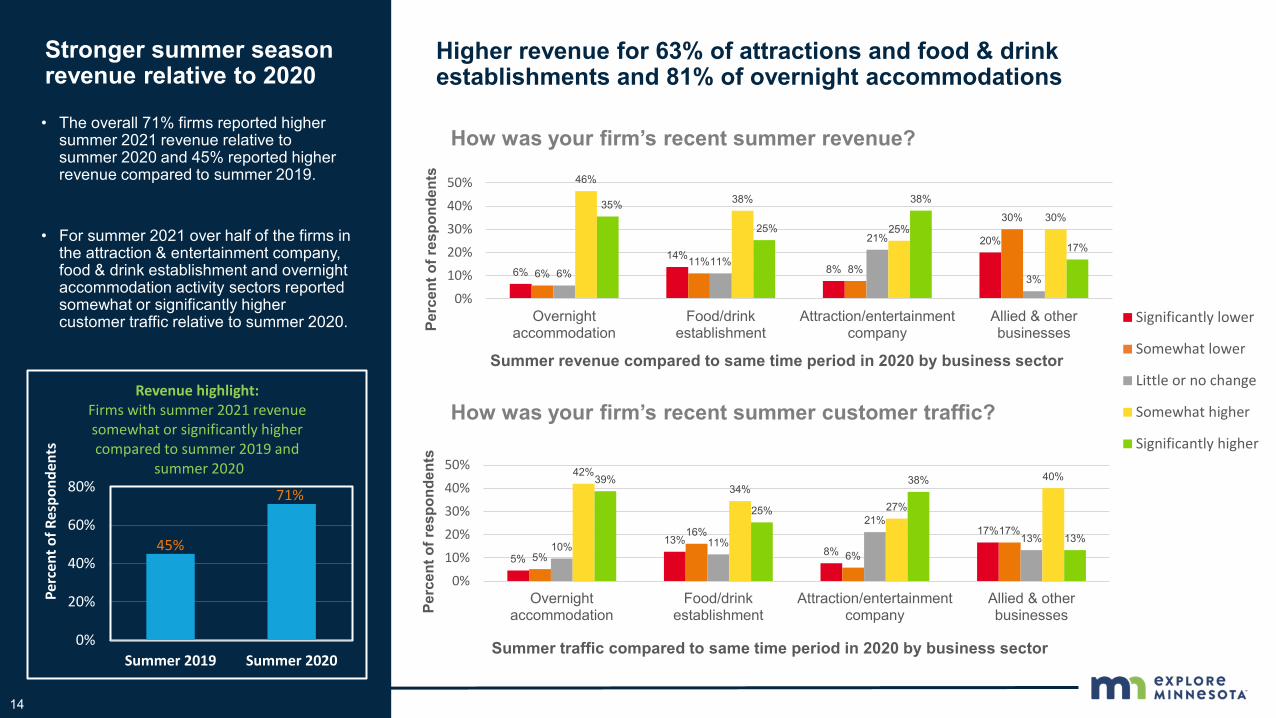
Higher revenue for 63% of attractions and food & drink establishments and 81% of overnight accommodations
Stronger summer season revenue relative to 2020
• The overall 71% firms reported higher summer 2021 revenue relative to summer 2020 and 45% reported higher revenue compared to summer 2019.
• For summer 2021 over half of the firms in the attraction & entertainment company, food & drink establishment and overnight accommodation activity sectors reported somewhat or significantly higher customer traffic relative to summer 2020.
14
6%14%
8%
20%
6%11%
8%
30%
6%11%
21%
3%
46%
38%
25%30%
35%
25%
38%
17%
0%
10%
20%
30%
40%
50%
Overnightaccommodation
Food/drinkestablishment
Attraction/entertainmentcompany
Allied & otherbusinessesPe
rcen
t of r
espo
nden
ts
Summer revenue compared to same time period in 2020 by business sector
How was your firm’s recent summer revenue?
Significantly lower
Somewhat lower
Little or no change
Somewhat higher
Significantly higher
How was your firm’s recent summer customer traffic?
5%
13%8%
17%
5%
16%
6%
17%10% 11%
21%13%
42%34%
27%
40%39%
25%
38%
13%
0%
10%
20%
30%
40%
50%
Overnightaccommodation
Food/drinkestablishment
Attraction/entertainmentcompany
Allied & otherbusinessesPe
rcen
t of r
espo
nden
ts
Summer traffic compared to same time period in 2020 by business sector
45%
71%
0%
20%
40%
60%
80%
Summer 2019 Summer 2020
Perc
ent o
f Res
pond
ents
Revenue highlight: Firms with summer 2021 revenue somewhat or significantly higher compared to summer 2019 and
summer 2020
14
2%11%
0%
14%2%
8% 7%0%
8% 3%13%
0%
58%
37%
53%
29%30%41%
27%
57%
0%
20%
40%
60%
80%
Resort Hotel/motel Campground B&B/historic innPerc
ent o
f res
pond
ents
Summer revenue compared to same time period in 2020 by lodging type
How was your firm’s recent summer revenue?
Significantly lower
Somewhat lower
Little or no change
Somewhat higher
Significantly higher
How was your firm’s recent summer customer traffic?
2% 7%0%
14%2%
8%0% 0%
17%
3%
20%
0%
53%
37%47%
14%26%
45%33%
71%
0%
20%
40%
60%
80%
Resort Hotel/motel Campground B&B/historic innPerc
ent o
f res
pond
ents
Summer traffic compared to same time period in 2020 by lodging type
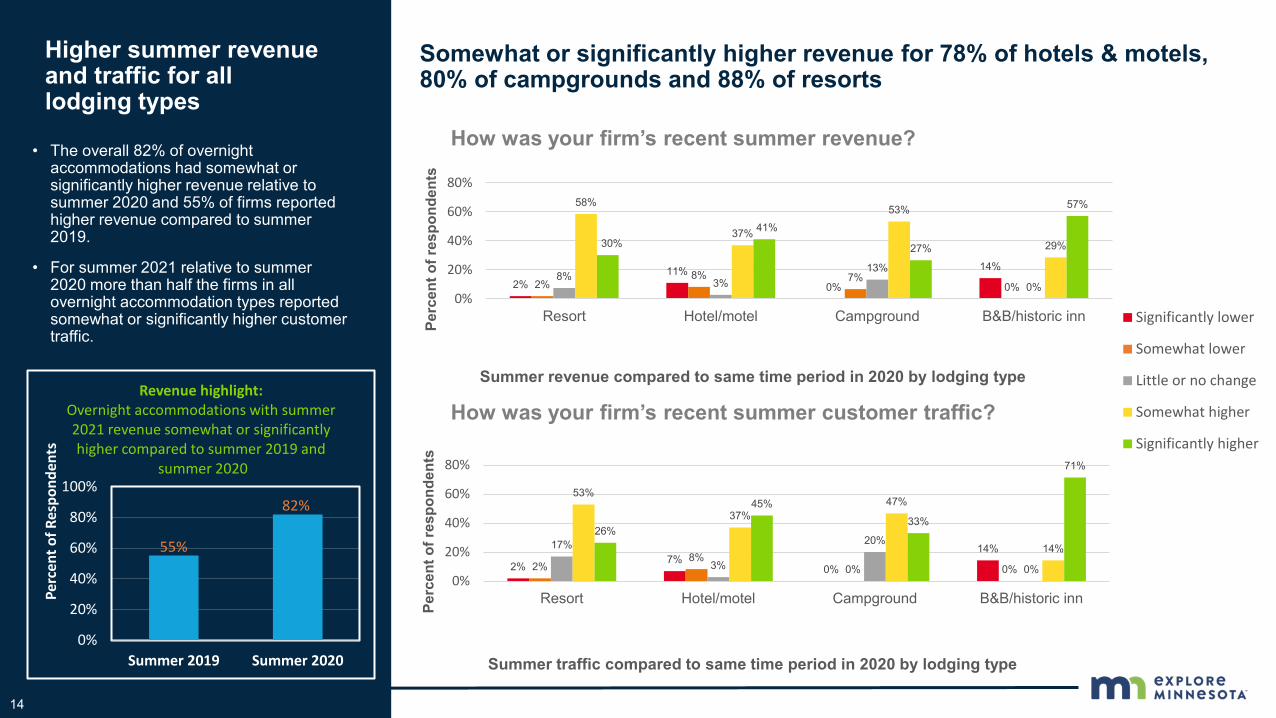
Higher summer revenue and traffic for all lodging types
Somewhat or significantly higher revenue for 78% of hotels & motels, 80% of campgrounds and 88% of resorts
55%
82%
0%
20%
40%
60%
80%
100%
Summer 2019 Summer 2020
Perc
ent o
f Res
pond
ents
Revenue highlight: Overnight accommodations with summer 2021 revenue somewhat or significantly higher compared to summer 2019 and
summer 2020
• The overall 82% of overnight accommodations had somewhat or significantly higher revenue relative to summer 2020 and 55% of firms reported higher revenue compared to summer 2019.
• For summer 2021 relative to summer 2020 more than half the firms in all overnight accommodation types reported somewhat or significantly higher customer traffic.
14
12% 9%
25%
7%
27% 25%
14%9% 13%
37%
55%
13%
31%
0%
25%
0%
20%
40%
60%
Restaurant Brewery, taproom, winery ordistillery
Bar/clubPerc
ent o
f res
pond
ents
Summer revenue compared to same time period in 2020 by food & drink business type
How was your firm’s recent summer revenue?Significantly lower
Somewhat lower
Little or no change
Somewhat higher
Significantly higher
How was your firm’s recent summer customer traffic?
8% 9% 13%8%
27%
50%
14%9%
0%
41%45%
0%
29%
9%
38%
0%
20%
40%
60%
Restaurant Brewery, taproom, winery ordistillery
Bar/clubPerc
ent o
f res
pond
ents
Summer traffic compared to same time period in 2020 by food & drink business type
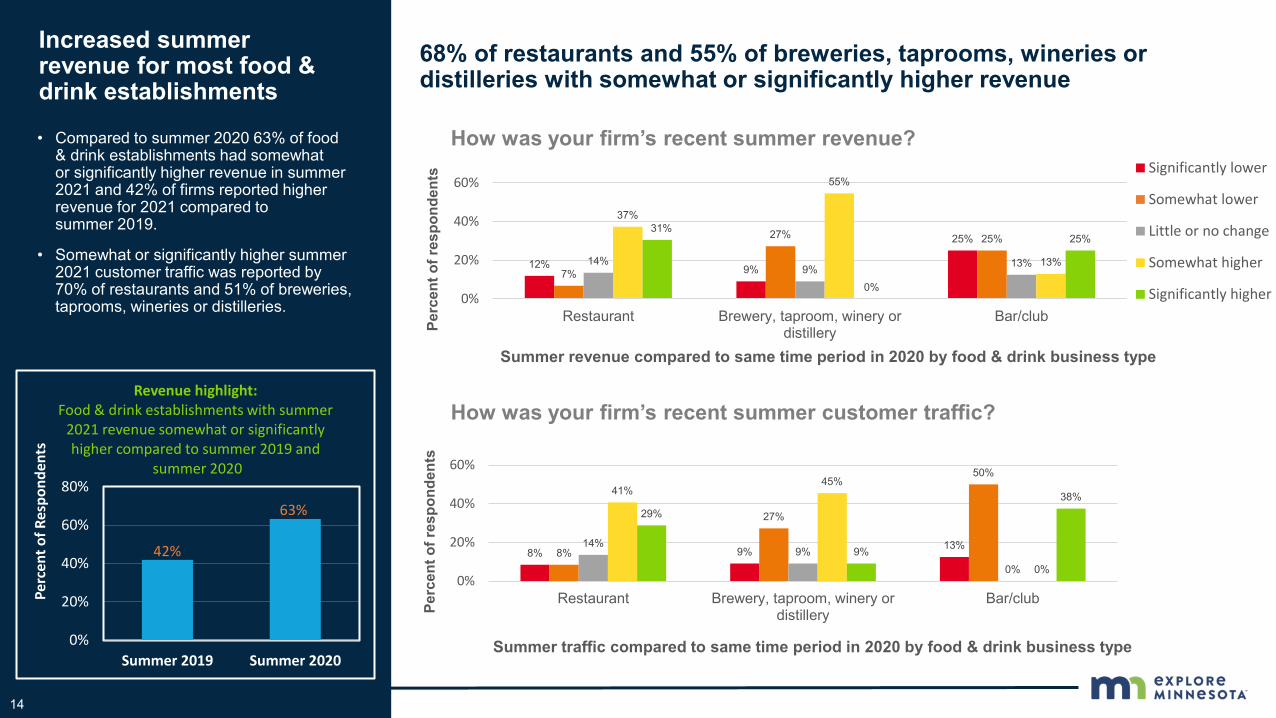
Increased summer revenue for most food & drink establishments
68% of restaurants and 55% of breweries, taprooms, wineries or distilleries with somewhat or significantly higher revenue
42%
63%
0%
20%
40%
60%
80%
Summer 2019 Summer 2020
Perc
ent o
f Res
pond
ents
Revenue highlight: Food & drink establishments with summer
2021 revenue somewhat or significantly higher compared to summer 2019 and
summer 2020
• Compared to summer 2020 63% of food & drink establishments had somewhat or significantly higher revenue in summer 2021 and 42% of firms reported higher revenue for 2021 compared to summer 2019.
• Somewhat or significantly higher summer 2021 customer traffic was reported by 70% of restaurants and 51% of breweries, taprooms, wineries or distilleries.
14
7%0% 0%
33%
7%0%
20% 22%20%
44%
20%11%
27%33%
0%11%
40%
22%
60%
22%
0%
20%
40%
60%
80%
Museum/gallery Outdooractivites/rentals
Tours/excursions Theater/performancePerc
ent o
f res
pond
ents
Summer revenue compared to same time period in 2020 by attraction business type
How was your firm’s recent summer revenue?Significantly lower
Somewhat lower
Little or no change
Somewhat higher
Significantly higher
How was your firm’s recent summer customer traffic?
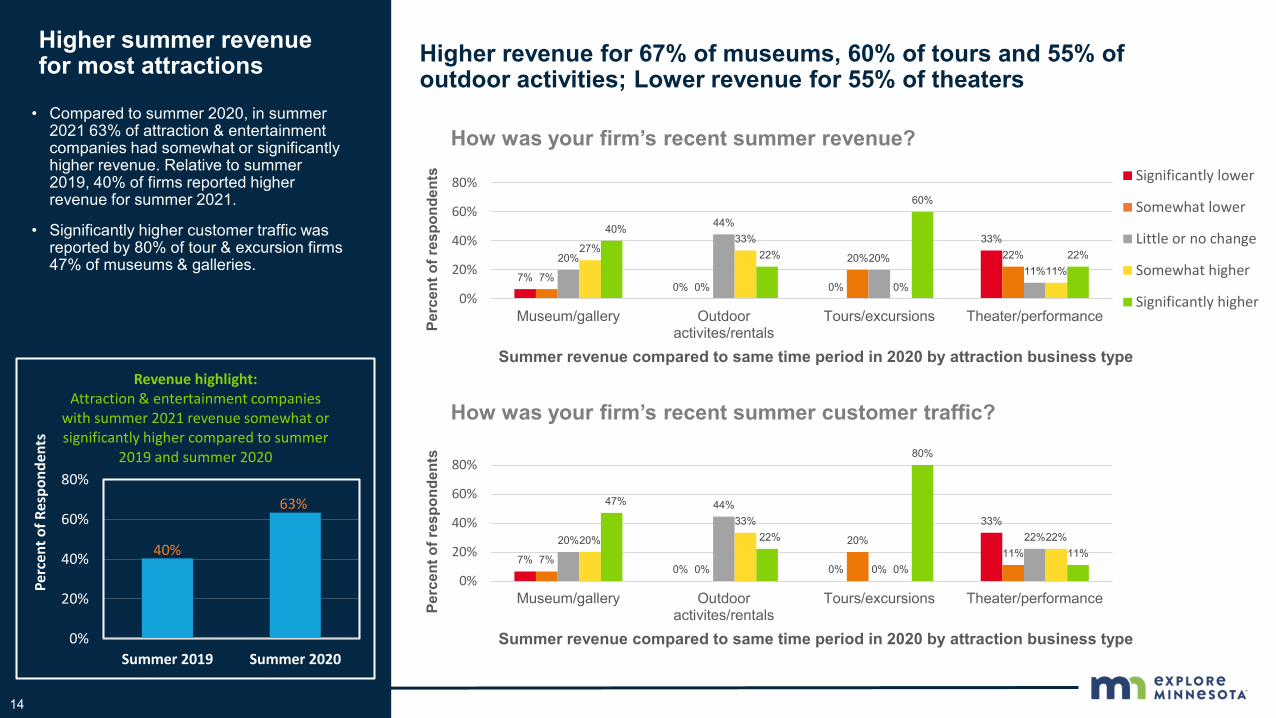
Higher summer revenue for most attractions Higher revenue for 67% of museums, 60% of tours and 55% of
outdoor activities; Lower revenue for 55% of theaters
40%
63%
0%
20%
40%
60%
80%
Summer 2019 Summer 2020
Perc
ent o
f Res
pond
ents
Revenue highlight: Attraction & entertainment companies
with summer 2021 revenue somewhat or significantly higher compared to summer
2019 and summer 2020
• Compared to summer 2020, in summer 2021 63% of attraction & entertainment companies had somewhat or significantly higher revenue. Relative to summer 2019, 40% of firms reported higher revenue for summer 2021.
• Significantly higher customer traffic was reported by 80% of tour & excursion firms 47% of museums & galleries.
7%0% 0%
33%
7%0%
20%11%
20%
44%
0%
22%20%
33%
0%
22%
47%
22%
80%
11%
0%
20%
40%
60%
80%
Museum/gallery Outdooractivites/rentals
Tours/excursions Theater/performancePerc
ent o
f res
pond
ents
Summer revenue compared to same time period in 2020 by attraction business type
Main point
• Compared to in the Spring 2021 survey 12% more firms reported a whole sales price increase of more than 3% bring the total number of firms meeting this condition to 68%. At the same time, only 37% of firms are increasing retails prices more than 3%.
• Dropping or little changed wholesale prices were reported by almost 13% of firms and 37% reported that their retail prices have dropped or changed little.
14
50%
24% 23%21%
30%
26%23% 24%
13%
42% 42%
34%
7% 8%
12%
21%
0%
20%
40%
60%
Allied & otherbusinesses
Attraction/entertainmentcompany
Food/drinkestablishment
Overnightaccommodation
Perc
ent o
f res
pond
ents
Customer demand relative to supply capacity by business sector
Tell us about customer demand in relation to your firm’s operation capacity.
Well below supply Somewhat below supply At or near supply Well above supply
Central MinnesotaModerate summer customer demand
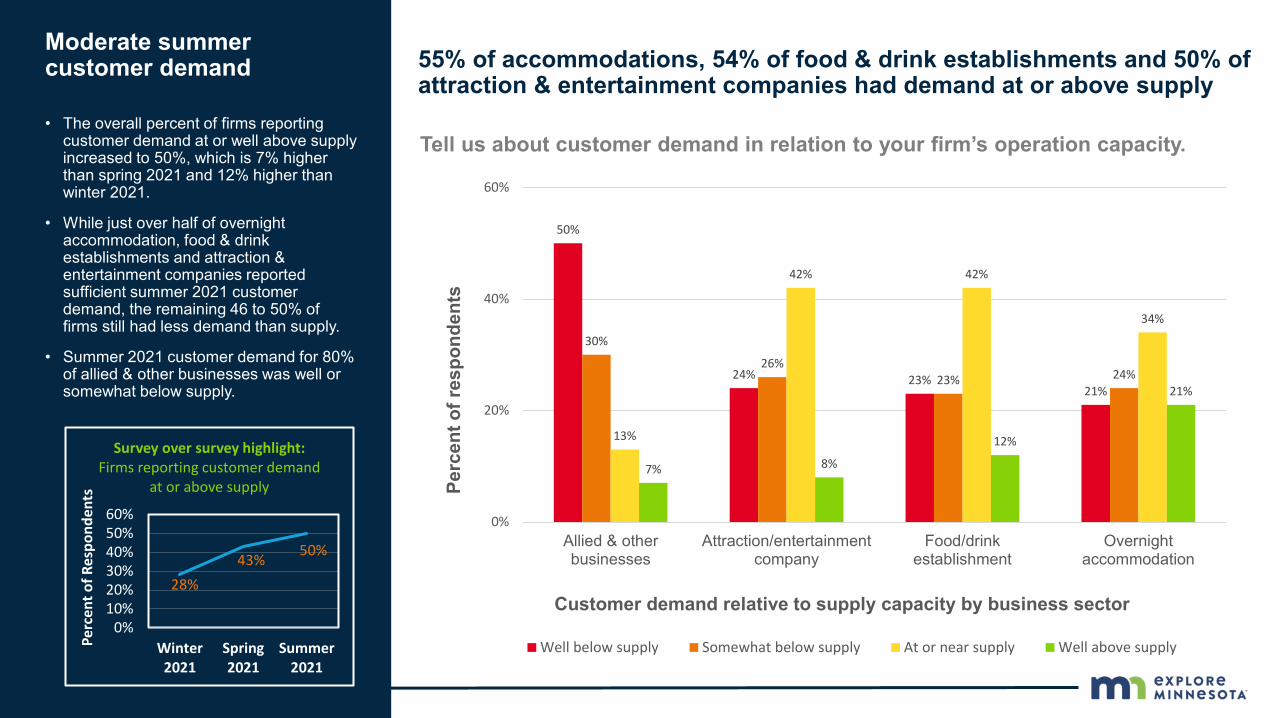
• The overall percent of firms reporting customer demand at or well above supply increased to 50%, which is 7% higher than spring 2021 and 12% higher than winter 2021.
• While just over half of overnight accommodation, food & drink establishments and attraction & entertainment companies reported sufficient summer 2021 customer demand, the remaining 46 to 50% of firms still had less demand than supply.
• Summer 2021 customer demand for 80% of allied & other businesses was well or somewhat below supply.
55% of accommodations, 54% of food & drink establishments and 50% of attraction & entertainment companies had demand at or above supply
28%43% 50%
0%10%20%30%40%50%60%
Winter2021
Spring2021
Summer2021
Perc
ent o
f Res
pond
ents
Survey over survey highlight: Firms reporting customer demand
at or above supply
Main point
• Compared to in the Spring 2021 survey 12% more firms reported a whole sales price increase of more than 3% bring the total number of firms meeting this condition to 68%. At the same time, only 37% of firms are increasing retails prices more than 3%.
• Dropping or little changed wholesale prices were reported by almost 13% of firms and 37% reported that their retail prices have dropped or changed little.
14
14%
36%
14% 14%
29%
16%
24%
17%19%
36%
43%
31%
43%
57%
26%27%
9%
26%
10% 9%
0%
10%
20%
30%
40%
50%
60%
Central Minnesota Metro NortheastMinnesota
NorthwestMinnesota
SouthernMinnesota
Perc
ent o
f res
pond
ents
Customer demand relative to supply capacity by region of Minnesota
Tell us about customer demand in relation to your firm’s operation capacity.
Well below supply Somewhat below supply At or near supply Well above supply
Central MinnesotaSummer customer demand varied by Minnesota region
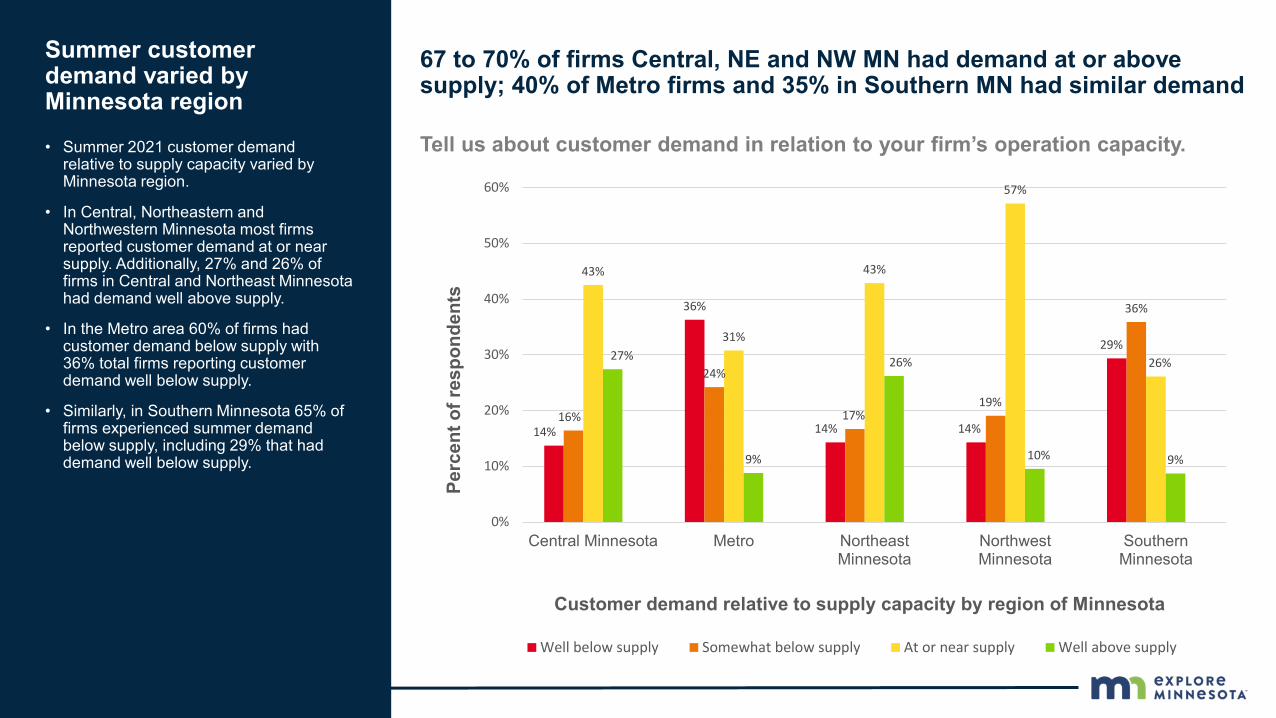
• Summer 2021 customer demand relative to supply capacity varied by Minnesota region.
• In Central, Northeastern and Northwestern Minnesota most firms reported customer demand at or near supply. Additionally, 27% and 26% of firms in Central and Northeast Minnesota had demand well above supply.
• In the Metro area 60% of firms had customer demand below supply with 36% total firms reporting customer demand well below supply.
• Similarly, in Southern Minnesota 65% of firms experienced summer demand below supply, including 29% that had demand well below supply.
67 to 70% of firms Central, NE and NW MN had demand at or above supply; 40% of Metro firms and 35% in Southern MN had similar demand
14
2%
9%
0%
6%
18%
2%
6%4%
0%
14%
5%3%
7%
12%
4%
46%
42% 43%
53%
46%44%
39%
46%
29%
18%
0%
10%
20%
30%
40%
50%
60%
Central Minnesota Metro NortheasternMinnesota
NorthwesternMinnesota
SouthernMinnesota
Perc
ent o
f res
pond
ents
Summer revenue compared to same time period in 2020 by region of Minnesota
How was your recent summer revenue at your overnight accommodation?
Significantly lower Somewhat lower Little or no change Somewhat higher Significantly higher
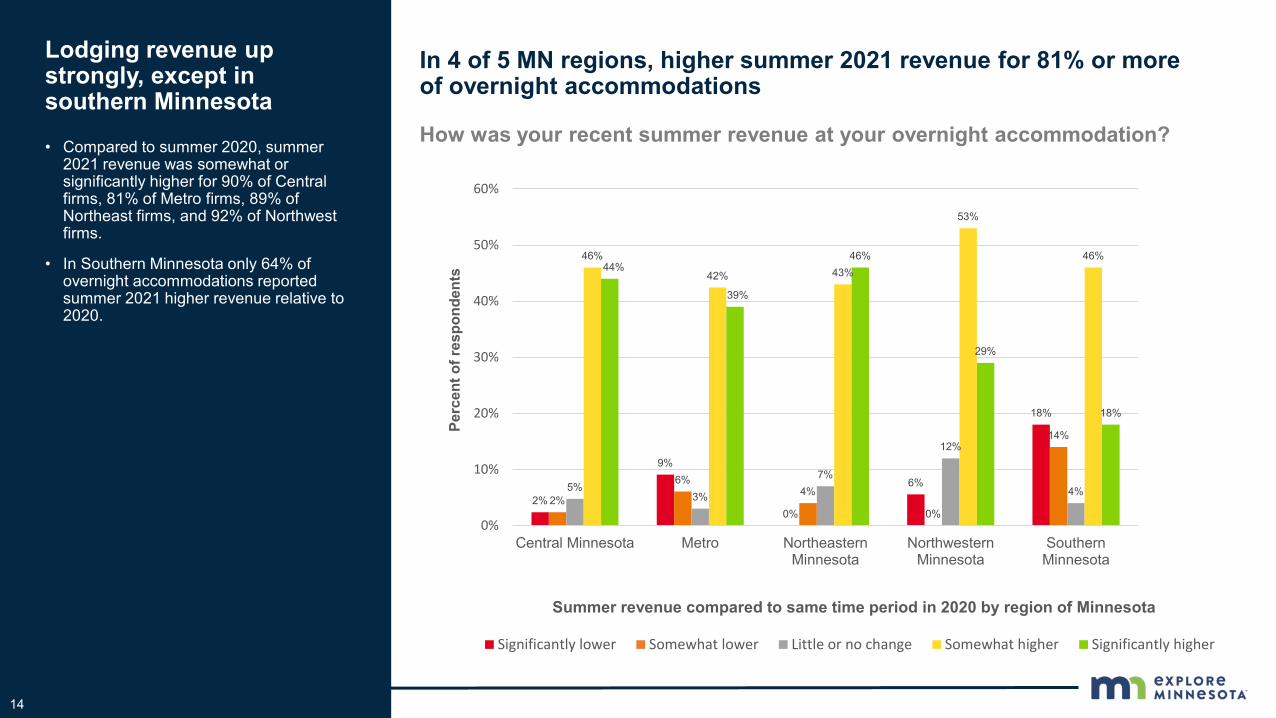
Lodging revenue up strongly, except in southern Minnesota
In 4 of 5 MN regions, higher summer 2021 revenue for 81% or more of overnight accommodations
• Compared to summer 2020, summer 2021 revenue was somewhat or significantly higher for 90% of Central firms, 81% of Metro firms, 89% of Northeast firms, and 92% of Northwest firms.
• In Southern Minnesota only 64% of overnight accommodations reported summer 2021 higher revenue relative to 2020.
14
7% 6%
0% 0%
29%
13%
9%
0%
33%
13%
20%
12%
0% 0%
13%
27%
45%
67%
33%
29%
33%
27%
33% 33%
17%
0%
10%
20%
30%
40%
50%
60%
70%
Central Minnesota Metro NortheasternMinnesota
NorthwesternMinnesota
SouthernMinnesota
Perc
ent o
f res
pond
ents
Summer revenue compared to same time period in 2020 by region of Minnesota
How was your recent summer revenue at your food & drink establishment?
Significantly lower Somewhat lower Little or no change Somewhat higher Significantly higher
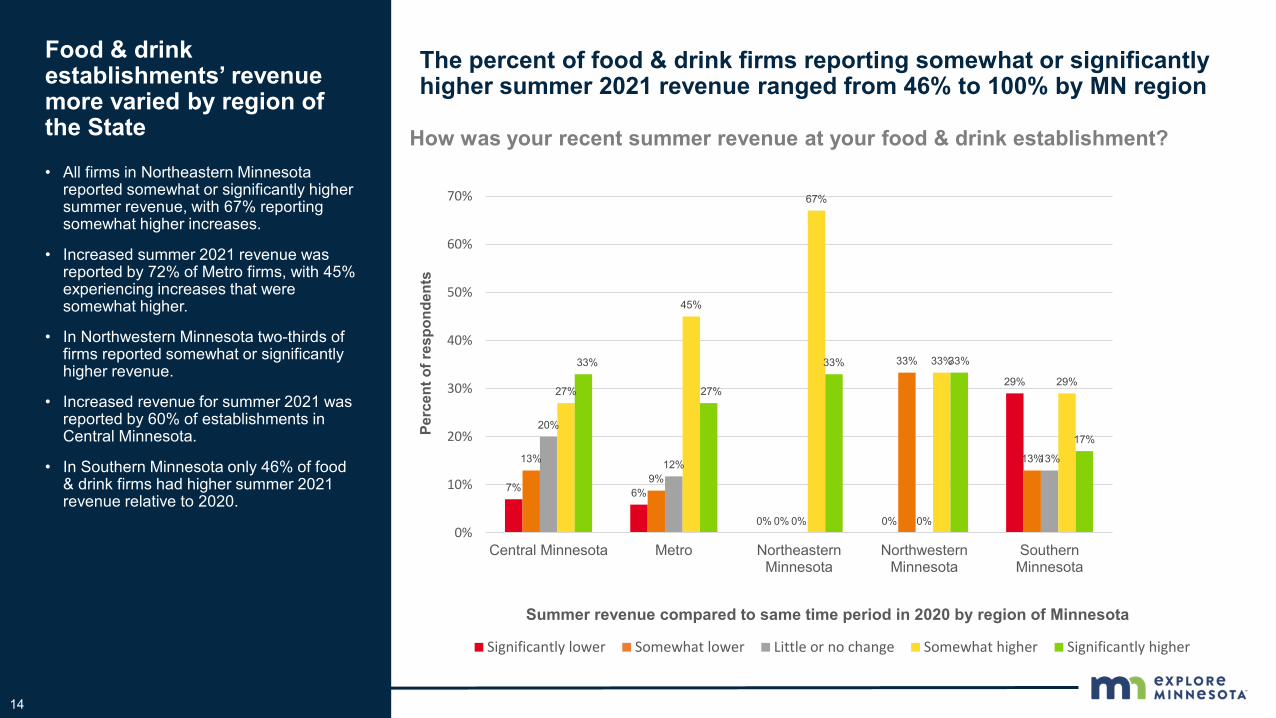
Food & drink establishments’ revenue more varied by region of the State
The percent of food & drink firms reporting somewhat or significantly higher summer 2021 revenue ranged from 46% to 100% by MN region
• All firms in Northeastern Minnesota reported somewhat or significantly higher summer revenue, with 67% reporting somewhat higher increases.
• Increased summer 2021 revenue was reported by 72% of Metro firms, with 45% experiencing increases that were somewhat higher.
• In Northwestern Minnesota two-thirds of firms reported somewhat or significantly higher revenue.
• Increased revenue for summer 2021 was reported by 60% of establishments in Central Minnesota.
• In Southern Minnesota only 46% of food & drink firms had higher summer 2021 revenue relative to 2020.
14
5% 8% 8% 7%11% 10%
16%
27%25% 23% 20%
33%
47% 46%
31%
23%
12% 13%
26%
10%
0%
10%
20%
30%
40%
50%
Overnightaccommodation
Food/drinkestablishment
Attraction/entertainmentcompany
Allied & otherbusinessesPe
rcen
t of r
espo
nden
ts
Fall revenue expectation compared to same time period in 2020 by business sector
What is your firm’s fall revenue expectation?
Significantly lower
Somewhat lower
Little or no change
Somewhat higher
Significantly higher
What is your firm’s fall customer traffic expectation?
5%9% 8%
3%9%
13%8%
27%26% 23%28%
23%
47%41%
28%
37%
13% 14%
28%
10%
0%
10%
20%
30%
40%
50%
Overnightaccommodation
Food/drinkestablishment
Attraction/entertainmentcompany
Allied & otherbusinessesPe
rcen
t of r
espo
nden
ts
Fall traffic expectation compared to same time period in 2020 by business sector
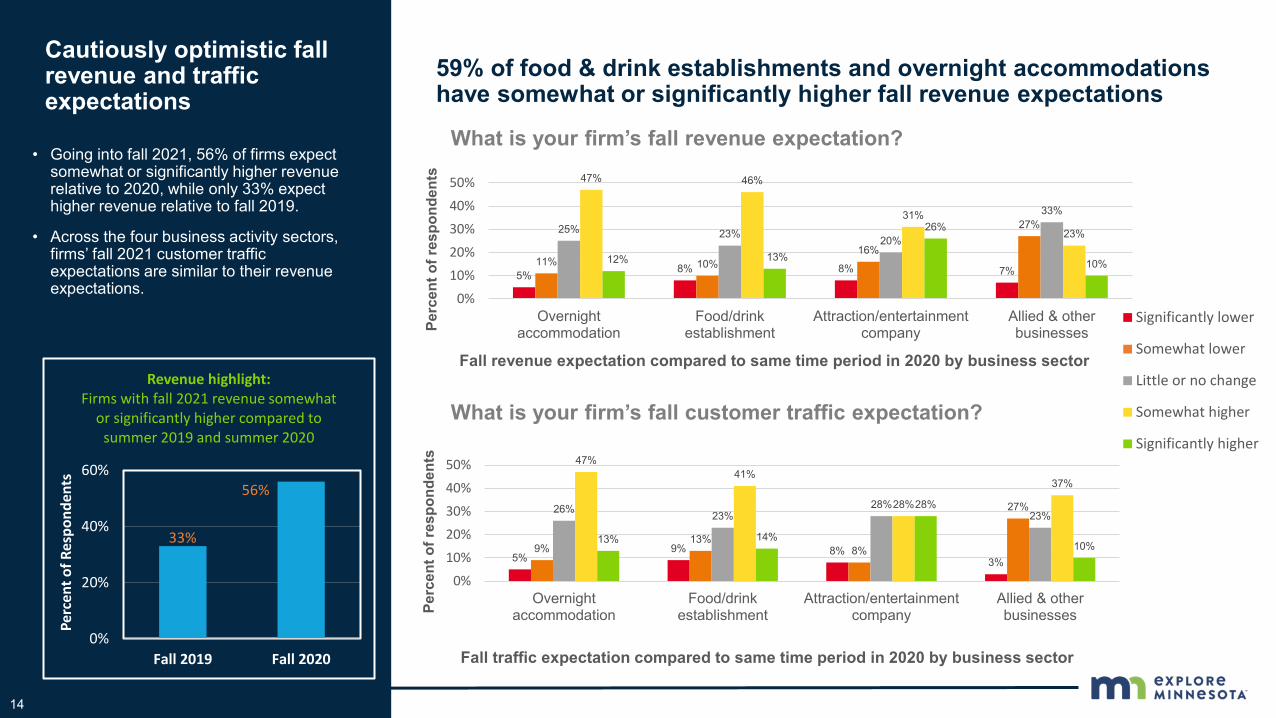
Cautiously optimistic fall revenue and traffic expectations
59% of food & drink establishments and overnight accommodations have somewhat or significantly higher fall revenue expectations
33%
56%
0%
20%
40%
60%
Fall 2019 Fall 2020
Perc
ent o
f Res
pond
ents
Revenue highlight: Firms with fall 2021 revenue somewhat
or significantly higher compared to summer 2019 and summer 2020
• Going into fall 2021, 56% of firms expect somewhat or significantly higher revenue relative to 2020, while only 33% expect higher revenue relative to fall 2019.
• Across the four business activity sectors, firms’ fall 2021 customer traffic expectations are similar to their revenue expectations.
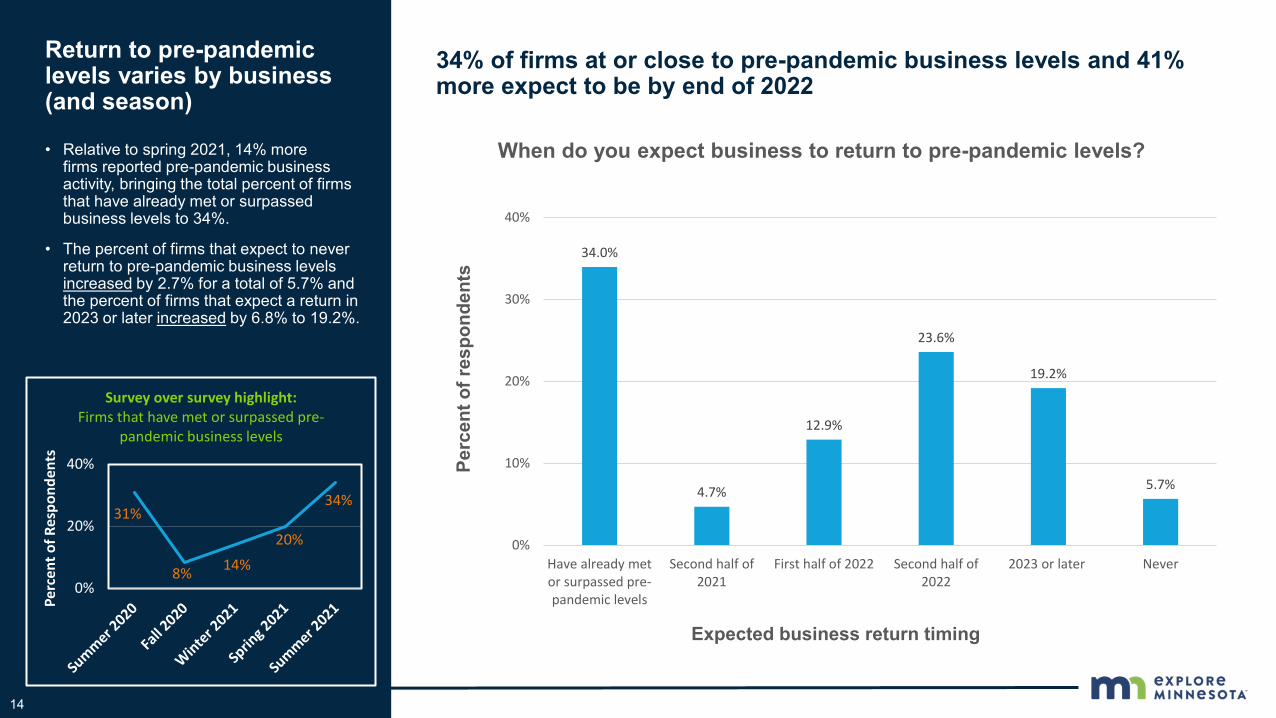
34% of firms at or close to pre-pandemic business levels and 41% more expect to be by end of 2022
Return to pre-pandemic levels varies by business (and season)
• Relative to spring 2021, 14% more firms reported pre-pandemic business activity, bringing the total percent of firms that have already met or surpassed business levels to 34%.
• The percent of firms that expect to never return to pre-pandemic business levels increased by 2.7% for a total of 5.7% and the percent of firms that expect a return in 2023 or later increased by 6.8% to 19.2%.
14
34.0%
4.7%
12.9%
23.6%
19.2%
5.7%
0%
10%
20%
30%
40%
Have already metor surpassed pre-pandemic levels
Second half of2021
First half of 2022 Second half of2022
2023 or later Never
Perc
ent o
f res
pond
ents
Expected business return timing
When do you expect business to return to pre-pandemic levels?
31%
8% 14%
20%
34%
0%
20%
40%
Perc
ent o
f Res
pond
ents
Survey over survey highlight: Firms that have met or surpassed pre-
pandemic business levels
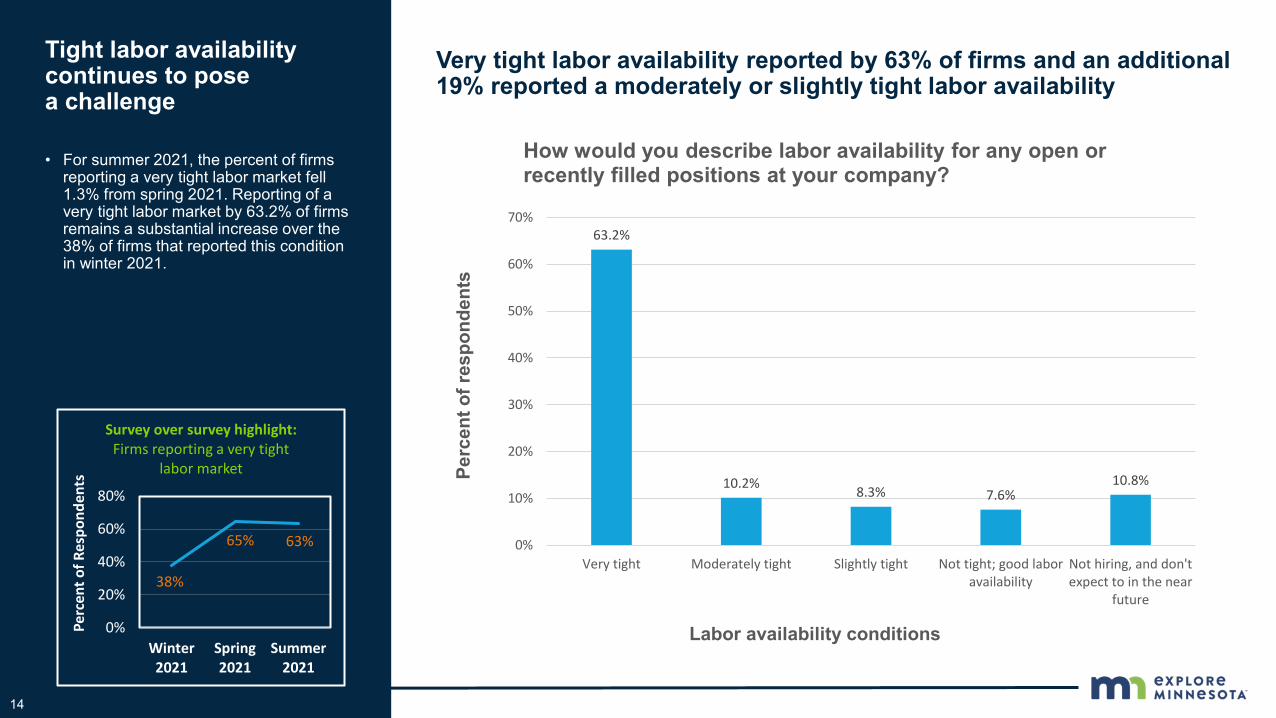
Very tight labor availability reported by 63% of firms and an additional 19% reported a moderately or slightly tight labor availability
Tight labor availability continues to pose a challenge
• For summer 2021, the percent of firms reporting a very tight labor market fell 1.3% from spring 2021. Reporting of a very tight labor market by 63.2% of firms remains a substantial increase over the 38% of firms that reported this condition in winter 2021.
14
63.2%
10.2% 8.3% 7.6%10.8%
0%
10%
20%
30%
40%
50%
60%
70%
Very tight Moderately tight Slightly tight Not tight; good laboravailability
Not hiring, and don'texpect to in the near
future
Perc
ent o
f res
pond
ents
Labor availability conditions
How would you describe labor availability for any open or recently filled positions at your company?
38%
65% 63%
0%
20%
40%
60%
80%
Winter2021
Spring2021
Summer2021
Perc
ent o
f Res
pond
ents
Survey over survey highlight: Firms reporting a very tight
labor market
Survey comments & conclusions
18
The summer 2021 survey revealed that while tourism and hospitality business conditions are improving, pandemic response and recovery varies by business type and region of Minnesota. Written survey comments provided a mixed outlook, and many shared recent frustrations and concerns about the future.
In survey comments the following themes emerged:
• Business is different than it was in 2019 - Changes reported include greatly diminished business traffic, inconsistent week versus weekend activity, more revenue per transaction and more on-line and take-out orders.
• Outdoor leisure and wedding activity are significantly up - Some businesses are experiencing very high customer demand.
• Firms that cater to business travel and groups are struggling - For some firms it is difficult to know what to expect in the coming years, and owners are not sure if their business will fully recover.
• Seasonality significantly impacts many business - Drought and forest fires hurt some businesses more than others, and seasonal traffic patterns also impact business’s view of recent summer and upcoming fall activity.
• The Delta variant is impacting business activity - Some reservations have been cancelled, and generally people are not reserving as far in advance and prefer to stay closer to home. While there is moderate optimism for fall, many firms remain cautious and fear COVID-related operating restrictions.
• Labor availability is a significant challenge - A low supply of reliable workers is sometimes compounded by unrealistic customer expectations. Increasing wholesale prices and supply shortages are also problematic.
A reoccurring message emerged that until the spread of COVID is significantly slowed or stopped, Minnesota’s hospitality and tourism industry will not return to pre-pandemic levels. Furthermore, even if the industry is able to regain 2019 activity, many believe travel will likely look different for the foreseeable future.
THANK YOU
Additional survey topics Explore Minnesota partners with the Federal Reserve Bank of Minneapolis and Hospitality Minnesota to conduct the quarterly Minnesota tourism business conditions survey.
Quarterly surveys are conducted jointly, and results are analyzed and reported separately. Please refer to their reports for analysis of responses to survey questions about debt, wages, prices and business solvency.
18
Appendix 1: Survey respondent dataThis report contains findings from the summer 2021 Minnesota tourism and hospitality industry business conditions survey. This survey was conducted August 17-24, 2021 and received 324 responses.
This appendix provides an overview of the total 324 summer 2021 survey respondents by region of Minnesota and business activity sector and type.
18
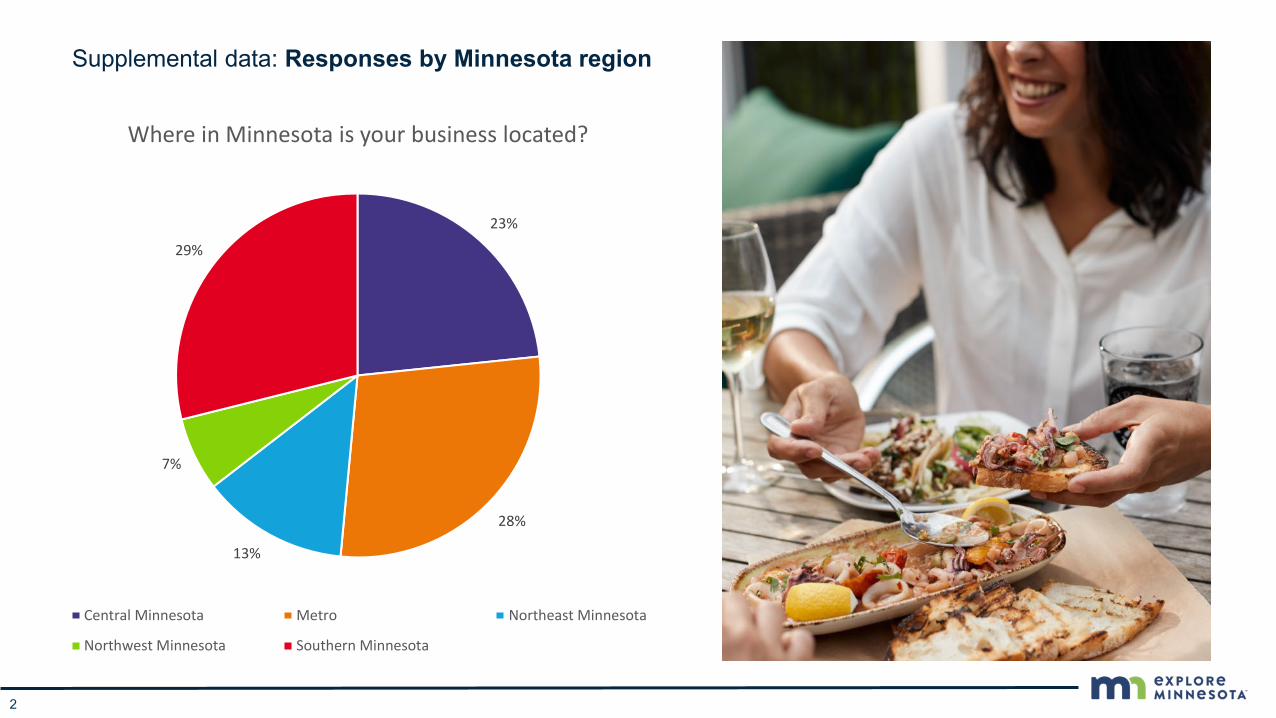
Supplemental data: Responses by Minnesota region
2
23%
28%
13%
7%
29%
Where in Minnesota is your business located?
Central Minnesota Metro Northeast Minnesota
Northwest Minnesota Southern Minnesota
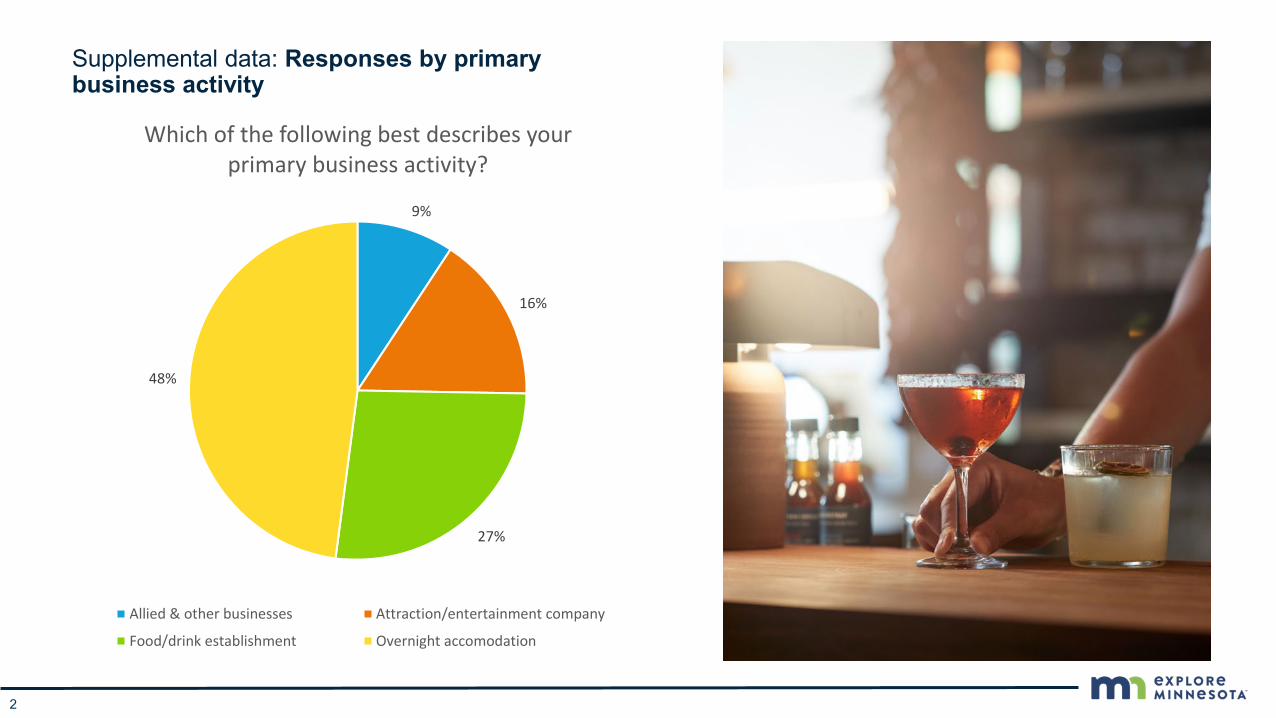
Supplemental data: Responses by primary business activity
2
9%
16%
27%
48%
Which of the following best describes your primary business activity?
Allied & other businesses Attraction/entertainment company
Food/drink establishment Overnight accomodation
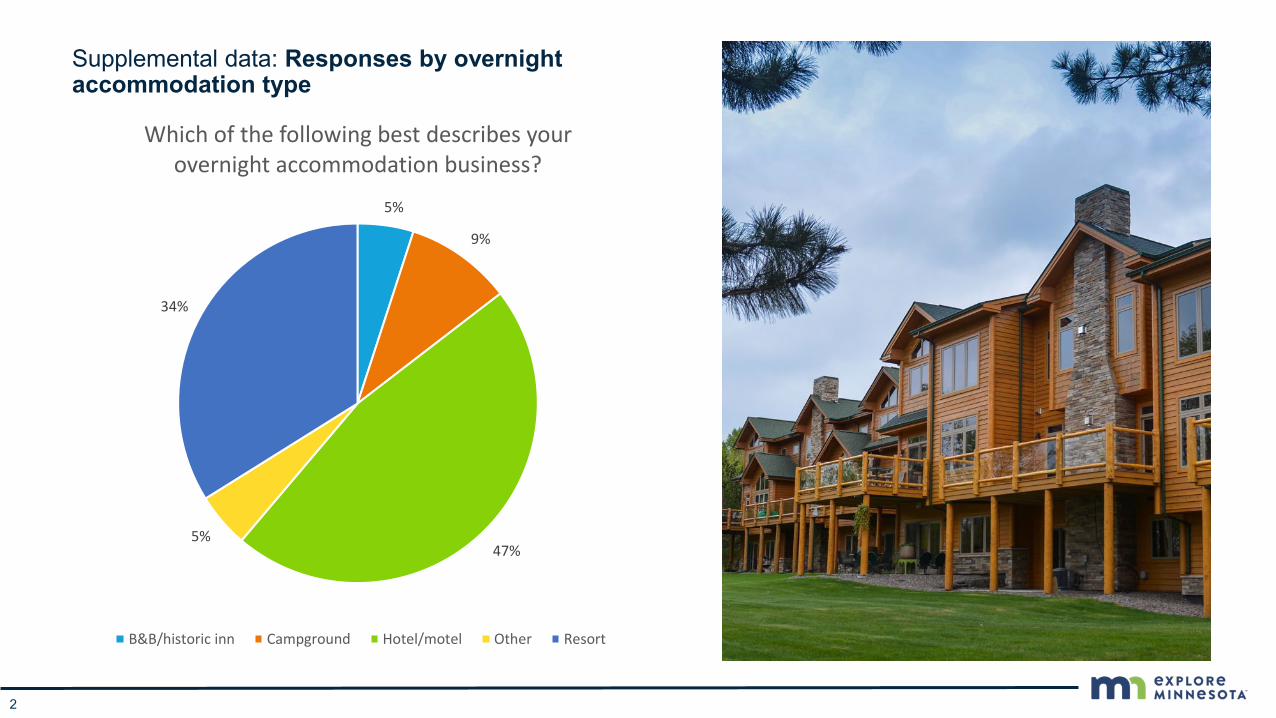
Supplemental data: Responses by overnight accommodation type
2
5%
9%
47%5%
34%
Which of the following best describes your overnight accommodation business?
B&B/historic inn Campground Hotel/motel Other Resort
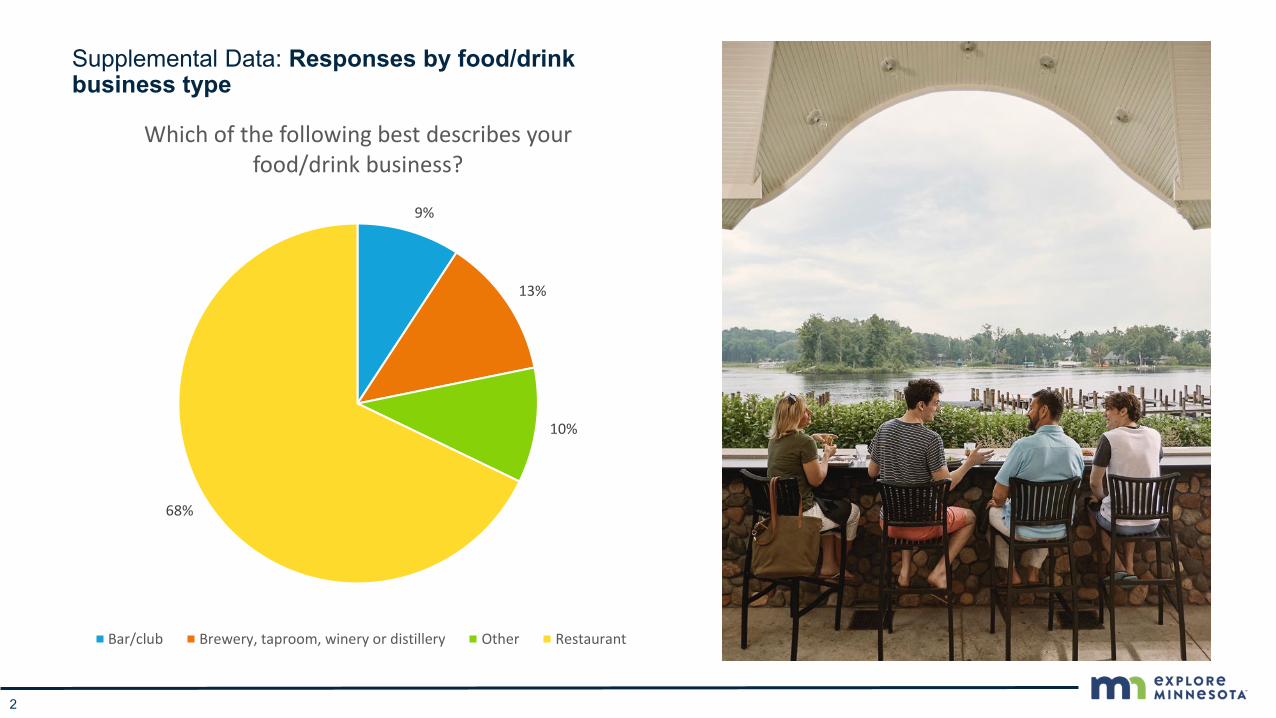
Supplemental Data: Responses by food/drink business type
2
9%
13%
10%
68%
Which of the following best describes your food/drink business?
Bar/club Brewery, taproom, winery or distillery Other Restaurant
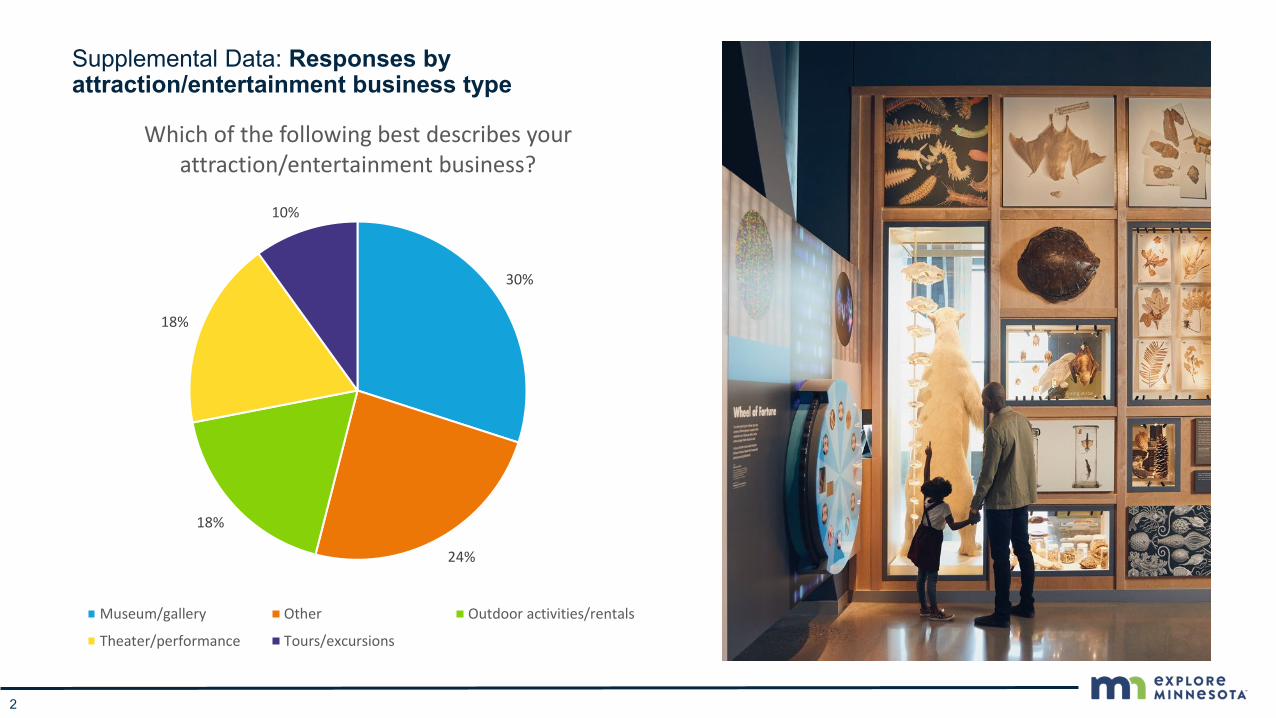
Supplemental Data: Responses by attraction/entertainment business type
2
30%
24%
18%
18%
10%
Which of the following best describes your attraction/entertainment business?
Museum/gallery Other Outdoor activities/rentals
Theater/performance Tours/excursions