Substructure Tutorial - AASHTOWare Bridge Design … - Frame Pier.pdf · Pier 3 – Frame Pier...
124
AASHTOWare BrD 6.8 Substructure Tutorial Pier 3 – Frame Pier Example
-
Upload
duongthuan -
Category
Documents
-
view
245 -
download
8
Transcript of Substructure Tutorial - AASHTOWare Bridge Design … - Frame Pier.pdf · Pier 3 – Frame Pier...

AASHTOWare BrD 6.8
Substructure Tutorial Pier 3 – Frame Pier Example
Pier 3 – Frame Pier Example
Last Modified: 8/3/2016 1
Sta 0+00.00
Ahead Sta
CL Brgs CL Brgs
Sta 2+60.00
BL SR 456
CL Pier
Sta 1+30.00
(Pier Ref. Point)
Bridge Layout
CL Brgs
Exp Exp
CL Brgs
Abut 1
CL Brgs
Abut 2
CL Pier 1
Span Arrangement
Fix
CL Brgs
Pier 1
130'-0" 130'-0"
260'-0"

Pier 3 – Frame Pier Example
Last Modified: 8/3/2016 2
51'-0"
18'-9"
5'-3"
17'-7"
3'-9"
9'-0"
EL 76.00
EL 50.00
Groundline EL 54.50
Pier Elevation
Looking Sta Ahead
3'-0"
1'-8"
6'-9"
CL Column1 CL Column2 CL Column3
18'-9" 6'-9"
5'-3"
3'-0" Dia. Column
(Typ)
25'-9"
Superstructure Definition
Reference Line
3'-3" 3'-3"9'-0" 9'-0" 9'-0" 9'-0"
51'-6"
BL SR 456
9'-0"
(Typ)
3'-4"
17'-7"
12'-0"
3'-0"
Pier Side View
3'-0"
1'-8"

Pier 3 – Frame Pier Example
Last Modified: 8/3/2016 3
2'-6"1'-6"
Cap Plan View
3'-4"
3'-0" 5 @ 9'-0" = 45'-0" 3'-0"
Sta
Ahead
BL SR 456CL Pier
Sta 1+30.83
(Pier Ref Point)
G1 G2 G3 G4 G5
CL PierPier Long Axis
Pier Trans Axis
G6
CL Brgs
25'-6"
Pier 3 – Frame Pier Example
Last Modified: 8/3/2016 4
Pier 3 – Frame Pier Example
Last Modified: 8/3/2016 5
Section A-A
2" clr
(Typ)#5 Stirrups
2 rows of 5 - #9 bars
2 rows of 6 - #10 bars1 ½" clr
(Typ)
Section B-B
8 - #10 bars
2" clr
(Typ)

Pier 3 – Frame Pier Example
Last Modified: 8/3/2016 6
BrD Substructure Training
Pier 3 – Frame Pier Example – Topic 1
This topic is the first of four in a series describing the entry and analysis of a reinforced concrete multi-column
frame pier in BrD Substructure. In this example, a two span continuous steel superstructure is supported by a 3
column frame pier.
Example features:
Reinforced concrete, three column frame pier, spread footings
Pier skew – 0 degrees
Specification checking of reinforcement
Items covered in this series:
Topic 1:
BrD Substructure Capabilities
Locating Substructure Units
Topic 2:
Bridge Data Related to Piers
Pier Alternatives
Pier Geometry
Pier Reinforcement
Pier 3D Schematic
Validating a Pier Alternative
Topic 3:
Superstructure Loads
Superstructure Environmental Loads
Substructure Loads
Load Calculation Reports
Topic 4:
BrD Substructure Toolbar
Finite Element Model
Pier Analysis
Specification Checks
Footing Analysis
Tabular Results
Viewing Results in 3D Schematic

Pier 3 – Frame Pier Example
Last Modified: 8/3/2016 7
Additional Reports
Note: It is assumed that users are familiar with the BrD Superstructure module and as such this example does not go
into detail describing BrD Superstructure windows or bridge workspace navigation.
Pier 3 – Frame Pier Example
Last Modified: 8/3/2016 8
BrD Substructure Capabilities
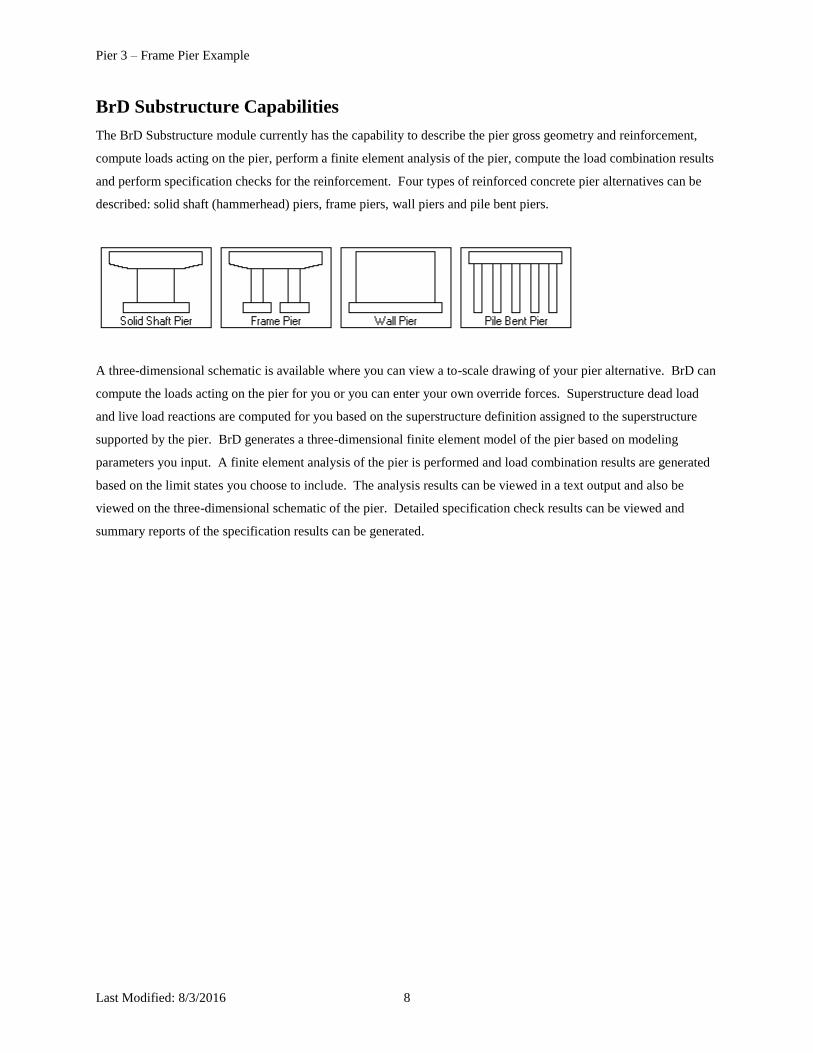
The BrD Substructure module currently has the capability to describe the pier gross geometry and reinforcement,
compute loads acting on the pier, perform a finite element analysis of the pier, compute the load combination results
and perform specification checks for the reinforcement. Four types of reinforced concrete pier alternatives can be
described: solid shaft (hammerhead) piers, frame piers, wall piers and pile bent piers.
A three-dimensional schematic is available where you can view a to-scale drawing of your pier alternative. BrD can
compute the loads acting on the pier for you or you can enter your own override forces. Superstructure dead load
and live load reactions are computed for you based on the superstructure definition assigned to the superstructure
supported by the pier. BrD generates a three-dimensional finite element model of the pier based on modeling
parameters you input. A finite element analysis of the pier is performed and load combination results are generated
based on the limit states you choose to include. The analysis results can be viewed in a text output and also be
viewed on the three-dimensional schematic of the pier. Detailed specification check results can be viewed and
summary reports of the specification results can be generated.
Pier 3 – Frame Pier Example
Last Modified: 8/3/2016 9
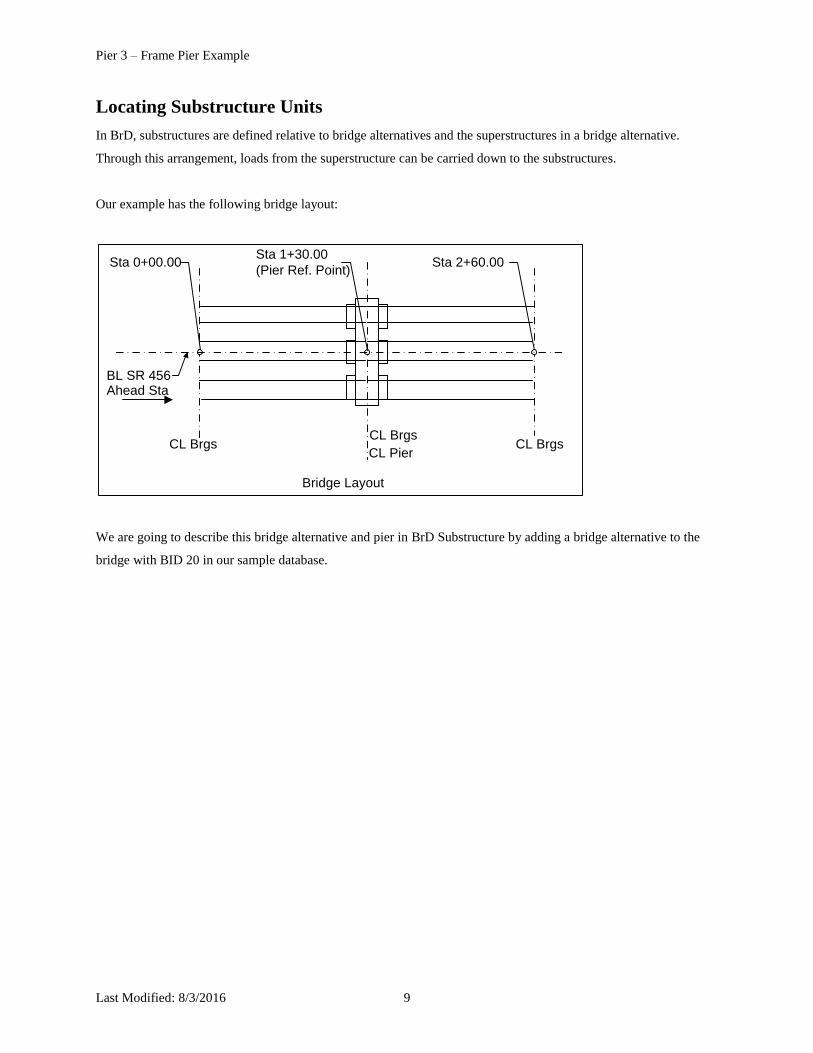
Locating Substructure Units
In BrD, substructures are defined relative to bridge alternatives and the superstructures in a bridge alternative.
Through this arrangement, loads from the superstructure can be carried down to the substructures.
Our example has the following bridge layout:
Sta 0+00.00
Ahead Sta
CL Brgs CL Brgs
Sta 2+60.00
BL SR 456
CL Pier
Sta 1+30.00
(Pier Ref. Point)
Bridge Layout
CL Brgs
We are going to describe this bridge alternative and pier in BrD Substructure by adding a bridge alternative to the
bridge with BID 20 in our sample database.
Pier 3 – Frame Pier Example
Last Modified: 8/3/2016 10
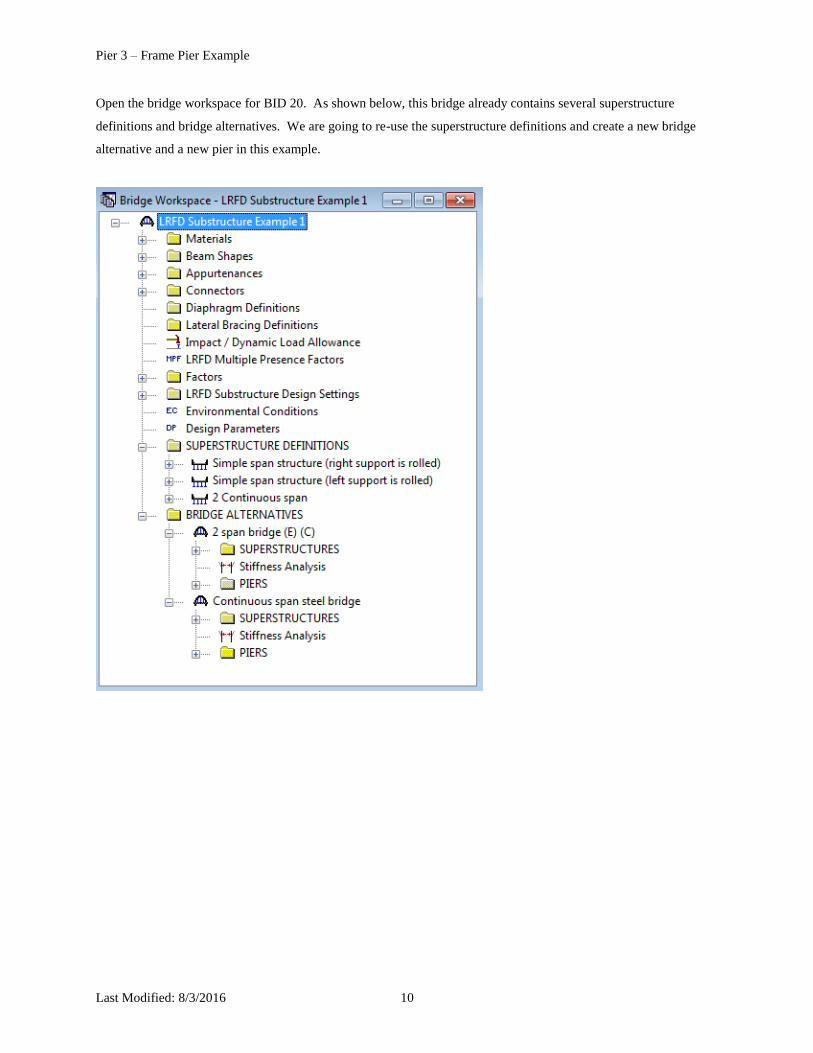
Open the bridge workspace for BID 20. As shown below, this bridge already contains several superstructure
definitions and bridge alternatives. We are going to re-use the superstructure definitions and create a new bridge
alternative and a new pier in this example.

Pier 3 – Frame Pier Example
Last Modified: 8/3/2016 11
Open the Bridge window for this bridge:

Pier 3 – Frame Pier Example
Last Modified: 8/3/2016 12
We do not have to change any data on the Description tab. Switch to the Global Reference Point tab.
This tab contains an “X” and “Y” coordinate field for the bridge global reference point. This data could be used to
describe the state plane coordinates for the bridge. When we view the Pier window later in our example, we will see
that BrD computes the coordinates for the pier based on this bridge global reference point. We are going to leave
the X and Y coordinates as zero in our example. Click Cancel to close the Bridge window.

Pier 3 – Frame Pier Example
Last Modified: 8/3/2016 13
We are going to jump down to the Bridge Alternatives section and create a new bridge alternative. Double click the
“BRIDGE ALTERNATIVES” label and enter the following information.
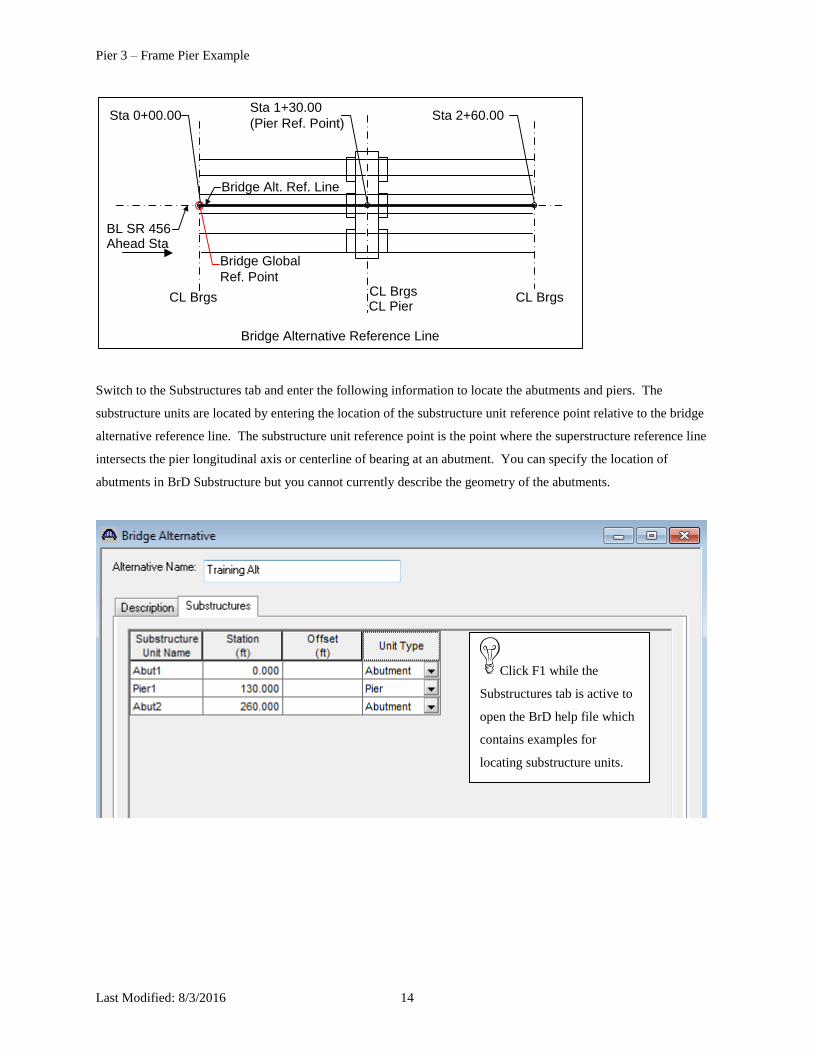
The data on this tab orients the bridge alternative reference line. Our substructure units will be located with respect
to this bridge alternative reference line. Our bridge alternative is 261.67 feet long and the starting station is 0+00.
The default bearing of N 90^ 0’ 0” E is acceptable for our example. The Global Positioning data orients the bridge
alternative reference line with respect to the bridge global reference point. We can leave this data blank in our
example since our bridge alternative is not offset to the bridge global reference point.
Pier 3 – Frame Pier Example
Last Modified: 8/3/2016 14
Sta 0+00.00
Ahead Sta
CL Brgs CL Brgs
Sta 2+60.00
BL SR 456
CL Pier
Sta 1+30.00
(Pier Ref. Point)
Bridge Alternative Reference Line
CL Brgs
Bridge Global
Ref. Point
Bridge Alt. Ref. Line
Switch to the Substructures tab and enter the following information to locate the abutments and piers. The
substructure units are located by entering the location of the substructure unit reference point relative to the bridge
alternative reference line. The substructure unit reference point is the point where the superstructure reference line
intersects the pier longitudinal axis or centerline of bearing at an abutment. You can specify the location of
abutments in BrD Substructure but you cannot currently describe the geometry of the abutments.
Click F1 while the
Substructures tab is active to
open the BrD help file which
contains examples for
locating substructure units.
Pier 3 – Frame Pier Example
Last Modified: 8/3/2016 15
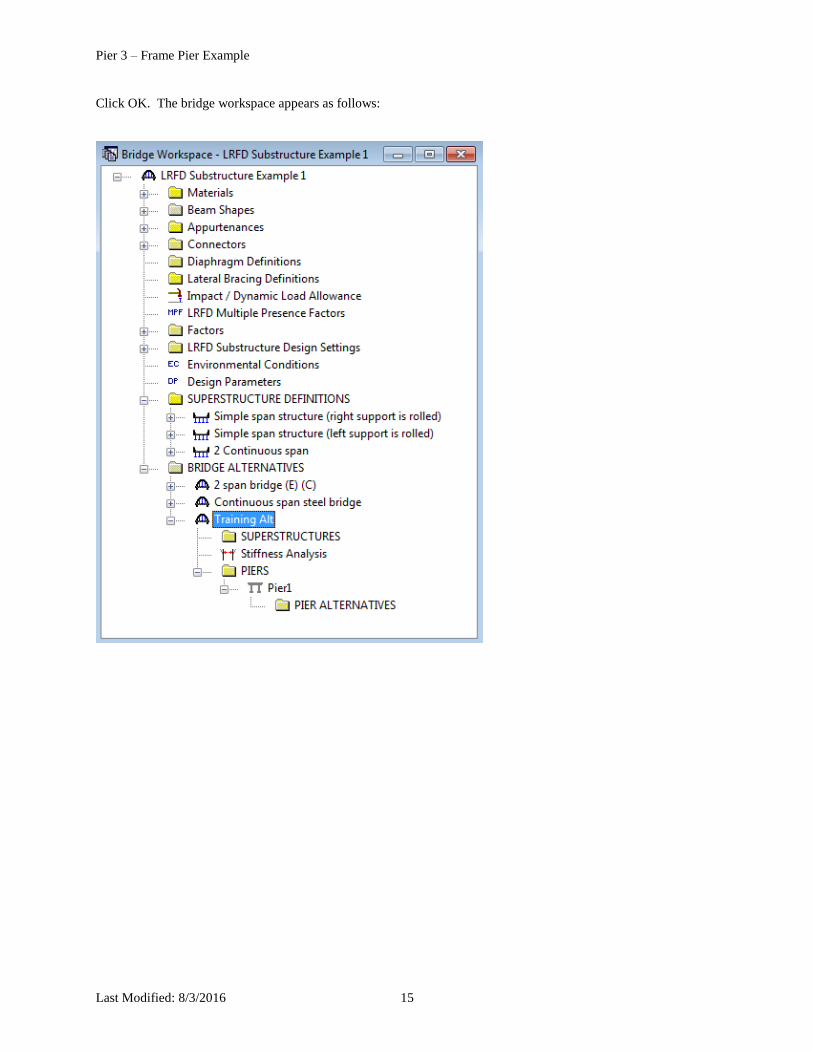
Click OK. The bridge workspace appears as follows:

Pier 3 – Frame Pier Example
Last Modified: 8/3/2016 16
Double click the SUPERSTRUCTURES label to create a new superstructure. Enter the following information to
describe the first superstructure in this bridge alternative.
Our superstructure is located at the start of the bridge alternative reference line so we do not need to enter any data
for the reference line distance or offset. Enter the span length of the superstructure and select the substructure
supports. Click OK to close the window and save the data to memory.
Sta 0+00.00
Ahead Sta
CL Brgs
Abut 1
CL Brgs
Abut 2
Sta 2+60.00
BL SR 456
CL Pier
Sta 1+30.00
(Pier Ref. Point)
Superstructure Layout
CL Brgs
Bridge Global
Ref. Point
Superstructure
Ref. Line
Pier 3 – Frame Pier Example
Last Modified: 8/3/2016 17
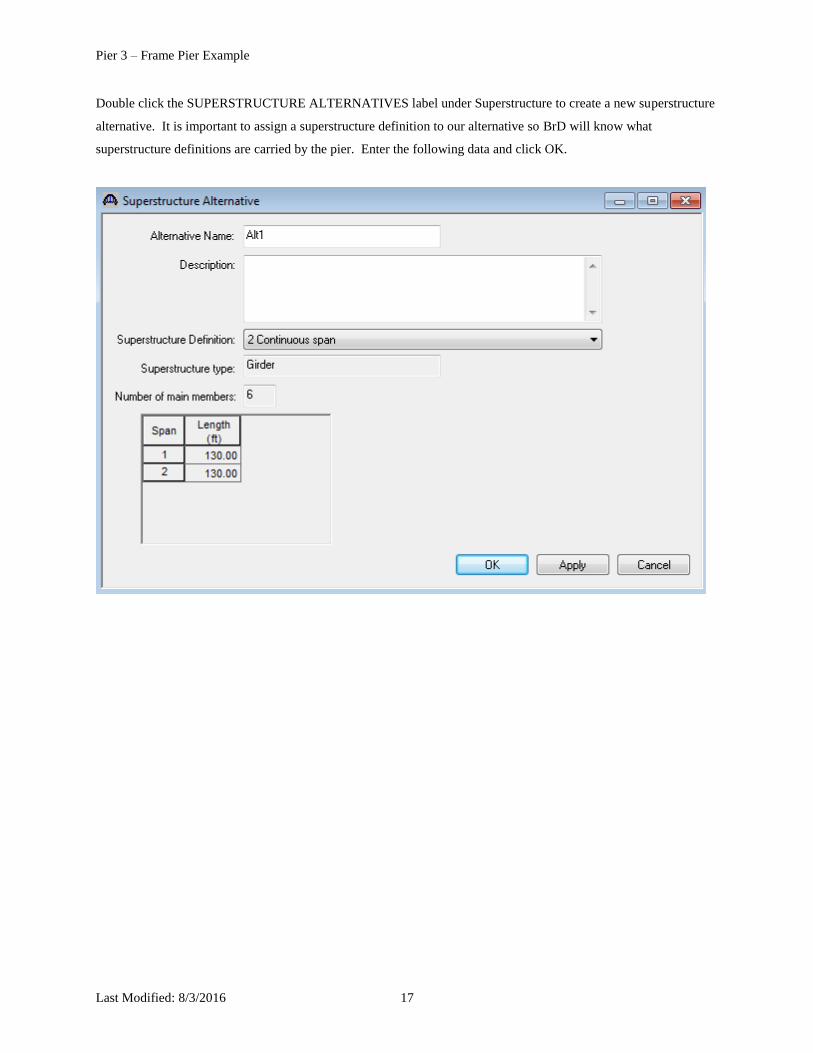
Double click the SUPERSTRUCTURE ALTERNATIVES label under Superstructure to create a new superstructure
alternative. It is important to assign a superstructure definition to our alternative so BrD will know what
superstructure definitions are carried by the pier. Enter the following data and click OK.
Pier 3 – Frame Pier Example
Last Modified: 8/3/2016 18
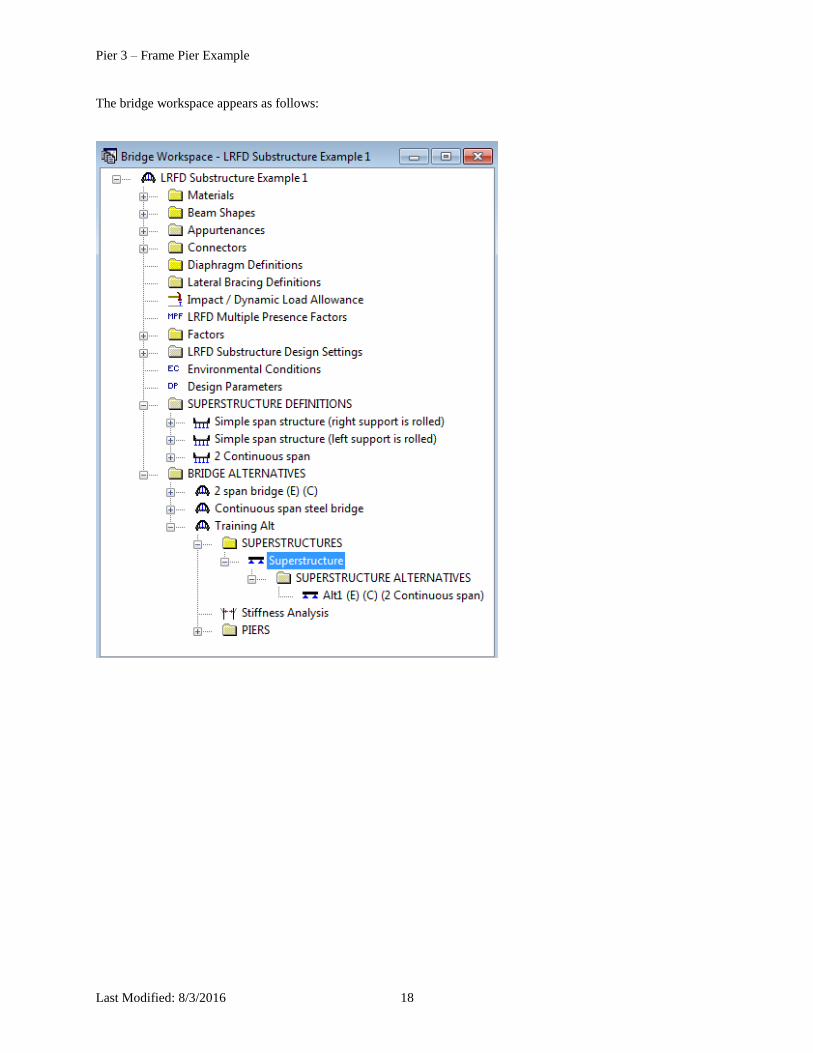
The bridge workspace appears as follows:
Pier 3 – Frame Pier Example
Last Modified: 8/3/2016 19
Pier 3 – Frame Pier Example – Topic 2
This topic is the second of four in a series describing the entry and analysis of a reinforced concrete multi-column
frame pier in BrD Substructure. In this example, a two span continuous steel superstructure is supported by a 3
column frame pier.
Example features:
Reinforced concrete, three column frame pier, spread footings
Pier skew – 0 degrees
Specification checking of reinforcement
Items covered in this series:
Topic 1:
BrD Substructure Capabilities
Locating Substructure Units
Topic 2:
Bridge Data Related to Piers
Pier Alternatives
Pier Geometry
Pier Reinforcement
Pier 3D Schematic
Validating a Pier Alternative
Topic 3:
Superstructure Loads
Superstructure Environmental Loads
Substructure Loads
Load Calculation Reports
Topic 4:
BrD Substructure Toolbar
Finite Element Model
Pier Analysis
Specification Checks
Footing Analysis
Tabular Results
Viewing Results in 3D Schematic
Additional Reports

Pier 3 – Frame Pier Example
Last Modified: 8/3/2016 20
Note: You must complete Topic 1 in the series before you can enter this topic. It is assumed that users are familiar
with the BrD Superstructure module and as such this example does not go into detail describing BrD Superstructure
windows or bridge workspace navigation.

Pier 3 – Frame Pier Example
Last Modified: 8/3/2016 21
Bridge Data Related to Piers
Our bridge already contains the following materials. We are going to use the existing “Class A (US)” concrete and
Grade 60 reinforcing steel in our pier alternative so we do not need to add any other materials.
Pier 3 – Frame Pier Example
Last Modified: 8/3/2016 22
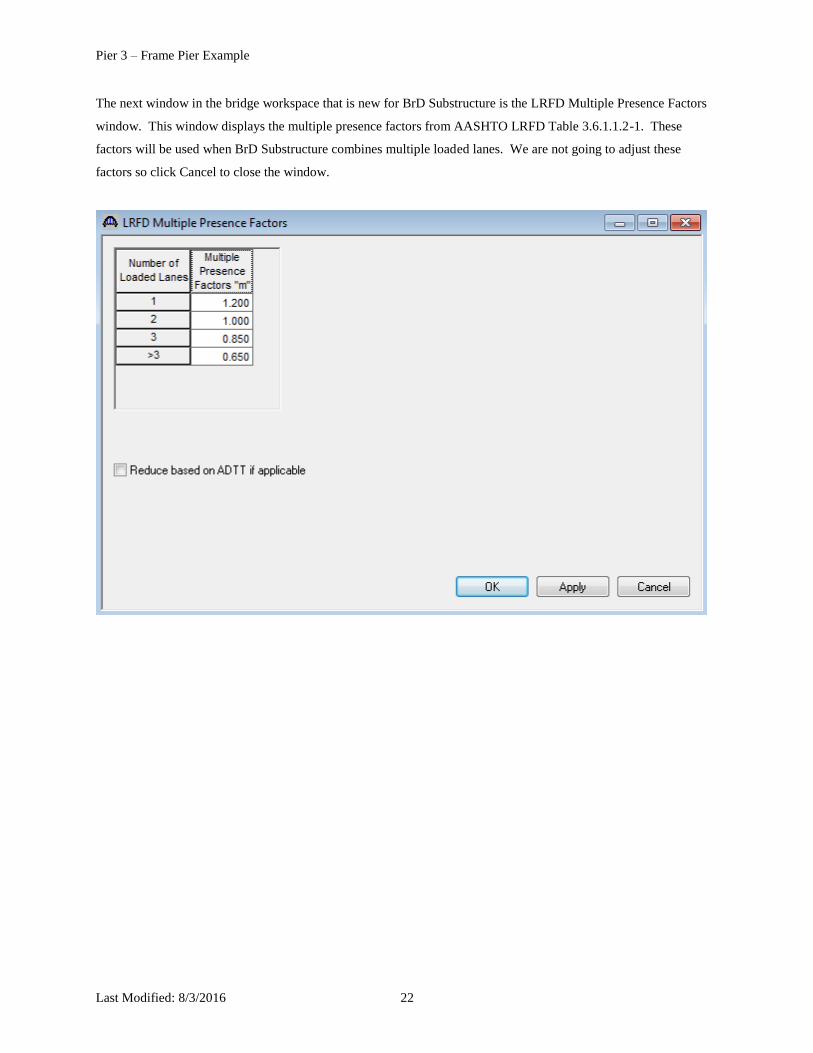
The next window in the bridge workspace that is new for BrD Substructure is the LRFD Multiple Presence Factors
window. This window displays the multiple presence factors from AASHTO LRFD Table 3.6.1.1.2-1. These
factors will be used when BrD Substructure combines multiple loaded lanes. We are not going to adjust these
factors so click Cancel to close the window.
Pier 3 – Frame Pier Example
Last Modified: 8/3/2016 23
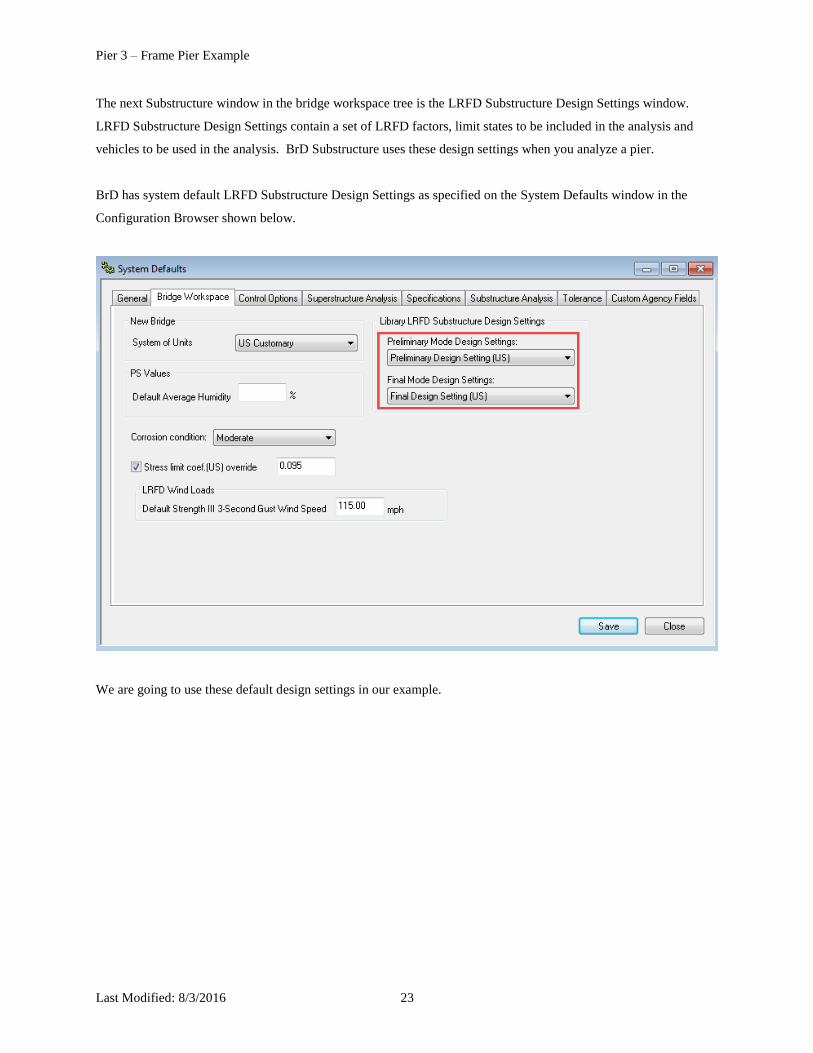
The next Substructure window in the bridge workspace tree is the LRFD Substructure Design Settings window.
LRFD Substructure Design Settings contain a set of LRFD factors, limit states to be included in the analysis and
vehicles to be used in the analysis. BrD Substructure uses these design settings when you analyze a pier.
BrD has system default LRFD Substructure Design Settings as specified on the System Defaults window in the
Configuration Browser shown below.
We are going to use these default design settings in our example.

Pier 3 – Frame Pier Example
Last Modified: 8/3/2016 24
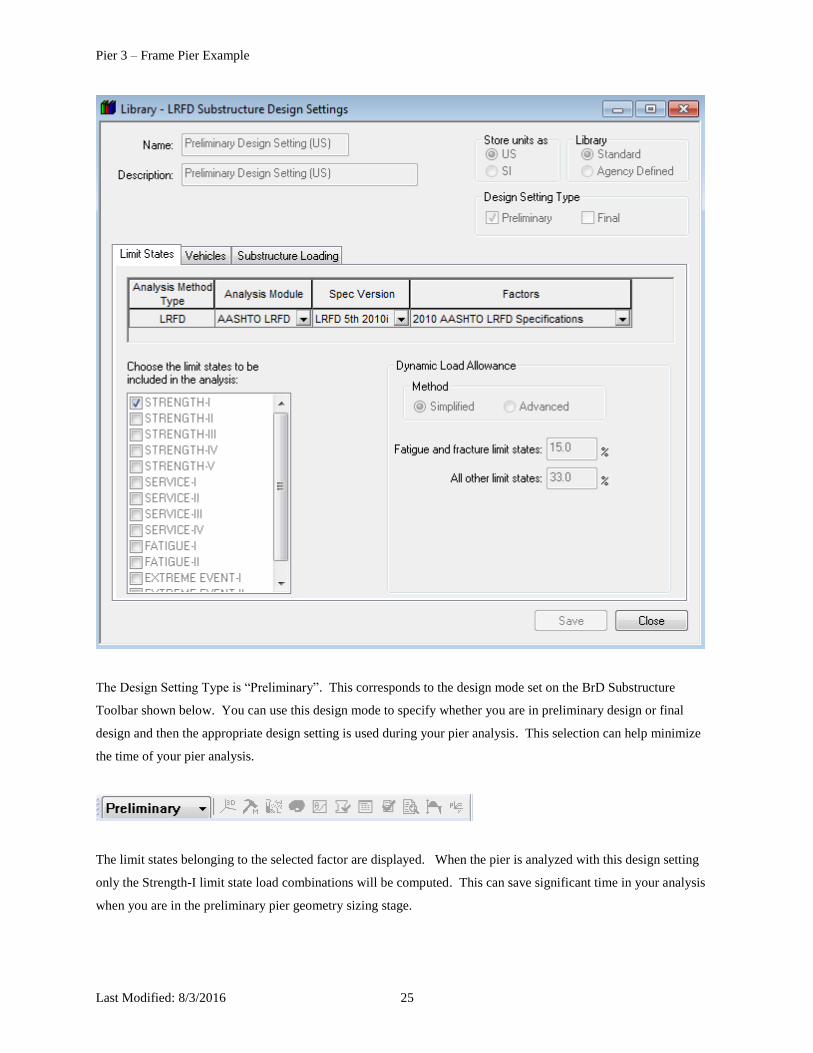
The following windows show the Preliminary Design Setting in the Library.
Pier 3 – Frame Pier Example
Last Modified: 8/3/2016 25
The Design Setting Type is “Preliminary”. This corresponds to the design mode set on the BrD Substructure
Toolbar shown below. You can use this design mode to specify whether you are in preliminary design or final
design and then the appropriate design setting is used during your pier analysis. This selection can help minimize
the time of your pier analysis.
The limit states belonging to the selected factor are displayed. When the pier is analyzed with this design setting
only the Strength-I limit state load combinations will be computed. This can save significant time in your analysis
when you are in the preliminary pier geometry sizing stage.

Pier 3 – Frame Pier Example
Last Modified: 8/3/2016 26
The vehicles to be used in the analysis are shown on the Vehicles tab.
Pier 3 – Frame Pier Example
Last Modified: 8/3/2016 27
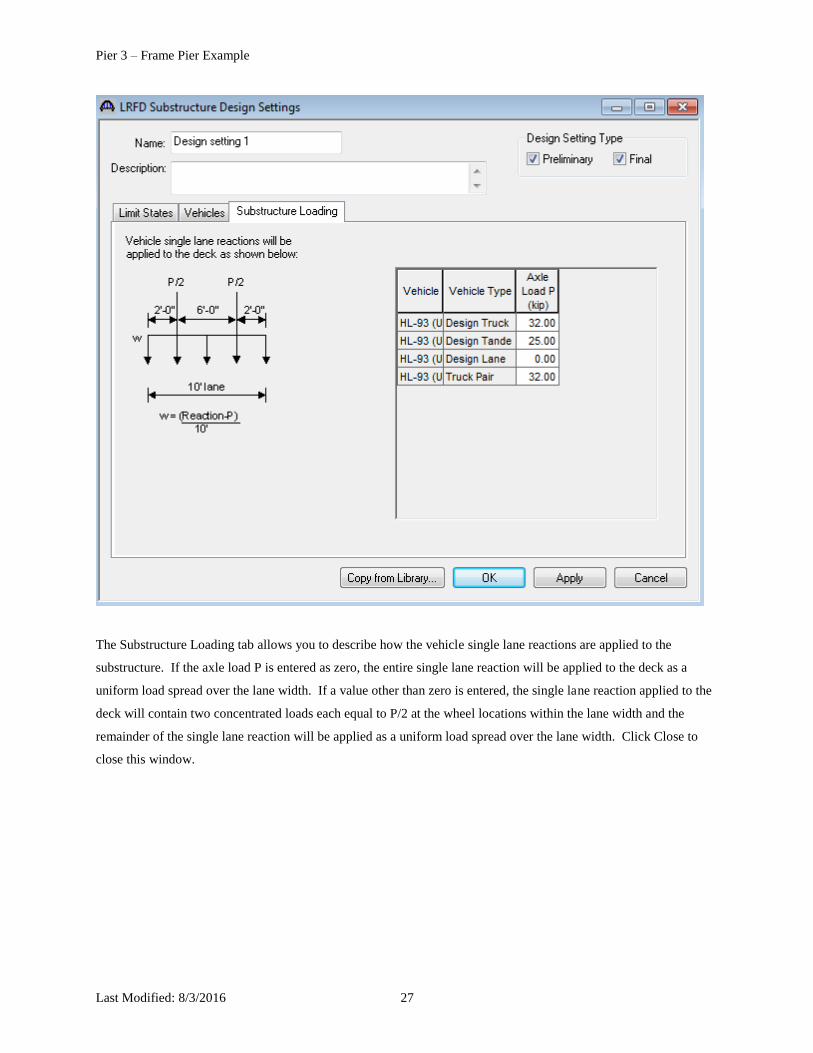
The Substructure Loading tab allows you to describe how the vehicle single lane reactions are applied to the
substructure. If the axle load P is entered as zero, the entire single lane reaction will be applied to the deck as a
uniform load spread over the lane width. If a value other than zero is entered, the single lane reaction applied to the
deck will contain two concentrated loads each equal to P/2 at the wheel locations within the lane width and the
remainder of the single lane reaction will be applied as a uniform load spread over the lane width. Click Close to
close this window.

Pier 3 – Frame Pier Example
Last Modified: 8/3/2016 28
The next Substructure window is the Environmental Conditions window shown below.
This window lists the environmental conditions acting on the bridge. The wind pressure values on the Wind tab
default to values from the AASHTO LRFD Specifications.
Specify the surface
conditions for your bridge.
All other data on this tab
defaults to the AASHTO
specs.
Pier 3 – Frame Pier Example
Last Modified: 8/3/2016 29
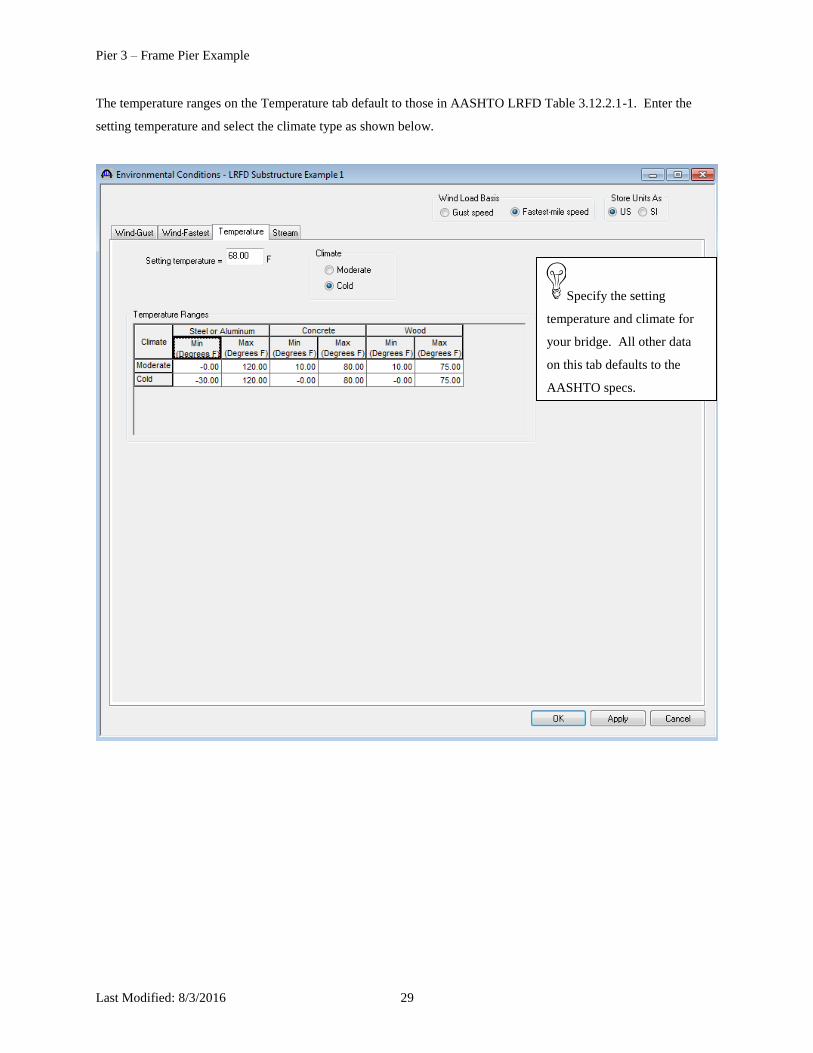
The temperature ranges on the Temperature tab default to those in AASHTO LRFD Table 3.12.2.1-1. Enter the
setting temperature and select the climate type as shown below.
Specify the setting
temperature and climate for
your bridge. All other data
on this tab defaults to the
AASHTO specs.
Pier 3 – Frame Pier Example
Last Modified: 8/3/2016 30
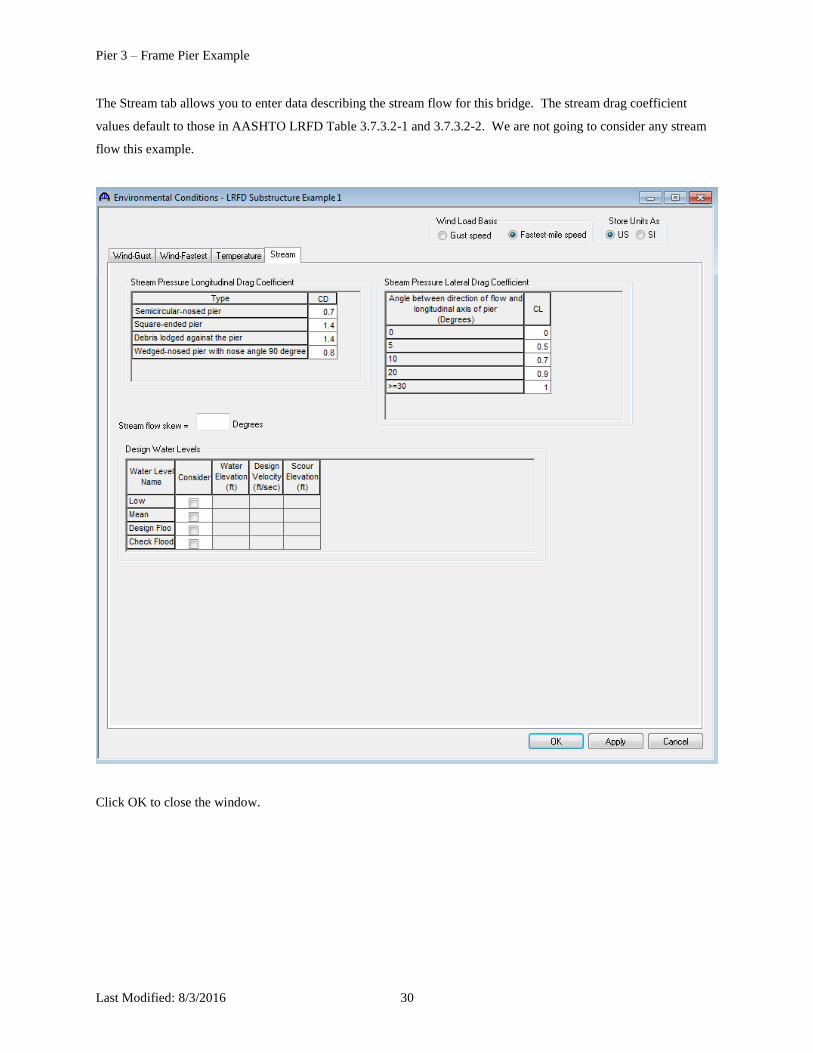
The Stream tab allows you to enter data describing the stream flow for this bridge. The stream drag coefficient
values default to those in AASHTO LRFD Table 3.7.3.2-1 and 3.7.3.2-2. We are not going to consider any stream
flow this example.
Click OK to close the window.
Pier 3 – Frame Pier Example
Last Modified: 8/3/2016 31
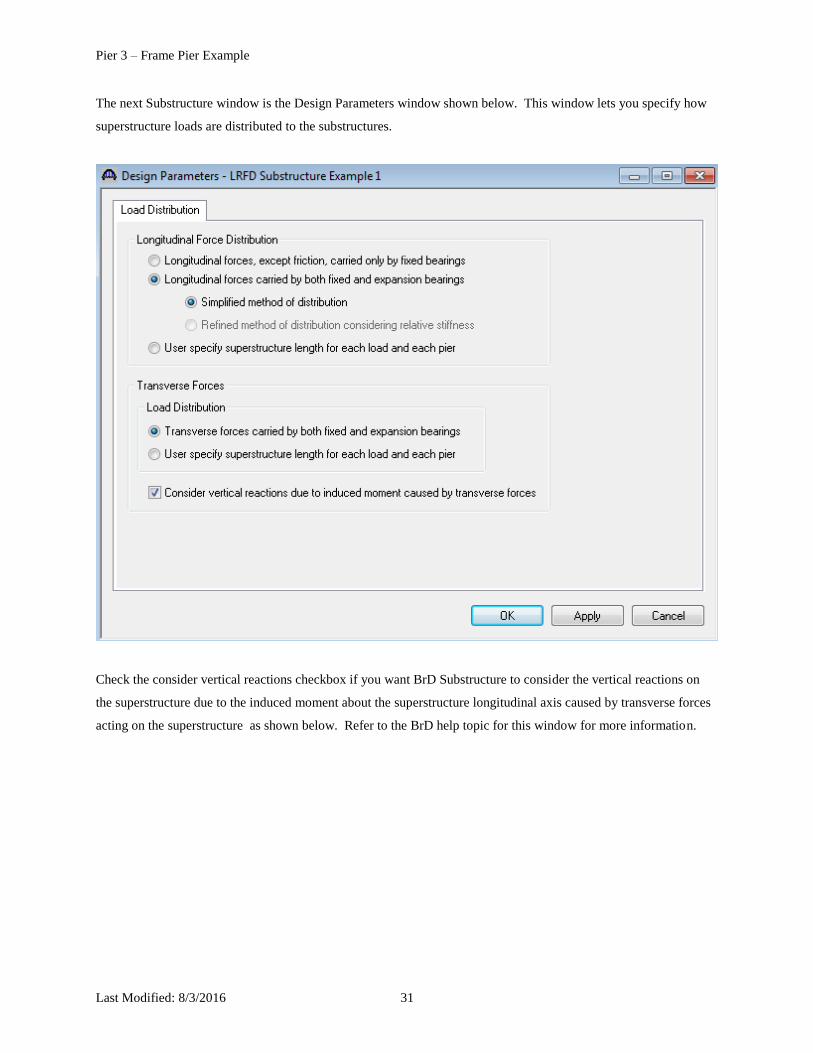
The next Substructure window is the Design Parameters window shown below. This window lets you specify how
superstructure loads are distributed to the substructures.
Check the consider vertical reactions checkbox if you want BrD Substructure to consider the vertical reactions on
the superstructure due to the induced moment about the superstructure longitudinal axis caused by transverse forces
acting on the superstructure as shown below. Refer to the BrD help topic for this window for more information.

Pier 3 – Frame Pier Example
Last Modified: 8/3/2016 32
S2
Transverse Force
h
V1V2 V3
V4CG of girders
S4
S3
G1
G4G3
G2
S
S1 = 0
We are now ready to start describing the pier. Open the Stiffness Analysis window shown below.

Pier 3 – Frame Pier Example
Last Modified: 8/3/2016 33
The Stiffness Analysis window lets you describe the bearing data at each substructure unit in your bridge alternative.
This bearing data can be used by BrD to compute the length of loaded superstructure applied to each substructure
unit.
Enter the data shown above.
The Bearing Data (Cont’d) tab lets you enter the coefficient of friction for sliding bearings so BrD can compute the
friction forces on the pier for you. Since our bridge has elastomeric bearings, the coefficient of friction is not
entered for our bearings.

Pier 3 – Frame Pier Example
Last Modified: 8/3/2016 34
The Relative Stiffness tab allows you to specify how longitudinal superstructure loads are distributed to the
substructure units. Click the “Compute…” button to have BrD compute the loaded superstructure lengths to apply
to our pier. You will get a message asking if you want to first apply your changes to the Bearing Data tab. Click
Yes to that message.
Pier 3 – Frame Pier Example
Last Modified: 8/3/2016 35
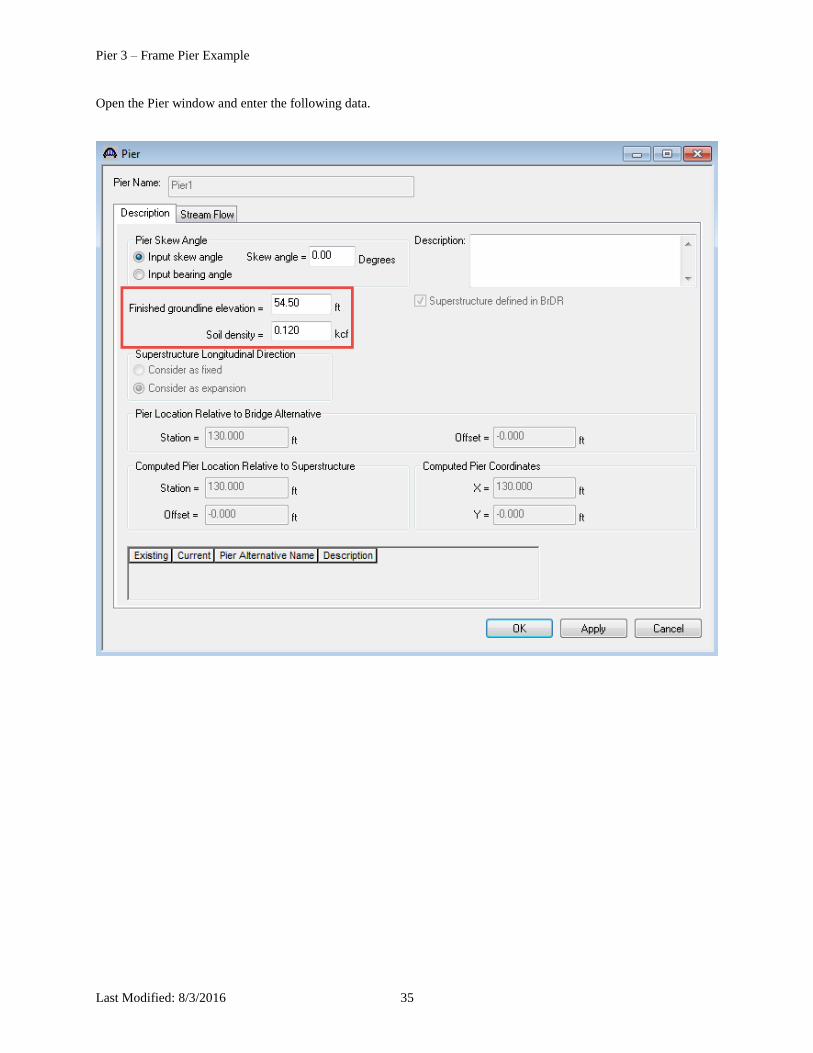
Open the Pier window and enter the following data.
Pier 3 – Frame Pier Example
Last Modified: 8/3/2016 36
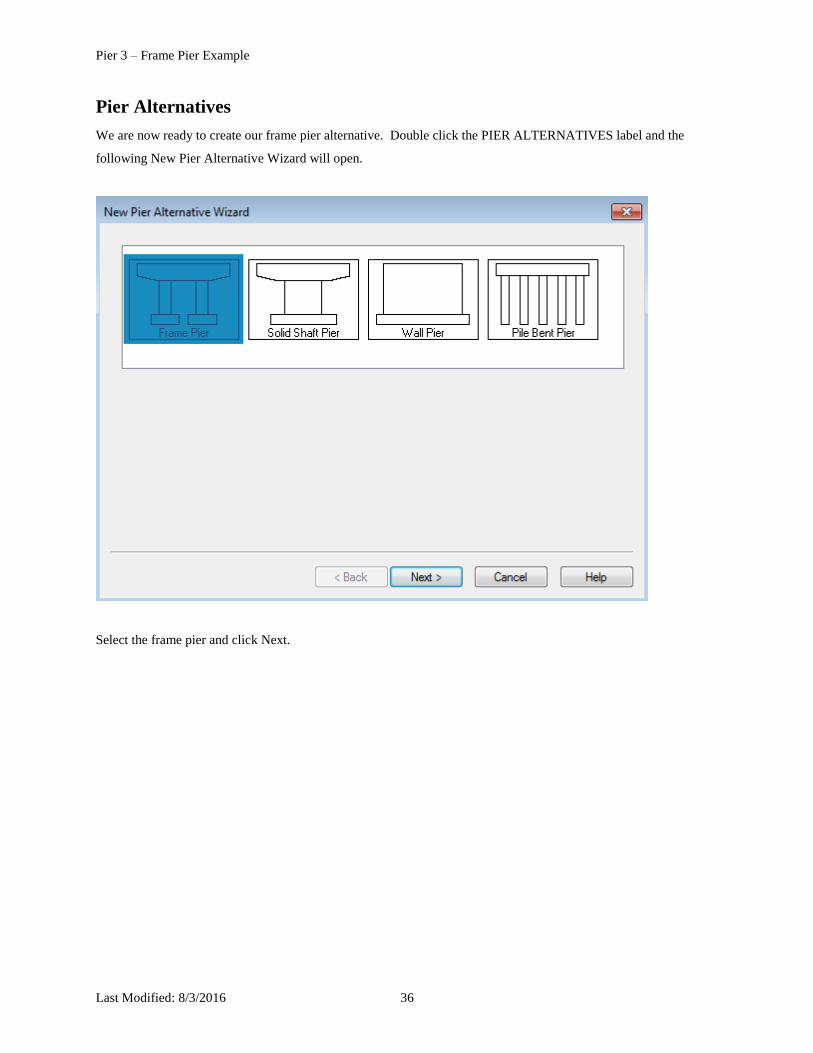
Pier Alternatives
We are now ready to create our frame pier alternative. Double click the PIER ALTERNATIVES label and the
following New Pier Alternative Wizard will open.
Select the frame pier and click Next.
Pier 3 – Frame Pier Example
Last Modified: 8/3/2016 37
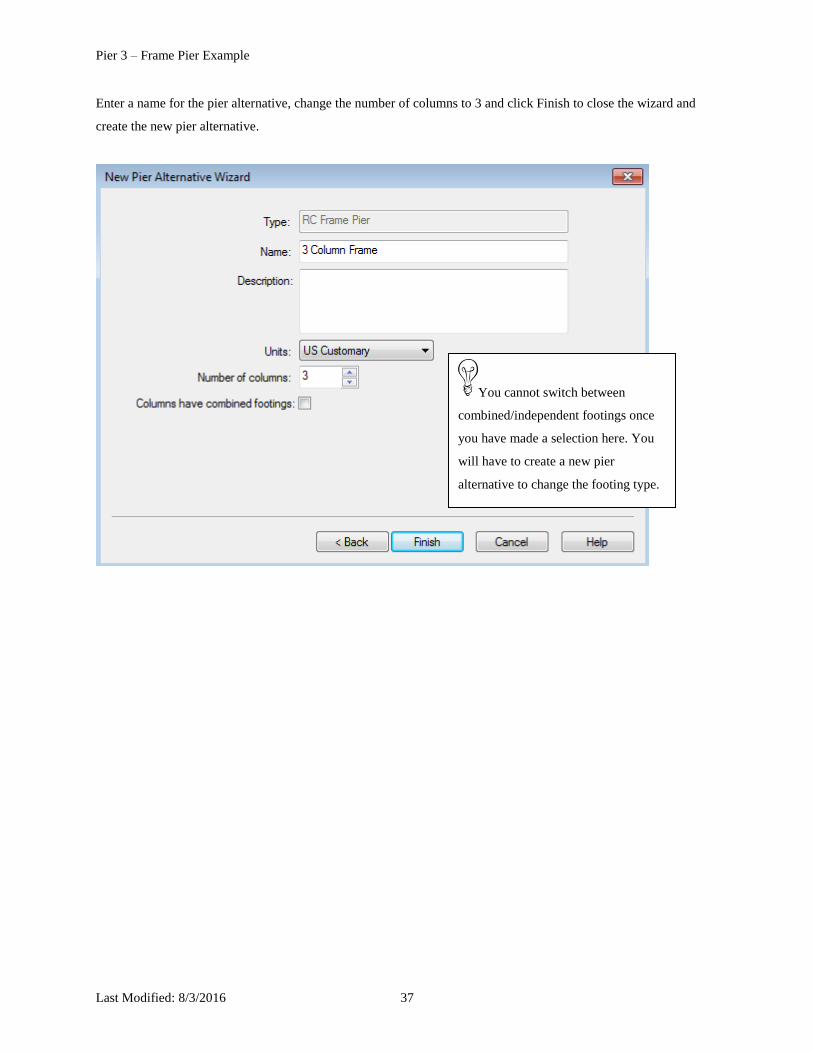
Enter a name for the pier alternative, change the number of columns to 3 and click Finish to close the wizard and
create the new pier alternative.
You cannot switch between
combined/independent footings once
you have made a selection here. You
will have to create a new pier
alternative to change the footing type.
Pier 3 – Frame Pier Example
Last Modified: 8/3/2016 38
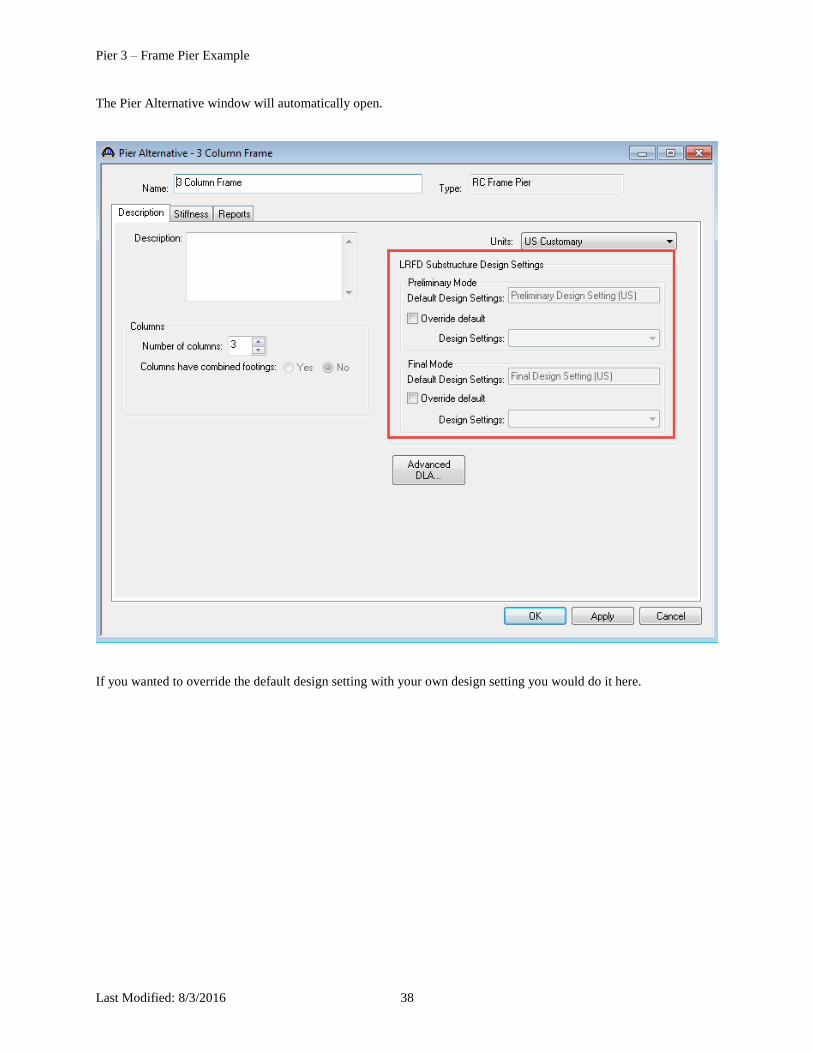
The Pier Alternative window will automatically open.
If you wanted to override the default design setting with your own design setting you would do it here.
Pier 3 – Frame Pier Example
Last Modified: 8/3/2016 39
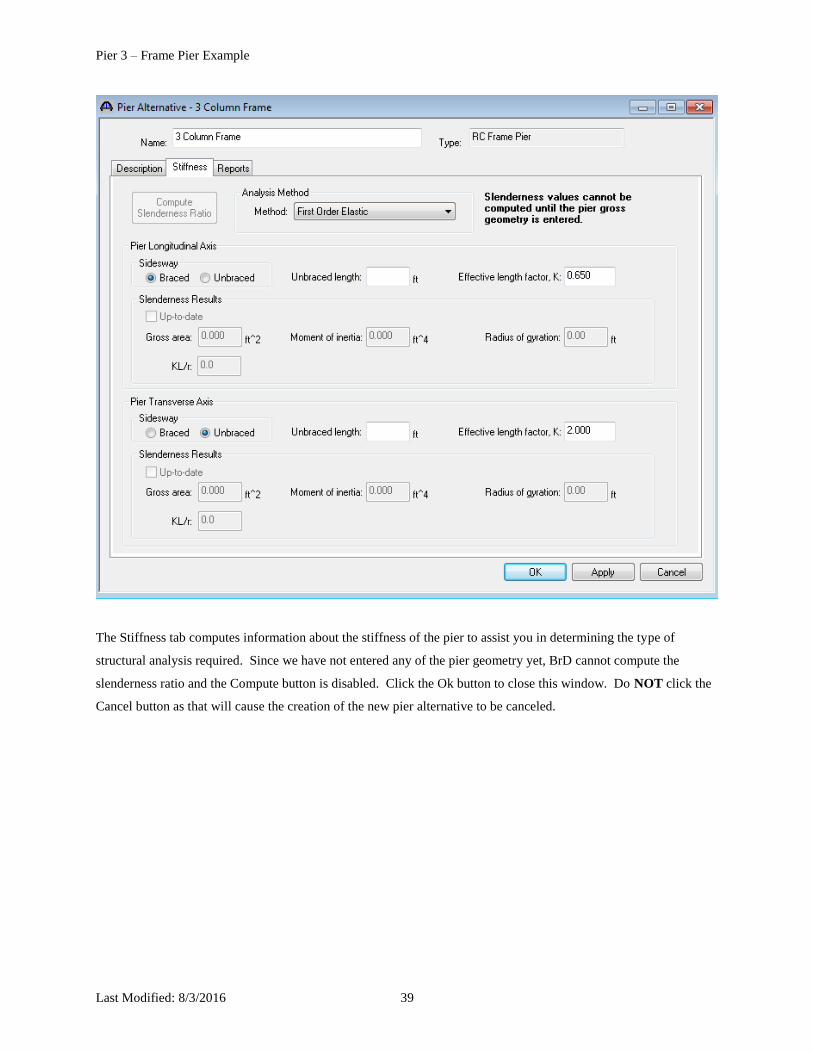
The Stiffness tab computes information about the stiffness of the pier to assist you in determining the type of
structural analysis required. Since we have not entered any of the pier geometry yet, BrD cannot compute the
slenderness ratio and the Compute button is disabled. Click the Ok button to close this window. Do NOT click the
Cancel button as that will cause the creation of the new pier alternative to be canceled.
Pier 3 – Frame Pier Example
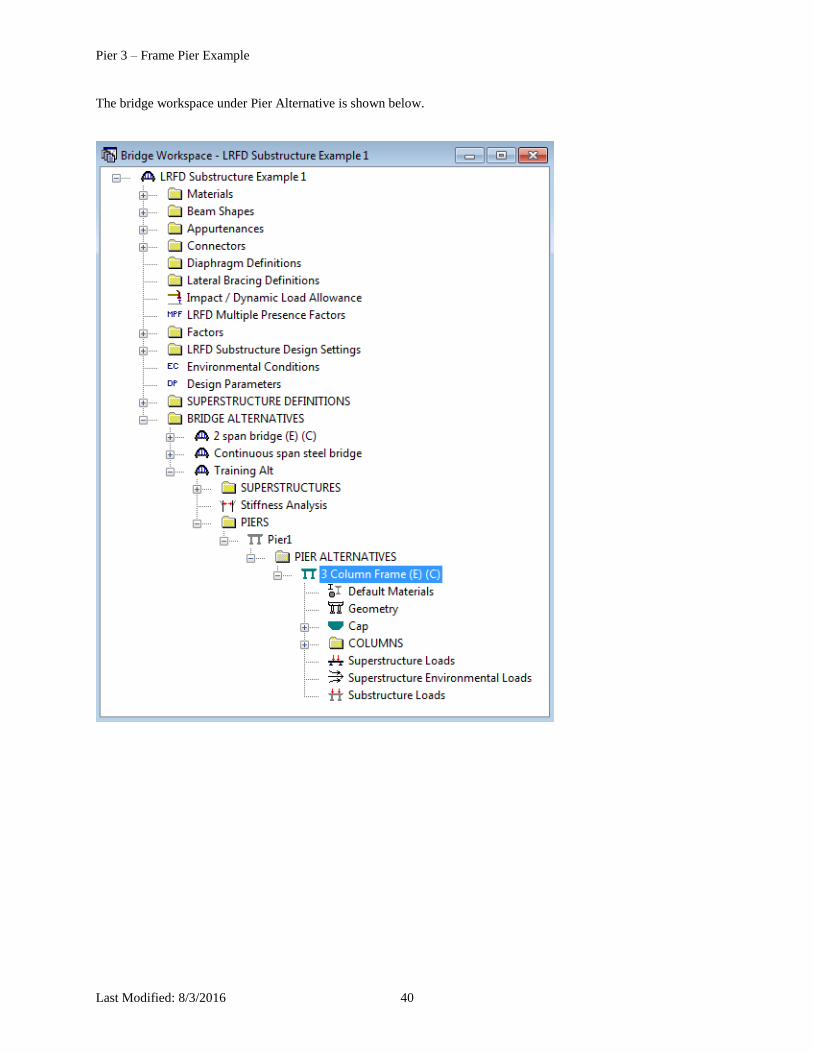
Last Modified: 8/3/2016 40
The bridge workspace under Pier Alternative is shown below.
Pier 3 – Frame Pier Example
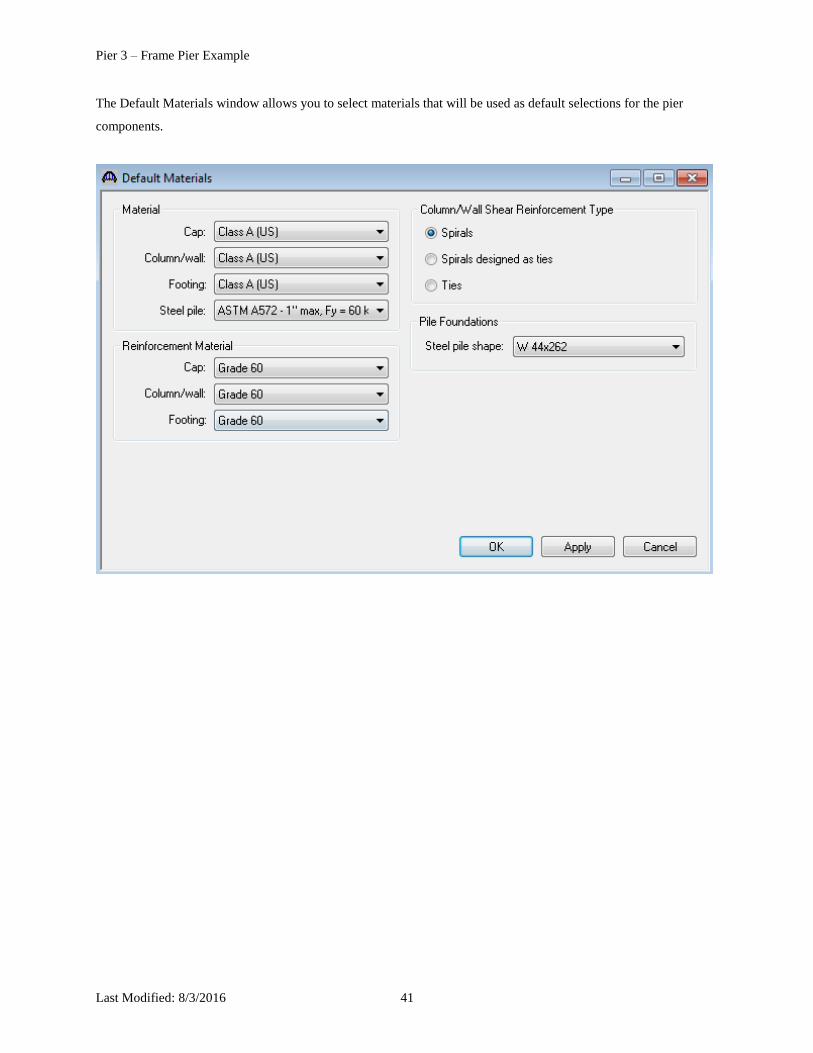
Last Modified: 8/3/2016 41
The Default Materials window allows you to select materials that will be used as default selections for the pier
components.
Pier 3 – Frame Pier Example
Last Modified: 8/3/2016 42
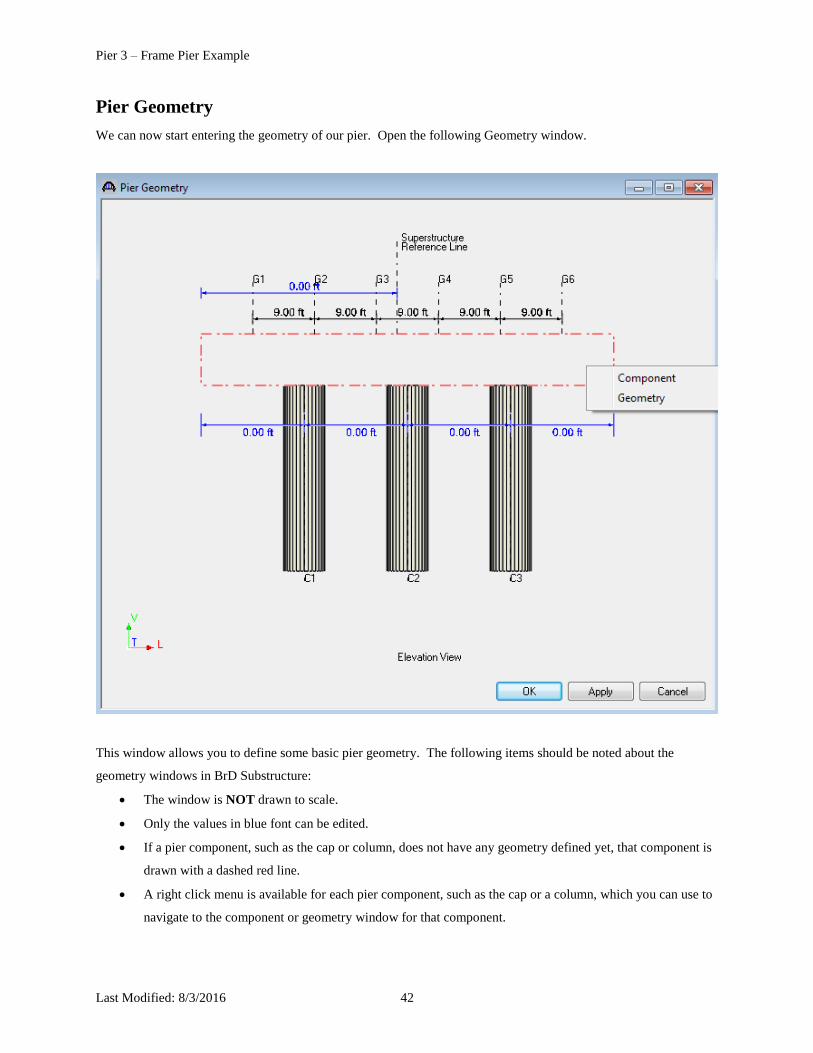
Pier Geometry
We can now start entering the geometry of our pier. Open the following Geometry window.
This window allows you to define some basic pier geometry. The following items should be noted about the
geometry windows in BrD Substructure:
The window is NOT drawn to scale.
Only the values in blue font can be edited.
If a pier component, such as the cap or column, does not have any geometry defined yet, that component is
drawn with a dashed red line.
A right click menu is available for each pier component, such as the cap or a column, which you can use to
navigate to the component or geometry window for that component.
Pier 3 – Frame Pier Example
Last Modified: 8/3/2016 43
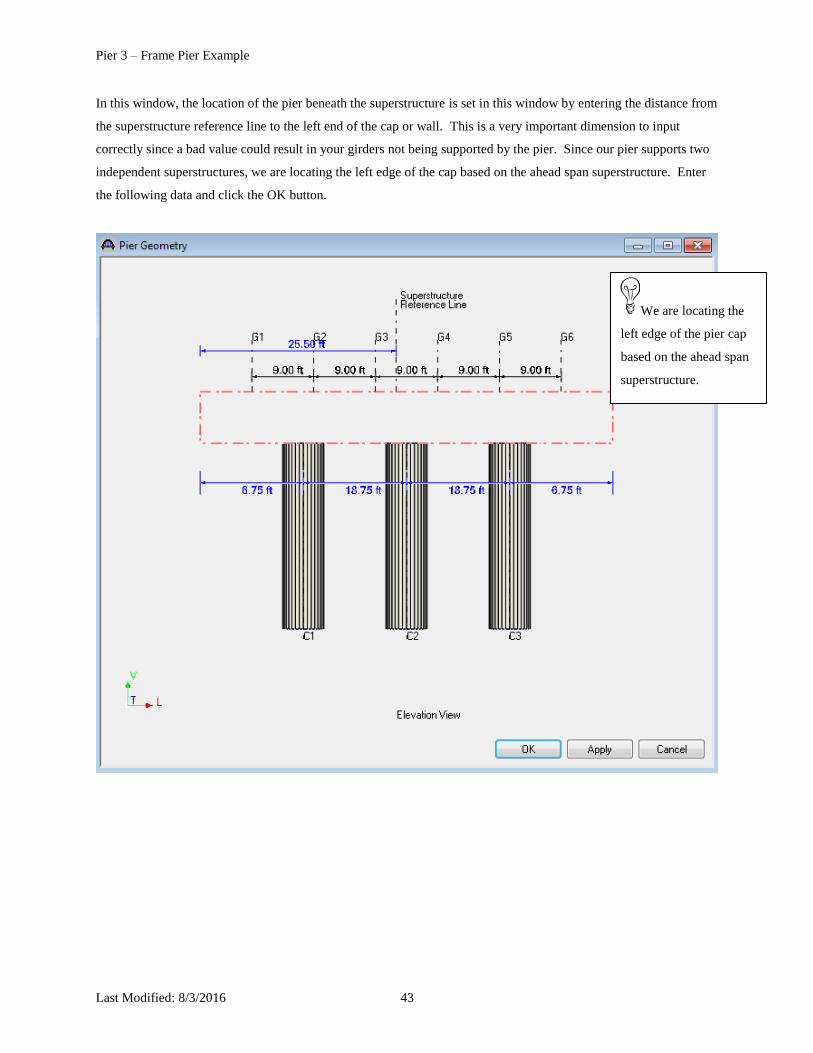
In this window, the location of the pier beneath the superstructure is set in this window by entering the distance from
the superstructure reference line to the left end of the cap or wall. This is a very important dimension to input
correctly since a bad value could result in your girders not being supported by the pier. Since our pier supports two
independent superstructures, we are locating the left edge of the cap based on the ahead span superstructure. Enter
the following data and click the OK button.
We are locating the
left edge of the pier cap
based on the ahead span
superstructure.
Pier 3 – Frame Pier Example
Last Modified: 8/3/2016 44
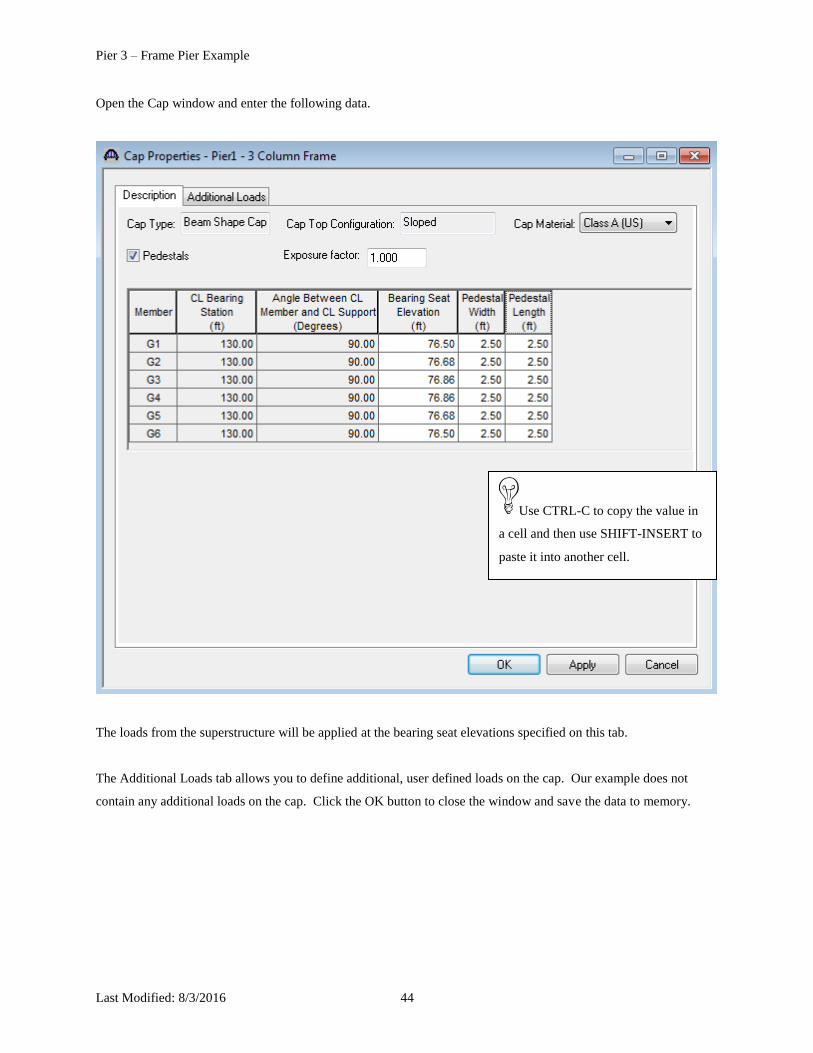
Open the Cap window and enter the following data.
The loads from the superstructure will be applied at the bearing seat elevations specified on this tab.
The Additional Loads tab allows you to define additional, user defined loads on the cap. Our example does not
contain any additional loads on the cap. Click the OK button to close the window and save the data to memory.
Use CTRL-C to copy the value in
a cell and then use SHIFT-INSERT to
paste it into another cell.
Pier 3 – Frame Pier Example
Last Modified: 8/3/2016 45
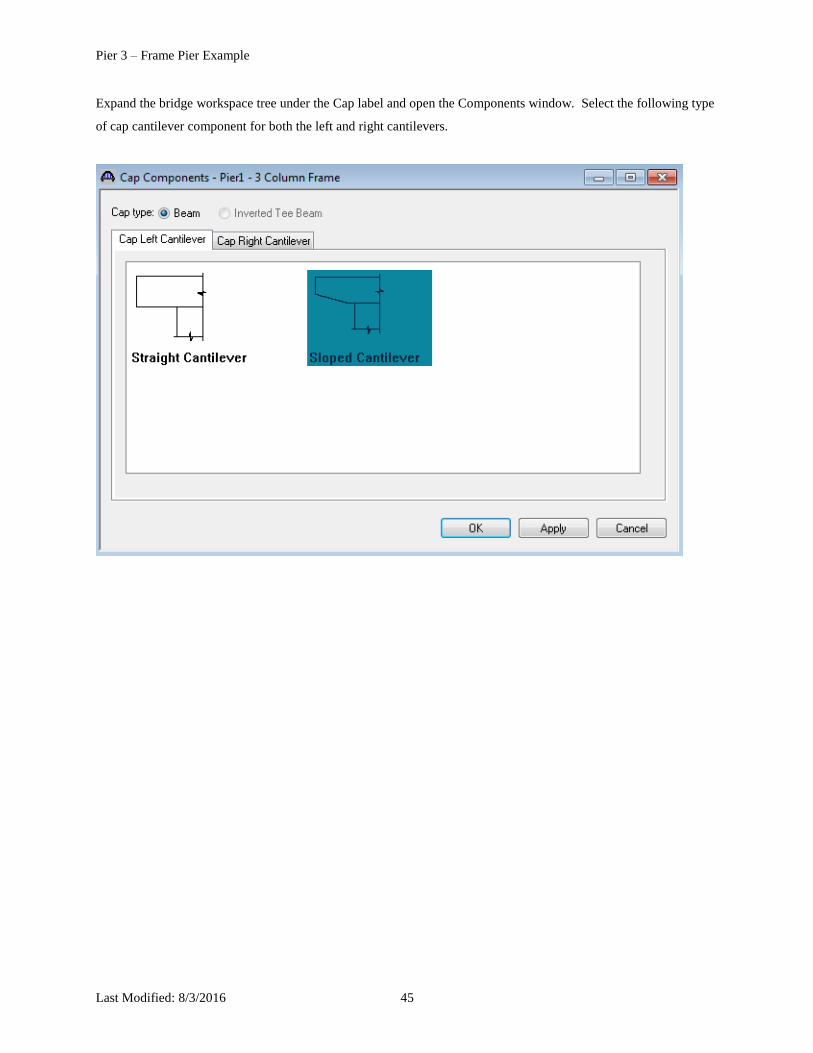
Expand the bridge workspace tree under the Cap label and open the Components window. Select the following type
of cap cantilever component for both the left and right cantilevers.

Pier 3 – Frame Pier Example
Last Modified: 8/3/2016 46
Now open the Cap Geometry window and enter the following cap geometry data.
Click OK to close the window.
Pier 3 – Frame Pier Example
Last Modified: 8/3/2016 47
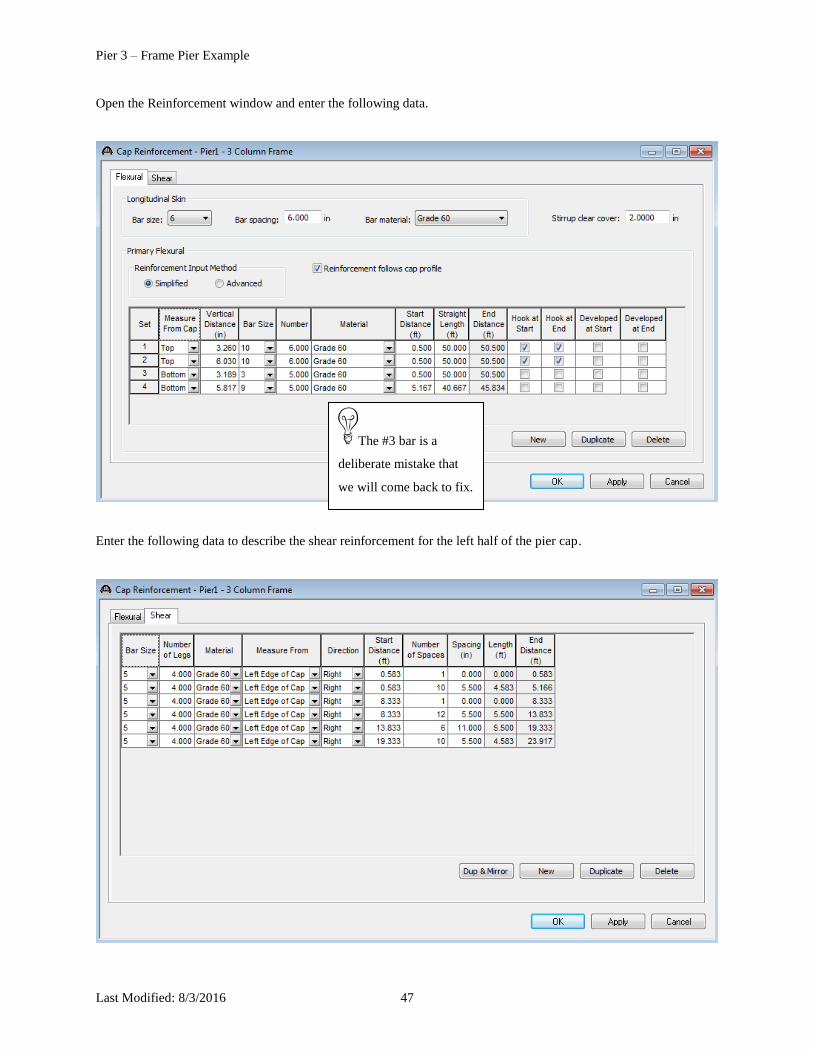
Open the Reinforcement window and enter the following data.
Enter the following data to describe the shear reinforcement for the left half of the pier cap.
The #3 bar is a
deliberate mistake that
we will come back to fix.
Pier 3 – Frame Pier Example
Last Modified: 8/3/2016 48
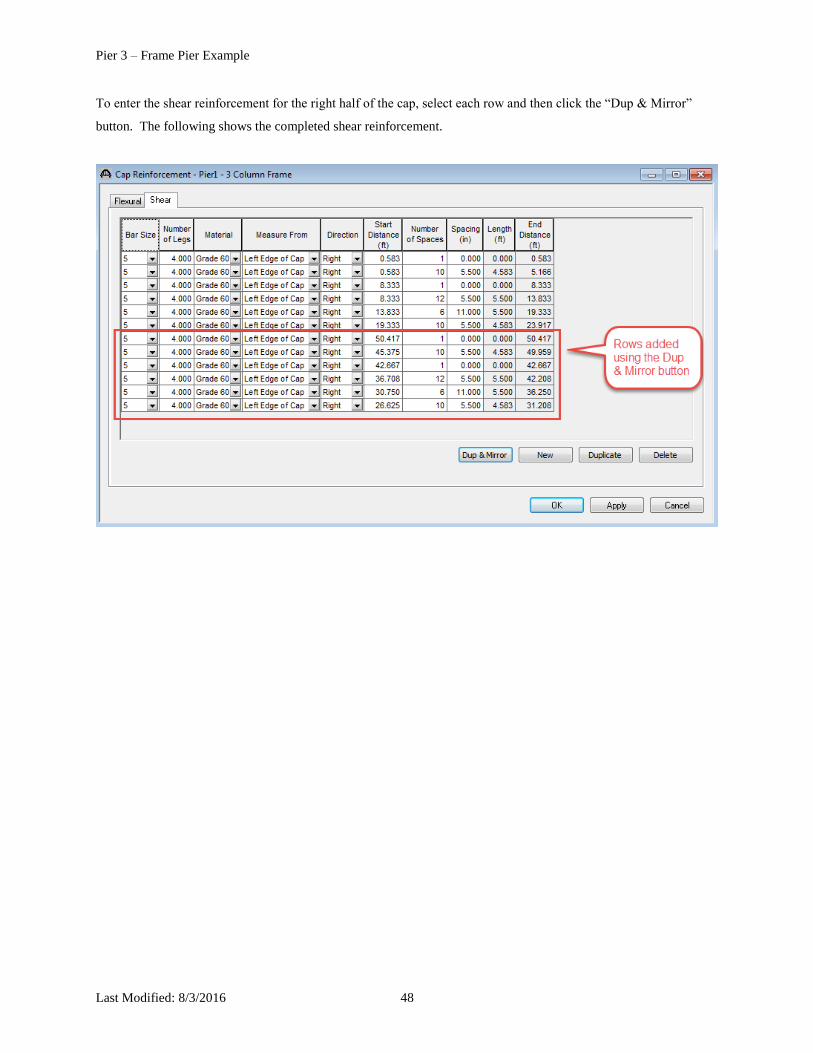
To enter the shear reinforcement for the right half of the cap, select each row and then click the “Dup & Mirror”
button. The following shows the completed shear reinforcement.

Pier 3 – Frame Pier Example
Last Modified: 8/3/2016 49
Open the Column window for Column1 and enter the Exposure Factor.
If you leave the Exposure Factor
blank BrD will use a default value
equal to 1.0 in the spec checks.
Pier 3 – Frame Pier Example
Last Modified: 8/3/2016 50
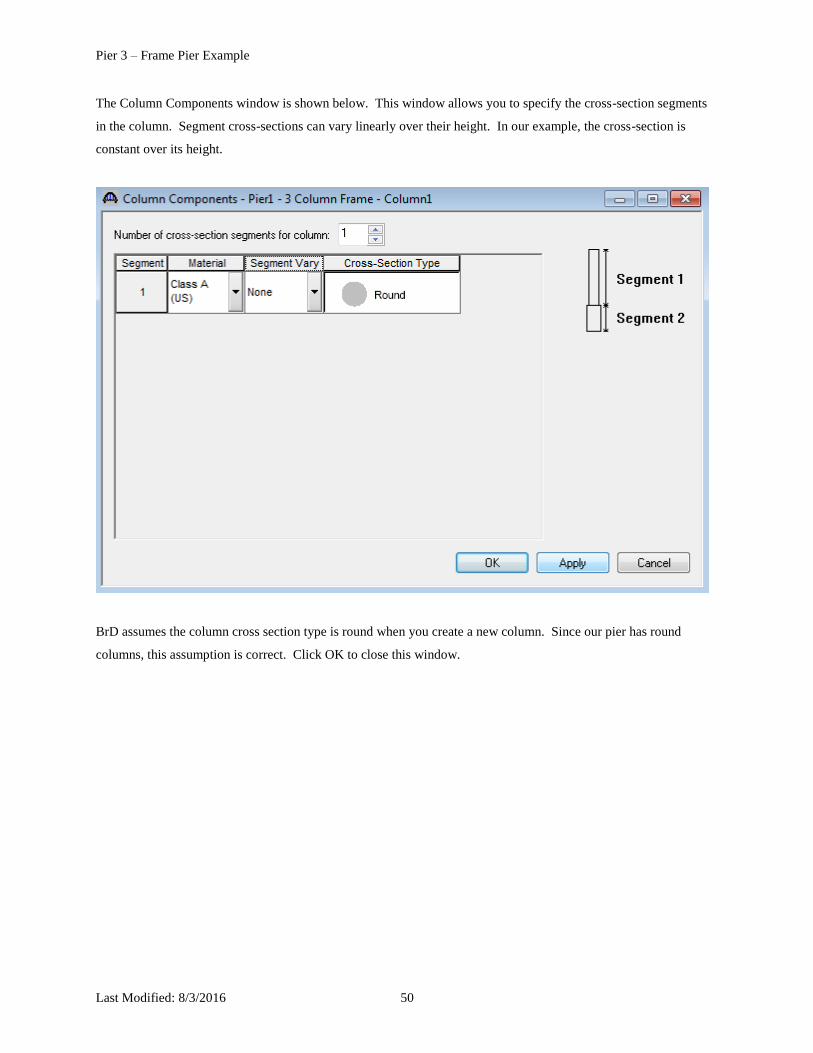
The Column Components window is shown below. This window allows you to specify the cross-section segments
in the column. Segment cross-sections can vary linearly over their height. In our example, the cross-section is
constant over its height.
BrD assumes the column cross section type is round when you create a new column. Since our pier has round
columns, this assumption is correct. Click OK to close this window.
Pier 3 – Frame Pier Example
Last Modified: 8/3/2016 51
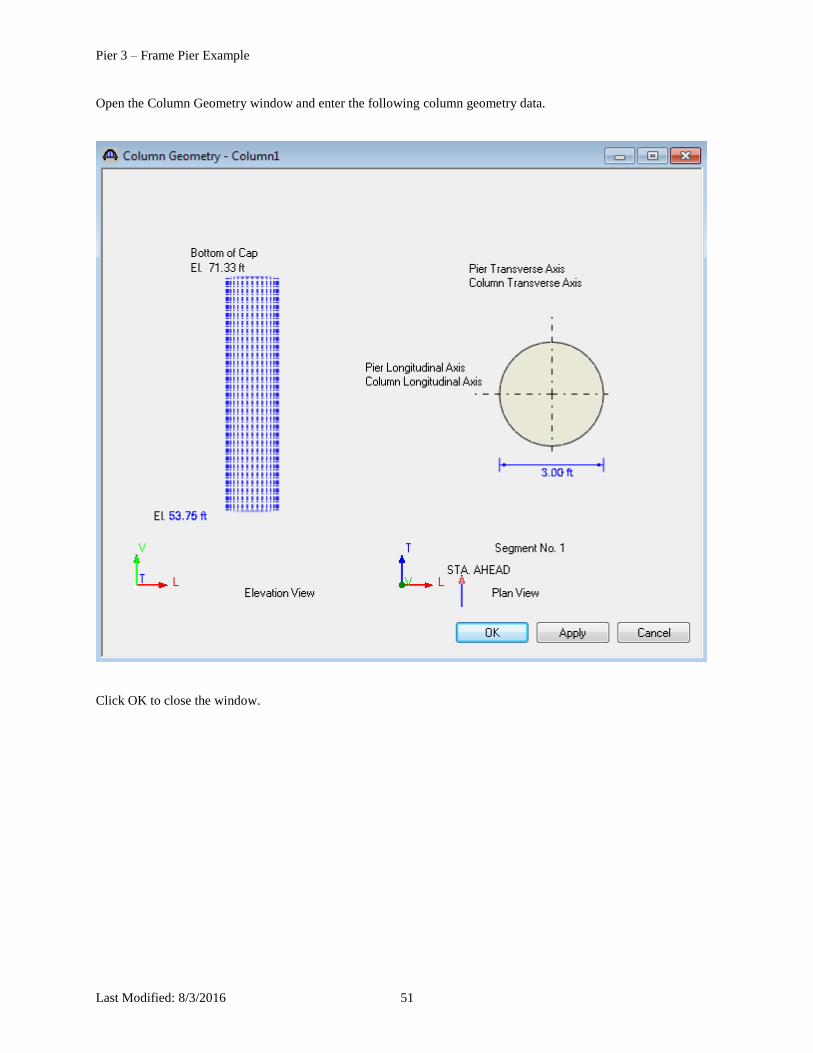
Open the Column Geometry window and enter the following column geometry data.
Click OK to close the window.

Pier 3 – Frame Pier Example
Last Modified: 8/3/2016 52
Double click the Reinforcement Definitions label to create a new reinforcement definition for the column. The
reinforcement definition will be later assigned to ranges over the height of the column. Click the “Generate Pattern”
button to use the pattern wizard to create a pattern of reinforcement. Enter the following data and click the “Apply”
button. The clear cover measured to the face of the flexural reinforcement is 2” cover to face of spiral plus ½” for
the spiral diameter.
The following bar locations are generated for this pattern.

Pier 3 – Frame Pier Example
Last Modified: 8/3/2016 53
Our column reinforcement is going to extend down into the footing so we will next create a Foundation Alternative
and then come back to assign this pattern to the column. Otherwise we will get a Validation message that the
column rebar does not fit inside the footing.
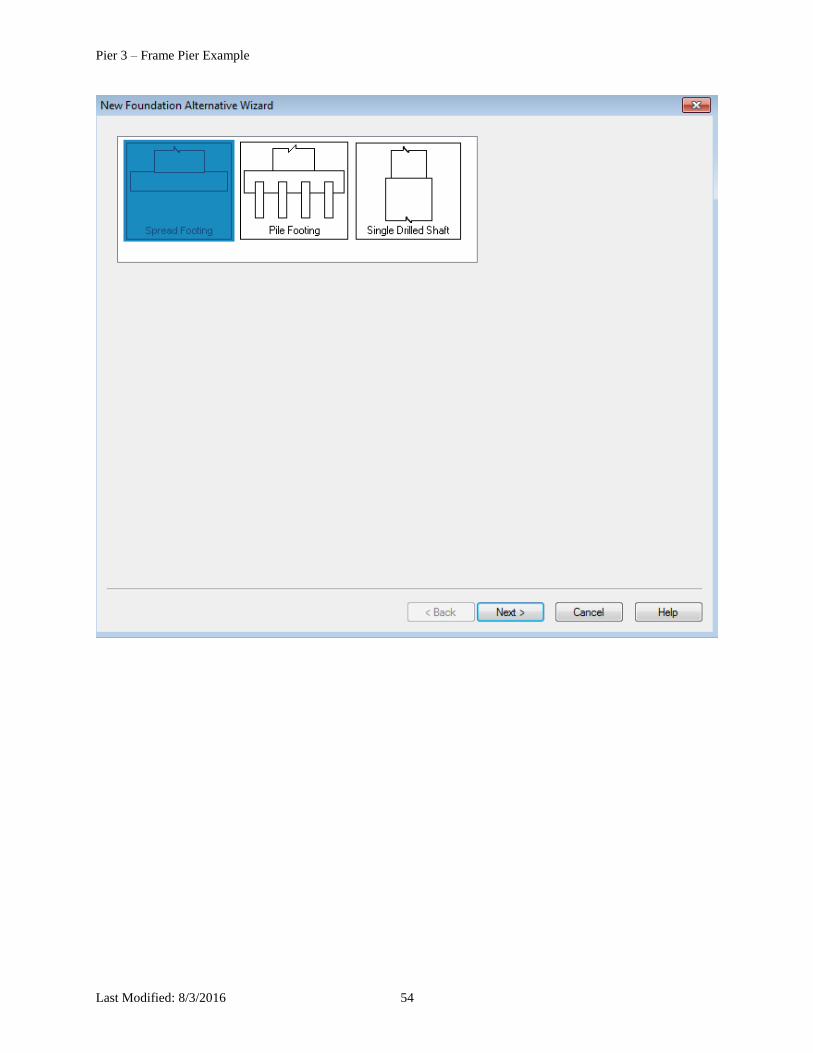
Double click the FOUNDATION ALTERNATIVES label and the New Foundation Alternatives wizard will open.
Select the spread footing and click Next.
Pier 3 – Frame Pier Example
Last Modified: 8/3/2016 54

Pier 3 – Frame Pier Example
Last Modified: 8/3/2016 55
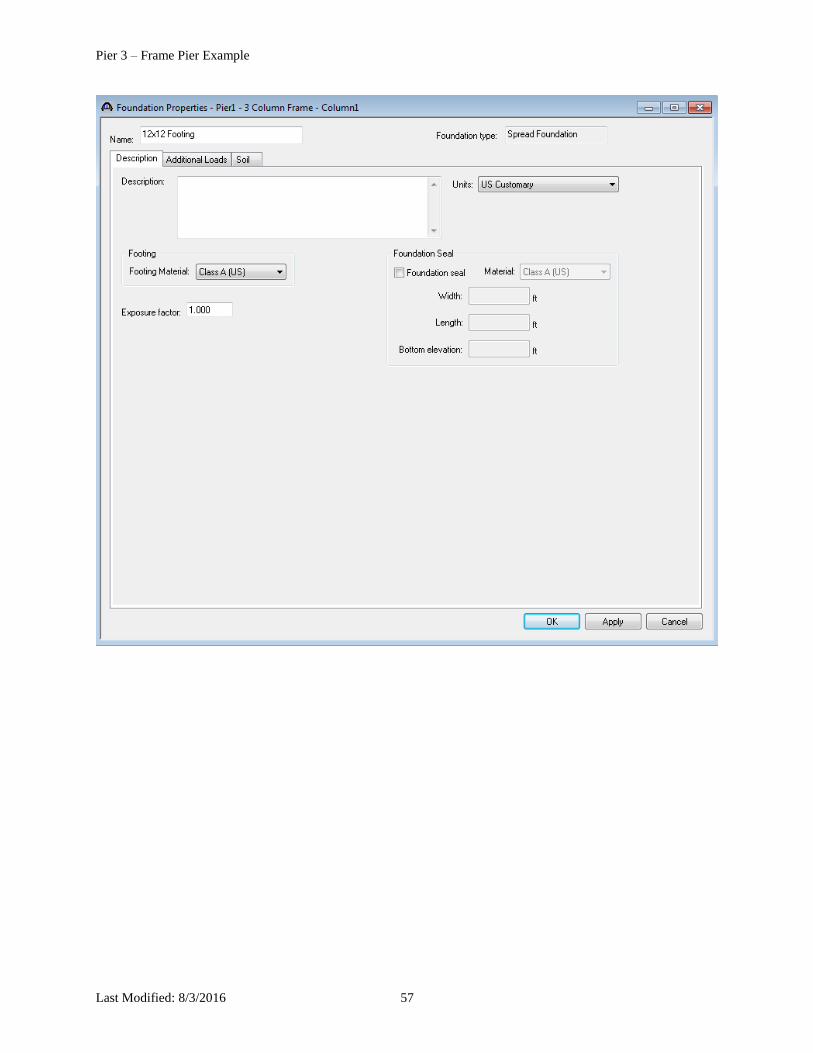
Enter the following description of the foundation.
Click Finish and the Foundation Properties window will open. Enter the Exposure Factor.

Pier 3 – Frame Pier Example
Last Modified: 8/3/2016 56
Pier 3 – Frame Pier Example
Last Modified: 8/3/2016 57

Pier 3 – Frame Pier Example
Last Modified: 8/3/2016 58
Enter the rock factored bearing resistance and click the OK button. Do not click the Cancel button as that will cause
the creation of the new foundation alternative to be canceled.

Pier 3 – Frame Pier Example
Last Modified: 8/3/2016 59
Open the Foundation Geometry window.
There is no additional data to enter so click the OK button.
Pier 3 – Frame Pier Example
Last Modified: 8/3/2016 60
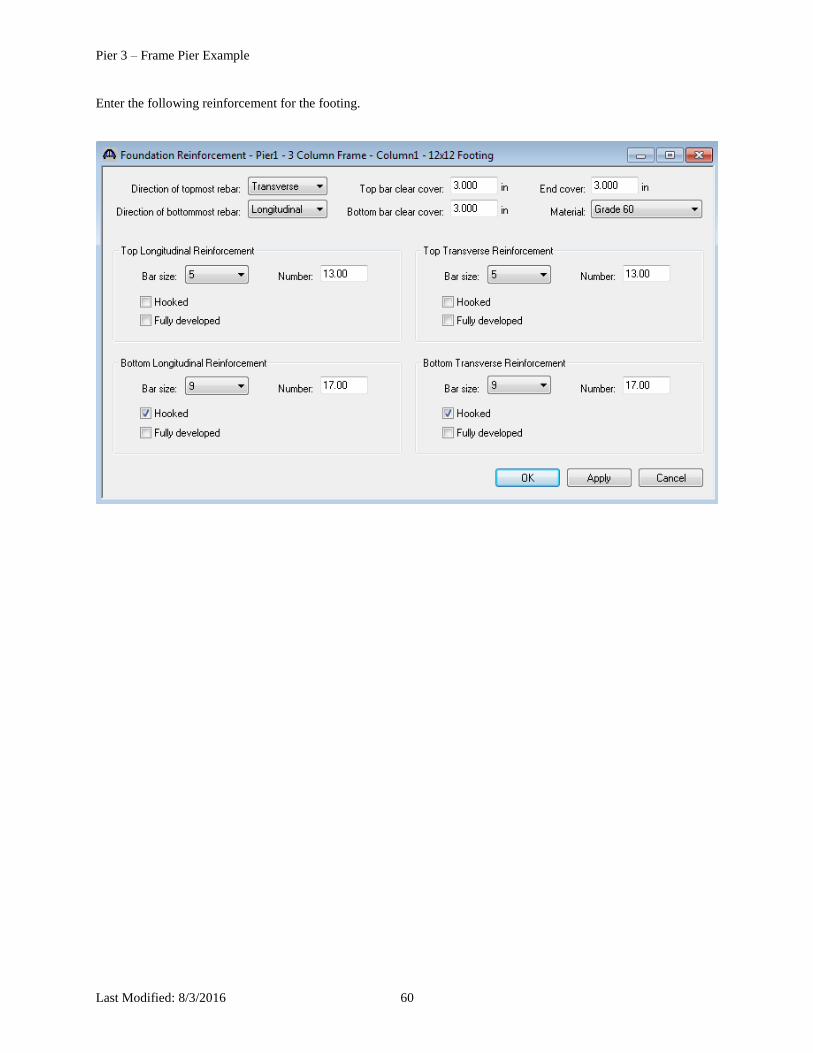
Enter the following reinforcement for the footing.
Pier 3 – Frame Pier Example
Last Modified: 8/3/2016 61
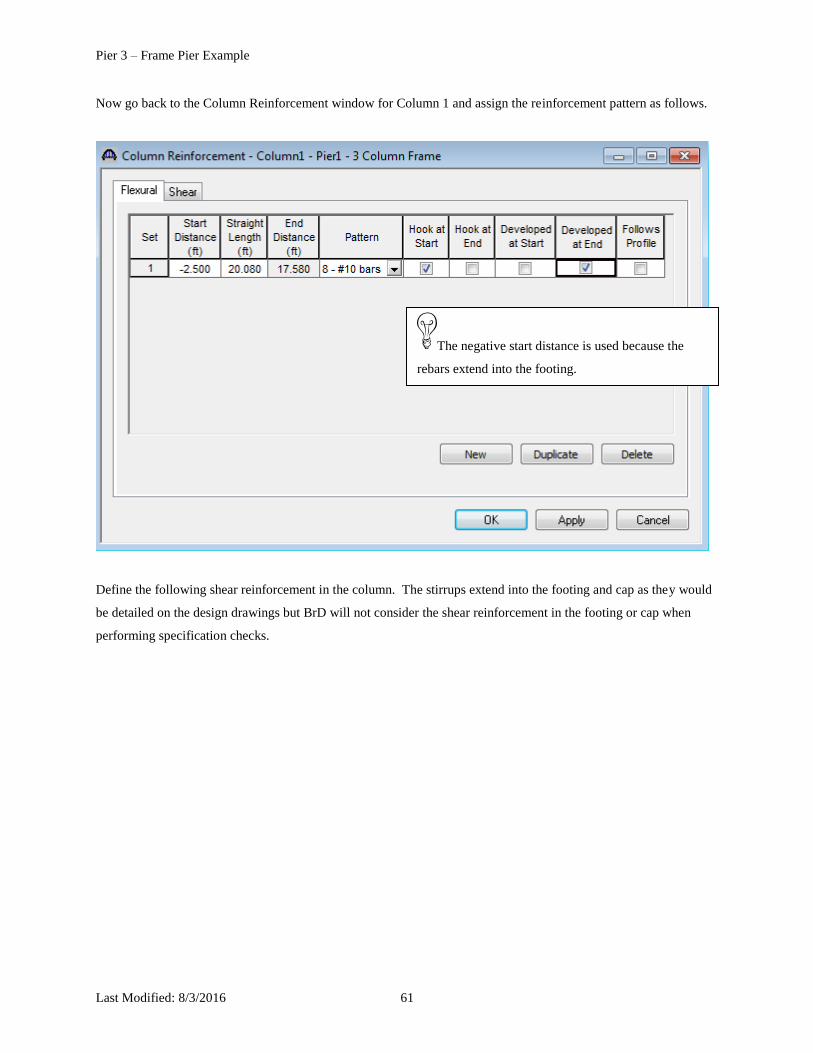
Now go back to the Column Reinforcement window for Column 1 and assign the reinforcement pattern as follows.
Define the following shear reinforcement in the column. The stirrups extend into the footing and cap as they would
be detailed on the design drawings but BrD will not consider the shear reinforcement in the footing or cap when
performing specification checks.
The negative start distance is used because the
rebars extend into the footing.

Pier 3 – Frame Pier Example
Last Modified: 8/3/2016 62

Pier 3 – Frame Pier Example
Last Modified: 8/3/2016 63
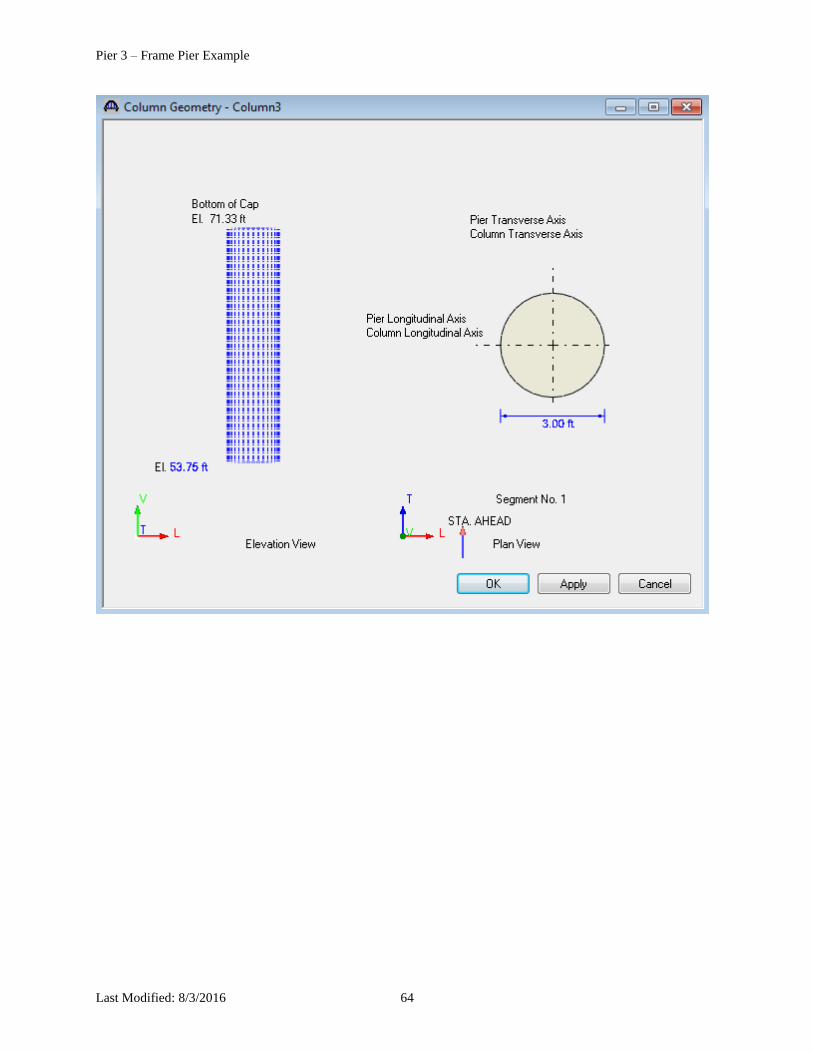
Now we can finish describing Columns 2 and 3. Define the geometry for Column 2 and 3 as shown below.
Pier 3 – Frame Pier Example
Last Modified: 8/3/2016 64

Pier 3 – Frame Pier Example
Last Modified: 8/3/2016 65
Let’s now copy the footing from Column 1 and paste it to Columns 2 and 3 using the right-click menu. The Copy
function is shown below. Paste the footing in the same manner.
Pier 3 – Frame Pier Example
Last Modified: 8/3/2016 66
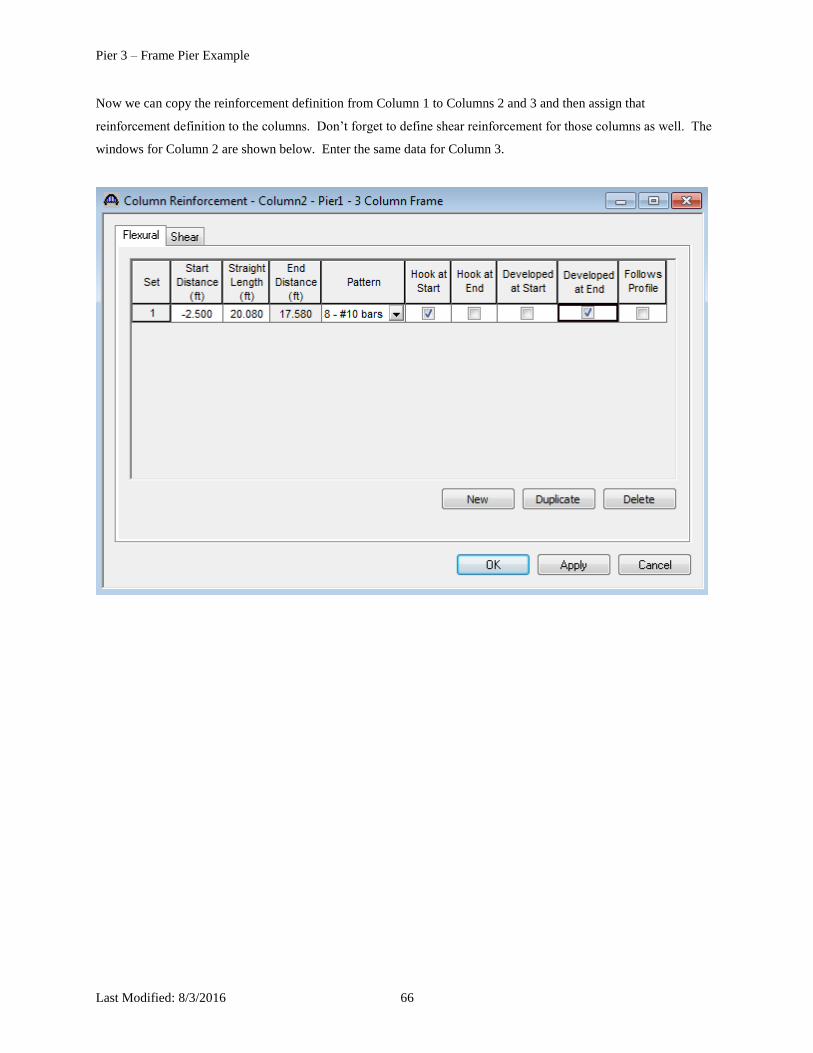
Now we can copy the reinforcement definition from Column 1 to Columns 2 and 3 and then assign that
reinforcement definition to the columns. Don’t forget to define shear reinforcement for those columns as well. The
windows for Column 2 are shown below. Enter the same data for Column 3.

Pier 3 – Frame Pier Example
Last Modified: 8/3/2016 67
Pier 3 – Frame Pier Example
Last Modified: 8/3/2016 68
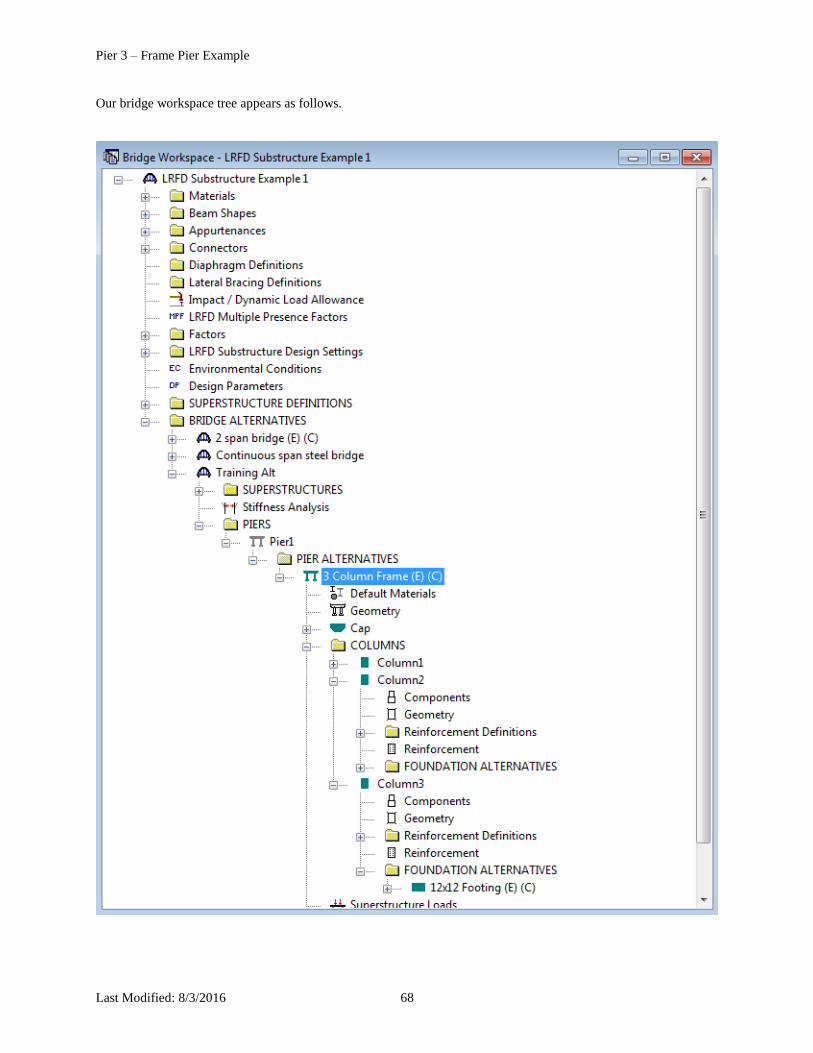
Our bridge workspace tree appears as follows.

Pier 3 – Frame Pier Example
Last Modified: 8/3/2016 69
Now that we have defined our pier geometry, we can re-open the Pier Alternative: Stiffness tab and evaluate the
slenderness of our pier.
BrD computes the KL/r ratios for the pier longitudinal and transverse axes based on the pier alternative geometry
we’ve input. We can independently evaluate these KL/r ratios in accordance with AASHTO LRFD Article 5.7.4.3
to determine if the first order elastic analysis performed by BrD is satisfactory for this pier.

Pier 3 – Frame Pier Example
Last Modified: 8/3/2016 70
Pier 3D Schematic
We can now view the 3D schematic of the pier alternative. Select the name of our pier alternative in the bridge
workspace tree. The 3D schematic can then be accessed by the “3D” button on the BrD Substructure toolbar shown
below.
This 3D schematic is a to-scale drawing of the pier alternative. This schematic view has a lot of useful features like
rotating, scaling, and dimensioning. Select F1 to open the BrD help topic for this window to review the features
available in this schematic window.
Pier 3 – Frame Pier Example
Last Modified: 8/3/2016 71
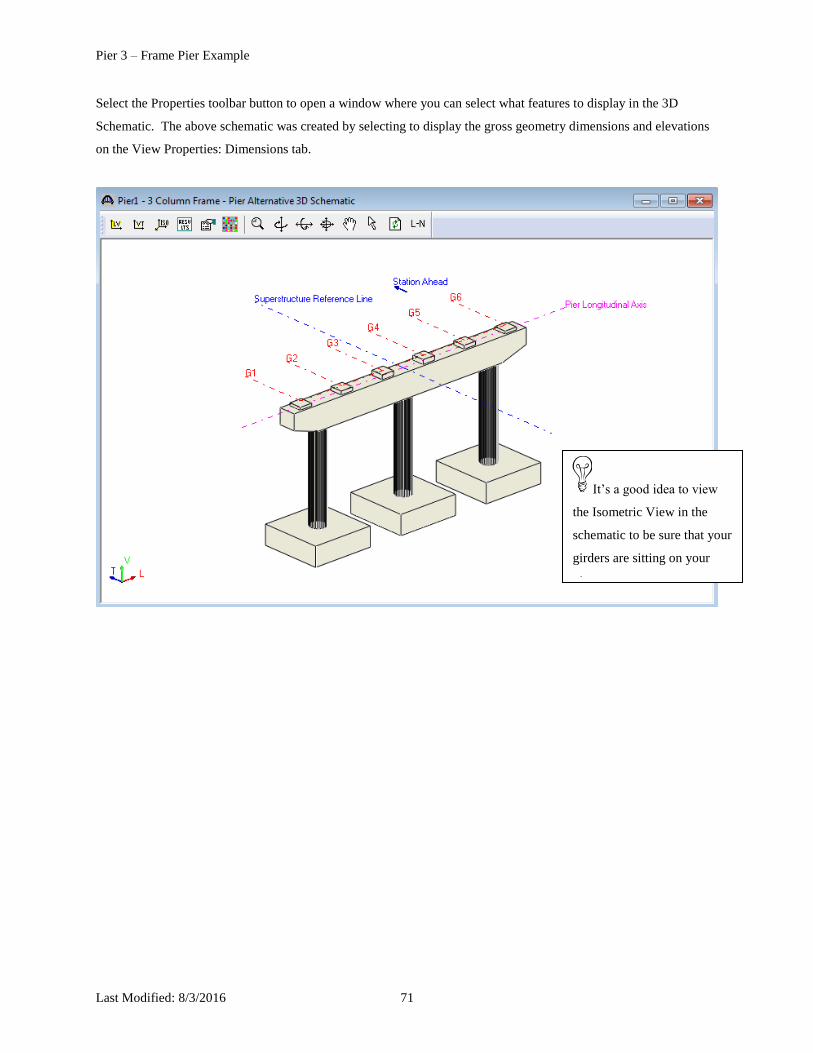
Select the Properties toolbar button to open a window where you can select what features to display in the 3D
Schematic. The above schematic was created by selecting to display the gross geometry dimensions and elevations
on the View Properties: Dimensions tab.
It’s a good idea to view
the Isometric View in the
schematic to be sure that your
girders are sitting on your
pier.

Pier 3 – Frame Pier Example
Last Modified: 8/3/2016 72
Validating a Pier Alternative
Another useful feature is to validate your pier alternative once you have the geometry defined. This will alert you to
any missing or incorrect data in your pier description. You can access the validation feature from the right-click
menu available when your pier alternative is selected in the bridge workspace tree.
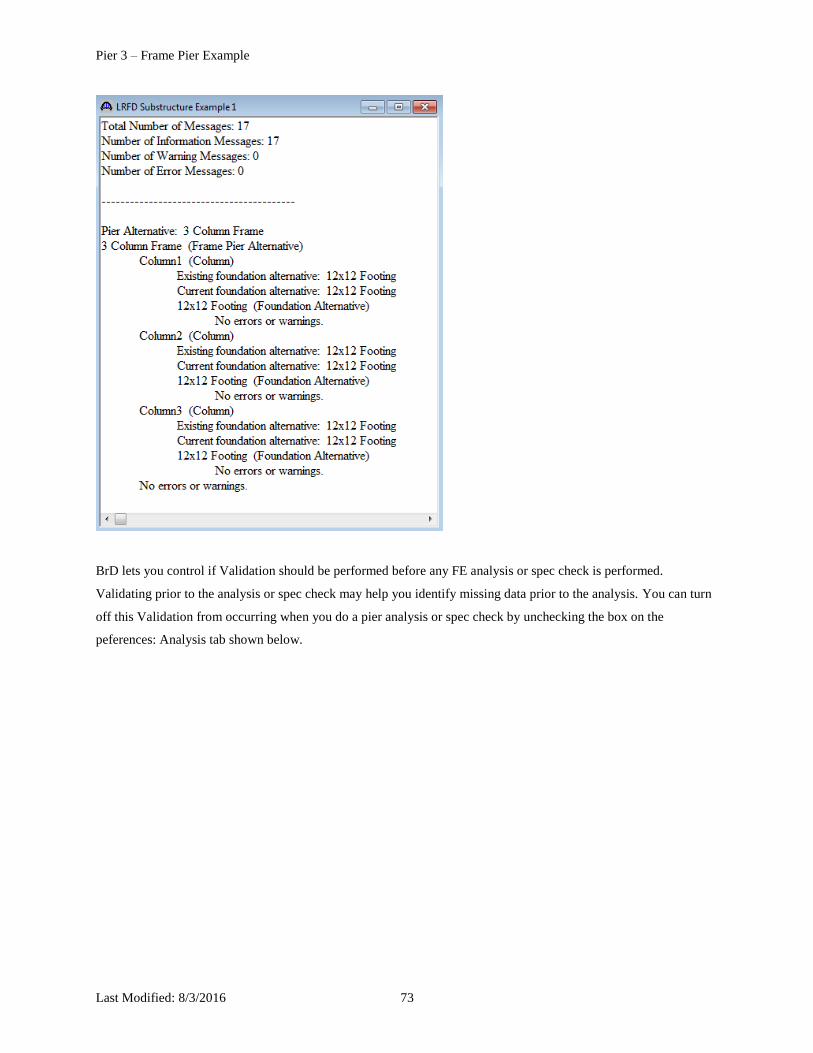
This opens a window which contains warnings and errors if your pier alternative description is in error or missing
data.
Pier 3 – Frame Pier Example
Last Modified: 8/3/2016 73
BrD lets you control if Validation should be performed before any FE analysis or spec check is performed.
Validating prior to the analysis or spec check may help you identify missing data prior to the analysis. You can turn
off this Validation from occurring when you do a pier analysis or spec check by unchecking the box on the
peferences: Analysis tab shown below.

Pier 3 – Frame Pier Example
Last Modified: 8/3/2016 74

Pier 3 – Frame Pier Example
Last Modified: 8/3/2016 75
Pier 3 – Frame Pier Example – Topic 3
This topic is the third of four in a series describing the entry and analysis of a reinforced concrete multi-column
frame pier in BrD Substructure. In this example, a two span continuous steel superstructure is supported by a 3
column frame pier.
Example features:
Reinforced concrete, three column frame pier, spread footings
Pier skew – 0 degrees
Specification checking of reinforcement
Items covered in this series:
Topic 1:
BrD Substructure Capabilities
Locating Substructure Units
Topic 2:
Bridge Data Related to Piers
Pier Alternatives
Pier Geometry
Pier Reinforcement
Pier 3D Schematic
Validating a Pier Alternative
Topic 3:
Superstructure Loads
Superstructure Environmental Loads
Substructure Loads
Load Calculation Reports
Topic 4:
BrD Substructure Toolbar
Finite Element Model
Pier Analysis
Viewing Results in 3D Schematic
Specification Checks
Footing Analysis
Tabular Results
Additional Reports

Pier 3 – Frame Pier Example
Last Modified: 8/3/2016 76
Note: You must complete Topics 1 and 2 in the series before you can enter this topic. It is assumed that users are
familiar with the BrD Superstructure module and as such this example does not go into detail describing BrD
Superstructure windows or bridge workspace navigation.

Pier 3 – Frame Pier Example
Last Modified: 8/3/2016 77
Superstructure Loads
We are now ready to describe the loads acting on the pier. The first thing to review is the following axis convention
that is used for the superstructure and pier axes.
Superstructure reference line
Pier Skew Angle
NegativePositive
Superstructure longitudinal axis
Superstructure transverse axis
Pier transverse axis
Pier longitudinal axis
Stations Ahead
Ahead SpanBack Span
Open the Superstructure Loads window.
Please note that you do not have to open any of
these Load windows to do a pier analysis or spec
check. We are going to review each Load window
as part of this training exercise but you can always
initiate a pier analysis and spec check directly from
the toolbar without ever opening these Load
windows. BrD will compute the loads for you as part
of the analysis and spec check.

Pier 3 – Frame Pier Example
Last Modified: 8/3/2016 78

Pier 3 – Frame Pier Example
Last Modified: 8/3/2016 79
The first thing you will see is the following dialog.
BrD computes some of the superstructure loads on the pier for you when the Superstructure Loads window is
opened. This dialog lists details about how BrD computes the loads and may contain warning and error messages.
This dialog always appears after BrD computes any loads for you. Click OK to close this window.
The Superstructure Loads window now appears as shown below.
If you try to open one of the Load
windows before you define the pier
geometry, you will get error messages
that the geometry needs to be defined.
The Load window will open but data
will be missing.
Pier 3 – Frame Pier Example
Last Modified: 8/3/2016 80
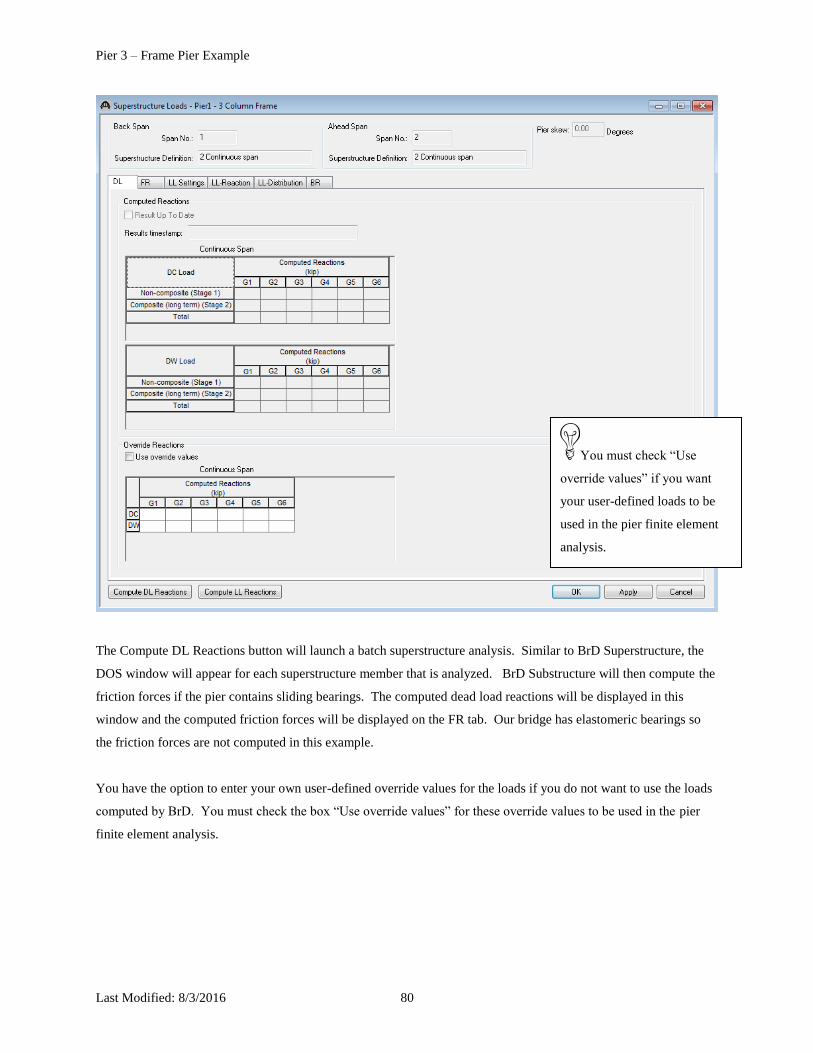
The Compute DL Reactions button will launch a batch superstructure analysis. Similar to BrD Superstructure, the
DOS window will appear for each superstructure member that is analyzed. BrD Substructure will then compute the
friction forces if the pier contains sliding bearings. The computed dead load reactions will be displayed in this
window and the computed friction forces will be displayed on the FR tab. Our bridge has elastomeric bearings so
the friction forces are not computed in this example.
You have the option to enter your own user-defined override values for the loads if you do not want to use the loads
computed by BrD. You must check the box “Use override values” for these override values to be used in the pier
finite element analysis.
You must check “Use
override values” if you want
your user-defined loads to be
used in the pier finite element
analysis.
Pier 3 – Frame Pier Example
Last Modified: 8/3/2016 81
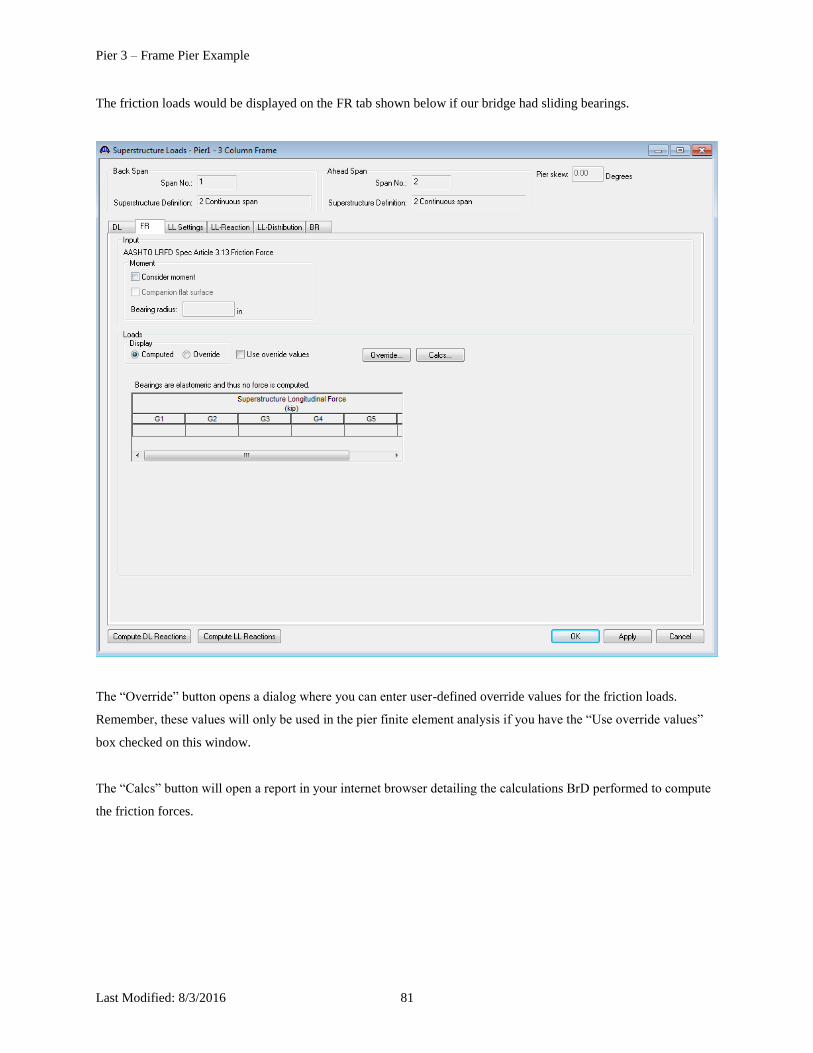
The friction loads would be displayed on the FR tab shown below if our bridge had sliding bearings.
The “Override” button opens a dialog where you can enter user-defined override values for the friction loads.
Remember, these values will only be used in the pier finite element analysis if you have the “Use override values”
box checked on this window.
The “Calcs” button will open a report in your internet browser detailing the calculations BrD performed to compute
the friction forces.

Pier 3 – Frame Pier Example
Last Modified: 8/3/2016 82
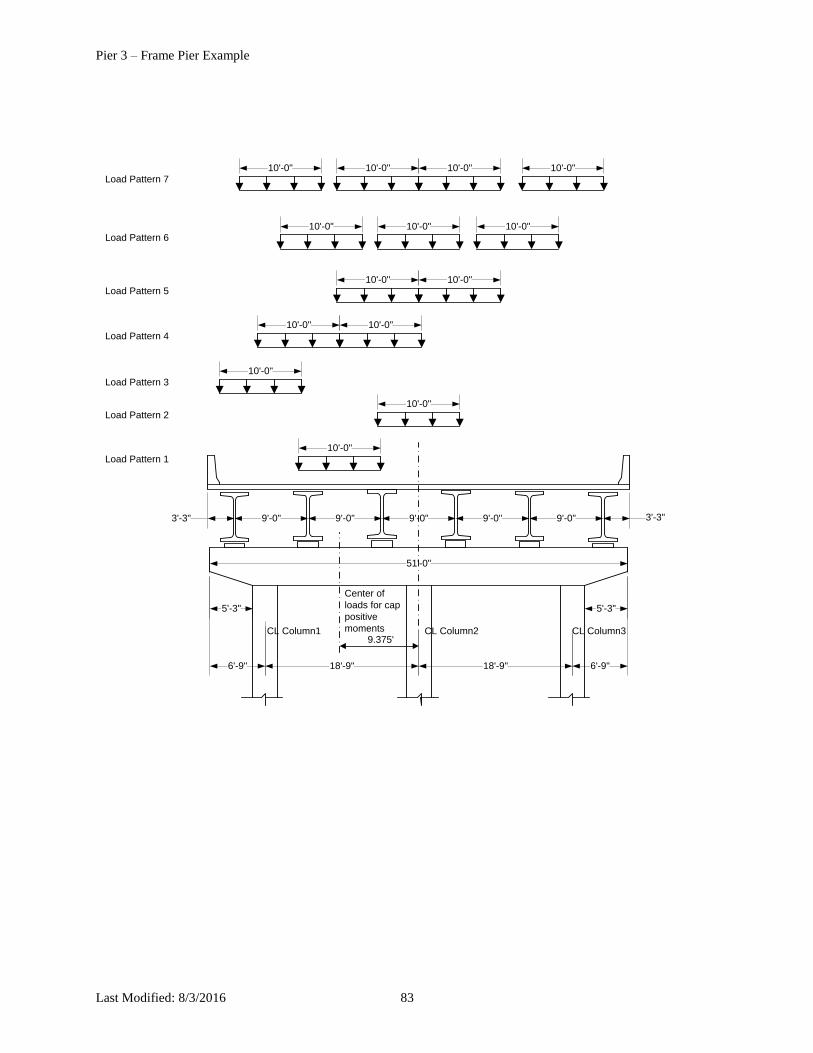
The LL Settings tab allows you to specify loading constraints for the transverse live load analysis.
Each transverse live load position is a load case in the finite element analysis. The data you enter on this tab can
greatly affect the time required for analysis. If you have a wide travelway and small values for the vehicle
increment and lane increment, the analysis will take a longer time than if you had larger values for the vehicle and
lane increment. Likewise, checking the box to move the vehicles from right to left across the travelway will double
the number of live load cases in the pier finite element analysis. If scan for controlling load positions is not checked,
the analysis will check all of the live load positions you defined. If you select user defined lanes as live loading type
you will be able to create your own load patterns at the bottom. We will create our own load patterns in this
example.
The settings on this tab
greatly affect the time
required for a pier analysis.
Pier 3 – Frame Pier Example
Last Modified: 8/3/2016 83
51'-0"
18'-9"
5'-3"
6'-9"
CL Column1 CL Column2 CL Column3
18'-9" 6'-9"
5'-3"
3'-3" 3'-3"9'-0" 9'-0" 9'-0" 9'-0" 9'-0"
10'-0"
10'-0"
9.375'
10'-0"
Load Pattern 1
Load Pattern 2
Load Pattern 3
10'-0"10'-0"Load Pattern 4
10'-0"10'-0"Load Pattern 5
10'-0"10'-0" 10'-0"Load Pattern 6
10'-0"10'-0" 10'-0"10'-0"Load Pattern 7
Center of
loads for cap
positive
moments
Pier 3 – Frame Pier Example
Last Modified: 8/3/2016 84
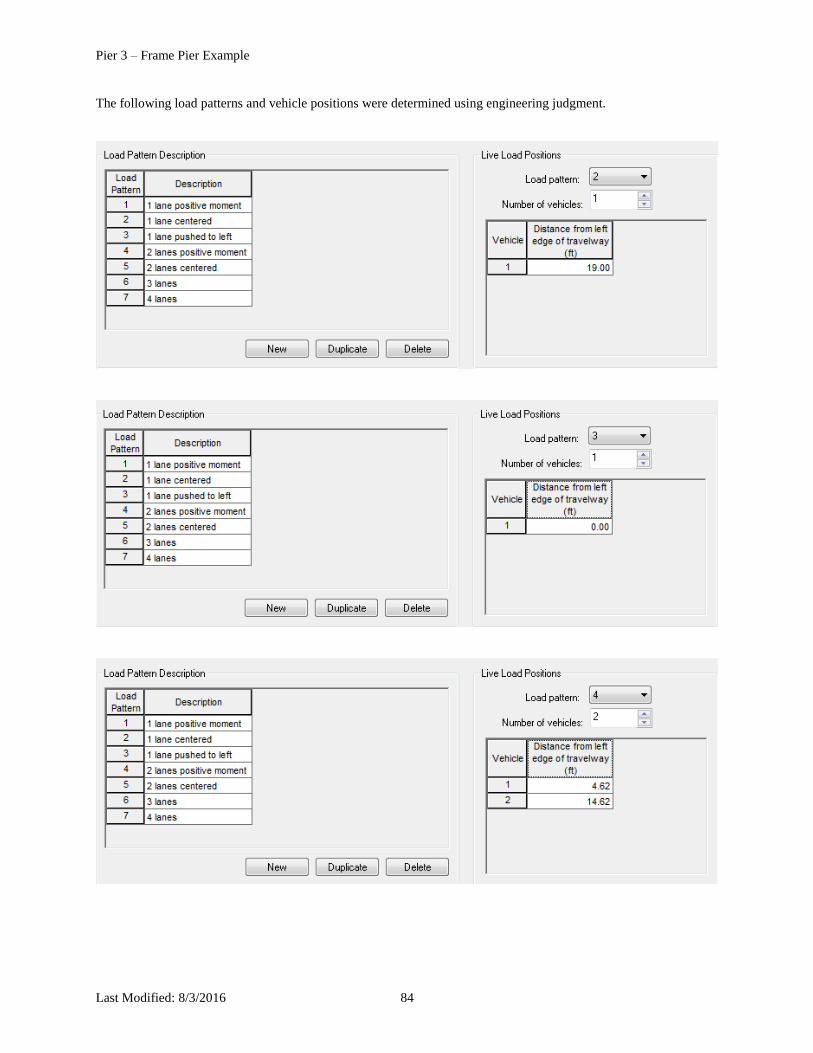
The following load patterns and vehicle positions were determined using engineering judgment.

Pier 3 – Frame Pier Example
Last Modified: 8/3/2016 85
Pier 3 – Frame Pier Example
Last Modified: 8/3/2016 86
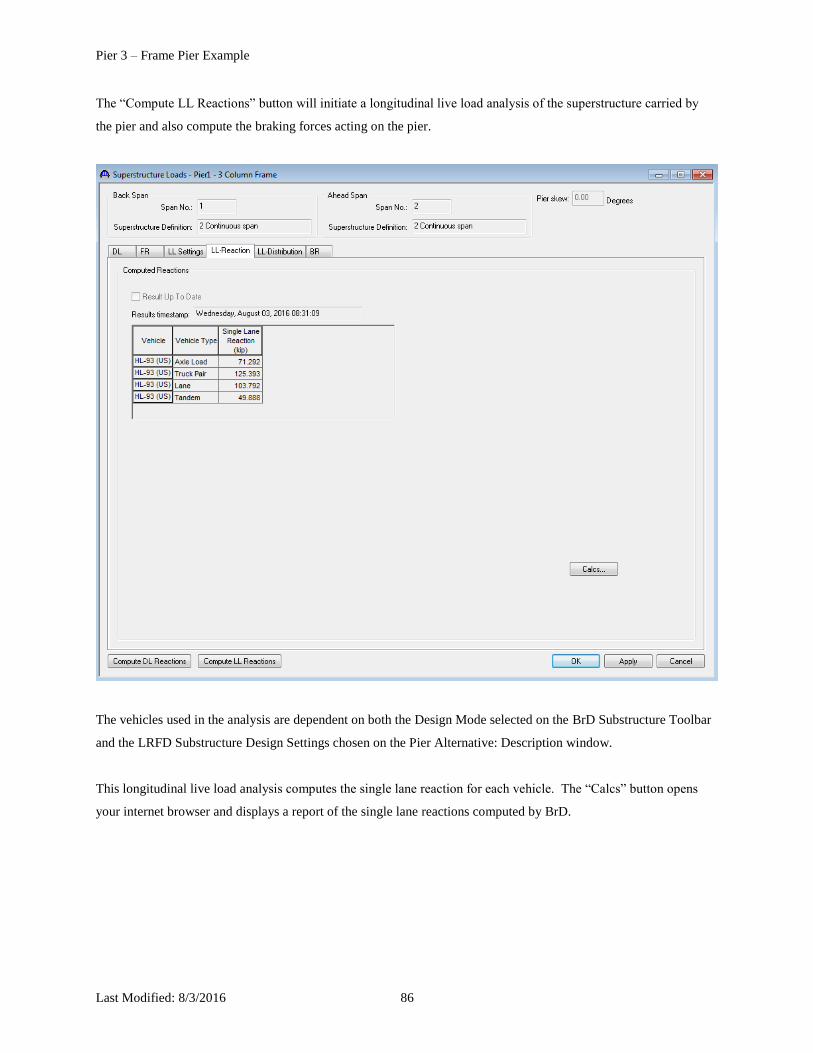
The “Compute LL Reactions” button will initiate a longitudinal live load analysis of the superstructure carried by
the pier and also compute the braking forces acting on the pier.
The vehicles used in the analysis are dependent on both the Design Mode selected on the BrD Substructure Toolbar
and the LRFD Substructure Design Settings chosen on the Pier Alternative: Description window.
This longitudinal live load analysis computes the single lane reaction for each vehicle. The “Calcs” button opens
your internet browser and displays a report of the single lane reactions computed by BrD.

Pier 3 – Frame Pier Example
Last Modified: 8/3/2016 87
The LL-Distribution tab allows you to view the BrD computed live load reactions distributed for a pier analysis or
enter your own user defined distributed live load reactions.
Pier 3 – Frame Pier Example
Last Modified: 8/3/2016 88
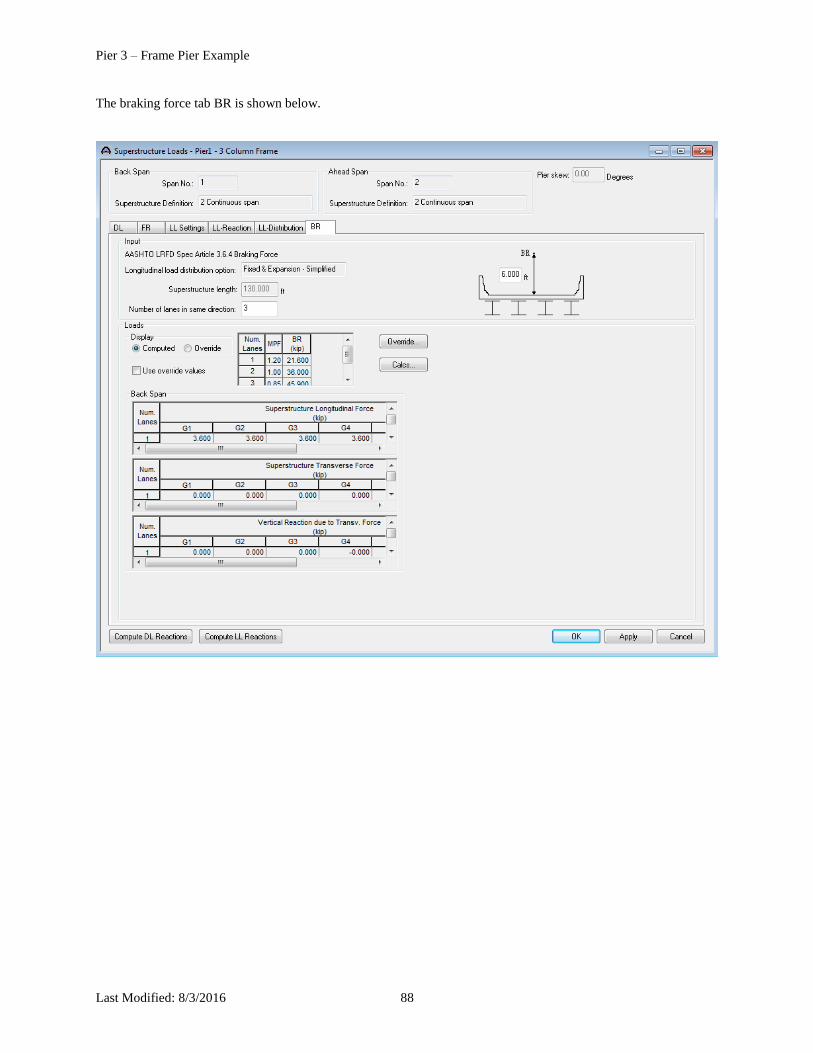
The braking force tab BR is shown below.

Pier 3 – Frame Pier Example
Last Modified: 8/3/2016 89
Superstructure Environmental Loads
Open the Superstructure Environmental Loads window as shown below.
The top of the screen displays values computed by BrD that are used to compute the wind on superstructure loads on
the pier and in some cases lets you override some of this data. The bottom of the screen displays loads on the
superstructure members for wind blowing from left to right. You will get a chance to specify which direction the
wind should blow in the actual pier finite element analysis in the Load Combination Settings window we will visit
later.

Pier 3 – Frame Pier Example
Last Modified: 8/3/2016 90
The overturning wind on superstructure load window is shown below.
Pier 3 – Frame Pier Example
Last Modified: 8/3/2016 91
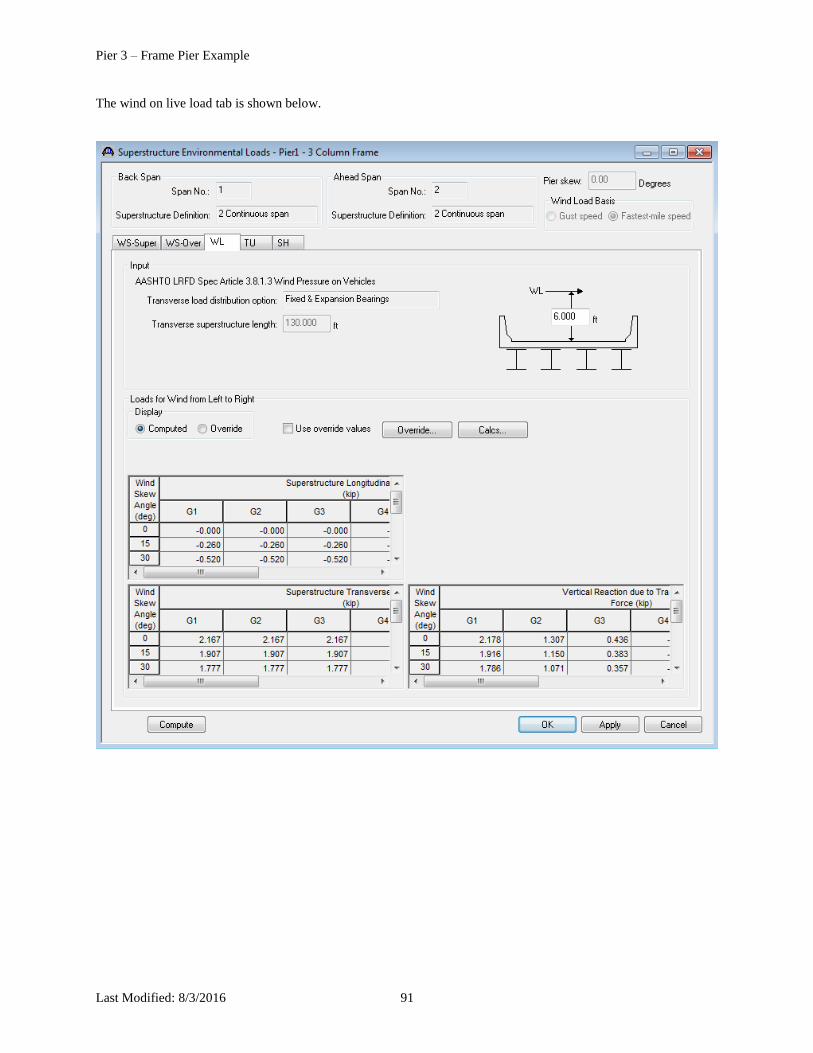
The wind on live load tab is shown below.
Pier 3 – Frame Pier Example
Last Modified: 8/3/2016 92
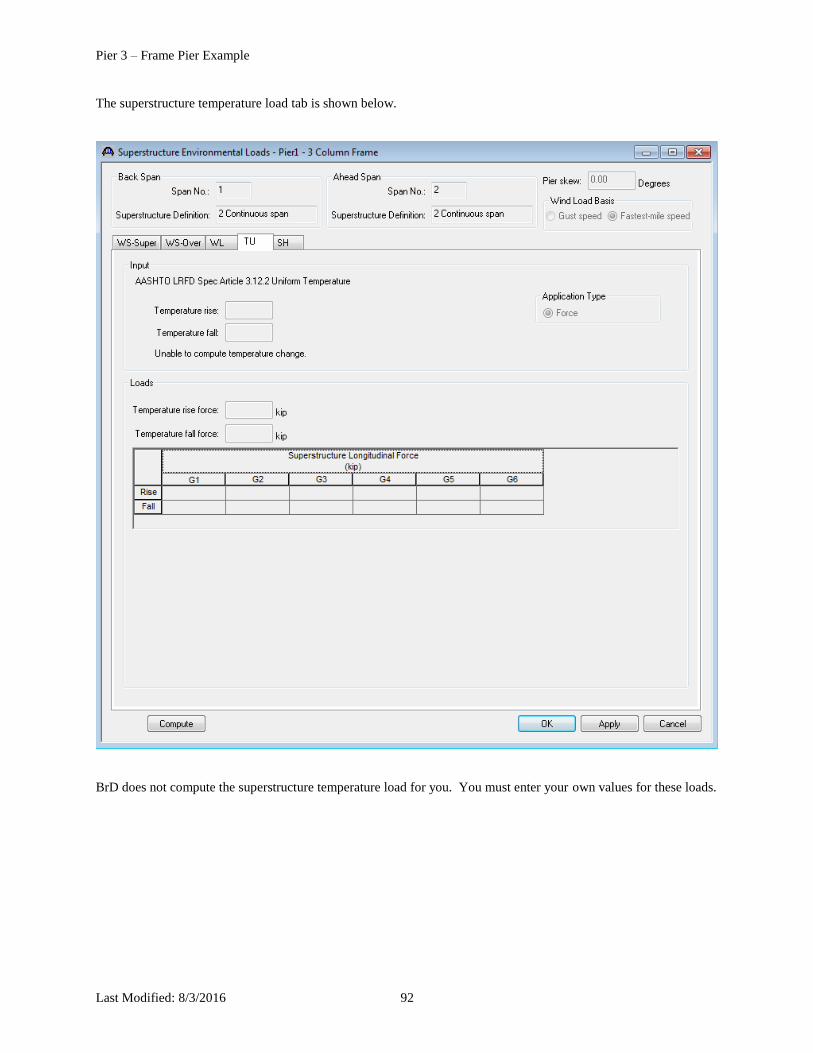
The superstructure temperature load tab is shown below.
BrD does not compute the superstructure temperature load for you. You must enter your own values for these loads.
Pier 3 – Frame Pier Example
Last Modified: 8/3/2016 93
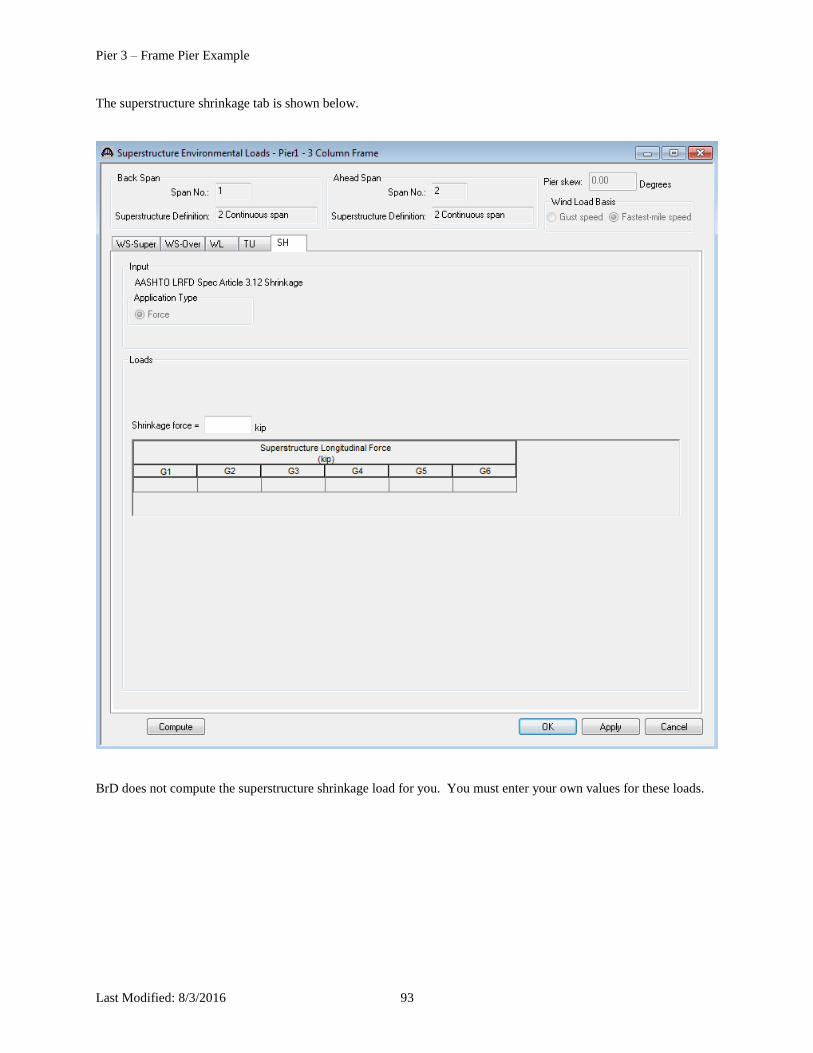
The superstructure shrinkage tab is shown below.
BrD does not compute the superstructure shrinkage load for you. You must enter your own values for these loads.
Pier 3 – Frame Pier Example
Last Modified: 8/3/2016 94
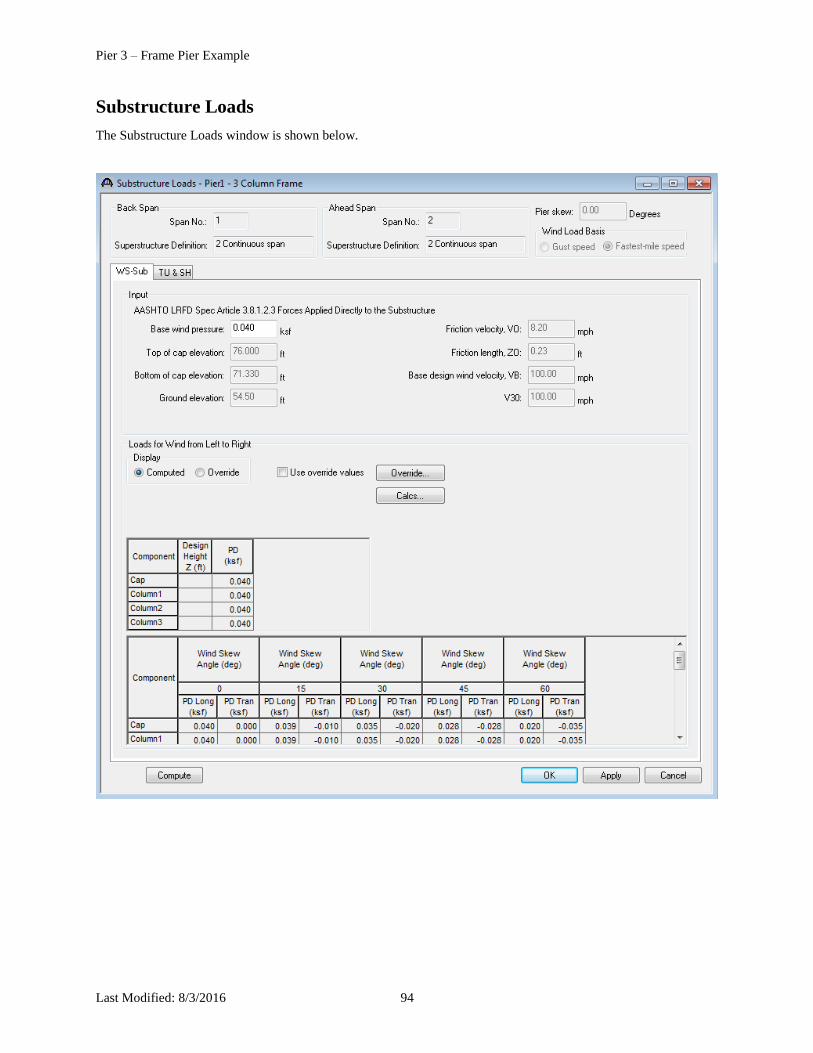
Substructure Loads
The Substructure Loads window is shown below.
Pier 3 – Frame Pier Example
Last Modified: 8/3/2016 95
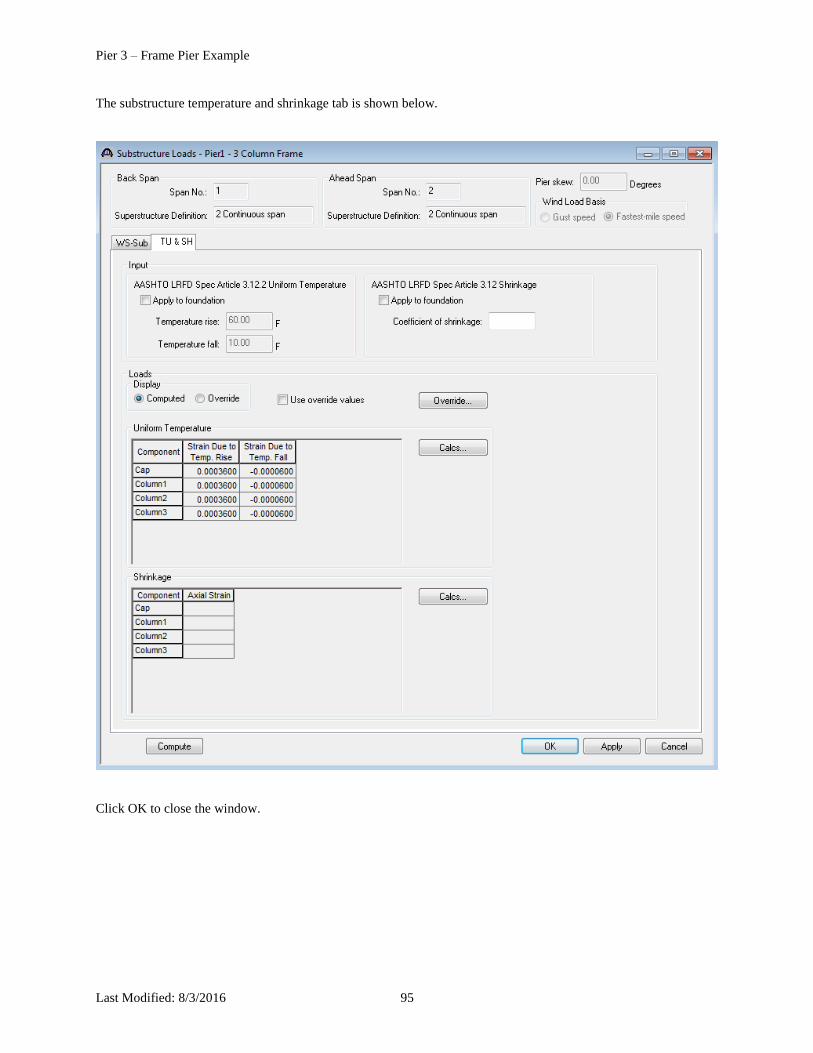
The substructure temperature and shrinkage tab is shown below.
Click OK to close the window.
Pier 3 – Frame Pier Example
Last Modified: 8/3/2016 96
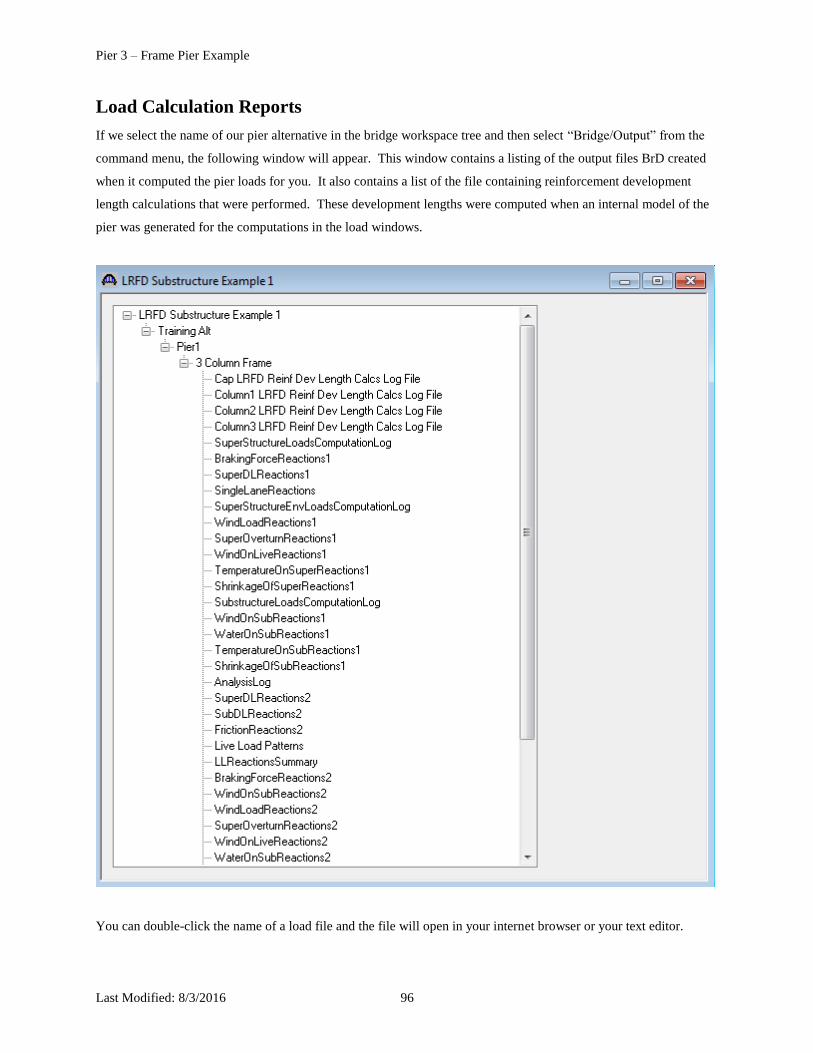
Load Calculation Reports
If we select the name of our pier alternative in the bridge workspace tree and then select “Bridge/Output” from the
command menu, the following window will appear. This window contains a listing of the output files BrD created
when it computed the pier loads for you. It also contains a list of the file containing reinforcement development
length calculations that were performed. These development lengths were computed when an internal model of the
pier was generated for the computations in the load windows.
You can double-click the name of a load file and the file will open in your internet browser or your text editor.

Pier 3 – Frame Pier Example
Last Modified: 8/3/2016 97
Pier 3 – Frame Pier Example – Topic 4
This topic is the fourth of four in a series describing the entry and analysis of a reinforced concrete multi-column
frame pier in BrD Substructure. In this example, a two span continuous steel superstructure is supported by a 3
column frame pier.
Example features:
Reinforced concrete, three column frame pier, spread footings
Pier skew – 0 degrees
Specification checking of reinforcement
Items covered in this series:
Topic 1:
BrD Substructure Capabilities
Locating Substructure Units
Topic 2:
Bridge Data Related to Piers
Pier Alternatives
Pier Geometry
Pier Reinforcement
Pier 3D Schematic
Validating a Pier Alternative
Topic 3:
Superstructure Loads
Superstructure Environmental Loads
Substructure Loads
Load Calculation Reports
Topic 4:
BrD Substructure Toolbar
Finite Element Model
Pier Analysis
Specification Checks
Footing Analysis
Tabular Results
Viewing Results in 3D Schematic
Additional Reports

Pier 3 – Frame Pier Example
Last Modified: 8/3/2016 98
Note: You must complete Topics 1, 2 and 3 in the series before you can enter this topic. It is assumed that users are
familiar with the BrD Superstructure module and as such this example does not go into detail describing BrD
Superstructure windows or bridge workspace navigation.
Pier 3 – Frame Pier Example
Last Modified: 8/3/2016 99
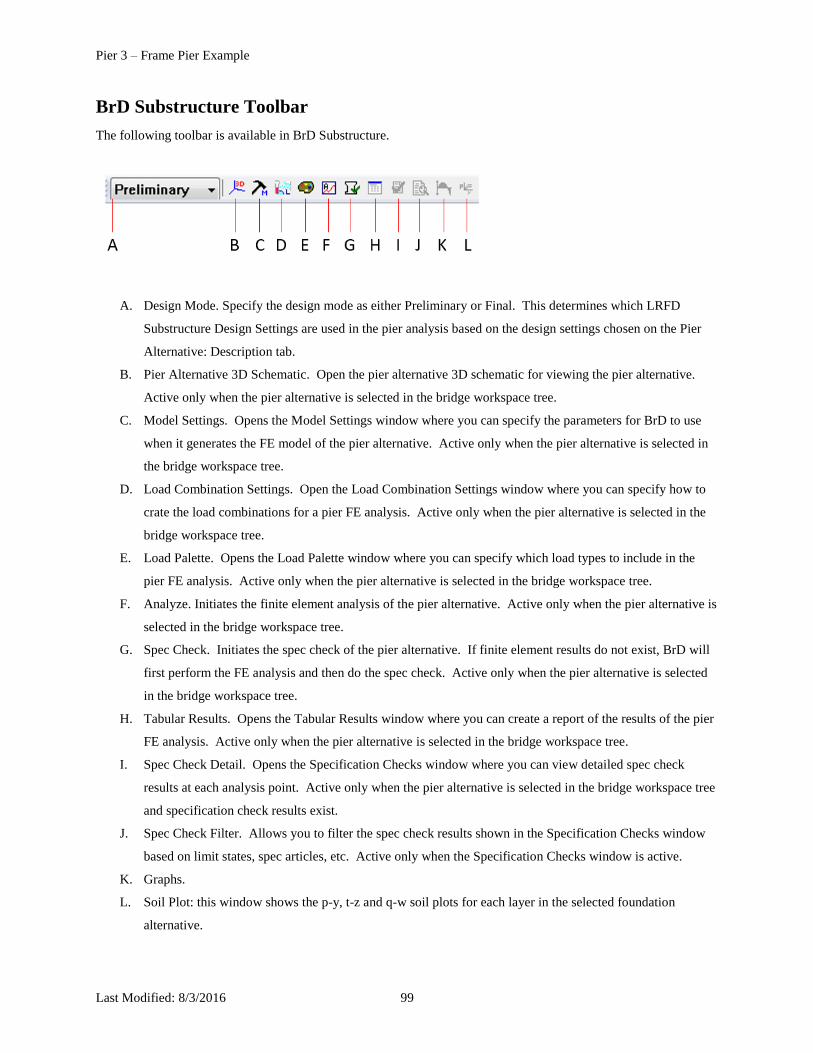
BrD Substructure Toolbar
The following toolbar is available in BrD Substructure.
A. Design Mode. Specify the design mode as either Preliminary or Final. This determines which LRFD
Substructure Design Settings are used in the pier analysis based on the design settings chosen on the Pier
Alternative: Description tab.
B. Pier Alternative 3D Schematic. Open the pier alternative 3D schematic for viewing the pier alternative.
Active only when the pier alternative is selected in the bridge workspace tree.
C. Model Settings. Opens the Model Settings window where you can specify the parameters for BrD to use
when it generates the FE model of the pier alternative. Active only when the pier alternative is selected in
the bridge workspace tree.
D. Load Combination Settings. Open the Load Combination Settings window where you can specify how to
crate the load combinations for a pier FE analysis. Active only when the pier alternative is selected in the
bridge workspace tree.
E. Load Palette. Opens the Load Palette window where you can specify which load types to include in the
pier FE analysis. Active only when the pier alternative is selected in the bridge workspace tree.
F. Analyze. Initiates the finite element analysis of the pier alternative. Active only when the pier alternative is
selected in the bridge workspace tree.
G. Spec Check. Initiates the spec check of the pier alternative. If finite element results do not exist, BrD will
first perform the FE analysis and then do the spec check. Active only when the pier alternative is selected
in the bridge workspace tree.
H. Tabular Results. Opens the Tabular Results window where you can create a report of the results of the pier
FE analysis. Active only when the pier alternative is selected in the bridge workspace tree.
I. Spec Check Detail. Opens the Specification Checks window where you can view detailed spec check
results at each analysis point. Active only when the pier alternative is selected in the bridge workspace tree
and specification check results exist.
J. Spec Check Filter. Allows you to filter the spec check results shown in the Specification Checks window
based on limit states, spec articles, etc. Active only when the Specification Checks window is active.
K. Graphs.
L. Soil Plot: this window shows the p-y, t-z and q-w soil plots for each layer in the selected foundation
alternative.
Pier 3 – Frame Pier Example
Last Modified: 8/3/2016 100
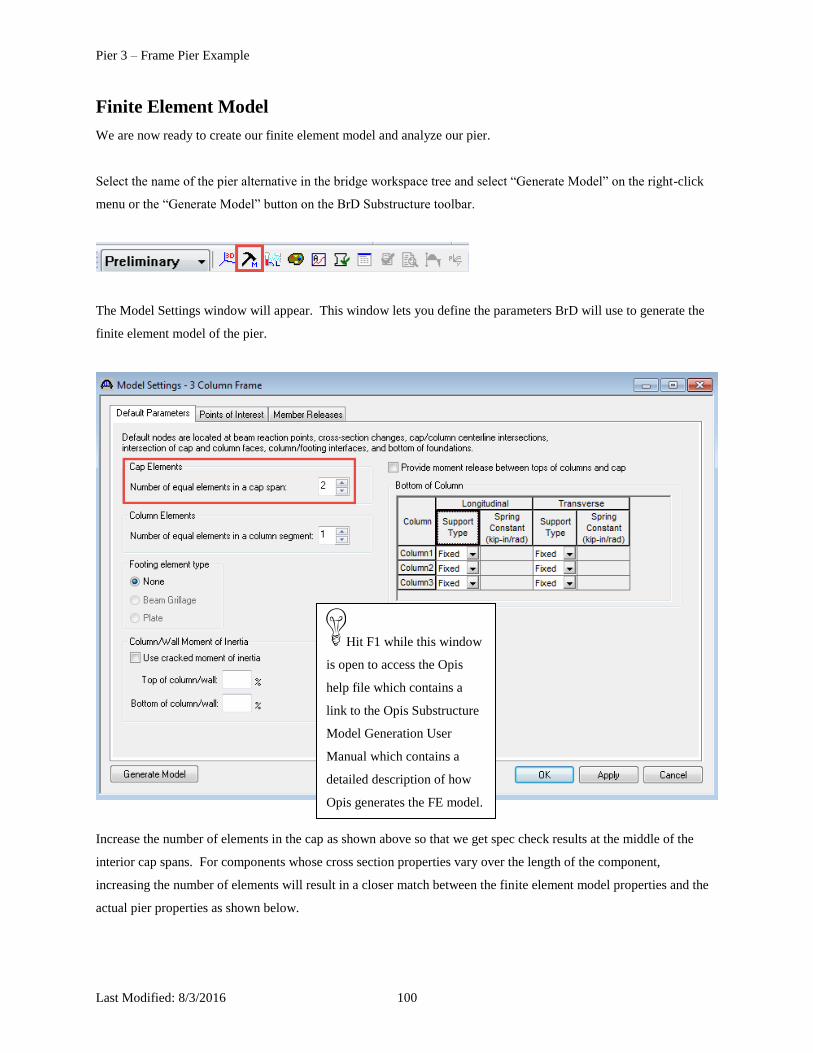
Finite Element Model
We are now ready to create our finite element model and analyze our pier.
Select the name of the pier alternative in the bridge workspace tree and select “Generate Model” on the right-click
menu or the “Generate Model” button on the BrD Substructure toolbar.
The Model Settings window will appear. This window lets you define the parameters BrD will use to generate the
finite element model of the pier.
Increase the number of elements in the cap as shown above so that we get spec check results at the middle of the
interior cap spans. For components whose cross section properties vary over the length of the component,
increasing the number of elements will result in a closer match between the finite element model properties and the
actual pier properties as shown below.
Hit F1 while this window
is open to access the Opis
help file which contains a
link to the Opis Substructure
Model Generation User
Manual which contains a
detailed description of how
Opis generates the FE model.
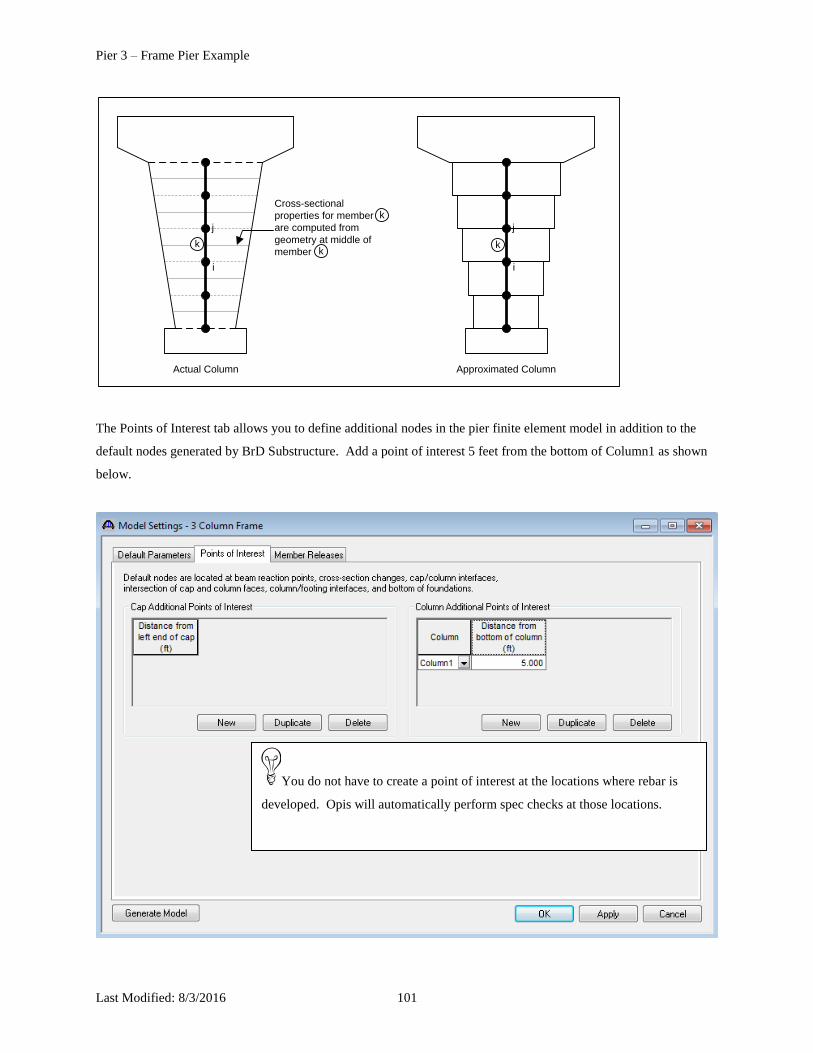
Pier 3 – Frame Pier Example
Last Modified: 8/3/2016 101
i
j
k
Cross-sectional
properties for member
are computed from
geometry at middle of
member
k
k
Actual Column Approximated Column
i
j
k
The Points of Interest tab allows you to define additional nodes in the pier finite element model in addition to the
default nodes generated by BrD Substructure. Add a point of interest 5 feet from the bottom of Column1 as shown
below.
You do not have to create a point of interest at the locations where rebar is
developed. Opis will automatically perform spec checks at those locations.
Pier 3 – Frame Pier Example
Last Modified: 8/3/2016 102
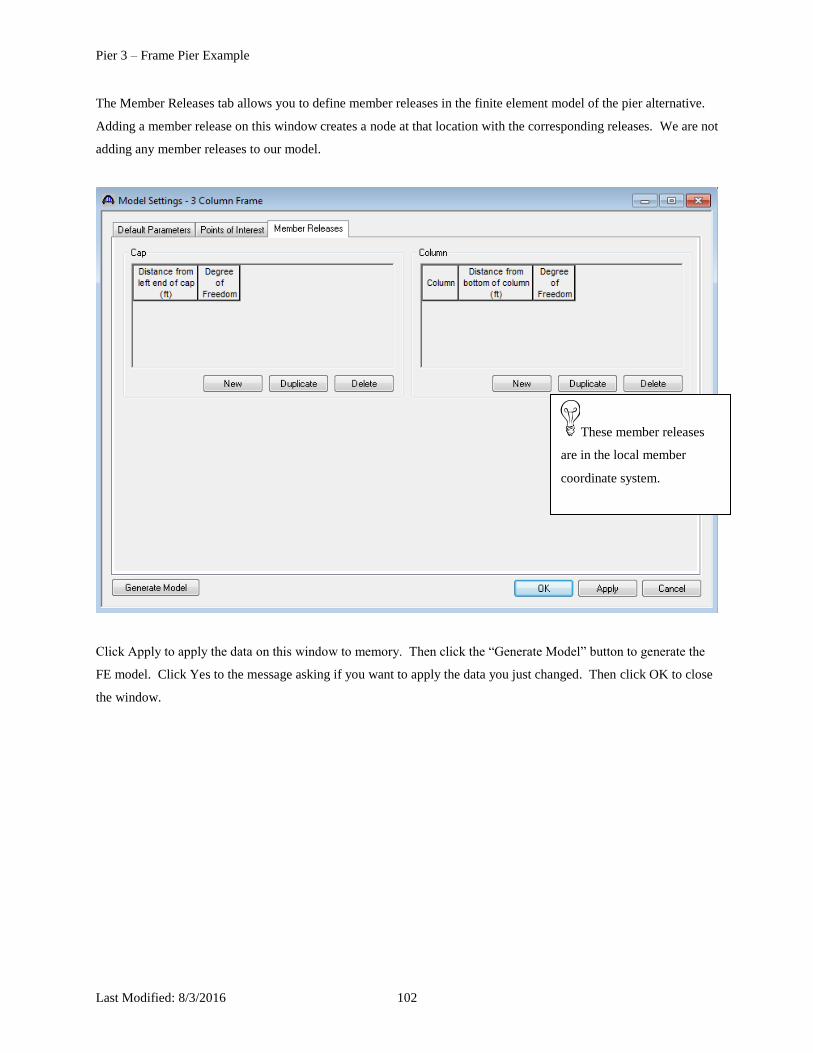
The Member Releases tab allows you to define member releases in the finite element model of the pier alternative.
Adding a member release on this window creates a node at that location with the corresponding releases. We are not
adding any member releases to our model.
Click Apply to apply the data on this window to memory. Then click the “Generate Model” button to generate the
FE model. Click Yes to the message asking if you want to apply the data you just changed. Then click OK to close
the window.
These member releases
are in the local member
coordinate system.
Pier 3 – Frame Pier Example
Last Modified: 8/3/2016 103
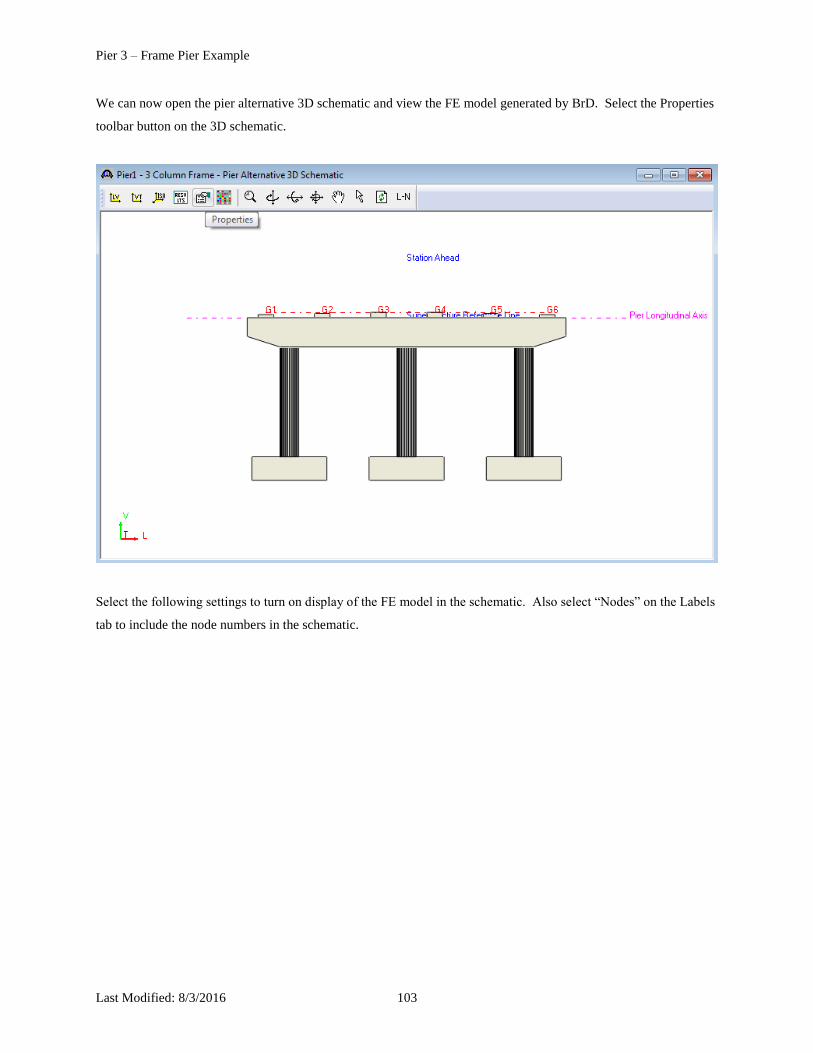
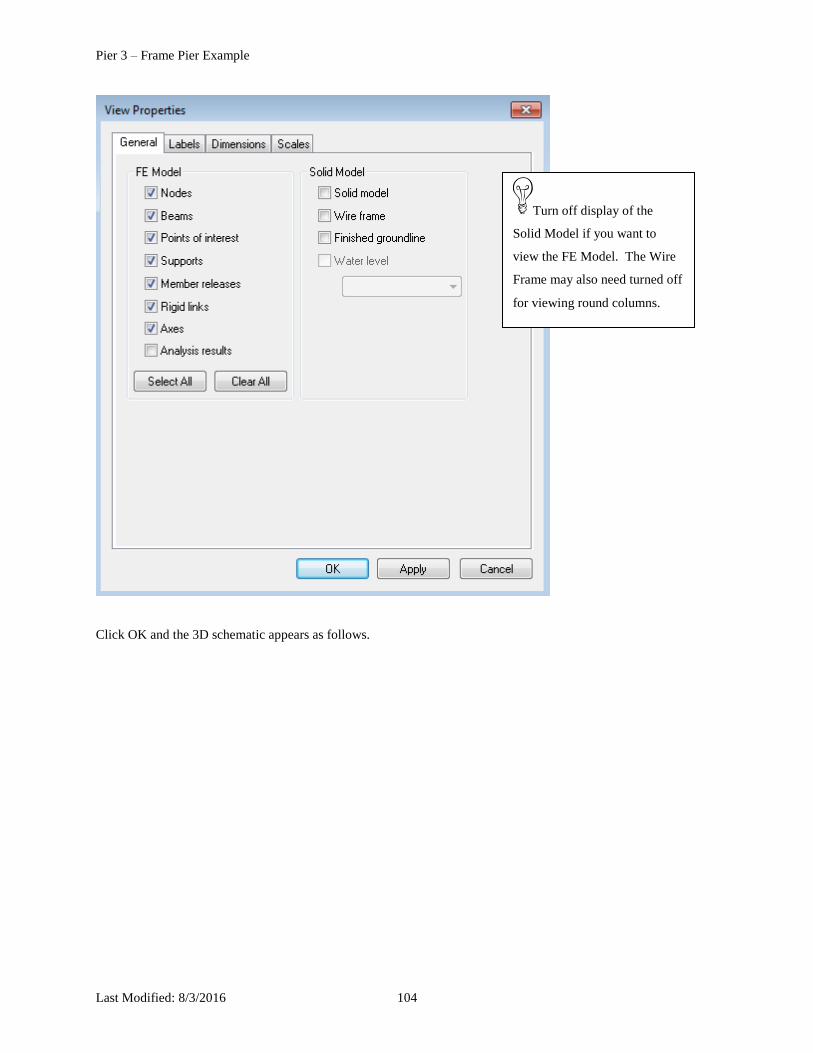
We can now open the pier alternative 3D schematic and view the FE model generated by BrD. Select the Properties
toolbar button on the 3D schematic.
Select the following settings to turn on display of the FE model in the schematic. Also select “Nodes” on the Labels
tab to include the node numbers in the schematic.
Pier 3 – Frame Pier Example
Last Modified: 8/3/2016 104
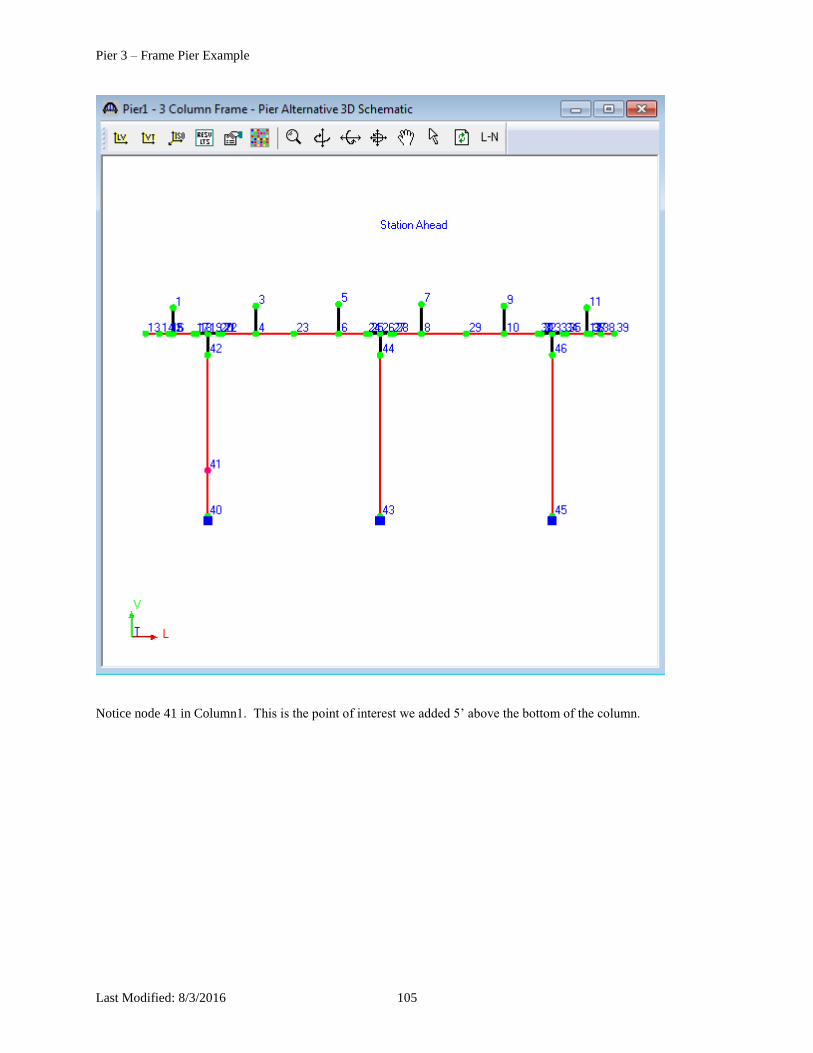
Click OK and the 3D schematic appears as follows.
Turn off display of the
Solid Model if you want to
view the FE Model. The Wire
Frame may also need turned off
for viewing round columns.
Pier 3 – Frame Pier Example
Last Modified: 8/3/2016 105
Notice node 41 in Column1. This is the point of interest we added 5’ above the bottom of the column.

Pier 3 – Frame Pier Example
Last Modified: 8/3/2016 106
Pier Analysis
We are now going to select the loads to be included in our analysis. Open the Load Combination Settings window
from the right-click menu for the pier alternative or from the BrD Substructure toolbar.
This window allows you to specify the load conditions to be considered when BrD performs the pier analysis. We
will use the following default selections.
It’s ok to keep the water levels turned
on even if your pier is not subject to all of
the water levels. The water levels will be
ignored if your pier is not subject to them.

Pier 3 – Frame Pier Example
Last Modified: 8/3/2016 107
Another window that allows you to specify the load types to be included in the pier analysis is the Load Palette
window. This window can be accessed by selecting the name of the pier alternative in the bridge workspace tree
and clicking the Load Palette in the BrD Substructure toolbar.
The Load Palette can be very useful when you want to evaluate individual load types on the pier and when you want
to minimize the time required for analysis.
If you do not check the “Use” box for a load type, that load type will not be included in the pier analysis nor in the
load combinations computed by BrD. Results for limit states that contain that load type will still be computed but
the loading for that load type will be missing.
It is ok to keep the “Use” box checked for load types that do not apply to your pier. They will be ignored if they do
not apply to your pier.
If you uncheck a
load type, the load
combinations for the
limit states containing
that load type will still
be computed but that
load type will have
zero loading.

Pier 3 – Frame Pier Example
Last Modified: 8/3/2016 108
Specification Checking
Now that we have our loads selected, we can analyze our pier and do a spec check.
Select “Spec Check” from the toolbar.
The Validation window will appear to alert you to any missing data. Click the Continue button to continue with the
spec check.
The Substructure Analysis Progress dialog will open as shown below. The FE analysis of the pier will occur first
followed by the specification check of the pier.
Review this log
file for errors and
warnings.
If the FE analysis results do not exist on your hard drive when you select to do a Spec
Check, Opis will perform the FE analysis automatically. The next time you want to do a Spec
Check, Opis will use the existing FE analysis results. This allows you to quickly fine tune
your reinforcement and geometry without re-doing the FE analysis every time. Once you find
reinforcement and geometry that satisfies the spec checks you can do a final FE analysis and
spec check.
Pier 3 – Frame Pier Example
Last Modified: 8/3/2016 109
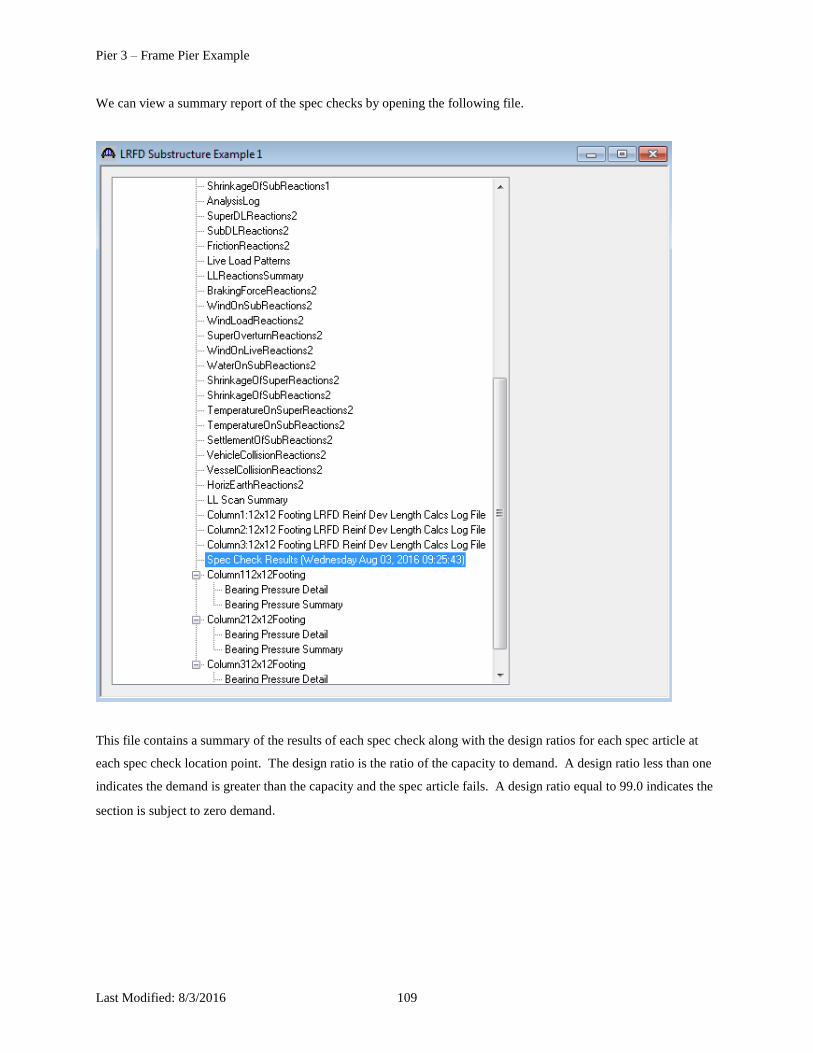
We can view a summary report of the spec checks by opening the following file.
This file contains a summary of the results of each spec check along with the design ratios for each spec article at
each spec check location point. The design ratio is the ratio of the capacity to demand. A design ratio less than one
indicates the demand is greater than the capacity and the spec article fails. A design ratio equal to 99.0 indicates the
section is subject to zero demand.
Pier 3 – Frame Pier Example
Last Modified: 8/3/2016 110
The specification checks can be viewed by selecting the “Spec Check Detail” button.
BrD performs spec checks at each node in the finite element model along with locations where the reinforcement is
developed and at a distance dv from the face of each column.
Open the spec check detail window for the flexural resistance at the center of the first interior span of the cap at
16.13’.
The following is noted for this window, other spec articles are similar:
1. For each spec check location, both the left and right sides of the point are evaluated.The design ratio is
printed out for the article. The design ratio is the ratio of capacity to demand. A design ratio less than one
indicates the demand is greater than the capacity and the spec article fails. A design ratio equal to 99.0
indicates the section is subject to zero demand.
2. The user has control over which limit states are investigated. For our example we are using the Preliminary
Design Mode and the default Preliminary Design Setting only contains the Strength-I limit state. For each
limit state, the max and min force effect is checked. Thus each limit state shows two rows of data.
3. The LL load combination is shown in this column. If the location is not at a node in the FE model (eg, the
node is at a point where the rebar is fully developed), this column will list two load combinations separated

Pier 3 – Frame Pier Example
Last Modified: 8/3/2016 111
by a comma. The first load combination is the combination considered at the left end and the second load
combination is the combination considered at the right end of the FE element that contains this location.
The resulting load displayed is a linear interpolation between the two displayed load cases.
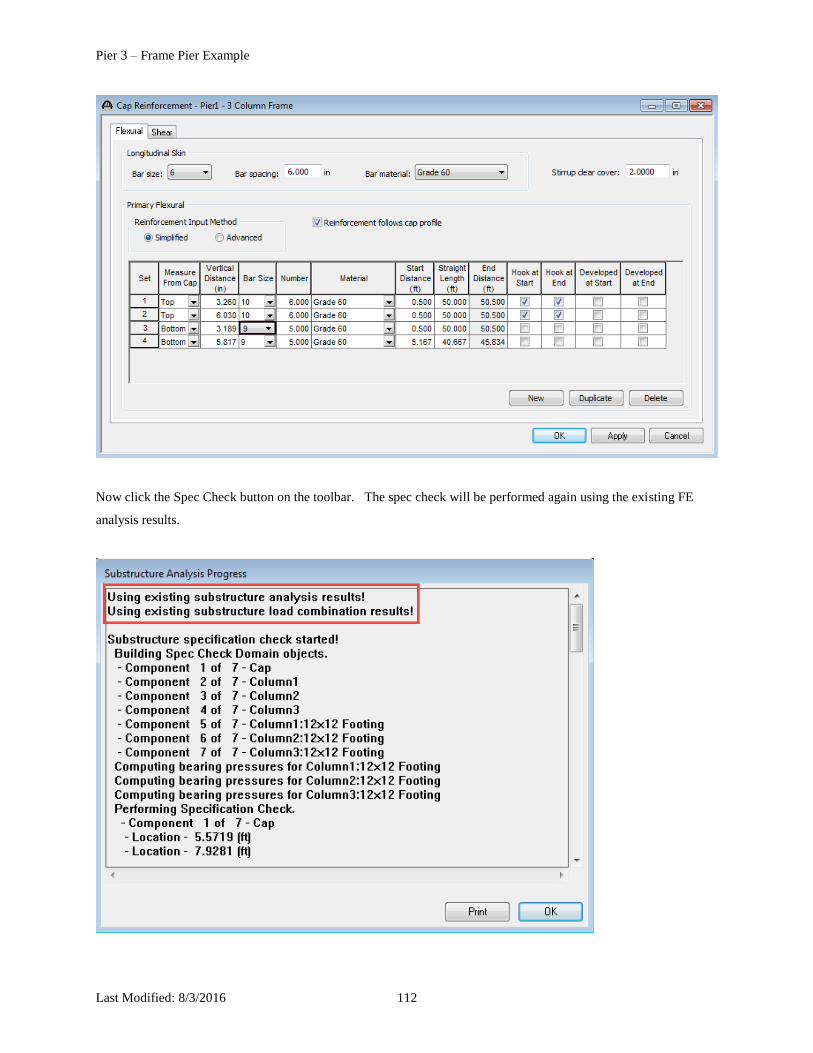
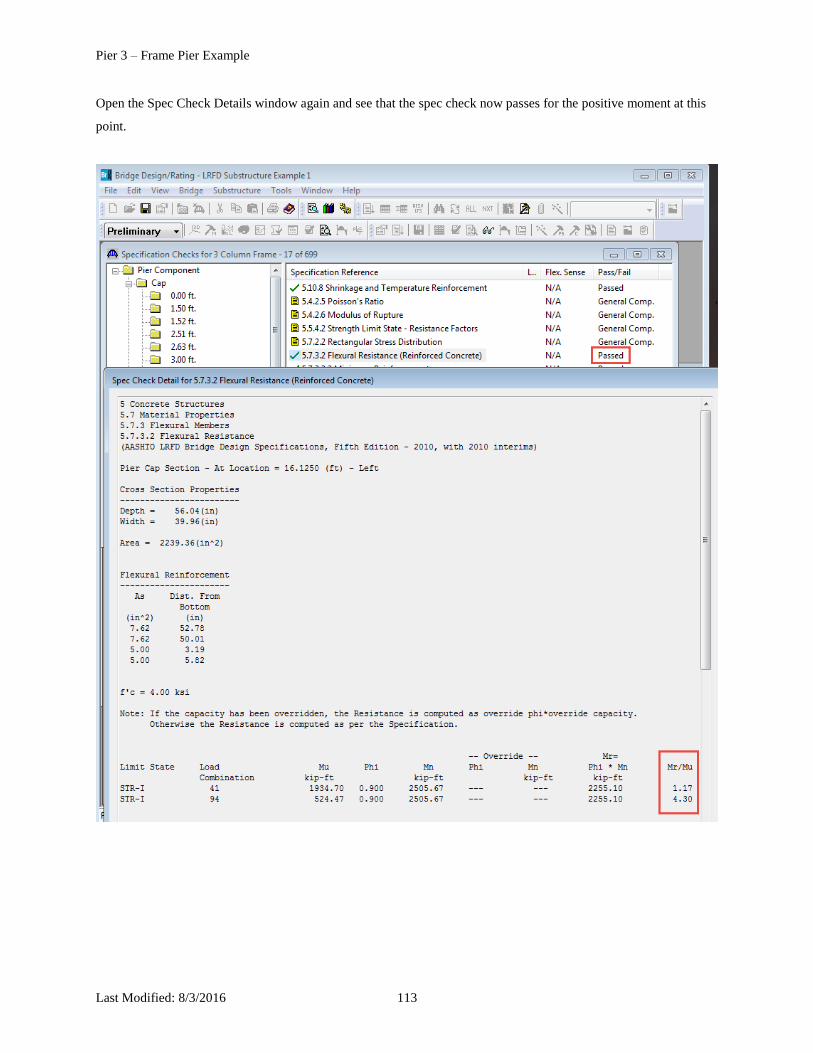
The critical design ratio for positive moment at this point is 0.67 which is less than 1.0 so the spec check fails. Let’s
go back to the Cap Reinforcement window and revise the cap reinforcement from a #3 bar to a #9 bar. Click OK to
close the window.
Pier 3 – Frame Pier Example
Last Modified: 8/3/2016 112
Now click the Spec Check button on the toolbar. The spec check will be performed again using the existing FE
analysis results.
Pier 3 – Frame Pier Example
Last Modified: 8/3/2016 113
Open the Spec Check Details window again and see that the spec check now passes for the positive moment at this
point.

Pier 3 – Frame Pier Example
Last Modified: 8/3/2016 114
Footing Analysis
BrD Substructure has the ability to analyze both individual and combined footings. Both spread and pile footings are
supported. Specification checks at the critical locations in the footing are then performed.
The footing analysis and spec check occurs when the Spec Check is performed on the pier. BrD determines the
forces in the footing using the bottom of column forces from the finite element analysis along with the soil and
footing loads.
The following file containing the footing calculations is available after the spec check is performed.
Pier 3 – Frame Pier Example
Last Modified: 8/3/2016 115
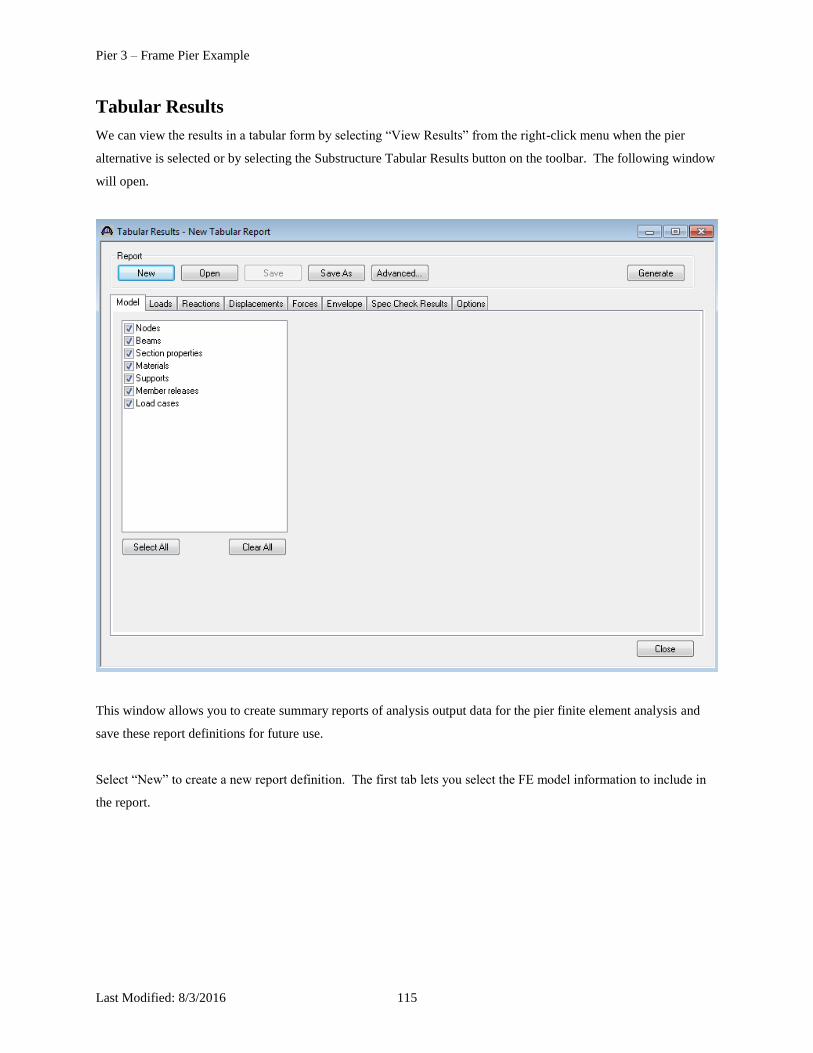
Tabular Results
We can view the results in a tabular form by selecting “View Results” from the right-click menu when the pier
alternative is selected or by selecting the Substructure Tabular Results button on the toolbar. The following window
will open.
This window allows you to create summary reports of analysis output data for the pier finite element analysis and
save these report definitions for future use.
Select “New” to create a new report definition. The first tab lets you select the FE model information to include in
the report.
Pier 3 – Frame Pier Example
Last Modified: 8/3/2016 116
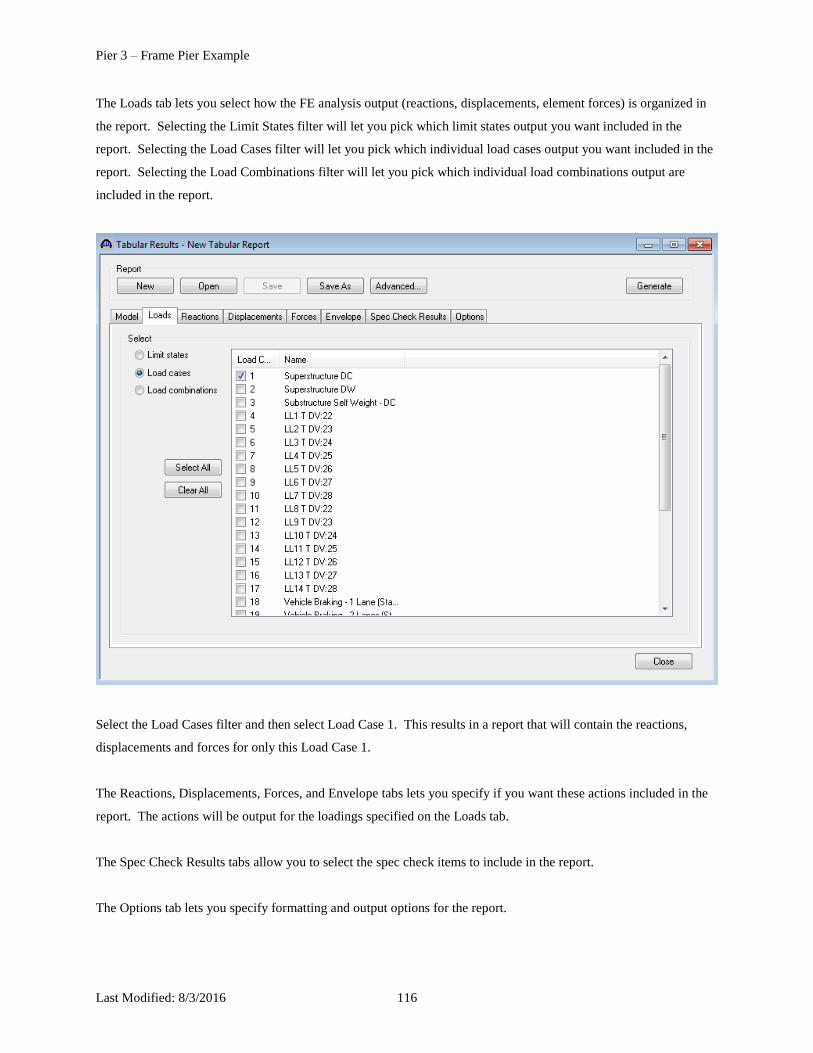
The Loads tab lets you select how the FE analysis output (reactions, displacements, element forces) is organized in
the report. Selecting the Limit States filter will let you pick which limit states output you want included in the
report. Selecting the Load Cases filter will let you pick which individual load cases output you want included in the
report. Selecting the Load Combinations filter will let you pick which individual load combinations output are
included in the report.
Select the Load Cases filter and then select Load Case 1. This results in a report that will contain the reactions,
displacements and forces for only this Load Case 1.
The Reactions, Displacements, Forces, and Envelope tabs lets you specify if you want these actions included in the
report. The actions will be output for the loadings specified on the Loads tab.
The Spec Check Results tabs allow you to select the spec check items to include in the report.
The Options tab lets you specify formatting and output options for the report.

Pier 3 – Frame Pier Example
Last Modified: 8/3/2016 117
If we wanted to save the settings on these tabs as a report definition that we can re-use in the future, we could select
the “Save As” button. This would save the settings on these tabs as a report definition file. It would not save the FE
analysis output report for this pier.
Select the Generate button to view the FE analysis output report for this pier in your internet browser. An xml file
containing the data for this report is created and given the name “New Tabular Report.xml”. This file is located in
the subdirectory for this pier which was created under the directory where BrD Substructure is installed. This file is
overwritten each time you select the Generate button. You can rename this file to something else in Windows
Explorer if you want to save these results.
Pier 3 – Frame Pier Example
Last Modified: 8/3/2016 118
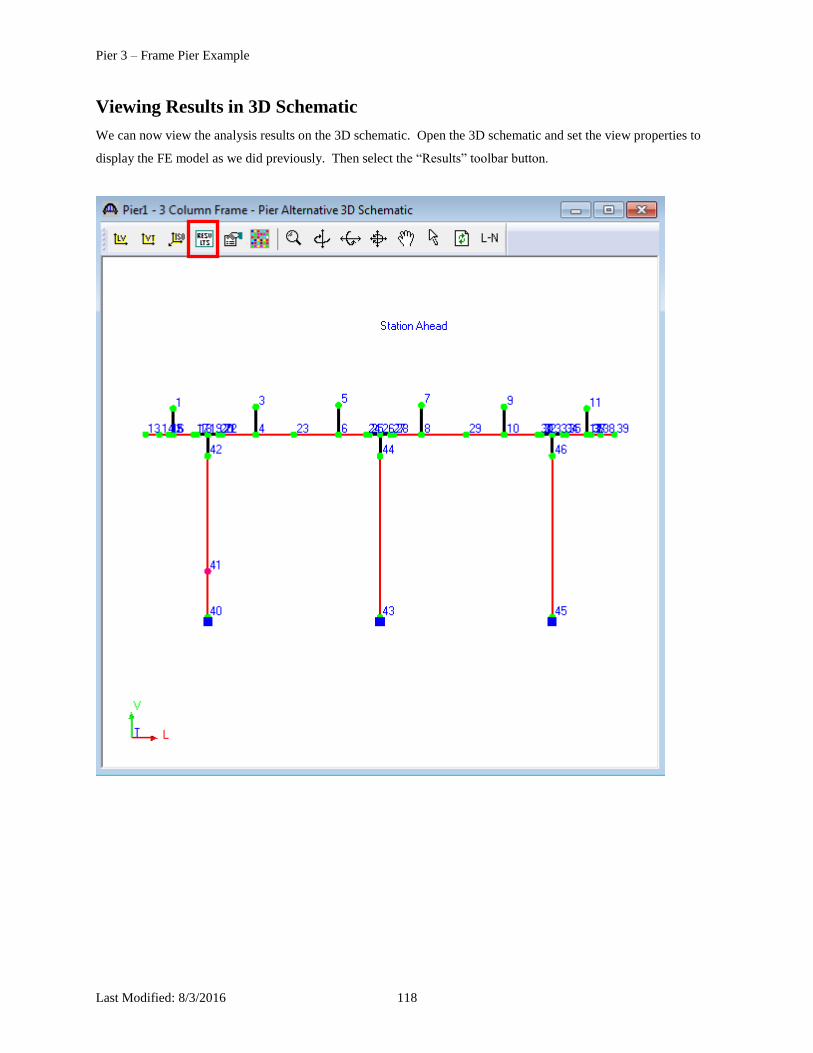
Viewing Results in 3D Schematic
We can now view the analysis results on the 3D schematic. Open the 3D schematic and set the view properties to
display the FE model as we did previously. Then select the “Results” toolbar button.
Pier 3 – Frame Pier Example
Last Modified: 8/3/2016 119
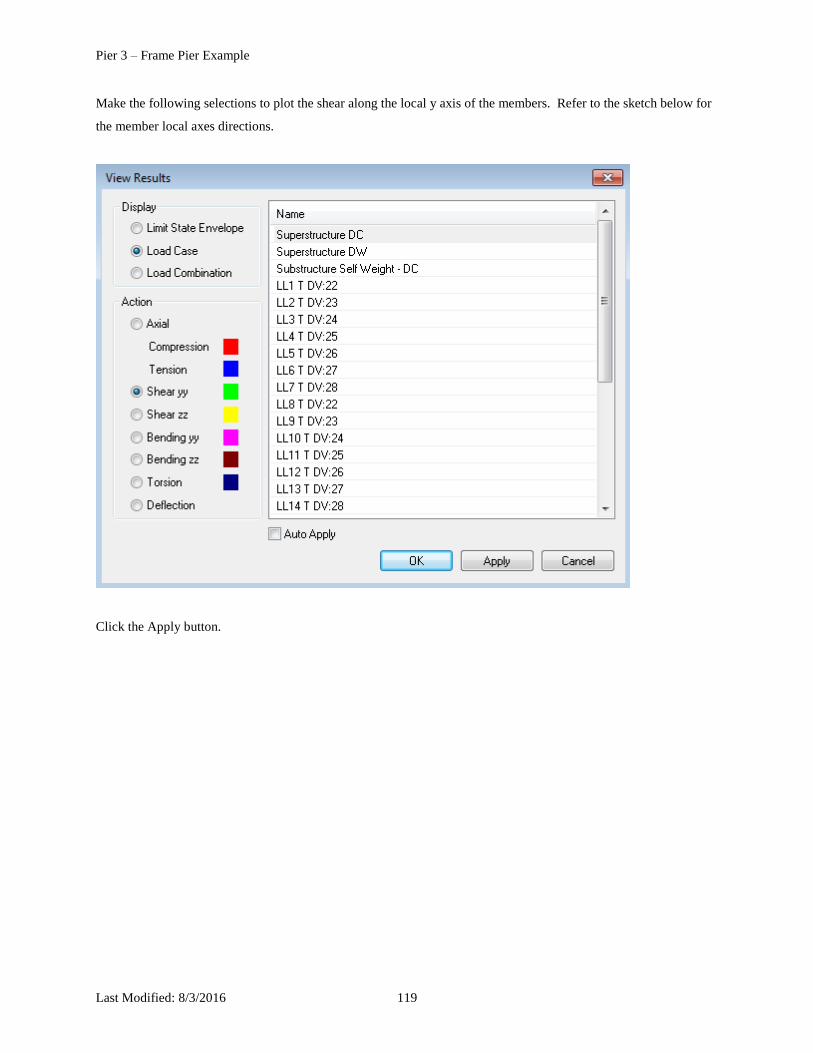
Make the following selections to plot the shear along the local y axis of the members. Refer to the sketch below for
the member local axes directions.
Click the Apply button.

Pier 3 – Frame Pier Example
Last Modified: 8/3/2016 120
Superstructure Longitudinal Axis
Pier Longitudinal Axis
Pier Transverse Axis
Superstructure Transverse Axis
Substructure Unit Reference Point
Superstructure Reference Line
L
V
T
Global Pier
Coordinate System
Sta
Ahead
x
y
z
i j
Reference Point Node
x
y
zi
j
Reference Point Node
x
zy
Reference
Point Node
Pier 3 – Frame Pier Example
Last Modified: 8/3/2016 121
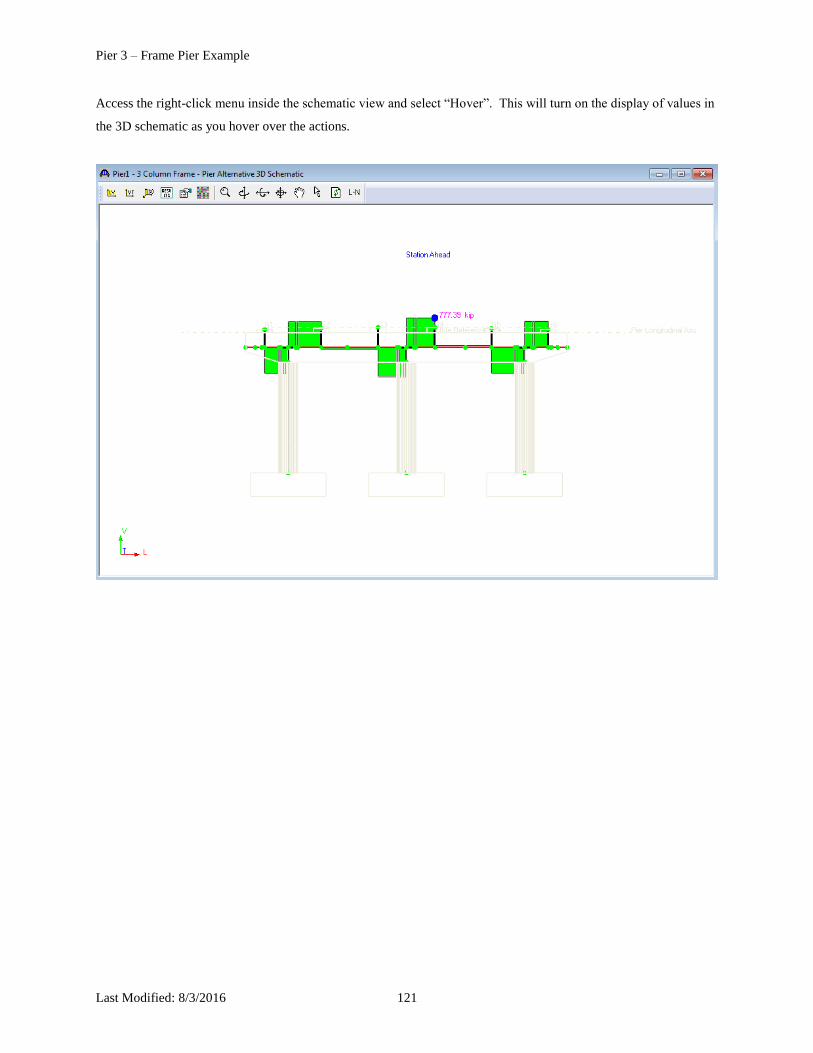
Access the right-click menu inside the schematic view and select “Hover”. This will turn on the display of values in
the 3D schematic as you hover over the actions.
Pier 3 – Frame Pier Example
Last Modified: 8/3/2016 122
Additional Reports
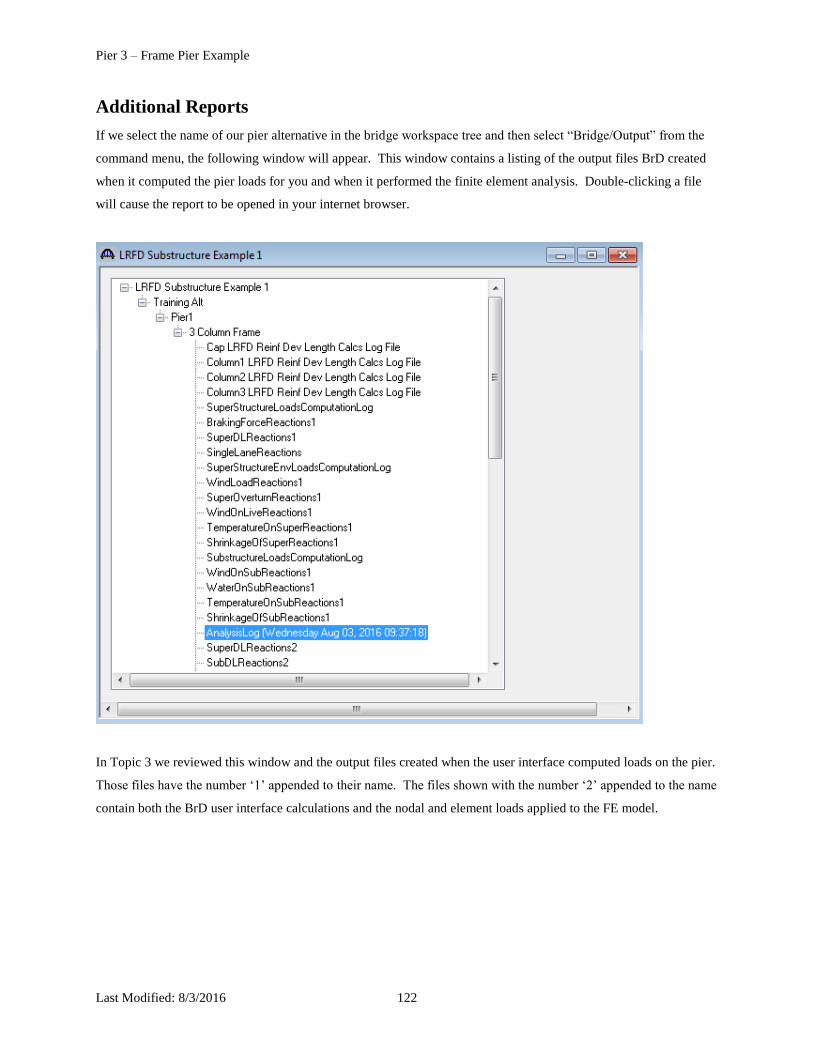
If we select the name of our pier alternative in the bridge workspace tree and then select “Bridge/Output” from the
command menu, the following window will appear. This window contains a listing of the output files BrD created
when it computed the pier loads for you and when it performed the finite element analysis. Double-clicking a file
will cause the report to be opened in your internet browser.
In Topic 3 we reviewed this window and the output files created when the user interface computed loads on the pier.
Those files have the number ‘1’ appended to their name. The files shown with the number ‘2’ appended to the name
contain both the BrD user interface calculations and the nodal and element loads applied to the FE model.

Pier 3 – Frame Pier Example
Last Modified: 8/3/2016 123
Method of Solution
The Method of Solution manual can be accessed from the Help menu in BrD.