ORISSA STATE ROAD PROJECT - OSRPosrp.gov.in/sites/default/files/PDF/Final Bridge Design...
451
GOVERNMENT OF ORISSA WORKS DEPARTMENT ORISSA STATE ROAD PROJECT FINAL DETAILED ENGINEERING REPORT FOR PHASE-I ROADS DESIGN REPORT OF BRIDGES (BHAWANIPATNA TO KHARIAR) Engineers Group Ltd. Jaipur E-12, Moji Colony, Malviya Nagar , Jaipur, Raj. + 91-141-2520899, Telefax +91-141-2521348 E-mail : [email protected] URL : www.cegindia.com
Transcript of ORISSA STATE ROAD PROJECT - OSRPosrp.gov.in/sites/default/files/PDF/Final Bridge Design...

GOVERNMENT OF ORISSA
WORKS DEPARTMENT
ORISSA STATE ROAD PROJECT
FINAL DETAILED ENGINEERING REPORT FOR PHASE-I ROADS
DESIGN REPORT OF BRIDGES (BHAWANIPATNA TO KHARIAR)
������������������������������������������������������������������������
Engineers Group Ltd. Jaipur E-12, Moji Colony, Malviya Nagar , Jaipur, Raj. �+ 91-141-2520899, Telefax +91-141-2521348 E-mail : [email protected] URL : www.cegindia.com

Consuting Engineers Group Ltd., Jaipur_____________________________________________________________________________
Bridge Design Report_______________________________________________________________________________
Sl No Titile Pages1 Introduction 1 - 4
Bridge at Ch: 13+750(I) Design of Substructure 1 - 28(II) Design of Superstructure 1 - 1
Bridge at Ch: 21+000(I) Design of Substructure 1 - 26 (II) Design of Superstructure 1 - 1
Bridge at Ch: 27+600 & 28+900(I) Stability Check & Design of Substructure (Abutment Pier)
1 - 29
(II) Stability Check & Design of Substructure (Pier)
1 - 21
Bridge at Ch: 27+800 (I) Design of Substructure (Pier) 1 - 38(II) Design of Substructure (Abutment) 1 - 31(III) Design of Superstructure 1 - 61(IV) Design of Desk Slab 1 - 6(V) Design of Diaphragm 1 - 5(VI) Appendix 1 - 14
Bridge at Ch: 29+400 (I) Design of Substructure (Abutment - Pier) 1 - 29(II) Design of Substructure (Pier) 1 - 26(III) Design of Superstructure 1 - 10
Bridge at Ch: 54+600 (I) Design of Substructure (Abutment) 1 - 26(I) Design of Substructure (Pier) 1 - 27(II) Design of Superstructure 1 - 1
Bridge at Ch: 58+900 (I) Design of Substructure 1 - 26(II) Design of Superstructure 1 - 1
5
6
7
8
INDEX
2
3
4

CEG.Ltd., Jaipur Bridge Design Report
Consultancy Services for Feasibility Study and Detailed Project Preparation for Proposed Orissa State Road Project
INTRODUCTION

Consulting Engineers Group Ltd., Jaipur Bridge Design Report ______________________________________________________________________________
INTRODUCTION This report presents the design of bridges for Bhawanipatna to Khariar on SH-16. The total width of carriageway is 12.0 m with clear carriageway width of 11.0 m and crash barrier of 0.5 m on each side in minor bridges does not lie in village vicinity. Footpath of 1.5 m shall be provided on both sides for major bridges and minor bridges lies in the village vicinity. The bridge having 7.5 m width in good condition has been retained without any widening as per the discussion and decision with PIU. There are total 21 Nos of existing bridges in this stretch. The existing and new proposal has been summarized on the next page. From Ch. 27/600 to 29/400, there are total 6 nos. of bridges on Tel River. 3 Nos. of bridges are towards Bhawanipatna side w.r.t. Main Tel River bridge and 2 bridges are towards Khariar side. As per the drawing received from Executive Engineer Bhawanipatna,HFL observed on 3rd July 2006 was around 1.5 m above bridge deck w.r.t. bridge at Ch. 27/850. The level difference between main bridge on Tel and the above bridge is about 6 m within a distance of around 125 m. As per highway alignment, it is not possible to keep the bridge at the same level. Due to submergence, difficulty in highway alignment , Detailed hydrology report, Review committee meeting and Inspection of Bhawanipatna-Khariar Road followed by Inspection note vide letter no. PIU(WB) 25/2006, it is decided to dismantle the existing bridge at Ch. 27/800 and at Ch. 27/850 and construction of new bridge of around 175 m clear vent way. It is proposed to construct 8 spans of 32.2 m PSC Girder and substructure resting on Pile foundations as per geotechnical and hydrology report. As per the discussion with PIU, raising of other minor bridges at Ch. 27/600, 28/900 and 29/400 has been suggested provided the parameter like SBC and reinforcement mentioned in working drawings based on detailed calculations are met. Main Tel bridge has been kept as it is as per detailed inspection and performance of the bridge. For bridge at Ch. 29/400 besides raising, 2 additional spans of 9.2 m on both sides has been added. Initially 2 spans of 32.2 m was proposed for the above bridge. Detailed analysis of existing bridges to be raised has been made on the basis of modern day loading and dimension detail drawing No. D-III/25/1-78-79 provided by PIU. In final DPR, rehabilitation measures of bridge at Ch. 69/300 has been proposed as per the review committee inspection note vide letter no. PIU(WB) 25/2006, however as the NDT results are not satisfactory, it is suggested to do core cutting of slab during execution to know the residual strength of concrete. Slab type superstructure of 10.0 m and RCC girder of 12.0 m, 14.0 m and 21.0 m has been taken from the MOST standard drawings. Box type structure has also been taken from the MOST – standard drawings. Substructure of the bridges has been designed as per the program based on latest IRC codes on standard excel sheet-moving live load using standard software STAAD-PRO. Following live loads has been considered for 12.0 m overall width.
1. Single lane of Class 70-R wheeled+ Class A 2. Single lane of class 70-R Tracked + class A 3. Class-A, 3 lane
The structural drawing has been prepared in AUTOCAD. Following changes has been done in Final DPR.
� Tel bridge and its approaches designs has been revised as per the actual HFL as per detailed hydrology report and waterway as per the Inspection note vide letter no. PIU(WB) 25/2006 and letter no. PIU (WB)/36/05/part/7227/22/2/07.
� Bridge at Ch. 69/300 reconstruction case in draft DPR has been revised to Rehabilitation case as per the Inspection note vide letter no. PIU(WB) 25/2006.

Consulting Engineers Group Ltd., Jaipur Bridge Design Report ______________________________________________________________________________
� Discrepancy in Soil report has been taken care as per the comments received on 30.12.06 and compliance on dated 17-01-07.
� Bed protection and length of apron has been incorporated as per discussion. � Seismic analysis as per letter no. PIU(WB)43/2006/11973/dated 20th march 2007, has
been done in our sample calculation for bridge at Ch. 29/500 in Berhampur-Rayagada road and are not critical for seismic zone II and as per our experience in this regard, hence in other designs it is ignored.
� Coherence in list of culverts in the drawing, report and scheduled of culverts has been maintained with proper design chainages as per letter no. PIU (WB)/36/05/part/7227/22/2/07.
Code of Reference
1. IRC : 21 - 2000 2. IRC : 6 - 2004 3. IRC : 78 - 2000 4. IRC : 89 - 1997 5. IRC : 89 - 1997 (Part II) 6. SP : 13 – 2004 7. Specifications for Road and Bridge works (MOST Book) 8. MOST standard plans Culverts with or without Cushion

Consulting Engineers Group Ltd., Jaipur_____________________________________________________________________________________________________
Bridge Design Report_______________________________________________________________________________
Sl.No.
Location/ Chainage
Existing Span Arrangement
Existing Carriage way
widthType of Bridge Recommended for
Proposed Spand Arrangement
Type of foundation
Type of Substructure
Type of Superstructure
Remarks
1 3/050 3 x 8.8 7.7 High Level Repair/Rahabilitation - Open foundation PCC wall type RCC Solid SlabGood Repair/ Rehabilitation required
2 4/450 4 x 9.9 6.7 Submersible Repair/Rahabilitation - Open foundation PCC wall type RCC Solid SlabGood Repair/ Rehabilitation required
3 8/600 1 x 7.3 7.2 Submersible Reconsturction 1 x 8.0 RCC Box Raft Foundation New bridge, existing submersible
4 10/500 1 x 7.4 7.2 Submersible Reconsturction 1 x 8.0 RCC Box Raft Foundation New bridge, existing submersible
5 13/750 2 x 7.2 7.3 Submersible Reconsturction1 x 14.6 RCC T -
Beam GirderOpen foundation RCC wall type
RCC T - Beam Girder
New bridge, existing in poor condition
6 17/120 1 x 7.55 3.1 Submersible Reconsturction 1 x 8.0 RCC Box Raft Foundation New bridge, existing in poor condition
7 21/000(3 x 0.6) + (7 x
1.2)6.7
Hume pipe Vented cause
wayReconsturction
1 x 12.6 RCC T - Beam Girder
Open foundation RCC wall typeRCC T - Beam
GirderNew bridge, existing causeway
8 27/600 7 x 9.2 6.85 Submersible Repair/Rahabilitation - Open foundationRCC Pier, RCC
Pier Type Abutment
RCC Solid SlabGood Repair/ Rehabilitation required
9 27/800 10 x 1.2 6.6Hume pipe
Vented cause way
Reconsturction
10 27/850 9 x 9.2 7.2 Submersible Reconsturction
11 28/400(2 x 9.9) + (1 x
24.37) + (1 x 34.9) + (10 x 40.85)
6.85 High Level Nothing to do - Well FoundationRCC Pier, RCC
Pier Type Abutment
Balanced Cantilever Box
GirderGood Nothing to do
12 28/900 4 x 9.2 7 Submersible Repair/Rahabilitation - Open foundationRCC pier, Rcc
pier type abutment
RCC Solid SlabGood Repair/ Rehabilitation required
13 29/400 2 x 9.2 7.1 Submersible Repair/Rahabilitation
( 2 x 9.2 ) + ( 2 x 9.2 ) Additional Spans on each
sides
Pile foundation RCC wall type PSC GirderGood Repair/ Rehabilitation required
14 45/700 1 x 6.2 10.4 High Level Reconsturction 1 x 8.0 RCC Box Raft Foundation New bridge existing in poor condition
15 54/600 3 x 8.5 7.5 Submersible Realigned3 x 10.8 m RCC
Solid SlabOpen foundation RCC wall type RCC Solid Slab
New bridge, existing in realignment
8 x 32.2 PSC Girder Pile foundation
RCC cell box
RCC cell box
RCC cell box
New bridge, existing submersible
RCC cell box
PSC GirderRCC wall type

Consulting Engineers Group Ltd., Jaipur_____________________________________________________________________________________________________
Bridge Design Report_______________________________________________________________________________
Sl.No.
Location/ Chainage
Existing Span Arrangement
Existing Carriage way
widthType of Bridge Recommended for
Proposed Spand Arrangement
Type of foundation
Type of Substructure
Type of Superstructure
Remarks
16 58/900 3 x 6.8 8 Submersible Realigned1 x 21.6 RCC T -
Beam GirderOpen foundation RCC wall type
RCC T - Beam Girder
New bridge, existing in realignment
17 59/100(7 x 32.7) + (1 x
7.6)7.2 High Level Repair/Rahabilitation - Well Foundation RCC wall type PSC Girder
Good Repair/ Rehabilitation required
18 59/400 5 x 4.0 7.8 High Level Repair/Rahabilitation - Raft Foundation Good Repair/ Rehabilitation required
19 63/650 1 x 6.6 9 High Level Reconsturction 1 x 8.0 RCC Box Raft Foundation New bridge existing in poor condition
20 66/500 1 x 6.4 8.8 High Level Reconsturction 1 x 8.0 RCC Box Raft Foundation New bridge existing in poor condition
21 69/300 1 x 7.2 8.5 High Level Repair/Rahabilitation - Open foundationRR Stone
Masonry wall typeRCC Solid Slab
Repair/ Rehabilitation required
RCC cell box
RCC cell box
RCC cell box

CEG.Ltd., Jaipur Bridge Design Report
Consultancy Services for Feasibility Study and Detailed Project Preparation for Proposed Orissa State Road Project
BRIDGE AT CH:13+750

CEG.Ltd., Jaipur Bridge Design Report
Consultancy Services for Feasibility Study and Detailed Project Preparation for Proposed Orissa State Road Project
DESIGN OF SUBSTRUCTURE
Consulting Engineers Group Ltd., Jaipur_______________________________________________________________________
Bridge Design Report______________________________________________________________________
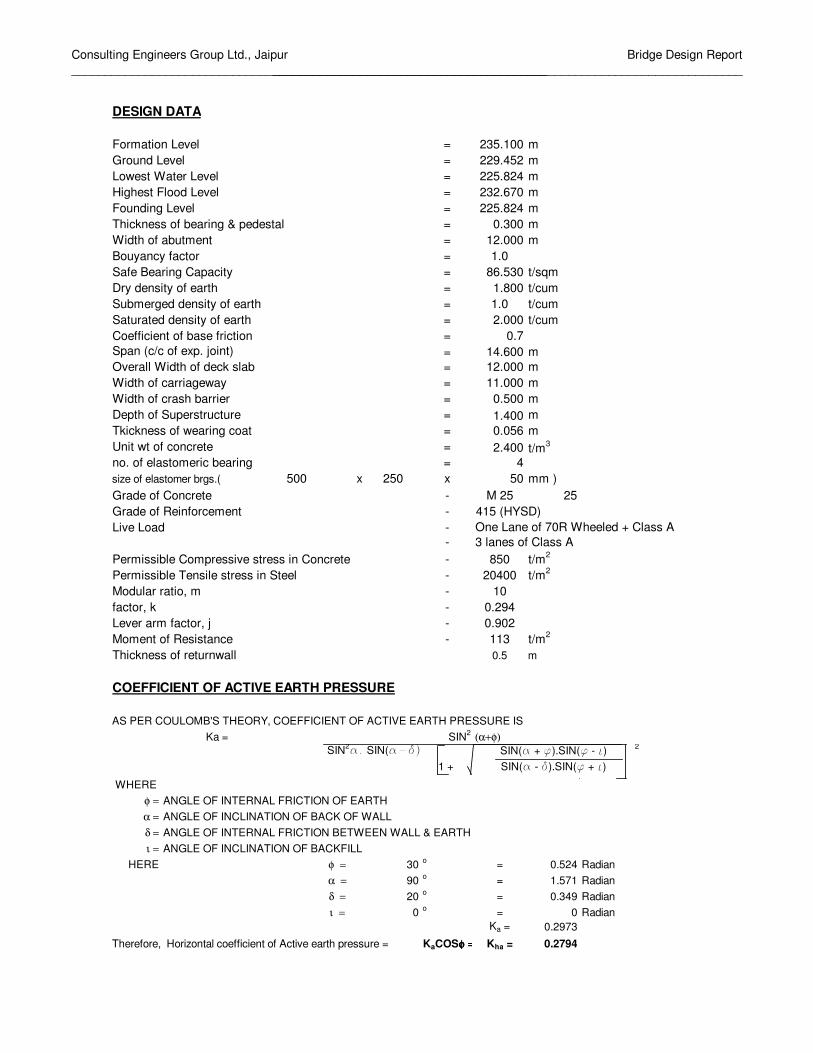
DESIGN DATA
Formation Level = 235.100 mGround Level = 229.452 mLowest Water Level = 225.824 mHighest Flood Level = 232.670 mFounding Level = 225.824 mThickness of bearing & pedestal = 0.300 mWidth of abutment = 12.000 mBouyancy factor = 1.0Safe Bearing Capacity = 86.530 t/sqmDry density of earth = 1.800 t/cumSubmerged density of earth = 1.0 t/cumSaturated density of earth = 2.000 t/cumCoefficient of base friction = 0.7Span (c/c of exp. joint) = 14.600 mOverall Width of deck slab = 12.000 mWidth of carriageway = 11.000 mWidth of crash barrier = 0.500 mDepth of Superstructure = 1.400 mTkickness of wearing coat = 0.056 mUnit wt of concrete = 2.400 t/m3
no. of elastomeric bearing = 4size of elastomer brgs.( 500 x 250 x 50 mm )Grade of Concrete - M 25 25Grade of Reinforcement - Fe 415 (HYSD)Live Load -
-Permissible Compressive stress in Concrete - 850 t/m2
Permissible Tensile stress in Steel - 20400 t/m2
Modular ratio, m - 10factor, k - 0.294Lever arm factor, j - 0.902Moment of Resistance - 113 t/m2
Thickness of returnwall 0.5 m
COEFFICIENT OF ACTIVE EARTH PRESSURE
AS PER COULOMB'S THEORY, COEFFICIENT OF ACTIVE EARTH PRESSURE ISKa = SIN2 (α+φ)
SIN2�� SIN(���� 2
1 +
WHEREφ = ANGLE OF INTERNAL FRICTION OF EARTHα = ANGLE OF INCLINATION OF BACK OF WALLδ = ANGLE OF INTERNAL FRICTION BETWEEN WALL & EARTHι = ANGLE OF INCLINATION OF BACKFILL
HERE φ = 30 o = 0.524 Radianα = 90 o = 1.571 Radianδ = 20 o = 0.349 Radianι = 0 o = 0 Radian
Ka = 0.2973
Therefore, Horizontal coefficient of Active earth pressure = KaCOSφ = φ = φ = φ = Kha = 0.2794
One Lane of 70R Wheeled + Class A3 lanes of Class A
SIN(� + �).SIN(� - �)SIN(� - �).SIN(� + �)

Consulting Engineers Group Ltd., Jaipur_______________________________________________________________________
Bridge Design Report______________________________________________________________________
HEIGHT OF ABUTMENT
Total height of abutment = Formation Level - Founding Level = 9.276 mFor DESIGN purpose, the height of abutment is considered as, say, = 9.280 m
CALCULATION OF ACTIVE EARTH PRESSURE
2water level 1
9.276
4 3
Active Earth Pressure Surcharge DRY. condition
a) Service Condition
1 LL Surcharge 1.0 1.200 0.67 74.64 4.638 346.172 0.5 9.276 4.66 259.62 3.896 1011.483 1.0 0.000 4.66 0.00 0.000 0.004 SubmgEarth 0.5 0.000 0.00 0.00 0.000 0.00
334.26 1357.64
b) Span Dislodge Condition
Net force = 334.26 - 74.64 = 259.62 tNet moment = 1357.64 - 346.17 = 1011.48 tm
H.F.L. condition
a) Service Condition
1 LL Surcharge 1.0 1.200 0.67 74.64 4.638 346.172 0.5 2.430 1.36 19.80 7.867 155.733 1.0 6.846 1.36 111.55 3.423 381.824 SubmgEarth 0.5 6.846 1.91 78.56 2.282 179.28
284.54 1063.01
b) Span Dislodge Condition
Net force = 284.54 - 74.64 = 209.91 tNet moment= 1063.01 - 346.17 = 716.84 tm
Force (t)
C.G. from base (m)
Force (t)Moment
(tm)
Moment (tm)
C.G. from base (m)
Pressure (t/m2)
Height (m)
Height (m)
Pressure (t/m2)
Area factor
TOTAL
TOTAL
Element no.
Area factorComponent
Dry Earth
Element No.
Component
Dry Earth

Consulting Engineers Group Ltd., Jaipur_______________________________________________________________________
Bridge Design Report______________________________________________________________________
Forces & moments due to Abutment (Concrete) components
DRY Case :
Length Width Height Density Weight(m) (m) (m) (t/m3) (t)
1 1.0 2.000 12.00 0.500 2.40 28.80 1.000 28.80
2 0.5 2.000 12.00 0.700 2.40 20.16 1.333 26.88
3 1.0 3.400 12.00 0.500 2.40 48.96 4.900 239.90
4 0.5 3.400 12.00 0.700 2.40 34.27 4.333 148.51
5 1.0 1.200 12.00 7.220 2.40 249.52 2.600 648.76
6 0.5 0.000 12.00 7.220 2.40 0.00 2.000 0.00
7 stem rect 1.0 1.200 12.00 1.200 2.40 41.47 2.600 107.83
10 Cap 1.0 1.200 12.00 0.300 2.40 10.37 2.600 26.96
11 Dirt Wall 1.0 0.300 12.00 1.406 2.40 12.15 3.050 37.05
8 0.5 3.400 1.00 0.700 2.40 2.86 5.467 15.61
8a 1.0 3.400 1.00 8.776 2.40 71.61 4.900 350.90520.17 1631.20
H.F.L. Case :
Length Width Height Density Weight Moment(m) (m) (m) (t/m3) (t) ,@ Toe
1 1.0 2.000 12.00 0.500 1.40 16.80 1.000 16.80
2 0.5 2.000 12.00 0.700 1.40 11.76 1.333 15.68
3 1.0 3.400 12.00 0.500 1.40 28.56 4.900 139.94
4 0.5 3.400 12.00 0.700 1.40 19.99 4.333 86.63
5 1.0 1.200 12.00 5.646 1.40 113.82 2.600 295.94
6 0.5 0.000 12.00 5.646 1.40 0.00 2.000 0.00
5 1.0 1.200 12.00 0.374 2.40 12.93 2.600 33.61
6 0.5 0.000 12.00 0.374 2.40 0.00 2.000 0.00
7 stem rect 1.0 1.200 12.00 1.200 1.40 24.19 2.600 62.90
10 Cap 1.0 1.200 12.00 0.30 2.40 10.37 2.600 26.96
11 Dirt Wall 1.0 0.300 12.00 1.41 2.40 12.15 3.050 37.05
8 0.5 3.400 1.00 0.70 1.40 1.67 5.467 9.11
8c 1.0 3.400 1.00 5.65 1.40 26.87 4.900 131.69
8d 1.0 3.400 1.00 2.43 2.40 19.83 4.900 97.16298.94 953.47
Stem Wall
Retutnwall
Returnwall
Moment about toe
C.G.from toe (m)
C.G.from toe (m)
Area FactorComponent
Area Factor
TOTAL
Element No.
Element No.
Heel Slab
Toe Slab
Stem Wall
Component
Toe Slab
Stem Wall
Heel Slab
TOTAL
Consulting Engineers Group Ltd., Jaipur_______________________________________________________________________
Bridge Design Report______________________________________________________________________
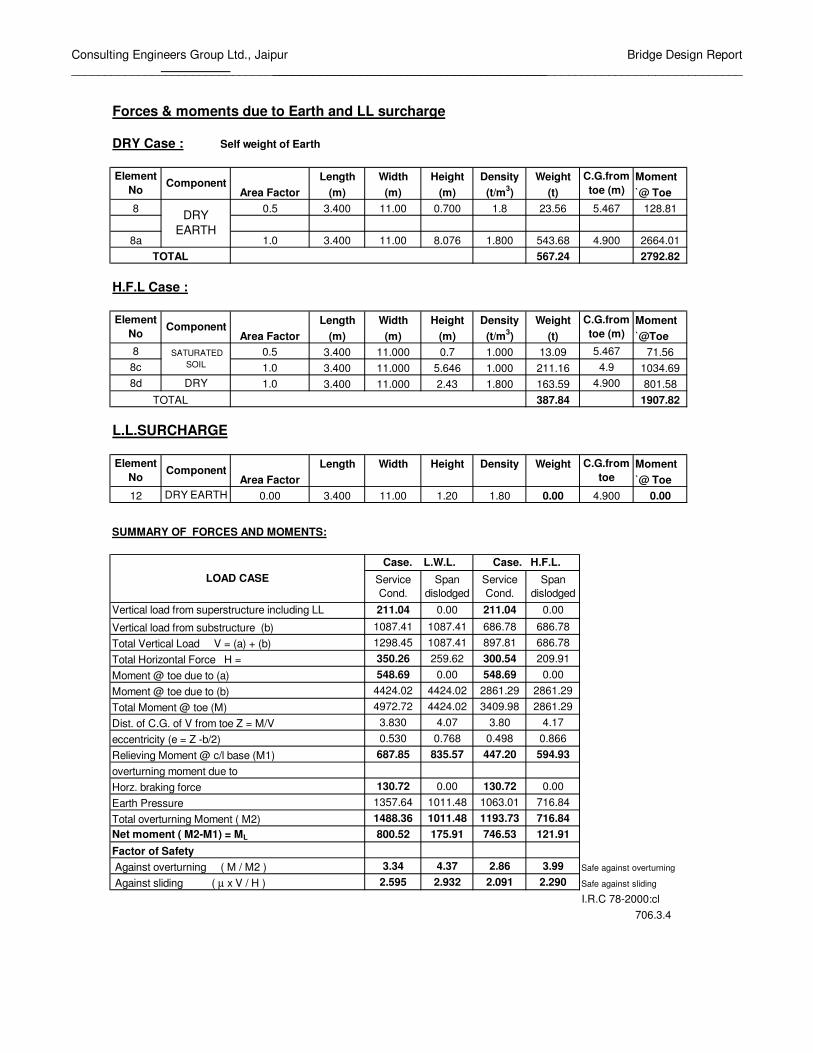
Forces & moments due to Earth and LL surcharge
DRY Case : Self weight of Earth
Length Width Height Density Weight Moment(m) (m) (m) (t/m3) (t) `@ Toe
8 0.5 3.400 11.00 0.700 1.8 23.56 5.467 128.81
8a 1.0 3.400 11.00 8.076 1.800 543.68 4.900 2664.01567.24 2792.82
H.F.L Case :
Length Width Height Density Weight Moment(m) (m) (m) (t/m3) (t) `@Toe
8 0.5 3.400 11.000 0.7 1.000 13.09 5.467 71.568c 1.0 3.400 11.000 5.646 1.000 211.16 4.9 1034.698d DRY 1.0 3.400 11.000 2.43 1.800 163.59 4.900 801.58
387.84 1907.82
L.L.SURCHARGE
Length Width Height Density Weight Moment`@ Toe
12 DRY EARTH 0.00 3.400 11.00 1.20 1.80 0.00 4.900 0.00
SUMMARY OF FORCES AND MOMENTS:
211.04 0.00 211.04 0.00
1087.41 1087.41 686.78 686.781298.45 1087.41 897.81 686.78350.26 259.62 300.54 209.91548.69 0.00 548.69 0.00
4424.02 4424.02 2861.29 2861.294972.72 4424.02 3409.98 2861.29
3.830 4.07 3.80 4.170.530 0.768 0.498 0.866687.85 835.57 447.20 594.93
130.72 0.00 130.72 0.001357.64 1011.48 1063.01 716.841488.36 1011.48 1193.73 716.84800.52 175.91 746.53 121.91
3.34 4.37 2.86 3.99 Safe against overturning
2.595 2.932 2.091 2.290 Safe against sliding
I.R.C 78-2000:cl706.3.4
TOTAL
DRY EARTH
Net moment ( M2-M1) = ML
eccentricity (e = Z -b/2)
overturning moment due to
SATURATED SOIL
Vertical load from superstructure including LL surcharge (a)Vertical load from substructure (b)
Moment @ toe due to (b)Total Moment @ toe (M)Dist. of C.G. of V from toe Z = M/V
Against sliding ( µ x V / H )
Total overturning Moment ( M2)
Against overturning ( M / M2 )Factor of Safety
Service Cond.
Span dislodged
Case. H.F.L.
C.G.from toe (m)
C.G.from toe
C.G.from toe (m)
ElementNo
Area Factor
Component
TOTAL
ElementNo
Component
Area Factor
Span dislodged
Relieving Moment @ c/l base (M1)
ElementNo Area Factor
Service Cond.
Total Vertical Load V = (a) + (b)Total Horizontal Force H =Moment @ toe due to (a)
Case. L.W.L.LOAD CASE
Horz. braking forceEarth Pressure
Component
Consulting Engineers Group Ltd., Jaipur_______________________________________________________________________
Bridge Design Report______________________________________________________________________
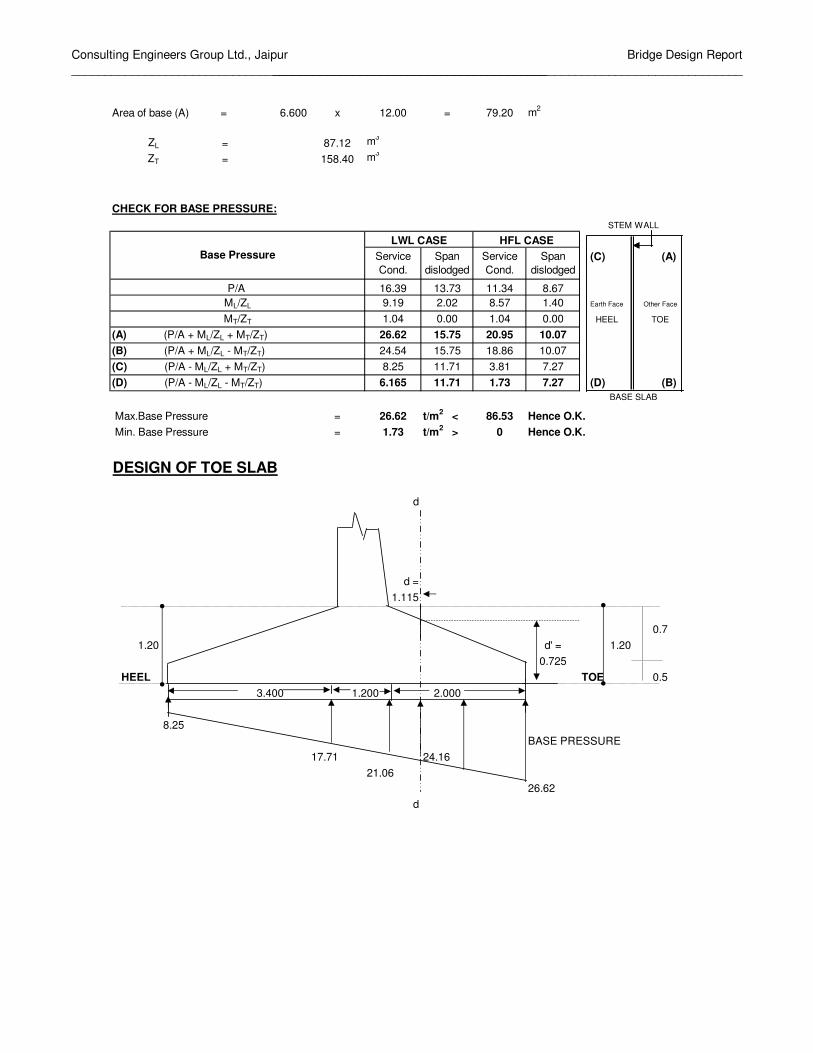
6.600 x 12.00 = 79.20 m2
ZL = 87.12 m3
ZT = 158.40 m3
CHECK FOR BASE PRESSURE:
(C) (A)
16.39 13.73 11.34 8.679.19 2.02 8.57 1.40 Earth Face Other Face
1.04 0.00 1.04 0.00 HEEL TOE
26.62 15.75 20.95 10.0724.54 15.75 18.86 10.078.25 11.71 3.81 7.27
6.165 11.71 1.73 7.27 (D) (B)
Max.Base Pressure = 26.62 t/m2 < 86.53 Hence O.K. Min. Base Pressure = 1.73 t/m2 > 0 Hence O.K.
DESIGN OF TOE SLAB
d
d =1.115
0.71.20 d' = 1.20
0.725HEEL TOE 0.5
3.400 2.000
8.25BASE PRESSURE
17.71 24.1621.06
26.62d
(D) (P/A - ML/ZL - MT/ZT)
P/A ML/ZL
MT/ZT
(A) (P/A + ML/ZL + MT/ZT)
Area of base (A) =
LWL CASESTEM WALL
BASE SLAB
HFL CASESpan
dislodgedService Cond.
Span dislodged
Service Cond.
1.200
(C) (P/A - ML/ZL + MT/ZT)(B) (P/A + ML/ZL - MT/ZT)
Base Pressure

Consulting Engineers Group Ltd., Jaipur_______________________________________________________________________
Bridge Design Report______________________________________________________________________
BENDING MOMENT AT FACE OF STEM
Element Area fact. force L.A. Moment1 1.0 2.400 1.000 2.4002 0.5 1.680 0.667 1.120
Rect. 1.0 -42.111 1.000 -42.111Trian. 0.5 -5.569 1.333 -7.425
-43.600 -46.016
Bending Moment at face of stem 46.016 tm/m
Effective depth required 0.639 m
Effective depth provided at face of stem 1.115 m
Area of Reinforcement required 2243 mm2
Minimum steel required 1673 mm2 I.R.C 78-2000 Clause:707.2.7
Distribution steel 669 mm2/mmainsteel 2243 mm2 12 φ , @ 150 C/C
753.9822Hence provide , 25 φ , @ 175 C/C
0 φ , @ 175 C/CThere is no tension below foundation, hence foundation will not have negative momentat top. However in reference to clause 707.2.8 of IRC: 78-2000, the requirement of reinforcement at top is follows.Minimum steel reinfocement as per above clause 250 mm2/m
provide 12 φ , @ 150 C/C753.9822
Check for Shear
SHEAR FORCE AT "d" FROM FACE OF STEM
Element Area fact. force L.A. Moment1 1.0 1.062 0.443 0.4702 0.5 0.743 0.295 0.219
Rect. 1.0 -21.382 0.443 -9.461Trian. 0.5 -1.090 0.590 -0.643
-20.667 -9.416
Effective depth ( d' ) at distence d 0.725 m
Shear force at critical section 20.7 t
Bending Moment at critical section 9.42 tm
tan β = 0.36
Net shear force S-M*tanβ/d' 15.96 t
Hence, Shear stress 22.02 t/m2
% of reinforcement 0.39Permissible shear stress 27.92 t/m2 Hence O.K.
Downward loads
Loadings
Loadings
TOTAL
Upward base pressure
TOTAL
Upward Base pressure
Downward Loads
Consulting Engineers Group Ltd., Jaipur_______________________________________________________________________
Bridge Design Report______________________________________________________________________
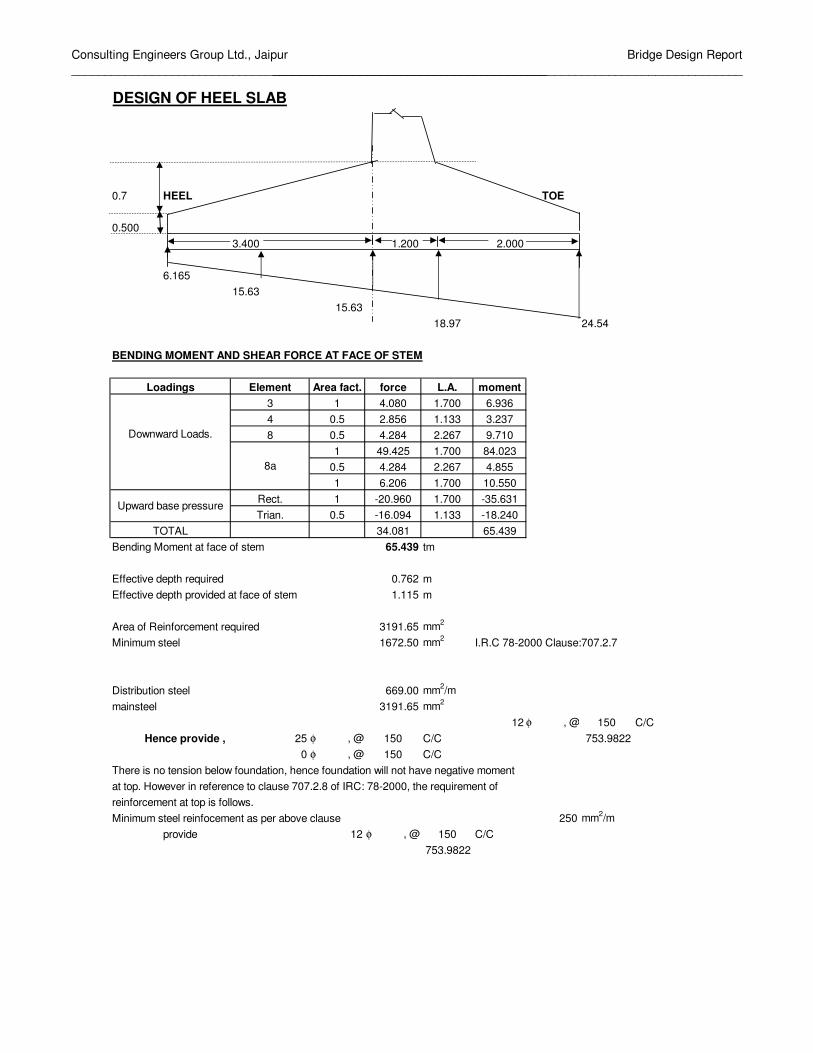
DESIGN OF HEEL SLAB
0.7 HEEL TOE
0.5003.400 2.000
6.16515.63
15.6318.97 24.54
BENDING MOMENT AND SHEAR FORCE AT FACE OF STEM
Element Area fact. force L.A. moment3 1 4.080 1.700 6.9364 0.5 2.856 1.133 3.2378 0.5 4.284 2.267 9.710
1 49.425 1.700 84.0230.5 4.284 2.267 4.8551 6.206 1.700 10.550
Rect. 1 -20.960 1.700 -35.631Trian. 0.5 -16.094 1.133 -18.240
34.081 65.439Bending Moment at face of stem 65.439 tm
Effective depth required 0.762 mEffective depth provided at face of stem 1.115 m
Area of Reinforcement required 3191.65 mm2
Minimum steel 1672.50 mm2 I.R.C 78-2000 Clause:707.2.7
Distribution steel 669.00 mm2/mmainsteel 3191.65 mm2
12 φ , @ 150 C/CHence provide , 25 φ , @ 150 C/C 753.9822
0 φ , @ 150 C/CThere is no tension below foundation, hence foundation will not have negative momentat top. However in reference to clause 707.2.8 of IRC: 78-2000, the requirement of reinforcement at top is follows.Minimum steel reinfocement as per above clause 250 mm2/m
provide 12 φ , @ 150 C/C753.9822
1.200
TOTAL
8a
Downward Loads.
Loadings
Upward base pressure

Consulting Engineers Group Ltd., Jaipur_______________________________________________________________________
Bridge Design Report______________________________________________________________________
Check for Shear ( Critical section at face of stem )
Shear force at face of stem 34.08 t
tan β = 0.206Bending moment at face of stem 65.439 tmNet shear force S-M*tanβ /d 22.00 t
Hence, Shear stress 19.73 t/m2
% of reinforcement 0.29
Permissible shear stress 24.63 t/m2 Hence O.K.
DESIGN OF STEM WALL0.30
1
6.020 8.0762
R.L. OF SECTION = 227.024 m
DRY Condition
a) Service Condition
1 1 0.603 55.9 3.863 216.132 0.5 3.885 180.1 3.245 584.44
16.00 6.620 105.92252.06 906.488
= Stem + dirt wall + cap + Load from superstructure= 208.051 + 12.15 + 10.37 + 211.04= 441.604 t
Longitudinal Moment = 906.488 t-mTransverse Moment = 164.933 t-m
Total Vertical Load
7.7267.726
HORIZONTAL FORCETOTAL
Earth Pressure
Force L.A.Moment
tm
SUMMARY OF FORCES AND MOMENTS IN ABUTMENT SHAFT
SurchargeActive Earth Pressure.
Element No. Area factor Height of E.P. diagram

Consulting Engineers Group Ltd., Jaipur_______________________________________________________________________
Bridge Design Report______________________________________________________________________
b) Span Dislodged Condition
= Stem + dirt wall + cap + Load from superstructure= 208.051 + 12.15 + 10.37 + 0.00= 230.567 t
Longitudinal Moment = 800.568 t-mTransverse Moment = 0.000 t-m
H.F.L. Condition
a) Service Condition
1 LL Surcharge 1.0 1.200 0.603 55.95 3.863 216.132 0.5 2.024 1.13 13.73 6.321 86.813 1.0 5.646 1.13 76.62 2.823 216.314 SubmgEarth 0.5 5.646 1.58 53.44 1.882 100.57
199.74 619.815
= Stem + dirt wall + cap + Load from superstructure= 126.749 + 12.15 + 10.37 + 211.04= 360.301 t
Longitudinal Moment = 725.735 t-mTransverse Moment = 164.933 t-m
b) Span Dislodged Condition
= Stem + dirt wall + cap + Load from superstructure= 126.749 + 12.15 + 10.37 + 0.00= 149.265 t
Longitudinal Moment = 619.815 t-mTransverse Moment = 0.000 t-m
1.2 m2
For horizontal reinforcement area of steel required for the stem at the section/metre = 173.9186 mm2
Providing 12 ,@ 650.29 c/c say, 150 C/C as horizontal reinforcement
Moment (tm)
Total Vertical Load
Dry Earth
TOTAL
Total Vertical Load
Height (m)
Pressure (t/m2)
Force (t)C.G. from base (m)
Element no.
Component Area factor
Total Vertical Load
Cross Sectional area
Consulting Engineers Group Ltd., Jaipur_______________________________________________________________________
Bridge Design Report______________________________________________________________________
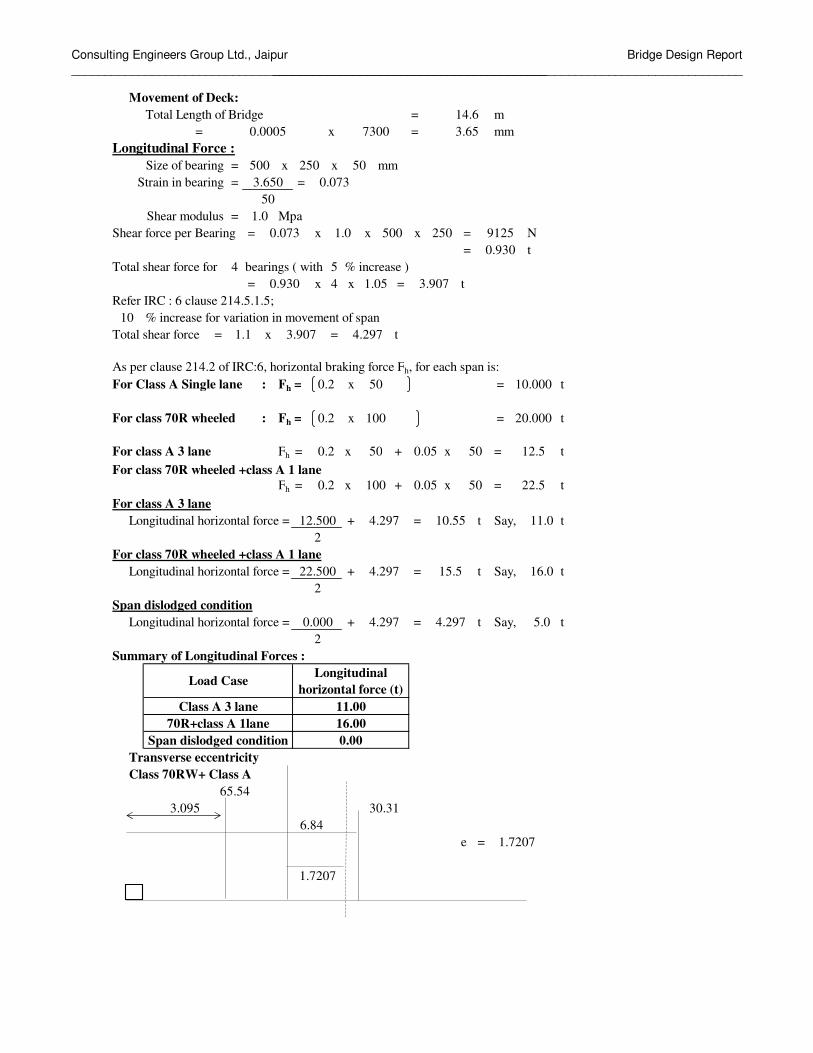
Movement of Deck: Total Length of Bridge = m
= x = mmLongitudinal Force :
= x x mm= =
= MpaShear force per Bearing = x x x = N
= tTotal shear force for 4 bearings ( with 5 % increase )
= x 4 x = tRefer IRC : 6 clause 214.5.1.5;
% increase for variation in movement of spanTotal shear force = x = t
As per clause 214.2 of IRC:6, horizontal braking force Fh, for each span is:For Class A Single lane : Fh = x = t
For class 70R wheeled : Fh = x = t
For class A 3 lane Fh = x + x = tFor class 70R wheeled +class A 1 lane
Fh = x + x = tFor class A 3 lane
Longitudinal horizontal force = + = t Say, t
For class 70R wheeled +class A 1 laneLongitudinal horizontal force = + = t Say, t
Span dislodged conditionLongitudinal horizontal force = + = t Say, t
Summary of Longitudinal Forces :
Transverse eccentricityClass 70RW+ Class A
e = 1.7207
1.7207
65.543.095 30.31
6.84
14.6
0.2 100
10.55
0.2
0.2
500.05
4.297
11.0
0.930 1.05
50 10.000
3.907
12.500 4.297
0.2
1.1 3.907
Shear modulus 1.0
10
0.073
Size of bearingStrain in bearing 3.650
50
500 500.073
250
0.930250 91251.0 500
16.02
2
22.500 4.297 15.5
0.000 4.297 4.297 5.02
0.00
0.0005 7300
Load Case
Span dislodged condition70R+class A 1lane
11.0016.00
Class A 3 lane
3.65
12.5
100 0.05 50 22.5
50
Longitudinal horizontal force (t)
20.000
Consulting Engineers Group Ltd., Jaipur_______________________________________________________________________
Bridge Design Report______________________________________________________________________
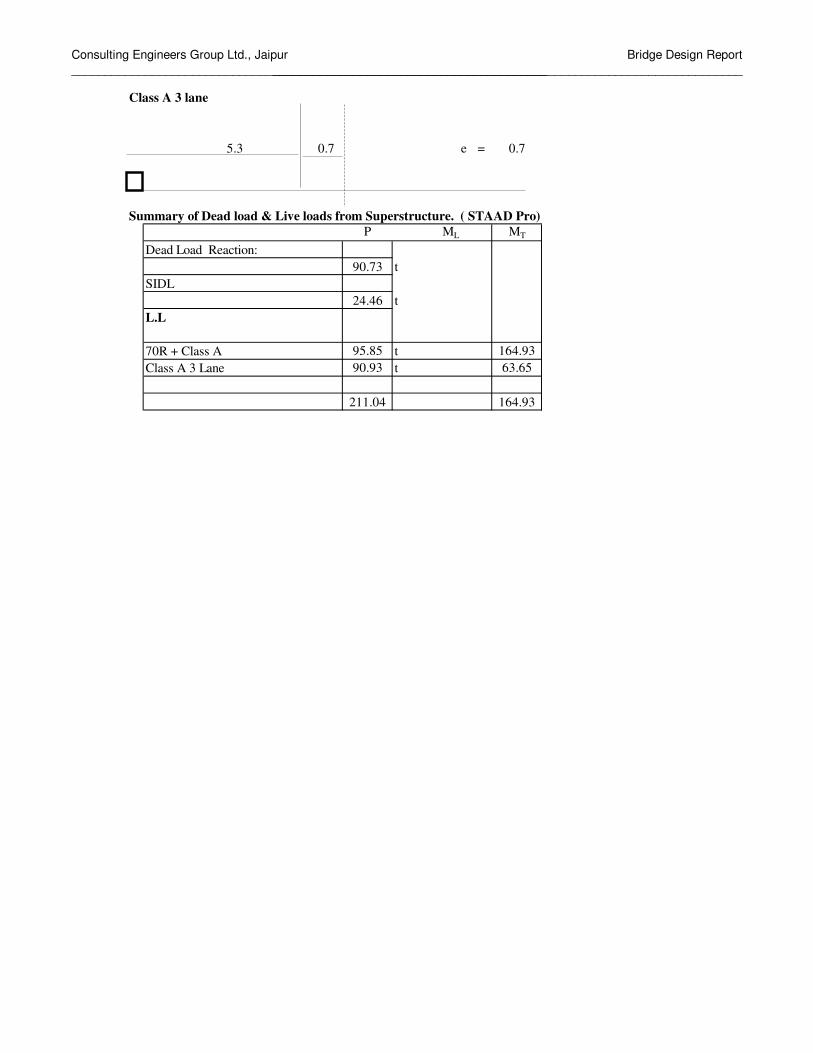
Class A 3 lane
e =
Summary of Dead load & Live loads from Superstructure. ( STAAD Pro)P ML MT
Dead Load Reaction:t
SIDLt
L.L
70R + Class A tClass A 3 Lane t
5.3 0.7 0.7
164.9363.65
24.46
90.73
211.04
95.8590.93
164.93

Consulting Engineers Group Ltd., Jaipur_______________________________________________________________________
Bridge Design Report______________________________________________________________________
φφ
φ no.both sides
% Reinforcement provided = mm2
Summary of Loads at Abutment Shaft bottom :
1 DRY condition P ML MT
With L.LCheck for Cracked/Uncracked Section
Length of section = mmWidth of section = mm
Gross Area of section Ag = mm2
Gross M.O.I of section Igxx = mm4
Gross M.O.I of section Igyy = mm4
y
x x
y
Abutment section
Transformed sectional properties of section:Adopting
Modular ratio m =Cover
Dia of Bars =No of bars in tension face (longer) =No of bars in compression face =
No of bars in shorter direction =
Total bars in section =
16 8020 160
12000
1200 16 8
12000
PLAN : ABUTMENT SHAFT69567.428
0.00 0.00 0.00
120001200
14400000
1.728E+12
1.728E+14
1200
12000
1070 68
20 16160
80
8
256
0 0

Consulting Engineers Group Ltd., Jaipur_______________________________________________________________________
Bridge Design Report______________________________________________________________________
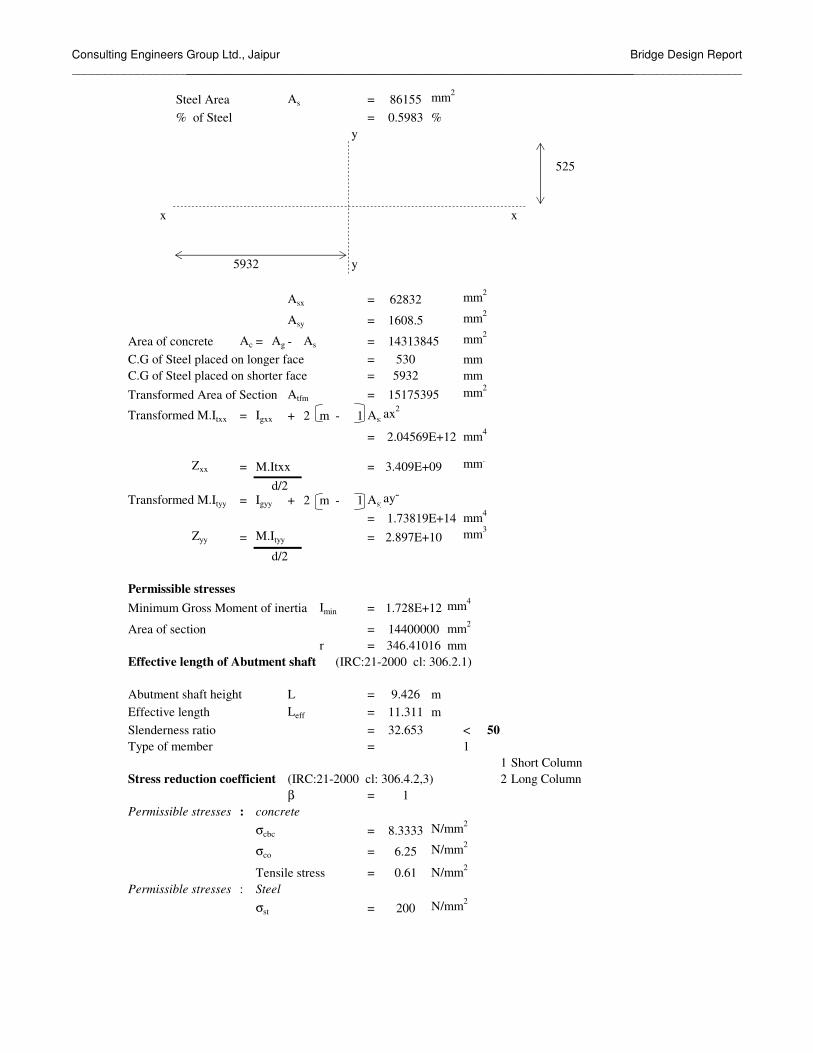
Steel Area As = mm2
% of Steel = %y
x x
y
Asx = mm2
Asy = mm2
Area of concrete Ac = Ag - As = mm2
C.G of Steel placed on longer face = mmC.G of Steel placed on shorter face = mm
Transformed Area of Section Atfm = mm2
Transformed M.Itxx = Igxx + 2 m - 1 Asxax2
= mm4
Zxx = M.Itxx = mm3
d/2Transformed M.Ityy = Igyy + 2 m - 1 Asyay2
= mm4
Zyy = M.Ityy = mm3
d/2
Permissible stressesMinimum Gross Moment of inertia Imin = mm4
Area of section = mm2
r = mmEffective length of Abutment shaft (IRC:21-2000 cl: 306.2.1)
Abutment shaft height L = mEffective length Leff = mSlenderness ratio = <Type of member = 1
1 Short ColumnStress reduction coefficient (IRC:21-2000 cl: 306.4.2,3) 2 Long Column
β =Permissible stresses : concrete
σcbc = N/mm2
σco = N/mm2
Tensile stress = N/mm2
Permissible stresses : Steel
σst = N/mm2
695670.4831
525
5932
50265
1608.5
143304335305932
15026107
1.98215E+12
3.304E+09
1.73819E+14
2.897E+10
1.728E+12
14400000346.41016
9.42611.31132.653 50
1
8.3333
6.25
0.61
200

Consulting Engineers Group Ltd., Jaipur_______________________________________________________________________
Bridge Design Report______________________________________________________________________
S.No Item DRY CaseLoads and Moments With L.L
1 P t
2 ML t-m
3 MT t-m
Actual(calculated) Stresses
4 σco,cal P/Atfm
5 σcbc,cal ML/Zxx
6 σcbc,cal MT/Zyy
7 σcbc,cal = 5 + 6
Permissible Stresses8 σcbc
9 σco
Check for Minimum steel area mm2
Conc.Area Required for directstress(1)/(9)
0.8% of area required0.3% of Ag
Governing steel mm2
Provided Steel area mm2
Check for safety of section
σco,cal + σcbc,cal
σco σcbc < 1
Check for Cracked /Uncracked section
σco,cal - σcbc,cal
Permissible Basic tensile stress in concreteSection to be designed as
906.49
164.93
0.293890878
10706565.72
11 5652.525712 43200
13 43200
14 69567.428
0.3831284
-2.506992-0.61
Cracked
6.25
2.743949739
0.056932836
2.800882575
8.3333333
441.60

Consulting Engineers Group Ltd., Jaipur_______________________________________________________________________
Bridge Design Report______________________________________________________________________
a
A B
b
X directionY direction
A' B'
Width of Solid return wall (a) =Width of Cantilever return wall =Avg Height of Solid return wall (b) =Height of Cantilever return at Tip =Height of Cantilever return at Root =Thickness of Solid Return at farther end =Thickness of Solid Return at Root =Thickness of Solid Return at bottom =Thickness of Solid Return at top =Thickness of Cantilever return =Unit wt of Soil = t/m3
Grade of concrete = M 30σcbc = t/m2
m =σst = t/m2
k =j =R = t/m2
Case (1) For uniformly distributed load over entire platea/b = For a/b = β1 = β2 =
For a/b = β1 = β2 =
a/b = β1 =β2 = 0.451376
0.3980.632
0.4035129 0.416413
0.4035129 0.3750.5
0.3530.631
204000.3333330.888889151.1111
0.51.8
102010
0.50.50.50.5
8.4260.75
2.666667
2.666667
226.674
0.75
3.404.00
3.404.00
8.426
235.100

Consulting Engineers Group Ltd., Jaipur_______________________________________________________________________
Bridge Design Report______________________________________________________________________
Live Load Surcharge:q = x x = t/m2
σbmax = β1 x q x b2
t2
σamax = β2 x q x b2
t2
σbmax = x x = t/m2
For mm of widthZ = x = mm3
6 = m3
Hence Moment /m width along Y direction
MY /m width = x = t-m/mσamax = x x = t/m2
For mm of widthZ = x = mm3
6 = m3
Hence Moment /m width along X direction
MX /m width = x = t-m/mCase (2) For Triangular loading due to earth pressure
a/b = For a/b = β1 = β2 =For a/b = β1 = β2 =
a/b = β1 =β2 =
Earth pressure:q = x x = t/m2
σbmax = β1 x q x b2
t2
σamax = β2 x q x b2
t2
σbmax = x x = t/m2
For mm of widthZ = x = mm3
6 = m3
41666667
0.041667
0.251000
1000 250000
4.237604
0.23846 4.237604 71.00 286.9715
0.159861
0.2794 1.8 8.426
0.5 0.328 0.200
0.4035129 0.23846
0.4035129 0.375 0.212 0.148
41666667
0.041667
77.360938 0.041667 3.223372
0.251000
1000 250000
0.4513762 0.603504 71.00 77.36094
0.041667
71.368586 0.041667 2.973691
0.2571.36859
10001000 250000 41666667
0.603504
0.4164128 0.603504 71.00
0.2794 1.8 1.2

Consulting Engineers Group Ltd., Jaipur_______________________________________________________________________
Bridge Design Report______________________________________________________________________
Hence Moment /m width along Y direction
MY /m width = x = t-m/mσamax = x x = t/m2
For mm of widthZ = x = mm3
6 = m3
Hence Moment /m width along X direction
MX /m width = x = t-m/m
Total Moment in Solid Return /m height = t-m/mAlong X-direction
Total Moment in Solid Return /m width = t-m/mAlong Y-direction
Moment due to Cantilever Return:Moment due to earth pressure at face A - A '
M = x x x x x+ 0.5 x x 1.8 x x x+ 0.5 x x 1.8 x x X2 x dx x - X+ x 1.8 x x x X x dx x - X
= + + x + x
= t-m
Design of cantilever Return:Assuming 50 mm cover and 12 mm dia bars.Effective depth available = - 50 - 20 - 6 = 424 mm
M = R x b x d2
= x x = t-m
Ast = x 10^6 = mm2
x xAst/m = mm2/m
Provide 12 mm dia @ mm c/c providing mm2 on earth face.Provide 12 mm dia @ mm c/c providing mm2 on other face.
Along Horizantal direction.
150 753.9822180 628.3185
72.4431
1835.28
500
688.231
14.1106320400 0.888889 0.424
0.444444
4.004.00 2.00
1.8
4.00
14.11063
3.621024 1.13157 0.11176
0.666667 4.00
0.2794 1.2
0.2794 1.95
0.27940.2794
0.750.5625
11.23933
14.93084
151.1111 2.666667 0.179776
21.33333 0.653796 10.6667
2.00
41666667
0.041667
192.38306 0.041667 8.015961
0.251000
1000 250000
0.1598614 4.237604 71.00 192.3831
286.97153 0.041667 11.95715

Consulting Engineers Group Ltd., Jaipur_______________________________________________________________________
Bridge Design Report______________________________________________________________________
Design of Solid Return:Moment due to Cantilever Return:Moment due to Earth pressure at face B-B '
M = x x x x x+ 0.5 x x 1.8 x x x+ 0.5 x x 1.8 x x X2 x dx x - X+ x 1.8 x x x X x dx x - X
= + + x + x
= t-m
Moment in Solid Return /m height = + = t-m/m
Moment in Solid Return /m width = = t-m/m
Design of face B-B '
Moment in Solid Return /m height = t-m/m
Assuming 50 mm cover and 20 mm dia bars.Effective depth available = - 50 - 20 - 10 = 420 mm
M = R x b x d2
= x x = t-m
Ast = x 10^6 = mm2
x xAst/m = mm2/m
Provide 20 mm dia @ mm c/c providing mm2 on earth face.Provide 12 mm dia @ mm c/c providing mm2 on other face.
Along Horizantal direction.Design of face A ' -B '
Moment in Solid Return /m width = t-m/m
Assuming 50 mm cover and 20 mm dia bars.Effective depth available = - 50 - 0 - 10 = 440 mm
M = R x b x d2
= x x = t-m
Ast = x 10^6 = mm2
x xAst/m = mm2/m
Provide 20 mm dia @ mm c/c providing mm2 on earth face.Provide 12 mm dia @ mm c/c providing mm2 on other face.
Along Vertical direction.
1871.35
160 1963.495160 706.8583
14.93084 1871.3520400 0.888889 0.44
14.9308
500
151.1111 1 0.1936 29.2551
2224.98
150 2094.395150 753.9822
16.94544 2224.9820400 0.888889 0.42
16.9454
500
151.1111 1 0.1764 26.656
9.776765 3.055239 0.11176 93.86667
48.07962
11.23933 48.07962 16.9454
0.2794 0.444444 7.400.2794 1.95 0.666667 7.40
5.40
0.653796 37.8667
0.2794 1.2 1.8 0.750.2794 0.5625 4.00
8.426
4.005.40
14.9308

Consulting Engineers Group Ltd., Jaipur_______________________________________________________________________
Bridge Design Report______________________________________________________________________
1. DESIGN FOR FORCES IN LONGITUDINAL DIRECTION
Active earth pressure Ka = 0.279384FOR NORMAL CASE, FA = 1.0unit wt of soil γ = 1.8
δ = 20clear span between return wall = 11.000 mwidth of return wall = 0.5Avg. cover to reinforcement. (FOR 2-3 LAYERS) = 0.150 mH (From formation level) = 8.076 m DESIGN FOR BENDING MOMENT
S.NO. UNITS 1H (FROM TOP) m 8.076
WIDTH OF RETURN AT THIS LEVEL m 3.400FORCE DUE TO EARTH PRESSURE t 92.464
MOMENT DUE TO EARTH PRESSURE tm 313.631FORCE DUE TO L.L. SURCHARGE t 27.478
MOMENT DUE TO L.L. SURCHARGE tm 110.957TOTAL MOMENT tm 424.588
DESIGN MOMENT tm 424.588REQUIRED EFFECTIVE DEPTH m 2.650
EFF. DEPTH AVAILABLE m 3.250AREA OF STEEL REQUIRED cm2 72.036
DIAMETER OF BAR PROVIDED mm 32TOTAL NO. OF BARS no. 12
cm2 96.51O.K.34.0
CHECK FOR SHEAR STRESS
SHEAR FORCE t 124.942SHEAR STRESS t/m2 76.888
Ast/bd x 100 % 0.443PERMISSIBLE SHEAR STRESS MPa 0.29PERMISSIBLE SHEAR STRESS t/m2 29.77
Asv/sv cm2/m 7.107k1 ... 0.5k2 ... 1.0
PERMISSIBLE SHEAR STRESS t/m2
10 Tor 2-legged 1
AREA OF STEEL PROVIDED

Consulting Engineers Group Ltd., Jaipur_______________________________________________________________________
Bridge Design Report______________________________________________________________________
Design of Abutment Cap:
As the cap is fully supported on the abutment.Minimum thickness of the cap required as per cl: 710.8.2 of IRC:78-2000 is 200 mm.However the thickness of abutment cap is = mmAssuming a cap thickness of = mmVolume of Abutment cap = x x
= m3
Quantity of steel = 1 % of volume= x
= m3
Quantity of steel to be provided at top = m3
Quantity of steel to be provided at bottom = m3
Top & bottom face:Quantity of steel to be provided in Longitudinal direction= m3
Assuming a clear cover of = mmLength of bar - = mArea of steel required in Longitudinal direction
= mm2
Provide 9 nos of bars mm dia at top & bottom face.= mm2
Transverse steel:Quantity of steel to be provided in Longitudinal direction= m3
Assuming a clear cover of = mmAssuming a dia of bar = mmLength of bar - = m
Volume of each stirrup = m3
no of stirrups required for m/length = nosRequired Spacing =
= mmProvide mm dia bar mm c/c stirrups throught in length of abutment cap.
mm2
3003000.3 1.20 124.32
1100
4.32
0.04320.02160.0216
0.010850
12.00 0.100 11.9
1.20 0.100 1.1
0.010811.9
907.563
12
0.00012
12
1017.88
0.010850
12 125904.779
81000
8125

Consulting Engineers Group Ltd., Jaipur_______________________________________________________________________
Bridge Design Report______________________________________________________________________
Design of Dirt wall:Dirt wall designed as a vertical cantilever.
F1
F2
Intensity for rectangular portion = x x = t/m2
F1 = x x = tIntensity for triangular portion = x x = t/m2
F2 = x x = tM1 = x = t-mM2 = x = t-mM1+ M2 = t-mTotal moment at base of dirt wall /m length = t-m/m
Thickness of dirtwall = mAssuming a clear cover on either face = mmVertical steel on earth face:dia of steel bar = mmAvailable effective depth = - - = mm
effective depth req = = mmx
Ast req = = mm2/mx x
Minimum steel = x x = mm2/m
Provide mm dia bar mm c/c as vertical steel at earth face.mm2/m
Disrtibution steel on earth face:dia of steel bar = mmAvailable effective depth = - - = mm
0.3M = x = t-m/mAst req = = mm2/m
x x
Minimum steel as per IRC:21-200 cl:305.10 = mm2/m
Governing steel at earth face = mm2/mProvide mm dia bar mm c/c as vertical steel at earth face.
mm2/mVertical steel on earth face
As per IRC:21-200 cl:305.10 All faces provide minimum steel of = mm2/mProvide mm dia bar mm c/c as vertical steel at earth face.
mm2/mDistribution steel:As per IRC:21-200 cl:305.10 All faces provide minimum steel of = mm2/mProvide mm dia bar mm c/c as vertical steel at earth face.
mm2/m392.6991
392.6991
25010 200
250
25010 200
10 200392.6991
250
0.296686 70.11142200 0.889 238
0.2966860.3 0.988954
300 50 12 238
12 200565.4867
12
227.9579
0.12100
300 1000 360
0.988954200 0.889 244
0.9889541.51 1000
80.92815
12300 50 6 244
11.867450.988954
0.350
11.31369 0.70 7.9535236.627936 0.59052 3.913929
0.785673 12.00 1.41 6.627936
0.2794 2.00 1.41 0.7857
0.6706
1.41
0.67056 12.00 1.41
0.2794 2.00 1.2
11.31369

Consulting Engineers Group Ltd., Jaipur_______________________________________________________________________
Bridge Design Report______________________________________________________________________
7.400 0.3 0.900235.100
0.7511
1.756
slop V1:H 1.52.667 233.344
10 0.3008d 0.000
1.20 233.0444.000 0.00
0.000 233.044
H.F.L 232.673.400
9b
6.020
8c
L.W.L225.824
5 9a8a
6
227.024 1.20 0.00 227.024
0.700 8 9 0.7004 2 Founding
7 Lvl225.824
0.500 3 1 0.500
3.400 1.200 2.000
6.60

Consulting Engineers Group Ltd., Jaipur_______________________________________________________________________
Bridge Design Report______________________________________________________________________
Wind Force Calculation
Span c/c of Abutment 14.60 m
Section details
Deck level at abutment 235.100 mWearing coat + Girder depth + Bearing thickness + Pedestal ht. 1.552 mAbutment cap level 233.548 mFoundation level adopted 225.900 mFoundation top level 227.100Average bed level 229.420 mHeight of dirt wall 1.552 mThickness of abutment cap 0.300 mHt. of abutment from foundation base to top of cap 233.548-225.900 7.648 mThickness of foundation slab at junction 1.200 mThickness of foundation slab at edge 0.500 mNet ht. of abutment from top of fnd. slab to bottom of cap 7.648-1.200-0.300 6.148 mHt. of back fill from bottom of foundation 235.10-225.90 9.20 mSurcharge height as per IRC:78-2000, clause 710.4.4 1.20 mThickness of dirt wall (as per clause 710.6.4 of IRC:78-2000) 0.300 mWidth of abutment cap 0.430+0.320+0.300 1.200 mHeight of return wall above top of foundation slab 235.100-225.900-1.200 8.000 m
Wind Forces
On live load
Intensity of wind force on moving live load 300 kg/mExposed length of live load 14.60 mHorizontal wind force 43.8 kNHeight of action of this force above deck 1.5 mHeight of action of this force from top of foundation 9.500 mHeight of action of this force from bottom of foundation 10.700 m
On deck
Girder depth + crash barrier 2.45 mExposed area of deck per span 17.89 m2Average height above foundation top 9.325 mWind pressure at this height 88.00 kg/m2Wind force on deck per span 15.74 kN
Total on superstructure
Wind force on loaded superstructure 29.77 kNMin. force on loaded superstructure @ 450 kg/m 32.85 kNHence applicable wind force on loaded superstructure 32.85 kNHeight of combined c.g. of the forces above foundation top 9.454 mHeight of combined c.g. of the forces at foundation bottom 10.654 mLevel of action of this force 236.554 mWind force on unloaded superstructure 15.74 kNMin. force on unloaded superstructure @ 240 kg/m2 42.92 kNHence applicable wind force on unloaded superstructure 42.92 kNHeight of c.g. of the forces above foundation top 9.32 mHeight of c.g. of the forces at foundation bottom 10.53 mLevel of action of this force 236.43 m

Consulting Engineers Group Ltd., Jaipur_______________________________________________________________________
Bridge Design Report______________________________________________________________________
On substructure
Exposed area of abutment & cap 4.95 m2Average height above top of foundation 5.584 mWind pressure at this height 71.00 kg/m2Wind force on substructure 3.52 kNAverage height from bottom of foundation 5.584 mAverage height from bottom of abutment shaft 4.384Moment at the bottom of foundation Total Transverse Longitudinal
Loaded condition 369.61 369.61 0.00 kN.mUnloaded condition 471.41 471.41 0.00 kN.m
Transverse moment due to wind forces are say 47 t-m.Moment at the bottom of abutment shaft bottom
Loaded condition 325.97 325.97Unloaded condition 415.69 415.69
Transverse moment due to wind forces are say 42 t-m.

Consulting Engineers Group Ltd., Jaipur Bridge Design Report ________________________________________________________________________ INPUT FILE: 70r.STD 3. STAAD PLANE 4. INPUT WIDTH 72 5. UNIT METER MTON 6. PAGE LENGTH 1000 7. UNIT METER MTON 8. JOINT COORDINATES 9. 1 0.00 0 0;2 0.3 0 0;3 14.3 0 0;4 14.6 0 0 10. MEMBER INCIDENCES 11. 1 1 2 3 12. MEMBER PROPERTY CANADIAN 13. 1 TO 3 PRI YD 1.0 ZD 1.0 14. CONSTANT 15. E CONCRETE ALL 16. DENSITY CONCRETE ALL 17. POISSON CONCRETE ALL 18. SUPPORT 19. 2 3 PINNED 20. DEFINE MOVING LOAD 21. TYPE 1 LOAD 8.0 2*12 4*17.0 DIS 3.96 1.52 2.13 1.37 3.05 1.37 22. LOAD GENERATION 175 23. TYPE 1 -13.4 0. 0. XINC .2 24. PERFORM ANALYSIS 25. LOAD LIST 74 26. PRINT SUPPORT REACTION SUPPORT REACTION SUPPORT REACTIONS -UNIT MTON METE STRUCTURE TYPE = PLANE ----------------- JOINT LOAD FORCE-X FORCE-Y FORCE-Z MOM-X MOM-Y MOM Z 2 74 0.00 34.46 0.00 0.00 0.00 0.00 3 74 0.00 65.54 0.00 0.00 0.00 0.00 27. FINISH

Consulting Engineers Group Ltd., Jaipur Bridge Design Report ________________________________________________________________________________
INPUT FILE: CLASS A.STD 3. STAAD PLANE 4. INPUT WIDTH 72 5. UNIT METER MTON 6. PAGE LENGTH 1000 7. UNIT METER MTON 8. JOINT COORDINATES 9. 1 0.00 0 0;2 0.3 0 0;3 14.3 0 0;4 14.6 0 0 10. MEMBER INCIDENCES 11. 1 1 2 3 12. MEMBER PROPERTY CANADIAN 13. 1 TO 3 PRI YD 1.0 ZD 1.0 14. CONSTANT 15. E CONCRETE ALL 16. DENSITY CONCRETE ALL 17. POISSON CONCRETE ALL 18. SUPPORT 19. 2 3 PINNED 20. DEFINE MOVING LOAD 21. TYPE 1 LOAD 2*2.7 2*11.4 4*6.8 DIS 1.1 3.2 1.2 4.3 3 3 3 22. LOAD GENERATION 202 23. TYPE 1 -18.8 0. 0. XINC .2 24. PERFORM ANALYSIS 25. LOAD LIST 74 26. PRINT SUPPORT REACTION SUPPORT REACTION SUPPORT REACTIONS -UNIT MTON METE STRUCTURE TYPE = PLANE ----------------- JOINT LOAD FORCE-X FORCE-Y FORCE-Z MOM-X MOM-Y MOM Z 2 74 0.00 30.31 0.00 0.00 0.00 0.00 3 74 0.00 19.69 0.00 0.00 0.00 0.00 ************** END OF LATEST ANALYSIS RESULT ************** 27. FINISH

Consulting Engineers Group Ltd., Jaipur Bridge Design Report ________________________________________________________________________________________________
Abutment SHAFT ..DRY NORMAL Depth of Section = 1.200 m Width of Section = 12.000 m along width-compression face- no of bar: 80 tension face- no of bar: 160 Dia (mm) 16 20 Cover (cm) 7.50 10.5 along depth-compression face- no of bar: 8 tension face- no of bar: 8 Dia (mm) 16 16 Cover (cm) 7.50 7.5 Modular Ratio : Compression = 10.0 Modular Ratio : Tension = 10.0 Allowable Concrete Stress = 85.00 Kg/cm^2 Allowable Steel Stress = 2040.00 Kg/cm^2 Axial Load = 441.604 T Mxx = 906.488 Tm Myy = 164.933 Tm Intercept of Neutral axis : X axis : = 192.893 m : y axis : = .330 m Concrete Stress Governs Design Stress in Concrete due to Loads = 57.84 Kg/cm^2 Stress in Steel due to Loads = 1374.71 Kg/cm^2 Percentage of Steel = .48 % Abutment SHAFT ..DRY SPAN DISLODGED Depth of Section = 1.200 m Width of Section = 12.000 m Modular Ratio : Compression = 10.0 Modular Ratio : Tension = 10.0 Allowable Concrete Stress = 85.00 Kg/cm^2 Allowable Steel Stress = 2040.00 Kg/cm^2 Axial Load = 230.567 T Mxx = 800.568 Tm Myy = .000 Tm Intercept of Neutral axis : X axis : = ******* m : y axis : = .294 m

Consulting Engineers Group Ltd., Jaipur Bridge Design Report ________________________________________________________________________________________________
Steel Stress Governs Design Stress in Concrete due to Loads = 49.21 Kg/cm^2 Stress in Steel due to Loads = 1341.50 Kg/cm^2 Percentage of Steel = .48 % Abutment SHAFT ..HFL NORMAL Depth of Section = 1.200 m Width of Section = 12.000 m Modular Ratio : Compression = 10.0 Modular Ratio : Tension = 10.0 Allowable Concrete Stress = 85.00 Kg/cm^2 Allowable Steel Stress = 2040.00 Kg/cm^2 Axial Load = 360.301 T Mxx = 725.735 Tm Myy = 164.933 Tm Intercept of Neutral axis : X axis : = 156.141 m : y axis : = .334 m Concrete Stress Governs Design Stress in Concrete due to Loads = 46.67 Kg/cm^2 Stress in Steel due to Loads = 1098.35 Kg/cm^2 Percentage of Steel = .48 % Abutment SHAFT ..HFL SPAN DISLODGED Depth of Section = 1.200 m Width of Section = 12.000 m Modular Ratio : Compression = 10.0 Modular Ratio : Tension = 10.0 Allowable Concrete Stress = 85.00 Kg/cm^2 Allowable Steel Stress = 2040.00 Kg/cm^2 Axial Load = 149.265 T Mxx = 619.815 Tm Myy = .000 Tm Intercept of Neutral axis : X axis : = ******* m : y axis : = .288 m Steel Stress Governs Design Stress in Concrete due to Loads = 37.99 Kg/cm^2 Stress in Steel due to Loads = 1064.81 Kg/cm^2 Percentage of Steel = .48 %
CEG.Ltd., Jaipur Bridge Design Report
Consultancy Services for Feasibility Study and Detailed Project Preparation for Proposed Orissa State Road Project
DESIGN OF SUPERSTRUCTURE

Consulting Engineers Group Ltd., Jaipur Bridge Design Report ________________________________________________________________________
For Design of Superstructure of RCC Girder 14.0 m span refer MOST
STANDARD Drawing titled “STANDARD PLANS FOR HIGHWAY
BRIDGES (R.C.C T-beam and Slab Superstructure)” Drg. No. SD/250 to
SD/256.

CEG.Ltd., Jaipur Bridge Design Report
Consultancy Services for Feasibility Study and Detailed Project Preparation for Proposed Orissa State Road Project
BRIDGE AT CH:21+000

CEG.Ltd., Jaipur Bridge Design Report
Consultancy Services for Feasibility Study and Detailed Project Preparation for Proposed Orissa State Road Project
DESIGN OF SUBSTRUCTURE

Consulting Engineers Group Ltd., Jaipur______________________________________________________________________________________
Bridge Design Report_____________________________________________________________________________________
DESIGN DATA
Formation Level = 221.200 mGround Level = 217.178 mLowest Water Level = 210.678 mHighest Flood Level = 218.807 mFounding Level = 210.678 mThickness of bearing & pedestal = 0.300 mWidth of abutment = 12.000 mBouyancy factor = 1.0Safe Bearing Capacity = 45.300 t/sqmDry density of earth = 1.800 t/cumSubmerged density of earth = 1.0 t/cumSaturated density of earth = 2.000 t/cumCoefficient of base friction = 0.5Span (c/c of exp. joint) = 12.600 mOverall Width of deck slab = 12.000 mWidth of carriageway = 11.000 mWidth of crash barrier = 0.500 mDepth of Superstructure = 1.200 mTkickness of wearing coat = 0.056 mUnit wt of concrete = 2.400 t/m3
no. of elastomeric bearing = 4size of elastomer brgs.( 500 x 250 x 50 mm )Grade of Concrete - M 25 25Grade of Reinforcement - Fe 415 (HYSD)Live Load -
-Permissible Compressive stress in Concrete - 850 t/m2
Permissible Tensile stress in Steel - 20400 t/m2
Modular ratio, m - 10factor, k - 0.294Lever arm factor, j - 0.902Moment of Resistance - 113 t/m2
Thickness of returnwall 0.5 m
COEFFICIENT OF ACTIVE EARTH PRESSURE
AS PER COULOMB'S THEORY, COEFFICIENT OF ACTIVE EARTH PRESSURE ISKa = SIN2 (α+φ)
SIN2�� SIN(���� 2
1 +
WHEREφ = ANGLE OF INTERNAL FRICTION OF EARTHα = ANGLE OF INCLINATION OF BACK OF WALLδ = ANGLE OF INTERNAL FRICTION BETWEEN WALL & EARTHι = ANGLE OF INCLINATION OF BACKFILL
HERE φ = 30 o = 0.524 Radianα = 90 o = 1.571 Radianδ = 20 o = 0.349 Radianι = 0 o = 0 Radian
Ka = 0.2973Therefore, Horizontal coefficient of Active earth pressure = KaCOSφ = φ = φ = φ = Kha = 0.2794
One Lane of 70R Wheeled + Class A3 lanes of Class A
SIN(� + �).SIN(� - �)SIN(� - �).SIN(� + �)

Consulting Engineers Group Ltd., Jaipur______________________________________________________________________________________
Bridge Design Report_____________________________________________________________________________________
HEIGHT OF ABUTMENT
Total height of abutment = Formation Level - Founding Level = 10.522 mFor DESIGN purpose, the height of abutment is considered as, say, = 10.520 m
CALCULATION OF ACTIVE EARTH PRESSURE
2water level 1
10.522
4 3
Active Earth Pressure Surcharge DRY. condition
a) Service Condition
1 LL Surcharge 1.0 1.200 0.67 84.66 5.261 445.412 0.5 10.522 5.29 334.06 4.419 1476.283 1.0 0.000 5.29 0.00 0.000 0.004 SubmgEarth 0.5 0.000 0.00 0.00 0.000 0.00
418.72 1921.69
b) Span Dislodge Condition
Net force = 418.72 - 84.66 = 334.06 tNet moment = 1921.69 - 445.41 = 1476.28 tm
H.F.L. condition
a) Service Condition
1 LL Surcharge 1.0 1.200 0.67 84.66 5.261 445.412 0.5 2.393 1.34 19.20 9.134 175.363 1.0 8.129 1.34 130.43 4.065 530.154 SubmgEarth 0.5 8.129 2.27 110.77 2.710 300.15
345.07 1451.07
b) Span Dislodge Condition
Net force = 345.07 - 84.66 = 260.40 tNet moment= 1451.07 - 445.41 = 1005.66 tm
Area factor
TOTAL
TOTAL
Element no.
Area factorComponent
Dry Earth
Element No.
Component
Dry Earth
Pressure (t/m2)
Height (m)
Height (m)
Pressure (t/m2)
Force (t)
C.G. from
base (m)Force (t)
Moment (tm)
Moment (tm)
C.G. from
base (m)
Consulting Engineers Group Ltd., Jaipur______________________________________________________________________________________
Bridge Design Report_____________________________________________________________________________________
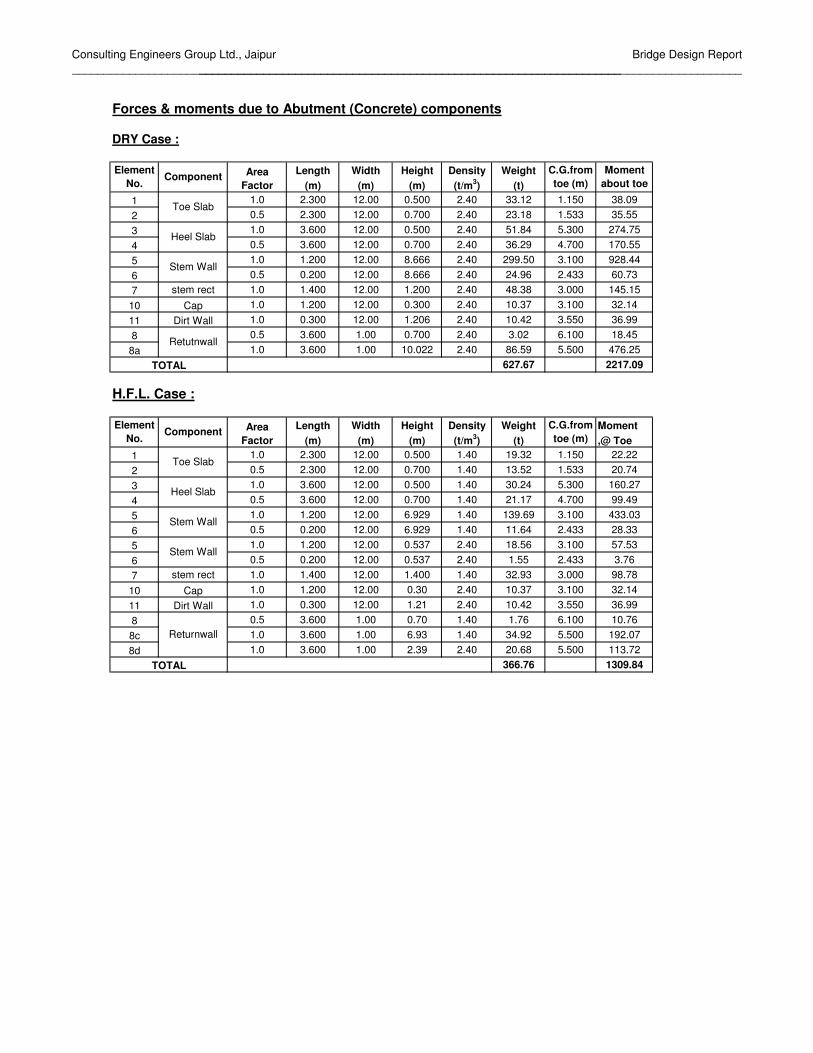
Forces & moments due to Abutment (Concrete) components
DRY Case :
Length Width Height Density Weight(m) (m) (m) (t/m3) (t)
1 1.0 2.300 12.00 0.500 2.40 33.12 1.150 38.092 0.5 2.300 12.00 0.700 2.40 23.18 1.533 35.553 1.0 3.600 12.00 0.500 2.40 51.84 5.300 274.754 0.5 3.600 12.00 0.700 2.40 36.29 4.700 170.555 1.0 1.200 12.00 8.666 2.40 299.50 3.100 928.446 0.5 0.200 12.00 8.666 2.40 24.96 2.433 60.737 stem rect 1.0 1.400 12.00 1.200 2.40 48.38 3.000 145.1510 Cap 1.0 1.200 12.00 0.300 2.40 10.37 3.100 32.1411 Dirt Wall 1.0 0.300 12.00 1.206 2.40 10.42 3.550 36.998 0.5 3.600 1.00 0.700 2.40 3.02 6.100 18.458a 1.0 3.600 1.00 10.022 2.40 86.59 5.500 476.25
627.67 2217.09
H.F.L. Case :
Length Width Height Density Weight Moment(m) (m) (m) (t/m3) (t) ,@ Toe
1 1.0 2.300 12.00 0.500 1.40 19.32 1.150 22.222 0.5 2.300 12.00 0.700 1.40 13.52 1.533 20.743 1.0 3.600 12.00 0.500 1.40 30.24 5.300 160.274 0.5 3.600 12.00 0.700 1.40 21.17 4.700 99.495 1.0 1.200 12.00 6.929 1.40 139.69 3.100 433.036 0.5 0.200 12.00 6.929 1.40 11.64 2.433 28.335 1.0 1.200 12.00 0.537 2.40 18.56 3.100 57.536 0.5 0.200 12.00 0.537 2.40 1.55 2.433 3.767 stem rect 1.0 1.400 12.00 1.400 1.40 32.93 3.000 98.7810 Cap 1.0 1.200 12.00 0.30 2.40 10.37 3.100 32.1411 Dirt Wall 1.0 0.300 12.00 1.21 2.40 10.42 3.550 36.998 0.5 3.600 1.00 0.70 1.40 1.76 6.100 10.768c 1.0 3.600 1.00 6.93 1.40 34.92 5.500 192.078d 1.0 3.600 1.00 2.39 2.40 20.68 5.500 113.72
366.76 1309.84
TOTAL
Toe Slab
Stem Wall
Heel Slab
Area Factor
Component
Area Factor
TOTAL
Element No.
Element No.
Heel Slab
Toe Slab
Stem Wall
Component
Moment about toe
C.G.from toe (m)
Retutnwall
Returnwall
C.G.from toe (m)
Stem Wall

Consulting Engineers Group Ltd., Jaipur______________________________________________________________________________________
Bridge Design Report_____________________________________________________________________________________
Forces & moments due to Earth and LL surcharge
DRY Case : Self weight of Earth
Length Width Height Density Weight Moment(m) (m) (m) (t/m3) (t) `@ Toe
8 0.5 3.600 11.00 0.700 1.8 24.95 6.100 152.18
8a 1.0 3.600 11.00 9.322 1.800 664.47 5.500 3654.60689.42 3806.78
H.F.L Case :
Length Width Height Density Weight Moment(m) (m) (m) (t/m3) (t) `@Toe
8 0.5 3.600 11.000 0.7 1.000 13.86 6.100 84.558c 1.0 3.600 11.000 6.929 1.000 274.39 5.5 1509.148d DRY 1.0 3.600 11.000 2.393 1.800 170.57 5.500 938.15
458.82 2531.83
L.L.SURCHARGE
Length Width Height Density Weight Moment`@ Toe
12 DRY EARTH 0.00 3.600 11.00 1.20 1.80 0.00 5.500 0.00
SUMMARY OF FORCES AND MOMENTS:
181.78 0.00 181.78 0.001317.09 1317.09 825.59 825.591498.87 1317.09 1007.36 825.59429.72 334.06 356.07 260.40563.50 0.00 563.50 0.006023.87 6023.87 3841.67 3841.676587.37 6023.87 4405.17 3841.674.395 4.57 4.37 4.650.745 0.924 0.723 1.003
1116.50 1216.48 728.31 828.28
105.78 0.00 105.78 0.001921.69 1476.28 1451.07 1005.662027.47 1476.28 1556.85 1005.66910.96 259.80 828.54 177.38
3.25 4.08 2.83 3.82 Safe against overturning
1.744 1.971 1.41 1.585 Not safe
I.R.C 78-2000:cl706.3.4
Horz. braking forceEarth Pressure
Component
Span dislodged
Relieving Moment @ c/l base (M1)
ElementNo
Area Factor
Service Cond.
Total Vertical Load V = (a) + (b)Total Horizontal Force H =Moment @ toe due to (a)
Case. L.W.L.LOAD CASE
ElementNo
Area Factor
Component
TOTAL
ElementNo
Component
Area Factor
Case. H.F.L.
C.G.from toe (m)
C.G.from toe
C.G.from toe (m)
Service Cond.
Span dislodged
Vertical load from superstructure including LL surcharge (a)Vertical load from substructure (b)
Against sliding ( µ x V / H )
Total overturning Moment ( M2)
Factor of Safety Against overturning ( M / M2 )
Moment @ toe due to (b)Total Moment @ toe (M)Dist. of C.G. of V from toe Z = M/V
Net moment ( M2-M1) = ML
eccentricity (e = Z -b/2)
overturning moment due to
SATURATED SOIL
TOTAL
DRY EARTH
Consulting Engineers Group Ltd., Jaipur______________________________________________________________________________________
Bridge Design Report_____________________________________________________________________________________
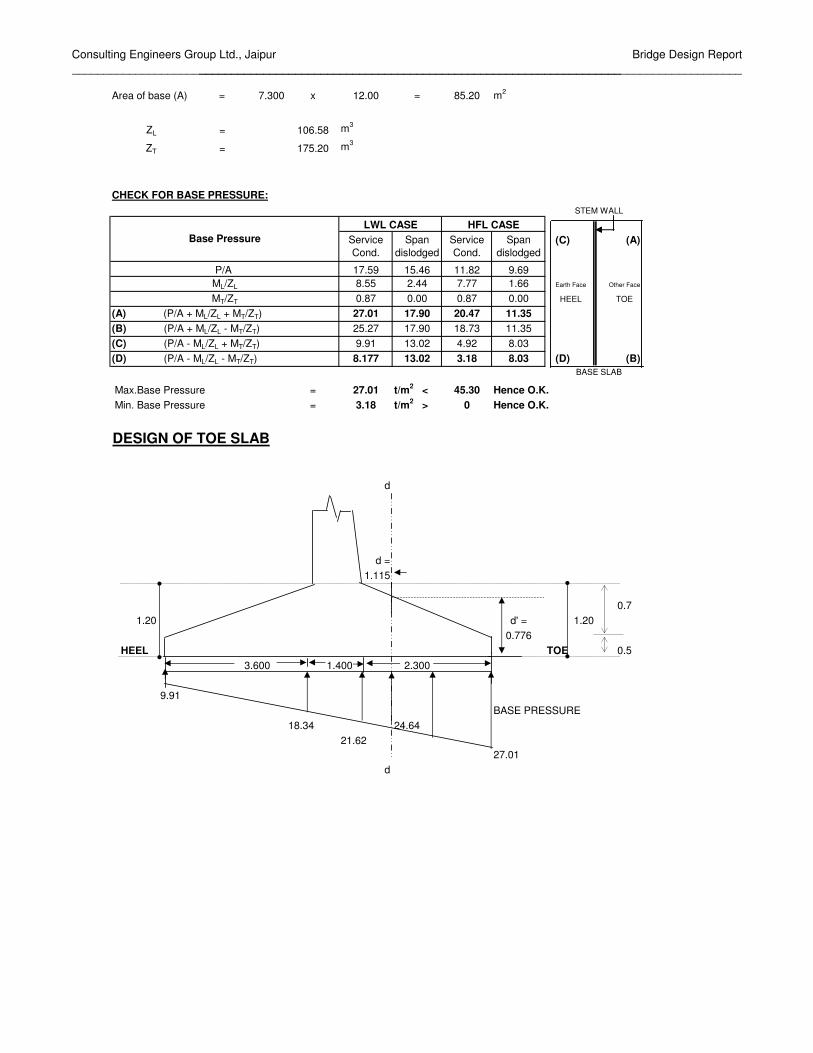
7.300 x 12.00 = 85.20 m2
ZL = 106.58 m3
ZT = 175.20 m3
CHECK FOR BASE PRESSURE:
(C) (A)
17.59 15.46 11.82 9.698.55 2.44 7.77 1.66 Earth Face Other Face
0.87 0.00 0.87 0.00 HEEL TOE
27.01 17.90 20.47 11.3525.27 17.90 18.73 11.359.91 13.02 4.92 8.038.177 13.02 3.18 8.03 (D) (B)
Max.Base Pressure = 27.01 t/m2 < 45.30 Hence O.K. Min. Base Pressure = 3.18 t/m2 > 0 Hence O.K.
DESIGN OF TOE SLAB
d
d =1.115
0.71.20 d' = 1.20
0.776HEEL TOE 0.5
3.600 2.300
9.91BASE PRESSURE
18.34 24.6421.62
27.01d
Base PressureLWL CASE
Span dislodged
Service Cond.
1.400
Span dislodged
Service Cond.
STEM WALL
BASE SLAB
HFL CASE
Area of base (A) =
(C) (P/A - ML/ZL + MT/ZT)(B) (P/A + ML/ZL - MT/ZT)
(D) (P/A - ML/ZL - MT/ZT)
P/A ML/ZL
MT/ZT
(A) (P/A + ML/ZL + MT/ZT)

Consulting Engineers Group Ltd., Jaipur______________________________________________________________________________________
Bridge Design Report_____________________________________________________________________________________
BENDING MOMENT AT FACE OF STEM
Element Area fact. force L.A. Moment1 1.0 2.760 1.150 3.1742 0.5 1.932 0.767 1.481
Rect. 1.0 -49.729 1.150 -57.189Trian. 0.5 -6.194 1.533 -9.497
-51.231 -62.031
Bending Moment at face of stem 62.031 tm/m
Effective depth required 0.742 m
Effective depth provided at face of stem 1.115 m
Area of Reinforcement required 3024 mm2
Minimum steel required 1673 mm2 I.R.C 78-2000 Clause:707.2.7
Distribution steel 669 mm2/mmainsteel 3024 mm2 12 φ , @ 150 C/C
753.9822Hence provide , 25 φ , @ 150 C/C
0 φ , @ 150 C/CThere is no tension below foundation, hence foundation will not have negative momentat top. However in reference to clause 707.2.8 of IRC: 78-2000, the requirement of reinforcement at top is follows.Minimum steel reinfocement as per above clause 250 mm2/m
provide 12 φ , @ 150 C/C753.9822
Check for Shear
SHEAR FORCE AT "d" FROM FACE OF STEM
Element Area fact. force L.A. Moment1 1.0 1.422 0.593 0.8432 0.5 0.995 0.395 0.393
Rect. 1.0 -29.193 0.593 -17.297Trian. 0.5 -1.405 0.790 -1.110
-28.181 -17.171
Effective depth ( d' ) at distence d 0.776 m
Shear force at critical section 28.2 t
Bending Moment at critical section 17.17 tm
tan β = 0.34
Net shear force S-M*tanβ/d' 20.72 t
Hence, Shear stress 26.71 t/m2
% of reinforcement 0.42Permissible shear stress 29.05 t/m2 Hence O.K.
TOTAL
Upward base pressure
TOTAL
Upward Base pressure
Downward Loads
Loadings
Loadings
Downward loads

Consulting Engineers Group Ltd., Jaipur______________________________________________________________________________________
Bridge Design Report_____________________________________________________________________________________
DESIGN OF HEEL SLAB
0.7 HEEL TOE
0.5003.600 2.300
8.17716.61
16.6119.89 25.27
BENDING MOMENT AND SHEAR FORCE AT FACE OF STEM
Element Area fact. force L.A. moment3 1 4.320 1.800 7.7764 0.5 3.024 1.200 3.6298 0.5 4.536 2.400 10.886
1 60.407 1.800 108.7320.5 4.536 2.400 5.4431 7.468 1.800 13.442
Rect. 1 -29.438 1.800 -52.989Trian. 0.5 -15.174 1.200 -18.209
39.678 78.710
Bending Moment at face of stem 78.710 tm
Effective depth required 0.836 mEffective depth provided at face of stem 1.115 m
Area of Reinforcement required 3838.91 mm2
Minimum steel 1672.50 mm2 I.R.C 78-2000 Clause:707.2.7
Distribution steel 669.00 mm2/mmainsteel 3838.91 mm2
12 φ , @ 150 C/CHence provide , 25 φ , @ 125 C/C 753.9822
0 φ , @ 125 C/CThere is no tension below foundation, hence foundation will not have negative momentat top. However in reference to clause 707.2.8 of IRC: 78-2000, the requirement of reinforcement at top is follows.Minimum steel reinfocement as per above clause 250 mm2/m
provide 12 φ , @ 150 C/C753.9822
Loadings
Upward base pressure
1.400
TOTAL
8a
Downward Loads.
Consulting Engineers Group Ltd., Jaipur______________________________________________________________________________________
Bridge Design Report_____________________________________________________________________________________
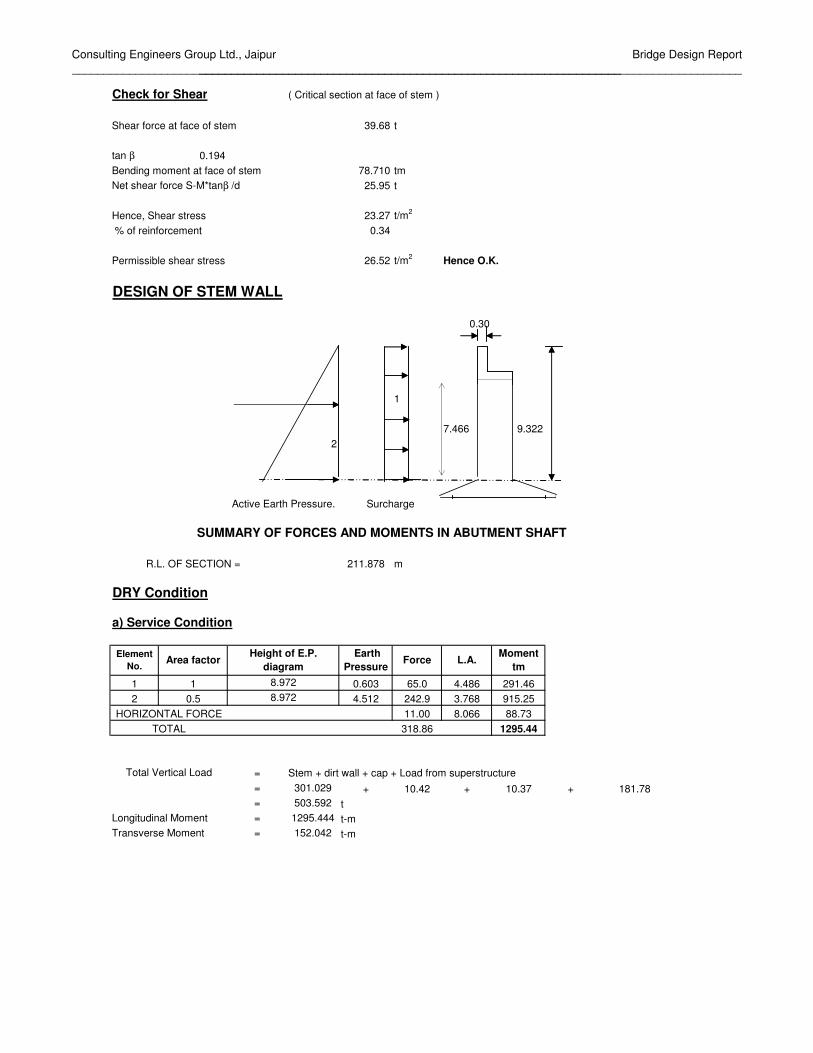
Check for Shear ( Critical section at face of stem )
Shear force at face of stem 39.68 t
tan β = 0.194Bending moment at face of stem 78.710 tmNet shear force S-M*tanβ /d 25.95 t
Hence, Shear stress 23.27 t/m2
% of reinforcement 0.34
Permissible shear stress 26.52 t/m2 Hence O.K.
DESIGN OF STEM WALL
0.30
1
7.466 9.3222
R.L. OF SECTION = 211.878 m
a) Service Condition
1 1 0.603 65.0 4.486 291.462 0.5 4.512 242.9 3.768 915.25
11.00 8.066 88.73318.86 1295.44
= Stem + dirt wall + cap + Load from superstructure= 301.029 + 10.42 + 10.37 + 181.78= 503.592 t
Longitudinal Moment = 1295.444 t-mTransverse Moment = 152.042 t-m
Total Vertical Load
TOTAL
8.9728.972
HORIZONTAL FORCE
Moment tm
L.A.Element No.
SUMMARY OF FORCES AND MOMENTS IN ABUTMENT SHAFT
DRY Condition
Earth Pressure
Force
Surcharge
Area factorHeight of E.P.
diagram
Active Earth Pressure.

Consulting Engineers Group Ltd., Jaipur______________________________________________________________________________________
Bridge Design Report_____________________________________________________________________________________
b) Span Dislodged case
= Stem + dirt wall + cap + Load from superstructure= 301.029 + 10.42 + 10.37 + 0.00= 321.817 t
Longitudinal Moment = 1206.718 t-mTransverse Moment = 0.000 t-m
H.F.L. Condition
a) Service Condition
1 LL Surcharge 1.0 1.200 0.603 64.97 4.486 291.462 0.5 1.987 1.11 13.24 7.591 100.483 1.0 6.929 1.11 92.32 3.465 319.834 SubmgEarth 0.5 6.929 1.94 80.48 2.310 185.88
251.01 897.66
= Stem + dirt wall + cap + Load from superstructure= 169.888 + 10.42 + 10.37 + 181.78= 372.451 t
Longitudinal Moment = 986.389 t-mTransverse Moment = 152.042 t-m
b) Span Dislodged case
= Stem + dirt wall + cap + Load from superstructure= 169.888 + 10.42 + 10.37 + 0.00= 190.676 t
Longitudinal Moment = 897.663 t-mTransverse Moment = 0.000 t-m
1.3 m2
For horizontal reinforcement area of steel required for the stem at the section/metre = 215.3876 mm2
Providing 12 ,@ 525.09 c/c say, 150 C/C as horizontal reinforcement
Cross Sectional area
Total Vertical Load
Element no.
Component
Total Vertical Load
Total Vertical Load
C.G. from
base (m)
Moment (tm)
Dry Earth
TOTAL
Area factorHeight
(m)Pressure
(t/m2)Force (t)

Consulting Engineers Group Ltd., Jaipur______________________________________________________________________________________
Bridge Design Report_____________________________________________________________________________________
Movement of Deck: Total Length of Bridge = m
= x = mmLongitudinal Force :
= x x mm= =
= MpaShear force per Bearing = x x x = N
= tTotal shear force for 4 bearings ( with 5 % increase )
= x 4 x = tRefer IRC : 6 clause 214.5.1.5;
% increase for variation in movement of spanTotal shear force = x = t
As per clause 214.2 of IRC:6, horizontal braking force Fh, for each span is:For Class A Single lane : Fh = x = t
For class 70R wheeled : Fh = x = t
For class A 3 lane Fh = x + x = tFor class 70R wheeled +class A 1 lane
Fh = x + x = tFor class A 3 lane
Longitudinal horizontal force = + = t Say, t
For class 70R wheeled +class A 1 laneLongitudinal horizontal force = + = t Say, t
Span dislodged conditionLongitudinal horizontal force = + = t Say, t
Summary of Longitudinal Forces :
Transverse eccentricityClass 70RW+ Class A
e =
Class A 3 lane
6.841.711
1.711
60.533.095 28.33
3.15
7.0825
60.5 0.05 28.3 13.523
28.3
Longitudinal horizontal force (t)
12.106
2
0.00
0.0005 6300
Load Case
Span dislodged condition70R+class A 1lane
8.0011.00
Class A 3 lane
0.000 3.709 3.709 4.0
11.02
2
13.523 3.709 10.5
0.063250
0.803250 78751.0 500
Size of bearingStrain in bearing 3.150
50
500
1.1 3.372
Shear modulus 1.0
10
0.063
8.0
0.803 1.05
28.3 5.666
3.372
7.083 3.709
0.2
0.2 60.5
7.25
0.2
0.2
28.30.05
12.6
3.709
50

Consulting Engineers Group Ltd., Jaipur______________________________________________________________________________________
Bridge Design Report_____________________________________________________________________________________
e =
Summary of Dead load & Live loads from Superstructure. ( STAAD Pro)P ML MT
Dead Load Reaction:t
SIDL tL.L Max Reaction Case70R + Class A tClass A 3 Lane t
5.3 0.7 0.7
152.04
21.1071.81
181.78
88.8684.99
152.0459.49

Consulting Engineers Group Ltd., Jaipur______________________________________________________________________________________
Bridge Design Report_____________________________________________________________________________________
φφ
φ no.both sides
% Reinforcement provided = mm2
Summary of Loads at Abutment Shaft bottom :
1 DRY condition P ML MT
With L.LCheck for Cracked/Uncracked Section
Length of section = mmWidth of section = mmGross Area of section Ag = mm2
Gross M.O.I of section Igxx = mm4
Gross M.O.I of section Igyy = mm4
y
x x
y
Abutment section
Transformed sectional properties of section:Adopting
Modular ratio m =Cover
Dia of Bars =No of bars in tension face (longer) =No of bars in compression face =
No of bars in shorter direction =
Total bars in section =
0 0
8
316
20 16200
100
1200
12000
1070 68
120014400000
1.728E+12
1.728E+14
12000
12000
PLAN : ABUTMENT SHAFT86155.037
503.59 1295.44 152.04
12000
1200 16 8
16 10020 200
Consulting Engineers Group Ltd., Jaipur______________________________________________________________________________________
Bridge Design Report_____________________________________________________________________________________
Steel Area As = mm2
% of Steel = %y
x x
y
Asx = mm2
Asy = mm2
Area of concrete Ac = Ag - As = mm2
C.G of Steel placed on longer face = mmC.G of Steel placed on shorter face = mmTransformed Area of Section Atfm = mm2
Transformed M.Itxx = Igxx + 2 m - 1 Asxax2
= mm4
Zxx = M.Itxx = mm3
d/2Transformed M.Ityy = Igyy + 2 m - 1 Asyay2
= mm4
Zyy = M.Ityy = mm3
d/2
Permissible stressesMinimum Gross Moment of inertia Imin = mm4
Area of section = mm2
r = mmEffective length of Abutment shaft (IRC:21-2000 cl: 306.2.1)
Abutment shaft height L = mEffective length Leff = mSlenderness ratio = <Type of member = 1
1 Short ColumnStress reduction coefficient (IRC:21-2000 cl: 306.4.2,3) 2 Long Column
β =Permissible stresses : concrete
σcbc = N/mm2
σco = N/mm2
Tensile stress = N/mm2
Permissible stresses : Steelσst = N/mm2
8.3333
6.25
0.61
200
11.31132.653 50
1
1.728E+12
14400000346.41016
9.426
2.04569E+12
3.409E+09
1.73819E+142.897E+10
14313845530
593215175395
525
5932
62832
1608.5
861550.5983

Consulting Engineers Group Ltd., Jaipur______________________________________________________________________________________
Bridge Design Report_____________________________________________________________________________________
S.No Item DRY CaseLoads and Moments With L.L
1 P t
2 ML t-m
3 MT t-m
Actual(calculated) Stresses
4 σco,cal P/Atfm
5 σcbc,cal ML/Zxx
6 σcbc,cal MT/Zyy
7 σcbc,cal = 5 + 6
Permissible Stresses8 σcbc
9 σco
Check for Minimum steel area mm2
Conc.Area Required for directstress(1)/(9)
0.8% of area required0.3% of Ag
Governing steel mm2
Provided Steel area mm2
Check for safety of section
σco,cal + σcbc,cal
σco σcbc < 1
Check for Cracked /Uncracked section
σco,cal - σcbc,cal
Permissible Basic tensile stress in concreteSection to be designed as
-0.61Cracked
6.25
3.799531164
0.052483082
3.852014246
8.3333333
503.59
14 86155.037
0.5153373
-3.520167
12 43200
13 43200
10805747.24
11 6445.9779
1295.44
152.042
0.331847713

Consulting Engineers Group Ltd., Jaipur______________________________________________________________________________________
Bridge Design Report_____________________________________________________________________________________
a
A B
b
X directionY direction
A' B'
Width of Solid return wall (a) =Width of Cantilever return wall =Avg Height of Solid return wall (b) =Height of Cantilever return at Tip =Height of Cantilever return at Root =Thickness of Solid Return at farther end =Thickness of Solid Return at Root =Thickness of Solid Return at bottom =Thickness of Solid Return at top =Thickness of Cantilever return =
Unit wt of Soil = t/m3
Grade of concrete = M 30σcbc = t/m2
m =σst = t/m2
k =j =
R = t/m2
Case (1) For uniformly distributed load over entire plate
a/b = For a/b = β1 = β2 =
For a/b = β1 = β2 =
a/b = β1 =β2 =
3.604.00
9.672
221.200
211.528
0.75
3.604.009.6720.75
2.666667
2.666667
0.50.50.50.50.5
1.8
102010
204000.3333330.888889
151.1111
0.188
0.398
0.3722084 0.349181
0.3722084 0.25
0.375
0.182
0.353
0.39331

Consulting Engineers Group Ltd., Jaipur______________________________________________________________________________________
Bridge Design Report_____________________________________________________________________________________
Live Load Surcharge:
q = x x = t/m2
σbmax = β1 x q x b2
t2
σamax = β2 x q x b2
t2
σbmax = x x = t/m2
For mm of width
Z = x = mm3
6 = m3
Hence Moment /m width along Y direction
MY /m width = x = t-m/m
σamax = x x = t/m2
For mm of width
Z = x = mm3
6 = m3
Hence Moment /m width along X direction
MX /m width = x = t-m/mCase (2) For Triangular loading due to earth pressure
a/b = For a/b = β1 = β2 =
For a/b = β1 = β2 =
a/b = β1 =β2 =
Earth pressure:
q = x x = t/m2
σbmax = β1 x q x b2
t2
σamax = β2 x q x b2
t2
σbmax = x x = t/m2
For mm of width
Z = x = mm3
6 = m3
0.2794 1.8 1.2 0.603504
0.3491811 0.603504 93.550.25
78.85396
1000
1000 250000 41666667
0.041667
78.853959 0.041667 3.285582
0.3933102 0.603504 93.55 88.819410.25
1000
1000 250000 41666667
0.041667
88.819413 0.041667 3.700809
0.3722084 0.25 0.133 0.09
0.375 0.212 0.148
0.3722084 0.210236
0.146705
0.2794 1.8 9.672 4.864242
0.2102357 4.864242 93.55 382.66110.25
1000
1000 250000 41666667
0.041667

Consulting Engineers Group Ltd., Jaipur______________________________________________________________________________________
Bridge Design Report_____________________________________________________________________________________
Hence Moment /m width along Y direction
MY /m width = x = t-m/m
σamax = x x = t/m2
For mm of width
Z = x = mm3
6 = m3
Hence Moment /m width along X direction
MX /m width = x = t-m/m
Total Moment in Solid Return /m height = t-m/mAlong X-direction
Total Moment in Solid Return /m width = t-m/mAlong Y-direction
Moment due to Cantilever Return:Moment due to earth pressure at face A - A '
M = x x x x x+ 0.5 x x 1.8 x x x
+ 0.5 x x 1.8 x x X2 x dx x - X+ x 1.8 x x x X x dx x - X
= + + x + x
= t-m
Design of cantilever Return:Assuming 50 mm cover and 12 mm dia bars.Effective depth available = - 50 - 20 - 6 = 424 mm
M = R x b x d2
= x x = t-m
Ast = x 10^6 = mm2
x xAst/m = mm2/m
Provide 12 mm dia @ mm c/c providing mm2 on earth face.
Provide 12 mm dia @ mm c/c providing mm2 on other face.Along Horizantal direction.
382.66108 0.041667 15.94421
0.1467047 4.864242 93.55 267.02490.25
1000
1000 250000 41666667
0.041667
267.02494 0.041667 11.12604
14.82685
19.22979
151.1111 2.666667 0.179776
21.33333 0.653796 10.66667
2.00
0.666667 4.00
0.2794 1.2
0.2794 1.95
0.2794
0.2794
0.750.5625
14.11063
3.621024 1.13157 0.11176
0.444444
4.004.00 2.00
1.8
4.00
72.44307
1835.283
500
688.231
14.1106320400 0.888889 0.424
150 753.9822
180 628.3185

Consulting Engineers Group Ltd., Jaipur______________________________________________________________________________________
Bridge Design Report_____________________________________________________________________________________
Design of Solid Return:Moment due to Cantilever Return:Moment due to Earth pressure at face B-B '
M = x x x x x+ 0.5 x x 1.8 x x x
+ 0.5 x x 1.8 x x X2 x dx x - X+ x 1.8 x x x X x dx x - X
= + + x + x
= t-m
Moment in Solid Return /m height = + = t-m/m
Moment in Solid Return /m width = = t-m/m
Design of face B-B '
Moment in Solid Return /m height = t-m/m
Assuming 50 mm cover and 25 mm dia bars.Effective depth available = - 50 - 20 - 13 = 418 mm
M = R x b x d2
= x x = t-m
Ast = x 10^6 = mm2
x xAst/m = mm2/m
Provide 25 mm dia @ mm c/c providing mm2 on earth face.
Provide 16 mm dia @ mm c/c providing mm2 on other face.Along Horizantal direction.
Design of face A ' -B '
Moment in Solid Return /m width = t-m/m
Assuming 50 mm cover and 25 mm dia bars.Effective depth available = - 50 - 0 - 13 = 438 mm
M = R x b x d2
= x x = t-m
Ast = x 10^6 = mm2
x xAst/m = mm2/m
Provide 25 mm dia @ mm c/c providing mm2 on earth face.
Provide 16 mm dia @ mm c/c providing mm2 on other face.Along Vertical direction.
19.229799.672
4.005.60
5.60
0.653796 39.46667
0.2794 1.2 1.8 0.750.2794 0.5625 4.00
0.2794 0.444444 7.600.2794 1.95 0.666667 7.60
50.07779
14.82685 50.07779 20.00445
10.13887 3.168396 0.11176 98.13333
20.00445
500
151.1111 1 0.174306 26.33961
20.00445 2642.36320400 0.888889 0.4175
2642.363
150 3272.492
150 1340.413
19.22979
500
151.1111 1 0.191406 28.92361
19.22979 2423.92420400 0.888889 0.4375
2423.924
160 3067.962
160 1256.637

Consulting Engineers Group Ltd., Jaipur______________________________________________________________________________________
Bridge Design Report_____________________________________________________________________________________
1. DESIGN FOR FORCES IN LONGITUDINAL DIRECTION
Active earth pressure Ka = 0.279384FOR NORMAL CASE, FA = 1.0unit wt of soil γ = 1.8
δ = 20clear span between return wall = 11.000 mwidth of return wall = 0.5Avg. cover to reinforcement. (FOR 2-3 LAYERS) = 0.150 mH (From formation level) = 9.322 m DESIGN FOR BENDING MOMENT
S.NO. UNITS 1H (FROM TOP) m 9.322
WIDTH OF RETURN AT THIS LEVEL m 3.600FORCE DUE TO EARTH PRESSURE t 123.197
MOMENT DUE TO EARTH PRESSURE tm 482.344FORCE DUE TO L.L. SURCHARGE t 31.718
MOMENT DUE TO L.L. SURCHARGE tm 147.836TOTAL MOMENT tm 630.180
DESIGN MOMENT tm 630.180REQUIRED EFFECTIVE DEPTH m 3.229
EFF. DEPTH AVAILABLE m 3.450AREA OF STEEL REQUIRED cm2 100.720
DIAMETER OF BAR PROVIDED mm 32TOTAL NO. OF BARS no. 16
cm2 128.68O.K.27.8
CHECK FOR SHEAR STRESS
SHEAR FORCE t 159.914SHEAR STRESS t/m2 92.704
Ast/bd x 100 % 0.584PERMISSIBLE SHEAR STRESS MPa 0.33PERMISSIBLE SHEAR STRESS t/m2 33.67
Asv/sv cm2/m 8.387
AREA OF STEEL PROVIDED

Consulting Engineers Group Ltd., Jaipur______________________________________________________________________________________
Bridge Design Report_____________________________________________________________________________________
Design of Abutment Cap:
As the cap is fully supported on the abutment.Minimum thickness of the cap required as per cl: 710.8.2 of IRC:78-2000 is 200 mm.However the thickness of abutment cap is = mmAssuming a cap thickness of = mmVolume of Abutment cap = x x
= m3
Quantity of steel = 1 % of volume= x
= m3
Quantity of steel to be provided at top = m3
Quantity of steel to be provided at bottom = m3
Top & bottom face:Quantity of steel to be provided in Longitudinal direction= m3
Assuming a clear cover of = mmLength of bar - = mArea of steel required in Longitudinal direction
= mm2
Provide 9 nos of bars mm dia at top & bottom face.= mm2
Transverse steel:Quantity of steel to be provided in Longitudinal direction= m3
Assuming a clear cover of = mmAssuming a dia of bar = mmLength of bar - = m
Volume of each stirrup = m3
no of stirrups required for m/length = nosRequired Spacing =
= mmProvide mm dia bar mm c/c stirrups throught in length of abutment cap.
mm212 125
904.779
81000
8125
0.00012
12
1017.88
0.010850
1.20 0.100 1.1
0.010811.9
907.563
12
5012.00 0.100 11.9
0.04320.02160.0216
0.0108
124.32
1100
4.32
3003000.3 1.20

Consulting Engineers Group Ltd., Jaipur______________________________________________________________________________________
Bridge Design Report_____________________________________________________________________________________
Design of Dirt wall:Dirt wall designed as a vertical cantilever.
F1
F2
Intensity for rectangular portion = x x = t/m2
F1 = x x = tIntensity for triangular portion = x x = t/m2
F2 = x x = tM1 = x = t-mM2 = x = t-mM1+ M2 = t-mTotal moment at base of dirt wall /m length = t-m/m
Thickness of dirtwall = mAssuming a clear cover on either face = mmVertical steel on earth face:dia of steel bar = mmAvailable effective depth = - - = mm
effective depth req = = mmx
Ast req = = mm2/mx x
Minimum steel = x x = mm2/m
Provide mm dia bar mm c/c as vertical steel at earth face.mm2/m
Disrtibution steel on earth face:dia of steel bar = mmAvailable effective depth = - - = mm
0.3M = x = t-m/mAst req = = mm2/m
x x
Minimum steel as per IRC:21-200 cl:305.10 = mm2/m
Governing steel at earth face = mm2/mProvide mm dia bar mm c/c as vertical steel at earth face.
mm2/mVertical steel on earth face
As per IRC:21-200 cl:305.10 All faces provide minimum steel of = mm2/mProvide mm dia bar mm c/c as vertical steel at earth face.
mm2/mDistribution steel:As per IRC:21-200 cl:305.10 All faces provide minimum steel of = mm2/mProvide mm dia bar mm c/c as vertical steel at earth face.
mm2/m
0.67056
1.21
0.67056 12.00 1.21
0.2794 2.00 1.2
9.7043440.2794 2.00 1.21 0.673913
0.673913 12.00 1.21 4.8764339.704344 0.60 5.851724.876433 0.50652 2.470011
8.321730.693478
0.350
12300 50 6 244
0.6934781.51 1000
67.76848
159.8493
0.12100
300 1000 360
0.693478200 0.889 244
12 200565.4867
12
0.2080430.3 0.693478
300 50 12 238
250
0.208043 49.16374200 0.889 238
250
25010 200
10 200392.6991
392.6991
392.6991
25010 200

Consulting Engineers Group Ltd., Jaipur______________________________________________________________________________________
Bridge Design Report_____________________________________________________________________________________
7.600 0.3 0.900221.200
0.7511
1.556
slop V1:H 1.52.667 219.644
10 0.3008d 0.000
1.20 219.3444.000 0.00
0.000 219.344
H.F.L 218.8073.800
9b 9.322
7.466
8c
L.W.L210.678
5 9a8a
6
211.878 1.20 0.20 211.878
0.700 8 9 0.7004 2 Founding
7 Lvl210.678
0.500 3 1 0.500
3.600 1.400 2.300
7.30

Consulting Engineers Group Ltd., Jaipur Bridge Design Report ________________________________________________________________________ INPUT FILE: 70r.STD 3. STAAD PLANE 4. INPUT WIDTH 72 5. UNIT METER MTON 6. PAGE LENGTH 1000 7. UNIT METER MTON 8. JOINT COORDINATES 9. 1 0.00 0 0;2 0.3 0 0;3 14.3 0 0;4 14.6 0 0 10. MEMBER INCIDENCES 11. 1 1 2 3 12. MEMBER PROPERTY CANADIAN 13. 1 TO 3 PRI YD 1.0 ZD 1.0 14. CONSTANT 15. E CONCRETE ALL 16. DENSITY CONCRETE ALL 17. POISSON CONCRETE ALL 18. SUPPORT 19. 2 3 PINNED 20. DEFINE MOVING LOAD 21. TYPE 1 LOAD 8.0 2*12 4*17.0 DIS 3.96 1.52 2.13 1.37 3.05 1.37 22. LOAD GENERATION 175 23. TYPE 1 -13.4 0. 0. XINC .2 24. PERFORM ANALYSIS 25. LOAD LIST 74 26. PRINT SUPPORT REACTION SUPPORT REACTION SUPPORT REACTIONS -UNIT MTON METE STRUCTURE TYPE = PLANE ----------------- JOINT LOAD FORCE-X FORCE-Y FORCE-Z MOM-X MOM-Y MOM Z 2 74 0.00 34.46 0.00 0.00 0.00 0.00 3 74 0.00 65.54 0.00 0.00 0.00 0.00 27. FINISH
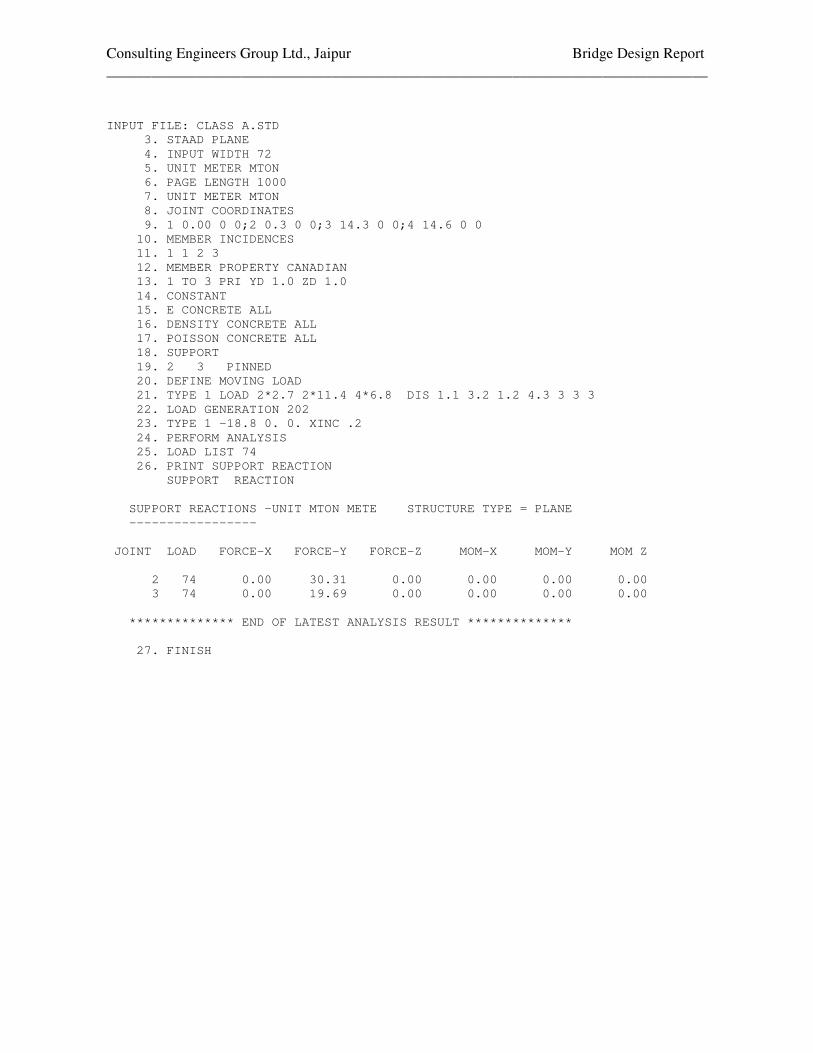
Consulting Engineers Group Ltd., Jaipur Bridge Design Report ________________________________________________________________________________
INPUT FILE: CLASS A.STD 3. STAAD PLANE 4. INPUT WIDTH 72 5. UNIT METER MTON 6. PAGE LENGTH 1000 7. UNIT METER MTON 8. JOINT COORDINATES 9. 1 0.00 0 0;2 0.3 0 0;3 14.3 0 0;4 14.6 0 0 10. MEMBER INCIDENCES 11. 1 1 2 3 12. MEMBER PROPERTY CANADIAN 13. 1 TO 3 PRI YD 1.0 ZD 1.0 14. CONSTANT 15. E CONCRETE ALL 16. DENSITY CONCRETE ALL 17. POISSON CONCRETE ALL 18. SUPPORT 19. 2 3 PINNED 20. DEFINE MOVING LOAD 21. TYPE 1 LOAD 2*2.7 2*11.4 4*6.8 DIS 1.1 3.2 1.2 4.3 3 3 3 22. LOAD GENERATION 202 23. TYPE 1 -18.8 0. 0. XINC .2 24. PERFORM ANALYSIS 25. LOAD LIST 74 26. PRINT SUPPORT REACTION SUPPORT REACTION SUPPORT REACTIONS -UNIT MTON METE STRUCTURE TYPE = PLANE ----------------- JOINT LOAD FORCE-X FORCE-Y FORCE-Z MOM-X MOM-Y MOM Z 2 74 0.00 30.31 0.00 0.00 0.00 0.00 3 74 0.00 19.69 0.00 0.00 0.00 0.00 ************** END OF LATEST ANALYSIS RESULT ************** 27. FINISH
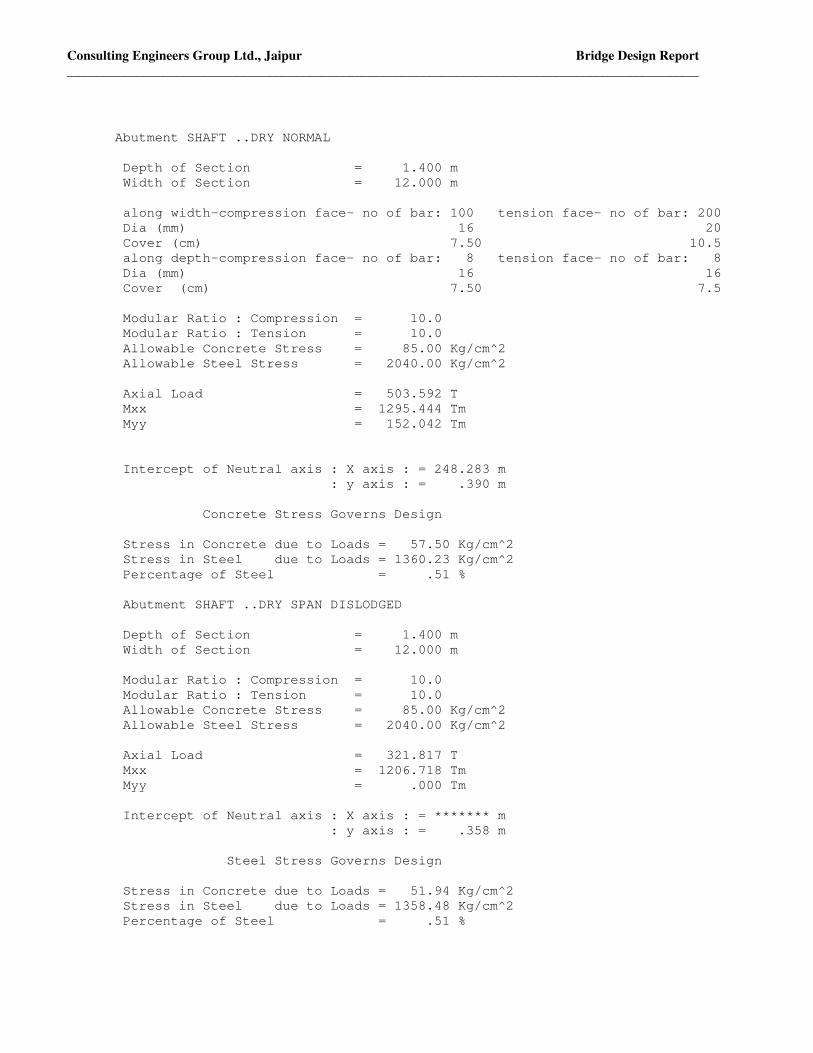
Consulting Engineers Group Ltd., Jaipur Bridge Design Report _______________________________________________________________________________________________
Abutment SHAFT ..DRY NORMAL Depth of Section = 1.400 m Width of Section = 12.000 m along width-compression face- no of bar: 100 tension face- no of bar: 200 Dia (mm) 16 20 Cover (cm) 7.50 10.5 along depth-compression face- no of bar: 8 tension face- no of bar: 8 Dia (mm) 16 16 Cover (cm) 7.50 7.5 Modular Ratio : Compression = 10.0 Modular Ratio : Tension = 10.0 Allowable Concrete Stress = 85.00 Kg/cm^2 Allowable Steel Stress = 2040.00 Kg/cm^2 Axial Load = 503.592 T Mxx = 1295.444 Tm Myy = 152.042 Tm Intercept of Neutral axis : X axis : = 248.283 m : y axis : = .390 m Concrete Stress Governs Design Stress in Concrete due to Loads = 57.50 Kg/cm^2 Stress in Steel due to Loads = 1360.23 Kg/cm^2 Percentage of Steel = .51 % Abutment SHAFT ..DRY SPAN DISLODGED Depth of Section = 1.400 m Width of Section = 12.000 m Modular Ratio : Compression = 10.0 Modular Ratio : Tension = 10.0 Allowable Concrete Stress = 85.00 Kg/cm^2 Allowable Steel Stress = 2040.00 Kg/cm^2 Axial Load = 321.817 T Mxx = 1206.718 Tm Myy = .000 Tm Intercept of Neutral axis : X axis : = ******* m : y axis : = .358 m Steel Stress Governs Design Stress in Concrete due to Loads = 51.94 Kg/cm^2 Stress in Steel due to Loads = 1358.48 Kg/cm^2 Percentage of Steel = .51 %

Consulting Engineers Group Ltd., Jaipur Bridge Design Report _______________________________________________________________________________________________
Abutment SHAFT ..HFL NORMAL Depth of Section = 1.400 m Width of Section = 12.000 m Modular Ratio : Compression = 10.0 Modular Ratio : Tension = 10.0 Allowable Concrete Stress = 85.00 Kg/cm^2 Allowable Steel Stress = 2040.00 Kg/cm^2 Axial Load = 372.451 T Mxx = 986.389 Tm Myy = 152.042 Tm Intercept of Neutral axis : X axis : = 189.496 m : y axis : = .391 m Concrete Stress Governs Design Stress in Concrete due to Loads = 44.09 Kg/cm^2 Stress in Steel due to Loads = 1046.55 Kg/cm^2 Percentage of Steel = .51 % Abutment SHAFT ..HFL SPAN DISLODGED Depth of Section = 1.400 m Width of Section = 12.000 m Modular Ratio : Compression = 10.0 Modular Ratio : Tension = 10.0 Allowable Concrete Stress = 85.00 Kg/cm^2 Allowable Steel Stress = 2040.00 Kg/cm^2 Axial Load = 190.676 T Mxx = 897.663 Tm Myy = .000 Tm Intercept of Neutral axis : X axis : = ******* m : y axis : = .349 m Steel Stress Governs Design Stress in Concrete due to Loads = 38.47 Kg/cm^2 Stress in Steel due to Loads = 1044.81 Kg/cm^2 Percentage of Steel = .51 %

CEG.Ltd., Jaipur Bridge Design Report
Consultancy Services for Feasibility Study and Detailed Project Preparation for Proposed Orissa State Road Project
DESIGN OF SUPERSTRUCTURE

Consulting Engineers Group Ltd., Jaipur Bridge Design Report ________________________________________________________________________
For Design of Superstructure of RCC Girder 12.0 m span refer MOST
STANDARD Drawing titled “STANDARD PLANS FOR HIGHWAY
BRIDGES (R.C.C T-beam and Slab Superstructure)” Drg. No. SD/260 to
SD/266.

CEG.Ltd., Jaipur Bridge Design Report
Consultancy Services for Feasibility Study and Detailed Project Preparation for Proposed Orissa State Road Project
BRIDGE AT CH:27+600 & 28+900
CEG.Ltd., Jaipur Bridge Design Report
Consultancy Services for Feasibility Study and Detailed Project Preparation for Proposed Orissa State Road Project
STABILITY CHECK & DESIGN OF SUBSTRUCTURE(ABUTMENT PIER)

Consulting Engineers Group Ltd., Jaipur____________________________________________________________________________
Bridge Design Report___________________________________________________________________________
F.R.L
H.F.L
G.L
216.189
0.15
0.0751.2
0.45 0.45
0.15
214.172
0.15
2.725
0.051.60
206.804
0.82
215.448215.148
208.272
0.225
213.948
205.834
205.9840.97
7.250
0.225
0.700

Consulting Engineers Group Ltd., Jaipur____________________________________________________________________________
Bridge Design Report___________________________________________________________________________
2.825
0.15
0.8
0.875
0.15
4.25
0.875
2.825 0.90
7.250
2.50
0.8
1.600
0.700
1.80

Consulting Engineers Group Ltd., Jaipur____________________________________________________________________________
Bridge Design Report___________________________________________________________________________
2.50
0.15
0.82
4.25
7.95

Consulting Engineers Group Ltd., Jaipur____________________________________________________________________________
Bridge Design Report___________________________________________________________________________
Design Data :For design purposes, following parameters have been considered.
Grade of concrete = M -Abutment Cap = M -
Grade of reinforcement steel = Fe -Centre to Centre distance of A / Expansion joints = mCentre to Centre distance of Bearing = mDepth of superstructure = mmThickness of wearing coat = mmFormation level along C of carriage way = mSoffit level =Pedestal top level =Height of bearing and Pedestal = mL.W.L./Bed level = mH.F.L = mM.S.L = mFounding Level = mAbutment cap top level = mLive Load Class A two Lane
Class 70R wheeled Bearing :neoprene but during raising Tar paper bearing may be kept.Seismic zone = II
The following codes are used for the design of substructure:1 IRC : 6 - 20002 IRC : 21 - 20003 IRC : 78 - 2000
20
208.2720.025
216.189
41525
66056.00
(a)(b)
9.200
215.448
215.448215.473
214.172205.452205.834
8.800

Consulting Engineers Group Ltd., Jaipur____________________________________________________________________________
Bridge Design Report___________________________________________________________________________
Longitudinal translation due to creep, shrinkage & temperature =Horizontal movement = x x = mm
Longitudinal Force := x x mm= =
= MpaShear force per Bearing = x x x = N
= tTotal shear force for 4 bearings ( with 5 % increase )
= x 4 x = tRefer IRC : 6 clause 214.5.1.5;
% increase for variation in movement of spanTotal shear force = x = t
As per clause 214.2 of IRC:6, horizontal braking force Fh, for each span is:For Class A 2 lane : Fh = x = t
For class 70R wheeled : Fh = x = t
Summary of Longitudinal Forces :
2.1661.1
500.046
250
0.00050.0005 4.60 1000 2.300
0.2
0.2
47.72
0.469 1.05
49.5 9.896
1.969
1.969
Shear modulus 1.0
10
0.046
Size of bearingStrain in bearing 2.300
50
400
0.469250 46001.0 400
0.00
9.544
Load Case
Span dislodged condition70R
7.116.94
Class A 2 lane
Longitudinal horizontal force (t)

Consulting Engineers Group Ltd., Jaipur____________________________________________________________________________
Bridge Design Report___________________________________________________________________________
Dry Condition with L.La) Vertical load and their moments about C/L of Foundation base.I1 D.L Reaction eL ML eT MT
a Left span2 S.I.D.L
a Left span
4 L.La Left span
70R Wheeled Class A 2 Lane
II Substructure V ρρρρ P eL ML eT MT
1 Pedestala Left span
2 Abut cap RAbut cap Tr
3 Abut shaftup to G.Lbelow G.L
4 Footing5 Earth above
footing67 Earth wt on
heel side
b) Horizantal Forces and Moments withrespect to Base
1 Longitudinal Forces at bearing levelHL HT eL ML eT MT
2 Earth pressure
SummaryP = tML = t-mMT = t-m
A =ZL =ZT =
-331.7383.277 1.8 149.898 -2.213
071.2
P58.00 0.225
16.02
0
13.20 0.225 2.97 0 0
13.05 0
30.92511.133 0.62547.7249.48
0.2250.225
10.737 1.1 52.492
02.4 0.02310.0096 0.225 0.0052 0
2.385 2.4 5.724 0 0 0 05.37 2.4 12.888 0 0 0 0
14.461 2.4 34.706 0
03.7401 2.4 8.9762 0
02.4 48.103
0 0 00 0 0
0 0 020.04351.338 1.80 92.408 0
0 0
0
6.94 66.8790 9.639
202.83 -332
0
9.614 0
30.813
436.22
37.23221.826
6.94 0
52.492131
369.35
118.92 26.757 52.492
321.75

Consulting Engineers Group Ltd., Jaipur____________________________________________________________________________
Bridge Design Report___________________________________________________________________________
Check for Maximum Allowable Base Pressure:
Pmax = P + +
A
= + + = t/m2
Pmin = P - -
A
= - - = t/m2
b s P1
P4 Heel Toe
P3 P2b s
Toe3
4Base pressure diagram
21
Design of Toe slabLoadings Element Area factor Force L.A MomentDownward loads 1
2Upward base pressure
34 0.5
-11.22 1.4125 -15.849-3.8808 0.9417 -3.6544
9.3217
4.5116
2.8251.60
1
MT
ZT
321.7530.813
131.2637.232
ZL
ML
52.49221.826
16.373
ML MT
ZL ZT
21.826321.75 131.26 52.492 4.5116
6.9166
1.0170.5 2.7798
1.41250.9417
1
37.232
11.22
11.563
13.968
2.825
16.373
0.15
0.82
4.25
7.250
30.813
1.43652.6176
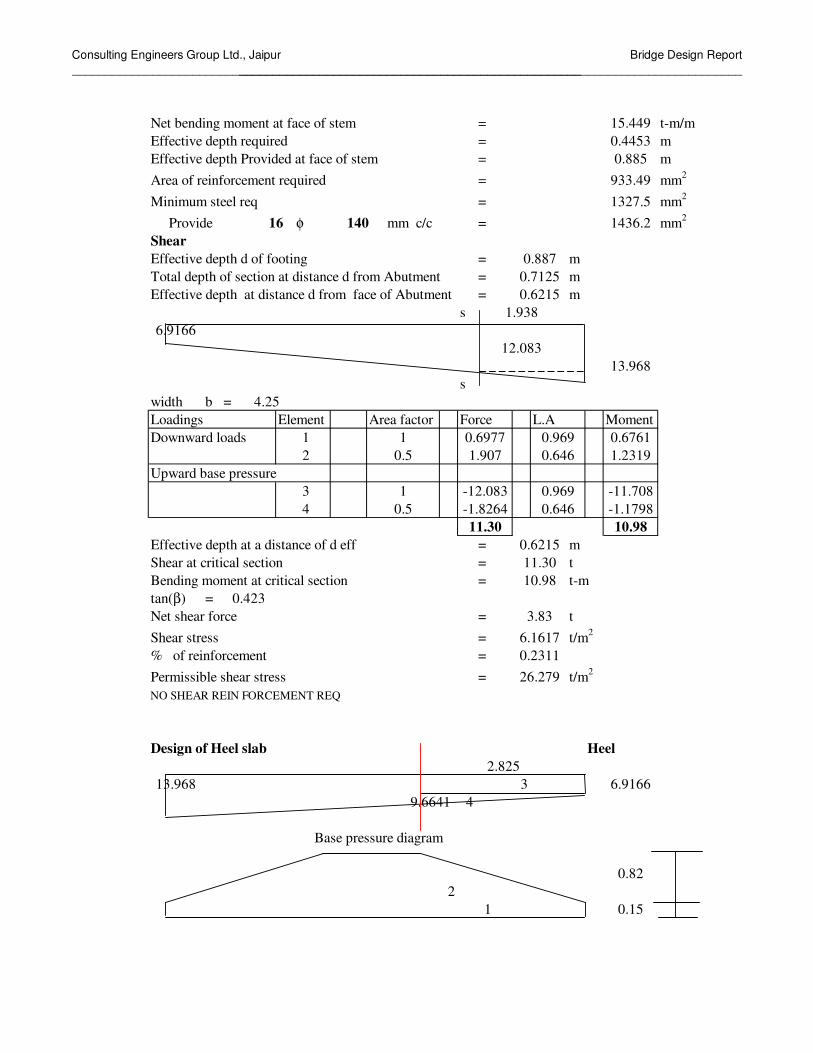
Consulting Engineers Group Ltd., Jaipur____________________________________________________________________________
Bridge Design Report___________________________________________________________________________
Net bending moment at face of stem = t-m/mEffective depth required = mEffective depth Provided at face of stem = mArea of reinforcement required = mm2
Minimum steel req = mm2
Provide φ mm c/c = mm2
ShearEffective depth d of footing = mTotal depth of section at distance d from Abutment = mEffective depth at distance d from face of Abutment = m
s
swidth b =Loadings Element Area factor Force L.A MomentDownward loads 1
2Upward base pressure
34
Effective depth at a distance of d eff = mShear at critical section = tBending moment at critical section = t-mtan(β) =Net shear force = tShear stress = t/m2
% of reinforcement =Permissible shear stress = t/m2
NO SHEAR REIN FORCEMENT REQ
Design of Heel slab Heel
34
Base pressure diagram
21
6.9166
0.15
0.82
2.82513.968
9.6641
0.423
0.231126.279
11.30 10.98
11.3010.98
0.5 -1.8264 0.646 -1.17981 -12.083 0.969 -11.708
0.5 1.907 0.646 1.23191 0.6977 0.969 0.6761
1327.516 140 1436.2
0.885933.49
15.4490.4453
6.1617
0.6215
4.25
3.83
0.8870.71250.6215
13.968
6.91661.938
12.083

Consulting Engineers Group Ltd., Jaipur____________________________________________________________________________
Bridge Design Report___________________________________________________________________________
Loadings Element Area factor Force L.A MomentDownward loads 1
2earth
Upward base pressure34
Net bending moment at face of stem = t-m/mEffective depth required = mEffective depth Provided at face of stem = mArea of reinforcement required = mm2
Minimum steel req = mm2
Provide φ mm c/c = mm2
ShearEffective depth d of footing = mTotal depth of section at distance d from Abutment = mEffective depth at distance d from face of Abutment = m
s
s
width b =Loadings Element Area factor Force L.A MomentDownward loads 1
2earth
Upward base pressure34
Effective depth at a distance of d eff = mShear at critical section = tBending moment at critical section = t-mtan(β) =Net shear force = tShear stress = t/m2
% of reinforcement =Permissible shear stress = t/m2
NO SHEAR REIN FORCEMENT REQ
0.639731.411
51.892 1.4125 73.298
35.599 0.969 34.496
28.520.6138
0.423
15.9679.80
28.52
0.5 -1.8264 0.646 -1.17981 -6.9166 0.969 -6.7022
13.9688.8014
6.9166
4.25
1376.325 125 3927
63.9280.90580.91753726
1 1.017 1.41250.5 2.7798 0.9417
1 -6.9166
29.46
29.46
1 0.6977 0.969
0.6138
0.8825
0.5 1.907 0.646 1.2319
0.7138
1.938
0.6761
-3.65440.5 -3.8808 0.9417
1.43652.6176
-9.76971.4125

Consulting Engineers Group Ltd., Jaipur____________________________________________________________________________
Bridge Design Report___________________________________________________________________________
Dry Condition with L.La) Vertical load and their moments about Abutment Shaft bottomII Substructure V ρρρρ P eL ML eT MT
1 Pedestala Left span
2 Abut cap RAbut cap Tr
3 Abutment shaftup to G.Lbelow G.L
4 Earth pressure
b) Horizantal Forces and Moments withrespect to Abutment Shaft bottom
1 Longitudinal Forces at bearing levelHL HT eL ML eT MT
Summary for design of AbutmentP = tML = t-mMT = t-m
0 00.0096 2.4 0.0231 0.225
2.4 4.293 0
0.0052
00 0 00 0 0
6.94
2.4 08.9762
60.886
3.7401
8.669
60.149
00 0
280
60.149
0
0 0 00
1.7888
6.94
52.492
0
367.35
0
179.81
8.644 00
5.37 2.4 12.888
14.461 2.4 34.706
280

Consulting Engineers Group Ltd., Jaipur____________________________________________________________________________
Bridge Design Report___________________________________________________________________________
H.F.L Condition with L.La) Vertical load and their moments about C/L of Foundation base.I1 D.L Reaction eL ML eT MT
a Left span2 S.I.D.L
a Left span
3 L.La Left span
70R Wheeled Class A 2 Lane
II Substructure V ρρρρ P eL ML eT MT
1 Pedestala Left span2 Abut cap R
Abut cap Tr3 Abut shaft
up to H.F.Lbelow H.F.L
4 Footing5 Earth above
footing6 Earth Pressure
Earth wt onheel side
b) Horizantal Forces and Moments withrespect to Base
1 Longitudinal Forces at bearing levelHL HT eL ML eT MT
SummaryP = tML = t-mMT = t-m
0.000
0.000 0.000
0.000
0.000
83.277 1.000 -2.213 -184.29
0.000 0.000
0.000
83.277
0.000
0.000 0.000 0.000
0.000 0.0000.000 0.000
0.000
52.49230.925
0.0000.000
12.888
49.480 0.225 11.133 0.62547.720 0.225 10.737
0.000
1.100
71.200 16.020
0.000P
58.000 0.225 13.050
0.00013.200 0.225 2.970 0.000
0.010 2.400 0.023 0.225
118.920 26.757 52.492
2.385 2.4000.005 0.000
5.724 0.000 0.0005.370 2.400
0.000 2.400
0.0000.00018.201 1.400 25.481 0.0000.00020.043 1.400 28.060
51.338 1.000 51.338 0.000
123.515 46.096 0.000
66.879
0.000 0.000
9.614
230.383
6.938 0.000 9.639
6.938 0.000 66.879 0.000
242.435139.73252.492
7

Consulting Engineers Group Ltd., Jaipur____________________________________________________________________________
Bridge Design Report___________________________________________________________________________
Check for Maximum Allowable Base Pressure:
Pmax = P + +
A
= + + = t/m2
Pmin = P - -
A
= - - = t/m2
H.F.L Condition with L.La) Vertical load and their moments about Abutment Shaft bottom
II Substructure V ρρρρ P eL ML eT MT
1 Pedestala Left span
2 Abut cap RAbut cap Tr
3 Abut shaftup to H.F.Lbelow H.F.L
b) Horizantal Forces and Moments withrespect to Abutment Shaft bottom1 Longitudinal Forces at bearing level
HL HT eL ML eT MT
Earth pressure
Summary for design of Abutment shaftP = tML = t-mMT = t-m
0.005 0.000 0.000
0.0000.000 0.000
0.000
ZT
242.435 139.732
ML MT
ZL
14.02630.813 37.232 21.826
52.492
ML MT
ZL ZT
242.435 139.732 52.492 1.71030.813 37.232 21.826
0.010 2.400 0.023 0.225
1.789 2.400 4.293 0.0000.0000.000
0.000 0.0000.000
0.0005.370 2.400
0.000 2.40018.201 1.400 25.481 0.000
8.644 0.000
0.005 0.000
6.938 0.000 8.669
6.938 0.000
12.888
0.000
161.605266.108
0.0000.000 0.000
60.149
52.492
239.346
42.685
179.197
0.000 0.000

Consulting Engineers Group Ltd., Jaipur____________________________________________________________________________
Bridge Design Report___________________________________________________________________________
Summary of Loads at Abutment Shaft bottom :
1 DRY condition P ML MT
With L.L
2 H.F.LWith L.L
179.81 367.35 52.49
161.61 266.11 52.49
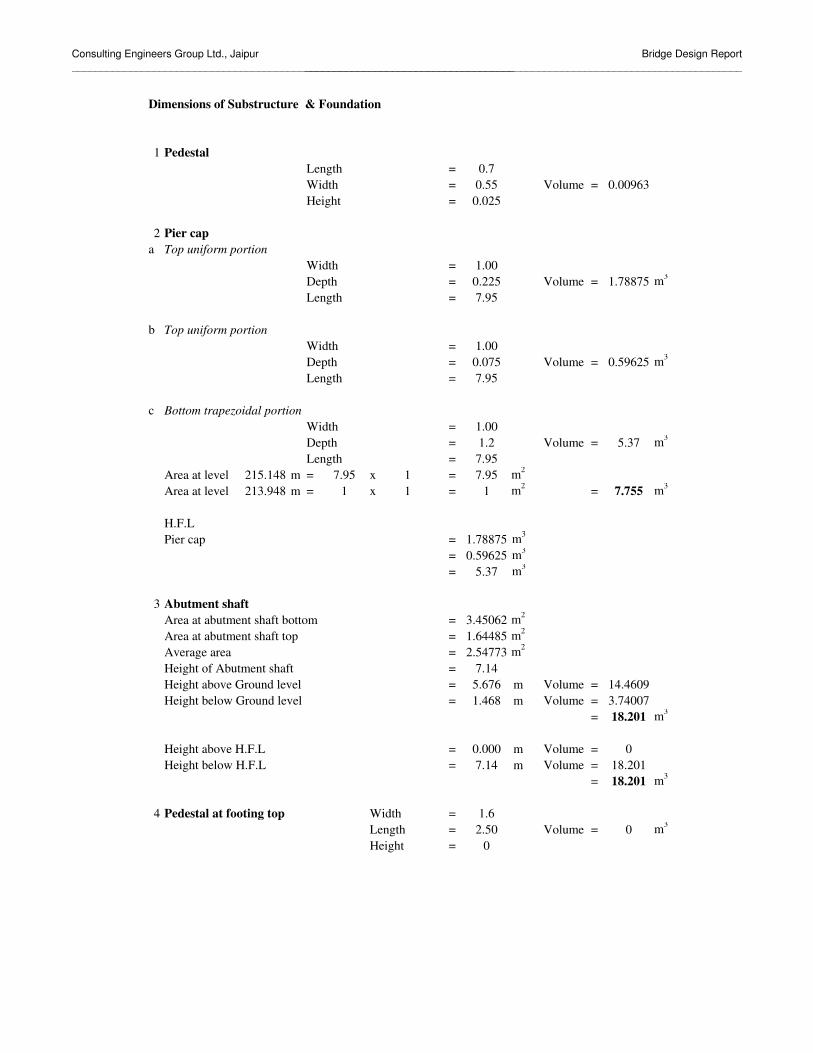
Consulting Engineers Group Ltd., Jaipur____________________________________________________________________________
Bridge Design Report___________________________________________________________________________
Dimensions of Substructure & Foundation
1 PedestalLength =Width = Volume =Height =
2 Pier capa Top uniform portion
Width =Depth = Volume = m3
Length =
b Top uniform portionWidth =Depth = Volume = m3
Length =
c Bottom trapezoidal portionWidth =Depth = Volume = m3
Length =Area at level m = x = m2
Area at level m = x = m2 = m3
H.F.L Pier cap = m3
= m3
= m3
3 Abutment shaftArea at abutment shaft bottom = m2
Area at abutment shaft top = m2
Average area = m2
Height of Abutment shaft =Height above Ground level = m Volume =Height below Ground level = m Volume =
= m3
Height above H.F.L = m Volume =Height below H.F.L = m Volume =
= m3
4 Pedestal at footing top Width =Length = Volume = m3
Height =
0.7
0.59625
0.00963
1.78875
1.001.2
1.468
7.14
1.00
0.550.025
1.00
0.075
0.2257.95
18.201
215.148
3.74007
7.755
5.37
14.4609
00
5.676
7.95
7.95
7.95
018.201
213.948 1 1 17.95 1
0.0007.14
18.201
1.62.50
2.54773
1.788750.59625
5.37
3.450621.64485

Consulting Engineers Group Ltd., Jaipur____________________________________________________________________________
Bridge Design Report___________________________________________________________________________
5 Footing
at foundation levelWidth = mLength = mThickness at Root = mThickness at Tip = m
= m3
Volume of Overburdden earth below ground levelTotal volume x x = m3
Net volume below Ground level = m3
Wt of earth on Heel side above ground level = tSectional Properties of Footing
A = x = m2
ZL = x = m3
ZT = x = m3
83.2769
75.120951.3378
4.250 30.813
2.4387.250
7.250
4.250
4.250 8.76042
7.250 3.01042
37.232
21.826
0.15
7.250
0.97
20.043
4.25

Consulting Engineers Group Ltd., Jaipur____________________________________________________________________________
Bridge Design Report___________________________________________________________________________
DESIGN OF ABUTMENT CAP:
For Outer bearing a =D =
Available effective depthusing mm dia of bars d = - -
= ma = = > 1d
= Pier cap designed as Cantilever
A1 A2 A3 A4
0.3
2.125
1.1258.5
2.25
25 1.5
0.2251.00
2.1251.425
1.4912
0.225
0.05 0.025
8.50
0.875 0.8752.25 2.25 2.25
3.38 1.13
2.5
1.2
3
0.300
2.125
1.2
1.50
1.425

Consulting Engineers Group Ltd., Jaipur____________________________________________________________________________
Bridge Design Report___________________________________________________________________________
Bearings A1 & A4 are effective.A1
DLSIDLLL70RW due to Transverse moment A1 = x =
A1 = x = t
Summary of loads from superstructure:Loads on Outer bearings
A1DLSIDLLL
Selfweight of piercap upto section through outerbearing:
= + x x x= t
Distance of c.g from section = mCalculation of Cantilevermoment at bearing sectionMoment at the face due to load from outerbearing
= x = t-mDue to selfweight of Abutment cap = x = t-m
Total moment at the face of support = t-mTorsion at outerbearing section:
=Eccentricity =Moment = t-m8.3499
6.481.1667
78.860223
0.22537.111
6.482.13
14.53.3
55.35525.31
3.38
11.93
14.5
2.00
1.1667
3.37.3807
0.65
13.00
7.3807
2.4
86.427.56
55.3551.16
1.500
3.000.88
11.9337.111
2.13
0.3 1.50
0.3
37.11
47.72

Consulting Engineers Group Ltd., Jaipur____________________________________________________________________________
Bridge Design Report___________________________________________________________________________
Longitudinal Reinforcement:M = = t-m
For, M - & Fe -N/mm2
N/mm2
Effective depth required = xx
= < O.KAst required =
x x= mm2
Provide nos mm dia bars in layers mm2
This reinforcement will provided in full length of Abutment cap.Check for Shear:At bearing section
Available Effective depth at root = mmDownward Load from Superstructure =
= tDownward Load due to self wt of Abutment cap = t
Total downward Load = t
After shear correction, S.F = V - M tanβd
= - x
= tEquivalent shear IRC:21-2000,cl:304.2.3.1
b = + = m2
Ve = V + x T = tb
Shear stress = x = N/mm2
xArea of tension reinforcement = %
τc = N/mm2
Provide minimum shear
86.42
200
R = 1.10586.42
�st =
25 41586.42
�cbc = 8.33
m = 10
10^71.105 1000
K = 0.294j = 0.902
884.22 1425
200 0.90286.42
6 20 3769.92
43.591 86.42 0.41.425
19.332385
1 1 1
1.6 32.692
32.692 100001000 1425
0.2294
0.26460.2671
37.1116.48
43.591
14253361.8851
142537.111

Consulting Engineers Group Ltd., Jaipur____________________________________________________________________________
Bridge Design Report___________________________________________________________________________
EARTH PRESSURE CALCULATION
Formation level = 216.189 m Founding level = 205.834 mLow Water Level = 208.272 mHighest flood level = 214.172 m
CALCULATION OF ACTIVE EARTH PRESSURE
From Coulomb's theory of active earth pressure
Ka =
Here Angle of internal friction, φ = 30 o
Angle of friction between soil and concrete, δ = 20 o
Surcharge angle i = 0 o
Angle of wall face with horizontal α = 90 o
Bulk density of earth γ = 1.8 t/m3
Submerged density of earth γsub = 1.0 t/m3
Width of abutment = mKa* = sin2 2.09
sin2 1.57 x sin 1.22 x 1 + sin 0.87 x sin 0.52 2
sin 1.22 x sin 1.57* (value of angles in radian)
= 0.750 = 0.29732.523
CALCULATION OF EARTH PRESSURE IN DRY CONDITION
P1= 0.2973 x 1.8 x 10.36 = 5.5 t/m2
P2= 0.2973 x 1.0 x 0.00 = 0 t/m2
F1= 0.5 x 5.542 x 10.36 x 2.5 x cos 0.3= 67.404 t say 68 t 10.36
M = 67.404 x 0.42 x 10.36= 293 t-m
P1 P2CALCULATION OF EARTH PRESSURE IN FULL SUPPLY LEVEL CONDITION
P4= 0.2973 x 1.8 x 2.02 = 1.1 t/m2
P5= 0.2973 x 1.0 x 8.34 = 2.5 t/m2
F4= 0.5 x 1.079 x 2.02 x 2.5 x cos 0.3= 2.5574 t
F5= 0.5 x 2.479 x 8.34 x 2.5 x cos 0.3 F4= 24.28 t H.F.L
F6= 1.08 x 8.34 x 2.5 x cos 0.3= 21.14 t
Total force, F = 2.5574 + 24.28 + 21.14 F6= 48 t F5
M = 2.5574 x ( 0.42 x 2.02 + 8.34 ) P5 P4+ 24.28 x 0.33 x 8.34 + 21.1 x 8.34
= 178 t-m 2
2.50
216.189
216.189
205.83
214.17
2.02
205.834
8.348.34
���
�
���
�
+αδ−α−φδ+φ+δ−αα
φ+α
)isin().sin()isin().sin(
1)sin(.sin
)(sin2
2
2

Consulting Engineers Group Ltd., Jaipur____________________________________________________________________________
Bridge Design Report___________________________________________________________________________
CALCULATION OF LIVE LOAD SURCHARGEDry F7P6= 0.2973 x 1.2 x 1.8 = 0.64 t/m2
F7= 0.64 x 10.36 x 3 x cos 0.3= 16 t
M = 16 x 9.75 = 76 t-m2 P6
H.F.L
P6= 0.2973 x 1.2 x 1.0 = 0.36 t/m2
F7= 0.6422 x 2.02 x 3 x cos 0.3 = t= 0.3568 x 8.34 x 3 x cos 0.3 = t
=
M = 3.043 + x 5.1775 = tm
205.83
10.36
216.189
6.98854810.03156
6.988548147 51.9384
3.043011

Consulting Engineers Group Ltd., Jaipur____________________________________________________________________________
Bridge Design Report___________________________________________________________________________
EARTH PRESSURE CALCULATION
Formation level = 216.189 mAbutment shaft bottom level = 206.804 mLow Water Level = 208.272 mHighest flood level = 214.172 m
CALCULATION OF ACTIVE EARTH PRESSURE
From Coulomb's theory of active earth pressure
Ka =
Here Angle of internal friction, φ = 30 o
Angle of friction between soil and concrete, δ = 20 o
Surcharge angle i = 0 o
Angle of wall face with horizontal α = 90 o
Bulk density of earth γ = 1.8 t/m3
Submerged density of earth γsub = 1.0 t/m3
Width of abutment = mKa* = sin2 2.09
sin2 1.57 x sin 1.22 x 1 + sin 0.87 x sin 0.52 2
sin 1.22 x sin 1.57* (value of angles in radian)
= 0.750 = 0.29732.523
CALCULATION OF EARTH PRESSURE IN DRY CONDITION
P1= 0.2973 x 1.8 x 9.38 = 5.02 t/m2
P2= 0.2973 x 1.0 x 0.00 = 0 t/m2
F1= 0.5 x 5.023 x 9.38 x 2.5 x cos 0.3= 55.367 t say 56 t 9.38
M = 55.367 x 0.42 x 9.38= 218 t-m
P1 P2CALCULATION OF EARTH PRESSURE IN FULL SUPPLY LEVEL CONDITION
P4= 0.2973 x 1.8 x 2.02 = 1.08 t/m2
P5= 0.2973 x 1.0 x 7.37 = 2.19 t/m2
F4= 0.5 x 1.079 x 2.02 x 2.5 x cos 0.3= 2.5574 t
F5= 0.5 x 2.191 x 7.37 x 3 x cos 0.3= 18.96 t H.F.L
F6= 1.08 x 7.37 x 2.5 x cos 0.3= 18.68 t
Total force, F = 2.5574 + 18.96 + 18.68= 40 t
M = 2.5574 x ( 0.42 x 2.02 + 7.37 ) P5 P4+ 18.96 x 0.33 x 7.37 + 18.7 x 7.37
= 136 t-m 2
2.50
7.37
206.80
2.02
214.17
216.189
7.37
216.189
206.804
���
�
���
�
+αδ−α−φδ+φ
+δ−αα
φ+α
)isin().sin()isin().sin(
1)sin(.sin
)(sin2
2
2

Consulting Engineers Group Ltd., Jaipur____________________________________________________________________________
Bridge Design Report___________________________________________________________________________
CALCULATION OF LIVE LOAD SURCHARGEDryP6= 0.2973 x 1.2 x 1.8 = 0.64 t/m2
F7= 0.64 x 9.38 x 3 x cos 0.3= 14 t
M = 14 x 8.78 = 62 t-m2 P6
H.F.L
P6= 0.2973 x 1.2 x 1.0 = 0.36 t/m2
F7= 0.6422 x 2.02 x 3 x cos 0.3 = t= 0.3568 x 7.37 x 3 x cos 0.3 = t
=
M = 3.043 + x 4.6925 = tm6.175536429 43.25803
3.0430116.1755369.218547
9.38
206.80
216.189

Consulting Engineers Group Ltd., Jaipur Bridge Design Report _______________________________________________________________________________ INPUT FILE: 9.2 M SPAN DL.STD 1. STAAD FLOOR 2. START JOB INFORMATION 3. ENGINEER DATE 09-JUN-06 4. END JOB INFORMATION 5. INPUT WIDTH 79 6. UNIT METER MTON 7. JOINT COORDINATES 8. 1 0.0 0.0 0.0;2 0.02 0.0 0.0;3 0.4 0.0 0.0 10 8.4 0.0 0.0;11 8.8 0.0 0.0 9. 12 9.18 0.0 0.0;139.22 0.0 0.0;14 9.6 0.00.0 22 18 0.00.0;2318.380.0 0.0 10. 24 18.4 0.0 0.0 11. REPEAT ALL 1 0.0 0.0 1.0 12. REPEAT 3 0.0 0.0 2.0 13. REPEAT 1 0.0 0.0 1.0 14. MEMBER INCIDENCES 15. 1 1 2 23 1 1 16. REPEAT 5 23 24 17. 139 1 25 143 1 24 18. REPEAT 23 5 1 19. CONSTANTS 20. E 2.7386E+006 21. POISSON 0.15 22. DENSITY 2.4 MEMB 1 TO 138 23. DENSITY 0.0001 MEMB 139 TO 258 24. MEMBER PROPERTY INDIAN 25. 2 TO 11 13 TO 22 117 TO 126 128 TO 137 PRIS AX 0.330 IX 0.024 IZ 0.012 26. 25 TO 34 36 TO 45 94 TO 103 105 TO 114 PRIS AX 0.990 IX 0.072 IZ 0.036 27. 48 TO 57 59 TO 68 71 TO 80 82 TO 91 PRIS AX 1.320 IX 0.096 IZ 0.048 28. 1 12 23 24 35 46 47 58 69 70 81 92 93 104 115 - 29. 116 127 138 PRIS AX 0.0001 IX 0.0002 IZ 0.0001 30. 139 TO 258 PRIS AX 0.0001 IX 0.0002 IZ 0.0001 31. SUPPORTS 32. 27 51 75 99 ENFORCED BUT FX FZ MX MY MZ 33. 38 62 86 110 ENFORCED BUT FX FZ MX MY MZ 34. 35 59 83 107 PINNED 35. 46 70 94 118 PINNED 36. MEMBER RELEASE 37. 1 24 47 93 116 END MZ 38. 23 46 92 115 138 START MZ 39. 12 35 58 81 104 127 START MZ 40. 12 35 58 81 104 127 END MZ 41. LOAD 1 SELFWEIGHT 42. SELF Y -1 43. PERFORM ANALYSIS 44. PRINT SUPPORT REACTION LIST 27 51 75 99 38 62 86 110 35 59 83 107 46 70 94 118

Consulting Engineers Group Ltd., Jaipur Bridge Design Report _______________________________________________________________________________ � SUPPORT REACTION LIST 27 � SUPPORT REACTIONS -UNIT MTON METE STRUCTURE TYPE = FLOOR ----------------- JOINT LOAD FORCE-X FORCE-Y FORCE-Z MOM-X MOM-Y MOM Z � 27 1 0.00 16.77 0.00 0.00 0.00 0.00 51 1 0.00 12.24 0.00 0.00 0.00 0.00 75 1 0.00 12.24 0.00 0.00 0.00 0.00 99 1 0.00 16.77 0.00 0.00 0.00 0.00 38 1 0.00 16.42 0.00 0.00 0.00 0.00 62 1 0.00 12.60 0.00 0.00 0.00 0.00 86 1 0.00 12.60 0.00 0.00 0.00 0.00 110 1 0.00 16.42 0.00 0.00 0.00 0.00 35 1 0.00 16.58 0.00 0.00 0.00 0.00 59 1 0.00 12.44 0.00 0.00 0.00 0.00 83 1 0.00 12.44 0.00 0.00 0.00 0.00 107 1 0.00 16.58 0.00 0.00 0.00 0.00 46 1 0.00 16.86 0.00 0.00 0.00 0.00 70 1 0.00 12.16 0.00 0.00 0.00 0.00 94 1 0.00 12.16 0.00 0.00 0.00 0.00 118 1 0.00 16.86 0.00 0.00 0.00 0.00 ************** END OF LATEST ANALYSIS RESULT ************** 45. FINISH

Consulting Engineers Group Ltd., Jaipur Bridge Design Report ________________________________________________________________________________ INPUT FILE: 9.2 M SPAN SIDL.STD 1. STAAD FLOOR 2. START JOB INFORMATION 3. ENGINEER DATE 09-JUN-06 4. END JOB INFORMATION 5. INPUT WIDTH 79 6. UNIT METER MTON 7. JOINT COORDINATES 8. 1 0.0 0.0 0.0;2 0.02 0.0 0.0;3 0.4 0.0 0.0 10 8.4 0.0 0.0;11 8.8 0.0 0.0 9. 12 9.18 0.0 0.0;13 9.22 0.0 0.0;14 9.6 0.0 0.0 22180.00.0;2318.380.0 0.0 10. 24 18.4 0.0 0.0 11. REPEAT ALL 1 0.0 0.0 1.0 12. REPEAT 3 0.0 0.0 2.0 13. REPEAT 1 0.0 0.0 1.0 14. MEMBER INCIDENCES 15. 1 1 2 23 1 1 16. REPEAT 5 23 24 17. 139 1 25 143 1 24 18. REPEAT 23 5 1 19. CONSTANTS 20. E 2.7386E+006 21. POISSON 0.15 22. DENSITY 2.4 MEMB 1 TO 138 23. DENSITY 0.0001 MEMB 139 TO 258 24. MEMBER PROPERTY INDIAN 25. 2 TO 11 13 TO 22 117 TO 126 128 TO 137 PRIS AX 0.330 IX 0.024 IZ 0.012 26. 25 TO 34 36 TO 45 94 TO 103 105 TO 114 PRIS AX 0.990 IX 0.072 IZ 0.036 27. 48 TO 57 59 TO 68 71 TO 80 82 TO 91 PRIS AX 1.320 IX 0.096 IZ 0.048 28. 1 12 23 24 35 46 47 58 69 70 81 92 93 104 115 - 29. 116 127 138 PRIS AX 0.0001 IX 0.0002 IZ 0.0001 30. 139 TO 258 PRIS AX 0.0001 IX 0.0002 IZ 0.0001 31. SUPPORTS 32. 27 51 75 99 ENFORCED BUT FX FZ MX MY MZ 33. 38 62 86 110 ENFORCED BUT FX FZ MX MY MZ 34. 35 59 83 107 PINNED 35. 46 70 94 118 PINNED 36. MEMBER RELEASE 37. 1 24 47 93 116 END MZ 38. 23 46 92 115 138 START MZ 39. 12 35 58 81 104 127 START MZ 40. 12 35 58 81 104 127 END MZ 41. LOAD 1 SIDL 42. *** CRASH BARRIER 43. MEMBER LOAD 44. 25 TO 45 UNI GY -1.0 45. 94 TO 114 UNI GY -1.0 46. 25 TO 45 UMOM GX -1.0 47. 94 TO 114 UMOM GX 1.0 48. LOAD 2 WEARINGCOAT 49. MEMBER LOAD 50. 25 TO 114 UNI GY -0.2464 51. PERFORM ANALYSIS �

Consulting Engineers Group Ltd., Jaipur Bridge Design Report ________________________________________________________________________________ 52. PRINT SUPPORT REACTION LIST 27 51 75 99 38 62 86 110 35 59 83 107 46 70 94 118 � SUPPORT REACTION LIST 27 � STAAD FLOOR -- PAGE NO. 3 SUPPORT REACTIONS -UNIT MTON METE STRUCTURE TYPE = FLOOR ----------------- JOINT LOAD FORCE-X FORCE-Y FORCE-Z MOM-X MOM-Y MOM Z 27 1 0.00 7.42 0.00 0.00 0.00 0.00 2 0.00 1.13 0.00 0.00 0.00 0.00 51 1 0.00 -2.84 0.00 0.00 0.00 0.00 2 0.00 1.13 0.00 0.00 0.00 0.00 75 1 0.00 -2.84 0.00 0.00 0.00 0.00 2 0.00 1.13 0.00 0.00 0.00 0.00 99 1 0.00 7.42 0.00 0.00 0.00 0.00 2 0.00 1.13 0.00 0.00 0.00 0.00 38 1 0.00 6.97 0.00 0.00 0.00 0.00 2 0.00 1.13 0.00 0.00 0.00 0.00 62 1 0.00 -2.37 0.00 0.00 0.00 0.00 2 0.00 1.14 0.00 0.00 0.00 0.00 86 1 0.00 -2.37 0.00 0.00 0.00 0.00 2 0.00 1.14 0.00 0.00 0.00 0.00 110 1 0.00 6.97 0.00 0.00 0.00 0.00 2 0.00 1.13 0.00 0.00 0.00 0.00 35 1 0.00 7.19 0.00 0.00 0.00 0.00 2 0.00 1.13 0.00 0.00 0.00 0.00 59 1 0.00 -2.59 0.00 0.00 0.00 0.00 2 0.00 1.13 0.00 0.00 0.00 0.00 83 1 0.00 -2.59 0.00 0.00 0.00 0.00 2 0.00 1.13 0.00 0.00 0.00 0.00 107 1 0.00 7.19 0.00 0.00 0.00 0.00 2 0.00 1.13 0.00 0.00 0.00 0.00 46 1 0.00 7.52 0.00 0.00 0.00 0.00 2 0.00 1.13 0.00 0.00 0.00 0.00 70 1 0.00 -2.94 0.00 0.00 0.00 0.00 2 0.00 1.13 0.00 0.00 0.00 0.00 94 1 0.00 -2.94 0.00 0.00 0.00 0.00 2 0.00 1.13 0.00 0.00 0.00 0.00 118 1 0.00 7.52 0.00 0.00 0.00 0.00 2 0.00 1.13 0.00 0.00 0.00 0.00 ************** END OF LATEST ANALYSIS RESULT ************** 53. FINISH

Consulting Engineers Group Ltd., Jaipur Bridge Design Report ________________________________________________________________________________
INPUT FILE: 70RW.STD 1. STAAD SPACE 2. INPUT WIDTH 72 3. UNIT METER MTON 4. PAGE LENGTH 1000 5. UNIT METER MTON 6. JOINT COORDINATES 7. 1 0.0 0 0;2 0.4 0 0;3 8.8 0 0;4 9.2 0 0 8. MEMBER INCIDENCES 9. 1 1 2 3 10. MEMBER PROPERTY CANADIAN 11. 1 TO 3 PRI YD 1.0 ZD 1.0 12. CONSTANT 13. E CONCRETE ALL 14. DENSITY CONCRETE ALL 15. POISSON CONCRETE ALL 16. SUPPORT 17. 2 3 PINNED 18. DEFINE MOVING LOAD 19. TYPE 1 LOAD 8.0 2*12 4*17.0 DIS 3.96 1.52 2.13 1.37 3.05 1.37 20. LOAD GENERATION 175 21. TYPE 1 -13.4 0. 0. XINC .2 22. PERFORM ANALYSIS 23. LOAD LIST 30 24. PRINT SUPPORT REACTION SUPPORT REACTION SUPPORT REACTIONS -UNIT MTON METE STRUCTURE TYPE = SPACE ----------------- JOINT LOAD FORCE-X FORCE-Y FORCE-Z MOM-X MOM-Y MOM Z � 2 30 0.00 47.72 0.00 0.00 0.00 0.00 3 30 0.00 20.28 0.00 0.00 0.00 0.00 ************** END OF LATEST ANALYSIS RESULT ************** 25. FINISH

Consulting Engineers Group Ltd., Jaipur Bridge Design Report ________________________________________________________________________________ INPUT FILE: CLASS A.STD 1. STAAD SPACE 2. INPUT WIDTH 72 3. UNIT METER MTON 4. PAGE LENGTH 1000 5. UNIT METER MTON 6. JOINT COORDINATES 7. 1 0.0 0 0;2 0.4 0 0;3 8.8 0 0;4 9.2 0 0 8. MEMBER INCIDENCES 9. 1 1 2 3 10. MEMBER PROPERTY CANADIAN 11. 1 TO 3 PRI YD 1.0 ZD 1.0 12. CONSTANT 13. E CONCRETE ALL 14. DENSITY CONCRETE ALL 15. POISSON CONCRETE ALL 16. SUPPORT 17. 2 3 PINNED 18. DEFINE MOVING LOAD 19. TYPE 1 LOAD 2*2.7 2*11.4 4*6.8 DIS 1.1 3.2 1.2 4.3 3 3 3 20. LOAD GENERATION 100 21. TYPE 1 -18.8 0. 0. XINC .2 22. PERFORM ANALYSIS 23. LOAD LIST 74 24. PRINT SUPPORT REACTION SUPPORT REACTION SUPPORT REACTIONS -UNIT MTON METE STRUCTURE TYPE = SPACE ----------------- JOINT LOAD FORCE-X FORCE-Y FORCE-Z MOM-X MOM-Y MOM Z 2 74 0.00 24.74 0.00 0.00 0.00 0.00 3 74 0.00 11.66 0.00 0.00 0.00 0.00 ************** END OF LATEST ANALYSIS RESULT ************** 25. FINISH
CEG.Ltd., Jaipur Bridge Design Report
Consultancy Services for Feasibility Study and Detailed Project Preparation for Proposed Orissa State Road Project
STABILITY CHECK & DESIGN OF SUBSTRUCTURE (PIER)
Consulting Engineers Group Ltd., Jaipur________________________________________________________________________
Bridge Design Report________________________________________________________________
Design Data :For design purposes, following parameters have been considered.
Grade of concrete = M -Pier Cap = M -
Grade of reinforcement steel = Fe -Centre to Centre distance between Expansion joints = mCentre to Centre distance of Bearing = mDepth of superstructure = mmThickness of wearing coat = mmFormation level along C of carriage way = mSoffit level =Pedestal top level =Height of bearing and Pedestal = mL.W.L./Bed level = mH.F.L = mM.S.L = mFounding Level = mPier cap top level = mLive Load Class A two Lane
Class 70R wheeled Bearing : neoprene but during raising Tar paper bearing may be kept.Seismic zone = II
The following codes are used for the design of substructure:1 IRC : 6 - 20002 IRC : 21 - 20003 IRC : 78 - 2000
8.8009.200
215.423
215.423215.473
214.172205.452205.834
(a)(b)
20
208.2720.050
216.189
41525
66056.00
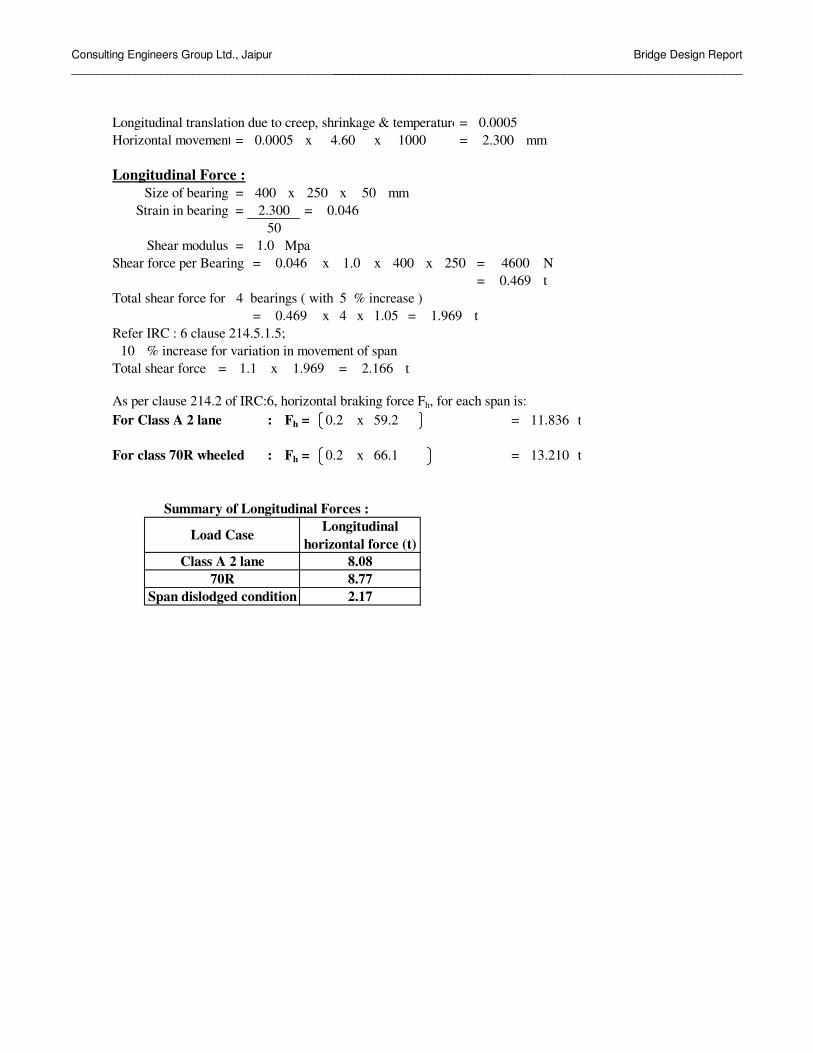
Consulting Engineers Group Ltd., Jaipur________________________________________________________________________
Bridge Design Report________________________________________________________________
Longitudinal translation due to creep, shrinkage & temperature=Horizontal movement = x x = mm
Longitudinal Force := x x mm= =
= MpaShear force per Bearing = x x x = N
= tTotal shear force for 4 bearings ( with 5 % increase )
= x 4 x = tRefer IRC : 6 clause 214.5.1.5;
% increase for variation in movement of spanTotal shear force = x = t
As per clause 214.2 of IRC:6, horizontal braking force Fh, for each span is:For Class A 2 lane : Fh = x = t
For class 70R wheeled : Fh = x = t
Summary of Longitudinal Forces :
Load Case
Span dislodged condition70R
8.088.77
Class A 2 lane
Longitudinal horizontal force (t)
2.17
13.210
500.046
250
0.469250 46001.0 400
Size of bearingStrain in bearing 2.300
50
400
1.1 1.969
Shear modulus 1.0
10
0.046
2.166
0.469 1.05
59.2 11.836
1.969
0.2 66.1
0.2
0.00050.0005 4.60 1000 2.300

Consulting Engineers Group Ltd., Jaipur________________________________________________________________________
Bridge Design Report________________________________________________________________
Dry Condition with L.La) Vertical load and their moments about C/L of Foundation base.I1 D.L Reaction eL ML eT MT
a Left spanb Right span2 S.I.D.L
a Left spanb Right span
4 L.L Max Reaction casea Left span
70R Wheeled + Class AClass A 3 Lane
b Right span70R Wheeled + Class AClass A 3 Lane
4 L.L Max Longitudinal Moment casea Left span
70R Wheeled + Class AClass A 3 Lane
b Right span70R Wheeled + Class AClass A 3 Lane
Max Reaction case
Max Longitudinal Moment
II Substructure V ρρρρ P eL ML eT MT
1 Pedestala Left spanb Right span2 Pier cap R
Pier cap Tr3 Pier shaft
up to G.Lbelow G.L
4 Footing5 Earth above
footing
190.51 18.86
149.08 0
002.4
0
51.865
0 0 0
0 0 00 0 0
51.86547.74 0.4 19.096 0.625 29.837547.15 0.4 18.86 1.1
-0.4 -2.752 0.625 4.3
28.1610
0
011.7337534.826681 2 69.653 0
0 0 00 0
10.76912 2.4 25.846 02.8356842 2.4 6.8056 0
5.37 2.4 12.888 02.385 2.4 5.724 0
00
2.42.4
00
0 -0.4 0 0
1.1
209.41 1.42 72.655
0 -0.4 0 1.1 06.88
21
33.05525.58 0.4 10.232 0.625 15.987530.05 0.4 12.02
-13.44 0.62536
33.6-0.4-0.4
0.4 0 0 0
-14.4 1.1 39.6
013.68 0.4 5.472 0
00
13.68 -0.4 -5.472 0 0
-23.20
P58.00
58-0.40.4 23.2
0
0143.36 0
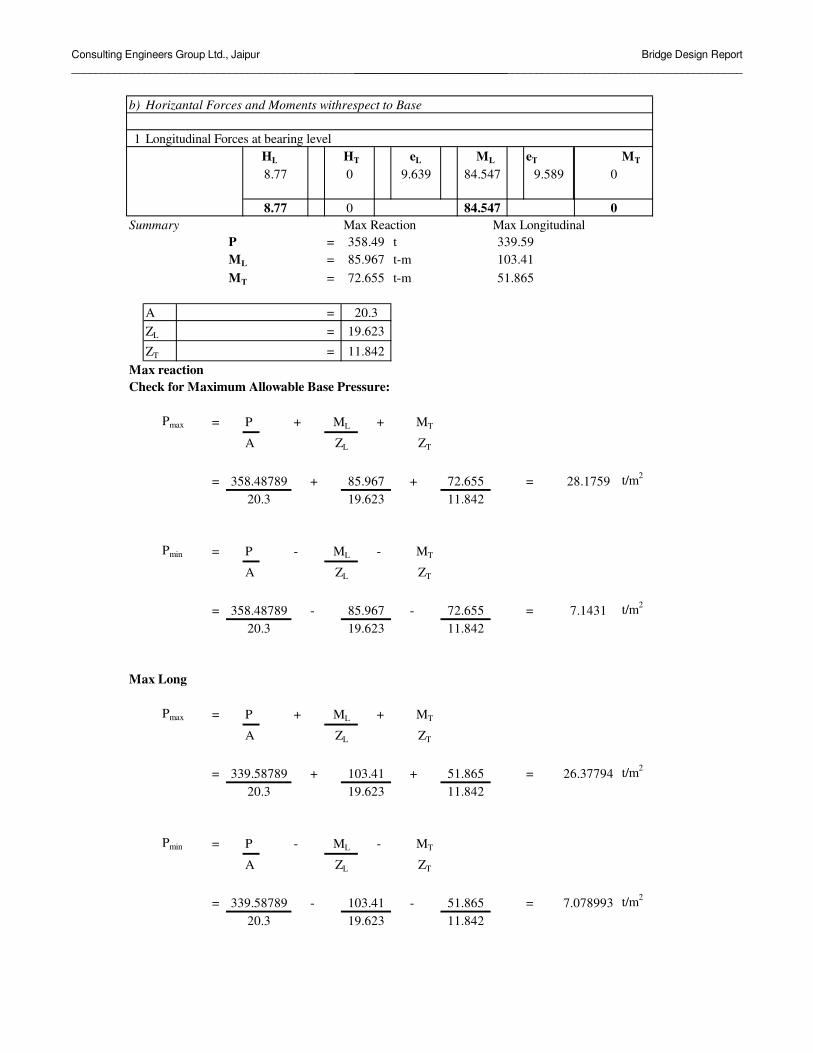
Consulting Engineers Group Ltd., Jaipur________________________________________________________________________
Bridge Design Report________________________________________________________________
b) Horizantal Forces and Moments withrespect to Base
1 Longitudinal Forces at bearing levelHL HT eL ML eT MT
Summary Max Reaction Max LongitudinalP = tML = t-mMT = t-m
A =ZL =
ZT =Max reactionCheck for Maximum Allowable Base Pressure:
Pmax = P + +
A
= + + = t/m2
Pmin = P - -
A
= - - = t/m2
Max Long
Pmax = P + +
A
= + + = t/m2
Pmin = P - -
A
= - - = t/m2
358.4985.967
84.547
20.3 19.623
ML
ZL
339.58789 103.41
339.58789 103.41
26.3779420.3 19.623 11.842
11.842358.48789 85.967 72.655 7.1431
ML MT
ZL ZT
72.65511.842
28.1759
MT
ZT
358.4878920.3
85.96719.623
ZL
ML
19.623
11.842
8.77 0
72.655
20.3
339.59103.4151.865
0
9.589 08.77 84.5470 9.639
MT
ZT
51.865
ML MT
ZL ZT
51.865 7.07899320.3 19.623 11.842

Consulting Engineers Group Ltd., Jaipur________________________________________________________________________
Bridge Design Report________________________________________________________________
Design of Footing in Transverse directionP4 b P1
P3 P2
bGross Pressure Diagram
Net Pressure diagram bBending moment at the face of pier b-b = t-mFooting is checked for shear at distance of d from face pierEffective depth d of footing = mTotal depth of section at distance d from pier = mEffective depth at distance d from face of pier = m
Bending moment at a distance of d from face of pier = t-mShear force at a distance d from face of pier = tNet shear force at a distance d from face of pier = t
(after correction)
Design for Flexure:M = Fe =
Permissible compressive stress σcbc = N/mm2
Permissible tensile stress σst = N/mm2
m =k =j =Q =
8.418612.609 16.82
19.414
8.4186
1.6775
14.39
3.50
7.1431
16.82
13.279
5.800
18.279
167.27
15.905
28.176
22.04
2.49
91.62372.118
36.54
0.81250.65530.5643
100.250.920.7639
20 415
6.67
200

Consulting Engineers Group Ltd., Jaipur________________________________________________________________________
Bridge Design Report________________________________________________________________
width b =
Effective depth required d = mmEffective depth provided = mm
Ast Required = mm2
Provide nos dia bars /m width
Check for shearShear stress at effective depth from pier = t/m2
% of steel provided =
Permissible shear stress = t/m2
Area of shearreinforcement IRC:21-2000,cl:304.7.1.4
Asw = V - τc x b x d x s
σs x d
= mm2
Minimum Shear Reinforcement :
Asw =
Asw = x b = mm2/mm
Provide 2 Legged @ =
Dry Condition with L.La) Vertical load and their moments about Pier Shaft bottomII Substructure V ρρρρ P eL ML eT MT
1 Pedestala Left spanb Right span2 Pier cap R
Pier cap Tr3 Pier shaft
up to G.Lbelow G.L
51.264
2.8356842
5.37 2.4 12.888
10.76912 2.4 25.846
2.385
00 0
0 0
0 0
02.4 06.8056
0 0 0
0 00 0 02.4 5.724 0
00
0 00 2.4 0 0.40 2.4 0 -0.4
7 25
0.25
0.35800536.5170.3565
25.5
s 0.87 x fy
403.08
0.4
b x s 0.87 x fy
12 200 1131
0.4 3.8776
3.50
790.97812.5
3208.4
0 0

Consulting Engineers Group Ltd., Jaipur________________________________________________________________________
Bridge Design Report________________________________________________________________
b) Horizantal Forces and Moments withrespect to PierShaft bottom1 Longitudinal Forces at bearing level
HL HT eL ML eT MT
Summary for design of Pier Max Reaction case Max Longitudinal momentP = tML = t-mMT = t-m
Dry Condition One.Span dislodged a) Vertical load and their moments about C/L of Foundation base.
1 Longitudinal Forces at bearing levelHL HT eL ML eT MT
SummaryP = tML = t-mMT = t-m
Check for Maximum Allowable Base Pressure:
Pmax = P + +
A
= + + = t/m2
Pmin = P - -
A
= - - = t/m2
Dry Condition One.Span dislodgeda) Vertical load and their moments about Abutment Shaft bottom.1 Longitudinal Forces at bearing level
HL HT eL ML eT MT
Summary for design of PierP = tML = t-mMT = t-m0
194.62
20.8820
18.824
ML
20.3 19.623
8.77
292.43789 20.882 0 13.34169
ML MT
ZL ZT
20.3 19.623 11.842292.43789 20.882 0
ZT
72.655
292.44
2.17 0
2.17 0
MT
ZL
51.865
9.589 0
0 0
77.634241.7795.074
260.67
8.639 00 8.6898.77
9.639 20.882
76.214
76.214
20.882 0
8.639 0
15.46993
11.842
2.17 0 8.689 18.824

Consulting Engineers Group Ltd., Jaipur________________________________________________________________________
Bridge Design Report________________________________________________________________
H.F.L Condition with L.La) Vertical load and their moments about C/L of Foundation base.I
1.000 D.L Reaction eL ML eT MT
a Left spanb Right span
2.000 S.I.D.La Left spanb Right span
3.000 L.L Max Reaction casea Left span
70R Wheeled Class A 2 Lane
b Right span70R Wheeled Class A 2 Lane
4.000 L.L Max Long.Moment casea Left span
70R WheeledClass A 2 Lane
b Right span70R Wheeled Class A 2 Lane
Max Reaction case:Max Long. moment case:
II Substructure V ρρρρ P eL ML eT MT
1.000 Pedestala Left spanb Right span
2.000 Pier cap RPier cap Tr
3.000 Pier shaftup to H.F.Lbelow H.F.L
4.000 Footing5.000 Earth above
footing6.000 Water current
b) Horizantal Forces and Moments withrespect to Base
1.000 Longitudinal Forces at bearing levelHL HT eL ML eT MT
Summary Max Reaction case Max Long.moment caseP = tML = t-mMT = t-m
47.740
143.360 0.000
6.880 -0.400 -2.752
84.547 0.000
298.323102.24179.267
8.771 0.000 9.639
8.771 0.000
84.547
0.000 0.000
9.589
16.27488.913 16.274 6.612
0.000 6.6120.000 0.000
34.827 1.000 34.827 0.000
0.000 0.00011.734 1.400 16.427 0.000 0.000 0.000 0.000
5.370 2.400
0.0000.00013.605 1.400 19.047 0.000
2.400
0.000
0.000 0.0000.000 0.000
12.888
0.000 0.400 0.000
0.000
5.724 0.0000.000 0.000 0.000
0.0000.000 2.4002.385 2.400
0.000 0.000 0.0000.0000.000
0.000 2.400 0.000 -0.400
33.05525.580 0.400 10.232 0.625 15.98830.050 0.400 12.020 1.100
0.625 21.00036.000 -0.400 -14.400 1.100
0.00013.680 0.400 5.472 0.000 0.00013.680 -0.400 -5.472 0.000
0.000 0.00058.000 0.400 23.200 0.000 0.000
P58.000 -0.400 -23.200
0.000
0.000 -0.400 0.000 1.100 0.000
39.60033.600 -0.400 -13.440
4.300
47.150 0.400 18.860 1.100 51.865
0.625
0.400 19.096 0.625 29.838
209.410190.510
1.42018.860
72.65551.865
279.423119.681
0.000
0.000
0.000
0.000
58.477
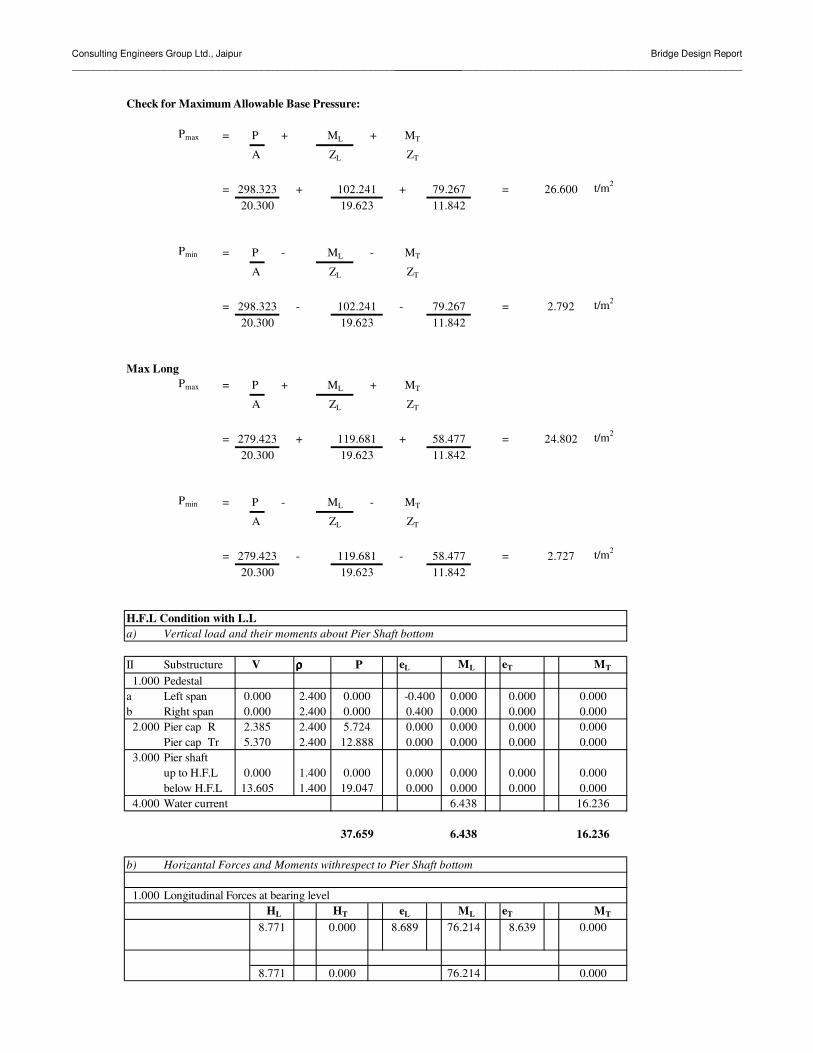
Consulting Engineers Group Ltd., Jaipur________________________________________________________________________
Bridge Design Report________________________________________________________________
Check for Maximum Allowable Base Pressure:
Pmax = P + +
A
= + + = t/m2
Pmin = P - -
A
= - - = t/m2
Max LongPmax = P + +
A
= + + = t/m2
Pmin = P - -
A
= - - = t/m2
H.F.L Condition with L.La) Vertical load and their moments about Pier Shaft bottom
II Substructure V ρρρρ P eL ML eT MT
1.000 Pedestala Left spanb Right span
2.000 Pier cap RPier cap Tr
3.000 Pier shaftup to H.F.Lbelow H.F.L
4.000 Water current
b) Horizantal Forces and Moments withrespect to Pier Shaft bottom
1.000 Longitudinal Forces at bearing levelHL HT eL ML eT MT
8.771 0.000 76.214 0.000
8.771 0.000 8.689
0.0000.000 0.000
76.214 8.639
37.659 6.438 16.236
16.2366.43813.605 1.400 19.047 0.000
0.000 0.000 0.000
5.370 2.400
0.000 1.400 0.000 0.000
0.00012.888 0.000
0.0000.000 0.400
0.0000.000
0.0002.385 2.400 5.724
2.4000.000 0.000 0.000
0.000 0.0000.000 2.400 0.000 -0.400
20.300 19.623 11.842298.323 102.241 79.267 2.792
ML MT
ZL ZT
ZL
26.60020.300 19.623 11.842
79.267
ZT
298.323 102.241
ML MT
0.0000.000 0.000
0.000
0.000
ML MT
ZL ZT
279.423 119.681 58.477 24.80220.300 19.623 11.842
ML MT
ZL ZT
279.423 119.681 58.477 2.72720.300 19.623 11.842

Consulting Engineers Group Ltd., Jaipur________________________________________________________________________
Bridge Design Report________________________________________________________________
Gross Pressure DiagramSummary for design of Pier Max Reaction case Max Long.moment case
P = t tML = t-m t-m
Net Pressure diagramMT t-m t-m
H.F.L Condition One.Span dislodged a) Vertical load and their moments about C/L of Foundation base.
II Substructure V ρρρρ P eL ML eT MT
1.000 Pedestala Left spanb Right span
2.000 Pier cap RPier cap Tr
3.000 Pier shaftup to H.F.Lbelow H.F.L
4.000 Footing5.000 Earth above
footing6.000 Water current
SummaryP = tML = t-mMT = t-m
Check for Maximum Allowable Base Pressure:
Pmax = P + +
A
= + + = t/m2
Pmin = P - -
A
= - - = t/m2
0.000
232.27316.2746.612
20.300 19.623 11.842232.273 16.274 6.612 10.054
ML MT
ZL ZT
6.612 12.83020.300 19.623 11.842
MT
ZL ZT
232.273 16.274
ML
0.000
88.913 16.274 6.612
0.000 6.6120.000
0.000 0.000
16.274
34.827 1.000 34.827 0.000
0.000 0.000 0.00011.734 1.400 16.427 0.000 0.000 0.000 0.00013.605 1.400 19.047 0.000
0.000 0.000 0.000
0.000 2.400 0.000 0.000 0.000 0.000 0.000
5.370 2.400 12.888 0.000
0.000 0.000 0.0002.385 2.400 5.724 0.000 0.000 0.000 0.0000.000 2.400 0.000 0.400
-0.400 0.000 0.000 0.000
247.06984.07288.891
0.000 2.400 0.000
228.169101.51268.101

Consulting Engineers Group Ltd., Jaipur________________________________________________________________________
Bridge Design Report________________________________________________________________
φφ
φ no.both sides
Reinforcement provided =
Summary of Loads at Pier Shaft bottom :
1 DRY condition P ML MT
With L.LSpan dislodged
2 H.F.LWith L.LSpan dislodged
410 410
181.02 6.44 16.24
194.62 18.82 0.00
247.07 84.07 88.89
2500
PLAN : PIER SHAFT13722.477
260.67 77.63 72.66
1680
820
16 6
20 1820 18
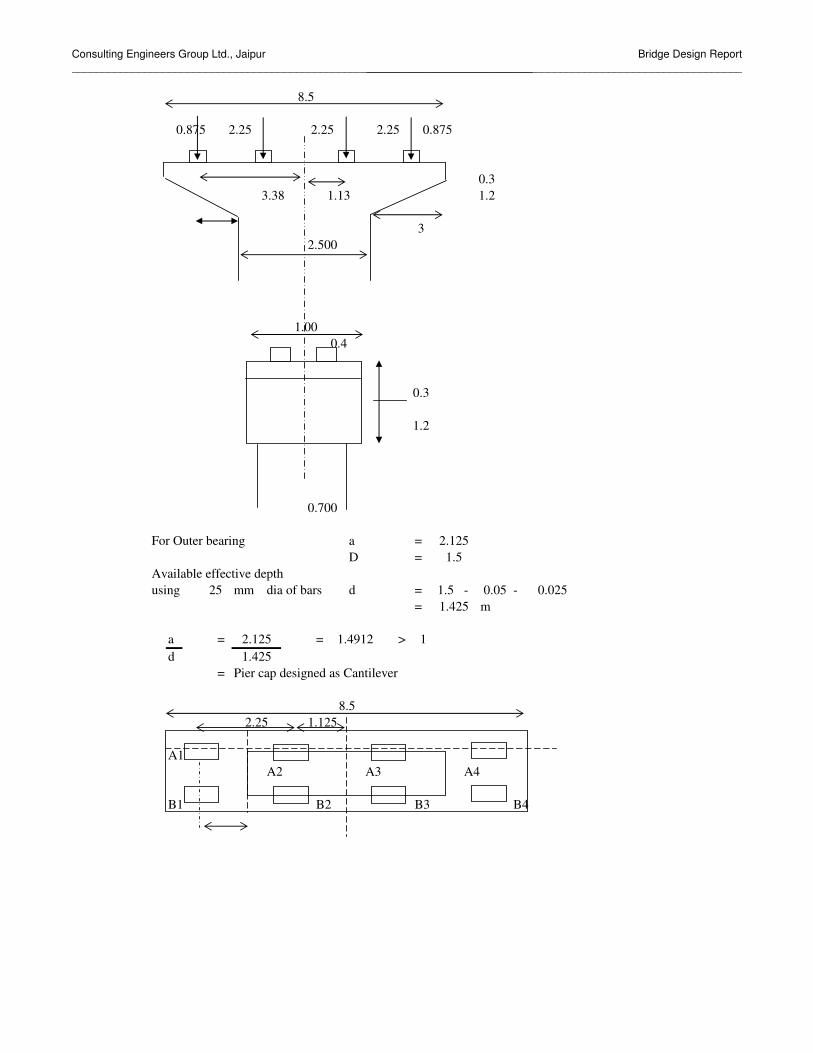
Consulting Engineers Group Ltd., Jaipur____________________________________________________________________________
Bridge Design Report______________________________________________________________
For Outer bearing a =D =
Available effective depthusing mm dia of bars d = - -
= m
a = = > 1d
= Pier cap designed as Cantilever
A1A2 A3 A4
B1 B2 B3 B4
0.3
0.4
8.5
1.425
2.25 1.125
0.025
2.1251.425
1.4912
1.5
25 1.5 0.05
8.5
0.875 0.875
2.125
2.25 2.25 2.25
3.38 1.13
0.700
1.2
1.00
1.2
2.5003
0.3

Consulting Engineers Group Ltd., Jaipur____________________________________________________________________________
Bridge Design Report______________________________________________________________
Loads on bearingBearings A1 & B1 are effective.
A1 B1DLSIDLLL70RW due to Transverse moment A1 = x =
B1 = x =A1 = x = t
B1 = x = t
Summary of loads from superstructure:Loads on Outer bearings
Left span Right spanB1 A1
DLSIDLLL
Selfweight of piercap upto section through outerbearing:
= + x x x= t
Distance of c.g from section = m
Calculation of Cantilevermoment at bearing sectionMoment at the face due to load from outerbearing
= x= t-m
Due to selfweight of pier cap = x = t-mTotal moment at the face of support = t-m
Torsion at outerbearing section:= -=
Eccentricity =Moment = t-m
32.368 29.969 7.5125
5.568 4.64773.3 3.3
25.31
14.5 14.5
25.3141.76 3.38 5.568
2.46.48
1.1667
29.96
14.5 14.53.3 3.3
7.5125 9
0.9631
32.3682.4078
30.05 1.16 34.858
0.4
36 1.16 41.76
1
3.38 4.6477
6.48 1.1667
62.328
2.00
0.65
3.000.3 1.50
0.30.88
34.858
3.0002.125
1.5
140.017.56
2.125132.4475

Consulting Engineers Group Ltd., Jaipur____________________________________________________________________________
Bridge Design Report______________________________________________________________
Longitudinal Reinforcement:M = + = t-m
For, M - & Fe -N/mm2
N/mm2
Effective depth required = xx
= < O.K
Ast required =x x
= mm2
Provide nos mm dia bars in layers mm2
This reinforcement will provided in full length of pier cap.Check for Shear:At bearing section
Available Effective depth at root = mmDownward Load from Superstructure = +
= tDownward Load due to self wt of pier cap = tTotal downward Load = t
After shear correction, S.F = V + M tanβd
= + x
= tEquivalent shear IRC:21-2000,cl:304.2.3.1
b = + = m2
V = t
Shear stress = x = N/mm2
xArea of tension reinforcement = %
τc = N/mm2
Provide minimum shear
1000
200 0.902140.01
1.105
8.33
140.01
�st =
140.01
140.01
10^7
20010
1425
25 415�cbc =
m =
1125.5 1425
R = 1.105
K = 0.294j = 0.902
29.96
5446.5159
142532.368
6 25 5890.52
0.2873
62.3286.48
68.808
68.808 140.01 0.41.425
29.507884
1 1 1
29.508
29.508 100001000 1425
0.2071
0.4134

Consulting Engineers Group Ltd., Jaipur____________________________________________________________________________
Bridge Design Report______________________________________________________________
For Outer bearing a =D =
Available effective depthusing mm dia of bars d = - -
= m
a = = > 1d
= Pier cap designed as Cantilever
A1A2 A3 A4
B1 B2 B3 B4
3.38 1.13
0.700
1.2
1.00
1.2
2.5003
0.3
25 1.5 0.05
8.5
0.875 0.875
2.125
2.25 2.25 2.25
2.1251.425
1.4912
1.5
0.025
2.25 1.125
0.3
0.4
8.5
1.425

Consulting Engineers Group Ltd., Jaipur____________________________________________________________________________
Bridge Design Report______________________________________________________________
Loads on bearingBearings A1 & B1 are effective.
A1 B1DLSIDLLL70RW due to Transverse moment A1 = x =
B1 = x =A1 = x = t
B1 = x = t
Summary of loads from superstructure:Loads on Outer bearings
Left span Right spanB1 A1
DLSIDLLL
Selfweight of piercap upto section through outerbearing:
= + x x x= t
Distance of c.g from section = mCalculation of Cantilevermoment at bearing sectionMoment at the face due to load from outerbearing
= x= t-m
Due to selfweight of pier cap = x = t-mTotal moment at the face of support = t-m
Torsion at outerbearing section:= -=
Eccentricity =Moment = t-m
3.0002.125
2.125116.68522
1.5
1.1667
54.911
124.257.56
2.00
0.65
3.000.3 1.50
0.30.88
0
37.111 17.819.311
7.7243
0 1.16 0
0.4
47.72 1.16 55.355
1
6.48
3.38
14.5 14.53.3 3.3
0 11.93
2.46.48
1.1667
025.31
55.355 3.38 7.380725.31
14.5 14.53.3 3.3
7.3807 011.93 0
37.111 17.8

Consulting Engineers Group Ltd., Jaipur____________________________________________________________________________
Bridge Design Report______________________________________________________________
Longitudinal Reinforcement:Me = M + Mt
Mt = T x 1 + D/b
= t-mMe = + = t-m
For, M - & Fe -N/mm2
N/mm2
Effective depth required = xx
= < O.K
Ast required =x x
= mm2
Provide nos mm dia bars in layers mm2
This reinforcement will provided in full length of pier cap.Check for Shear:At bearing section
Available Effective depth at root = mmDownward Load from Superstructure = +
= tDownward Load due to self wt of pier cap = tTotal downward Load = t
After shear correction, S.F = V + M tanβd
= + x
= tEquivalent shear IRC:21-2000,cl:304.2.3.1
b = + = m2
Ve = V + x T = tb
Shear stress = x = N/mm2
xArea of tension reinforcement = %
τc = N/mm2
1000 14250.2728
0.41340.2873
1.6 38.874
38.874 10000
26.514841
1 1 1
61.391 124.25 0.41.425
54.9116.48
61.391
6 25
R = 1.105
K = 0.294j = 0.902
124.25 6.815525
m = �st = 200
415�cbc = 8.33
1425131.06
1.105
5890.52
1088.9 1425
10
200 0.902
131.06
131.06
10^7
6.81551.7
17.8
5098.4736
142537.111
1000
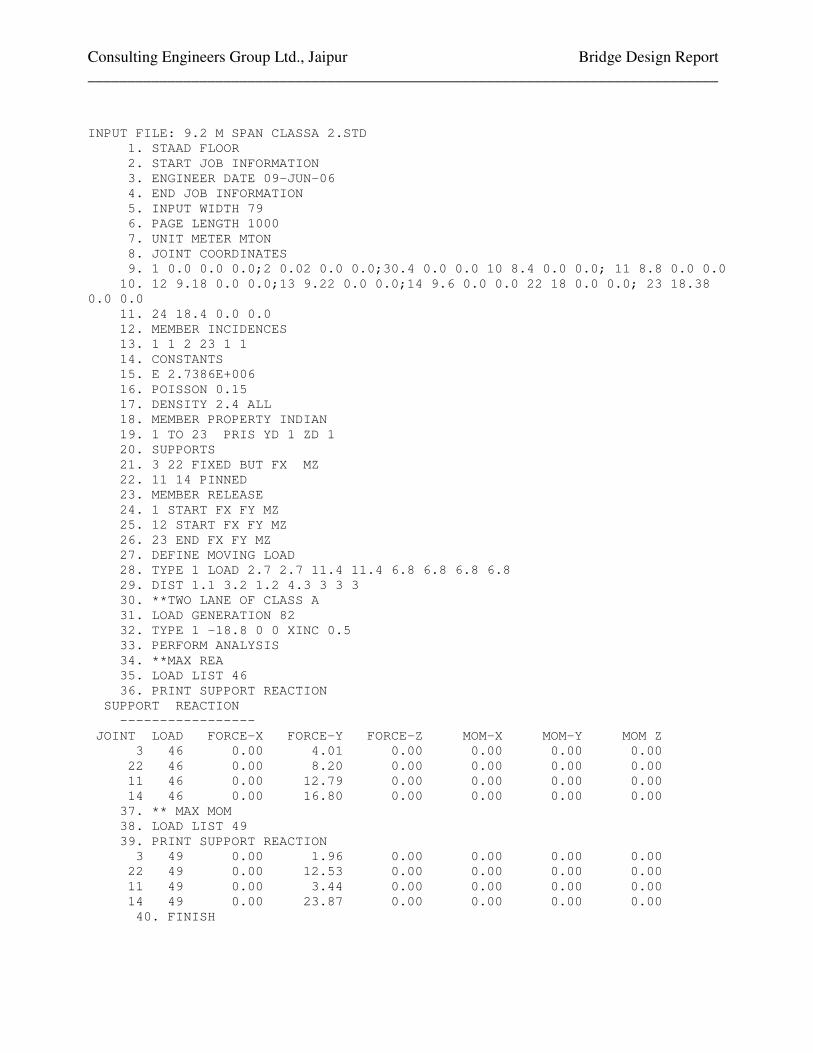
Consulting Engineers Group Ltd., Jaipur Bridge Design Report _______________________________________________________________________________
INPUT FILE: 9.2 M SPAN CLASSA 2.STD 1. STAAD FLOOR 2. START JOB INFORMATION 3. ENGINEER DATE 09-JUN-06 4. END JOB INFORMATION 5. INPUT WIDTH 79 6. PAGE LENGTH 1000 7. UNIT METER MTON 8. JOINT COORDINATES 9. 1 0.0 0.0 0.0;2 0.02 0.0 0.0;30.4 0.0 0.0 10 8.4 0.0 0.0; 11 8.8 0.0 0.0 10. 12 9.18 0.0 0.0;13 9.22 0.0 0.0;14 9.6 0.0 0.0 22 18 0.0 0.0; 23 18.38 0.0 0.0 11. 24 18.4 0.0 0.0 12. MEMBER INCIDENCES 13. 1 1 2 23 1 1 14. CONSTANTS 15. E 2.7386E+006 16. POISSON 0.15 17. DENSITY 2.4 ALL 18. MEMBER PROPERTY INDIAN 19. 1 TO 23 PRIS YD 1 ZD 1 20. SUPPORTS 21. 3 22 FIXED BUT FX MZ 22. 11 14 PINNED 23. MEMBER RELEASE 24. 1 START FX FY MZ 25. 12 START FX FY MZ 26. 23 END FX FY MZ 27. DEFINE MOVING LOAD 28. TYPE 1 LOAD 2.7 2.7 11.4 11.4 6.8 6.8 6.8 6.8 29. DIST 1.1 3.2 1.2 4.3 3 3 3 30. **TWO LANE OF CLASS A 31. LOAD GENERATION 82 32. TYPE 1 -18.8 0 0 XINC 0.5 33. PERFORM ANALYSIS 34. **MAX REA 35. LOAD LIST 46 36. PRINT SUPPORT REACTION � SUPPORT REACTION � ----------------- JOINT LOAD FORCE-X FORCE-Y FORCE-Z MOM-X MOM-Y MOM Z 3 46 0.00 4.01 0.00 0.00 0.00 0.00 22 46 0.00 8.20 0.00 0.00 0.00 0.00 11 46 0.00 12.79 0.00 0.00 0.00 0.00 14 46 0.00 16.80 0.00 0.00 0.00 0.00 37. ** MAX MOM 38. LOAD LIST 49 39. PRINT SUPPORT REACTION 3 49 0.00 1.96 0.00 0.00 0.00 0.00 22 49 0.00 12.53 0.00 0.00 0.00 0.00 11 49 0.00 3.44 0.00 0.00 0.00 0.00 14 49 0.00 23.87 0.00 0.00 0.00 0.00 40. FINISH
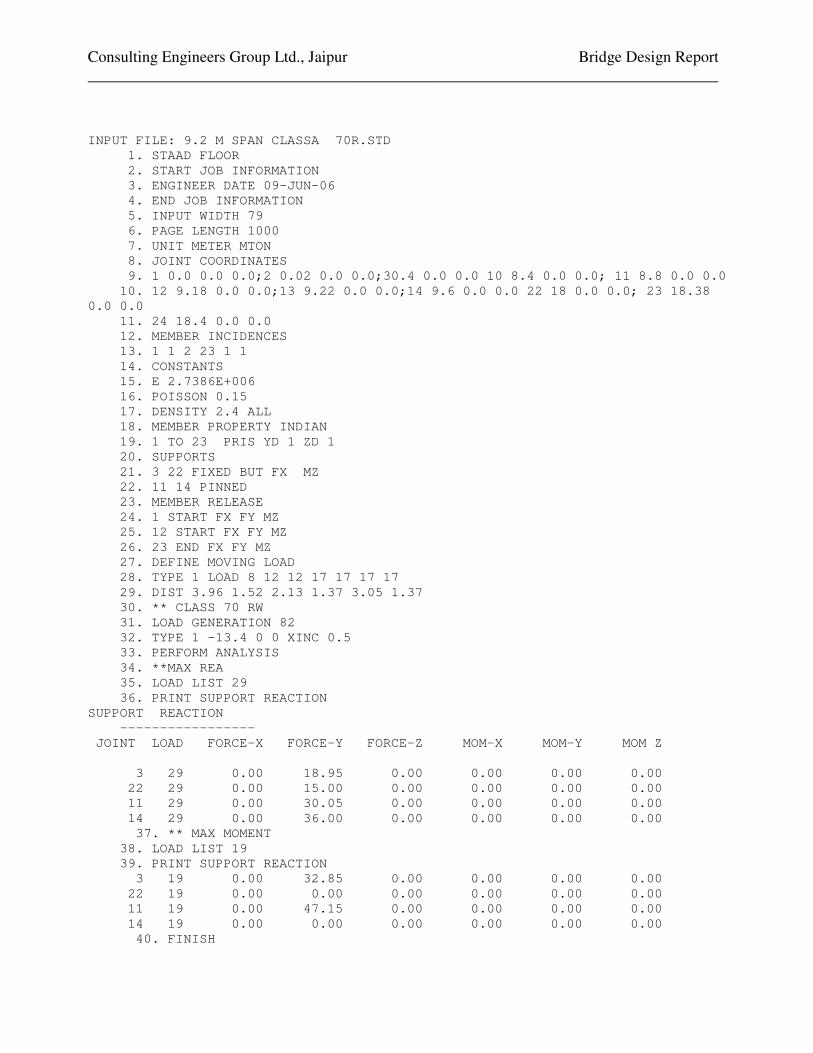
Consulting Engineers Group Ltd., Jaipur Bridge Design Report _______________________________________________________________________________ INPUT FILE: 9.2 M SPAN CLASSA 70R.STD 1. STAAD FLOOR 2. START JOB INFORMATION 3. ENGINEER DATE 09-JUN-06 4. END JOB INFORMATION 5. INPUT WIDTH 79 6. PAGE LENGTH 1000 7. UNIT METER MTON 8. JOINT COORDINATES 9. 1 0.0 0.0 0.0;2 0.02 0.0 0.0;30.4 0.0 0.0 10 8.4 0.0 0.0; 11 8.8 0.0 0.0 10. 12 9.18 0.0 0.0;13 9.22 0.0 0.0;14 9.6 0.0 0.0 22 18 0.0 0.0; 23 18.38 0.0 0.0 11. 24 18.4 0.0 0.0 12. MEMBER INCIDENCES 13. 1 1 2 23 1 1 14. CONSTANTS 15. E 2.7386E+006 16. POISSON 0.15 17. DENSITY 2.4 ALL 18. MEMBER PROPERTY INDIAN 19. 1 TO 23 PRIS YD 1 ZD 1 20. SUPPORTS 21. 3 22 FIXED BUT FX MZ 22. 11 14 PINNED 23. MEMBER RELEASE 24. 1 START FX FY MZ 25. 12 START FX FY MZ 26. 23 END FX FY MZ 27. DEFINE MOVING LOAD 28. TYPE 1 LOAD 8 12 12 17 17 17 17 29. DIST 3.96 1.52 2.13 1.37 3.05 1.37 30. ** CLASS 70 RW 31. LOAD GENERATION 82 32. TYPE 1 -13.4 0 0 XINC 0.5 33. PERFORM ANALYSIS 34. **MAX REA 35. LOAD LIST 29 36. PRINT SUPPORT REACTION SUPPORT REACTION � ----------------- JOINT LOAD FORCE-X FORCE-Y FORCE-Z MOM-X MOM-Y MOM Z 3 29 0.00 18.95 0.00 0.00 0.00 0.00 22 29 0.00 15.00 0.00 0.00 0.00 0.00 11 29 0.00 30.05 0.00 0.00 0.00 0.00 14 29 0.00 36.00 0.00 0.00 0.00 0.00 37. ** MAX MOMENT 38. LOAD LIST 19 39. PRINT SUPPORT REACTION 3 19 0.00 32.85 0.00 0.00 0.00 0.00 22 19 0.00 0.00 0.00 0.00 0.00 0.00 11 19 0.00 47.15 0.00 0.00 0.00 0.00 14 19 0.00 0.00 0.00 0.00 0.00 0.00 40. FINISH
CEG.Ltd., Jaipur Bridge Design Report
Consultancy Services for Feasibility Study and Detailed Project Preparation for Proposed Orissa State Road Project
BRIDGE AT CH:27+800

CEG.Ltd., Jaipur Bridge Design Report
Consultancy Services for Feasibility Study and Detailed Project Preparation for Proposed Orissa State Road Project
DESIGN OF SUBSTRUCTURE (PIER)

Consulting Engineers Group Ltd., Jaipur_______________________________________________________________________________
Bridge Design Report________________________________________________________________
Design Data :For design purposes, following parameters have been considered.
Grade of concrete Pier & Pier Cap = M -Pile cap & Pile = M -
Grade of reinforcement steel = Fe -Centre to Centre distance of A / Expansion joints = mCentre to Centre distance of Bearing = mDepth of superstructure = mmThickness of wearing coat = mmFormation level along C of carriage way = mHeight of bearing and Pedestal = mL.W.L./G.L = mH.F.L = mM.S.L =Pier cap top level = mPile cap top level = mDepth of pile cap = mmPile cap bottom level = mDiameter of bored cast-in-situ piles = mmLength of piles above rock level = mLength of piles below rock level = mTotal length of pile = mLoad carrying capacity of each pile = TonsLive Load Class A 2 Lane
Class 70R wheeled Maximum surface velocity of water = x m/sec = m/sec
Say, m/secThe following codes are used for the design of substructure:
1 IRC : 6 - 20002 IRC : 21 - 20003 IRC : 78 - 2000
35
207.9050.300
218.139
41535
2100
2 3.000 4.24
214.172193.355
(b)
215.674
(a)
1200
2.000
4.30
30.00032.200
12.000
205.355
10.000
1800
275
207.155
65.00

Consulting Engineers Group Ltd., Jaipur_________________________________________________________________________________
Bridge Design Report____________________________________________________________________________
Depth of SuperStructure =Number of Longitudinal Girders =Mid section1 slab = 12*0.25 = m2
2 Top Flange = 4*[(0.15*1.25)+(0.5*(1.25+0.275))*0.16 = m2
3 Web = 4*[(2.1-(0.15+0.16)-(0.2+0.24))*0.275] = m2
4 Bottom Bulb = 4*[(1*0.2)+(0.5*(1+0.275))*0.24 = m2
Total = m2
2.81.000
0.275
0.20.24
2.8
0.150.16
1.25
12.007.50
0.25
2.82.35
4
4.135
1.238
1.485
1.412
0.5
0.250
1.8
1.525 0.225
1.8
2.10.625
3

Consulting Engineers Group Ltd., Jaipur_________________________________________________________________________________
Bridge Design Report____________________________________________________________________________
End Section
Depth of SuperStructure =Number of Longitudinal Girders =End section1 slab = 12*0.25 = m2
2 Top Flange = 4*[(0.15*1.25)+(0.5*(1.25+0.6))*0.107 = m2
3 Web = 4*[(2.1-(0.15+0.107)-(0.2+0.132))*0.6] = m2
4 Bottom Bulb = 4*[(1*0.2)+(0.5*(1+0.6))*0.132 = m2
Total = m2
DL per running meter at Intermediate section = t/mDL per running meter at End section = t/m
0.250
1.8
0.6
0.225
0.25
14.98675
3
0.5
10.3375
12.00
0.13
11.00
5.99
1.525
2.8
0.2
1.25 0.15
1.53
1.1459
1.2224
0.107
3.6264
2.354
2.8 1.8
2.1
1.0002.8

Consulting Engineers Group Ltd., Jaipur_________________________________________________________________________________
Bridge Design Report____________________________________________________________________________
Intermediate Cross GirderThickness of Cross Girder =Number of intermediate cross girders =
Cross sectional area in elevation = m2
Dl of intermediate cross girder = tEnd Cross GirderThickness of end Cross Girder =Number of intermediate cross girders =
Cross sectional area in elevation = m2
Dl of intermediate cross girder = tS.I.D.LI Wearing Coat @ t/m = t/mII Crash barrier @ t/m
(provide one side enter 1,bothsides enter 2 , otherwise enter 0) = t/mIII R.C.C Post & Railing @ t/m
(provide one side enter 1,bothsides enter 2 , otherwise enter 0) = t/m
1
2footpath precast slab
3
4φ mm
1.07251.00
0.0850 0
2 2.00
0.45
0.33
12.258527.58163
1.0725
2
18.027740.56233
1001525
100
200
500
250
500 1525 225
250
50 200 50 200
1050
150
150
5

Consulting Engineers Group Ltd., Jaipur_________________________________________________________________________________
Bridge Design Report____________________________________________________________________________
Wt due to CrashbarrierComponent Area Wt
12345
t/m say,Footpath precast slab
t/mmissllaneous utilities t/mFootpath kerb t/msandfilling t/mIV Foot path precast slab@ t/m
(provide one side enter 1,bothsides enter 2 , otherwise enter 0) = t/mV Footpath Kerb @ t/m
(provide one side enter 1,bothsides enter 2 , otherwise enter 0) = t/mVI Missillaneous utilities @ t/m
(provide one side enter 1,bothsides enter 2 , otherwise enter 0) = t/mVII Sandfilling in footpath @ t/m
(provide one side enter 1,bothsides enter 2 , otherwise enter 0) = t/mTotal = t/mTotal S.I.D.L Reaction = t
t t tt/m t/m
t/m
m
RA m RB
Due to girders:Reaction RA = (10.3375*0.5*25.4)+(14.99*2.5)+(0.5*12.66*2.9)+20.28+13.79)
= tDue to SLAB = tDue to SIDL = tTotal DL + SIDL = t
20.281227.5816
5.25169.2086
0.430.8
2.5 2.9 30
14.9868 12.662120.2812
10.3375
2 0.76250.14063
2 0.28125
2 0.40.36934
2
0.38125
853.07984.6043120.75
0.002
0.0750.075
0.240.0875 0.210.100
0.18
0.738677
1.000
0.36934
0.96
221.1852
0.15413
0.18
0.20519
0.2
0.1525 0.381250.2
0.05625 0.14063
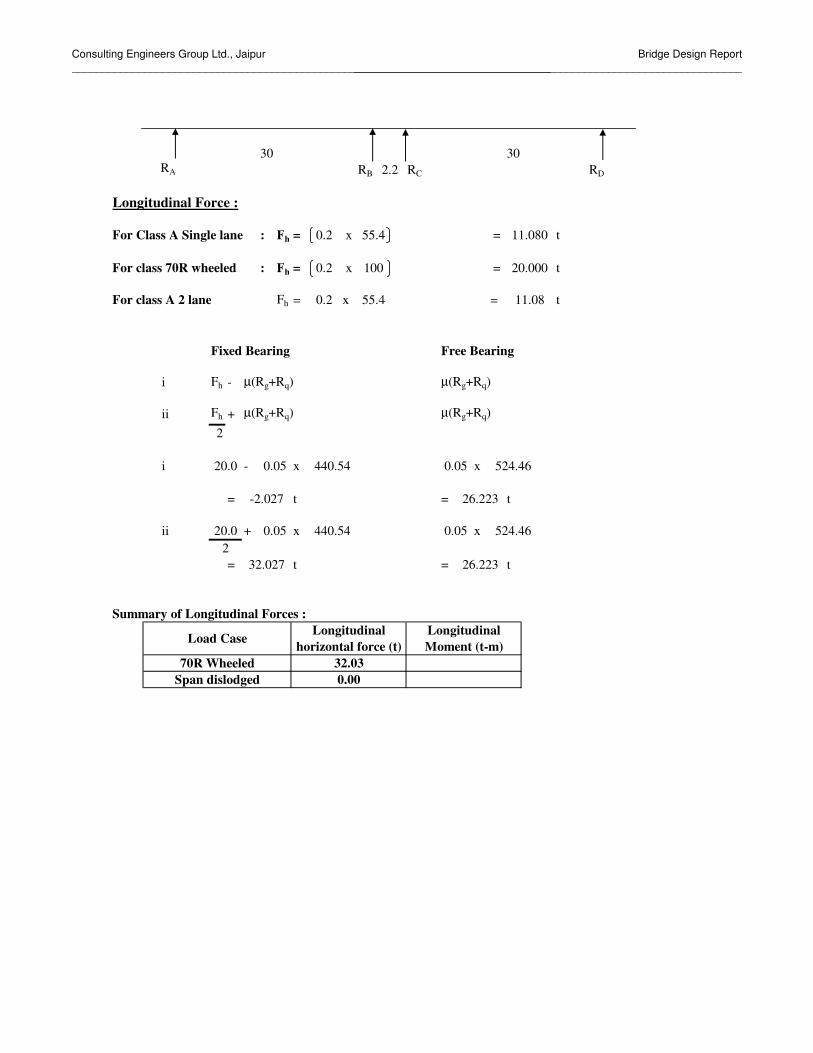
Consulting Engineers Group Ltd., Jaipur_______________________________________________________________________________
Bridge Design Report________________________________________________________________
RA RB RC RD
Longitudinal Force :
For Class A Single lane : Fh = x = t
For class 70R wheeled : Fh = x = t
For class A 2 lane Fh = x = t
Fixed Bearing Free Bearing
i Fh - µ(Rg+Rq) µ(Rg+Rq)
ii Fh + µ(Rg+Rq) µ(Rg+Rq)
2
i - x x
= t = t
ii + x x
= t = t
Summary of Longitudinal Forces :
232.027 26.223
524.46
-2.027 26.223
20.0 0.05 440.54 0.05
20.0 0.05 440.54 0.05
30 302.2
0.2
11.080
20.000
55.4
524.46
0.2 100
0.2
Longitudinal Moment (t-m)Load Case
Span dislodged70R Wheeled 32.03
Longitudinal horizontal force (t)
0.00
11.0855.4

Consulting Engineers Group Ltd., Jaipur_______________________________________________________________________________
Bridge Design Report________________________________________________________________
Moment in Transverse DirectionEccentricity of vertical load in transverse direction,
(a) Class A Single lane = - - =2
(b) Class A 2 lane = - - x 2 + =2
(c) Class 70R Wheeled= - - =
Footpath Live load :The effective span of girders = m > mTherefore, Intensity of footpath live load = P = P' - + - W
LWhere, P' = Kg/m2
Therefore, - + -
= Kg/m2 = t/m2
When one side is loaded;Load on each span = x x = t Say, tWhen both sides are loaded;Load on each span = x 2 = t Say, t
Eccentricity of load in transverse direction:When one side is loaded = - + = m
When both sides loaded = NilSummary of Footpath Live load :
LOADING: CASE RA (t) RB(t) RC(t) RD(t) ML MT RB + RC
Class A 1 Lane MAX REAMAX LONG
Class A 2 Lane MAX REAMAX LONG
70R Wheeled MAX REAMAX LONG
SUMMARY OF LOAD ON PIER FROM SUPERSTRUCTURE
1 D.L2 S.I.D.L3 L.L
Max ReaMax Long
0
0
4.137.86
0
16.08
34.38
96.68
43.75.3
P
197.21683.87
83.92
0
236.87
0
19.62492.312 244.21
014.98
ML MT
083.92
38.2157.2676.42
96.6876.4290.57
039.42
046.87
83.9292.312
160.48236.87187.23263.56244.21
84.0623.487
38.21203.03 48.34
17.1926.34
42.03119.624
13.17 28.63 19.71 7.49 9.812
2.001.711.0 0.40 1.80
11.0
0.00
Transverse moment
260
11.0
1.93
2.45
2.91
1.80 4.2
2
260
30.00
400
0.40
2.001.63
32.200
2.00
289.07
28.0
15
1.5
0.289
When both sides loaded7.00When one side is loaded
Longitudinal momentReaction
28.00 0.000.00 33.25
(a)32.200 13.962
(a) 6 0.5
27.924
4.75
14.0
1.5
Load Case
(b)0.289 1.5
(b)2
400
13.962
32.2
16.515
4800 16.5
4800
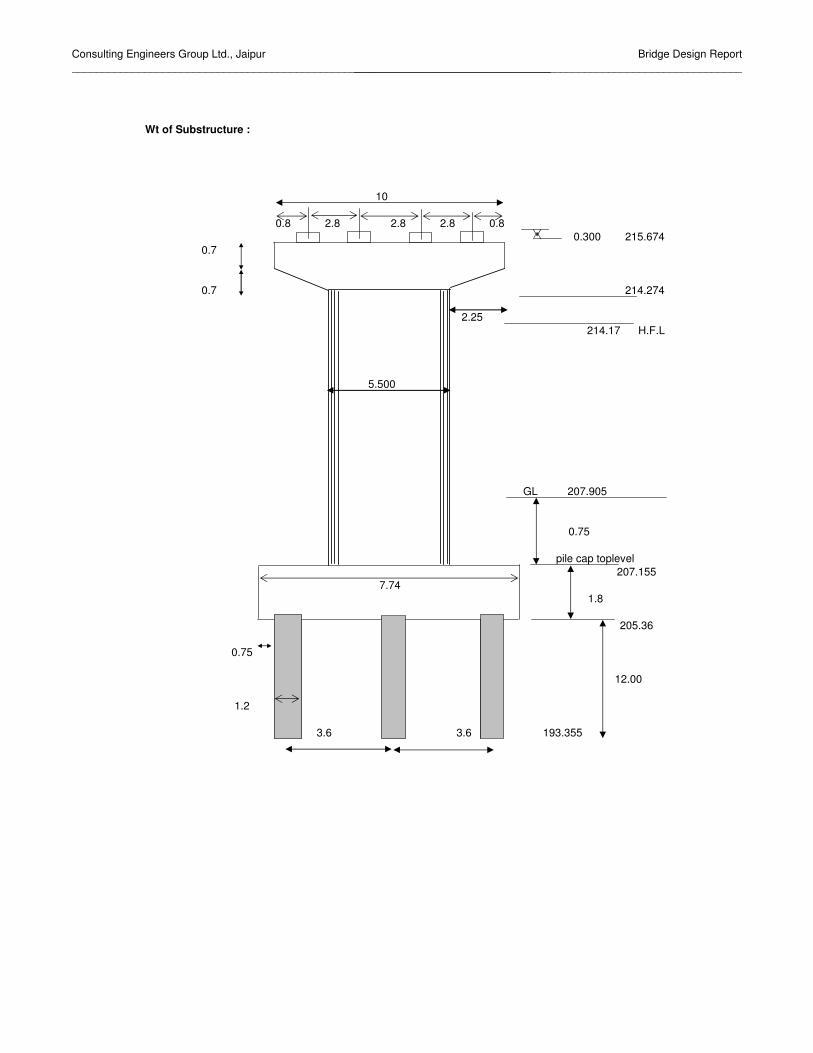
Consulting Engineers Group Ltd., Jaipur_______________________________________________________________________________
Bridge Design Report________________________________________________________________
Wt of Substructure :
H.F.L
GL
pile cap toplevel
0.7
0.7
5.500
2.25
214.274
205.36
0.75
2.8 2.80.300
0.8215.674
10
3.6
7.74
0.8 2.8
207.905
214.17
3.6
207.155
1.8
12.00
193.355
1.2
0.75

Consulting Engineers Group Ltd., Jaipur_______________________________________________________________________________
Bridge Design Report________________________________________________________________
Loads from substructure
1 DRY Condition0 0
1 Wt of Pier cap
Rectangularx x x = t
Trapezoidal x x x = t= t
2 Wt of Pier Shaftx x x =x x x = t
= t
3 Wt of Pile capx x = t
4 Weight due to Earth - x x =
2 H.F.L
Rectangularx x x = t
Trapezoidal x x x = t= t
2 Wt of Pier Shaftx x x = tx x x = tx x x = tx x x = t
t3 Wt of Pile cap
x x = t
4 Weight due to Earth - x x =
0.7854 2.250 0.10 2.4 0.4326
10
4.000
4.000.75
0.7854
7.7553.763.2010
2.4 30.19277.119 1.5
2.441.66495.424
0.7 3.20 2.40.7
102.5142.4
7.7756.07
3.20
0.75
2.42.4
65.21441.8
17.36010.7854 2.250 7.02 1.4
4 1.5 7.02 1.4
132.706
4.000
41.66453.760.7 3.20
7.75 0.7
58.94281.5 0.10 2.4 1.4688
2.250 7.12
141.307
56.07 1.8 2.4 242.24
95.424
78.2043
36.230256.07 7.77 1.0 0.75
56.07 1.8 1.4

Consulting Engineers Group Ltd., Jaipur_______________________________________________________________________________
Bridge Design Report________________________________________________________________
8.7
0.15
1.5
0.75
3.20
0.75
0.3

Consulting Engineers Group Ltd., Jaipur_______________________________________________________________________________
Bridge Design Report________________________________________________________________
H.F.L. Case :Formation level = mH.F.L. = mFoundation level = mVertical load on pile foundation;Vertical load from substructure & Pile cap
+ + + = t Say, tPier cap Pier shaft pile cap earth Total load = tWater current pressure;Maximum surface velocity at H.F.L. = m/sec
So,
P = kV2
= x k x 2 = k kg/m2
= k t/m2
PIER CAPk t/m2 k m
PIER SHAFT
km
k
PILE
m
95.424
214.172193.355
4.30
52
52
352.00352.0078.204 36.23
0.961
7.11
90
193.355
H.F.L=
961.48
0.961
0.897
0.568
1.80
10.4
98
PILE CAP20.8
17
207.053
218.139
1.4
0.485
351.165
214.172
141.31
4.30

Consulting Engineers Group Ltd., Jaipur_______________________________________________________________________________
Bridge Design Report________________________________________________________________
Transverse direction;
Pressure per metre depthPier cap
x Cos 200 x x = t/m depth
x Cos 200 x x = t/m depthPier shaft
x Cos 200 x x = t/m depth
x Cos 200 x x = t/m depthPile cap
x Cos 200 x x = t/m depth
x Cos 200 x x = t/m depth
Pressure & moment at pile cap bottom;x = t x m = t-m
1 x - x = t x m = t-m2
x = t x m = t-m1 x - x = t x m = t-m2
x = t x m = t-m1 x - x = t x m = t-m2 Total load = t = t-m
Say, t Say, t-m
Longitudinal direction;Pressure per metre depth
Pier cap
x Sin 200 x x = t/m depth
x Sin 200 x x = t/m depthPier shaft
x Sin 200 x x = t/m depth
x Sin 200 x x = t/m depthPile cap
x Sin 200 x x = t/m depth
x Sin 200 x x = t/m depth
Pressure & moment at pile cap bottom;x = t x m = t-m
1 x - x = t x m = t-m2
x = t x m = t-m1 x - x = t x m = t-m2
x = t x m = t-m1 x - x = t x m = t-m2 Total load = t = t-m
Say, t Say, t-m
Therefore, Total vertical load = = tLongitudinal moment = = t-m
Transverse moment = = t-m
1.924
0.897 0.00 10.00 0.000
1.603
2.254
1.50 5.50
9.852 0.000.000 9.6190.000 1.400 0.000
0.00
5.50
38.02239.00
0.0000.961 0.00 10.00
86.24319.00 87.00
5.360 61.156.546 21.62
0.900
18.473
3.464
352.00P
3.122.254 1.924 1.800 0.297 1.200 0.36
1.924
2.531 1.603 7.119 3.3021.603
(b)0.568 1.50
7.119
0.485 1.50
0.0001.400
1.800
0.000
7.74
11.410
7.74
(a)
MT 39.00
2.531
0.568
(a)0.897 1.50
ML 87.00
16.47117.00
1.50
7.119
(a)0.000.961 1.50 0
(b)0.897
1.50 0.8340.897 0.66
00.00
0.568 0.66 1.50 0.528(c)
0.568 1.50 8.70 6.966
0.485 1.50 8.70 5.946
00 1.4 0.000 9.852 0.000 1.4 0 9.619
1.089
0
0.528 7.119 3.762 5.360 20.16
6.966 5.946 1.800 0.918
6.546 7.130.834 0.528
1.200 1.105.946 1.800 10.703 0.900 9.63

Consulting Engineers Group Ltd., Jaipur_______________________________________________________________________________
Bridge Design Report________________________________________________________________
Case-I(1) :DRY. condition with L.L:
L.W.L. = mPile cap top level = mPile cap bottom level = m
Vertical load on Pile foundation;Load from superstructure : Max Reaction case
S.I.D.L. + D.L. = + = t+ Live load = t
t Say, tLoad from superstructure : Max Long.Moment case
S.I.D.L. + D.L. = + = t+ Live load = t
t Say, tLoad from substructure & pile cap =
+ = t Say, tPier cap Pier shaft pile cap
Horizontal longitudinal force at bearing level for pier = t= x =
Total = Say, t-mP ML MT
Max ReaMax Long
Case-II(1) :H.F.L. case (Live load condition) :
Water level = mPile cap top level = mPile cap bottom level = m
Load from superstructure: Max Reaction caseS.I.D.L. + D.L. = + = tLive load = t
t Say, tLoad from superstructure: Max Long.Moment case
S.I.D.L. + D.L. = + = tLive load = t
t Say, tLoad from substructure & pile cap = t Say, t
P ML MT
Max ReaMax Long
Seismic forces do not govern for Zone II & III .Sample calculations have already been submitted.
83.92965.00 965.00
1317.00 520.31 283.2
351.165 352.00
1330.00 447.62
244.2
197.21 683.87 881.08
978.0096.68
977.76
433.31
197.21 683.87 881.0883.92
965.00 965.00
65.214
236.9
95.42 132.71 242.24
Moment 32.027
207.905
977.76
535.59 536.00
881.0896.68
207.155205.355
683.87
978.00
275.9
197.21 683.87 881.08
214.172207.155
340.09
1501.00
197.21
205.355
32.02710.619 340.1
341
earth
1514.00 360.62
+

Consulting Engineers Group Ltd., Jaipur_______________________________________________________________________________
Bridge Design Report________________________________________________________________
Case-I(2) :DRY. case (Span dislodged condition) :
Vertical load on Pile foundation;Load from superstructure : Max Reaction case
S.I.D.L. + D.L. = + = tLive load = t
t Say, t
Load from substructure & pile cap = t Say, t
Horizontal longitudinal force at bearing level for pier = t= x = t-m
Total = Say, t-m
Transverse moment = Say, t-mP ML MT
Max ReaMax Long
Case-II(2) :H.F.L. case (Span dislodged condition) :
Vertical load on Pile foundation;Load from superstructure
S.I.D.L. + D.L. = + = tLive load = t
t Say, t
Load from substructure & pile cap = t Say, t
Horizontal longitudinal force at bearing level for pier = t= x = t-m Say,
P ML MT
Max ReaMax Long 1234.00 87.00 39.0
0
0.00 0.0
1234.00 87.00 39.0
351.165 352.00
0.00
0.00881.08 882.00
197.21 683.87 881.08
Moment 0.00 10.619 0.000
Moment 0.00 10.619 0.000
535.585
0.00881.08 882.00
536.00
0.00
0.000 0
197.21 683.87 881.08
0.00 0.0
1418.00 0.00 0.01418.00

Consulting Engineers Group Ltd., Jaipur_______________________________________________________________________________
Bridge Design Report________________________________________________________________
DESIGN OF PILE LAYOUT
Diameter of pile D = mc/c distance ratio of pile, K = x
= 3.60 mProjection of pile cap from the face of pile= 0.15 mNO. OF PILES : 7
TRAFFIC
DIRECTION
0.75 1.8 0.75
X ZL Y1234567
εx2 εy2
Wherex = Distance of pile from C.G of pile group in longitudinal direction
ZL =y = Distance of pile from C.G of pile group in transverse direction
ZT =
PILE LAYOUT PLAN1.8
3.12
PILE NO
εx2 / x
εy2 / y
12.4712.47
---
12.47
1.50
1.203.00 1.20
5.1
7.74
8.7
3.12
ZT
12.47
3.1183.1180.0000.0000.0003.1183.11838.88
21.6021.6010.80
-
1.8001.8003.6000.000
38.88
10.8021.6021.60
3.6001.8001.800
1
6
2
7
4 53

Consulting Engineers Group Ltd., Jaipur_______________________________________________________________________________
Bridge Design Report________________________________________________________________
Pile CapArea of Pile cap = m2
Dry Case: Pile 1 Pile 2 Pile 3Max ReaMax LongSpan DislodgedH.F.L Case:Max Rea 1330.00 447.62 275.87 232.84
251.97
56.07P ML MT
218.58 249.681501.00 433.31 244.21 254.07 213.95 254.551514.00 360.62 236.87
1418.00 0.00 0.00 202.57 202.57 202.57
191.40 231.45

Consulting Engineers Group Ltd., Jaipur_______________________________________________________________________________
Bridge Design Report________________________________________________________________
Max LongSpan DislodgedDry Case: Pile 4 Pile 5 Pile 6 Pile 7Max ReaMax LongSpan DislodgedH.F.L Case:Max ReaMax LongSpan DislodgedDry Case: Pile 1 + Pile 2 Pile 1 + Pile 6 Pile 3Max ReaMax LongSpan DislodgedH.F.L Case:Max ReaMax LongSpan Dislodged
Design of Pile Layout
231.45236.32
358.83
570.00564.43528.86
424.24421.71
184.34
468.02405.14
169.13
607.71723.53 254.55
202.57
470.56 249.68
188.14 139.9658 189.52 141.34
202.57 202.5714 202.57 202.57214.43 174.3071 214.91 174.79
1317.00 520.31 283.21 234.941234.00 87.00 39.00 183.44 175.39 184.34
186.76 236.32
216.29 182.8946 213.99 180.60
715.64
176.29 168.2302 177.19
190.00 148.5533 188.60 147.16
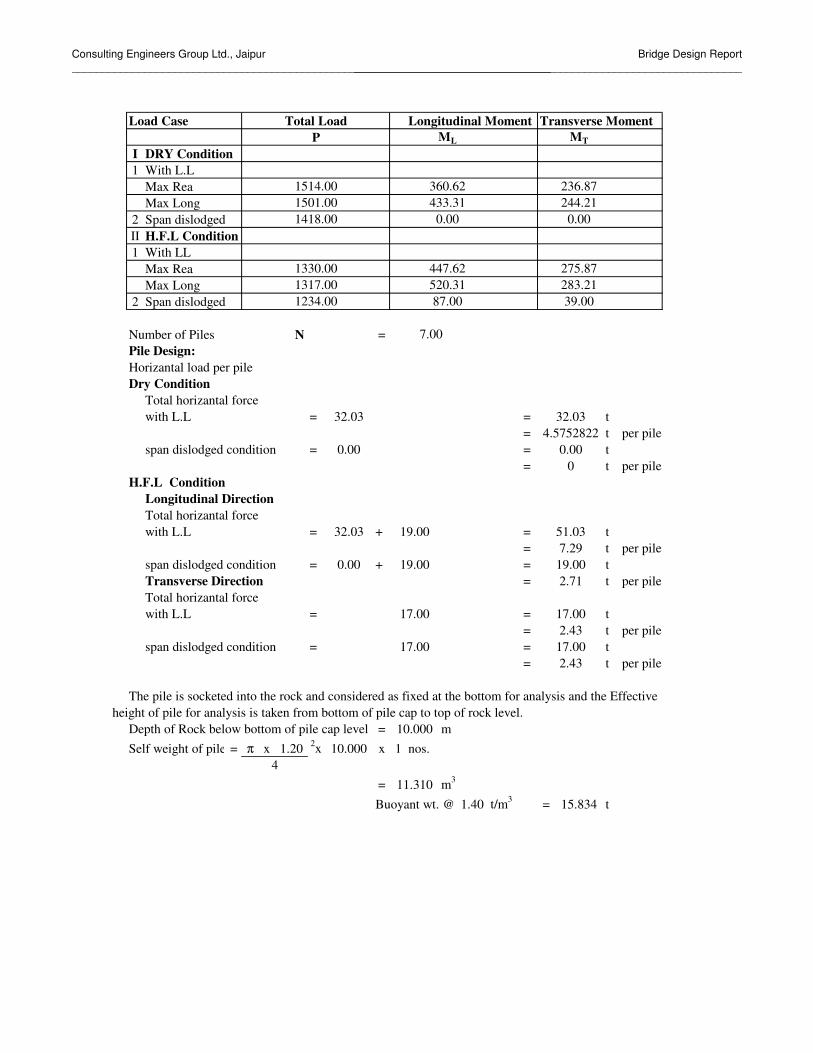
Consulting Engineers Group Ltd., Jaipur_______________________________________________________________________________
Bridge Design Report________________________________________________________________
Load Case Total Load Longitudinal Moment Transverse MomentP ML MT
I DRY Condition1 With L.L
Max ReaMax Long
2 Span dislodgedII H.F.L Condition1 With LL
Max ReaMax Long
2 Span dislodged
Number of Piles N =Pile Design:Horizantal load per pileDry Condition
Total horizantal forcewith L.L = = t
= t per pilespan dislodged condition = = t
= t per pileH.F.L Condition
Longitudinal DirectionTotal horizantal forcewith L.L = + = t
= t per pilespan dislodged condition = + = tTransverse Direction = t per pileTotal horizantal forcewith L.L = = t
= t per pilespan dislodged condition = = t
= t per pile
The pile is socketed into the rock and considered as fixed at the bottom for analysis and the Effectiveheight of pile for analysis is taken from bottom of pile cap to top of rock level.
Depth of Rock below bottom of pile cap level = mSelf weight of pile = π x 2x x 1 nos.
= m3
Buoyant wt. @ t/m3 = t
447.62520.31
275.87283.21
7.00
2.71
17.002.43
15.834
17.00
7.290.00 19.00 19.00
0
32.03 19.00 51.03
4.57528220.00 0.00
32.03 32.03
1418.00 0.00 0.00
1514.00 360.62433.31 244.21
236.871501.00
1234.00 87.00 39.00
1330.001317.00
10.0001.20 10.000
4
17.00
17.00
1.4011.310
2.43

Consulting Engineers Group Ltd., Jaipur_______________________________________________________________________________
Bridge Design Report________________________________________________________________
t /t ML = x = t-m
MT = x = t-mMR = t-m
Reaction on each Pile = x
=
Load at Pile base :Maximum load on a pile at pile cap bottom = tMinimum load on a pile at pile cap bottom = t
Provide nos φ
= cm2
= cm2
0.4%
9.933
38.42 2.07.74
36.44812.14
2.429
1000
0
7.2907.290
5.00
5000
2.42938.42
254.55
5.00
139.97
23 16
46.2
45.2
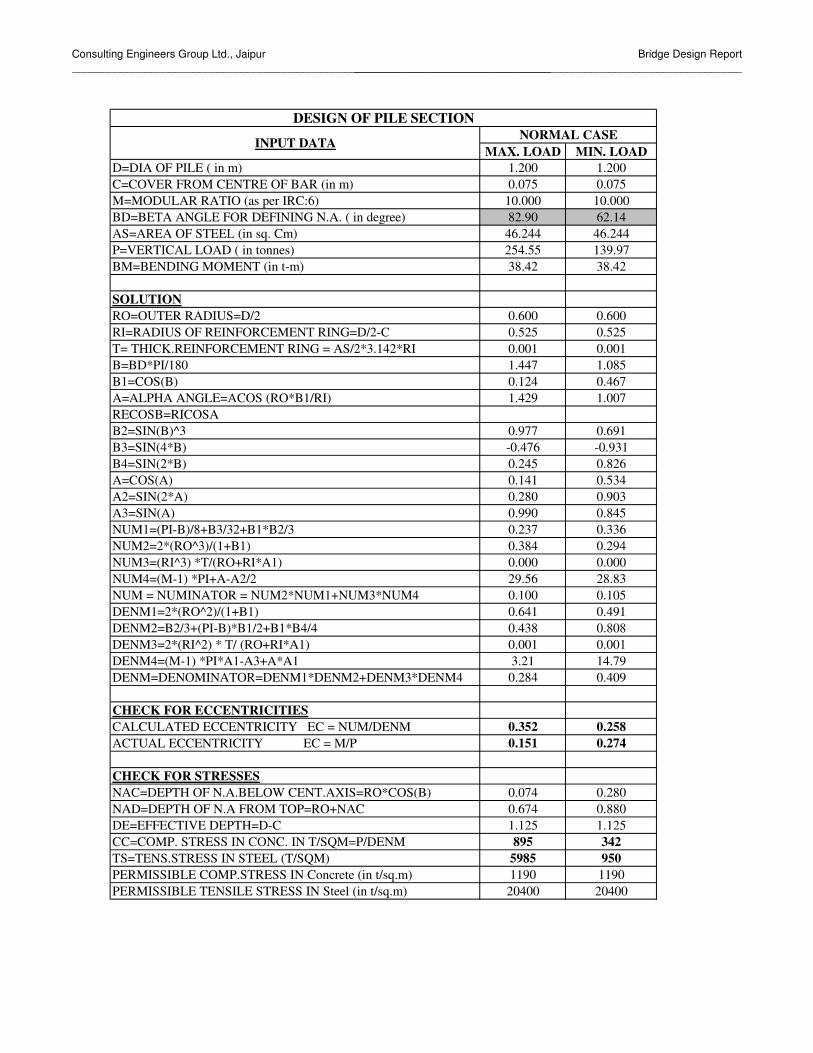
Consulting Engineers Group Ltd., Jaipur_______________________________________________________________________________
Bridge Design Report________________________________________________________________
MAX. LOAD MIN. LOADD=DIA OF PILE ( in m) 1.200 1.200C=COVER FROM CENTRE OF BAR (in m) 0.075 0.075M=MODULAR RATIO (as per IRC:6) 10.000 10.000BD=BETA ANGLE FOR DEFINING N.A. ( in degree) 82.90 62.14AS=AREA OF STEEL (in sq. Cm) 46.244 46.244P=VERTICAL LOAD ( in tonnes) 254.55 139.97BM=BENDING MOMENT (in t-m) 38.42 38.42
SOLUTIONRO=OUTER RADIUS=D/2 0.600 0.600RI=RADIUS OF REINFORCEMENT RING=D/2-C 0.525 0.525T= THICK.REINFORCEMENT RING = AS/2*3.142*RI 0.001 0.001B=BD*PI/180 1.447 1.085B1=COS(B) 0.124 0.467A=ALPHA ANGLE=ACOS (RO*B1/RI) 1.429 1.007RECOSB=RICOSAB2=SIN(B)^3 0.977 0.691B3=SIN(4*B) -0.476 -0.931B4=SIN(2*B) 0.245 0.826A=COS(A) 0.141 0.534A2=SIN(2*A) 0.280 0.903A3=SIN(A) 0.990 0.845NUM1=(PI-B)/8+B3/32+B1*B2/3 0.237 0.336NUM2=2*(RO^3)/(1+B1) 0.384 0.294NUM3=(RI^3) *T/(RO+RI*A1) 0.000 0.000NUM4=(M-1) *PI+A-A2/2 29.56 28.83NUM = NUMINATOR = NUM2*NUM1+NUM3*NUM4 0.100 0.105DENM1=2*(RO^2)/(1+B1) 0.641 0.491DENM2=B2/3+(PI-B)*B1/2+B1*B4/4 0.438 0.808DENM3=2*(RI^2) * T/ (RO+RI*A1) 0.001 0.001DENM4=(M-1) *PI*A1-A3+A*A1 3.21 14.79DENM=DENOMINATOR=DENM1*DENM2+DENM3*DENM4 0.284 0.409
CHECK FOR ECCENTRICITIESCALCULATED ECCENTRICITY EC = NUM/DENM 0.352 0.258ACTUAL ECCENTRICITY EC = M/P 0.151 0.274
CHECK FOR STRESSESNAC=DEPTH OF N.A.BELOW CENT.AXIS=RO*COS(B) 0.074 0.280NAD=DEPTH OF N.A FROM TOP=RO+NAC 0.674 0.880DE=EFFECTIVE DEPTH=D-C 1.125 1.125CC=COMP. STRESS IN CONC. IN T/SQM=P/DENM 895 342TS=TENS.STRESS IN STEEL (T/SQM) 5985 950PERMISSIBLE COMP.STRESS IN Concrete (in t/sq.m) 1190 1190PERMISSIBLE TENSILE STRESS IN Steel (in t/sq.m) 20400 20400
INPUT DATA NORMAL CASEDESIGN OF PILE SECTION

Consulting Engineers Group Ltd., Jaipur_______________________________________________________________________________
Bridge Design Report________________________________________________________________
PILE CAP DESIGN:TRAFFIC
DIRECTION
S
1.5
0.75 1.8 0.75
STotal Load on Pile in One row Pile 1 & Pile 6 = tTotal Load on Pile in Second row Pile 3 = tLever arm for bending moment due to Pile 1 & Pile 6 = mLever arm for bending moment due to Pile 3 = m Bending Moment in Transverse direction Pile 1 & Pile 6 = t-m Bending Moment in Transverse direction Pile 3 = t-mTotal Load on Pile 1 & Pile 2 = t Bending Moment in Longitudinal direction = t-m
4 1.200.7 5
3 1
1.502
3
1.051.6375
3.12
3.12
2.85
723.53254.55
1.05
7.74
2.85759.71
1.507.74
3.12
1.8
8.7
5.1
3.12
470.56725.4677
213.17
1
6
2
7
4 53

Consulting Engineers Group Ltd., Jaipur_______________________________________________________________________________
Bridge Design Report________________________________________________________________
Wt of Pile cap in Transverse directionArea of strip 1 = m2
Wt due to strip 1 = tMoment due to strip 1 = t-m
Area of strip 2 = m2
Wt due to strip 2 = tMoment due to strip 2 = t-m
Area of strip 3 = m2
Wt due to strip 3 = tMoment due to strip 3 = t-mMoment due to pile cap ( Pile 1 & Pile 6) = t-mMoment due to pile cap ( Pile 3) = t-mWt of Pile cap in Longitudinal directionArea of strip 4 = m2
Wt due to strip 4 = tMoment due to strip 4 = t-m
Area of strip 5 = m2
Wt due to strip 5 = tMoment due to strip 6 = t-m
= t-m Total Bending Moment in Transverse direction Pile 1 & Pile 6 = t-m Total Bending Moment in Transverse direction Pile 3 = t-m Total Bending Moment in Longitudinal direction = t-m
Design for FlexureM = 35Fe = 415σcbc =σst =m = 10k =j =Q =
Depth of Pile Cap = mPile shall be embeded by 50 mm into Pile cap & provide cover for Reinforcement 75 mmdeff avilabledeff required in Transverse direction pile1& Pile 6 = mdeff required in Transverse direction Pile 3 = mdeff required in Longtudinal direction = m
Ast required in Transverse direction due to pile 1 & pile 6 = mm2
Ast required in Transverse direction due to pile 3 = mm2
Ast required in Longtudinal direction = mm2
Ast required in Transverse direction /m width = mm2/m
Ast required in Transverse direction /m width = mm2/m
Ast required in Transverse direction /m width = mm2/m
Minimum area of steel required = mm2/m(As per cl. 305.19 of
IRC :21-2000)Ast required in Longtudinal direction /m width = mm2/m
Minimum area of steel required = mm2/m
6815.029
3033.341
1336.28
1.6375
0.673187
0.39611
23464.05
0.669786
0.370.881.89
1.8
674.08
195.78
11.66667
200
1.45
85.63
17.39
6.1426.5015.94
0.84
31.49
5.61
13.92
3.61
60.1554.14
24.2458.18
6036.114
23227.6
3002.773
667.28
58.18
2.7011.66
2160.00
2160.00

Consulting Engineers Group Ltd., Jaipur_______________________________________________________________________________
Bridge Design Report________________________________________________________________
Transverse direction on Bottom face:Total reinforcement in transverse direction on bottom face = mm2
Provide φ mm c/c = mm2/mTransverse direction on Top face:Minimum area of steel required on top face = mm2/m
Provide φ mm c/c = mm2/m
Longitudinal direction on Bottom face:Provide φ mm c/c = mm2/m
Provide φ mm c/c = mm2/mLongitudinal direction on Top face:Minimum area of steel required on top face = mm2/m
Provide φ mm c/c = mm2/mCheck for ShearDistance of section S-S from face of PierPortion of Pile Cap effective for Shear = mPile 3 is fully effective for shear & Pile 1,Pile 6 are partially effective Portion of Pile effective for Shear = mShear due to Pile 3 = tShear due to Pile 1 & Pile 6 = tTotal Shear = tWt of Pile cap upto section S-S = tNet UpwardShear = t
Shear Stress = t/m2
Percentage reinforcement provided = %
Permissible Shear Stress = t/m2
No shear reinforcement required Provide Minimum Shear
39.15222.94
17.60
254.557.54
262.09
1.63751.9625
0.185242
19.13129
32 125 6433.982
20 130 2416.61
16 130 1546.63
16 130 1546.63
1080
1080
20 130
1.20
6036.114
2416.61

Consulting Engineers Group Ltd., Jaipur_______________________________________________________________________________
Bridge Design Report________________________________________________________________
Design of Pier shaft :
Checking the section at R.L. = m
Lever arm for Longitudinal forces = i.e( - )DRY With L.L
1 Vertical load - Max Reaction case Max Long.Moment caseS.I.D.L. = t =Dead load = t =Live load = t =Pier cap = t =Pier shaft = t =
Total load = t = t2 Longitudinal moment -
Due to Longitudinal force = x = t-mt-m
H.F.L With L.L1 Vertical load - Max Reaction Case Max Long.Moment Case
S.I.D.L. = t =Dead load = t =Live load = t =Pier cap = t =Pier shaft = t =
Total load = t Say, t = t2 Longitudinal moment -
Due to earth = t-mDue to Longitudinal force = t-m
Total moment = t-m Say, t-m
DRY spandislodgedcondition1 Vertical load -
S.I.D.L. = tDead load = tPier cap = tPier shaft = t
Total load = t Say, t2 Longitudinal moment -
Due to Longitudinal force = x = t-m= t-m t-m
H.F.L spandislodged condition1 Vertical load -
S.I.D.L. = tDead load = tPier cap = t
Max Long 1109.2 0.00 0.00
MT
Max Rea 1109.21 0.00 0.00
Max ReaMax Long
P ML
683.8795.42
132.711109.21
0.00
83.9295.42
78.2041138.6
Max ReaMax Long
197.21683.87
197.21683.87
132.7061193.1
1193.13 375.31 244.21
282.45
P1205.89
197.21683.8783.9295.42
197.21683.8796.68
8.81932.027
1205.89
95.42132.706
Calculation of Forces at Pier base(At Top of Pile cap)
8.819
207.16
215.97 207.16
96.68
78.2041151.391151.39
95.42
282.45
0.000282.45
P ML MT
1151.39 385.39 264.151138.6 458.08 271.50
197.21
1109.21
0.000 8.819 0
197.21683.8795.42
0.00
283.00
283.00ML MT
302.62 236.87
m

Consulting Engineers Group Ltd., Jaipur_______________________________________________________________________________
Bridge Design Report________________________________________________________________
Pier shaft = tTotal load = t Say, t
2 Longitudinal moment -Due to Longitudinal force = x = t-mDue to earth = t-m
= t-m t-m
φφ
φ no.both sides
% Reinforcement provided = mm2
Summary of Loads at Abutment Shaft bottom :
1 DRY condition P ML MT
With L.LMax ReaMax LongSpan dislodged
2 H.F.LWith L.LMax ReaMax LongSpan dislodged
Check for Cracked/Uncracked SectionLength of section = mmWidth of section = mmGross Area of section Ag = mm2
Gross M.O.I of section Igxx = mm4
Gross M.O.I of section Igyy = mm4
y
x x
y
Abutment section
Transformed sectional properties of section:Adopting
264.15271.500.00
236.871193.13 375.31 244.211205.89 302.62
1151.391138.63
385.39458.08
5329.3
5329.34041500
7994010.6
1.499E+12
1.892E+13
1500
PLAN : PIER SHAFT32669.422
1109.21 0.00 0.00
1054.71 82.77
1500 16 8
5329.34
25 3025 30
Max Long 1054.7 82.77 0.00
P ML MT
Max Rea 1054.71 82.77 0.00
78.2041054.71 1054.71
0.000 8.819 0
0.000.000.00

Consulting Engineers Group Ltd., Jaipur_______________________________________________________________________________
Bridge Design Report________________________________________________________________
Modular ratio m =Cover
Dia of Bars =No of bars in tension face (longer) =No of bars in compression face =
No of bars in shorter direction =
Total bars in section =
Steel Area As = mm2
% of Steel = %y
x x
y
Asx = mm2
Asy = mm2
Area of concrete Ac = Ag - As = mm2
C.G of Steel placed on longer face = mmC.G of Steel placed on shorter face = mmTransformed Area of Section Atfm = mm2
Transformed M.Itxx = Igxx + 2 m - 1 As ax2
= mm4
Zxx = M.Itxx = mm3
d/2Transformed M.Ityy = Igyy + 2 m - 1 As ay2
= mm4
Zyy = M.Ityy = mm3
d/2
Permissible stressesMinimum Gross Moment of inertia Imin = mm4
Area of section = mm2
r = mmEffective length of Pier shaft (IRC:21-2000 cl: 306.2.1)
Pier shaft height L = mEffective length Leff = mSlenderness ratio = <Type of member = Shotr Column
7.11912.45828.771 50
6.922E+09
1.499E+12
7994010.6433.0127
8329768.3
1.37721E+12
1.836E+09
1.84454E+13
-3927
7956704.2677.5
2592.2
0.4667
675
677.5
-14726
30
8
76
37306
1072.5 72.5
25 2530

Consulting Engineers Group Ltd., Jaipur_______________________________________________________________________________
Bridge Design Report________________________________________________________________
Stress reduction coefficient (IRC:21-2000 cl: 306.4.2,3)β =
Permissible stresses : concreteσcbc = N/mm2
σco = N/mm2
Tensile stress = N/mm2
Permissible stresses : Steelσst = N/mm2
Dry caseS.No Item Max Rea Max Long Span Dislodg
Loads and Moments1 P t t
2 ML t-m t-m
3 MT t-m t-m
Actual(calculated) Stresses
4 σco,cal P/Atfm
5 σcbc,cal ML/Zxx
6 σcbc,cal MT/Zyy
7 σcbc,cal = 5 + 6
Permissible Stresses8 σcbc
9 σco
Check for Minimum steel area mm2
Conc.Area Required for directstress(1)/(9)
0.8% of area required0.3% of Ag
Governing steel mm2
Provided Steel area mm2
Check for safety of section
σco,cal + σcbc,cal
σco σcbc < 1 < 1 < 1
Check for Cracked /Uncracked section
σco,cal - σcbc,cal
Permissible Basic tensile stress in concreteSection to be designed as
-0.67UncrackedCracked
23982.03232669.422
0.1521852
1.3316209
8.75
1267667.810141.34323982.032
0.000000.000000.00000
11.666667
1109.21
0.00
0.00
1.33162
1193.13
375.31
244.21
1363576.4
0.352792.39666
11.6678.75
1.432372.04388
1090923982
2398232669
0.3691
-0.9643-0.67-0.67
Uncracked
8.75
1.648030.34218
14 32669.422
0.3360396
-0.542526
12 23982.032
13 23982.032
101378159.3
11 11025.274
200
1.99021
11.666667
1205.89
302.62
236.87
1.44769
1
11.667
8.75
0.67
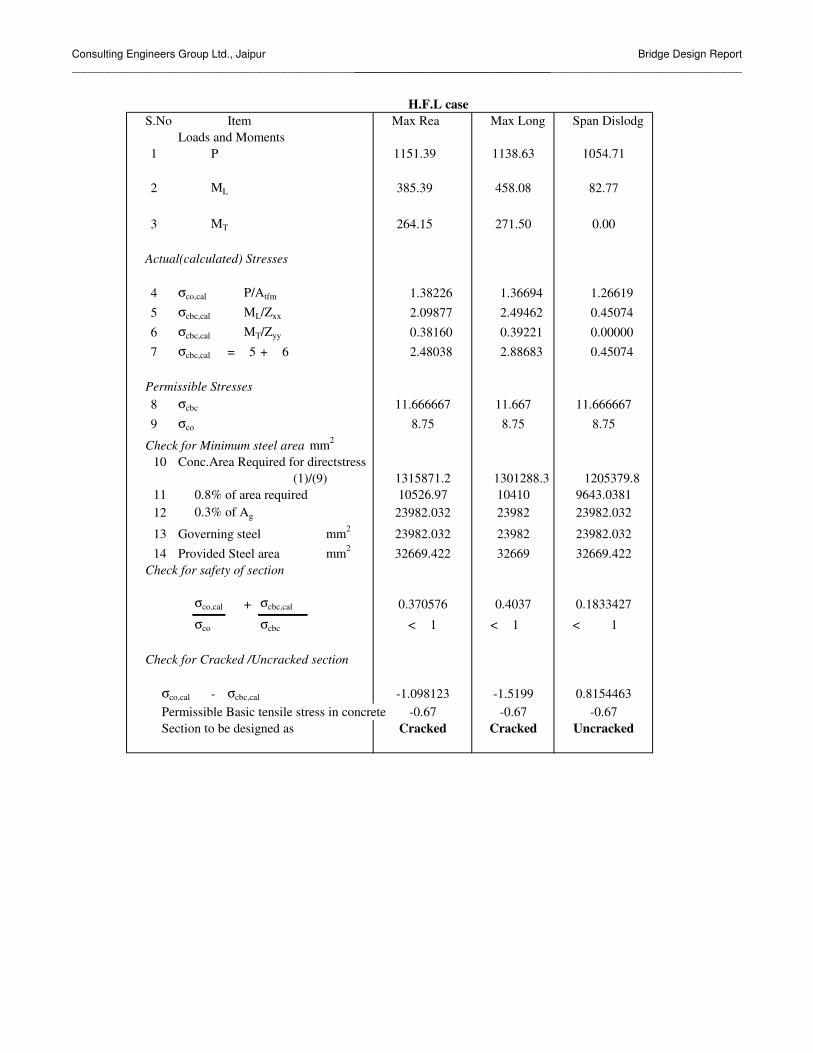
Consulting Engineers Group Ltd., Jaipur_______________________________________________________________________________
Bridge Design Report________________________________________________________________
H.F.L caseS.No Item Max Rea Max Long Span Dislodg
Loads and Moments1 P
2 ML
3 MT
Actual(calculated) Stresses
4 σco,cal P/Atfm
5 σcbc,cal ML/Zxx
6 σcbc,cal MT/Zyy
7 σcbc,cal = 5 + 6
Permissible Stresses8 σcbc
9 σco
Check for Minimum steel area mm2
Conc.Area Required for directstress(1)/(9)
0.8% of area required0.3% of Ag
Governing steel mm2
Provided Steel area mm2
Check for safety of section
σco,cal + σcbc,cal
σco σcbc < 1 < 1 < 1
Check for Cracked /Uncracked section
σco,cal - σcbc,cal
Permissible Basic tensile stress in concreteSection to be designed as
-0.67 -0.67 -0.67Cracked Cracked Uncracked
0.370576 0.4037 0.1833427
-1.098123 -1.5199 0.8154463
14 32669.422 32669 32669.42213 23982.032 23982 23982.032
12 23982.032 23982 23982.03211 10526.97 10410 9643.0381
101315871.2 1301288.3 1205379.8
11.666667 11.667 11.6666678.75 8.75 8.75
0.38160 0.39221 0.000002.48038 2.88683 0.45074
1151.39 1138.63 1054.71
385.39 458.08 82.77
264.15 271.50 0.00
1.38226 1.36694 1.266190.450742.09877 2.49462

Consulting Engineers Group Ltd., Jaipur_______________________________________________________________________________
Bridge Design Report________________________________________________________________
DESIGN OF PIER CAP
DESIGN OF PIER CAP (along Transverse Direction)1
1 3 5 7
2 4 6 8
1
Depth of Pier Cap in Transverse Direction = mmconsidering two layers of 32 φ + in longitudinal 32 φ in transverse
directiona = distance of cg of bearing from face of equivalent square = mmCover = mmdeff d = mm
a = > 1d DESIGNED AS A CANTILEVER BEAM
angle
Distance of bearing 1 from face of pier =Distance of bearing 2 from face of pier =Distance of bearing 3 from face of pier =Distance of bearing 4 from face of pier =
Loads on bearings:Reaction Ecc 1,2 3,4 5,6 7,8
1 Dead Load 02 SIDL3 LL max Long
LL reaction with impact factor = tLength of Cantilever at one end = mLength of Cantilever at other end = mSelf wt of Cantilever = tTorsion due to LL Reaction = t-mHorizantal force due to LL = tCorresponding moment due horizantal force = t-mTotal Torsional Moment = t-m
Equivalent bending moment T*(1+D/b)/1.7 = t-m
1.5
1.312
0.967
58.651
49.137
49.302 49.302
1.535
50% 49.92
8.0067443.736
1.058901
49.302
54.91412
49.302
0.35
10.00
0.55
0.55
1.1702211312
40.000
1400
1535
2.335
3.3
2.8 2.8
2.2
2.33519.4206
0.8
5.3292.6652.335
2.8
1.535
2.335
0.7
1.40
0.716.686
1.53500
171.0 171.0 171.0197.2086
83.92 2.91 47.145 29.702 12.258 -5.185
683.8704 171.0

Consulting Engineers Group Ltd., Jaipur_______________________________________________________________________________
Bridge Design Report________________________________________________________________
Equivalent Shear 1.6*T/b = t
Moment at face of pier due to DL = t-mMoment at face of pier due to LL = t-mMoment at face of pier due to Cantilever load = t-m
Total bending moment = t-m
M = 35 N/mm2
Fe = 415 N/mm2
σcbc = N/mm2
σst = N/mm2
m = 10k =j =
Q = N/mm2
Depth required M/Q*b = mOK
Reinforcement required = mm2
Provide two layers of 32 φ 14 nos + 32 φ 14 nos in longitudinal direction
= mm2
Shear forceself wt at effective depth d = tTotal Shear force = t
Shear stress τv = (V-M*Tan(β)/d)/bd = t/m2
% of reinforcement provided = %τc = t/m2
Shear Force carried by Concrete τc*b*d = t
Net design S.F = t
using 14 Legged stirrups at a spacing of mm
Area of steel required /m run = mm2/m
Providing 12 φ 14 legged @ mmArea of steel provided /m run =
14 14 28 nos 32 φ two layers
14 Legged 12 φ@ 200 mm
CHECK FOR TORSION (one span dislodged condition)
Dead load reaction on bearing = tSidl reaction on bearing = tHorizantal force due to dead load & sidl reaction = tTorsion Tu = t-m
X = m
200
7634.766
2007916.813
204.34
0.706
31.16
303.80
11.66667
85.4824.65
99.46
200
0.370.88
1.89
48.18
26.62503
484.127
76.6466220.157
338.1867
5.51
0.873
21032.97
22518.94
6.98
163.551.4

Consulting Engineers Group Ltd., Jaipur_______________________________________________________________________________
Bridge Design Report________________________________________________________________
Y = mx = inchesy = inchesεX2*Y =f'c = kg/cm2
= psiφ*(0.5*(f'c)
0.5*εX2*Y) = lb inch= t-m
< t-mAt/s = Tu/(αt*x*y*fy)
αt = 0.66 + 0.33 *y/x =
At/s = = inch2/inch
= cm2/mDESIGN OF PIER CAP (along Longitudinal Direction)
Depth of pier cap = mmconsidering two layers of 32 φ + in longitudinal 32 φ in transverse
directiona = distance of cg of brg.from face of pier = mmbeff tacking pedestal size for dispersion as 1mx1m = mmdeff = mm
a =d < 1.00
DESIGNED AS A CORBELHence the pier cap has been designed as a bracket.The design has been done as per "Design proposal for reinforced concrete corbels" by A.H.Mattock.
Dead load reaction coming on corbel = tSidl reaction coming on corbel = tLive load reaction = t
a
self wt of corbel = tDL+SIDL+LL + self wt on corbel = tUltimate force Vu 1.4*470.78+1.7*88.86 = t
( as per load factores given by ACI-4)DL+SIDL+LL + self wt on corbel per bearing = tUltimate force per bearing Vu = tFor Pot-Ptfe bearings µ' =Design value of Nuc = t
559.64810.1583
0.0510.13
139.91202.5396
2.2
0.55
30.24
0.7
0.7
0.900
1.5
1.1
341.9498.6088.86
1420
0.35
13120.266768
0.02335
5.93
1400
350
121.875163.55
1.437857
3984.4
10588617.424
3.3
394701.6
280
55.118129.921

Consulting Engineers Group Ltd., Jaipur_______________________________________________________________________________
Bridge Design Report________________________________________________________________
Check for Nominal Shearstrengthφ =µ =
V = Vu/φ*b*d = t/m2
< 0.2 F'c = t/m2
F'c = 0.8 f'c O.KCalculation for Shear Friction Reinforcement
Avf = Vu/φ*µ*fy = cm2
clause 11.9.3.3Calculation of flexural reinforcement
Mu = Vu*a+Nuc*(D-deff) = t-m
Af = Mu/φ*fy*(deff-x/2) = cm2
Where x = depth of rectangular stress blockassume x = cm
Depth of Rectangular Block
x = Af*fy/φ*f'c*beff = cm
Calculation for Horizantal Tensile Steel
At = Nuc/(φ*fy) or = cm2
= 2/3*Avf = cm2
= Af = cm2
whichever is maximum = cm2
Minimum reinforcement as per clause 11.9.5 of ACI-4
= 0.04*f'c*beff*deff/fy = cm2
Calculation for Torsional Steel In flexural steel, reinforcement due to torsion is to be added also and to compared with minimum steel requirement. Torsion due to horizantal force as a result of the live load reaction coming on the bearing.
Horizantal force = tBending moment = t-mUltimate torsion = t-m
X = mY = mx = inchesy = inchesεX2*Y =f'c = kg/cm2
= psiφ*(0.5*(f'c)
0.5*εX2*Y) = lb inch= t-m
> t-m(Thus reinforcement is provided to cater tothe effect of full torsion,neglecting the effect of concrete)
At/s = Tu/(αt*x*y*fy)
3984.4
4209777.59448.45454
4.67
55.11851.654
156923.8
280
15.53
0.85
127.90
571.2
41.012
1.4
1.312
27.34
50.280
2.4962.7457064.6677
1.4
2.870866
27.34158
71.78
1.876458
15.53
1.90725

Consulting Engineers Group Ltd., Jaipur_______________________________________________________________________________
Bridge Design Report________________________________________________________________
αt = 0.66 + 0.33 *y/x =
At/s = = inch2/inch
= cm2/m
Longitudinal reinforcement as per ACI:
As = 2*At*(X1+Y1)/s = cm2
Total Steel = + = cm2 per Therefore this is more than minimum steel.
Hence As design = cm2
Provide nos φArea of steel provided = cm2
Horizantal Stirrups = 0.5*As = cm2
Provide nos 2 Legged 16 φ in 3 Layers
Area of steel provided = cm2
60 nos32 φ
214.1441
20241.2743
60 32
1.42
482.5486
33.883
27.342 33.88 61.225
0.969257
0.025812
6.56
431.159

Consulting Engineers Group Ltd., Jaipur Bridge Design Report ________________________________________________________________________________
PIER SHAFT .case 1 Depth of Section = 1.500 m Width of Section = 5.329 m along width-compression face- no of bar: 30 tension face- no of bar: 30 Dia (mm) 25 25 Cover (cm) 7.50 7.5 along depth-compression face- no of bar: 8 tension face- no of bar: 8 Dia (mm) 16 16 Cover (cm) 7.50 7.5 Modular Ratio : Compression = 10.0 Modular Ratio : Tension = 10.0 Allowable Concrete Stress = 102.00 Kg/cm^2 Allowable Steel Stress = 2040.00 Kg/cm^2 Axial Load = 1225.35 T Mxx = 335.620 Tm Myy = 236.870 Tm Intercept of Neutral axis : X axis : = 27.149 m : y axis : = 1.616 m Concrete Stress Governs Design Stress in Concrete due to Loads = 33.74 Kg/cm^2 Stress in Steel due to Loads = 25.47 Kg/cm^2 Percentage of Steel = .41 % PIER SHAFT .case 2 Depth of Section = 1.500 m Width of Section = 5.329 m Modular Ratio : Compression = 10.0 Modular Ratio : Tension = 10.0 Allowable Concrete Stress = 102.00 Kg/cm^2 Allowable Steel Stress = 2040.00 Kg/cm^2 Axial Load = 1212.590 T Mxx = 408.310 Tm Myy = 244.210 Tm Intercept of Neutral axis : X axis : = 26.643 m : y axis : = 1.428 m ` Concrete Stress Governs Design Stress in Concrete due to Loads = 37.94 Kg/cm^2 Stress in Steel due to Loads = 74.00 Kg/cm^2 Percentage of Steel = .41 %

Consulting Engineers Group Ltd., Jaipur Bridge Design Report ________________________________________________________________________________ PIER SHAFT .case 1 Depth of Section = 1.500 m Width of Section = 5.329 m along width-compression face- no of bar: 30 tension face- no of bar: 30 Dia (mm) 25 25 Cover (cm) 7.50 7.5 along depth-compression face- no of bar: 8 tension face- no of bar: 8 Dia (mm) 16 16 Cover (cm) 7.50 7.5 Modular Ratio : Compression = 10.0 Modular Ratio : Tension = 10.0 Allowable Concrete Stress = 102.00 Kg/cm^2 Allowable Steel Stress = 2040.00 Kg/cm^2 Axial Load = 1172.850 T Mxx = 437.130 Tm Myy = 270.330 Tm Intercept of Neutral axis : X axis : = 23.847 m : y axis : = 1.346 m Concrete Stress Governs Design Stress in Concrete due to Loads = 35.66 Kg/cm^2 Stress in Steel due to Loads = 67.03 Kg/cm^2 Percentage of Steel = .41 % PIER SHAFT .case 2 23-11-06 Depth of Section = 1.500 m Width of Section = 5.329 m Modular Ratio : Compression = 10.0 Modular Ratio : Tension = 10.0 Allowable Concrete Stress = 102.00 Kg/cm^2 Allowable Steel Stress = 2040.00 Kg/cm^2 Axial Load = 1160.090 T Mxx = 509.820 Tm Myy = 277.670 Tm Intercept of Neutral axis : X axis : = 23.171 m : y axis : = 1.160 Concrete Stress Governs Design Stress in Concrete due to Loads = 46.53 Kg/cm^2 Stress in Steel due to Loads = 211.80 Kg/cm^2 Percentage of Steel = .41 %

Consulting Engineers Group Ltd., Jaipur Bridge Design Report ______________________________________________________________________________
INPUT FILE: 70RW.STD 1. STAAD SPACE 2. INPUT WIDTH 72 3. UNIT METER MTON 4. PAGE LENGTH 1000 5. JOINT COORDINATES 6. 1 0.000 .000 .000 7. 2 0.4 .000 .000 8. 3 30.4 .000 .000 9. 4 30.8 .000 .000 10. 5 30.84 0.0 0.0 11. 6 31.24 .000 .000 12. 7 61.24 0.0 0.0 13. 8 61.64 0 0 14. MEMBER INCIDENCES 15. 1 1 2 16. 2 2 3 17. 3 3 4 18. 4 4 5 19. 5 5 6 20. 6 6 7 21. 7 7 8 22. MEMBER PROPERTY CANADIAN 23. 1 TO 7 PRI YD 2. ZD 1. 24. MEMBER RELEASE 25. 4 END FY MZ 26. 5 START FY MZ 27. CONSTANT 28. E CONCRETE ALL 29. DENSITY CONCRETE ALL 30. POISSON CONCRETE ALL 31. SUPPORT 32. 2 3 6 7 PINNED 33. DEFINE MOVING LOAD 34. *TYPE 1 LOAD 4*17.0 2*12.0 8.0 DIS 1.37 3.05 1.37 2.13 1.52 3.96 35. TYPE 1 LOAD 8 2*12 4*17 DIS 3.96 1.52 2.13 1.37 3.05 1.37 36. LOAD GENERATION 264 37. TYPE 1 -100.2 0. 0. XINC .5 38. TYPE 1 -56.8 0. 0. XINC .5 39. TYPE 1 -13.4 0. 0. XINC .5 40. PERFORM ANALYSIS 41. ***MAX REA 42. LOAD LIST 159 43. PRINT SUPPORT REACTION SUPPORT REACTION SUPPORT REACTIONS -UNIT MTON METE STRUCTURE TYPE = SPACE ----------------- JOINT LOAD FORCE-X FORCE-Y FORCE-Z MOM-X MOM-Y MOM Z 2 159 0.00 5.30 0.00 0.00 0.00 0.00 3 159 0.00 43.70 0.00 0.00 0.00 0.00 6 159 0.00 46.87 0.00 0.00 0.00 0.00 7 159 0.00 4.13 0.00 0.00 0.00 0.00 44. LOAD LIST 236 45. PRINT SUPPORT REACTION SUPPORT REACTIONS -UNIT MTON METE STRUCTURE TYPE = SPACE
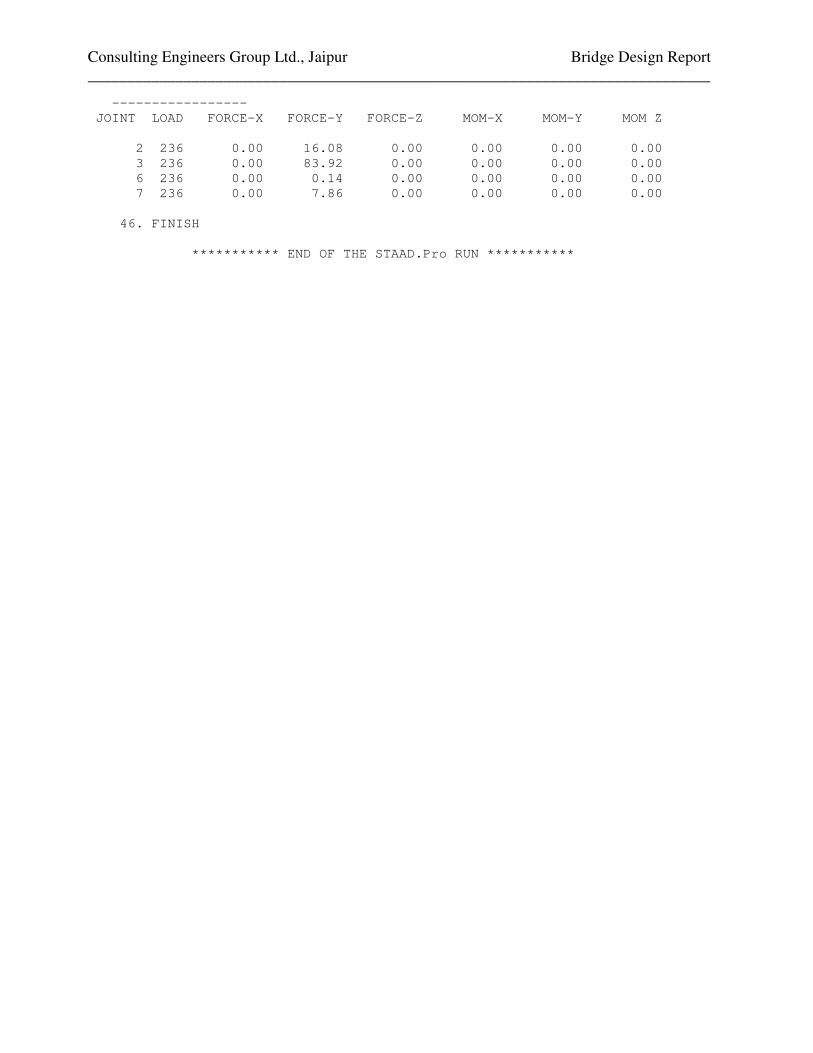
Consulting Engineers Group Ltd., Jaipur Bridge Design Report ______________________________________________________________________________
----------------- JOINT LOAD FORCE-X FORCE-Y FORCE-Z MOM-X MOM-Y MOM Z 2 236 0.00 16.08 0.00 0.00 0.00 0.00 3 236 0.00 83.92 0.00 0.00 0.00 0.00 6 236 0.00 0.14 0.00 0.00 0.00 0.00 7 236 0.00 7.86 0.00 0.00 0.00 0.00 46. FINISH *********** END OF THE STAAD.Pro RUN ***********

CEG.Ltd., Jaipur Bridge Design Report
Consultancy Services for Feasibility Study and Detailed Project Preparation for Proposed Orissa State Road Project
DESIGN OF SUBSTRUCTURE (ABUTMENT)

Consulting Engineers Group Ltd., Jaipur_______________________________________________________________________________
Bridge Design Report____________________________________________________________________________
DESIGN DATA
Formation Level = 218.139 mGround Level = 210.144 mLowest Water Level = 210.144 mHighest Flood Level = 214.172 mBottom of pile cap Level = 207.144 mThickness of bearing & pedestal = 0.300 mLength of Span expansion joint to expansion joint = 32.200 mClear Span = 30.000 mBouyancy factor = 1Submerged density of earth = 1.0 t/cumSaturated density of earth = 2.000 t/cumUnit wt of concrete = 2.400 t/m3
Depth of Superstructure = 2.350 mTkickness of wearing coat = 0.056 mPILE DATANumber of piles = 12Diameter of pile = 1.20 mSpacing of pile in longitudinal direction = 3.60 mNo. of spacing in longi. dir. = 3Specing of pile in trans. dir. = 3.60 mNo. of specing in trans. dir. = 2SEC MODULUS FOR LONG. MOMENTS, ZL outer = 36.00 m3
SEC MODULUS FOR LONG. MOMENTS, ZL inner = 108.00 m3
SEC MODULUS FOR TRANS. MOMENTS, ZT outer = 28.80 m3
SEC MODULUS FOR TRANS. MOMENTS, ZT inner = 0.00 m3
LENGTH OF PILE CAP IN LONG. DIRECTION = 12.30 m
LENGTH OF PILE CAP IN TRANS. DIRECTION = 8.70 mLive Load -
Two Lane of class AGrade of Concrete - M 35Grade of Reinforcement - Fe 415 (HYSD)Permissible Compressive stress in Concrete - 1190 t/m2
Permissible Tensile stress in Steel - 20400 t/m2
Modular ratio, m - 10factor, k - 0.368Lever arm factor, j - 0.877Moment of Resistance - 192 t/m2
One Lane of 70R

Consulting Engineers Group Ltd., Jaipur_______________________________________________________________________________
Bridge Design Report____________________________________________________________________________
3.984 0.3 1.450.3 218.139
0.5 0.300 Formation Lvl
0.250 0.7 0.75 2.4060.250
slop V1:H 1.5 0.3 0.32.66
1.000
214.983 214.433
0.5 3.600
214.233210.833
1.75
5.289
G.L
209.1441.25 1.25 Eccentricity
0.00 0.002.00 3.900 4.25 4.150 2.00
2.00 2 207.144Founding
5.150 1.750 5.400 Lvl
A 12.30 B
0.75 3.60 3.60 3.60 0.75
2.40 0.15
1a
2
3
4
5
67
8
9
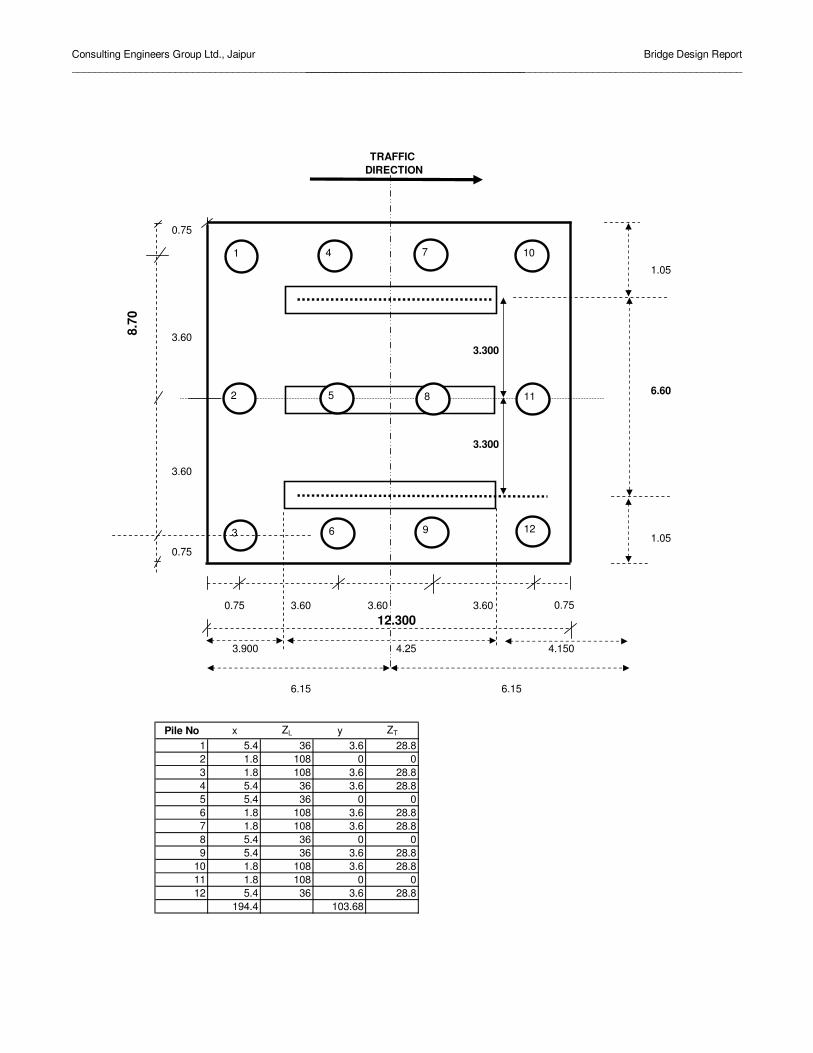
Consulting Engineers Group Ltd., Jaipur_______________________________________________________________________________
Bridge Design Report____________________________________________________________________________
TRAFFIC DIRECTION
0.75
1.05
3.603.300
6.60
3.300
3.60
1.050.75
0.75 3.60 3.60 3.60 0.7512.300
3.900 4.25 4.150
6.15 6.15
Pile No x ZL y ZT
1 5.4 36 3.6 28.82 1.8 108 0 03 1.8 108 3.6 28.84 5.4 36 3.6 28.85 5.4 36 0 06 1.8 108 3.6 28.87 1.8 108 3.6 28.88 5.4 36 0 09 5.4 36 3.6 28.8
10 1.8 108 3.6 28.811 1.8 108 0 012 5.4 36 3.6 28.8
194.4 103.68
8.70
3 6 9
1 4 7
2 5 8
12
10
11
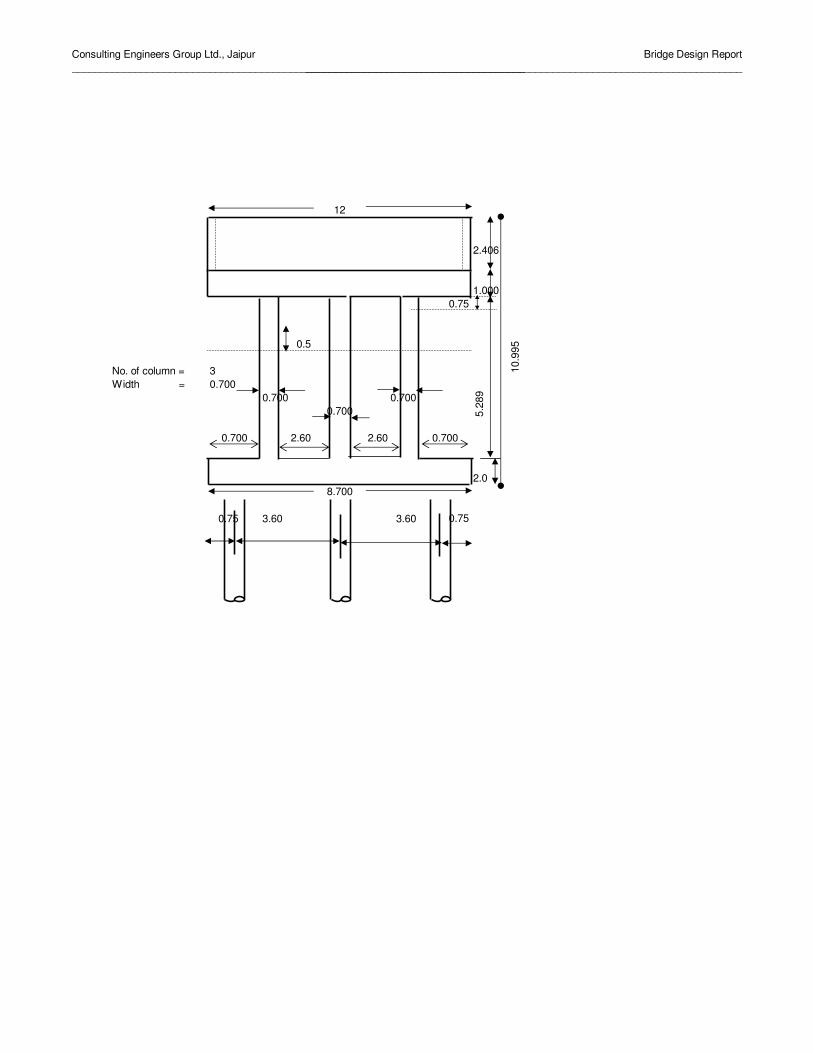
Consulting Engineers Group Ltd., Jaipur_______________________________________________________________________________
Bridge Design Report____________________________________________________________________________
12
2.406
1.0000.75
0.5
No. of column = 3Width = 0.700
0.700 0.7000.700
0.700 2.60 2.60 0.700
2.08.700
0.75 3.60 3.60 0.75
5.28
9
10.9
95

Consulting Engineers Group Ltd., Jaipur_______________________________________________________________________________
Bridge Design Report_____________________________________________________________________________________
Depth of SuperStructure =Number of Longitudinal Girders =Mid section1 slab = 12*0.25 = m2
2 Top Flange = 4*[(0.15*1.25)+(0.5*(1.25+0.275))*0.16 = m2
3 Web = 4*[(2.1-(0.15+0.16)-(0.2+0.24))*0.275] = m2
4 Bottom Bulb = 4*[(1*0.2)+(0.5*(1+0.275))*0.24 = m2
Total = m2
3
2.354
4.135
1.238
1.485
1.412
1.8
2.10.625
2.8
0.5
0.250
1.8
1.525 0.225
2.8 2.81.000
12.007.50
0.25
0.275
0.20.24
0.150.16
1.25

Consulting Engineers Group Ltd., Jaipur_______________________________________________________________________________
Bridge Design Report_____________________________________________________________________________________
End Section
Depth of SuperStructure =Number of Longitudinal Girders =End section1 slab = 12*0.25 = m2
2 Top Flange = 4*[(0.15*1.25)+(0.5*(1.25+0.6))*0.107 = m2
3 Web = 4*[(2.1-(0.15+0.107)-(0.2+0.132))*0.6] = m2
4 Bottom Bulb = 4*[(1*0.2)+(0.5*(1+0.6))*0.132 = m2
Total = m2
DL per running meter at Intermediate section = t/mDL per running meter at End section = t/m
0.2
2.8 1.8
2.1
1.0002.8
0.107
3.6264
2.354
1.1459
1.2224
1.25 0.15
1.53
0.5
10.338
12.00
0.13
11.00
5.99
1.525
2.8
0.225
0.25
14.987
3
0.250
1.8
0.6

Consulting Engineers Group Ltd., Jaipur_______________________________________________________________________________
Bridge Design Report_____________________________________________________________________________________
Intermediate Cross GirderThickness of Cross Girder =Number of intermediate cross girders =
Cross sectional area in elevation = m2
Dl of intermediate cross girder = tEnd Cross GirderThickness of end Cross Girder =Number of intermediate cross girders =
Cross sectional area in elevation = m2
Dl of intermediate cross girder = tS.I.D.LI Wearing Coat @ t/m = t/mII Crash barrier @ t/m
(provide one side enter 1,bothsides enter 2 , otherwise enter 0) = t/mIII R.C.C Post & Railing @ t/m
(provide one side enter 1,bothsides enter 2 , otherwise enter 0) = t/m
1
2footpath precast slab
3
4φ mm
50 200 50 200
1050
150
150
200
500
250
500 1525 225
250
18.02840.562
1001525
100
3
12.25927.582
1.0725
2
0.3
0 0
2 2.00
0.45
1.07251.00
0.085
5

Consulting Engineers Group Ltd., Jaipur_______________________________________________________________________________
Bridge Design Report_____________________________________________________________________________________
Wt due to CrashbarrierComponent Area Wt
12345
t/m say,Footpath precast slab
t/mmissllaneous utilities t/mFootpath kerb t/msandfilling t/mIV Foot path precast slab@ t/m
(provide one side enter 1,bothsides enter 2 , otherwise enter 0) = t/mV Footpath Kerb @ t/m
(provide one side enter 1,bothsides enter 2 , otherwise enter 0) = t/mVI Missillaneous utilities @ t/m
(provide one side enter 1,bothsides enter 2 , otherwise enter 0) = t/mVII Sandfilling in footpath @ t/m
(provide one side enter 1,bothsides enter 2 , otherwise enter 0) = t/mTotal = t/mTotal S.I.D.L Reaction = t
t t tt/m t/m
t/m
m
RA m RB
Due to girders:Reaction RA = (10.3375*0.5*25.4)+(14.99*2.5)+(0.5*12.66*2.9)+20.28+13.79)
= tDue to SLAB = tDue to SIDL = tTotal DL + SIDL = t
0.2052
0.2
0.1525 0.38130.2
0.0563 0.1406
0.1541
0.7387
1.000
0.3693
0.96
0.180.180.075
0.240.0875 0.210.100
0.002
0.075
120.75
853.0884.604
0.38125
10.338
2 0.76250.140625
2 0.2813
2 0.40.3693
2
14.987 12.66212520.281
0.430.8
221.19
2.5 2.9 30
20.28127.582
5.25169.21

Consulting Engineers Group Ltd., Jaipur_______________________________________________________________________________
Bridge Design Report____________________________________________________________________________
RA RB
Longitudinal Force :
As per clause 214.2 of IRC:6, horizontal braking force Fh, for each span is:For Class A Single lane : Fh = x = t
For class 70R wheeled : Fh = x = t
For class A 2 lane Fh = x = tSummary of Longitudinal Forces :
Fixed Bearing Free Bearing1 Fh - µ µ
2 Fh + µ µ2
1 = - x x= t = t
2 + x x
t = t32.8642.0
523.790.05
0.000
26.189
0.05 523.7926.189
20.0 0.05 457.29
Span dislodged 0.00 0.000
Rg+Rq
Rg+Rq
20.0 0.05 457.29
70R Wheeled 32.86
0.4
Load Case Longitudinal horizontal force (t)
Longitudinal Moment (t-m)
11.0855.40.2
55.4
-2.8645
Rg+Rq
Rg+Rq
0.2 100
0.2 11.080
300.4
20.000
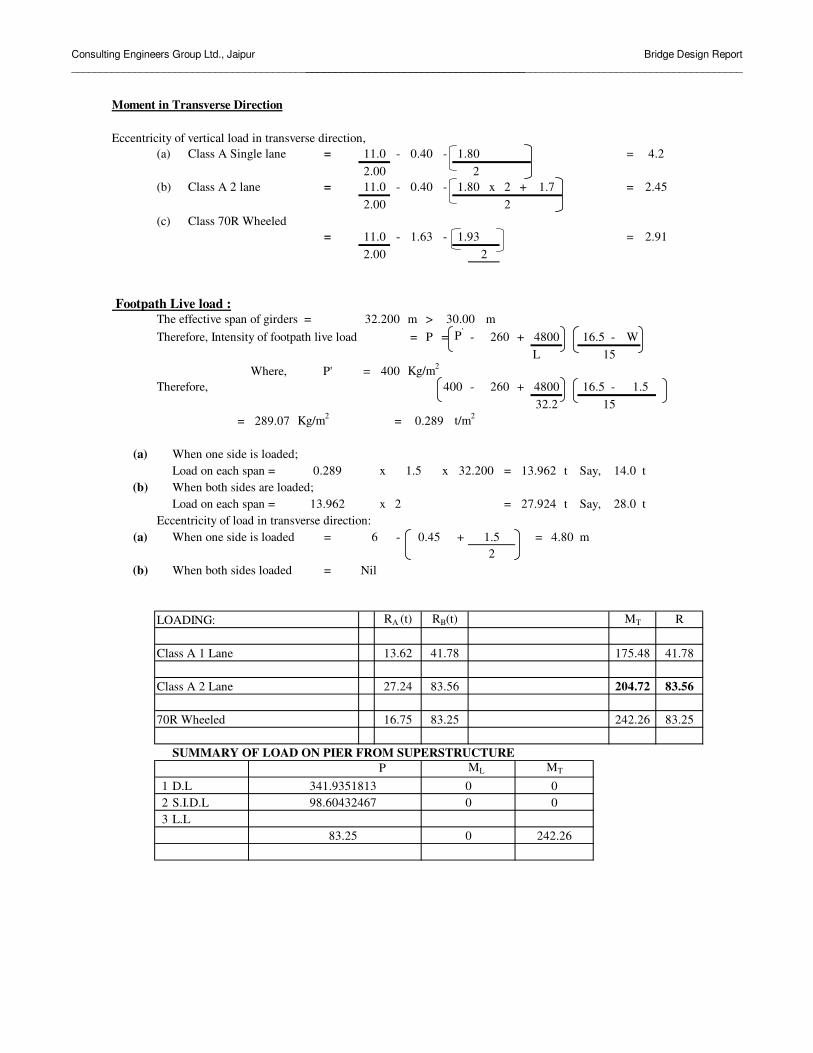
Consulting Engineers Group Ltd., Jaipur_______________________________________________________________________________
Bridge Design Report____________________________________________________________________________
Moment in Transverse Direction
Eccentricity of vertical load in transverse direction,(a) Class A Single lane = - - =
2(b) Class A 2 lane = - - x 2 + =
2(c) Class 70R Wheeled
= - - =
Footpath Live load :The effective span of girders = m > mTherefore, Intensity of footpath live load = P = P' - + - W
LWhere, P' = Kg/m2
Therefore, - + -
= Kg/m2 = t/m2
When one side is loaded;Load on each span = x x = t Say, tWhen both sides are loaded;Load on each span = x 2 = t Say, t
Eccentricity of load in transverse direction:When one side is loaded = - + = m
When both sides loaded = Nil
LOADING:
Class A 1 Lane
Class A 2 Lane
70R Wheeled
SUMMARY OF LOAD ON PIER FROM SUPERSTRUCTUREP ML MT
1 D.L2 S.I.D.L3 L.L
4.2
24.80
0.289
27.924
R
28.0
2.45
32.2260
(b)
151.5
4800 16.515
4800 16.5
2.91
(a)32.200 13.962
(a) 6 0.45
13.962(b)
0.289 1.5
289.07
1.802.00
2
0.40
1.93
11.0
2.00
400
11.0
26032.200 30.00
1.5
14.0
1.63
400
2.001.711.0 0.40 1.80
13.62 41.78
27.24
175.48 41.78
83.56
83.25
204.72
242.2616.75
98.60432467
83.25
83.56
341.9351813 0
MTRB(t)RA (t)
83.25
0
0
00
242.26

Consulting Engineers Group Ltd., Jaipur_______________________________________________________________________________
Bridge Design Report____________________________________________________________________________
COEFFICIENT OF ACTIVE EARTH PRESSUREAS PER COULOMB'S THEORY, COEFFICIENT OF ACTIVE EARTH PRESSURE IS
Ka = SIN2 (α+φ)SIN2�� SIN(���� 2
1 +
WHEREφ = ANGLE OF INTERNAL FRICTION OF EARTHα = ANGLE OF INCLINATION OF BACK OF WALLδ = ANGLE OF INTERNAL FRICTION BETWEEN WALL & EARTHι = ANGLE OF INCLINATION OF BACKFILL
HERE φ = 30 o = 0.524 Radianα = 90 o = 1.571 Radianδ = 20 o = 0.349 Radianι = 0 o = 0 Radian
Ka = 0.2973
Therefore, Horizontal coefficient of Active earth pressure = KaCOSφ = φ = φ = φ = Kha = 0.2794
CALCULATION OF ACTIVE EARTH PRESSURE
12
3 12.18
8.995 3a 2 5.089 2.1 8.995
45.03
SurchargeActive Earth Pressure Actual Width
8.70
L.W.L. Condition
a) Service Condition
1 1.0 3.906 0.67 12.000 12.000 31.429 9.042 284.182 1.0 5.089 0.67 2.100 2.100 7.166 4.545 32.563 0.5 3.906 2.18 12.000 12.000 51.150 8.730 446.52
3a 1.0 5.089 2.84 2.100 4.200 60.778 4.545 276.204 0.5 5.089 2.84 2.100 4.200 30.389 4.137 125.73
180.91 1165.19
Design Force 180.91 tDesign Moment 1165.19 tm
b) Span Dislodge ConditionNet force = 180.91 - 38.59 = 142.32 tNet moment = 1165.19 - 316.74 = 848.45 tm
* As per clause 710.4.3 of IRC : 78,
2.84
ComponentArea factor
Element No.
TOTAL
LL Surcharge (height=1.2)
SIN(� + �).SIN(� - �)SIN(� - �).SIN(� + �)
3.906
Moment (tm)
2
Actual WidthHeight (m)
Effective Width*
L.A. from bottom of pile cap
Force (t)Pressure
(t/m2)
Dry Earth

Consulting Engineers Group Ltd., Jaipur_______________________________________________________________________________
Bridge Design Report____________________________________________________________________________
H.F.L. condition12
Water Level 3.967 3.906
4a 0.061 2.18.995 8.995
5.028 5.0896b 6a
2.22
0.559 8.70Active Earth Pressure
a) Service Condition
1+2 Surcharge 38.594 316.744 0.5 3.906 2.183 12.000 7.800 33.248 8.730 290.235
6a 1.0 5.028 2.183 2.100 4.200 46.090 4.514 208.0516b 0.5 5.028 1.405 2.10 4.200 14.832 4.112 60.987
150.95 1039.86
Design Force 150.95 tDesign Moment 1039.86 tm
b) Span Dislodge Condition
Net force = 150.95 - 38.59 = 112.35 tNet moment= 1039.86 - 316.74 = 723.12 tm
Weight of Abutment
L.W.L. Condition
Length Width Height Density Weight(m) (m) (m) (t/m3) (t)
1a Pile cap 1.0 12.300 8.70 2.000 2.40 513.65 6.150 3158.942 0.5 1.250 2.10 5.289 2.40 16.66 7.567 126.063 1.0 1.750 2.10 5.289 2.40 46.65 6.275 292.724 0.5 1.250 2.10 5.289 2.40 16.66 4.983 83.025 Cap 1.0 1.750 12.00 1.000 2.40 50.40 6.275 316.266 Dirt Wall 1.0 0.300 12.00 2.406 2.40 20.79 7.000 145.517 1.0 3.984 0.90 0.500 2.40 4.30 9.142 39.348 0.5 3.984 0.90 2.656 2.40 11.43 8.478 96.89
680.54 4258.7
TOTAL
TOTAL
Element No.
Counterfort
Return Wall
Area factor Height (m)
3.906
Moment about B
Moment (tm)Force (t)
L.A.from pile cap B
L.A. from bottom of pile cap
3.587
Submg Earth
Same as in dry case
Pressure (t/m2)
Actual Width
Effective Width
Component Area Factor
Element no.
Component
Dry Earth4a 0.5 3.967 2.183 163.8482.100 4.200 18.182 9.012
4

Consulting Engineers Group Ltd., Jaipur_______________________________________________________________________________
Bridge Design Report____________________________________________________________________________
Weight of Earth and LL surcharge
L.W.L. Condition
Length Width Height Density Weight(m) (m) (m) (t/m3) (t)
1 7.15 8.7 5.289 2.000 658.0045 3.575 2352.3669 -0.5 5.400 8.70 3.600 2.0 -169.13 1.800 -304.434 -0.5 5.400 2.10 5.289 2.0 -59.98 3.600 -215.923 -1.0 1.750 2.10 5.289 2.0 -38.87 6.275 -243.94
1.0 5.150 8.70 8.995 2.0 806.04 9.725 7838.762 -0.5 1.250 2.10 5.289 2.0 -13.88 7.567 -105.057 -1.0 3.984 0.90 0.500 2.0 -3.59 9.142 -32.788 -0.5 3.984 0.90 2.656 2.0 -9.52 8.478 -80.74
1169.07 9208.3
LLSURCHARGE
Length Width Height Density Weight
DRY EARTH 1.00 5.150 8.70 1.20 2.00 107.53 9.725 1045.75
BOUYANCY FACTOR = 1
BOUYANT FORCE (H.F.L. Case) 12.30 X 8.70 X 7.028 = 752.0663
MOMENT DUE TO BOUYANT FORCE @, TOE = 4625.208
SUMMARY OF FORCES AND MOMENTS:
CLASS-70R 83.25 83.25Foot Path L.L. 0.00 0.00D.L. of superstructure 341.94 341.94S.I.D.L. 83.25 83.25Total Vertical Load from supr str (a) 508.44 0.00 508.44 0.00L.L. Surcharge 107.53 107.53
1957.14 1849.61 1205.08 1097.542465.58 1849.61 1713.51 1097.54
Horizontal force at bearing 32.86 0.00 32.86 0.00Horiz force due to active Earth Pressure 180.91 142.32 150.95 112.35
213.78 142.32 183.81 112.35Moment, due to Horiz. force at bearing 292.13 0.00 292.13 0.00`eccen' due to C.G.of pile & C of bearing 0.000 0.000 0.000 0.000
0.00 0.00 0.00 0.00`eccen' due to C.G.of pile & CG of (b) 1.265 1.131 2.055 1.906
2476.33 2091.91 2476.33 2091.91Moment due to active earth pressure 1165.19 848.45 1039.86 723.12Net Longitudinal moment -1019.006 -1243.454 -1144.3 -1368.783Transverse moment 242.258 0.000 242.3 0.000
Span dislodged
Case. H.F.L.Case. L.W.L.
Total Vertical Load V = (a) + (b)
Total Horizontal Force H =
ML @ C.G. of pile group due to (a)
ML @ C.G. of pile group due to (b)
Service Cond.
Span dislodged
TOTAL
Front Earth below cap
VOLUME DEDUCTED
Component
Backfill Earth
VOLUME DEDUCTED
L.A.from pile cap B
L.A.from pile cap B
Moment about B
Moment about B
Vertical load from substructure (b)
LOAD CASE
Area Factor
Component Area Factor
ElementNo
Service Cond.
Element No
L

Consulting Engineers Group Ltd., Jaipur_______________________________________________________________________________
Bridge Design Report____________________________________________________________________________
Seismic Calculation
Seismic forces in longitudinal & transverse direction shall be generated only on superstructureand do not govern for Zone II & III,the design hence ignored.
CALCULATION OF LOAD ON PILES
Total no. of Piles (N) 12
P 2465.58 ZL (outer) 36.00 ZL (inner) 108.00ML -1019.006MT 242.258 ZT (outer) 28.80 ZT (inner) 0.00
L.W.L. Case
P/NML/ZL
(outer)ML/ZL
(inner)MT/ZT
(outer) MT/ZT
(inner) P/N
ML/ZL
(outer)ML/ZL
(inner)MT/ZT
(outer) MT/ZT
(inner) 205.46 -28.31 -9.44 8.41 0.00 154.13 -34.54 -11.51 0 0
TRAFFIC DIRECTION
PILE NO. A B C D A B C D
1 225.36 206.49 187.62 168.75 188.67 165.65 142.62 119.59
2 233.77 214.90 196.03 177.16 188.67 165.65 142.62 119.59
3 242.18 223.31 204.44 185.57 188.67 165.65 142.62 119.59
H.F.L. Case
P/NML/ZL
(outer)ML/ZL
(inner)MT/ZT
(outer) MT/ZT
(inner) P/N
ML/ZL
(outer)ML/ZL
(inner)MT/ZT
(outer) MT/ZT
(inner) 142.79 -31.79 -10.60 8.41 0.00 91.46 -38.02 -12.67 0.00 0.00
TRAFFIC DIRECTION
PILE NO. A B C D A B C D
1 166.17 144.98 123.79 102.59 129.48 104.14 78.79 53.44
2 174.58 153.39 132.20 111.01 129.48 104.14 78.79 53.44
3 182.99 161.80 140.61 119.42 129.48 104.14 78.79 53.44
SERVICE CONDITION SPAN DISLODGE CONDITION
SPAN DISLODGE CONDITIONSERVICE CONDITION

Consulting Engineers Group Ltd., Jaipur_______________________________________________________________________________
Bridge Design Report____________________________________________________________________________
DESIGN OF PILE CAP
NORMAL CASE (L.W.L.)
P/NML/ZL
(outer)ML/ZL
(inner)MT/ZT
(outer) MT/ZT
(inner) 205.46 -28.31 -9.44 8.41 0.00
PILE NO. A B C D Total
1 225.36 206.49 187.62 168.75 788.21
2 233.77 214.90 196.03 177.16 821.86
TRAFFIC DIRECTION3 242.18 223.31 204.44 185.57 855.51
Total 701.31 644.70 588.09 531.48
DESIGNING THE SECTION PARALLEL TO THE TRAFFIC DIRECTION
4.153.9
2.00
0.753.60 3.60 0.75
701.311.20 50
900701.31 644.70 588.09 531.48
CALCULATION OF BENDING MOMENT0 m from the face of the coloum
Element Area fact. force/m L.A. MomentSELF WEIGHT OF CONCRETE 1a 1.0 173.304 2.075 359.606SELF WEIGHT OF EARTH 4 1.0 381.9 2.075 792.481SELF WEIGHT OF EARTH 9 -1.0 -229.869 2.767 -635.970SELF WEIGHT OF EARTH 4 1.0 0.000 2.075 0.000Pile no. D1,D2,& D3 PileD1-3 -531.477 3.400 -1807.023Pile no. C1,C2,& C3 PileC1-3 0.000 -0.200 0.000
-206.123 -1290.905
Upward Load of Piles
TOTAL
Downward Loads
SERVICE CONDITION
3.60
Loadings
TRANSVERSE MOMENT
LONGITUDINAL MOMENT
PileD1-3Pile C1-3

Consulting Engineers Group Ltd., Jaipur_______________________________________________________________________________
Bridge Design Report____________________________________________________________________________
Bending Moment at face of stem 1290.905 tmM-35
Effective depth required 0.878 mQ = 192.29 t/m2
Effective depth provided 1.910 m
Area of Reinforcement required 43.4 cm2/m = 37769.02 mm2
Minimum area of steel 24.0 cm2/m
Provide 32 φ 42 nos16 φ 41 nos
Area of steel provided = 42021.94 mm2
= 49.148 cm2/mProvide minimum reinforcement at top face = 10440 mm2
16 φ 54 nos = 10857 mm2
Check for Shear
1.910 m from the face of the coloumElement Area fact. force/m L.A. Moment
SELF WEIGHT OF EARTH 4 1.0 206.1 1.120 230.881SELF WEIGHT OF EARTH blank 9 -1.0 -99.259 1.120 -111.170SELF WEIGHT OF SOIL triang 4 1.0 0.000 1.120 0.000Pile no. D1,D2,D3 Pile1 -531.477 1.490 -791.901Pile no. C1,C2,C3 Pile2 0.000 -2.110 0.000
-331.050 -567.422
Effective depth ( d' ) at distence d 1.910 m
Shear force at critical section 331.05 t
Bending Moment at critical section 567.42 tm
tan β = 0.00
Net shear force S 331.05 t
Hence, Shear stress 19.92 t/m2
% of reinforcement 0.257
Permissible shear stress 23.68 t/m2
Providing 2 legged 12 φφφφ stirrups @, 250 c/c
say 250 c/c
SELF WEIGHT OF CONCRETE 1a 1.0 93.542 1.120 104.767
Hence O.K., No need of shear reinforcement
Loadings
Downward Loads
Upward Load of piles
TOTAL

Consulting Engineers Group Ltd., Jaipur_______________________________________________________________________________
Bridge Design Report____________________________________________________________________________
DESIGN OF PILE CAP ON HEEL SIDE
0.0
701.31 644.70
BENDING MOMENT AND SHEAR FORCE AT FACE OF STEM
Element Area fact. force L.A. momentSELF WEIGHT OF CONCRETE 1a 1.0 162.864 1.950 317.585SELF WEIGHT OF EARTH 2a 1.0 610.401 1.950 1190.281SELF WT OF EARTH tring 0.5 0.000 1.950 0.000Surcharge 81.432 1.950 158.792Pile no. B1,B2,B3 Pile B1-3 0.0 0.000 -0.450 0.000Pile no. A1,A2,A3 Pile A1-3 0.0 -701.312 3.150 -2209.132
153.385 -542.473
Bending Moment at face of stem 542.473 tm
Effective depth required 0.569 mEffective depth provided at face of stem 1.910 m
Area of Reinforcement required 18.24 cm2/m
Hence, Provide 20 φ , @ 125 C/C0 φ , @ 125 C/C
Area of steel provided 25.13 cm2/m % OF STEEL EXTRA 37.77
Check for Shear ( Critical section at face of stem )
Shear force at face of stem 153.39 t
tan β = 0.000Bending moment at face of stem 542.473 tmNet shear force S-M*tanβ /d 153.39 t
Hence, Shear stress at face of stem 9.23 t/m2
Shear force at distence 1.910
% of reinforcement 0.13
Permissible shear stress 20.40 t/m2 Hence O.K.
TOTAL
Downward Loads.
Loadings
Upward Load of piles
PileB1-3PileA1-3

Consulting Engineers Group Ltd., Jaipur_______________________________________________________________________________
Bridge Design Report____________________________________________________________________________
DESIGNING THE SECTION PERPENDICULAR TO THE TRAFFIC DIRECTION
Maximum design momentWidth taken for design purposeDepth required (effective)Depth provided (effective)Area of steel required per meter of slab cm2
Minimum steel required cm2
Maximum shear forceMaximum shear stress% of reinforcementPermissible shear stress
Provide 20 φ , @ 125 C/CArea of steel provided 25.13 cm2
24.06
256.74.2500.5601.910
Hence O.K., No need of shear reinforcement
0.000.126
0.00
20.400
17.668

Consulting Engineers Group Ltd., Jaipur_______________________________________________________________________________
Bridge Design Report____________________________________________________________________________
DESIGN OF COLUMN
Case : L.W.L. service condition.
(c) CHECKING THE INTERMEDIATE SECTION, AT R.L.= 209.14 m
CALCULATION OF EARTH PRESSURE
Horizontal coefficient of Active earth pressure = KaCOSφ = φ = φ = φ = Kha = 0.2794
12 218.139
3 10.00
h4 2 5.089 2.1 8.995
Surcharge 209.144Active Earth Pressure Actual Width
12.30
R.L. of Section = 209.14 m
1 1.00 3.906 0.67 12.00 12.00 31.43 7.04 221.32 1.00 5.089 0.67 2.10 2.10 7.17 6.45 46.23 0.50 3.91 2.18 12.00 7.80 33.25 6.73 223.74 0.50 9.00 5.03 2.10 4.20 94.94 3.78 358.7
Total 166.78 850.0
Horizontal force at bearing due to superstructure = 32.86 6.59 216.5
Total longitudinal force & moment on all counterfort 199.65 1066.5
355.50
355.50
355.50
Longitudinal force on each column 66.55 t
Longitudinal moment on each column 355.50 tm
Actual Width Force (t)
1066
.50
L.A. (m) Moment (tm)
Surcharge
Dry Earth
3.906
2
Element No.
ComponentArea factor
Height (m)Pressure
(t/m2)Effective
Width

Consulting Engineers Group Ltd., Jaipur_______________________________________________________________________________
Bridge Design Report____________________________________________________________________________
TRANSVERSE MOMENTTraffic direction
29.67 tm (Refer STAAD output)
3.56
5.29
1.73
A A 14.44 tm (Refer STAAD output)
Transverse moment at the section = 16.94 tm
CALCULATION OF VERTICAL LOAD
R.L. = 214.73 Vertical Load (refer STAAD output)290.24
4.25 m5.59 m0.70 m
R.L. = 209.14
R.L. = 209.14 Vertical Reaction = 290.24 t
4.25
The design has been done on BIAX1 softwareInput data of forces & moment required to run the BIAX1
Cross-section 4.25 x 0.70 m2
Vertical load = 290.24 tTransverse moment = 16.94 tmLongitudinal moment = 355.50 tm
4.25φ = 12.00no. = 16.00
φ = 25.00 φ = 16.00no. = 18.00 no. = 6.00
0.70
φ = 12.00no. = 16.00
0.297 %Section A-A
5.58
9
1.75
5.59

Consulting Engineers Group Ltd., Jaipur_______________________________________________________________________________
Bridge Design Report____________________________________________________________________________
CHECK FOR SHEAR
Checking the section at R.L. = 209.14 m
Shear Force = 66.55 t
Area of section 4.25 x 0.70 m2
Shear stress 22.37 t/m2
% of tensile reinforcement 0.30 %
Vertical load 290.24 t
Muliplication factor as per IRC: 21 clause no. 304.7.1.3.3. = 1.14
Permissible shear stress 28.39 t/m2
Design shear force ( 22.37 28.39 ) x ( 4.25 0.70 ) = 17.92
Area of reinforcement required for shear 17.92 10000.00 = 2.14 cm2/m20400.00 4.25 0.15
- x t
xx ( - )

Consulting Engineers Group Ltd., Jaipur_______________________________________________________________________________
Bridge Design Report____________________________________________________________________________
DESIGN OF ABUTMENT CAP
Reaction due to (DL+SIDL) = tReaction due to live load = tAssuming impact factor asAdditional load due to impactTotal reaction = + + = tTransverse moment due to live load = t-mTotal no. of bearings = 4c/c distance between bearings = mSection modulus = 2 x 2 + 2 x 2 = 2
Load due to transverse moment in outer bearing = x = t
Load due to transverse moment in inner bearing = x = t
MAX LOAD MIN LOADTotal load on outer bearing = + = t & - = t
4 4Total load on third outer bearing = + = t & - = t
4 4Size of pedestal = x mmWidth of cap = mThickness of cap = mThickness of dirt wall = mDistance between face of dirt wall & c.l. bearing = mDistance between edge of cap & c.l. bearing
= - - = m
m39.2
242.3
4.22.8
25.96
44183
440.5395059 83.2510.0
533.8
0.12
10.0
39.2
1.4242.3 4.2
107
242.3 1.4 8.652
0.8 0.8
39.2
25.96533.8 25.96 159 533.8
8.652
1.751.00
0.300.700
1.75 0.700 0.30 0.750
2.8 1.8
2.65 3.35 3.35
12
1.8 2.8 2.8
1.00
0.5
2.65
125533.8 8.652 142 533.8
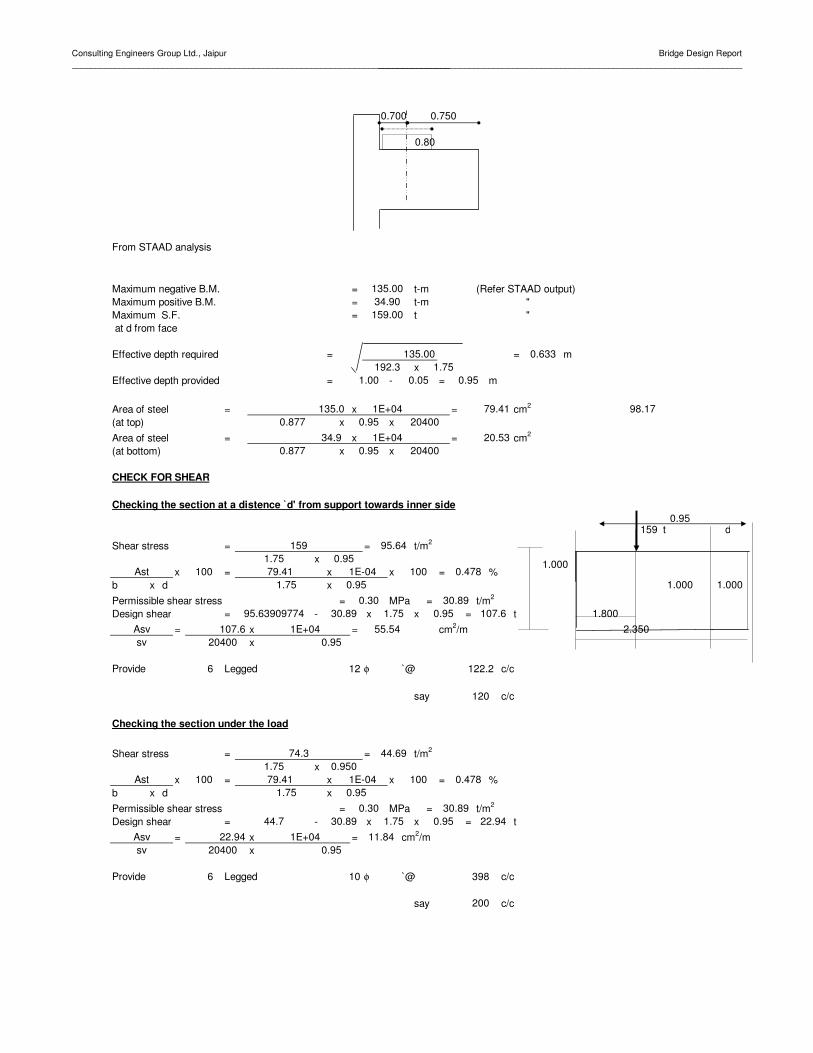
Consulting Engineers Group Ltd., Jaipur_______________________________________________________________________________
Bridge Design Report____________________________________________________________________________
From STAAD analysis
Maximum negative B.M. = t-m (Refer STAAD output)Maximum positive B.M. = t-m "Maximum S.F. = t " at d from face
Effective depth required = = mx
Effective depth provided = - = m
Area of steel = x = cm2
(at top) x xArea of steel = x = cm2
(at bottom) x x
CHECK FOR SHEAR
Checking the section at a distence `d' from support towards inner side
t d
Shear stress = = t/m2
xx = x x = %
b x d xPermissible shear stress = MPa = t/m2
Design shear = - x x = t= x = cm2/m
x
Provide Legged φ `@ c/c
say c/c
Checking the section under the load
Shear stress = = t/m2
xx = x x = %
b x d xPermissible shear stress = MPa = t/m2
Design shear = - x x = t= x = cm2/m
x
Provide Legged φ `@ c/c
say c/c
98.17
0.700
0.80
0.750
0.633192.3 1.75
135.0034.90
159.00
0.877 0.95 2040034.9 1E+04 20.53
0.877 0.95 20400
159 95.641.75 0.95
0.95Ast 100 79.41 1E-04
sv 20400 0.95
107.6Asv 107.6 1E+04
95.63909774 30.89 1.75
74.3 44.691.75 0.950
Ast 100 79.41 1E-04
1.000
6 12 122.2
0.30 30.890.95
100 0.4781.75
100 0.478
sv 20400 0.95
22.94Asv 22.94
1.75 0.95
30.89 1.75
200
1.000
1.8002.350
1.000
30.89
120
0.95
55.54
159
6 10 398
1E+04 11.84
0.3044.7
79.41
135.00
0.95
1.00 0.05 0.95
135.0 1E+04

Consulting Engineers Group Ltd., Jaipur_______________________________________________________________________________
Bridge Design Report____________________________________________________________________________
DESIGN OF DIRT WALL
218.14
1 2.7062 A
215.433
CAP 1.0
214.433
4 3 B 0.5005
213.933ACTIVE EARTH PRESSURE SURCHARGE
ELEMENT NO.
AREA FACTOR HEIGHT PRESSURE WIDTH FORCE L.A. MOMENT
L.L. SURCHARGE 1 1.0 2.71 0.67 12.00 21.77 1.353 29.46ACTIVE EARTH PRESSURE2 0.5 2.71 1.51 12.00 24.55 1.137 27.90TOTAL 46.32 57.36L.L. SURCHARGE 3 1.0 0.50 0.67 12.00 4.02 0.250 1.01ACTIVE EARTH PRESSURE4 1.0 0.50 1.51 12.00 9.07 0.250 2.27ACTIVE EARTH PRESSURE5 0.5 0.50 0.28 12.00 0.84 0.333 0.28TOTAL 13.93 3.55
For dirt wall A For dirt wall BBENDING MOMENT AT THE EDGE OF CAP 57.36 3.6EFFECTIVE DEPTH REQUIRED 0.16 0.04EFFECTIVE DEPTH PROVIDED 0.25 0.25AREA OF STEEL REQUIRED PER METER WIDTH 10.68 cm2/m 0.66 cm2/m CHECK FOR SHEAR
SHEAR FORCE AT THE EDGE OF CAP 46.32 13.9SHEAR STRESS 15.44 t/m2 4.6 t/m2
% OF STEEL 0.43 0.03PERMISSIBLE SHEAR STRESS 29.2 t/m2 20.4 t/m2
0.3
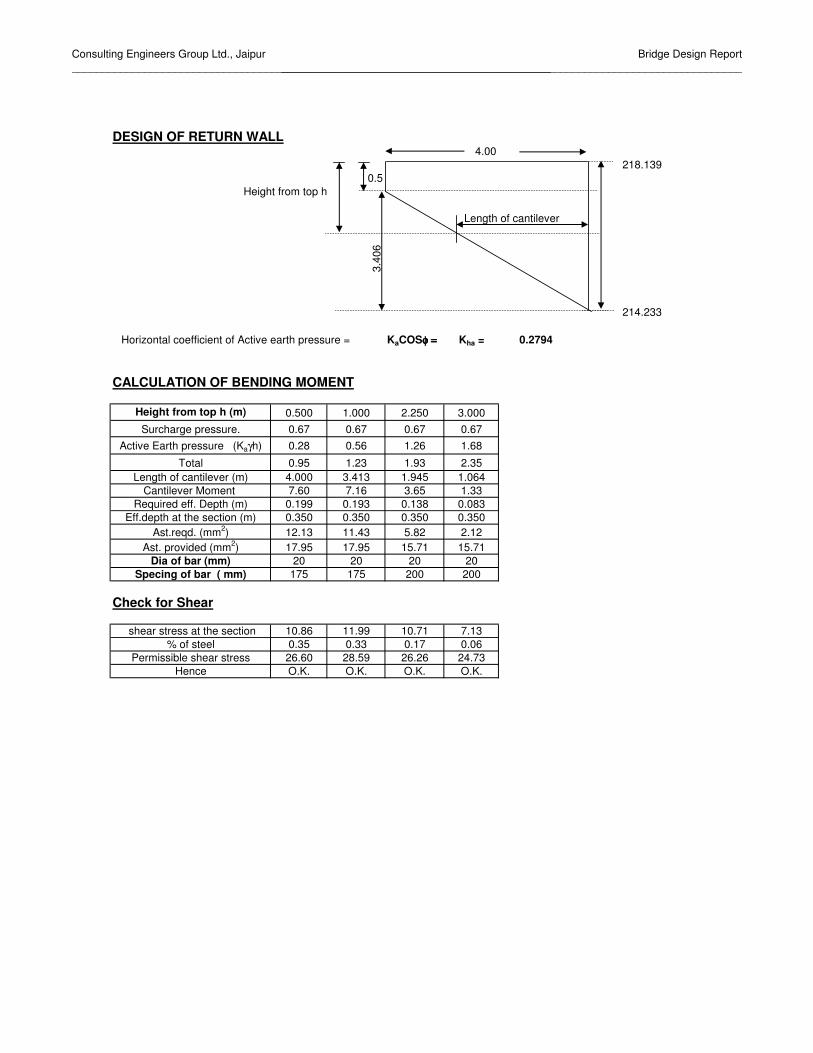
Consulting Engineers Group Ltd., Jaipur_______________________________________________________________________________
Bridge Design Report____________________________________________________________________________
DESIGN OF RETURN WALL4.00
218.1390.5
Height from top h
Length of cantilever
214.233
Horizontal coefficient of Active earth pressure = KaCOSφ = φ = φ = φ = Kha = 0.2794
CALCULATION OF BENDING MOMENT
0.500 1.000 2.250 3.0000.67 0.67 0.67 0.670.28 0.56 1.26 1.68
0.95 1.23 1.93 2.354.000 3.413 1.945 1.0647.60 7.16 3.65 1.33
0.199 0.193 0.138 0.0830.350 0.350 0.350 0.35012.13 11.43 5.82 2.1217.95 17.95 15.71 15.71
20 20 20 20175 175 200 200
Check for Shear
10.86 11.99 10.71 7.130.35 0.33 0.17 0.06
26.60 28.59 26.26 24.73O.K. O.K. O.K. O.K.
3.40
6
% of steelPermissible shear stress
Hence
Specing of bar ( mm)
shear stress at the section
Cantilever Moment Required eff. Depth (m)
Eff.depth at the section (m)Ast.reqd. (mm2)
Ast. provided (mm2)Dia of bar (mm)
Height from top h (m)
Surcharge pressure.Active Earth pressure (Kaγh)
Length of cantilever (m)Total

Consulting Engineers Group Ltd., Jaipur Bridge Design Report ______________________________________________________________________________ Abutment SHAFT .case 1 Depth of Section = 4.250 m Width of Section = .700 m along width-compression face- no of bar: 6 tension face- no of bar: 18 Dia (mm) 16 25 Cover (cm) 7.50 7.5 along depth-compression face- no of bar: 16 tension face- no of bar: 16 Dia (mm) 12 12 Cover (cm) 7.50 7.5 Modular Ratio : Compression = 10.0 Modular Ratio : Tension = 10.0 Allowable Concrete Stress = 102.00 Kg/cm^2 Allowable Steel Stress = 2040.00 Kg/cm^2 Axial Load = 289.910 T Mxx = 338.500 Tm Myy = 17.050 Tm Intercept of Neutral axis : X axis : = 1.812 m : y axis : = 3.805 m Concrete Stress Governs Design Stress in Concrete due to Loads = 33.15 Kg/cm^2 Stress in Steel due to Loads = 146.55 Kg/cm^2 Percentage of Steel = .46 %

Consulting Engineers Group Ltd., Jaipur Bridge Design Report _______________________________________________________________________________
1
INPUT FILE: spill rea.STD 1. STAAD PLANE 2. START JOB INFORMATION 3. ENGINEER DATE 02-NOV-06 4. END JOB INFORMATION 5. INPUT WIDTH 79 6. UNIT METER MTON 7. JOINT COORDINATES 8. 1 0 0 0; 2 1.8 0 0; 3 2.65 0 0; 4 4.6 0 0; 5 6 0 0; 6 7.4 0 0;7 9.35 0 0 9. 8 10.2 0 0; 9 12 0 0; 10 2.65 -5.064 0; 11 6 -5.064 0; 12 9.35 -5.064 0 10. 13 1.65 -5.064 0;14 10.95 -5.064 0 11. MEMBER INCIDENCES 12. 1 1 2; 2 2 3; 3 3 4; 4 4 5; 5 5 6; 6 6 7; 7 7 8; 8 8 9; 9 3 10; 10 5 11 13. 11 7 12;12 13 10;13 10 11;14 11 12;15 12 14 14. DEFINE MATERIAL START 15. ISOTROPIC MATERIAL1 16. E 2.95E+006 17. POISSON 0.15 18. DENSITY 2.4 19. END DEFINE MATERIAL 20. MEMBER PROPERTY INDIAN 21. 1 TO 8 PRIS YD 1 ZD 1.75 22. 9 TO 11 PRIS YD 0.7 ZD 3 23. 12 TO 15 PRIS YD 2 ZD 12.3 24. CONSTANTS 25. MATERIAL MATERIAL1 MEMB 1 TO 15 26. SUPPORTS 27. 10 TO 12 FIXED BUT FX MZ 28. LOAD 1 SELFWEIGHT 29. SELFWEIGHT Y -1 30. LOAD 2 31. JOINT LOAD 32. 2 8 FY -159 33. 4 6 FY -142 34. LOAD 3 35. MEMBER LOAD 36. 1 TO 8 UMOM GX 5.875 37. PERFORM ANALYSIS 38. PRINT MEMBER FORCES MEMBER FORCES MEMBER END FORCES STRUCTURE TYPE = PLANE ----------------- ALL UNITS ARE -- MTON METE MEMBER LOAD JT AXIAL SHEAR-Y SHEAR-Z TORSION MOM-Y MOM-Z 1 1 1 0.00 0.00 0.00 0.00 0.00 0.00 2 0.00 7.56 0.00 0.00 0.00 -6.80 2 1 0.00 0.00 0.00 0.00 0.00 0.00 2 0.00 0.00 0.00 0.00 0.00 0.00 3 1 0.00 0.00 0.00 -5.29 0.00 0.00 2 0.00 0.00 0.00 -5.29 0.00 0.00 2 1 2 0.00 -7.56 0.00 0.00 0.00 6.80 3 0.00 11.13 0.00 0.00 0.00 -14.75
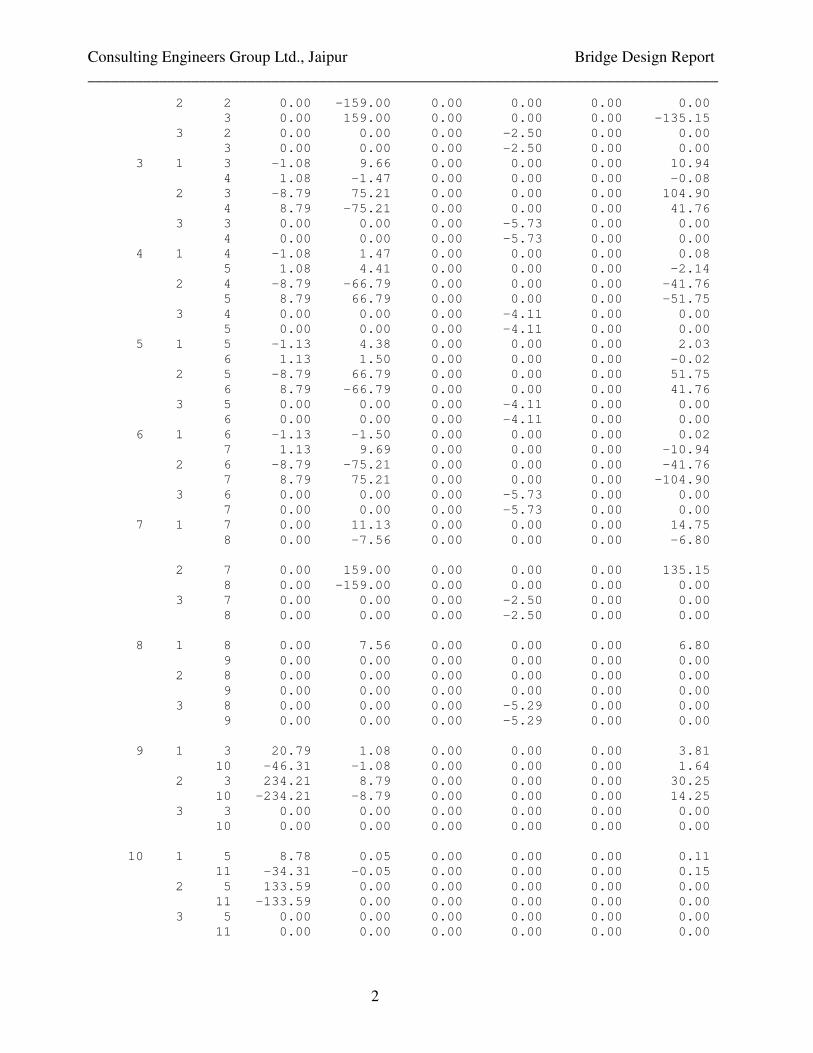
Consulting Engineers Group Ltd., Jaipur Bridge Design Report _______________________________________________________________________________
2
2 2 0.00 -159.00 0.00 0.00 0.00 0.00 3 0.00 159.00 0.00 0.00 0.00 -135.15 3 2 0.00 0.00 0.00 -2.50 0.00 0.00 3 0.00 0.00 0.00 -2.50 0.00 0.00 3 1 3 -1.08 9.66 0.00 0.00 0.00 10.94 4 1.08 -1.47 0.00 0.00 0.00 -0.08 2 3 -8.79 75.21 0.00 0.00 0.00 104.90 4 8.79 -75.21 0.00 0.00 0.00 41.76 3 3 0.00 0.00 0.00 -5.73 0.00 0.00 4 0.00 0.00 0.00 -5.73 0.00 0.00 4 1 4 -1.08 1.47 0.00 0.00 0.00 0.08 5 1.08 4.41 0.00 0.00 0.00 -2.14 2 4 -8.79 -66.79 0.00 0.00 0.00 -41.76 5 8.79 66.79 0.00 0.00 0.00 -51.75 3 4 0.00 0.00 0.00 -4.11 0.00 0.00 5 0.00 0.00 0.00 -4.11 0.00 0.00 5 1 5 -1.13 4.38 0.00 0.00 0.00 2.03 6 1.13 1.50 0.00 0.00 0.00 -0.02 2 5 -8.79 66.79 0.00 0.00 0.00 51.75 6 8.79 -66.79 0.00 0.00 0.00 41.76 3 5 0.00 0.00 0.00 -4.11 0.00 0.00 6 0.00 0.00 0.00 -4.11 0.00 0.00 6 1 6 -1.13 -1.50 0.00 0.00 0.00 0.02 7 1.13 9.69 0.00 0.00 0.00 -10.94 2 6 -8.79 -75.21 0.00 0.00 0.00 -41.76 7 8.79 75.21 0.00 0.00 0.00 -104.90 3 6 0.00 0.00 0.00 -5.73 0.00 0.00 7 0.00 0.00 0.00 -5.73 0.00 0.00 7 1 7 0.00 11.13 0.00 0.00 0.00 14.75 8 0.00 -7.56 0.00 0.00 0.00 -6.80 2 7 0.00 159.00 0.00 0.00 0.00 135.15 8 0.00 -159.00 0.00 0.00 0.00 0.00 3 7 0.00 0.00 0.00 -2.50 0.00 0.00 8 0.00 0.00 0.00 -2.50 0.00 0.00 8 1 8 0.00 7.56 0.00 0.00 0.00 6.80 9 0.00 0.00 0.00 0.00 0.00 0.00 2 8 0.00 0.00 0.00 0.00 0.00 0.00 9 0.00 0.00 0.00 0.00 0.00 0.00 3 8 0.00 0.00 0.00 -5.29 0.00 0.00 9 0.00 0.00 0.00 -5.29 0.00 0.00 9 1 3 20.79 1.08 0.00 0.00 0.00 3.81 10 -46.31 -1.08 0.00 0.00 0.00 1.64 2 3 234.21 8.79 0.00 0.00 0.00 30.25 10 -234.21 -8.79 0.00 0.00 0.00 14.25 3 3 0.00 0.00 0.00 0.00 0.00 0.00 10 0.00 0.00 0.00 0.00 0.00 0.00 10 1 5 8.78 0.05 0.00 0.00 0.00 0.11 11 -34.31 -0.05 0.00 0.00 0.00 0.15 2 5 133.59 0.00 0.00 0.00 0.00 0.00 11 -133.59 0.00 0.00 0.00 0.00 0.00 3 5 0.00 0.00 0.00 0.00 0.00 0.00 11 0.00 0.00 0.00 0.00 0.00 0.00

Consulting Engineers Group Ltd., Jaipur Bridge Design Report _______________________________________________________________________________
3
11 1 7 20.82 -1.13 0.00 0.00 0.00 -3.81 12 -46.35 1.13 0.00 0.00 0.00 -1.91 2 7 234.21 -8.79 0.00 0.00 0.00 -30.25 12 -234.21 8.79 0.00 0.00 0.00 -14.25 3 7 0.00 0.00 0.00 0.00 0.00 0.00 12 0.00 0.00 0.00 0.00 0.00 0.00 12 1 13 0.00 0.00 0.00 0.00 0.00 0.00 10 0.00 59.04 0.00 0.00 0.00 -29.52 2 13 0.00 0.00 0.00 0.00 0.00 0.00 10 0.00 0.00 0.00 0.00 0.00 0.00 3 13 0.00 0.00 0.00 0.00 0.00 0.00 10 0.00 0.00 0.00 0.00 0.00 0.00 13 1 10 1.08 90.43 0.00 0.00 0.00 27.88 11 -1.08 107.35 0.00 0.00 0.00 -56.22 2 10 8.79 -5.14 0.00 0.00 0.00 -14.25 11 -8.79 5.14 0.00 0.00 0.00 -2.97 3 10 0.00 0.00 0.00 0.00 0.00 0.00 11 0.00 0.00 0.00 0.00 0.00 0.00 14 1 11 1.13 93.64 0.00 0.00 0.00 56.07 12 -1.13 104.15 0.00 0.00 0.00 -73.67 2 11 8.79 5.14 0.00 0.00 0.00 2.97 12 -8.79 -5.14 0.00 0.00 0.00 14.25 3 11 0.00 0.00 0.00 0.00 0.00 0.00 12 0.00 0.00 0.00 0.00 0.00 0.00 15 1 12 0.00 94.46 0.00 0.00 0.00 75.57 14 0.00 0.00 0.00 0.00 0.00 0.00 2 12 0.00 0.00 0.00 0.00 0.00 0.00 14 0.00 0.00 0.00 0.00 0.00 0.00 3 12 0.00 0.00 0.00 0.00 0.00 0.00 14 0.00 0.00 0.00 0.00 0.00 0.00 39. PRINT SUPPORT REACTIONS JOINT LOAD FORCE-X FORCE-Y FORCE-Z MOM-X MOM-Y MOM Z 10 1 0.00 195.79 0.00 0.00 0.00 0.00 2 0.00 229.07 0.00 0.00 0.00 0.00 3 0.00 0.00 0.00 0.00 0.00 0.00 11 1 0.00 235.30 0.00 0.00 0.00 0.00 2 0.00 143.87 0.00 0.00 0.00 0.00 3 0.00 0.00 0.00 0.00 0.00 0.00 12 1 0.00 244.96 0.00 0.00 0.00 0.00 2 0.00 229.06 0.00 0.00 0.00 0.00 3 0.00 0.00 0.00 0.00 0.00 0.00 ************** END OF LATEST ANALYSIS RESULT ************** 40. FINISH
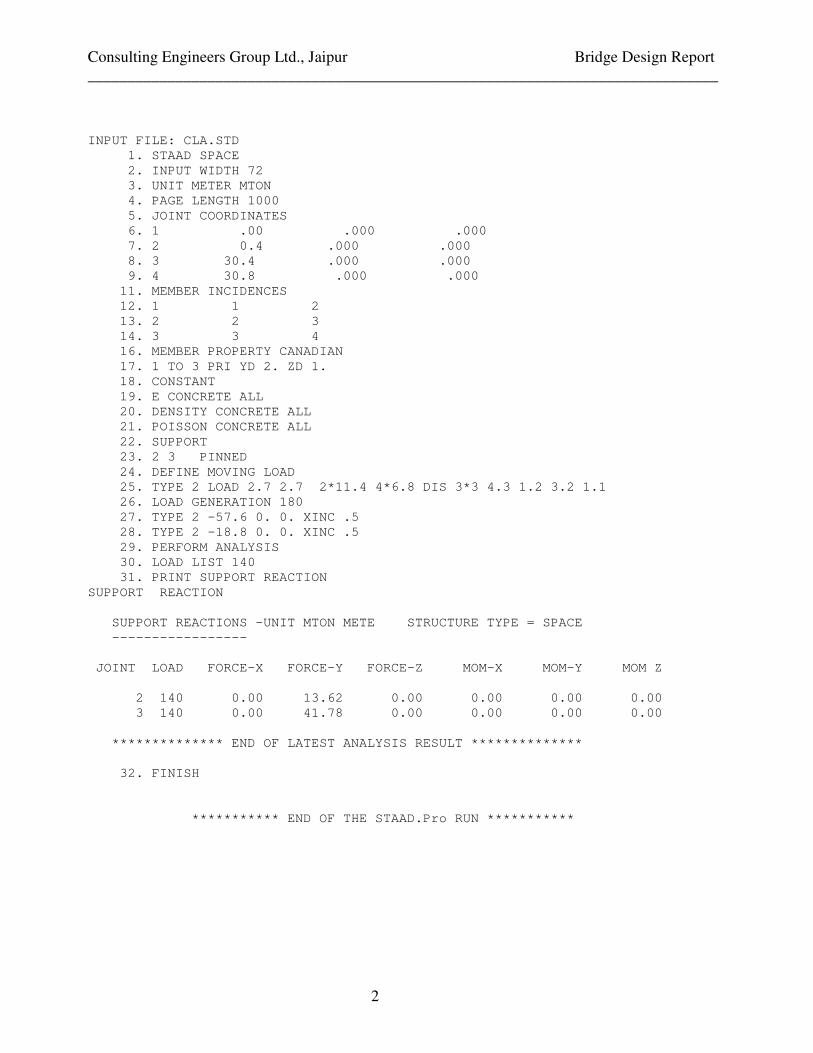
Consulting Engineers Group Ltd., Jaipur Bridge Design Report _______________________________________________________________________________
2
INPUT FILE: CLA.STD 1. STAAD SPACE 2. INPUT WIDTH 72 3. UNIT METER MTON 4. PAGE LENGTH 1000 5. JOINT COORDINATES 6. 1 .00 .000 .000 7. 2 0.4 .000 .000 8. 3 30.4 .000 .000 9. 4 30.8 .000 .000 11. MEMBER INCIDENCES 12. 1 1 2 13. 2 2 3 14. 3 3 4 16. MEMBER PROPERTY CANADIAN 17. 1 TO 3 PRI YD 2. ZD 1. 18. CONSTANT 19. E CONCRETE ALL 20. DENSITY CONCRETE ALL 21. POISSON CONCRETE ALL 22. SUPPORT 23. 2 3 PINNED 24. DEFINE MOVING LOAD 25. TYPE 2 LOAD 2.7 2.7 2*11.4 4*6.8 DIS 3*3 4.3 1.2 3.2 1.1 26. LOAD GENERATION 180 27. TYPE 2 -57.6 0. 0. XINC .5 28. TYPE 2 -18.8 0. 0. XINC .5 29. PERFORM ANALYSIS 30. LOAD LIST 140 31. PRINT SUPPORT REACTION SUPPORT REACTION SUPPORT REACTIONS -UNIT MTON METE STRUCTURE TYPE = SPACE ----------------- JOINT LOAD FORCE-X FORCE-Y FORCE-Z MOM-X MOM-Y MOM Z 2 140 0.00 13.62 0.00 0.00 0.00 0.00 3 140 0.00 41.78 0.00 0.00 0.00 0.00 ************** END OF LATEST ANALYSIS RESULT ************** 32. FINISH *********** END OF THE STAAD.Pro RUN ***********
CEG.Ltd., Jaipur Bridge Design Report
Consultancy Services for Feasibility Study and Detailed Project Preparation for Proposed Orissa State Road Project
ADDITIONAL SHEETS (SEISMIC CHECK)
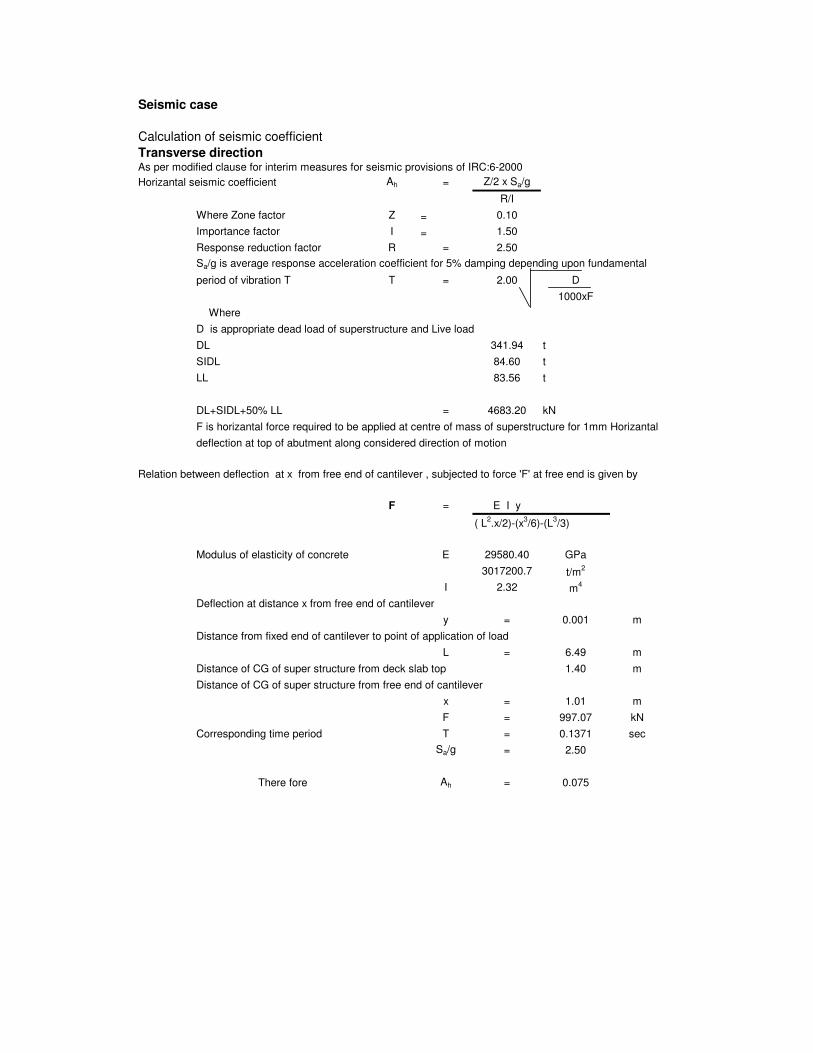
Seismic case
Calculation of seismic coefficientTransverse directionAs per modified clause for interim measures for seismic provisions of IRC:6-2000Horizantal seismic coefficient Ah = Z/2 x Sa/g
R/IWhere Zone factor Z = 0.10Importance factor I = 1.50Response reduction factor R = 2.50Sa/g is average response acceleration coefficient for 5% damping depending upon fundamental
period of vibration T T = 2.00 D1000xF
WhereD is appropriate dead load of superstructure and Live loadDL 341.94 tSIDL 84.60 tLL 83.56 t
DL+SIDL+50% LL = 4683.20 kNF is horizantal force required to be applied at centre of mass of superstructure for 1mm Horizantaldeflection at top of abutment along considered direction of motion
Relation between deflection at x from free end of cantilever , subjected to force 'F' at free end is given by
F = E I y
( L2.x/2)-(x3/6)-(L3/3)
Modulus of elasticity of concrete E 29580.40 GPa3017200.7 t/m2
I 2.32 m4
Deflection at distance x from free end of cantilever y = 0.001 m
Distance from fixed end of cantilever to point of application of loadL = 6.49 m
Distance of CG of super structure from deck slab top 1.40 mDistance of CG of super structure from free end of cantilever
x = 1.01 mF = 997.07 kN
Corresponding time period T = 0.1371 secSa/g = 2.50
There fore Ah = 0.075

Longitudinal directionAs per modified clause for interim measures for seismic provisions of IRC:6-2000Horizantal seismic coefficient Ah = Z/2 x Sa/g
R/IWhere Zone factor Z = 0.10Importance factor I = 1.50Response reduction factor R = 2.50Sa/g is average response acceleration coefficient for 5% damping depending upon fundamental
period of vibration T T = 2.00 D1000xF
WhereD is appropriate dead load of superstructure and Live loadFor longitudinal direction, live load is not to be considered.
DL+SIDL = 4265.40 kNF is horizantal force required to be applied at centre of mass of superstructure for 1mm Horizantaldeflection at top of abutment along considered direction of motion
Relation between deflection at x from free end of cantilever , subjected to force 'F' at free end is given by
F = E I y
( L2.x/2)-(x3/6)-(L3/3)
Modulus of elasticity of concrete E 29580.40 GPa3017201 t/m2
I 4.73 m4
Deflection at distance x from free end of cantilever y = 0.001 m
Distance from fixed end of cantilever to point of application of loadL = 6.49 m
Top of abutment from free end of cantilever x = 1.01 mF = 2034.84 kn
Corresponding time period T = 0.09 secSa/g = 2.50
There fore Ah = 0.075
Ground level 90.145
Weight due to Concrete componentsSeismic
component Area factor Length Width Height Density Force L.A Moment1 Dirt wall 1 12.0 0.3 2.706 2.4 1.753 9.642 16.9072 Abut cap 1 12.0 1.75 1 2.4 3.780 7.789 29.4423 Abut shaft 1 2.1 3 3.6445 2.4 4.133 4.875 20.146
9.666 66.495
Lever arm for the loads from super structureFormation level 218.139 mWearing coat 56 mmTop of deck slab 218.083 mDistance of CG of super structure below deck slab top 1.400 mPile cap bottom 207.144 mLever arm for DL 9.539 m

Distance of CG of SIDL above deck slab top 0.261 mLevel arm for SIDL 11.200 m
Distance of CG of live load above formation level 1.2Lever arm for live load 12.195
Load from SuperstrutureLongitudinal direction
Weight Force L.A momentDL 341.94 25.65 9.539 244.64SIDL 84.60 6.35 11.200 71.06
Total 31.99 315.70
Transverse directionWeight Force L.A moment
DL 341.94 25.645 9.54 244.64SIDL 84.60 6.345 11.20 71.06LL 50% 41.78 3.134 12.20 38.21
Total 35.124 353.92
Summary
seismic longitudinal caseP ML MT
Total load on piles for normal case 2465.58 -1019.01 242.26Additional horizantal force and moment due to seismic - -382.197 -(Live load not to be considered for longitudinal moment)Reduction in longitudinal moment due to braking force - 292.13 -Reduction in transverse moment due to live load -242.26
2465.58 -1109.070 0.00
Seismic Transverse caseTotal load on piles for normal case 2465.58 -1019.01 242.26Additional horizantal force and moment due to seismic - - 420.41(Only 50%% live load is to be considered for transverse moment)Reduction in longitudinal moment due to braking force - 146.066 -Reduction in transverse moment due to live load - - -121.13
2465.58 -872.94 541.54

Design of Substructure________________________________________________________________________
CEG.Ltd.,Jaipur_________________________________________________________________
Total no. of Piles (N) 12
P 2465.58ZL
(outer) 36.00 ZL (inner) 108.00ML -1109.070MT 0.000
ZT
(outer) 28.80 ZT (inner) 0.00
P/NML/ZL
(outer)ML/ZL
(inner)MT/ZT
(outer) MT/ZT
(inner) P/N
ML/ZL
(outer)ML/ZL
(inner)MT/ZT
(outer) MT/ZT
(inner)
205.46 -30.81 -10.27 0.00 0.00 205.46 -24.25 -8.08 18.80 0
TRAFFIC DIRECTION
PILE NO. A B C D A B C D
1 236.27 215.73 195.20 174.66 210.91 194.74 178.58 162.41
2 236.27 215.73 195.20 174.66 229.71 213.55 197.38 181.22
3 236.27 215.73 195.20 174.66 248.52 232.35 216.19 200.02
SEISMIC ANALYSIS
Permissible capacity of pile in normal case = 275 ton
Seismic Longitudinal Seismic Transverse
Permissible capacity of pile in seismic case = 275 x 1.25 = 343.75 ton > 248 ton

Design of Substructure________________________________________________________________________
CEG.Ltd.,Jaipur_________________________________________________________________

Design of Substructure________________________________________________________________________
CEG.Ltd.,Jaipur_________________________________________________________________
Horizontal load per pile for Normal case
Horizantal force due to weight of earth = tHorizontal force due to braking = t
Horizantal seismic force due to abutment avove G.L = t= t
Number of Piles == t per pile
Horizantal force in Normal condition due to earth = t= t per pile
Therefore Total Horizantal force per pile = t per pileMaximum Load on the Pile =Minimum Load on the Pile =
Determination of Lateral Deflection of pile :
T = E x I E = Youngs modulus kg/m2
5 K1 K1 = Constant kg/cm3
R = E x I K2 kg/cm2
4 K2 I = moment of inertia of pile cross section cm4
Dia of pile = m
E = x = kg/cm2
I = x ^ 4 = cm4
K1 =
K2 =
T =R =
Le = Embeded Length of pile= - = cm
L1 = Exposed Length = - = cm
L1 =
TLf =
TLf = cm
168.75
15.08
0.0032.86
0.00
12.002.74
180.91
17.81242.18
207.19 199.5 769.4
2.15
711.19
10.4207.09 206.99
1.20
5000 35 301533
3.14
64
120 10178760
0.775
32.86
0.0314
0
330.780
63

Design of Substructure________________________________________________________________________
CEG.Ltd.,Jaipur_________________________________________________________________
Pile Head deflection3
y = Q L1 + Lf = x
E I x x
= cm= mm
In seismic case as permissble increase in deflection is 25%, hencePermissible deflection = 5 x 1.25 = mm > mm
Maximum MomentMF = Q x + =
2
M = m x MF
= x = t-m
Reinforcement in pile:
Provide mm dia nos cm2
Provide mm Rings at mm c/c
1.7399
10178760
17.815 711.19
301533
6.25
52.58
63.348
0.83 63.348
L1 Lf
10
16
190
12 12
0.1741.74
30 60.319
t-m
73

Design of Substructure________________________________________________________________________
CEG.Ltd.,Jaipur_________________________________________________________________
MAX. LOAD MIN. LOADD=DIA OF PILE ( in m) 1.200 1.200C=COVER FROM CENTRE OF BAR (in m) 0.075 0.075M=MODULAR RATIO (as per IRC:6) 10.000 10.000BD=BETA ANGLE FOR DEFINING N.A. ( in degree) 49.14 74.21AS=AREA OF STEEL (in sq. Cm) 60.319 60.319P=VERTICAL LOAD ( in tonnes) 242.18 168.75BM=BENDING MOMENT (in t-m) 52.58 52.58
SOLUTIONRO=OUTER RADIUS=D/2 0.600 0.600RI=RADIUS OF REINFORCEMENT RING=D/2-C 0.525 0.525T= THICK.REINFORCEMENT RING = AS/2*3.142*RI 0.002 0.002B=BD*PI/180 0.858 1.295B1=COS(B) 0.654 0.272A=ALPHA ANGLE=ACOS (RO*B1/RI) 0.726 1.255RECOSB=RICOSAB2=SIN(B)^3 0.433 0.891B3=SIN(4*B) -0.285 -0.892B4=SIN(2*B) 0.990 0.524A=COS(A) 0.748 0.311A2=SIN(2*A) 0.993 0.591A3=SIN(A) 0.664 0.950NUM1=(PI-B)/8+B3/32+B1*B2/3 0.371 0.284NUM2=2*(RO^3)/(1+B1) 0.261 0.340NUM3=(RI 3) *T/(RO+RI*A1) 0.000 0.000NUM4=(M-1) *PI+A-A2/2 28.50 29.23NUM = NUMINATOR = NUM2*NUM1+NUM3*NUM4 0.104 0.106DENM1=2*(RO^2)/(1+B1) 0.435 0.566DENM2=B2/3+(PI-B)*B1/2+B1*B4/4 1.053 0.584DENM3=2*(RI 2) * T/ (RO+RI*A1) 0.001 0.001DENM4=(M-1) *PI*A1-A3+A*A1 21.02 8.23DENM=DENOMINATOR=DENM1*DENM2+DENM3*DENM4 0.480 0.341
CHECK FOR ECCENTRICITIESCALCULATED ECCENTRICITY EC = NUM/DENM 0.218 0.312ACTUAL ECCENTRICITY EC = M/P 0.217 0.312
CHECK FOR STRESSESNAC=DEPTH OF N.A.BELOW CENT.AXIS=RO*COS(B) 0.393 0.163NAD=DEPTH OF N.A FROM TOP=RO+NAC 0.993 0.763DE=EFFECTIVE DEPTH=D-C 1.125 1.125CC=COMP. STRESS IN CONC. IN T/SQM=P/DENM 505 494TS=TENS.STRESS IN STEEL (T/SQM) 674 2343PERMISSIBLE COMP.STRESS IN Concrete 50% increase (in t/sq.m) 1190 1190PERMISSIBLE TENSILE STRESS IN Steel 50% increase(in t/sq.m) 20400 20400Hence stresses in conc and steel are within permissible limits, hence safe.
INPUT DATA Normal CaseDESIGN OF PILE SECTION
67

Design of Substructure________________________________________________________________________
CEG.Ltd.,Jaipur_________________________________________________________________
Horizontal load per pile due to normal & seismicSeismic Longitudinal direction:
Horizontal seismic force due superstructure (DL+SIDL) = t(Live load not to be considered for longitudinal direction)Horizantal seismic force due to abutment avove G.L = t
= tNumber of Piles =
= t per pileHorizantal force in Normal condition due to earth = t
= t per pileTherefore Total Horizantal force per pile = t per pileMaximum Load on the Pile =Minimum Load on the Pile =
Determination of Lateral Deflection of pile :
T = E x I E = Youngs modulus kg/m2
5 K1 K1 = Constant kg/cm3
R = E x I K2 kg/cm2
4 K2 I = moment of inertia of pile cross section cm4
Dia of pile = m
E = x = kg/cm2
I = x ^ 4 = cm4
K1 =
K2 =
T =R =
Le = Embeded Length of pile= - = cm
L1 = Exposed Length = - = cm
L1 =
TLf =
TLf = cm
41.66
0.0314
0
330.780
1.20
5000 35 301533
3.14
64
120 10178760
0.775
207.19 199.5 769.4
2.15
711.19
10.4207.09 206.99
174.66
15.08
31.99
9.67
12.003.47
180.91
18.55236.27
63
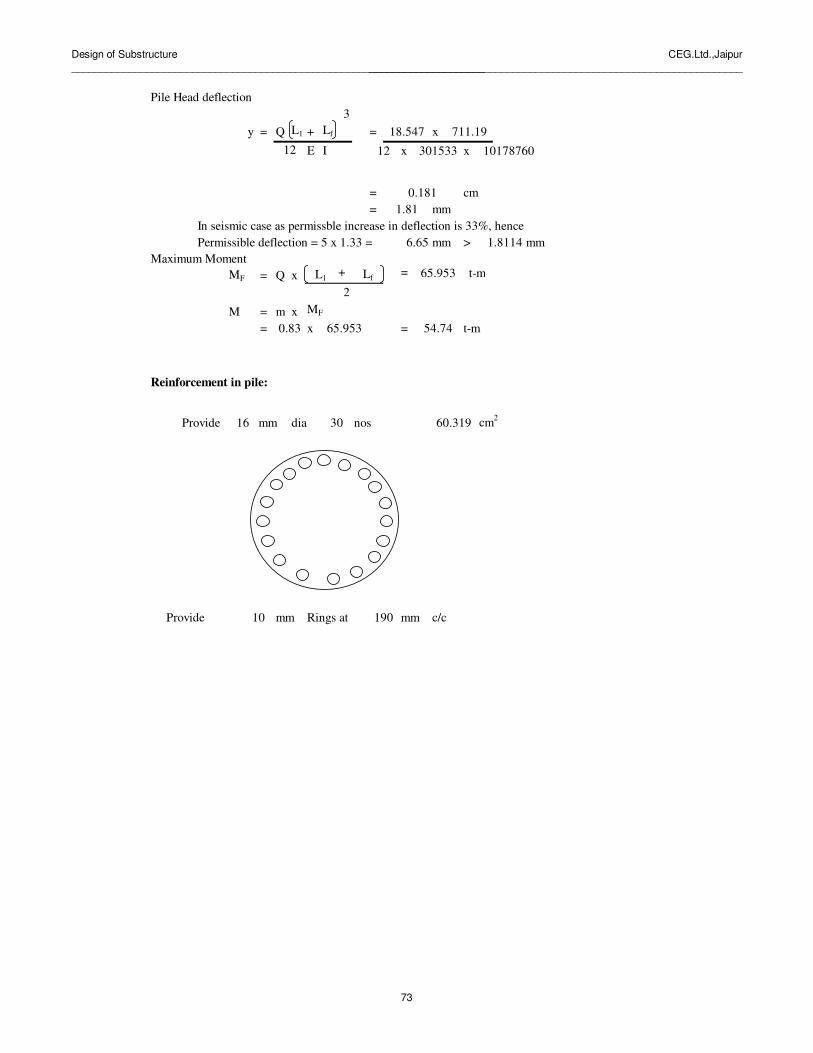
Design of Substructure________________________________________________________________________
CEG.Ltd.,Jaipur_________________________________________________________________
Pile Head deflection3
y = Q L1 + Lf = x
E I x x
= cm= mm
In seismic case as permissble increase in deflection is 33%, hencePermissible deflection = 5 x 1.33 = mm > mm
Maximum MomentMF = Q x + =
2
M = m x MF
= x = t-m
Reinforcement in pile:
Provide mm dia nos cm2
Provide mm Rings at mm c/c10
16
190
12 12
0.1811.81
30 60.319
t-m
0.83 65.953
L1 Lf
301533
6.65
54.74
65.953
18.547 711.19
10178760
1.8114
73

Design of Substructure________________________________________________________________________
CEG.Ltd.,Jaipur_________________________________________________________________
MAX. LOAD MIN. LOADD=DIA OF PILE ( in m) 1.200 1.200C=COVER FROM CENTRE OF BAR (in m) 0.075 0.075M=MODULAR RATIO (as per IRC:6) 10.000 10.000BD=BETA ANGLE FOR DEFINING N.A. ( in degree) 54.11 74.43AS=AREA OF STEEL (in sq. Cm) 60.319 60.319P=VERTICAL LOAD ( in tonnes) 236.27 174.66BM=BENDING MOMENT (in t-m) 54.74 54.74
SOLUTIONRO=OUTER RADIUS=D/2 0.600 0.600RI=RADIUS OF REINFORCEMENT RING=D/2-C 0.525 0.525T= THICK.REINFORCEMENT RING = AS/2*3.142*RI 0.002 0.002B=BD*PI/180 0.944 1.299B1=COS(B) 0.586 0.268A=ALPHA ANGLE=ACOS (RO*B1/RI) 0.837 1.259RECOSB=RICOSAB2=SIN(B)^3 0.532 0.894B3=SIN(4*B) -0.594 -0.885B4=SIN(2*B) 0.950 0.517A=COS(A) 0.670 0.307A2=SIN(2*A) 0.995 0.584A3=SIN(A) 0.742 0.952NUM1=(PI-B)/8+B3/32+B1*B2/3 0.360 0.283NUM2=2*(RO^3)/(1+B1) 0.272 0.341NUM3=(RI 3) *T/(RO+RI*A1) 0.000 0.000NUM4=(M-1) *PI+A-A2/2 28.61 29.24NUM = NUMINATOR = NUM2*NUM1+NUM3*NUM4 0.106 0.106DENM1=2*(RO^2)/(1+B1) 0.454 0.568DENM2=B2/3+(PI-B)*B1/2+B1*B4/4 0.961 0.580DENM3=2*(RI 2) * T/ (RO+RI*A1) 0.001 0.001DENM4=(M-1) *PI*A1-A3+A*A1 18.76 8.11DENM=DENOMINATOR=DENM1*DENM2+DENM3*DENM4 0.456 0.340
CHECK FOR ECCENTRICITIESCALCULATED ECCENTRICITY EC = NUM/DENM 0.233 0.313ACTUAL ECCENTRICITY EC = M/P 0.232 0.313
CHECK FOR STRESSESNAC=DEPTH OF N.A.BELOW CENT.AXIS=RO*COS(B) 0.352 0.161NAD=DEPTH OF N.A FROM TOP=RO+NAC 0.952 0.761DE=EFFECTIVE DEPTH=D-C 1.125 1.125CC=COMP. STRESS IN CONC. IN T/SQM=P/DENM 518 514TS=TENS.STRESS IN STEEL (T/SQM) 943 2456PERMISSIBLE COMP.STRESS IN Concrete 50% increase (in t/sq.m) 1785 1785PERMISSIBLE TENSILE STRESS IN Steel 50% increase(in t/sq.m) 30600 30600Hence stresses in conc and steel are within permissible limits, hence safe.
INPUT DATA Seismic long. CaseDESIGN OF PILE SECTION
67
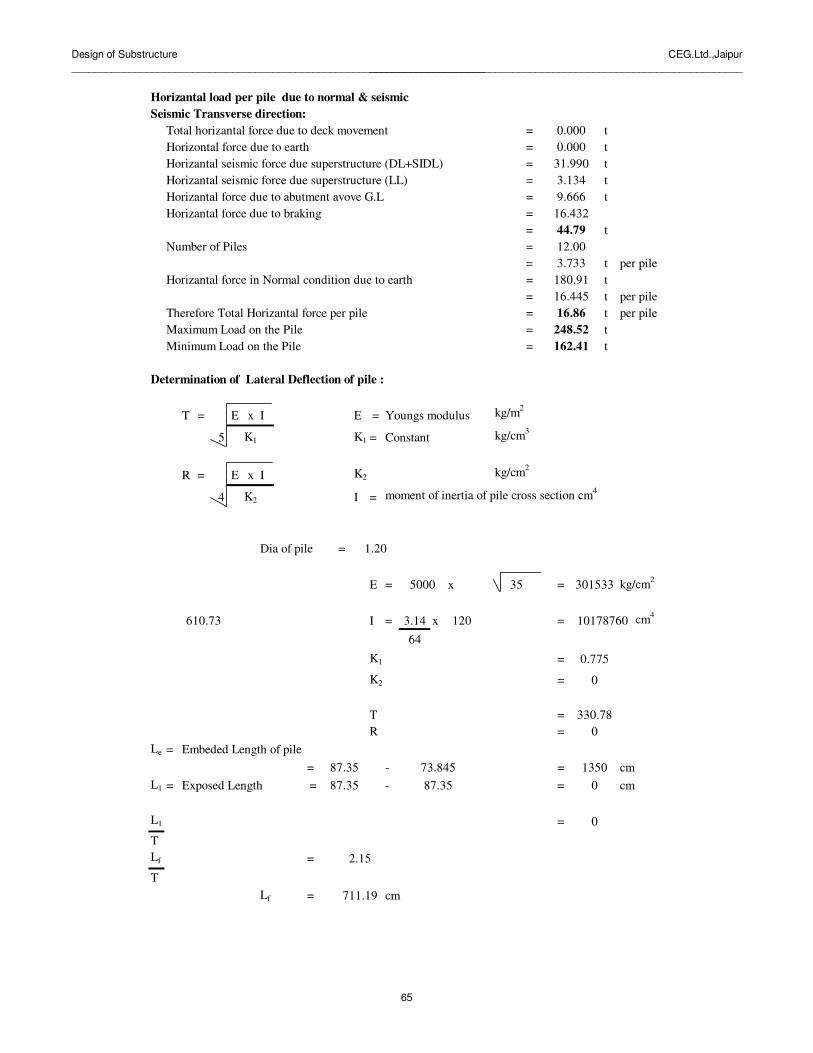
Design of Substructure________________________________________________________________________
CEG.Ltd.,Jaipur_________________________________________________________________
Horizantal load per pile due to normal & seismicSeismic Transverse direction:
Total horizantal force due to deck movement = tHorizontal force due to earth = tHorizantal seismic force due superstructure (DL+SIDL) = tHorizantal seismic force due superstructure (LL) = tHorizantal force due to abutment avove G.L = tHorizantal force due to braking =
= tNumber of Piles =
= t per pileHorizantal force in Normal condition due to earth = t
= t per pileTherefore Total Horizantal force per pile = t per pileMaximum Load on the Pile = tMinimum Load on the Pile = t
Determination of Lateral Deflection of pile :
T = E x I E = Youngs modulus kg/m2
5 K1 K1 = Constant kg/cm3
R = E x I K2 kg/cm2
4 K2 I = moment of inertia of pile cross section cm4
Dia of pile =
E = x = kg/cm2
I = x = cm4
K1 =
K2 =
T =R =
Le = Embeded Length of pile= - = cm
L1 = Exposed Length = - = cm
L1 =
TLf =
TLf = cm
12.00
16.86248.52162.41
16.445
3.733180.91
0.0000.000
31.990
9.6663.134
87.35 73.845 1350
2.15
711.19
087.35
1.20
5000 35 301533
3.14
64
120 10178760
0.775
44.79
0
0
330.780
610.73
87.35
16.432
65

Design of Substructure________________________________________________________________________
CEG.Ltd.,Jaipur_________________________________________________________________
Pile Head deflection3
y = Q L1 + Lf = x
E I x x
= cm= mm
in seismic transverse case permissible increase in deflection = 1.25 x 5 = mm > mm
Maximum MomentMF = Q x + =
2
M = m x MF
= x = t-m
Reinforcement in pile:
Provide mm dia nos cm2
Provide mm Rings at mm c/c
6.65
16.864
0.1651.65
301533
49.770.83 59.966
L1 Lf 59.966
711.19
10178760
1.65
10
16
190
30 60.319
t-m
12 12
75

Design of Substructure________________________________________________________________________
CEG.Ltd.,Jaipur_________________________________________________________________
MAX. LOAD MIN. LOADD=DIA OF PILE ( in m) 1.200 1.200C=COVER FROM CENTRE OF BAR (in m) 0.075 0.075M=MODULAR RATIO (as per IRC:6) 10.000 10.000BD=BETA ANGLE FOR DEFINING N.A. ( in degree) 42.28 73.10AS=AREA OF STEEL (in sq. Cm) 60.319 60.319P=VERTICAL LOAD ( in tonnes) 248.52 162.41BM=BENDING MOMENT (in t-m) 49.77 49.77
SOLUTIONRO=OUTER RADIUS=D/2 0.600 0.600RI=RADIUS OF REINFORCEMENT RING=D/2-C 0.525 0.525T= THICK.REINFORCEMENT RING = AS/2*3.142*RI 0.002 0.002B=BD*PI/180 0.738 1.276B1=COS(B) 0.740 0.291A=ALPHA ANGLE=ACOS (RO*B1/RI) 0.563 1.232RECOSB=RICOSAB2=SIN(B)^3 0.305 0.876B3=SIN(4*B) 0.189 -0.925B4=SIN(2*B) 0.996 0.556A=COS(A) 0.846 0.332A2=SIN(2*A) 0.903 0.627A3=SIN(A) 0.534 0.943NUM1=(PI-B)/8+B3/32+B1*B2/3 0.381 0.289NUM2=2*(RO^3)/(1+B1) 0.248 0.335NUM3=(RI 3) *T/(RO+RI*A1) 0.000 0.000NUM4=(M-1) *PI+A-A2/2 28.39 29.19NUM = NUMINATOR = NUM2*NUM1+NUM3*NUM4 0.102 0.107DENM1=2*(RO^2)/(1+B1) 0.414 0.558DENM2=B2/3+(PI-B)*B1/2+B1*B4/4 1.175 0.604DENM3=2*(RI 2) * T/ (RO+RI*A1) 0.001 0.001DENM4=(M-1) *PI*A1-A3+A*A1 23.85 8.86DENM=DENOMINATOR=DENM1*DENM2+DENM3*DENM4 0.509 0.348
CHECK FOR ECCENTRICITIESCALCULATED ECCENTRICITY EC = NUM/DENM 0.200 0.307ACTUAL ECCENTRICITY EC = M/P 0.200 0.306
CHECK FOR STRESSESNAC=DEPTH OF N.A.BELOW CENT.AXIS=RO*COS(B) 0.444 0.174NAD=DEPTH OF N.A FROM TOP=RO+NAC 1.044 0.774DE=EFFECTIVE DEPTH=D-C 1.125 1.125CC=COMP. STRESS IN CONC. IN T/SQM=P/DENM 488 466TS=TENS.STRESS IN STEEL (T/SQM) 379 2111PERMISSIBLE COMP.STRESS IN Concrete 50% increase (in t/sq.m) 1785 1785PERMISSIBLE TENSILE STRESS IN Steel 50% increase(in t/sq.m) 30600 30600Hence stresses in conc and steel are within permissible limits, hence safe.
INPUT DATA Seismic trans. CaseDESIGN OF PILE SECTION
68

CEG.Ltd., Jaipur Bridge Design Report
Consultancy Services for Feasibility Study and Detailed Project Preparation for Proposed Orissa State Road Project
DESIGN OF SUPERSTRUCTURE

Consulting Engineers Group Ltd., Jaipur_________________________________________________________________________
Bridge Design Report_______________________________________________________________________________
Bridge Data
Dimensional Data1 Total span c/c of Expansion Joint 32.2 m2 Length of gap slab at both ends 0.7 m3 Distance of centre of bearing from end of girder 0.4 m4 span c/c of bearing I.e. effective span 30 m5 skew angle of the bridge 06 width of clear carriageway 7.5 m7 Extra widening in carriageway, if any 08 Width of crash barrier footpath side 0.5 m9 Width of foothpath 1.525 m
10 Width of railing curb 0.225 m11 Width of median side curb 0.5 m12 Half width of median including curb 2.25 m13 Total width of bridge 12 m14 Spacing of main Girders c/c 2.8 m15 Number of main girders 416 Spacing of cross girders c/c 7.500 m17 Thickness of deck slab 0.25 m18 Thicknes of wearing coat 0.056 m19 Thickness of cantilever slab at fixed end 0.25 m20 Thickness of cantilever slab at free end 0.25 m21 Depth of precast girder including flange 2.1 m22 Web thickness of precast girder at mid section 0.275 m23 web thickness of precast girder at support section 0.6 m24 Length of side flaring section in main girder 2.5 m25 Length of widened section in main girder from end 2.9 m26 Distance of end of main girder from centre of bearing 0.4 m27 Length of widened section in main girder from bearing 2.5 m28 Width of flange of precast girder at top 1.25 m29 Width of flange of precast girder at bottom 1 m30 Thickness of flange of precast girder at top 0.15 m31 Size of top haunch width 0.4875 m
Depth 0.16 m32 Size of bottom haunch Width 0.3625 m
Depth 0.24 mSize of bottom bulb Width 1 m Depth 0.3 m
33 Depth of Intermediate cross girder excluding deck slab 1.8 m34 Depth of end cross girder excuding deck slab 1.8 m35 Web thickness of intermediate cross girder 0.3 m36 Web thickness of end cross girder 0.45 m
PropertiesGrade of concrete for superstructure M 40 N/mm2Grade of reinforcement for superstructure FY 415 N/mm2Clear cover to reinforcement for slabs 0.04 mClear cover to reinforcement for beams 0.05 mUnit weight of RCC ( as per IRC:6-2000,Cl 205) 2.4 t/m3unit weight of prestressed concrete( as per IRC:6-2000,Cl 205) 2.5 t/m3Unit weight of wearing coat 2.2 t/m3Weight of crash barrier 1 t/mWeight of railing,if any noWeight of utilities under foothpath slab 0.1 t/mAllowable stress in concrete in bending compression 13.33 N/mm2allowable stress in steel in bending compression 200 N/mm2Modular ratio 10Poissions ratio for concrete 0.15Modulus of elasticity 32500 N/mm2Coefficient of thermal expansion 1.17E-05 per deg.C

Consulting Engineers Group Ltd., Jaipur_________________________________________________________________________
Bridge Design Report_______________________________________________________________________________
General Features
Girder Length
Span c/c of exp. Joint 32.200 mGap slab 0.700 mOverall length of girder 30.800 mDistance of centre of bearing from end of girder 0.400 mEffective length of girder from c/c of bearing 30.000 m
Sequence of deck construction
1 Cast PSC beams at site2 Stress Stage -I tendons in the beam3 Cast the in-situ portion of cross girders and deck slab at top4 Stress Stage -II tendons in the beam5 Cast the gap slab,Crash barrier,Kerb etc.6 Lay the wearing coat
Design Sections
For flexural and shear stress1 mid span sections2 3/8 th section3 1/4 th sections4 1/8th span section5 effective depth d
Concrete Strength
For analysis it has been assumed that the precast beams as well as the deck slab of the top shall have a minimum of M-40 grade concrete. However the concrete shall be designmix and have a minimum 28 days characterstics strength of 40Mpa on 150 mm cubesfor all elements of super structure.
Codes of References
(I) IRC: 5-1998 (iv) IRC:21-2000(II) IRC:6-2000 (v) IRC:22-1986(iii) IRC:18-2000
Reinforcement
Reinforcing steel shall be of HYSD bars ( grade designation S:415) confirming to IS:1786
Prestressing steel and Accessories
Cable consisting of 12 No. of 12.7 mm dia 7 ply class 2 strand as per IS:6006-1983shall be used for main stressing.
Sheathing
Sheathing shall be of "Drassbatch" type 75 mm ID manufactured from minimum o.3 mmthick bright metal strip. It shall be as per IRC;18 -2000, Appendix 1.

Consulting Engineers Group Ltd., Jaipur_________________________________________________________________________
Bridge Design Report_______________________________________________________________________________
GIRDER (0uter)AT MID SPAN
Depth (mm) 2100 Depth (mm) 2350Area (mm2) 1106250 Deck slab Area (mm2) 1906250Iz (mm4) 6.2283E+11 250 Iz (mm4) 1.31354E+12Yb(mm) 1008.95 + mm Yb(mm) 1519.3Yt(mm) 1091.05 thick and Yt(mm) 830.7Zb(mm3) 6.173E+08 3200 Zb(mm3) 8.646E+08Zt(mm3) 5.709E+08 mm wide. Zt(mm3) 1.581E+09Concrete M- 40 Concrete M- 40
Iy Y 3200Element Iself = bd3/12 Az
2 1800 1400mm4 mm4
1 2.441E+10 0 2502 1.030E+09 7.019E+09 1503 2.860E+09 0 1604 6.351E+08 5.805E+095 2.500E+10 0 275
5.394E+10 1.282E+10 z 2100 z 1250
Iy(self) = 6.676E+10 mm4
zL = 1716.1 240300
Iy(slab) = 6.827E+11
Iy(comp) = 7.68E+11Y
Ix3200
Tav = 230.0 mm 250Bav = 420.0 mm
Portion no. b d 3.b3.d3
mm mm 10(b2+d2) 1250 Tav1 3200 250 8.33E+092 1250 230 4.41E+09 2100 2753 275 1450 8.73E+094 1000 420 1.89E+10 Bav
Ix (mm4) = 4.037E+10
1000
1000
for deck slab Ix = b x d3 / 6
SECTION PROPERTIES
Self
1250
Composite
1
2
3
4
1
2
33
4
5

Consulting Engineers Group Ltd., Jaipur_________________________________________________________________________
Bridge Design Report_______________________________________________________________________________
AT SUPPORT
Iz
Depth (mm) 2100 Depth (mm) 2350Area (mm2) 1538649.43 Deck slab Area (mm2) 2338649Iz (mm4) 6.932E+11 250 Iz (mm4) 1.42534E+12
Yb(mm) 1048.92 + mm Yb(mm) 1451.2Yt(mm) 1051.08 thick and Yt(mm) 898.8Zb(mm3) 6.608E+08 3200 Zb(mm3) 9.822E+08Zt(mm3) 6.595E+08 mm Zt(mm3) 1.586E+09W (kN/m) 38.5 wide.Concrete M- 40 Concrete M- 40
Y3200
Element Iself = bd3/12 Az2 1800 1400
mm4 mm4
1 2.441E+10 0 2502 2.034E+08 5.780E+09 1503 2.970E+10 0 1074 5.885E+07 3.560E+095 2.500E+10 0 600
7.938E+10 9.340E+09 z z 14112100
Iy(self) = 8.872E+10 mm4
zL = 1731.6 132.41300
Iy(slab) = 6.827E+11
Iy(comp) = 7.9244E+11 Y
Ix3200
Tav = 203.3 mm 250Bav = 366.2 mm
Portion no. b d 3.b3.d3
mm mm 10(b2+d2) 1250 Tav1 3200 250 8.33E+092 1250 203 3.07E+09 2100 6003 600 1530 8.60E+104 1000 366.206897 1.30E+10 Bav
Ix (mm4) = 1.10E+11
1250
1000
for deck slab Ix = b x d3 / 61000
Self Composite
11
2
3
4
1
2
3
4
5
11
2
3
4
1
2
3
4
5

Consulting Engineers Group Ltd., Jaipur_________________________________________________________________________
Bridge Design Report_______________________________________________________________________________
GIRDER ( INNER)AT MID SPAN
Depth (mm) 2100 Depth (mm) 2350Area (mm2) 1106250 Deck slab Area (mm2) 1806250Iz (mm4) 6.23E+11 250 Iz (mm4) 1.26046E+12Yb(mm) 1008.95 + mm Yb(mm) 1480.2Yt(mm) 1091.05 thick and Yt(mm) 869.8Zb(mm3) 6.173E+08 2800 Zb(mm3) 8.515E+08Zt(mm3) 5.709E+08 mm wide. Zt(mm3) 1.449E+09Concrete M- 40 Concrete M- 40
Iy Y 2800Element Iself = bd3/12 Az
2 1400 1400mm4 mm4
1 2.441E+10 0 2502 1.030E+09 7.019E+09 1503 2.860E+09 0 1604 6.351E+08 5.805E+095 2.500E+10 0 275
5.394E+10 1.282E+10 z 2100 z 1250
Iy(self) = 6.676E+10 mm4
zL = 1400.0 240300
Iy(slab) = 4.573E+11
Iy(comp) = 5.241E+11Y
Ix2800
Tav = 230.0 mm 250Bav = 420.0 mm
Portion no. b d 3.b3.d3
mm mm 10(b2+d2) 1250 Tav1 2800 250 7.29E+092 1250 230 4.41E+09 2100 2753 275 1450 8.73E+094 1000 420 1.89E+10 Bav
Ix (mm4) = 3.93E+10
1000
1250
1000
for deck slab Ix = b x d3 / 6
SECTION PROPERTIES
Self Composite
1
2
3
4
1
2
33
4
5

Consulting Engineers Group Ltd., Jaipur_________________________________________________________________________
Bridge Design Report_______________________________________________________________________________
AT SUPPORT
Iz
Depth (mm) 2100 Depth (mm) 2350Area (mm2) 1538649.43 Deck slab Area (mm2) 2238649Iz (mm4) 6.93E+11 250 Iz (mm4) 1.36228E+12
Yb(mm) 1048.92 + mm Yb(mm) 1416.7Yt(mm) 1051.08 thick and Yt(mm) 933.3Zb(mm3) 6.608E+08 2800 Zb(mm3) 9.616E+08Zt(mm3) 6.595E+08 mm Zt(mm3) 1.460E+09W (kN/m) 38.5 wide.Concrete M- 40 Concrete M- 40
Iy Y2800
Element Iself = bd3/12 Az2 1400 1400
mm4 mm4
1 2.441E+10 0 2502 2.034E+08 5.780E+09 1503 2.970E+10 0 1074 5.885E+07 3.560E+095 2.500E+10 0 600
7.938E+10 9.340E+09 z z 14112100
Iy(self) = 8.872E+10 mm4
zL = 1400.0 132.41300
Iy(slab) = 4.573E+11
Iy(comp) = 5.4605E+11 Y
Ix2800
Tav = 203.3 mm 250Bav = 366.2 mm
Portion no. b d 3.b3.d3
mm mm 10(b2+d2) 1250 Tav1 2800 250 7.29E+092 1250 203 3.07E+09 2100 6003 600 1530 8.60E+104 1000 366.206897 1.30E+10 Bav
Ix (mm4) = 1.09E+11
1250
1000
for deck slab Ix = b x d3 / 61000
Self Composite
11
2
3
4
1
2
3
4
5
11
2
3
4
1
2
3
4
5

Consulting Engineers Group Ltd., Jaipur_________________________________________________________________________
Bridge Design Report_______________________________________________________________________________
Cross member At End Supp.
2955Area (Ax) = 2955 x 250
+ 1800 x 450 1080 1875.0
= 1548750 mm2
250
yb = 1389 mm1800 2050
yt = 661 mm
Element Iself = bd3/12 Az2
mm4 mm4
1 3.848E+09 2.123E+11 4502 2.187E+11 1.9363E+11
2.225E+11 4.0593E+11
Iz = 6.285E+11 mm4
yl = 1270 mm
yr = 1685 mm
Element Iself = bd3/12 Ay2
mm4 mm4
1 5.376E+11 3.19E+102 1.367E+10 2.91E+10
5.512E+11 6.10E+10
Iy = 6.123E+11 mm4
Element b d 3.b3.d3
mm mm 10*(b2+d2)1 2955 250 7.695E+092 450 1800 4.631E+10
Ix = 5.401E+10 mm4
Iz
Ix
Iy
1
2

Consulting Engineers Group Ltd., Jaipur_________________________________________________________________________
Bridge Design Report_______________________________________________________________________________
Cross member At Intermediate Supp.
3750Area (Ax) = 3750 x 250
+ 1800 x 300 1875.00 1875.0
= 1477500 mm2
250
yb = 1550 mm1800 2050
yt = 500 mm
Element Iself = bd3/12 Az2
mm4 mm4
1 4.883E+09 1.3157E+11 3002 1.458E+11 2.2842E+11
1.507E+11 3.5999E+11
Iz = 5.107E+11 mm4
yl = 1875 mm
yr = 1875 mm
Element Iself = bd3/12 Ay2
mm4 mm4
1 1.099E+12 0.00E+002 4.050E+09 0.00E+00
1.103E+12 0.00E+00
Iy = 1.103E+12 mm4
Element b d 3.b3.d3
mm mm 10*(b2+d2)1 3750 250 9.766E+092 300 1800 1.419E+10
Ix = 2.395E+10 mm4
Iy
Ix
Iz
1
2

Consulting Engineers Group Ltd., Jaipur_________________________________________________________________________
Bridge Design Report_______________________________________________________________________________
GIRDER ( inner)AT 1/8 TH SPAN
Depth (mm) 2100 Depth (mm) 2350Area (mm2) 1315912.36 Deck slab Area (mm2) 2015912Iz (mm4) 6.559E+11 250 Iz (mm4) 1.30906E+12Yb(mm) 1032.73 + mm Yb(mm) 1446.7Yt(mm) 1067.27 thick and Yt(mm) 903.3Zb(mm3) 6.351E+08 2800 Zb(mm3) 9.048E+08Zt(mm3) 6.145E+08 mm wide. Zt(mm3) 1.449E+09Concrete M- 40 Concrete M- 40
100
Iy Y 2800Element Iself = bd3/12 Az
2 1400 1400mm4 mm4
1 2.441E+10 0 2502 4.966E+08 6.794E+09 1503 1.151E+10 0 133.334 2.301E+08 5.114E+095 2.500E+10 0 437.5
6.166E+10 1.191E+10 z 2100 z 1330.5
Iy(self) = 7.356E+10 mm4
zL = 1400.0 186.21300
Iy(slab) = 4.573E+11
Iy(comp) = 5.309E+11Y
Ix2800
Tav = 216.7 mm 250Bav = 393.1 mm
Portion no. b d 3.b3.d3
mm mm 10(b2+d2) 1250 Tav1 2800 250 7.29E+092 1250 217 3.70E+09 2100 437.503 438 1490 3.45E+104 1000 393.103448 1.58E+10 Bav
Girder only 5.395E+10
Ix (mm4) = 6.12E+10
1000
1250
1000
for deck slab Ix = b x d3 / 6
Self Composite
1
2
3
4
1
2
33
4
5
1

Consulting Engineers Group Ltd., Jaipur_________________________________________________________________________
Bridge Design Report_______________________________________________________________________________
GIRDER ( Outer)AT 1/8 TH SPAN
Depth (mm) 2100 Depth (mm) 2350Area (mm2) 1315912.36 Deck slab Area (mm2) 2115912Iz (mm4) 6.56E+11 250 Iz (mm4) 1.36729E+12Yb(mm) 1032.73 + mm Yb(mm) 1483.5Yt(mm) 1067.27 thick and Yt(mm) 866.5Zb(mm3) 6.351E+08 3200 Zb(mm3) 9.217E+08Zt(mm3) 6.145E+08 mm wide. Zt(mm3) 1.578E+09Concrete M- 40 Concrete M- 40
100
Iy Y 3200Element Iself = bd3/12 Az
2 1800 1400mm4 mm4
1 2.441E+10 0 2502 4.966E+08 6.794E+09 1503 1.151E+10 0 133.334 2.301E+08 5.114E+095 2.500E+10 0 437.5
6.166E+10 1.191E+10 z 2100 z 1330.5
Iy(self) = 7.356E+10 mm4
zL = 1724.4 186.21300
Iy(slab) = 6.827E+11
Iy(comp) = 7.7613E+11Y
Ix3200
Tav = 216.7 mm 250Bav = 393.1 mm
Portion no. b d 3.b3.d3
mm mm 10(b2+d2) 1250 Tav1 3200 250 8.33E+092 1250 217 3.70E+09 2100 437.503 438 1490 3.45E+104 1000 393.103448 1.58E+10 Bav
Ix (mm4) = 6.23E+10
1000
1250
1000
for deck slab Ix = b x d3 / 6
Self Composite
1
2
3
4
1
2
33
4
5
1

Consulting Engineers Group Ltd., Jaipur_________________________________________________________________________
Bridge Design Report_______________________________________________________________________________
GIRDER (Inner)at effective depth d
Depth (mm) 2100 Depth (mm) 2350Area (mm2) 1538649.43 Deck slab Area (mm2) 2238649Iz (mm4) 6.932E+11 250 Iz (mm4) 1.36228E+12Yb(mm) 1048.92 + mm Yb(mm) 1416.7Yt(mm) 1051.08 thick and Yt(mm) 933.3Zb(mm3) 6.608E+08 2800 Zb(mm3) 9.616E+08Zt(mm3) 6.595E+08 mm wide. Zt(mm3) 1.460E+09Concrete M- 40 Concrete M- 40
Iy Y 2800Element Iself = bd3/12 Az
2 1400 1400mm4 mm4
1 2.441E+10 0 2502 2.034E+08 5.780E+09 1503 2.970E+10 0 106.674 5.885E+07 3.560E+095 2.500E+10 0 600.0
7.938E+10 9.340E+09 z 2100 z 1410.9
Iy(self) = 8.872E+10 mm4
zL = 1400.0 132.41300
Iy(slab) = 4.573E+11
Iy(comp) = 5.4605E+11Y
Ix2800
Tav = 203.3 mm 250Bav = 366.2 mm
Portion no. b d 3.b3.d3
mm mm 10(b2+d2) 1250 Tav1 2800 250 7.29E+092 1250 203 3.07E+09 2100 6003 600 1530 8.60E+104 1000 366.206897 1.30E+10 Bav
Girder only 1.020E+11
Ix (mm4) = 1.09E+11
1000
Self Composite
1250
1000
for deck slab Ix = b x d3 / 6
1
2
3
4
1
2
33
4
5

Consulting Engineers Group Ltd., Jaipur_________________________________________________________________________
Bridge Design Report_______________________________________________________________________________
GIRDER ( Outer)AT effective depth d
Depth (mm) 2100 Depth (mm) 2350Area (mm2) 1538649.43 Deck slab Area (mm2) 2338649Iz (mm4) 6.93E+11 250 Iz (mm4) 1.42534E+12Yb(mm) 1048.92 + mm Yb(mm) 1451.2Yt(mm) 1051.08 thick and Yt(mm) 898.8Zb(mm3) 6.608E+08 3200 Zb(mm3) 9.822E+08Zt(mm3) 6.595E+08 mm wide. Zt(mm3) 1.586E+09Concrete M- 40 Concrete M- 40
100
Iy Y 3200Element Iself = bd3/12 Az
2 1800 1400mm4 mm4
1 2.441E+10 0 2502 2.034E+08 5.780E+09 1503 2.970E+10 0 106.674 5.885E+07 3.560E+095 2.500E+10 0 600.0
7.938E+10 9.340E+09 z 2100 z 1410.9
Iy(self) = 8.872E+10 mm4
zL = 1731.6 132.41300
Iy(slab) = 6.827E+11
Iy(comp) = 7.9244E+11Y
Ix3200
Tav = 203.3 mm 250Bav = 366.2 mm
Portion no. b d 3.b3.d3
mm mm 10(b2+d2) 1250 Tav1 3200 250 8.33E+092 1250 203 3.07E+09 2100 6003 600 1530 8.60E+104 1000 366.206897 1.30E+10 Bav
Ix (mm4) = 1.10E+11
1000
1250
1000
for deck slab Ix = b x d3 / 6
Self Composite
1
2
3
4
1
2
33
4
5
1

Consulting Engineers Group Ltd., Jaipur_________________________________________________________________________
Bridge Design Report_______________________________________________________________________________
FOR MEMBERS 107 TO 112 116 to 122 126 TO 132 136 to1411875.00 1875.00
Area Ax =3.75 x 0.25 = 0.9375 m2
Ix = 3.75 x 0.25 3 = 0.009766 m4
6
Iy = 0.25 x 3.75 3 = 1.098633 m4
12
Iz = 3.75 x 0.25 3 = 0.004883 m4
12
FOR MEMBERS 102 106 142 1461080 1875.00
Area Ax =2.955 x 0.25 = 0.73875 m2
Ix = 2.955 x 0.25 3 = 0.007695 m4
6
Iy = 0.25 x 2.955 3 = 0.537565 m4
12
Iz = 2.955 x 0.25 3 = 0.003848 m4
12
Summary of member PropertiesDue to Composite
Member No. AX IX IZ
0.001 0.0001 0.00011.906 0.0404 1.31351.806 0.0393 1.2605
17 31 65 792.339 0.1104 1.42532.239 0.1093 1.36232.122 0.0754 1.36942.022 0.0743 1.31141.549 0.0540 0.62851.478 0.0240 0.51070.938 0.0098 0.00490.001 0.0001 0.00010.739 0.0077 0.0038
97 to 101 147 to 151102 106 142 146
19 TO 21 28 TO 30 67TO 69 76 TO 7835 TO 37 44 TO 46 51 TO 53 60 TO 62103 to 105 143 to 145123 to 125 113 to 115 133 to 135
250
250
1 to 16,81 to 9622 to 27 70 to 7538 to 43 54 to 59
18 32 66 8033 34 47 to 50 63 64
107 to 112 116 to 122 126 to 132 136 to141

Consulting Engineers Group Ltd., Jaipur_________________________________________________________________________
Bridge Design Report______________________________________________________________________________________________
Self Weight of girder 316.27 316.27 316.27 316.27
Weight of deck slab 223.83 223.83 223.83 223.83
Weight of the shuttering 55.96 55.96 55.96 55.96
Weight of Diaphragm 44.63 44.63 44.63 44.63
SIDL 163.3 164.96 164.96 163.3
LIVE LOAD (Max) 238.92 177.7 146.88 123.46
Total 1042.91 983.35 952.53 927.45
SectionB.M. SF BM SF BM SF BM SF BM SF(t.m.) (t) (t.m.) (t) (t.m.) (t) (t.m.) (t) (t.m.) (t)
BM(tm) SF(t) BM(tm) SF(t)
1 - 1 316.27 0.00 223.83 0 55.96 0 44.63 1.49 163.3 2 238.92 7.65 198.15 12.22
2 - 2 296.83 10.37 209.77 7.5 52.44 1.88 39.05 1.49 164.75 8.6 207.59 8.94 195.41 13.7
3 - 3 238.50 20.74 167.58 15 41.9 3.75 33.47 4.46 126.54 10.3 175.11 21.94 170.34 22.64
4 - 4 141.29 31.11 97.27 22.5 24.32 5.62 16.74 4.46 81.97 20.35 89.10 23.89 88.84 23.95
5 - 5 92.26 36.06 62.24 25.42 15.56 6.36 10.21 4.46 51.3 21.61 54.36 23.76 54.05 24.46
SUMMARY OF BENDING MOMENT AT MID SPAN
SUMMARY OF BENDING MOMENT & SHEAR FORCES AT DIFFERENT SECTIONS OF G-1
Loads G1 G2 G3 G4
SHUTTERING WT. OF DIAPHRAGM SIDL
Hence Girder G-1 shall be designed and rest of the girders will be kept same as that of G-1
DL OF DECK SLABDL OF GIRDER LIVE LOADMax. Shear &Corres. BM
Max B.M. &Corres. SF

Consulting Engineers Group Ltd., Jaipur_________________________________________________________________________
Bridge Design Report_______________________________________________________________________________
No of Prestressing Cables = 7Type of cable = 12 -T-13Type of Sheathing = Bright MetalX-sectional area of each cable, As = 11.844 cm2
Modulus of elasticity of prestressing steel, Es = t/m2
= (1.95 Mpa x 105 )Span length bearing to bearing = 30.000 mWobble coefficient k = 0.0046Friction coefficient µ = 0.2500Expected slip, s = 6.0 mmHalf slip area (= 0.5 x As x Es x s) = 70.64 tm Grip length inside the jack = 0.350 mExtra length of cable required for jack attachment = 0.750 mUTS of Cable = 224.71 tJacking End Force = 70.0 % of UTSDia of Duct = 75 mm
CABLE PROFILE
Jacking StressingCABLE force (t) stage
1 1.000 14.250 0.000 0.000 0.300 0.115 0.000 157.30 12 1.000 14.250 0.000 0.000 0.300 0.115 0.000 157.30 13 1.000 8.250 0.000 6.000 0.600 0.115 0.000 157.30 14 1.000 8.250 0.000 6.000 0.900 0.265 0.000 157.30 15 1.000 14.250 0.000 0.000 1.200 0.415 0.000 157.30 26 1.000 14.250 0.000 0.000 1.500 0.565 0.000 157.30 27 1.000 14.250 0.000 0.000 1.800 0.715 0.000 157.30 1
CALCULATION FOR LENGTHS AND CUMULATIVE ANGLES
CABLE A to B A to C A to D A to E A to F �c �d �e=�f
(m) (m) (m) (m) (m) (rad) (rad) (rad)1 1.000 15.251 15.251 15.251 15.251 32.003 0.0228 0.0228 0.02282 1.000 15.251 15.251 15.251 15.251 32.003 0.0228 0.0228 0.02283 1.004 9.267 9.267 9.267 15.267 32.034 0.0944 0.0944 0.09444 1.008 9.279 9.279 9.279 15.279 32.058 0.1233 0.1233 0.12335 1.005 15.277 15.277 15.277 15.277 32.054 0.0963 0.0963 0.09636 1.007 15.288 15.288 15.288 15.288 32.076 0.1146 0.1146 0.11467 1.009 15.301 15.301 15.301 15.301 32.102 0.1328 0.1328 0.1328
* Total length of cable includes 750mm extra gripping length required for jack attachment.� is total angular change w.r.t. node A
Length* of cable
CALCULATION FOR FRICTION AND SLIP LOSSES
The cable is assumed to have a straight portion near ends followed by a parabolic profile. Theparabolic profile is followed by plan bending. Cable profile for plan bending is assumed to be made up oftwo parabola. Near midspan it has a small horizontal.
1.988E+07
a = Horr.Length ofinclined Portion in m.
b = Horr. Length ofparabolic Portion in m.
m = planbending in m.
h3 = Y co-ordinate Atmid span
c = Horr. Length of planbend. Portion inm.
d =Length ofstrait Port-ion in m.
H = Y co-ordinate Atjacking end

Consulting Engineers Group Ltd., Jaipur_________________________________________________________________________
Bridge Design Report_______________________________________________________________________________
FORCES IN CABLES AFTER FRICTION ONLYCABLE k FA FB FC FD FE FF
(t) (t) (t) (t) (t) (t)1 7.99E-04 157.30 156.57 145.81 145.81 145.81 145.81 151.572 7.99E-04 157.30 156.57 145.81 145.81 145.81 145.81 151.573 5.74E-03 157.30 156.57 147.22 147.22 147.22 143.21 149.604 7.51E-03 157.30 156.57 146.15 146.15 146.15 142.17 148.905 3.39E-03 157.30 156.57 143.13 143.13 143.13 143.13 150.326 4.04E-03 157.30 156.57 142.47 142.47 142.47 142.47 150.017 4.69E-03 157.30 156.57 141.82 141.82 141.82 141.82 149.70
k is coefficient of parabolic equation y = k x2 (in vertical plane)
SLIP DISTANCE CALCULATIONCABLE AB BC CD DE EF F2 F1 d Fp (t)
1 -70.28 17.22 17.22 17.22 17.22 156.57 145.81 14.25 147.002 -70.28 17.22 17.22 17.22 17.22 156.57 145.81 14.25 147.003 -70.27 -22.24 -22.24 -22.24 26.92 147.22 143.21 6.00 145.164 -70.27 -16.68 -16.68 -16.68 32.17 146.15 142.17 6.00 144.565 -70.27 39.12 39.12 39.12 39.12 156.57 143.13 14.27 145.986 -70.27 44.57 44.57 44.57 44.57 156.57 142.47 14.28 145.747 -70.27 50.00 50.00 50.00 50.00 156.57 141.82 14.29 145.52
FORCES IN CABLES AFTER SLIPCable Slip
distanceFA (t) FB (t) FC (t) FD (t) FE (t) FF (t) Avg.
Force (t)Elongation
(mm)1 13.676 136.70 137.42 145.81 145.81 145.81 145.81 141.32 100.512 13.676 136.70 137.42 145.81 145.81 145.81 145.81 141.32 100.513 12.348 133.02 133.75 143.10 143.10 143.10 143.21 139.95 99.344 11.680 131.82 132.55 142.97 142.97 142.97 142.17 139.28 98.965 12.259 134.65 135.38 143.13 143.13 143.13 143.13 138.98 99.876 11.976 134.19 134.92 142.47 142.47 142.47 142.47 138.42 99.747 11.714 133.75 134.48 141.82 141.82 141.82 141.82 137.88 99.62
FORCES IN CABLES AT SECTION 1-1 (MIDSPAN) AFTER SLIPCable no Stage Length of � � Co-ord P Pcos� Psin�
cable from (rad) (rad) from (t) (t) (t)midspan bottom
1 1 0.00 0.00 0.00 0.115 145.81 145.81 0.002 1 0.00 0.00 0.00 0.115 145.81 145.81 0.003 1 0.00 0.00 0.00 0.115 143.21 143.21 0.004 1 0.00 0.00 0.00 0.265 142.17 142.17 0.005 2 0.00 0.00 0.00 0.415 143.13 143.13 0.006 2 0.00 0.00 0.00 0.565 142.47 142.47 0.007 1 0.00 0.00 0.00 0.715 141.82 141.82 0.00
��is angle of cable in vertical plane w.r.t. soffit slab��is angle of cable in horizontal plane
Stage 1 Total horizontal force = 718.8 tecc wrt bottom = 0.263 mTotal vertical force = 0.000 t
Stage 2 Total horizontal force = 285.6 tecc wrt bottom = 0.490 mTotal vertical force = 0.00 t
Average Force (t)
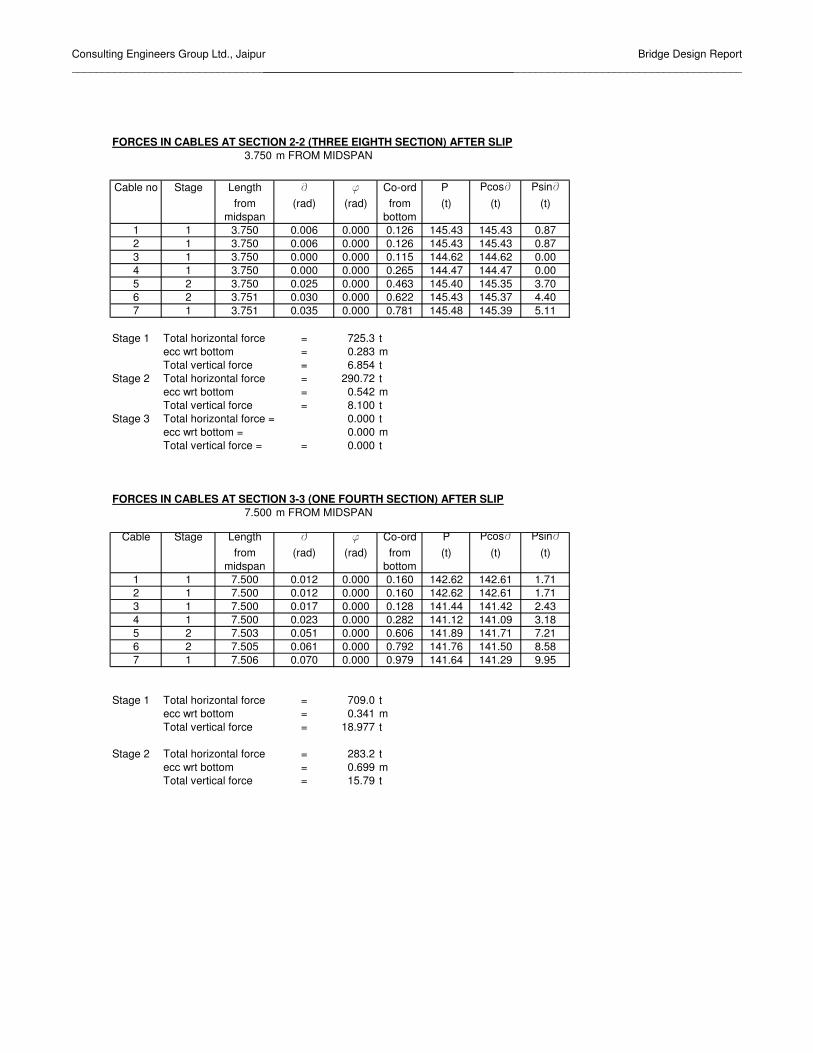
Consulting Engineers Group Ltd., Jaipur_________________________________________________________________________
Bridge Design Report_______________________________________________________________________________
FORCES IN CABLES AT SECTION 2-2 (THREE EIGHTH SECTION) AFTER SLIP3.750 m FROM MIDSPAN
Cable no Stage Length � � Co-ord P Pcos� Psin�from (rad) (rad) from (t) (t) (t)
midspan bottom1 1 3.750 0.006 0.000 0.126 145.43 145.43 0.872 1 3.750 0.006 0.000 0.126 145.43 145.43 0.873 1 3.750 0.000 0.000 0.115 144.62 144.62 0.004 1 3.750 0.000 0.000 0.265 144.47 144.47 0.005 2 3.750 0.025 0.000 0.463 145.40 145.35 3.706 2 3.751 0.030 0.000 0.622 145.43 145.37 4.407 1 3.751 0.035 0.000 0.781 145.48 145.39 5.11
Stage 1 Total horizontal force = 725.3 tecc wrt bottom = 0.283 mTotal vertical force = 6.854 t
Stage 2 Total horizontal force = 290.72 tecc wrt bottom = 0.542 mTotal vertical force = 8.100 t
Stage 3 Total horizontal force = 0.000 tecc wrt bottom = 0.000 mTotal vertical force = = 0.000 t
FORCES IN CABLES AT SECTION 3-3 (ONE FOURTH SECTION) AFTER SLIP7.500 m FROM MIDSPAN
Cable Stage Length � � Co-ord P Pcos� Psin�from (rad) (rad) from (t) (t) (t)
midspan bottom1 1 7.500 0.012 0.000 0.160 142.62 142.61 1.712 1 7.500 0.012 0.000 0.160 142.62 142.61 1.713 1 7.500 0.017 0.000 0.128 141.44 141.42 2.434 1 7.500 0.023 0.000 0.282 141.12 141.09 3.185 2 7.503 0.051 0.000 0.606 141.89 141.71 7.216 2 7.505 0.061 0.000 0.792 141.76 141.50 8.587 1 7.506 0.070 0.000 0.979 141.64 141.29 9.95
Stage 1 Total horizontal force = 709.0 tecc wrt bottom = 0.341 mTotal vertical force = 18.977 t
Stage 2 Total horizontal force = 283.2 tecc wrt bottom = 0.699 mTotal vertical force = 15.79 t

Consulting Engineers Group Ltd., Jaipur_________________________________________________________________________
Bridge Design Report_______________________________________________________________________________
FORCES IN CABLES AT SECTION 4-4 (ONE EIGHTH SECTION) AFTER SLIP11.250 m FROM MIDSPAN
Cable Stage Length � � Co-ord P Pcos� Psin�from (rad) (rad) from (t) (t)
midspan bottom1 1 11.251 0.0180 0.000 0.216 139.75 139.729 2.5122 1 11.251 0.0180 0.000 0.216 139.75 139.729 2.5123 1 11.253 0.0602 0.000 0.273 137.21 136.965 8.2584 1 11.255 0.0788 0.000 0.472 136.41 135.985 10.7445 2 11.261 0.0763 0.000 0.844 138.30 137.902 10.5396 2 11.265 0.0909 0.000 1.076 137.99 137.419 12.5197 1 11.271 0.1054 0.000 1.308 137.69 136.923 14.489
Stage 1 Total horizontal force = 689.3 tecc wrt bottom = 0.495 mTotal vertical force = 38.515 t
Stage 2 Total horizontal force = 275.32 tecc wrt bottom = 0.960 mTotal vertical force = 23.058 t
FORCES IN CABLES AT SECTION 5-5 (Effective depth d) AFTER SLIP12.713 m FROM MIDSPAN
Cable no Stage Length � � Co-ord P Pcos� Psin�from (rad) (rad) from (t) (t) (t)
midspan bottom1 1 12.713 0.020 0.000 0.244 138.62 138.59 2.822 1 12.713 0.020 0.000 0.244 138.62 138.59 2.823 1 12.719 0.077 0.000 0.373 135.53 135.13 10.434 1 12.724 0.101 0.000 0.603 134.53 133.84 13.545 2 12.728 0.086 0.000 0.963 136.88 136.37 11.786 2 12.735 0.103 0.000 1.218 136.49 135.77 13.997 1 12.743 0.119 0.000 1.472 136.12 135.15 16.18
Stage 1 Total horiontal force = 681.3 t TRUEecc wrt bottom = 0.584 mTotal vertical force = 45.772 t 0.00E+00
Stage 2 Total horiontal force = 272.1 tecc wrt bottom = 1.090 mTotal vertical force = 25.77 t

Consulting Engineers Group Ltd., Jaipur_________________________________________________________________________
Bridge Design Report_______________________________________________________________________________
STRESS CHECK AT VARIOUS SECTIONS
Type of cable = 12-T-13Area of each cable = 1184.4 sq.mmUTS of one cable = 224.7 tJacking stress = 70.0% of UTSJacking force = 157.29 t
== 1.95E+05 MPa = 1.99E+07 t/m2
Grade of concrete = M - 40fck = 40 N/mm2
= 5700x(fck)1/2
= 3.22E+04 MPa = 3.29E+06 t/m2 (At 4th Day)
3.60E+04 MPa = 3.68E+06 t/m2 (At 28th Day)
fcj at release = 32 MPaMaturity of concrete at the time of release as % of fck = 80.00 %Ec = 5700x(fcj)
1/2 = 3.22E+04 MPa = 3.29E+06 t/m2
Creep strain (per 10MPa) as per Table 2 of IRC:18 - 2000From 14th day (80% maturity) to 28th day (100% maturity)Creep strain for 80% maturity 0.000510Creep strain for 100% maturity 0.000400Differential Creep strain between 14th and 28th day = 0.000110Residual Creep strain 28th day onward = 0.000400
Residual shrinkage strain as per Table 3 of IRC:18 - 2000Residual Shrinkage strain (εs) at 14th day = 0.00025Residual Shrinkage strain (εs) at 28th day = 0.00019Therefore, Shrinkage strain (εs)between 14th & 28th day 0.00006Residual Shrinkage strain 28th day onward 0.00019
Loss due to Relaxation for low Relaxation steel as per Table 4A of IRC:18 - 2000at average initial force of 0.5 fp is 0 MPaat average initial force of 0.7 fp is 97 MPaat average initial force of 0.8 fp is 200 MPa
Modulus of Elasticity of Concrete, Ec
Modulus of Elasticity of HTS, Es
The girders shall be cast on the ground near bridge site. The stressing shall be done when cubestrength of concrete reached 32 MPa. Thereafter the girders will be launched / shifted to the bridgelocation and placed on permanent bearings and deck slab & diaphragm shall be casted.
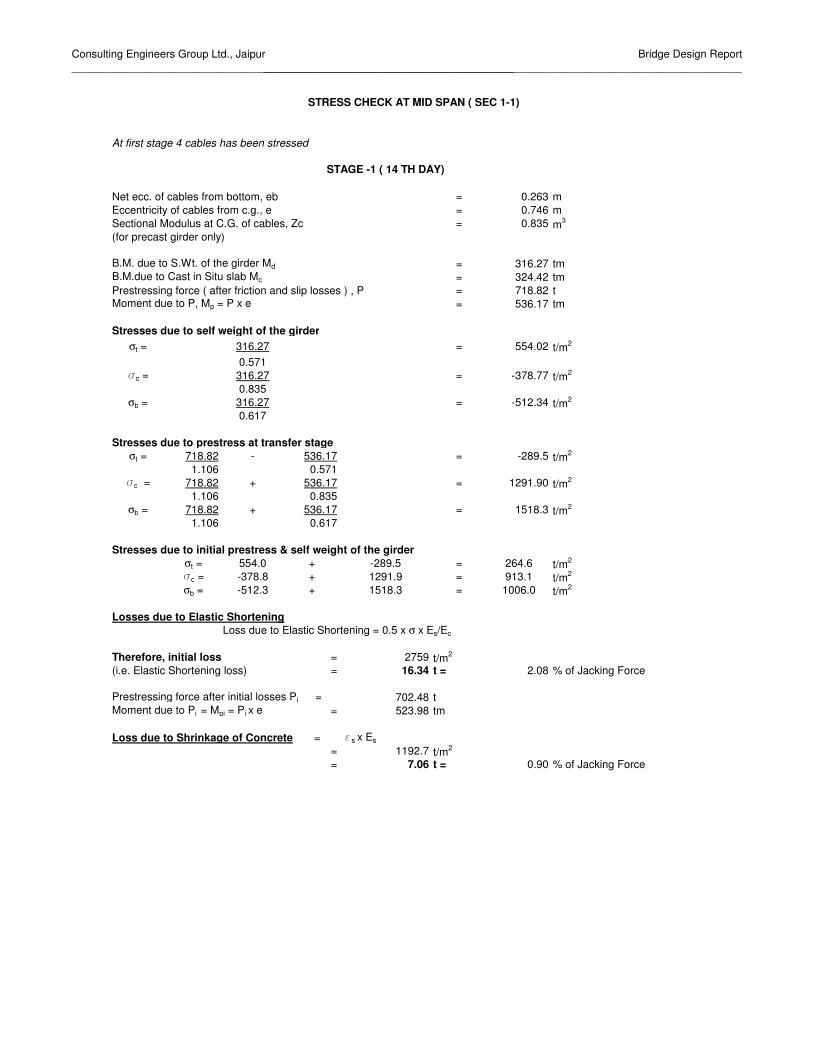
Consulting Engineers Group Ltd., Jaipur_________________________________________________________________________
Bridge Design Report_______________________________________________________________________________
At first stage 4 cables has been stressed
Net ecc. of cables from bottom, eb = 0.263 mEccentricity of cables from c.g., e = 0.746 mSectional Modulus at C.G. of cables, Zc = 0.835 m3
(for precast girder only)
B.M. due to S.Wt. of the girder Md = 316.27 tmB.M.due to Cast in Situ slab Mc = 324.42 tmPrestressing force ( after friction and slip losses ) , P = 718.82 tMoment due to P, Mp = P x e = 536.17 tm
Stresses due to self weight of the girderσt = 316.27 = 554.02 t/m2
0.571�c = 316.27 = -378.77 t/m2
0.835σb = 316.27 = -512.34 t/m2
0.617
Stresses due to prestress at transfer stageσt = 718.82 - 536.17 = -289.5 t/m2
1.106 0.571�c = 718.82 + 536.17 = 1291.90 t/m2
1.106 0.835σb = 718.82 + 536.17 = 1518.3 t/m2
1.106 0.617
Stresses due to initial prestress & self weight of the girderσt = 554.0 + -289.5 = 264.6 t/m2
�c = -378.8 + 1291.9 = 913.1 t/m2
σb = -512.3 + 1518.3 = 1006.0 t/m2
Losses due to Elastic ShorteningLoss due to Elastic Shortening = 0.5 x σ x Es/Ec
Therefore, initial loss = 2759 t/m2
(i.e. Elastic Shortening loss) = 16.34 t = 2.08 % of Jacking Force
Prestressing force after initial losses Pi = 702.48 tMoment due to Pi = Mpi = Pi x e = 523.98 tm
Loss due to Shrinkage of Concrete = �s x Es
= 1192.7 t/m2
= 7.06 t = 0.90 % of Jacking Force
STRESS CHECK AT MID SPAN ( SEC 1-1)
STAGE -1 ( 14 TH DAY)

Consulting Engineers Group Ltd., Jaipur_________________________________________________________________________
Bridge Design Report_______________________________________________________________________________
Loss due to relaxation of steelThe loss due to relaxation of steel depends on the stress in HTS after initial losses.Ratio of average force to UTS = 0.685Loss due to friction & slip = 786.4653 - 718.8 = 67.6 t% friction and slip loss = 67.6 x 100 = 6.021 %
786.465Ratio of average force to UTS = 0.685 - 0.060 = 0.625
Corresponding Relaxation Loss = 6195.8 t/m2
= 36.69 t 4.67 % of Jacking Force
Loss due to Relaxation & Shrinkage = 43.75 tMoment due to Relaxation & Shrinkage loss = 32.637 tm
Stresses due to Prestress after initial lossesσt = 702.48 - 523.98 = -282.88 t/m2
1.106 0.571�c = 702.48 + 523.98 = 1262.5 t/m2
1.106 0.835 σb = 702.48 + 523.98 = 1483.8 t/m2
1.106 0.617
Stresses due to prestress after initial losses & self weight of the girderσt = 554.0 + -282.9 = 271.1 t/m2
�c = -378.8 + 1262.5 = 883.8 t/m2
σb = -512.3 + 1483.8 = 971.5 t/m2
Stresses after Shrinkage and Relaxation lossesσt = 271.15 - 43.75 + 32.637 = 288.77 t/m2
1.106 0.571�c = 883.8 - 43.75 - 32.637 = 805.13 t/m2
1.106 0.835σb = 971.49 - 43.75 - 32.637 = 879.07 t/m2
1.106 0.617
Loss due to Creep of concrete
Airthmetic mean of initial and final stress between 14th = 844.44 t/m2
and 28 days at C.G. of cablesCreep loss = (σ/10) x εc x Εs = 1810.2 t/m2
= 10.72 t = 1.363 % of Jacking Force
Total Initial & Intermediate losses = 70.82 t = 9.00 % of Jacking Force(i.e. losses upto 28th day)Force after intermediate losses, Pint = 648.0 tMoment due to Pint = Mpint = Pint x e = 483.35 tm
Effect of prestress after Intermediate loss
σt = 648.0 - 483.35 = -260.9 t/m2
1.106 0.571�c = 648.0 + 483.35 = 1164.6 t/m2
1.106 0.835 σb = 648.0 + 483.35 = 1368.8 t/m2
1.106 0.617
Stresses Due to cast-in-situ slabσt = 324.4 = 568.30 t/m2
0.571
�c = 324.4 = -388.53 t/m2
0.835σb = 324.4 = -525.54 t/m2
0.617
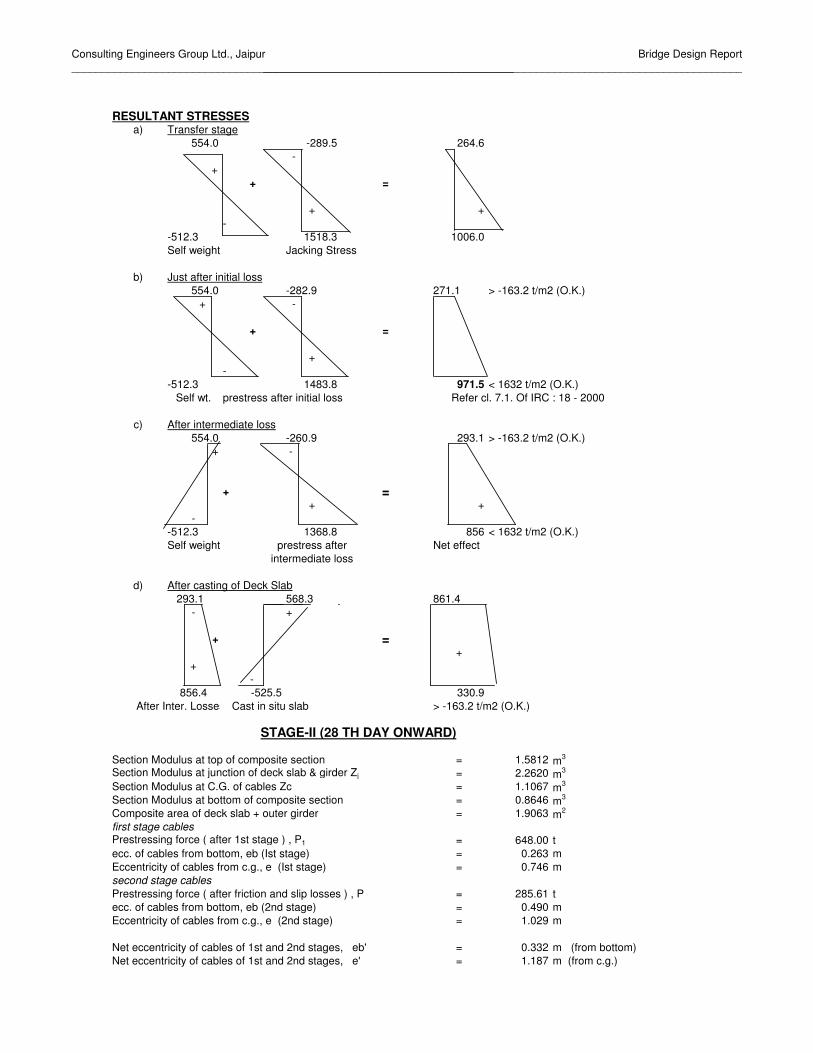
Consulting Engineers Group Ltd., Jaipur_________________________________________________________________________
Bridge Design Report_______________________________________________________________________________
RESULTANT STRESSESa) Transfer stage
554.0 -289.5 264.6 -
++ =
+ +-
-512.3 1518.3 1006.0Self weight Jacking Stress
b) Just after initial loss554.0 -282.9 271.1 > -163.2 t/m2 (O.K.)
+ -
+ =
+-
-512.3 1483.8 971.5 < 1632 t/m2 (O.K.)Self wt. prestress after initial loss Refer cl. 7.1. Of IRC : 18 - 2000
c) After intermediate loss554.0 -260.9 293.1 > -163.2 t/m2 (O.K.)
+ -
+ =+ +
--512.3 1368.8 856 < 1632 t/m2 (O.K.)Self weight prestress after Net effect
intermediate loss
d) After casting of Deck Slab293.1 568.3 861.4
- +
+ =+
+-
856.4 -525.5 330.9 After Inter. Losses Cast in situ slab > -163.2 t/m2 (O.K.)
Section Modulus at top of composite section = 1.5812 m3
Section Modulus at junction of deck slab & girder Zj = 2.2620 m3
Section Modulus at C.G. of cables Zc = 1.1067 m3
Section Modulus at bottom of composite section = 0.8646 m3
Composite area of deck slab + outer girder = 1.9063 m2
first stage cablesPrestressing force ( after 1st stage ) , P1 = 648.00 tecc. of cables from bottom, eb (Ist stage) = 0.263 mEccentricity of cables from c.g., e (Ist stage) = 0.746 msecond stage cablesPrestressing force ( after friction and slip losses ) , P = 285.61 tecc. of cables from bottom, eb (2nd stage) = 0.490 mEccentricity of cables from c.g., e (2nd stage) = 1.029 m
Net eccentricity of cables of 1st and 2nd stages, eb' = 0.332 m (from bottom)Net eccentricity of cables of 1st and 2nd stages, e' = 1.187 m (from c.g.)
STAGE-II (28 TH DAY ONWARD)

Consulting Engineers Group Ltd., Jaipur_________________________________________________________________________
Bridge Design Report_______________________________________________________________________________
B.M. due to S.Wt. of the girder Md = 316.27 tmB.M.due to Cast in Situ slab Mc (without shuttering) = 268.46 tmB.M. due to SIDL Ms = 163.30 tmB.M. due to Live loads ML = 238.92 tmB.M. due to FPLL = 0.00 tm
Prestressing force ( after 1st stage ) , P1 = 648.00 tMoment due to Pint = Mpint = P1 x e = 483.35 tmfor second stage prestressingPrestressing force ( after friction and slip losses ) , P = 285.61 tMoment due to P, Mp = P x e = 294.03 tm
Stresses due to self weight of the girder + cast in situ slab�j = 584.73 = 1024.3 t/m2
0.571�c = 584.73 = -700.3 t/m2
0.835σb = 584.73 = -947.2 t/m2
0.617
Stresses due to prestress (second stage cables)σt = 285.61 - 294.03 = -36.1 t/m2
1.906 1.581�j = 285.61 - 294.03 = 19.8 t/m2
1.906 2.262�c = 285.61 + 294.03 = 415.5 t/m2
1.906 1.107σb = 285.61 + 294.03 = 489.9 t/m2
1.906 0.865
Total Stresses due to prestress σt = 0.0 + -36.1 = -36.1 t/m2
σj = -260.9 + 19.8 = -241.1 t/m3
�c = 1164.6 + 415.5 = 1580.1 t/m2
σb = 1368.8 + 489.9 = 1858.7 t/m2
Stresses due to prestress & self weight of the girder+deck slabσt = 0.0 + -36.1 = -36.1 t/m2
σj = 1024.3 + -241.1 = 783.2 t/m3
�c = -700.3 + 1580.1 = 879.8 t/m2
σb = -947.2 + 1858.7 = 911.4 t/m2
Losses due to Elastic ShorteningLoss due to Elastic Shortening = 0.5 x σ x Es/Ec
Therefore, initial loss = 2378 t/m2
(i.e. Elastic Shortening loss) = 19.72 t = 1.79 % of Jacking Force
For first stage cablesPrestressing force after initial losses Pii = 642.37 tMoment due to Pi = Mpii = Pii x e = 479.15 tmFor second stage cablesPrestressing force after initial losses Pi = 279.98 tMoment due to Pi = Mpi = Pi x e = 288.23 tm
Loss due to Shrinkage of Concrete = �s x Es
= 3776.8 t/m2
= 31.31 t = 2.84 % of Jacking Force
Loss due to Shrinkage = 36.95 tMoment due to Shrinkage loss = 43.850 tm

Consulting Engineers Group Ltd., Jaipur_________________________________________________________________________
Bridge Design Report_______________________________________________________________________________
Loss due to relaxation of steelFor second stage cables:The loss due to relaxation of steel depends on the stress in HTS after initial losses.Ratio of average force to UTS = 0.694Loss due to friction and slip = 314.5861 - 285.6 = 29.0 t% friction and slip loss = 29.0 x 100 = 6.45 %
314.58612Ratio of average force to UTS = 0.694 - 0.064479 = 0.629
Corresponding Relaxation Loss = 6394.2 t/m2
= 15.15 t 4.81 % of Jacking Force
Loss due to Relaxation & Shrinkage = 20.78 tMoment due to Relaxation & Shrinkage loss = 24.663 tm
Shrinkage losses (for first stage cables)σt = -36.95 + 43.850 = 8.35 t/m2
1.906 1.581σj = -36.95 + 43.850 = 0.00 t/m2
1.906 2.262�c = -36.95 - 43.850 = -59.00 t/m2
1.906 1.107σb = -36.95 - 43.850 = -70.10 t/m2
1.906 0.865
Shrinkage and Relaxation losses (for second stage cables)σt = -20.78 + 24.663 = 4.70 t/m2
1.906 1.581σj = -20.78 + 24.663 = 0.00 t/m2
1.906 2.262�c = -20.78 - 24.663 = -33.19 t/m2
1.906 1.107σb = -20.78 - 24.663 = -39.43 t/m2
1.906 0.865
Total Shrinkage and Relaxation losses σt = 8.35 + 4.70 = 13.05 t/m2
σj = 0.00 + 0.00 = 0.01 t/m2
�c = -59.00 + -33.19 = -92.19 t/m2
σb = -70.10 + -39.43 = -109.53 t/m2
Stresses due to prestress after shrinkage & relaxation losses & self weight of the girder+cast insitu deck slab
σt = -36.1 + 13.05 = -23.07 t/m2
σj = 783.2 + 0.0 = 783.20 t/m2
�c = 879.8 + -92.2 = 787.66 t/m2
σb = 911.4 + -109.5 = 801.92 t/m2
Loss due to Creep of concrete
Airthmetic mean of initial and final stress after 28 days = 787.66 t/m2
Creep loss = (σ/10) x εc x Εs = 6139.9 t/m2
= 50.91 t = 4.623 % of Jacking Force
Loss due to Creep = 50.91 tMoment due to Creep loss = 60.42 tm

Consulting Engineers Group Ltd., Jaipur_________________________________________________________________________
Bridge Design Report_______________________________________________________________________________
Creep losses (for first stage cables)σt = -50.91 + 60.418 = 11.51 t/m2
1.906 1.581σj = -50.91 + 60.418 = 0.01 t/m2
1.906 2.262�c = -50.91 - 60.418 = -81.30 t/m2
1.906 1.107σb = -50.91 - 60.418 = -96.59 t/m2
1.906 0.865
Creep losses (for second stage cables)σt = -14.54 + -17.262 = -18.55 t/m2
1.906 1.581σj = -14.54 + -17.262 = -15.26 t/m2
1.906 2.262�c = -14.54 - -17.262 = 7.97 t/m2
1.906 1.107σb = -14.54 - -17.262 = 12.34 t/m2
1.906 0.865
Final Prestressing Force = 775.57 t
Total Creep losses σt = 11.51 + -18.55 = -7.04 t/m2
σj = 0.01 + -15.26 = -15.26 t/m2
�c = -81.30 + 7.97 = -73.33 t/m2
σb = -96.59 + 12.34 = -84.25 t/m2
Total Stresses due to prestress after immediate losses & self weight of the girder+cast insitu deck slab
σt = -23.07 + -7.04 = -30.11σj = 783.20 + -15.26 = 767.95�c = 787.66 + -73.33 = 714.33σb = 801.92 + -84.25 = 717.67
Stresses Due to SIDLσt = 163.30 = 103.3 t/m2
1.581�j = 163.30 = 72.2 t/m2
2.262�c = 163.30 = -147.6 t/m2
1.107σb = 163.30 = -188.9 t/m2
0.865
Total Stresses due to prestress + DL (Girder+deck slab) + SIDL
σt = -30.1 + 103.27 = 73.2 t/m2
�j = 767.9 + 72.19 = 840.1 t/m2
�c = 714.3 + -147.55 = 566.8 t/m2
σb = 717.7 + -188.88 = 528.8 t/m2

Consulting Engineers Group Ltd., Jaipur_________________________________________________________________________
Bridge Design Report_______________________________________________________________________________
After laying of SIDL
-30.1 103.3 73.2+
767.9 72.2
+ + +
-
717.7 -188.9 528.8SIDL
Stresses due to Live load σt = 238.92 = 151.10 t/m2
1.581�j = 238.92 = 105.62 t/m2
2.262�c = 238.92 = -215.881 t/m2
1.107σb = 238.92 = -276.35 t/m2
0.865
Stresses due to Prestress + DL + SIDL + FPLL + LLσt = 73.16 + 151.1 = 224.3 t/m2
�j = 840.14 + 105.6 = 945.8 t/m2
�c = 566.78 + -215.9 = 350.9 t/m2
σb = 528.79 + -276.3 = 252.4 t/m2
73.16 151.1 224.3
840.14 + 105.62 945.8
+ + + = +
-
528.79 -276.3 252.4Prestress + SIDL
Time dependant losses (i.e. due to relaxation of steel, shrinkage of concrete & creep of concrete) = 151.84 t
20% extra time dependant losses = 30.37 tStress due to 20% extra time dependant losses at top = 6.9 t/m2 Stress due to 20% extra time dependant losses at bottom = -57.6 t/m2
224.3 6.9 231.1
945.8 +
+ + =
-
252.4 -57.6 194.82
Live Load
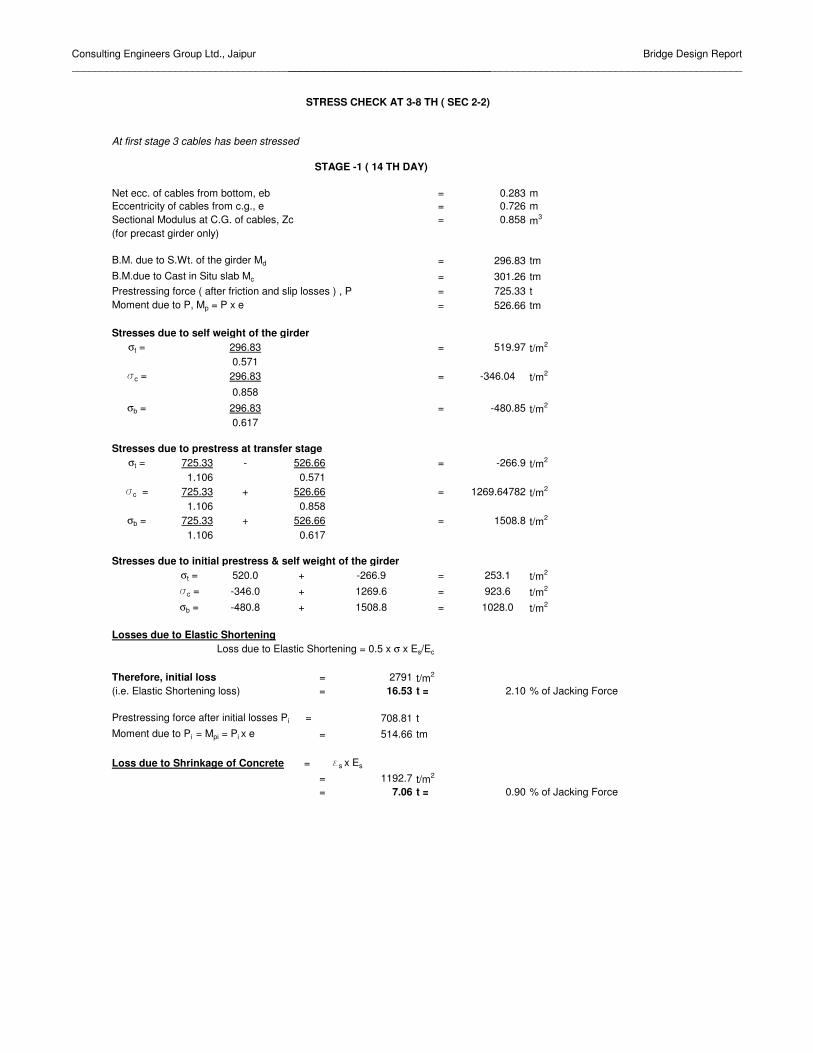
Consulting Engineers Group Ltd., Jaipur_________________________________________________________________________
Bridge Design Report_______________________________________________________________________________
At first stage 3 cables has been stressed
Net ecc. of cables from bottom, eb = 0.283 mEccentricity of cables from c.g., e = 0.726 mSectional Modulus at C.G. of cables, Zc = 0.858 m3
(for precast girder only)
B.M. due to S.Wt. of the girder Md = 296.83 tmB.M.due to Cast in Situ slab Mc = 301.26 tmPrestressing force ( after friction and slip losses ) , P = 725.33 tMoment due to P, Mp = P x e = 526.66 tm
Stresses due to self weight of the girderσt = 296.83 = 519.97 t/m2
0.571�c = 296.83 = -346.04 t/m2
0.858σb = 296.83 = -480.85 t/m2
0.617
Stresses due to prestress at transfer stageσt = 725.33 - 526.66 = -266.9 t/m2
1.106 0.571�c = 725.33 + 526.66 = 1269.64782 t/m2
1.106 0.858σb = 725.33 + 526.66 = 1508.8 t/m2
1.106 0.617
Stresses due to initial prestress & self weight of the girderσt = 520.0 + -266.9 = 253.1 t/m2
�c = -346.0 + 1269.6 = 923.6 t/m2
σb = -480.8 + 1508.8 = 1028.0 t/m2
Losses due to Elastic ShorteningLoss due to Elastic Shortening = 0.5 x σ x Es/Ec
Therefore, initial loss = 2791 t/m2
(i.e. Elastic Shortening loss) = 16.53 t = 2.10 % of Jacking Force
Prestressing force after initial losses Pi = 708.81 tMoment due to Pi = Mpi = Pi x e = 514.66 tm
Loss due to Shrinkage of Concrete = �s x Es
= 1192.7 t/m2
= 7.06 t = 0.90 % of Jacking Force
STRESS CHECK AT 3-8 TH ( SEC 2-2)
STAGE -1 ( 14 TH DAY)

Consulting Engineers Group Ltd., Jaipur_________________________________________________________________________
Bridge Design Report_______________________________________________________________________________
Loss due to relaxation of steelThe loss due to relaxation of steel depends on the stress in HTS after initial losses.Ratio of average force to UTS = 0.685Loss due to friction & slip = 786.4653 - 725.3 = 61.1 t% friction and slip loss = 61.1 x 100 = 5.44 %
786.46529Ratio of average force to UTS = 0.685 - 0.05441 = 0.631
Corresponding Relaxation Loss = 6474.5 t/m2
= 38.34 t 4.88 % of Jacking Force
Loss due to Relaxation & Shrinkage = 45.41 tMoment due to Relaxation & Shrinkage loss = 32.968 tm
Stresses due to Prestress after initial lossesσt = 708.81 - 514.66 = -260.82 t/m2
1.106 0.571�c = 708.81 + 514.66 = 1240.7 t/m2
1.106 0.858 σb = 708.81 + 514.66 = 1474.4 t/m2
1.106 0.617
Stresses due to prestress after initial losses & self weight of the girderσt = 520.0 + -260.8 = 259.1 t/m2
�c = -346.0 + 1240.7 = 894.7 t/m2
σb = -480.8 + 1474.4 = 993.6 t/m2
Stresses after Shrinkage and Relaxation lossesσt = 259.15 - 45.41 + 32.968 = 275.85 t/m2
1.106 0.571�c = 894.7 - 45.41 - 32.968 = 815.19 t/m2
1.106 0.858σb = 993.60 - 45.41 - 32.968 = 899.15 t/m2
1.106 0.617
Loss due to Creep of concrete
Airthmetic mean of initial and final stress between 14th = 854.93 t/m2
and 28 days at C.G. of cablesCreep loss = (σ/10) x εc x Εs = 1832.7 t/m2
= 10.85 t = 1.380 % of Jacking Force
Total Initial & Intermediate losses = 72.79 t = 1.38 % of Jacking Force(i.e. losses upto 28th day)Force after intermediate losses, Pint = 652.5 tMoment due to Pint = Mpint = Pint x e = 473.81 tm
Effect of prestress after Intermediate lossσt = 652.5 - 473.81 = -240.1 t/m2
1.106 0.571�c = 652.5 + 473.81 = 1142.2 t/m2
1.106 0.858 σb = 652.5 + 473.81 = 1357.4 t/m2
1.106 0.617
Stresses Due to cast-in-situ slabσt = 301.3 = 527.73 t/m2
0.571�c = 301.3 = -351.21 t/m2
0.858σb = 301.3 = -488.02 t/m2
0.617
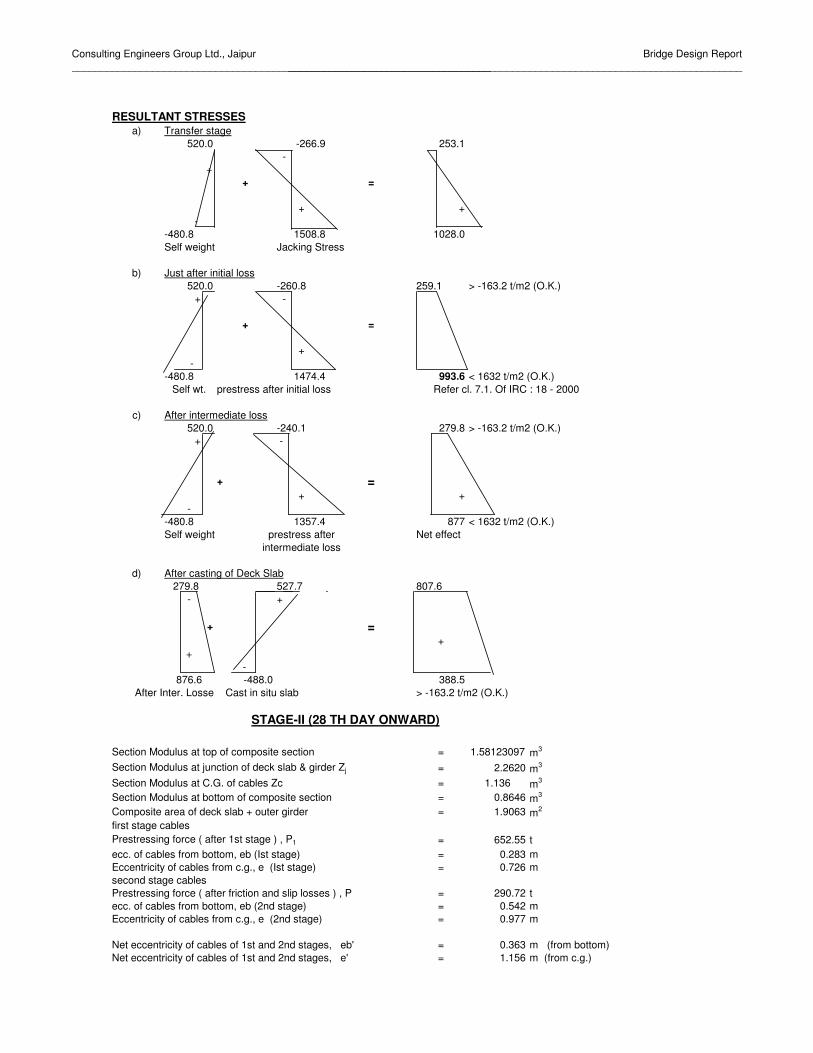
Consulting Engineers Group Ltd., Jaipur_________________________________________________________________________
Bridge Design Report_______________________________________________________________________________
RESULTANT STRESSESa) Transfer stage
520.0 -266.9 253.1 -
++ =
+ + -
-480.8 1508.8 1028.0Self weight Jacking Stress
b) Just after initial loss520.0 -260.8 259.1 > -163.2 t/m2 (O.K.)
+ -
+ =
+ --480.8 1474.4 993.6 < 1632 t/m2 (O.K.)
Self wt. prestress after initial loss Refer cl. 7.1. Of IRC : 18 - 2000
c) After intermediate loss520.0 -240.1 279.8 > -163.2 t/m2 (O.K.)
+ -
+ =+ +
--480.8 1357.4 877 < 1632 t/m2 (O.K.)Self weight prestress after Net effect
intermediate loss
d) After casting of Deck Slab279.8 527.7 807.6
- +
+ =+
+-
876.6 -488.0 388.5 After Inter. Losses Cast in situ slab > -163.2 t/m2 (O.K.)
Section Modulus at top of composite section = 1.58123097 m3
Section Modulus at junction of deck slab & girder Zj = 2.2620 m3
Section Modulus at C.G. of cables Zc = 1.136 m3
Section Modulus at bottom of composite section = 0.8646 m3
Composite area of deck slab + outer girder = 1.9063 m2
first stage cablesPrestressing force ( after 1st stage ) , P1 = 652.55 tecc. of cables from bottom, eb (Ist stage) = 0.283 mEccentricity of cables from c.g., e (Ist stage) = 0.726 msecond stage cablesPrestressing force ( after friction and slip losses ) , P = 290.72 tecc. of cables from bottom, eb (2nd stage) = 0.542 mEccentricity of cables from c.g., e (2nd stage) = 0.977 m
Net eccentricity of cables of 1st and 2nd stages, eb' = 0.363 m (from bottom)Net eccentricity of cables of 1st and 2nd stages, e' = 1.156 m (from c.g.)
STAGE-II (28 TH DAY ONWARD)

Consulting Engineers Group Ltd., Jaipur_________________________________________________________________________
Bridge Design Report_______________________________________________________________________________
B.M. due to S.Wt. of the girder Md = 296.83 tmB.M.due to Cast in Situ slab Mc = 245.30 tmB.M. due to SIDL Ms = 164.75 tmB.M. due to Live loads ML = 207.59 tmB.M. due to FPLL = 0.00 tm
Prestressing force ( after 1st stage ) , P1 = 652.55 tMoment due to Pint = Mpint = P1 x e = 473.81 tmfor second stage prestressingPrestressing force ( after friction and slip losses ) , P = 290.72 tMoment due to P, Mp = P x e = 284.05 tm
Stresses due to self weight of the girder + cast in situ slab�j = 542.13 = 949.7 t/m2
0.571�c = 542.13 = -632.0 t/m2
0.858σb = 542.13 = -878.2 t/m2
0.617
Stresses due to prestress (second stage cables)σt = 290.72 - 284.05 = -27.1 t/m2
1.906 1.581�j = 290.72 - 284.05 = 26.9 t/m2
1.906 2.262�c = 290.72 + 284.05 = 402.6 t/m2
1.906 1.136σb = 290.72 + 284.05 = 481.0 t/m2
1.906 0.865
Total Stresses due to prestress σt = 0.0 + -27.1 = -27.1 t/m2
σj = -240.1 + 26.9 = -213.2 t/m3
�c = 1142.2 + 402.6 = 1544.8 t/m2
σb = 1357.4 + 481.0 = 1838.5 t/m2
Stresses due to prestress & self weight of the girder+deck slabσt = 0.0 + -27.1 = -27.1 t/m2
σj = 949.7 + -213.2 = 736.5 t/m3
�c = -632.0 + 1544.8 = 912.8 t/m2
σb = -878.2 + 1838.5 = 960.3 t/m2
Losses due to Elastic ShorteningLoss due to Elastic Shortening = 0.5 x σ x Es/Ec
Therefore, initial loss = 2467 t/m2
(i.e. Elastic Shortening loss) = 20.46 t = 91.03 % of Jacking Force
For first stage cablesPrestressing force after initial losses Pii = 646.70 tMoment due to Pi = Mpii = Pii x e = 469.57 tmFor second stage cablesPrestressing force after initial losses Pi = 284.87 tMoment due to Pi = Mpi = Pi x e = 278.34 tm
Loss due to Shrinkage of Concrete = �s x Es
= 3776.8 t/m2
= 31.31 t = 2.84 % of Jacking Force
Loss due to Shrinkage = 37.16 tMoment due to Shrinkage loss = 42.972 tm

Consulting Engineers Group Ltd., Jaipur_________________________________________________________________________
Bridge Design Report_______________________________________________________________________________
Loss due to relaxation of steelFor second stage cables:The loss due to relaxation of steel depends on the stress in HTS after initial losses.Ratio of average force to UTS = 0.381Loss due to friction and slip = 314.5861 - 290.7 = 23.9 t% friction and slip loss = 23.9 x 100 = 7.588 %
314.58612Ratio of average force to UTS = 0.381 - 0.075879 = 0.306
Corresponding Relaxation Loss = 0.0 t/m2
= 0.00 t 0.00 % of Jacking Force
Loss due to Relaxation & Shrinkage = 5.84 tMoment due to Relaxation & Shrinkage loss = 6.759 tm
Shrinkage losses (for first stage cables)σt = -37.16 + 42.972 = 7.68 t/m2
1.906 1.581σj = -37.16 + 42.972 = -0.49 t/m2
1.906 2.262�c = -37.16 - 42.972 = -57.33 t/m2
1.906 1.136σb = -37.16 - 42.972 = -69.20 t/m2
1.906 0.865
Shrinkage and Relaxation losses (for second stage cables)σt = -5.84 + 6.759 = 1.21 t/m2
1.906 1.581σj = -5.84 + 6.759 = -0.08 t/m2
1.906 2.262�c = -5.84 - 6.759 = -9.02 t/m2
1.906 1.136σb = -5.84 - 6.759 = -10.88 t/m2
1.906 0.865
Total Shrinkage and relaxation losses σt = 7.68 + 1.21 = 8.89 t/m2
σj = -0.49 + -0.08 = -0.57 t/m2
�c = -57.33 + -9.02 = -66.34 t/m2
σb = -69.20 + -10.88 = -80.08 t/m2
Stresses due to prestress after shrinkage & relaxation losses & self weight of the girder+cast insitu deck slab
σt = -27.1 + 8.9 = -18.24 t/m2
σj = 736.5 + -0.6 = 735.91 t/m2
�c = 912.8 + -66.3 = 846.48 t/m2
σb = 960.3 + -80.1 = 880.17 t/m2
Loss due to Creep of concrete
Airthmetic mean of initial and final stress after 28 days = 846.48 t/m2
Creep loss = (σ/10) x εc x Εs = 6598.4 t/m2
= 54.71 t = 4.969 % of Jacking Force
Loss due to Creep = 54.71 tMoment due to Creep loss = 63.27 tm

Consulting Engineers Group Ltd., Jaipur_________________________________________________________________________
Bridge Design Report_______________________________________________________________________________
Creep losses (for first stage cables)σt = -54.71 + 63.268 = 11.31 t/m2
1.906 1.581σj = -54.71 + 63.268 = -0.73 t/m2
1.906 2.262�c = -54.71 - 63.268 = -84.40 t/m2
1.906 1.136σb = -54.71 - 63.268 = -101.88 t/m2
1.906 0.865
Creep losses (for second stage cables)σt = -15.63 + -18.077 = -19.63 t/m2
1.906 1.581σj = -15.63 + -18.077 = -16.19 t/m2
1.906 2.262�c = -15.63 - -18.077 = 7.72 t/m2
1.906 1.136σb = -15.63 - -18.077 = 12.71 t/m2
1.906 0.865
Final Prestressing force = 809.47 t
Total Creep losses σt = 11.31 + -19.63 = -8.32 t/m2
σj = -0.73 + -16.19 = -16.92 t/m2
�c = -84.40 + 7.72 = -76.69 t/m2
σb = -101.88 + 12.71 = -89.17 t/m2
Total Stresses due to prestress after immediate losses & self weight of the girder+cast insitu deck slab
σt = -18.24 + -8.32 = -26.56σj = 735.91 + -16.92 = 718.99�c = 846.48 + -76.69 = 769.79σb = 880.17 + -89.17 = 791.00
Stresses Due to SIDLσt = 164.75 = 104.2 t/m2
1.581�j = 164.75 = 72.8 t/m2
2.262�c = 164.75 = -145.1 t/m2
1.136σb = 164.75 = -190.6 t/m2
0.865
Total Stresses due to prestress + DL (Girder+deck slab) + SIDL
σt = -26.6 + 104.19 = 77.6 t/m2
�j = 719.0 + 72.83 = 791.8 t/m2
�c = 769.8 + -145.05 = 624.7 t/m2
σb = 791.0 + -190.56 = 600.4 t/m2
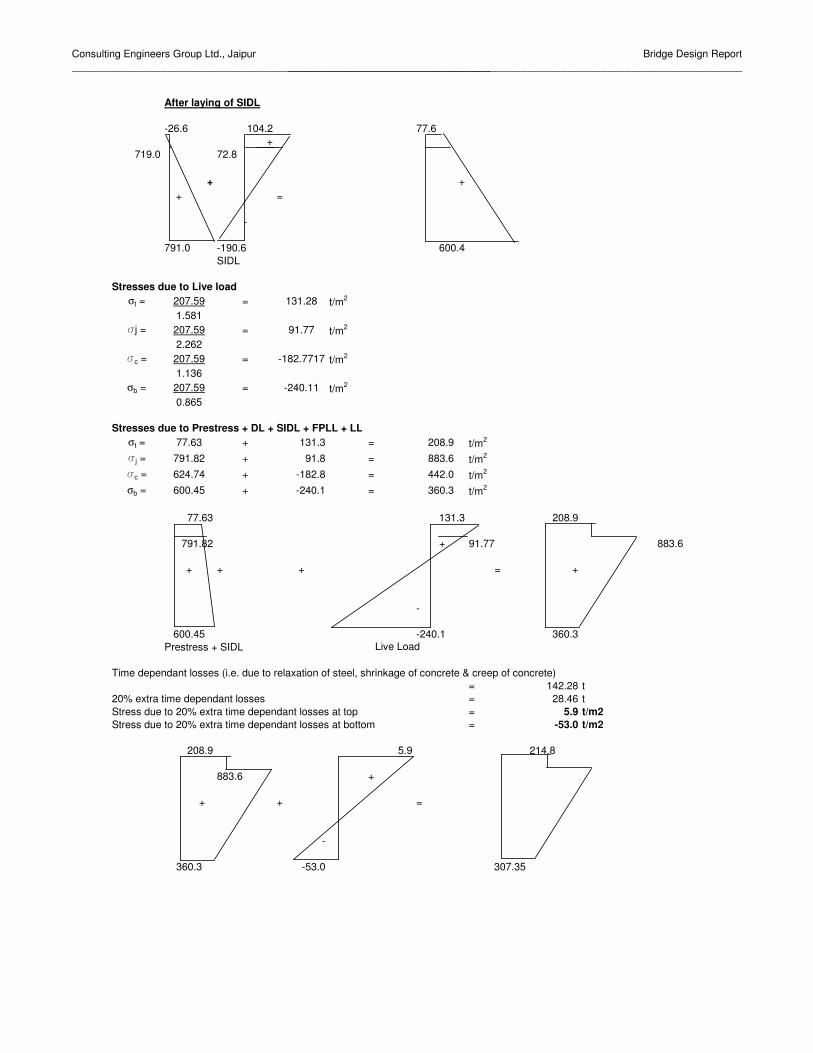
Consulting Engineers Group Ltd., Jaipur_________________________________________________________________________
Bridge Design Report_______________________________________________________________________________
After laying of SIDL
-26.6 104.2 77.6+
719.0 72.8
+ + + =
-
791.0 -190.6 600.4SIDL
Stresses due to Live load σt = 207.59 = 131.28 t/m2
1.581�j = 207.59 = 91.77 t/m2
2.262�c = 207.59 = -182.7717 t/m2
1.136σb = 207.59 = -240.11 t/m2
0.865
Stresses due to Prestress + DL + SIDL + FPLL + LLσt = 77.63 + 131.3 = 208.9 t/m2
�j = 791.82 + 91.8 = 883.6 t/m2
�c = 624.74 + -182.8 = 442.0 t/m2
σb = 600.45 + -240.1 = 360.3 t/m2
77.63 131.3 208.9
791.82 + 91.77 883.6
+ + + = +
-
600.45 -240.1 360.3Prestress + SIDL
Time dependant losses (i.e. due to relaxation of steel, shrinkage of concrete & creep of concrete) = 142.28 t
20% extra time dependant losses = 28.46 tStress due to 20% extra time dependant losses at top = 5.9 t/m2 Stress due to 20% extra time dependant losses at bottom = -53.0 t/m2
208.9 5.9 214.8
883.6 +
+ + =
-
360.3 -53.0 307.35
Live Load

Consulting Engineers Group Ltd., Jaipur_________________________________________________________________________
Bridge Design Report_______________________________________________________________________________
At first stage 3 cables has been stressed
Net ecc. of cables from bottom, eb = 0.341 mEccentricity of cables from c.g., e = 0.668 mSectional Modulus at C.G. of cables, Zc = 0.932 m3
(for precast girder only)
B.M. due to S.Wt. of the girder Md = 238.50 tmB.M.due to Cast in Situ slab Mc = 242.95 tmPrestressing force ( after friction and slip losses ) , P = 709.01 tMoment due to P, Mp = P x e = 473.62 tm
Stresses due to self weight of the girderσt = 238.50 = 417.79 t/m2
0.571�c = 238.50 = -255.80 t/m2
0.932σb = 238.50 = -386.36 t/m2
0.617
Stresses due to prestress at transfer stageσt = 709.01 - 473.62 = -188.8 t/m2
1.106 0.571�c = 709.01 + 473.62 = 1148.88945 t/m2
1.106 0.932σb = 709.01 + 473.62 = 1408.2 t/m2
1.106 0.617
Stresses due to initial prestress & self weight of the girderσt = 417.8 + -188.8 = 229.0 t/m2
�c = -255.8 + 1148.9 = 893.1 t/m2
σb = -386.4 + 1408.2 = 1021.8 t/m2
Losses due to Elastic ShorteningLoss due to Elastic Shortening = 0.5 x σ x Es/Ec
Therefore, initial loss = 2699 t/m2
(i.e. Elastic Shortening loss) = 15.98 t = 2.03 % of Jacking Force
Prestressing force after initial losses Pi = 693.03 tMoment due to Pi = Mpi = Pi x e = 462.95 tm
Loss due to Shrinkage of Concrete = �s x Es
= 1192.7 t/m2
= 7.06 t = 0.90 % of Jacking Force
STRESS CHECK AT 1-4 TH ( SEC 3-3)
STAGE -1 ( 14 TH DAY)

Consulting Engineers Group Ltd., Jaipur_________________________________________________________________________
Bridge Design Report_______________________________________________________________________________
Loss due to relaxation of steelThe loss due to relaxation of steel depends on the stress in HTS after initial losses.Ratio of average force to UTS = 0.686Loss due to friction & slip = 786.4653 - 709.0 = 77.5 t% friction and slip loss = 77.5 x 100 = 6.894 %
786.46529Ratio of average force to UTS = 0.686 - 0.068937 = 0.617
Corresponding Relaxation Loss = 5780.0 t/m2
= 34.23 t 4.35 % of Jacking Force
Loss due to Relaxation & Shrinkage = 41.29 tMoment due to Relaxation & Shrinkage loss = 27.583 tm
Stresses due to Prestress after initial lossesσt = 693.03 - 462.95 = -184.50 t/m2
1.106 0.571�c = 693.03 + 462.95 = 1123.0 t/m2
1.106 0.932σb = 693.03 + 462.95 = 1376.4 t/m2
1.106 0.617
Stresses due to prestress after initial losses & self weight of the girderσt = 417.8 + -184.5 = 233.3 t/m2
�c = -255.8 + 1123.0 = 867.2 t/m2
σb = -386.4 + 1376.4 = 990.1 t/m2
Stresses after Shrinkage and Relaxation lossesσt = 233.29 - 41.29 + 27.583 = 244.29 t/m2
1.106 0.571�c = 867.2 - 41.29 - 27.583 = 800.28 t/m2
1.106 0.932σb = 990.06 - 41.29 - 27.583 = 908.05 t/m2
1.106 0.617
Loss due to Creep of concrete
Airthmetic mean of initial and final stress between 14th = 833.74 t/m2
and 28 days at C.G. of cablesCreep loss = (σ/10) x εc x Εs = 1787.3 t/m2
= 10.58 t = 1.346 % of Jacking Force
Total Initial & Intermediate losses = 67.86 t = 1.35 % of Jacking Force(i.e. losses upto 28th day)Force after intermediate losses, Pint = 641.2 tMoment due to Pint = Mpint = Pint x e = 428.29 tm
Effect of prestress after Intermediate lossσt = 641.2 - 428.29 = -170.7 t/m2
1.106 0.571�c = 641.2 + 428.29 = 1038.9 t/m2
1.106 0.932 σb = 641.2 + 428.29 = 1273.4 t/m2
1.106 0.617
Stresses Due to cast-in-situ slabσt = 243.0 = 425.59 t/m2
0.571�c = 243.0 = -260.57 t/m2
0.932σb = 243.0 = -393.56 t/m2
0.617

Consulting Engineers Group Ltd., Jaipur_________________________________________________________________________
Bridge Design Report_______________________________________________________________________________
RESULTANT STRESSESa) Transfer stage
417.8 -188.8 229.0 -
++ =
+ + -
-386.4 1408.2 1021.8Self weight Jacking Stress
b) Just after initial loss417.8 -184.5 233.3 > -163.2 t/m2 (O.K.)
+ -
+ =
+ --386.4 1376.4 990.1 < 1632 t/m2 (O.K.)
Self wt. prestress after initial loss Refer cl. 7.1. Of IRC : 18 - 2000
c) After intermediate loss417.8 -170.7 247.1 > -163.2 t/m2 (O.K.)
+ -
+ =+ +
--386.4 1273.4 887 < 1632 t/m2 (O.K.)Self weight prestress after Net effect
intermediate loss
d) After casting of Deck Slab247.1 425.6 672.7
- +
+ =+
+-
887.0 -393.6 493.5 After Inter. Losses Cast in situ slab > -163.2 t/m2 (O.K.)
Section Modulus at top of composite section = 1.58123097 m3
Section Modulus at junction of deck slab & girder Zj = 2.2620 m3
Section Modulus at C.G. of cables Zc = 1.229 m3
Section Modulus at bottom of composite section = 0.8646 m3
Composite area of deck slab + outer girder = 1.9063 m2
first stage cablesPrestressing force ( after 1st stage ) , P1 = 641.15 tecc. of cables from bottom, eb (Ist stage) = 0.341 mEccentricity of cables from c.g., e (Ist stage) = 0.668 msecond stage cablesPrestressing force ( after friction and slip losses ) , P = 283.21 tecc. of cables from bottom, eb (2nd stage) = 0.699 mEccentricity of cables from c.g., e (2nd stage) = 0.820 m
STAGE-II (28 TH DAY ONWARD)

Consulting Engineers Group Ltd., Jaipur_________________________________________________________________________
Bridge Design Report_______________________________________________________________________________
Net eccentricity of cables of 1st and 2nd stages, eb' = 0.451 m (from bottom)Net eccentricity of cables of 1st and 2nd stages, e' = 1.069 m (from c.g.)
B.M. due to S.Wt. of the girder Md = 238.50 tmB.M.due to Cast in Situ slab Mc = 186.99 tmB.M. due to SIDL Ms = 126.54 tmB.M. due to Live loads ML = 175.11 tmB.M. due to FPLL = 0.00 tm
Prestressing force ( after 1st stage ) , P1 = 641.15 tMoment due to Pint = Mpint = P1 x e = 428.29 tmfor second stage prestressingPrestressing force ( after friction and slip losses ) , P = 283.21 tMoment due to P, Mp = P x e = 232.36 tm
Stresses due to self weight of the girder + cast in situ slab�j = 425.49 = 745.3 t/m2
0.571�c = 425.49 = -456.3 t/m2
0.932σb = 425.49 = -689.3 t/m2
0.617
Stresses due to prestress (second stage cables)σt = 283.21 - 232.36 = 1.6 t/m2
1.906 1.581�j = 283.21 - 232.36 = 45.8 t/m2
1.906 2.262�c = 283.21 + 232.36 = 337.6 t/m2
1.906 1.229σb = 283.21 + 232.36 = 417.3 t/m2
1.906 0.865
Total Stresses due to prestress σt = 0.0 + 1.6 = 1.6 t/m2
σj = -170.7 + 45.8 = -124.8 t/m3
�c = 1038.9 + 337.6 = 1376.5 t/m2
σb = 1273.4 + 417.3 = 1690.7 t/m2
Stresses due to prestress & self weight of the girder+deck slabσt = 0.0 + 1.6 = 1.6 t/m2
σj = 745.3 + -124.8 = 620.5 t/m3
�c = -456.3 + 1376.5 = 920.2 t/m2
σb = -689.3 + 1690.7 = 1001.4 t/m2
Losses due to Elastic ShorteningLoss due to Elastic Shortening = 0.5 x σ x Es/Ec
Therefore, initial loss = 2487 t/m2
(i.e. Elastic Shortening loss) = 20.62 t = 1.87 % of Jacking Force
For first stage cablesPrestressing force after initial losses Pii = 635.26 tMoment due to Pi = Mpii = Pii x e = 424.36 tmFor second stage cablesPrestressing force after initial losses Pi = 277.32 tMoment due to Pi = Mpi = Pi x e = 227.53 tm

Consulting Engineers Group Ltd., Jaipur_________________________________________________________________________
Bridge Design Report_______________________________________________________________________________
Loss due to Shrinkage of Concrete = �s x Es
= 3776.8 t/m2
= 31.31 t = 2.84 % of Jacking Force
Loss due to Shrinkage = 37.20 tMoment due to Shrinkage loss = 39.760 tm
Loss due to relaxation of steelFor second stage cables:The loss due to relaxation of steel depends on the stress in HTS after initial losses.Ratio of average force to UTS = 0.693Loss due to friction and slip = 314.5861 - 283.2 = 31.4 t% friction and slip loss = 31.4 x 100 = 6.98 %
314.58612Ratio of average force to UTS = 0.693 - 0.069817 = 0.624
Corresponding Relaxation Loss = 6115.9 t/m2
= 14.49 t 4.61 % of Jacking Force
Loss due to Relaxation & Shrinkage = 20.38 tMoment due to Relaxation & Shrinkage loss = 21.779 tm
Shrinkage losses (for first stage cables)σt = -37.20 + 39.760 = 5.63 t/m2
1.906 1.581σj = -37.20 + 39.760 = -1.94 t/m2
1.906 2.262�c = -37.20 - 39.760 = -51.87 t/m2
1.906 1.229σb = -37.20 - 39.760 = -65.50 t/m2
1.906 0.865
Shrinkage and Relaxation losses (for second stage cables)σt = -20.38 + 21.779 = 3.08 t/m2
1.906 1.581σj = -20.38 + 21.779 = -1.06 t/m2
1.906 2.262�c = -20.38 - 21.779 = -28.41 t/m2
1.906 1.229σb = -20.38 - 21.779 = -35.88 t/m2
1.906 0.865
Total Shrinkage and Relaxation losses σt = 5.63 + 3.08 = 8.71 t/m2
σj = -1.94 + -1.06 = -3.00 t/m2
�c = -51.87 + -28.41 = -80.28 t/m2
σb = -65.50 + -35.88 = -101.39 t/m2
Stresses due to prestress after shrinkage & relaxation losses & self weight of the girder+cast insitu deck slab
σt = 1.6 + 8.7 = 10.33 t/m2
σj = 620.5 + -3.0 = 617.50 t/m2
�c = 920.2 + -80.3 = 839.93 t/m2
σb = 1001.4 + -101.4 = 900.06 t/m2
Loss due to Creep of concrete
Airthmetic mean of initial and final stress after 28 days = 839.93 t/m2
Creep loss = (σ/10) x εc x Εs = 6547.4 t/m2
= 54.28 t = 4.930 % of Jacking Force
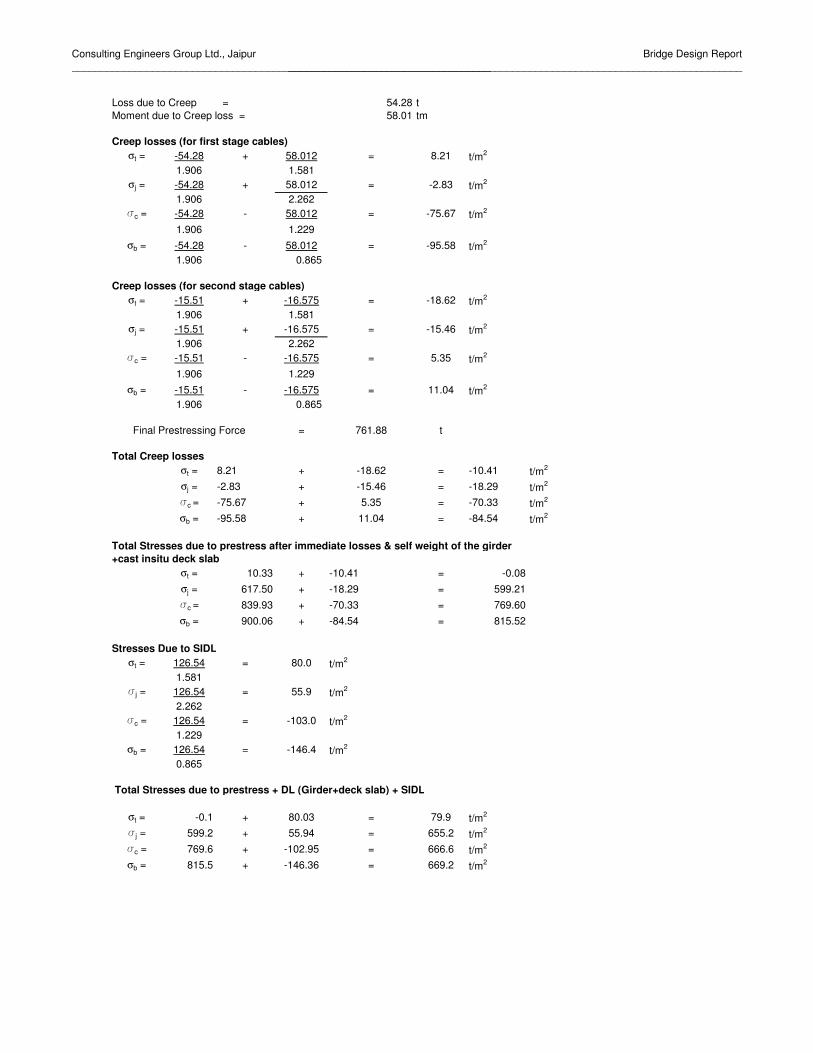
Consulting Engineers Group Ltd., Jaipur_________________________________________________________________________
Bridge Design Report_______________________________________________________________________________
Loss due to Creep = 54.28 tMoment due to Creep loss = 58.01 tm
Creep losses (for first stage cables)σt = -54.28 + 58.012 = 8.21 t/m2
1.906 1.581σj = -54.28 + 58.012 = -2.83 t/m2
1.906 2.262�c = -54.28 - 58.012 = -75.67 t/m2
1.906 1.229σb = -54.28 - 58.012 = -95.58 t/m2
1.906 0.865
Creep losses (for second stage cables)σt = -15.51 + -16.575 = -18.62 t/m2
1.906 1.581σj = -15.51 + -16.575 = -15.46 t/m2
1.906 2.262�c = -15.51 - -16.575 = 5.35 t/m2
1.906 1.229σb = -15.51 - -16.575 = 11.04 t/m2
1.906 0.865
Final Prestressing Force = 761.88 t
Total Creep losses σt = 8.21 + -18.62 = -10.41 t/m2
σj = -2.83 + -15.46 = -18.29 t/m2
�c = -75.67 + 5.35 = -70.33 t/m2
σb = -95.58 + 11.04 = -84.54 t/m2
Total Stresses due to prestress after immediate losses & self weight of the girder+cast insitu deck slab
σt = 10.33 + -10.41 = -0.08σj = 617.50 + -18.29 = 599.21�c = 839.93 + -70.33 = 769.60σb = 900.06 + -84.54 = 815.52
Stresses Due to SIDLσt = 126.54 = 80.0 t/m2
1.581�j = 126.54 = 55.9 t/m2
2.262�c = 126.54 = -103.0 t/m2
1.229σb = 126.54 = -146.4 t/m2
0.865
Total Stresses due to prestress + DL (Girder+deck slab) + SIDL
σt = -0.1 + 80.03 = 79.9 t/m2
�j = 599.2 + 55.94 = 655.2 t/m2
�c = 769.6 + -102.95 = 666.6 t/m2
σb = 815.5 + -146.36 = 669.2 t/m2
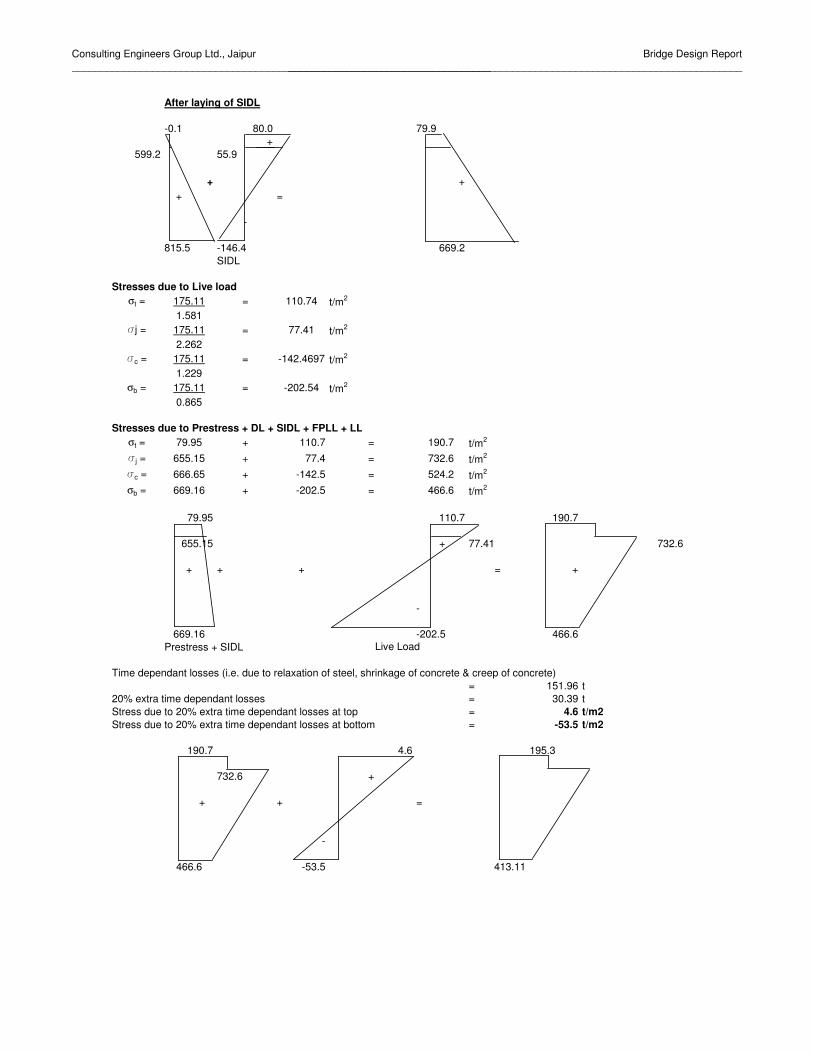
Consulting Engineers Group Ltd., Jaipur_________________________________________________________________________
Bridge Design Report_______________________________________________________________________________
After laying of SIDL
-0.1 80.0 79.9+
599.2 55.9
+ + + =
-
815.5 -146.4 669.2SIDL
Stresses due to Live load σt = 175.11 = 110.74 t/m2
1.581�j = 175.11 = 77.41 t/m2
2.262�c = 175.11 = -142.4697 t/m2
1.229σb = 175.11 = -202.54 t/m2
0.865
Stresses due to Prestress + DL + SIDL + FPLL + LLσt = 79.95 + 110.7 = 190.7 t/m2
�j = 655.15 + 77.4 = 732.6 t/m2
�c = 666.65 + -142.5 = 524.2 t/m2
σb = 669.16 + -202.5 = 466.6 t/m2
79.95 110.7 190.7
655.15 + 77.41 732.6
+ + + = +
-
669.16 -202.5 466.6Prestress + SIDL
Time dependant losses (i.e. due to relaxation of steel, shrinkage of concrete & creep of concrete) = 151.96 t
20% extra time dependant losses = 30.39 tStress due to 20% extra time dependant losses at top = 4.6 t/m2 Stress due to 20% extra time dependant losses at bottom = -53.5 t/m2
190.7 4.6 195.3
732.6 +
+ + =
-
466.6 -53.5 413.11
Live Load

Consulting Engineers Group Ltd., Jaipur_________________________________________________________________________
Bridge Design Report_______________________________________________________________________________
At first stage 3 cables has been stressed
Net ecc. of cables from bottom, eb = 0.495 mEccentricity of cables from c.g., e = 0.538 mSectional Modulus at C.G. of cables, Zc = 1.219 m3
(for precast girder only)
B.M. due to S.Wt. of the girder Md = 141.29 tmB.M.due to Cast in Situ slab Mc = 138.33 tmPrestressing force ( after friction and slip losses ) , P = 689.33 tMoment due to P, Mp = P x e = 370.81 tm
Stresses due to self weight of the girderσt = 141.29 = 229.91 t/m2
0.615�c = 141.29 = -115.88 t/m2
1.219σb = 141.29 = -222.47 t/m2
0.635
Stresses due to prestress at transfer stageσt = 689.33 - 370.81 = -79.6 t/m2
1.316 0.615�c = 689.33 + 370.81 = 828.0 t/m2
1.316 1.219σb = 689.33 + 370.81 = 1107.7 t/m2
1.316 0.635
Stresses due to initial prestress & self weight of the girderσt = 229.9 + -79.6 = 150.3 t/m2
�c = -115.9 + 828.0 = 712.1 t/m2
σb = -222.5 + 1107.7 = 885.2 t/m2
Losses due to Elastic ShorteningLoss due to Elastic Shortening = 0.5 x σ x Es/Ec
Therefore, initial loss = 2152 t/m2
(i.e. Elastic Shortening loss) = 12.74 t = 1.62 % of Jacking Force
Prestressing force after initial losses Pi = 676.59 tMoment due to Pi = Mpi = Pi x e = 363.96 tm
Loss due to Shrinkage of Concrete = �s x Es
= 1192.7 t/m2
= 7.06 t = 0.90 % of Jacking Force
STRESS CHECK AT 1-8 TH ( SEC 4-4)
STAGE -1 ( 14 TH DAY)

Consulting Engineers Group Ltd., Jaipur_________________________________________________________________________
Bridge Design Report_______________________________________________________________________________
Loss due to relaxation of steelThe loss due to relaxation of steel depends on the stress in HTS after initial losses.Ratio of average force to UTS = 0.689Loss due to friction & slip = 786.4653 - 689.3 = 97.1 t% friction and slip loss = 97.1 x 100 = 8.645 %
786.46529Ratio of average force to UTS = 0.689 - 0.086454 = 0.602
Corresponding Relaxation Loss = 5056.0 t/m2
= 29.94 t 3.81 % of Jacking Force
Loss due to Relaxation & Shrinkage = 37.00 tMoment due to Relaxation & Shrinkage loss = 19.906 tm
Stresses due to Prestress after initial lossesσt = 676.59 - 363.96 = -78.09 t/m2
1.316 0.615�c = 676.59 + 363.96 = 812.7 t/m2
1.316 1.219σb = 676.59 + 363.96 = 1087.2 t/m2
1.316 0.635
Stresses due to prestress after initial losses & self weight of the girderσt = 229.9 + -78.1 = 151.8 t/m2
�c = -115.9 + 812.7 = 696.8 t/m2
σb = -222.5 + 1087.2 = 864.8 t/m2
Stresses after Shrinkage and Relaxation lossesσt = 151.82 - 37.00 + 19.906 = 156.09 t/m2
1.316 0.615�c = 696.8 - 37.00 - 19.906 = 652.34 t/m2
1.316 1.219σb = 864.77 - 37.00 - 19.906 = 805.31 t/m2
1.316 0.635
Loss due to Creep of concrete
Airthmetic mean of initial and final stress between 14th = 674.56 t/m2
and 28 days at C.G. of cablesCreep loss = (σ/10) x εc x Εs = 1446.0 t/m2
= 8.56 t = 1.089 % of Jacking Force
Total Initial & Intermediate losses = 58.31 t = 1.09 % of Jacking Force(i.e. losses upto 28th day)Force after intermediate losses, Pint = 631.0 tMoment due to Pint = Mpint = Pint x e = 339.45 tm
Effect of prestress after Intermediate lossσt = 631.0 - 339.45 = -72.8 t/m2
1.316 0.615�c = 631.0 + 339.45 = 757.9 t/m2
1.316 1.219 σb = 631.0 + 339.45 = 1014.0 t/m2
1.316 0.635
Stresses Due to cast-in-situ slabσt = 138.3 = 225.10 t/m2
0.615�c = 138.3 = -113.45 t/m2
1.219σb = 138.3 = -217.81 t/m2
0.635

Consulting Engineers Group Ltd., Jaipur_________________________________________________________________________
Bridge Design Report_______________________________________________________________________________
RESULTANT STRESSESa) Transfer stage
229.9 -79.6 150.3 -
++ =
+ + -
-222.5 1107.7 885.2Self weight Jacking Stress
b) Just after initial loss229.9 -78.1 151.8 > -163.2 t/m2 (O.K.)
+ -
+ =
+ --222.5 1087.2 864.8 < 1632 t/m2 (O.K.)
Self wt. prestress after initial loss Refer cl. 7.1. Of IRC : 18 - 2000
c) After intermediate loss229.9 -72.8 157.1 > -163.2 t/m2 (O.K.)
+ -
+ =+ +
--222.5 1014.0 792 < 1632 t/m2 (O.K.)Self weight prestress after Net effect
intermediate loss
d) After casting of Deck Slab157.1 225.1 382.2
- +
+ =+
+-
791.5 -217.8 573.7 After Inter. Losses Cast in situ slab > -163.2 t/m2 (O.K.)
Section Modulus at top of composite section = 1.44924207 m3
Section Modulus at junction of deck slab & girder Zj = 2.0039 m3
Section Modulus at C.G. of cables Zc = 1.615 m3
Section Modulus at bottom of composite section = 0.9048 m3
Composite area of deck slab + outer girder = 2.0159 m2
first stage cablesPrestressing force ( after 1st stage ) , P1 = 631.02 tecc. of cables from bottom, eb (Ist stage) = 0.495 mEccentricity of cables from c.g., e (Ist stage) = 0.514 msecond stage cablesPrestressing force ( after friction and slip losses ) , P = 275.32 tecc. of cables from bottom, eb (2nd stage) = 0.960 mEccentricity of cables from c.g., e (2nd stage) = 0.559 m
STAGE-II (28 TH DAY ONWARD)
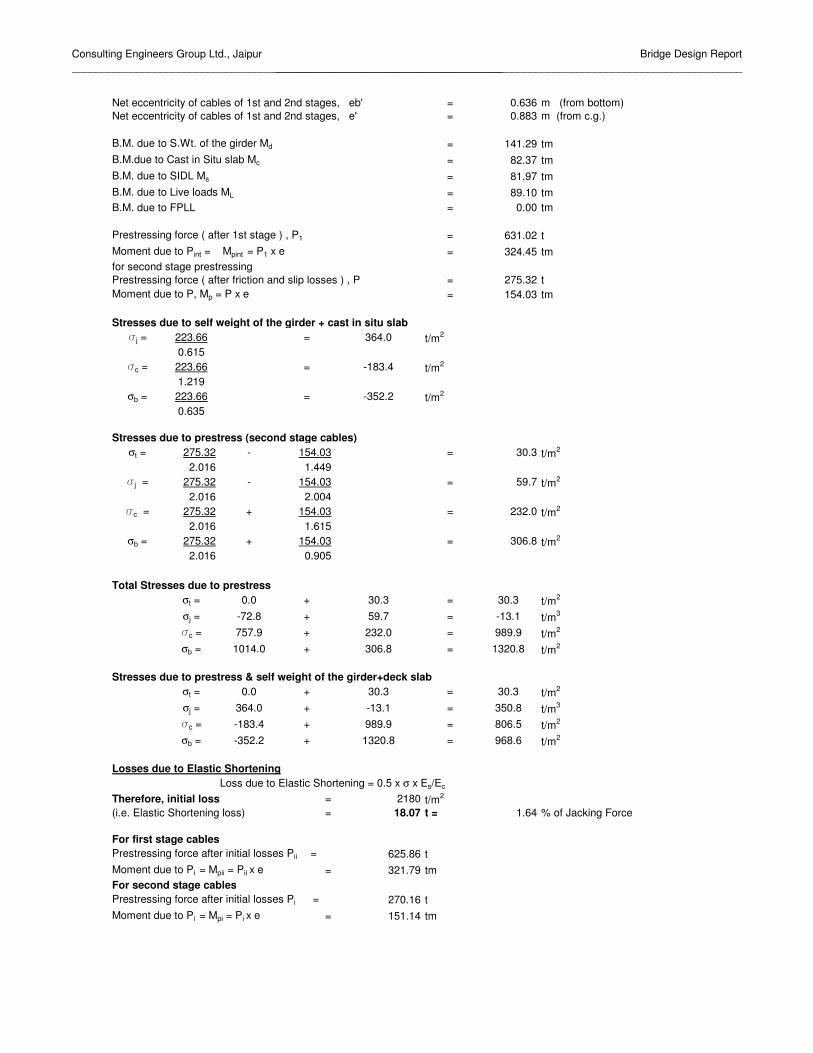
Consulting Engineers Group Ltd., Jaipur_________________________________________________________________________
Bridge Design Report_______________________________________________________________________________
Net eccentricity of cables of 1st and 2nd stages, eb' = 0.636 m (from bottom)Net eccentricity of cables of 1st and 2nd stages, e' = 0.883 m (from c.g.)
B.M. due to S.Wt. of the girder Md = 141.29 tmB.M.due to Cast in Situ slab Mc = 82.37 tmB.M. due to SIDL Ms = 81.97 tmB.M. due to Live loads ML = 89.10 tmB.M. due to FPLL = 0.00 tm
Prestressing force ( after 1st stage ) , P1 = 631.02 tMoment due to Pint = Mpint = P1 x e = 324.45 tmfor second stage prestressingPrestressing force ( after friction and slip losses ) , P = 275.32 tMoment due to P, Mp = P x e = 154.03 tm
Stresses due to self weight of the girder + cast in situ slab�j = 223.66 = 364.0 t/m2
0.615�c = 223.66 = -183.4 t/m2
1.219σb = 223.66 = -352.2 t/m2
0.635
Stresses due to prestress (second stage cables)σt = 275.32 - 154.03 = 30.3 t/m2
2.016 1.449�j = 275.32 - 154.03 = 59.7 t/m2
2.016 2.004�c = 275.32 + 154.03 = 232.0 t/m2
2.016 1.615σb = 275.32 + 154.03 = 306.8 t/m2
2.016 0.905
Total Stresses due to prestress σt = 0.0 + 30.3 = 30.3 t/m2
σj = -72.8 + 59.7 = -13.1 t/m3
�c = 757.9 + 232.0 = 989.9 t/m2
σb = 1014.0 + 306.8 = 1320.8 t/m2
Stresses due to prestress & self weight of the girder+deck slabσt = 0.0 + 30.3 = 30.3 t/m2
σj = 364.0 + -13.1 = 350.8 t/m3
�c = -183.4 + 989.9 = 806.5 t/m2
σb = -352.2 + 1320.8 = 968.6 t/m2
Losses due to Elastic ShorteningLoss due to Elastic Shortening = 0.5 x σ x Es/Ec
Therefore, initial loss = 2180 t/m2
(i.e. Elastic Shortening loss) = 18.07 t = 1.64 % of Jacking Force
For first stage cablesPrestressing force after initial losses Pii = 625.86 tMoment due to Pi = Mpii = Pii x e = 321.79 tmFor second stage cablesPrestressing force after initial losses Pi = 270.16 tMoment due to Pi = Mpi = Pi x e = 151.14 tm
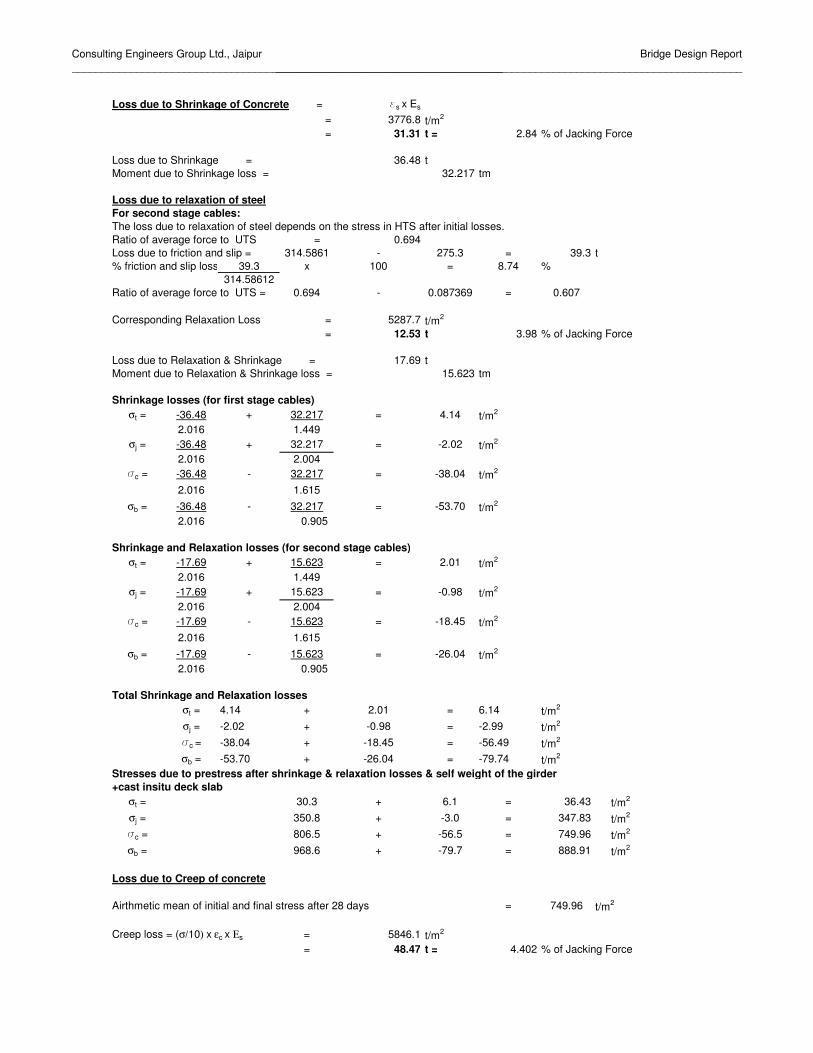
Consulting Engineers Group Ltd., Jaipur_________________________________________________________________________
Bridge Design Report_______________________________________________________________________________
Loss due to Shrinkage of Concrete = �s x Es
= 3776.8 t/m2
= 31.31 t = 2.84 % of Jacking Force
Loss due to Shrinkage = 36.48 tMoment due to Shrinkage loss = 32.217 tm
Loss due to relaxation of steelFor second stage cables:The loss due to relaxation of steel depends on the stress in HTS after initial losses.Ratio of average force to UTS = 0.694Loss due to friction and slip = 314.5861 - 275.3 = 39.3 t% friction and slip loss = 39.3 x 100 = 8.74 %
314.58612Ratio of average force to UTS = 0.694 - 0.087369 = 0.607
Corresponding Relaxation Loss = 5287.7 t/m2
= 12.53 t 3.98 % of Jacking Force
Loss due to Relaxation & Shrinkage = 17.69 tMoment due to Relaxation & Shrinkage loss = 15.623 tm
Shrinkage losses (for first stage cables)σt = -36.48 + 32.217 = 4.14 t/m2
2.016 1.449σj = -36.48 + 32.217 = -2.02 t/m2
2.016 2.004�c = -36.48 - 32.217 = -38.04 t/m2
2.016 1.615σb = -36.48 - 32.217 = -53.70 t/m2
2.016 0.905
Shrinkage and Relaxation losses (for second stage cables)σt = -17.69 + 15.623 = 2.01 t/m2
2.016 1.449σj = -17.69 + 15.623 = -0.98 t/m2
2.016 2.004�c = -17.69 - 15.623 = -18.45 t/m2
2.016 1.615σb = -17.69 - 15.623 = -26.04 t/m2
2.016 0.905
Total Shrinkage and Relaxation losses σt = 4.14 + 2.01 = 6.14 t/m2
σj = -2.02 + -0.98 = -2.99 t/m2
�c = -38.04 + -18.45 = -56.49 t/m2
σb = -53.70 + -26.04 = -79.74 t/m2
Stresses due to prestress after shrinkage & relaxation losses & self weight of the girder+cast insitu deck slab
σt = 30.3 + 6.1 = 36.43 t/m2
σj = 350.8 + -3.0 = 347.83 t/m2
�c = 806.5 + -56.5 = 749.96 t/m2
σb = 968.6 + -79.7 = 888.91 t/m2
Loss due to Creep of concrete
Airthmetic mean of initial and final stress after 28 days = 749.96 t/m2
Creep loss = (σ/10) x εc x Εs = 5846.1 t/m2
= 48.47 t = 4.402 % of Jacking Force
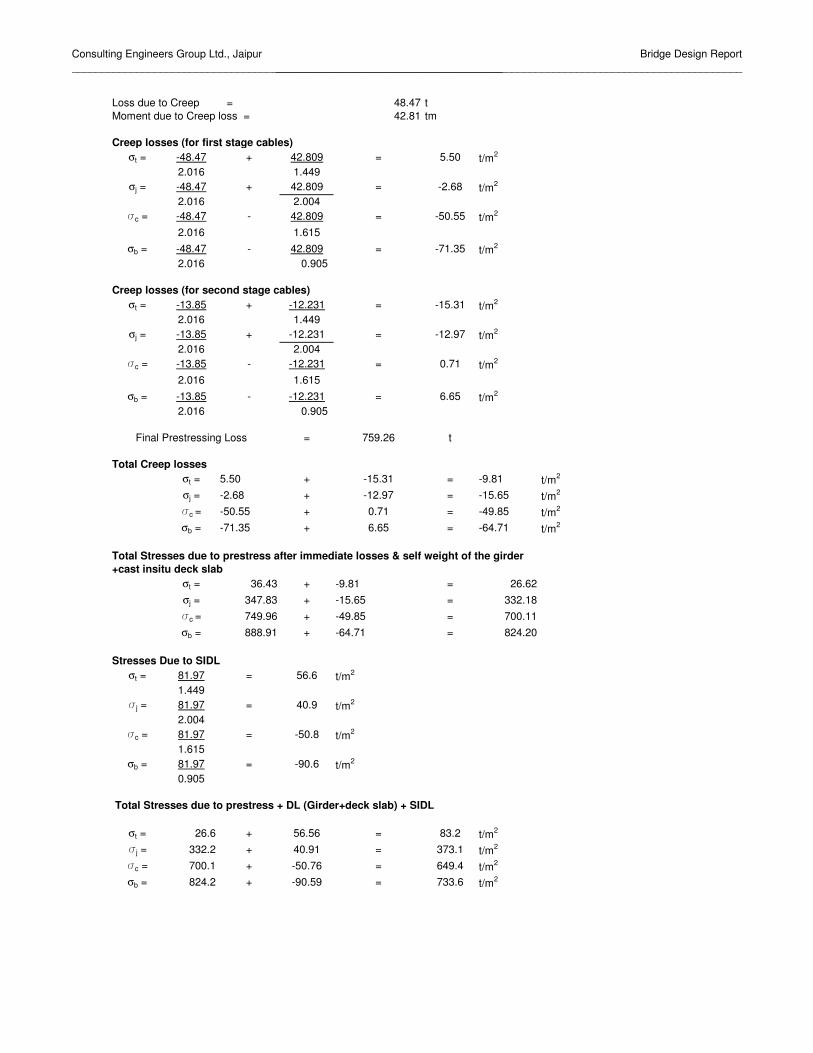
Consulting Engineers Group Ltd., Jaipur_________________________________________________________________________
Bridge Design Report_______________________________________________________________________________
Loss due to Creep = 48.47 tMoment due to Creep loss = 42.81 tm
Creep losses (for first stage cables)σt = -48.47 + 42.809 = 5.50 t/m2
2.016 1.449σj = -48.47 + 42.809 = -2.68 t/m2
2.016 2.004�c = -48.47 - 42.809 = -50.55 t/m2
2.016 1.615σb = -48.47 - 42.809 = -71.35 t/m2
2.016 0.905
Creep losses (for second stage cables)σt = -13.85 + -12.231 = -15.31 t/m2
2.016 1.449σj = -13.85 + -12.231 = -12.97 t/m2
2.016 2.004�c = -13.85 - -12.231 = 0.71 t/m2
2.016 1.615σb = -13.85 - -12.231 = 6.65 t/m2
2.016 0.905
Final Prestressing Loss = 759.26 t
Total Creep losses σt = 5.50 + -15.31 = -9.81 t/m2
σj = -2.68 + -12.97 = -15.65 t/m2
�c = -50.55 + 0.71 = -49.85 t/m2
σb = -71.35 + 6.65 = -64.71 t/m2
Total Stresses due to prestress after immediate losses & self weight of the girder+cast insitu deck slab
σt = 36.43 + -9.81 = 26.62σj = 347.83 + -15.65 = 332.18�c = 749.96 + -49.85 = 700.11σb = 888.91 + -64.71 = 824.20
Stresses Due to SIDLσt = 81.97 = 56.6 t/m2
1.449�j = 81.97 = 40.9 t/m2
2.004�c = 81.97 = -50.8 t/m2
1.615σb = 81.97 = -90.6 t/m2
0.905
Total Stresses due to prestress + DL (Girder+deck slab) + SIDL
σt = 26.6 + 56.56 = 83.2 t/m2
�j = 332.2 + 40.91 = 373.1 t/m2
�c = 700.1 + -50.76 = 649.4 t/m2
σb = 824.2 + -90.59 = 733.6 t/m2

Consulting Engineers Group Ltd., Jaipur_________________________________________________________________________
Bridge Design Report_______________________________________________________________________________
After laying of SIDL
26.6 56.6 83.2+
332.2 40.9
+ + + =
-
824.2 -90.6 733.6SIDL
Stresses due to Live load σt = 89.10 = 61.48 t/m2
1.449�j = 89.10 = 44.46 t/m2
2.004�c = 89.10 = -55.1773 t/m2
1.615σb = 89.10 = -98.47 t/m2
0.905
Stresses due to Prestress + DL + SIDL + FPLL + LLσt = 83.18 + 61.5 = 144.7 t/m2
�j = 373.08 + 44.5 = 417.5 t/m2
�c = 649.35 + -55.2 = 594.2 t/m2
σb = 733.61 + -98.5 = 635.1 t/m2
83.18 61.5 144.7
373.08 + 44.46 417.5
+ + = +
-
733.61 -98.5 635.1Prestress + SIDL
Time dependant losses (i.e. due to relaxation of steel, shrinkage of concrete & creep of concrete) = 137.87 t
20% extra time dependant losses = 27.57 tStress due to 20% extra time dependant losses at top = 3.1 t/m2 Stress due to 20% extra time dependant losses at bottom = -40.6 t/m2
144.7 3.1 147.8
417.5 +
+ + =
-
635.1 -40.6 594.55
Live Load

Consulting Engineers Group Ltd., Jaipur_________________________________________________________________________
Bridge Design Report_______________________________________________________________________________
At first stage 3 cables has been stressed
Net ecc. of cables from bottom, eb = 0.584 mEccentricity of cables from c.g., e = 0.465 mSectional Modulus at C.G. of cables, Zc = 1.491 m3
(for precast girder only)
B.M. due to S.Wt. of the girder Md = 92.26 tmB.M.due to Cast in Situ slab Mc = 88.01 tmPrestressing force ( after friction and slip losses ) , P = 681.31 tMoment due to P, Mp = P x e = 316.78 tm
Stresses due to self weight of the girderσt = 92.26 = 139.90 t/m2
0.659�c = 92.26 = -61.89 t/m2
1.491σb = 92.26 = -139.61 t/m2
0.661
Stresses due to prestress at transfer stageσt = 681.31 - 316.78 = -37.6 t/m2
1.539 0.659�c = 681.31 + 316.78 = 655.3 t/m2
1.539 1.491σb = 681.31 + 316.78 = 922.2 t/m2
1.539 0.661
Stresses due to initial prestress & self weight of the girderσt = 139.9 + -37.6 = 102.3 t/m2
�c = -61.9 + 655.3 = 593.4 t/m2
σb = -139.6 + 922.2 = 782.6 t/m2
Losses due to Elastic ShorteningLoss due to Elastic Shortening = 0.5 x σ x Es/Ec
Therefore, initial loss = 1793 t/m2
(i.e. Elastic Shortening loss) = 10.62 t = 1.35 % of Jacking Force
Prestressing force after initial losses Pi = 670.69 tMoment due to Pi = Mpi = Pi x e = 311.85 tm
Loss due to Shrinkage of Concrete = �s x Es
= 1192.7 t/m2
= 7.06 t = 0.90 % of Jacking Force
STRESS CHECK AT EFF. DEPTH ( SEC 5-5)
STAGE -1 ( 14 TH DAY)

Consulting Engineers Group Ltd., Jaipur_________________________________________________________________________
Bridge Design Report_______________________________________________________________________________
Loss due to relaxation of steelThe loss due to relaxation of steel depends on the stress in HTS after initial losses.Ratio of average force to UTS = 0.691Loss due to friction & slip = 786.4653 - 681.3 = 105.2 t% friction and slip loss = 105.2 x 100 = 9.360 %
786.46529Ratio of average force to UTS = 0.691 - 0.093597 = 0.597
Corresponding Relaxation Loss = 4796.2 t/m2
= 28.40 t 3.61 % of Jacking Force
Loss due to Relaxation & Shrinkage = 35.47 tMoment due to Relaxation & Shrinkage loss = 16.490 tm
Stresses due to Prestress after initial lossesσt = 670.69 - 311.85 = -36.98 t/m2
1.539 0.659�c = 670.69 + 311.85 = 645.1 t/m2
1.539 1.491σb = 670.69 + 311.85 = 907.8 t/m2
1.539 0.661
Stresses due to prestress after initial losses & self weight of the girderσt = 139.9 + -37.0 = 102.9 t/m2
�c = -61.9 + 645.1 = 583.2 t/m2
σb = -139.6 + 907.8 = 768.2 t/m2
Stresses after Shrinkage and Relaxation lossesσt = 102.92 - 35.47 + 16.490 = 104.88 t/m2
1.539 0.659�c = 583.2 - 35.47 - 16.490 = 549.08 t/m2
1.539 1.491σb = 768.18 - 35.47 - 16.490 = 720.18 t/m2
1.539 0.661
Loss due to Creep of concrete
Airthmetic mean of initial and final stress between 14th = 566.13 t/m2
and 28 days at C.G. of cablesCreep loss = (σ/10) x εc x Εs = 1213.6 t/m2
= 7.19 t = 0.914 % of Jacking Force
Total Initial & Intermediate losses = 53.27 t = 0.91 % of Jacking Force(i.e. losses upto 28th day)Force after intermediate losses, Pint = 628.0 tMoment due to Pint = Mpint = Pint x e = 292.01 tm
Effect of prestress after Intermediate lossσt = 628.0 - 292.01 = -34.6 t/m2
1.539 0.659�c = 628.0 + 292.01 = 604.1 t/m2
1.539 1.491 σb = 628.0 + 292.01 = 850.1 t/m2
1.539 0.661
Stresses Due to cast-in-situ slabσt = 88.0 = 133.45 t/m2
0.659�c = 88.0 = -59.04 t/m2
1.491σb = 88.0 = -133.18 t/m2
0.661

Consulting Engineers Group Ltd., Jaipur_________________________________________________________________________
Bridge Design Report_______________________________________________________________________________
RESULTANT STRESSESa) Transfer stage
139.9 -37.6 102.3 -
++ =
+ + -
-139.6 922.2 782.6Self weight Jacking Stress
b) Just after initial loss139.9 -37.0 102.9 > -163.2 t/m2 (O.K.)
+ -
+ =
+ --139.6 907.8 768.2 < 1632 t/m2 (O.K.)
Self wt. prestress after initial loss Refer cl. 7.1. Of IRC : 18 - 2000
c) After intermediate loss139.9 -34.6 105.3 > -163.2 t/m2 (O.K.)
+ -
+ =+ +
--139.6 850.1 710 < 1632 t/m2 (O.K.)Self weight prestress after Net effect
intermediate loss
d) After casting of Deck Slab105.3 133.5 238.7
- +
+ =+
+-
710.4 -133.2 577.3 After Inter. Losses Cast in situ slab > -163.2 t/m2 (O.K.)
Section Modulus at top of composite section = 1.58588333 m3
Section Modulus at junction of deck slab & girder Zj = 2.1970 m3
Section Modulus at C.G. of cables Zc = 1.995 m3
Section Modulus at bottom of composite section = 0.9822 m3
Composite area of deck slab + outer girder = 2.3386 m2
first stage cablesPrestressing force ( after 1st stage ) , P1 = 628.03 tecc. of cables from bottom, eb (Ist stage) = 0.584 mEccentricity of cables from c.g., e (Ist stage) = 0.425 msecond stage cablesPrestressing force ( after friction and slip losses ) , P = 272.14 tecc. of cables from bottom, eb (2nd stage) = 1.090 mEccentricity of cables from c.g., e (2nd stage) = 0.429 m
Net eccentricity of cables of 1st and 2nd stages, eb' = 0.737 m (from bottom)Net eccentricity of cables of 1st and 2nd stages, e' = 0.782 m (from c.g.)
STAGE-II (28 TH DAY ONWARD)

Consulting Engineers Group Ltd., Jaipur_________________________________________________________________________
Bridge Design Report_______________________________________________________________________________
B.M. due to S.Wt. of the girder Md = 92.26 tmB.M.due to Cast in Situ slab Mc = 32.05 tmB.M. due to SIDL Ms = 51.30 tmB.M. due to Live loads ML = 54.36 tmB.M. due to FPLL = 0.00 tm
Prestressing force ( after 1st stage ) , P1 = 628.03 tMoment due to Pint = Mpint = P1 x e = 266.92 tmfor second stage prestressingPrestressing force ( after friction and slip losses ) , P = 272.14 tMoment due to P, Mp = P x e = 116.85 tm
Stresses due to self weight of the girder + cast in situ slab�j = 124.31 = 188.5 t/m2
0.659�c = 124.31 = -83.4 t/m2
1.491σb = 124.31 = -188.1 t/m2
0.661
Stresses due to prestress (second stage cables)σt = 272.14 - 116.85 = 42.7 t/m2
2.339 1.586�j = 272.14 - 116.85 = 63.2 t/m2
2.339 2.197�c = 272.14 + 116.85 = 174.9 t/m2
2.339 1.995σb = 272.14 + 116.85 = 235.3 t/m2
2.339 0.982
Total Stresses due to prestress σt = 0.0 + 42.7 = 42.7 t/m2
σj = -34.6 + 63.2 = 28.6 t/m3
�c = 604.1 + 174.9 = 779.0 t/m2
σb = 850.1 + 235.3 = 1085.4 t/m2
Stresses due to prestress & self weight of the girder+deck slabσt = 0.0 + 42.7 = 42.7 t/m2
σj = 188.5 + 28.6 = 217.1 t/m3
�c = -83.4 + 779.0 = 695.6 t/m2
σb = -188.1 + 1085.4 = 897.3 t/m2
Losses due to Elastic ShorteningLoss due to Elastic Shortening = 0.5 x σ x Es/Ec
Therefore, initial loss = 1880 t/m2
(i.e. Elastic Shortening loss) = 15.59 t = 1.42 % of Jacking Force
For first stage cablesPrestressing force after initial losses Pii = 623.58 tMoment due to Pi = Mpii = Pii x e = 265.02 tmFor second stage cablesPrestressing force after initial losses Pi = 267.69 tMoment due to Pi = Mpi = Pi x e = 114.94 tm
Loss due to Shrinkage of Concrete = �s x Es
= 3776.8 t/m2
= 31.31 t = 2.84 % of Jacking Force
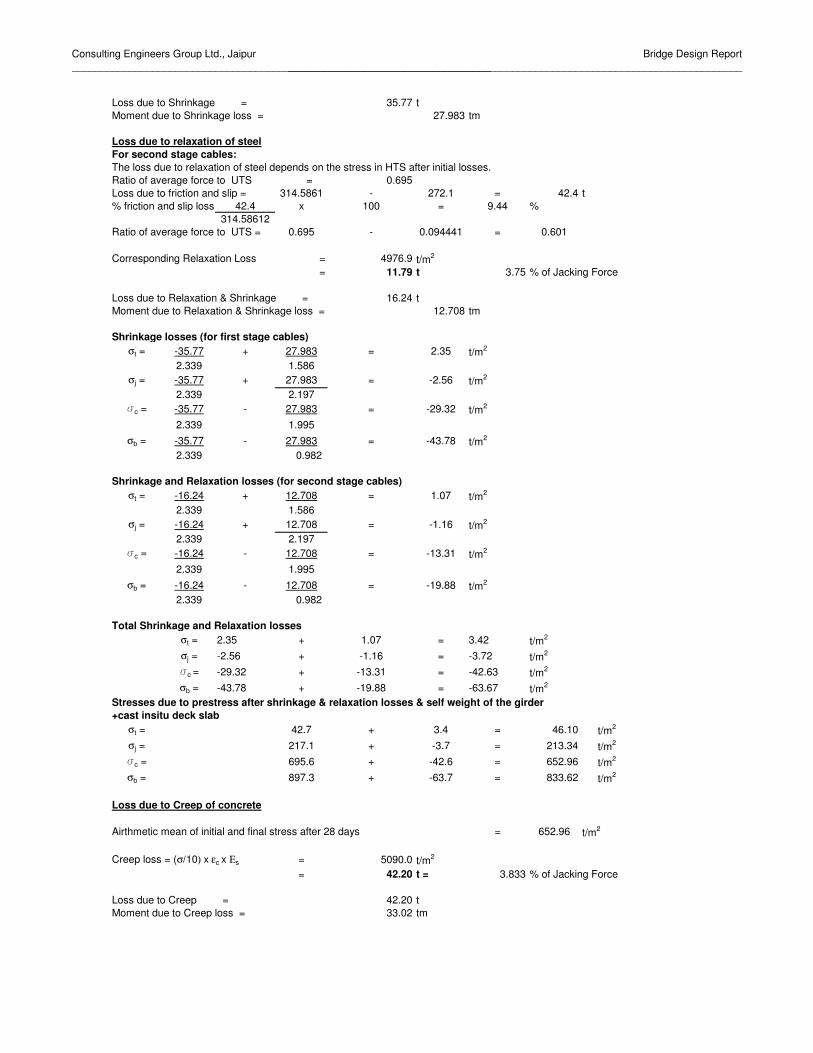
Consulting Engineers Group Ltd., Jaipur_________________________________________________________________________
Bridge Design Report_______________________________________________________________________________
Loss due to Shrinkage = 35.77 tMoment due to Shrinkage loss = 27.983 tm
Loss due to relaxation of steelFor second stage cables:The loss due to relaxation of steel depends on the stress in HTS after initial losses.Ratio of average force to UTS = 0.695Loss due to friction and slip = 314.5861 - 272.1 = 42.4 t% friction and slip loss = 42.4 x 100 = 9.44 %
314.58612Ratio of average force to UTS = 0.695 - 0.094441 = 0.601
Corresponding Relaxation Loss = 4976.9 t/m2
= 11.79 t 3.75 % of Jacking Force
Loss due to Relaxation & Shrinkage = 16.24 tMoment due to Relaxation & Shrinkage loss = 12.708 tm
Shrinkage losses (for first stage cables)σt = -35.77 + 27.983 = 2.35 t/m2
2.339 1.586σj = -35.77 + 27.983 = -2.56 t/m2
2.339 2.197�c = -35.77 - 27.983 = -29.32 t/m2
2.339 1.995σb = -35.77 - 27.983 = -43.78 t/m2
2.339 0.982
Shrinkage and Relaxation losses (for second stage cables)σt = -16.24 + 12.708 = 1.07 t/m2
2.339 1.586σj = -16.24 + 12.708 = -1.16 t/m2
2.339 2.197�c = -16.24 - 12.708 = -13.31 t/m2
2.339 1.995σb = -16.24 - 12.708 = -19.88 t/m2
2.339 0.982
Total Shrinkage and Relaxation losses σt = 2.35 + 1.07 = 3.42 t/m2
σj = -2.56 + -1.16 = -3.72 t/m2
�c = -29.32 + -13.31 = -42.63 t/m2
σb = -43.78 + -19.88 = -63.67 t/m2
Stresses due to prestress after shrinkage & relaxation losses & self weight of the girder+cast insitu deck slab
σt = 42.7 + 3.4 = 46.10 t/m2
σj = 217.1 + -3.7 = 213.34 t/m2
�c = 695.6 + -42.6 = 652.96 t/m2
σb = 897.3 + -63.7 = 833.62 t/m2
Loss due to Creep of concrete
Airthmetic mean of initial and final stress after 28 days = 652.96 t/m2
Creep loss = (σ/10) x εc x Εs = 5090.0 t/m2
= 42.20 t = 3.833 % of Jacking Force
Loss due to Creep = 42.20 tMoment due to Creep loss = 33.02 tm

Consulting Engineers Group Ltd., Jaipur_________________________________________________________________________
Bridge Design Report_______________________________________________________________________________
Creep losses (for first stage cables)σt = -42.20 + 33.016 = 2.77 t/m2
2.339 1.586σj = -42.20 + 33.016 = -3.02 t/m2
2.339 2.197�c = -42.20 - 33.016 = -34.59 t/m2
2.339 1.995σb = -42.20 - 33.016 = -51.66 t/m2
2.339 0.982
Creep losses (for second stage cables)σt = -12.06 + -9.433 = -11.10 t/m2
2.339 1.586σj = -12.06 + -9.433 = -9.45 t/m2
2.339 2.197�c = -12.06 - -9.433 = -0.43 t/m2
2.339 1.995σb = -12.06 - -9.433 = 4.45 t/m2
2.339 0.982
Final Prestressing Force = 766.54 t
Total Creep losses σt = 2.77 + -11.10 = -8.33 t/m2
σj = -3.02 + -9.45 = -12.47 t/m2
�c = -34.59 + -0.43 = -35.02 t/m2
σb = -51.66 + 4.45 = -47.21 t/m2
Total Stresses due to prestress after immediate losses & self weight of the girder+cast insitu deck slab
σt = 46.10 + -8.33 = 37.77σj = 213.34 + -12.47 = 200.87�c = 652.96 + -35.02 = 617.95σb = 833.62 + -47.21 = 786.41
Stresses Due to SIDLσt = 51.30 = 32.3 t/m2
1.586�j = 51.30 = 23.4 t/m2
2.197�c = 51.30 = -25.7 t/m2
1.995σb = 51.30 = -52.2 t/m2
0.982
Total Stresses due to prestress + DL (Girder+deck slab) + SIDL
σt = 37.8 + 32.35 = 70.1 t/m2
�j = 200.9 + 23.35 = 224.2 t/m2
�c = 617.9 + -25.71 = 592.2 t/m2
σb = 786.4 + -52.23 = 734.2 t/m2

Consulting Engineers Group Ltd., Jaipur_________________________________________________________________________
Bridge Design Report_______________________________________________________________________________
After laying of SIDL
37.8 32.3 70.1+
200.9 23.4
+ + + =
-
786.4 -52.2 734.2SIDL
Stresses due to Live load σt = 54.36 = 34.28 t/m2
1.586�j = 54.36 = 24.74 t/m2
2.197�c = 54.36 = -27.24261 t/m2
1.995σb = 54.36 = -55.35 t/m2
0.982
Stresses due to Prestress + DL + SIDL + FPLL + LLσt = 70.12 + 34.3 = 104.4 t/m2
�j = 224.22 + 24.7 = 249.0 t/m2
�c = 592.24 + -27.2 = 565.0 t/m2
σb = 734.18 + -55.3 = 678.8 t/m2
70.12 34.3 104.4
224.22 + 24.74 249.0
+ + = +
-
734.18 -55.3 678.8Prestress + SIDL
Time dependant losses (i.e. due to relaxation of steel, shrinkage of concrete & creep of concrete) = 127.95 t
20% extra time dependant losses = 25.59 tStress due to 20% extra time dependant losses at top = 1.7 t/m2 Stress due to 20% extra time dependant losses at bottom = -31.3 t/m2
104.4 1.7 106.1
249.0 +
+ + =
-
678.8 -31.3 647.50
Live Load

Consulting Engineers Group Ltd., Jaipur_________________________________________________________________________
Bridge Design Report_______________________________________________________________________________
SUMMARY OF MAXIMUM BENDING MOMENT & SHEAR FORCE
GIRDER G1 :
a) BENDING MOMENT (tm)
1-1 2-2 3-3 3-3 4-4 5-5a) Self Weight of Girder 316.27 296.83 238.50 238.50 141.29 92.26b) Deck Slab 268.46 248.82 201.05 201.05 114.01 72.45c) SIDL 163.30 164.75 126.54 126.54 81.97 51.30d)FPLL 0.00 0.00 0.00 0.00 0.00 0.0e) LL 238.92 207.59 175.11 175.11 89.10 54.36f) TOTAL 986.95 917.99 741.20 741.20 426.37 270.37g) LL BM corresponding to Max S.F.case
198.15 195.41 170.34 170.34 88.84 54.05
b) SHEAR FORCE (t)LOADING
1-1 2-2 3-3 3-3 4-4 5-5a) Self Weight of Girder 0.00 10.37 20.74 20.74 31.11 36.06b) Deck Slab 1.49 8.99 19.46 19.46 26.96 29.88c) SIDL 2.00 8.60 10.30 10.30 20.35 21.61d)FPLL 0.00 0.00 0.00 0.00 0.00 0.00e) LL 12.22 13.70 22.64 22.64 23.95 24.46f) TOTAL 15.71 41.66 73.14 73.14 102.37 112.01g) LL Shear corresponding to max BM case
7.65 8.94 21.94 21.94 23.89 23.76
ULTIMATE BENDING MOMENT AND SHEAR FORCEa) Maximum Bending Moment & corressponding Shear Force
Section 1-1 2-2 2-2 3-3 4-4 5-51.25DL 730.9 682.1 682.1 549.4 319.1 205.92SIDL 326.6 329.5 329.5 253.1 163.9 102.62.5LL 597.3 519.0 519.0 437.8 222.8 135.9
TOTAL Mu 1654.8 1530.5 1530.5 1240.3 705.8 444.4
1.25DL 1.9 24.2 24.2 50.3 72.6 82.42SIDL 4.0 17.2 17.2 20.6 40.7 43.22.5LL 19.1 22.4 54.9 54.9 59.7 59.4
TOTAL Vu 25.0 63.8 96.3 125.7 173.0 185.0
b) Maximum Shear force and Corressponding Bending MomentSection 1-1 2-2 2-2 3-3 4-4 5-51.25DL 1.9 24.2 24.2 50.3 72.6 82.42SIDL 4.00 17.20 17.20 20.60 40.70 43.222.5LL 30.6 34.3 34.3 56.6 59.9 61.2
TOTAL Vu 36.4 75.7 75.7 127.5 173.2 186.8
1.25DL 730.9 682.1 682.1 549.4 319.1 205.92SIDL 326.6 329.5 329.5 253.1 163.9 102.62.5LL 495.4 488.5 488.5 425.9 222.1 135.1
TOTAL Mu 1552.9 1500.1 1500.1 1228.4 705.2 443.6
LOADING
Shear Force corresponding to Max Bending Moment (t)
Bending Moment (tm)
SHEAR FORCE (t)
BENDING MOMENTS CORRESSPONDING TO MAX
SHEAR (tm)
SECTIONS
SECTIONS

Consulting Engineers Group Ltd., Jaipur_________________________________________________________________________
Bridge Design Report_______________________________________________________________________________
SECTION PROPERTIESSection 1-1 2-2 2-2 3-3 4-4 5-5Sectional area, A m2 1.906 1.906 1.906 1.906 2.016 2.239Moment of Inertia, Iz m4 1.314 1.314 1.314 1.314 1.309 1.362C.G. of section from top,Yt m 0.831 0.831 0.831 0.831 0.903 0.933C.G. of section from bottom, Yb m 1.519 1.519 1.519 1.519 1.447 1.417Sectional modulus at top, Zt m3 1.581 1.581 1.581 1.581 1.449 1.460Sectional modulus at bottom, Zb m3 0.865 0.865 0.865 0.865 0.905 0.962Width of the web, b m 0.275 0.275 0.275 0.275 0.438 0.6Overall Depth of Section, d m
Section 1-1 2-2 2-2 3-3 4-4 5-5Total No. of cables 7 7 7 7 7 7Final prestressing force, Pf t 775.57 809.47 809.47 761.88 759.26 766.54Eccentricity from bottom, eb m 0.332 0.363 0.36279805 0.451 0.636 0.737db = D - eb m 2.018 1.987 1.987 1.899 1.714 1.613
Average thickness of compression flange, t = 0.347 m Bf = 3200 mm
ULTIMATE MOMENT CAPACITYAs per Clause 13 of IRC:18 - 2000 1-1 2-2 2-2 3-3 4-4Mults* = 0.9 db As fp 2856.2 2813.2 2813.2 2688.9 2426.3 2283.5Multc** = 0.176 b db
2 fck + Part1 803.8 779.8 779.8 712.4 922.9 1121.12/3 x 0.8 (Bf - b)(db - t/2) x t x fck Part2 4069.8 4002.8 4002.8 3809.0 3210.9 2824.2
Total 4873.6 4782.6 4782.6 4521.4 4133.7 3945.2Mult = min(Mults and Multc) 2856.2 2813.2 2813.2 2688.9 2426.3 2283.5Mu 1654.8 1530.5 1530.5 1240.3 705.8 444.4Remarks O.K. O.K. O.K. O.K. O.K. O.K.* Mults Moment capacity due to yield of steel.** Multc Moment capacity due to crushing of concrete.
CALCULATION OF DEPTH OF TENSILE ZONESection 1-1 2-2 2-2 3-3 4-4 5-5σt = 0.8 x (Pf/A - Mf/Zt) + Mult/Zt t/m2 1666.1 1645.2 1645.2 1608.3 1635.7 1552.9
σb = 0.8 x (Pf/A+Mf/Zb)- Mult/Zb t/m2 -2126.3 -2047.9 -2047.9 -2036.9 -1836.0 -1667.3Depth of tensile zone, z m 1.318 1.303 1.303 1.313 1.243 1.217C.G. of cables in tensile zone from bottom, eb m 0.332 0.363 0.363 0.451 0.636 0.737db = (D - emax), but not < 0.8D m 2.018 1.987 1.987 1.899 1.880 1.880
2.35

Consulting Engineers Group Ltd., Jaipur_________________________________________________________________________
Bridge Design Report_______________________________________________________________________________
SHEAR CAPACITY AND SHEAR REINFORCEMENTft = Maximum principal tensile stress
= 0.24√fck = 154.83 t/m2 (As per Clause 14.1.2 of IRC:18)
fcp = Stress due to prestress only at centroidal axis of composite sectionfpt = Stress due to prestress only at tensile fibre of composite section
= d - 0.060 = 2.290 m
Maximum Ultimate shear stress = 479.4 t/m2 (As per Table 6 of IRC:18)units 1-1 2-2 2-2 3-3 4-4 5-5
b = web thickness = 275 - 75 x 2/3 m 0.225 0.225 0.225 0.225 0.388 0.550fcp t/m2
406.86 424.64 424.64 399.68 376.64 342.41Vco* = 0.67bd√ (ft
2 + 0.8fcpft) t 96.6 98.0 98.0 96.0 162.1 223.1db = d - eb m 2.018 1.987 1.987 1.899 1.880 1.880fpt t/m2
1471.6 1507.4 1507.4 1341.4 1056.9 884.3Mt = (0.37√fck + 0.8fpt)I/y tm 1224.2 1249.0 1249.0 1134.2 981.0 909.8Vcr = 0.037bdb√fck + (Mt/Mu) t 39.5 73.7 73.7 127.9 258.3 407.8
Vcrmin = 0.1 bd√fck t 34.1 34.1 34.1 34.1 58.7 83.4Vcr = max (Vcr, Vcrmin) t 39.5 73.7 73.7 127.9 258.3 407.8Vc = min (Vco,Vcr) t 39.5 73.7 73.7 96.0 162.1 223.1Vu t 36.4 75.7 75.7 127.5 173.2 186.8Remarks Vc>Vu>Vc/2 Vu>Vc Vu>Vc Vu>Vc Vu>Vc Vc>Vu>Vc/2
(Asv/Sv)min = 0.4b/(0.87fyv) (cm2/m) 2.493 2.493 2.493 2.493 4.293 6.093
Asv/Sv = (V-Vc)/(0.87fyvdt) (cm2/m) 0.00 0.24 0.24 3.80 1.33 0.00
Provide Asv/Sv = (cm2/m) 2.49 2.49 2.49 3.80 4.29 6.09vu = Vu/bdb where, b = 225mm t/m2 80.2 169.2 169.2 298.2 237.7 180.7Remarks O.K. O.K. O.K. O.K. O.K. O.K. Vco Uncracked shear capacity of the section.Vcr Cracked shear capacityVc Shear capacityVu Ultimate shear Shear reinforcement
fyv Yield strength of shear reinforcementvu Shear stress
dt = Depth from extreme compression fibre either to the longitudinal bars or to the centroid of the tendons whichever is greater)

Consulting Engineers Group Ltd., Jaipur_________________________________________________________________________
Bridge Design Report_______________________________________________________________________________
ULTIMATE T0RSION & SHEARGIRDER G1
2.5 (LL*I.F. 2.5 (LL*I.F.SEC. DL 1.25 DL SIDL 2.0 SIDL LL FPLL + FPLL) ULT DL 1.25 DL SIDL 2.0 SIDL LL FPLL + FPLL) ULT1-1 0.00 0.00 2.88 5.76 0.54 0.00 1.36 7.12 1.49 1.86 2.00 4.00 4.20 0.00 10.50 16.362- 2 0.00 0.00 3.10 6.20 0.65 0.00 1.62 7.82 19.36 24.20 8.60 17.20 2.77 0.00 6.93 48.333- 3 0.00 0.00 1.74 3.48 2.02 0.00 5.04 8.52 40.20 50.25 10.30 20.60 19.88 0.00 49.70 120.55 4- 4 0.00 0.00 5.73 11.46 2.81 0.00 7.03 18.49 58.07 72.59 20.35 40.70 19.38 0.00 48.45 161.74
5- 5 0.00 0.00 5.73 11.46 2.81 0.00 7.03 18.49 65.94 82.43 21.61 43.22 19.38 0.00 48.45 174.10
CASE 2 MAXIMUM SHEAR FORCE (t) & CORR. TORSIONAL MOMENT(t.m)2.5 (LL*I.F. 2.5 (LL*I.F.
SEC. DL 1.25 DL SIDL 2.0 SIDL LL FPLL + FPLL) ULT DL 1.25 DL SIDL 2.0 SIDL LL FPLL + FPLL) ULT1-1 1.49 1.86 2.00 4.00 11.53 0.00 28.83 34.69 0.00 0.00 2.88 5.76 0.09 0.00 0.23 5.992- 2 19.36 24.20 8.60 17.20 12.16 0.00 30.40 71.80 0.00 0.00 3.10 6.20 0.28 0.00 0.70 6.903- 3 40.20 50.25 10.30 20.60 20.29 0.00 50.73 121.58 0.00 0.00 1.74 3.48 0.69 0.00 1.73 5.21 4- 4 58.07 72.59 20.35 40.70 20.50 0.00 51.25 164.54 0.00 0.00 5.73 11.46 1.08 0.00 2.70 14.16 5- 5 65.94 82.43 21.61 43.22 20.95 0.00 52.38 178.02 0.00 0.00 5.73 11.46 1.17 0.00 2.93 14.39
CHECK FOR TOTAL ULTIMATE SHEAR STRESSEach component Rectangle will be subjected to a Torque = T(hmax * hmin^3)/(Σhmax *hmin^3)=
= T x C (say)Component
Rectangle hmax hmin
hmax * hmin ^3 C
1 3200 250 5.00E+10 0.302 1250 230 1.52E+10 0.093 1450 275 3.02E+10 0.184 1000 420 7.41E+10 0.44
Σ 1.69E+11
CASE 1 MAX. TORSIONAL MOMENT (t.m) & CORR. SHEAR FORCE(t)MAXIMUM TORSIONAL MOMENT CORRESPONDING SHEAR FORCE
MAXIMUM SHEAR FORCE CORRESPONDING TORSIONAL MOMENT

Consulting Engineers Group Ltd., Jaipur_________________________________________________________________________
Bridge Design Report_______________________________________________________________________________
Torsional Shear Stress= 2 T / (hmin ^2)/(hmax-hmin/3)CASE 1 MAX. TORSIONAL MOMENT & CORR. SHEAR FORCE
1 2 3 4 1 2 3 41-1 7.12 2.10 0.64 1.27 3.11 21.6 20.6 24.7 41.0 16.362-2 7.82 2.31 0.70 1.39 3.42 23.7 22.6 27.1 45.0 48.333-3 8.52 2.51 0.76 1.52 3.73 25.8 24.6 29.5 49.1 120.554-4 18.49 5.45 1.66 3.29 8.08 56.0 53.5 64.0 106.5 161.745-5 18.49 5.45 1.66 3.29 8.08 56.0 53.5 64.0 106.5 174.10
PERMISSIBLE VALUE OF TOTAL ULT. SHEAR STRESS =484.5 t/m^2
1 2 3 4Hmax 3.2 1.25 1.45 1Hmin 0.25 0.23 0.275 0.42
CASE 2 MAX. SHEAR FORCE & CORR. TORSIONAL MOMENT
1 2 3 4 1 2 3 41-1 5.99 1.77 0.54 1.07 2.62 18.13 17.31 20.74 34.50 34.692-2 6.90 2.04 0.62 1.23 3.02 20.90 19.95 23.91 39.77 71.803-3 5.21 1.54 0.47 0.93 2.28 15.77 15.05 18.03 30.00 121.584-4 14.16 4.18 1.27 2.52 6.19 42.90 40.95 49.06 81.62 164.545-5 14.39 4.24 1.29 2.56 6.29 43.58 41.60 49.84 82.92 178.02
CALCULATION OF TORSION REINFORCEMENT
AS PER CLAUSE 14.2.3.1 OF IRC : 18 - 2000REINFORCEMENT FOR TORSION Asv/Sv >= T / (0.8 * X1 * Y1 * 0.87 * Fyv )AREA OR LONG. REINFORCEMENT Asl >= Asv/Sv * (X1 + Y1 ) * ( Fyv / Fyl )
42330 X1 is the smaller dimension of the link measured between centres of legsY1 is the larger dimension of the link measured between centres of legs
According to clause 14.2.2 of IRC-18:2000 , torsion reinforcement is not required if Vtu < 42.75 t/m^2
b db
ULTIMATE SHEAR STRESS
DUE TO S.F. V V + Vtu (t/m^2)
61135193
TOTAL ULTIMATE
SHEAR STRESS
36.0108.1163.8
V (t/m^2)
168.4 232
SEC.
MAX. TOR.
MOM.(t.m)
MOMENT IN RECTANGULAR COMPONENT (t.m)
TOR. SHEAR STRESS IN COMPONENT RECTANGLES OF GIRDER
Vtu (t/m^2)
CORR. S.F. (t)
SEC
Fyv (t/m^2) =
CORR. TOR.
MOM.(t.m)
MOMENT IN COMPONENT RECTANGLES (t.m])
184183
COMPONENT RECTANGLES
9776.4
Vtu (t/m^2)
MAX. S.F. (t)
TOR. SHEAR STRESS IN COMPONENT RECTANGLES OF GIRDER
TOTAL ULTIMATE
SHEAR STRESSV + Vtu (t/m^2)
ULTIMATE SHEAR STRESS
DUE TO S.F.
160.6165.2159.1 208172.2 222
156.4 220

Consulting Engineers Group Ltd., Jaipur_________________________________________________________________________
Bridge Design Report_______________________________________________________________________________
1 2 3 4Hmax 3.2 1.25 1.45 1Hmin 0.25 0.23 0.275 0.42
CASE 1 MAX. TORSIONAL MOMENT & CORR. SHEAR FORCE
1 2 3 4 1 2 3 4 1 2 3 41-1 7.12 2.10 0.64 1.27 3.11 N.R. N.R. N.R. NOT REQ. - - - -2-2 7.82 2.31 0.70 1.39 3.42 NOT REQ.NOT REQ.NOT REQ. 3.9 - - - 4.813-3 8.52 2.51 0.76 1.52 3.73 NOT REQ.NOT REQ.NOT REQ. 4.2 - - - 5.254-4 18.49 5.45 1.66 3.29 8.08 3.8 3.5 4.5 9.2 12.31 4.57 6.92 11.385-5 18.49 5.45 1.66 3.29 8.08 3.8 3.5 4.5 9.2 12.31 4.57 6.92 11.38
CASE 2 MAX. SHEAR FORCE & CORR. TORSIONAL MOMENT
1 2 3 4 1 2 3 4 1 2 3 41-1 5.99 1.77 0.54 1.07 2.62 NOT REQ.NOT REQ.NOT REQ.NOT REQ. - - - -2-2 6.90 2.04 0.62 1.23 3.02 NOT REQ.NOT REQ.NOT REQ.NOT REQ. - - - -3-3 5.21 1.54 0.47 0.93 2.28 NOT REQ.NOT REQ.NOT REQ.NOT REQ. - - - -4-4 14.16 4.18 1.27 2.52 6.19 2.9 NOT REQ. 3.4 7.1 9.43 - 5.30 8.725-5 14.39 4.24 1.29 2.56 6.29 2.9 NOT REQ. 3.5 7.2 9.58 - 5.39 8.86
TOTAL R/F IN WEB
SHEAR TORSION TOTAL SHEAR TORSION TOTALcm2/m cm2/m cm2/m cm2/m cm2/m cm2/m
1-1 2.49 0.00 2.49 2.49 FALSE 2.492-2 3.80 0.00 3.80 3.80 FALSE 3.803-3 4.29 NOT REQ. 4.29 4.29 FALSE 4.294-4 6.09 4.49 6.09 6.09 3.44 9.545-5 6.09 4.49 10.59 6.09 3.50 9.59
SEC TOR. MOM.(t)
MOMENT IN COMPONENT RECTANGLES (t.m)
Asv / Sv (cm^2/m)
MOMENT IN COMPONENT RECTANGLES (t.m)
SEC
TORSIONAL REINFORCEMENT AREA OF LONG. REINFORCEMENT
Asv / Sv (cm^2/m) Asv / Sv (cm^2)
CASE 1 CASE 2
SECMAX. TOR.
MOM.(t)
TORSIONAL REINFORCEMENT AREA OF LONG. REINFORCEMENT
COMPONENT RECTANGLES
Asv / Sv (cm^2)

Consulting Engineers Group Ltd., Jaipur_________________________________________________________________________
Bridge Design Report_______________________________________________________________________________
Reference : clause 611.4.2 of IRC : 22 - 1986 code for composite constructionThe ultimate longitudinal shear VL per unit length ,
V . Ac. YV L = I
Where ,V =
= 21.61 x 1.5 + 24.5 x 2.5= 93.57 t
Ac = Area of transformed section on one side of interface= 0.25 x 3.2 ( refer section property )= 0.8 m2
Y =
= 0.89877 - 0.125 ( refer section property )= 0.77377 m
I = M . I . of the composite section= mm4 ( refer section property )= 1.42534 m4
The ultimate longitudinal shear VL per unit length ,= 93.57 x 0.8 x 0.7738
1.42534= 40.63 t/m
Σ Q u = As fu x 0.001Where,
Q u = The ultimate shear resisting capacity of anchorage connector in kNAs = The c / s Area of the anchorage connector in sq mm fu = The ultimate tensile strength of anchorage connector in Mpa
Σ Q u = [ 2 x 113 x 1000 x 415125
= 750.32 kN = 75.0 t > 40.63 t O.K.
Provide 2L - 12 φ @ 125 c / c in addition to shear reinforcement .
1.42534E+12
DESIGN OF SHEAR CONNECTOR
Vertical shear due to dead load placed after composite section iseffective and working live load with impact.
Dist. Of centroid of the area under consideration from the neutral axis ofthe composite section

CEG.Ltd., Jaipur Bridge Design Report
Consultancy Services for Feasibility Study and Detailed Project Preparation for Proposed Orissa State Road Project
DESIGN OF DECK SLAB

Consulting Engineers Group Ltd., Jaipur____________________________________________________________________________
Bridge Design Report___________________________________________________________________________
The Deck slab Panel is designed as a Two way slab spanning between the main girders andCross diaphragm, it is continuous.
C/c of main girders = 2.8 mWeb width of main girders = 0.275 mclear span (lx) between main girders = 2.525 mC/c of Cross diaphragms = 7.5 mClear span (ly) between croos diaphragms = 7.225 m
Ratio of span k = ly/lx = 2.86 > 2.0
###
m
7.225 m
The behaviour of the deck slab pannel is considered to be as Oneway slab. And will be analysed and designed accordingly.
ANALYSIS AND DESIGN
The deck slab pannel will be analysed using the tables given in "DESIGN TABLES FOR CONCRETE BRIDGE DECK SLAB". A hand book published by SERC, ROORKEE both for the effects of dead load and concentrated strip loads due to IRC loadings.Pigueads method will be adopted for evaluating the desihn moments.
Panel dimension = 2.525 x 7.225 = 18.24 m2
Slab thickness = 250 mmWearing coat thickness = 56 mm
Key charts corresponding to the nearest panel size,
Key chart No.
2.500 x 7 2072.5 x 7.25 224
2.75 x 7 2082.75 x 7.25 225
Dead Load on the Panel
Dead load due to Deck slab = 0.25 x 18.24 x 25 = 114.0 kNDead load due to Wearing coat = 0.056 x 18.24 x 22 = 22.5 kN
Total load (W) = 136.5 kN0.75 t/m2
DESIGN OF DECK SLAB
Panel size
Traffic DirectionTrafiic Direction
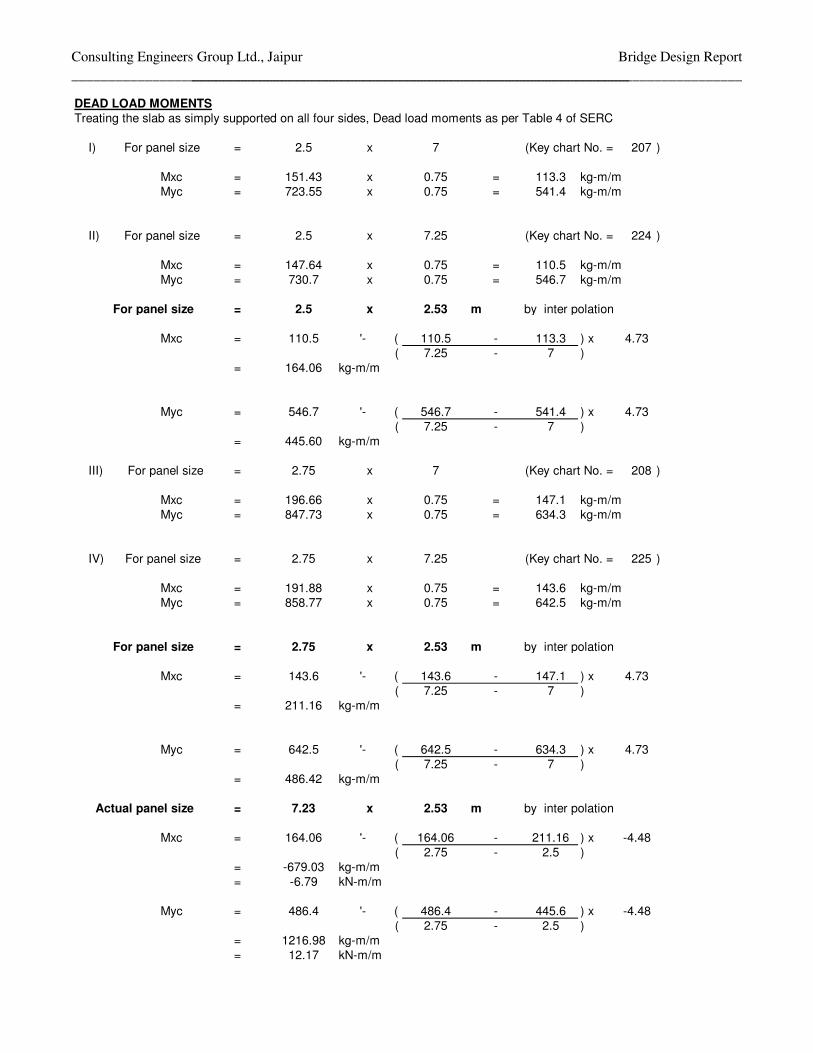
Consulting Engineers Group Ltd., Jaipur____________________________________________________________________________
Bridge Design Report___________________________________________________________________________
DEAD LOAD MOMENTSTreating the slab as simply supported on all four sides, Dead load moments as per Table 4 of SERC
I) For panel size = 2.5 x 7 (Key chart No. = 207 )
Mxc = 151.43 x 0.75 = 113.3 kg-m/mMyc = 723.55 x 0.75 = 541.4 kg-m/m
II) For panel size = 2.5 x 7.25 (Key chart No. = 224 )
Mxc = 147.64 x 0.75 = 110.5 kg-m/mMyc = 730.7 x 0.75 = 546.7 kg-m/m
For panel size = 2.5 x 2.53 m by inter polation
Mxc = 110.5 '- ( 110.5 - 113.3 ) x 4.73 ( 7.25 - 7 )
= 164.06 kg-m/m
Myc = 546.7 '- ( 546.7 - 541.4 ) x 4.73 ( 7.25 - 7 )
= 445.60 kg-m/m
III) For panel size = 2.75 x 7 (Key chart No. = 208 )
Mxc = 196.66 x 0.75 = 147.1 kg-m/mMyc = 847.73 x 0.75 = 634.3 kg-m/m
IV) For panel size = 2.75 x 7.25 (Key chart No. = 225 )
Mxc = 191.88 x 0.75 = 143.6 kg-m/mMyc = 858.77 x 0.75 = 642.5 kg-m/m
For panel size = 2.75 x 2.53 m by inter polation
Mxc = 143.6 '- ( 143.6 - 147.1 ) x 4.73 ( 7.25 - 7 )
= 211.16 kg-m/m
Myc = 642.5 '- ( 642.5 - 634.3 ) x 4.73 ( 7.25 - 7 )
= 486.42 kg-m/m
Actual panel size = 7.23 x 2.53 m by inter polation
Mxc = 164.06 '- ( 164.06 - 211.16 ) x -4.48 ( 2.75 - 2.5 )
= -679.03 kg-m/m= -6.79 kN-m/m
Myc = 486.4 '- ( 486.4 - 445.6 ) x -4.48 ( 2.75 - 2.5 )
= 1216.98 kg-m/m= 12.17 kN-m/m

Consulting Engineers Group Ltd., Jaipur____________________________________________________________________________
Bridge Design Report___________________________________________________________________________
LIVE LOAD MOMENTS
a) IRC - CLASS A LOADING
Treating the slab as simply supported on all four sides, CLASS A live load moments are evaluated as per Table 3 of SERC
I) For panel size = 2.5 x 7 (Key chart No. = 207 )
Mxc = 835.49 kg-m/mMyc = 1621.06 kg-m/m
II) For panel size = 2.5 x 7.25 (Key chart No. = 224 )
Mxc = 833.74 kg-m/mMyc = 1622.11 kg-m/m
For panel size = 2.5 x 2.53 m by inter polation
Mxc = 833.7 '- ( 833.7 - 835.5 ) x 4.73 ( 7.25 - 7 )
= 866.82 kg-m/m
Myc = 1622.1 '- ( 1622.1 - 1621.1 ) x 4.73 ( 7.25 - 7 )
= 1602.27 kg-m/m
III) For panel size = 2.75 x 7 (Key chart No. = 208 )
Mxc = 907.47 kg-m/mMyc = 1723.37 kg-m/m
IV) For panel size = 2.75 x 7.25 (Key chart No. = 225 )
Mxc = 906 kg-m/mMyc = 1726.38 kg-m/m
For panel size = 2.75 x 2.53 m by inter polation
Mxc = 906.0 '- ( 906.0 - 907.5 ) x 4.73 ( 7.25 - 7 )
= 933.78 kg-m/m
Myc = 1726.4 '- ( 1726.4 - 1723.4 ) x 4.73 ( 7.25 - 7 )
= 1669.49 kg-m/m
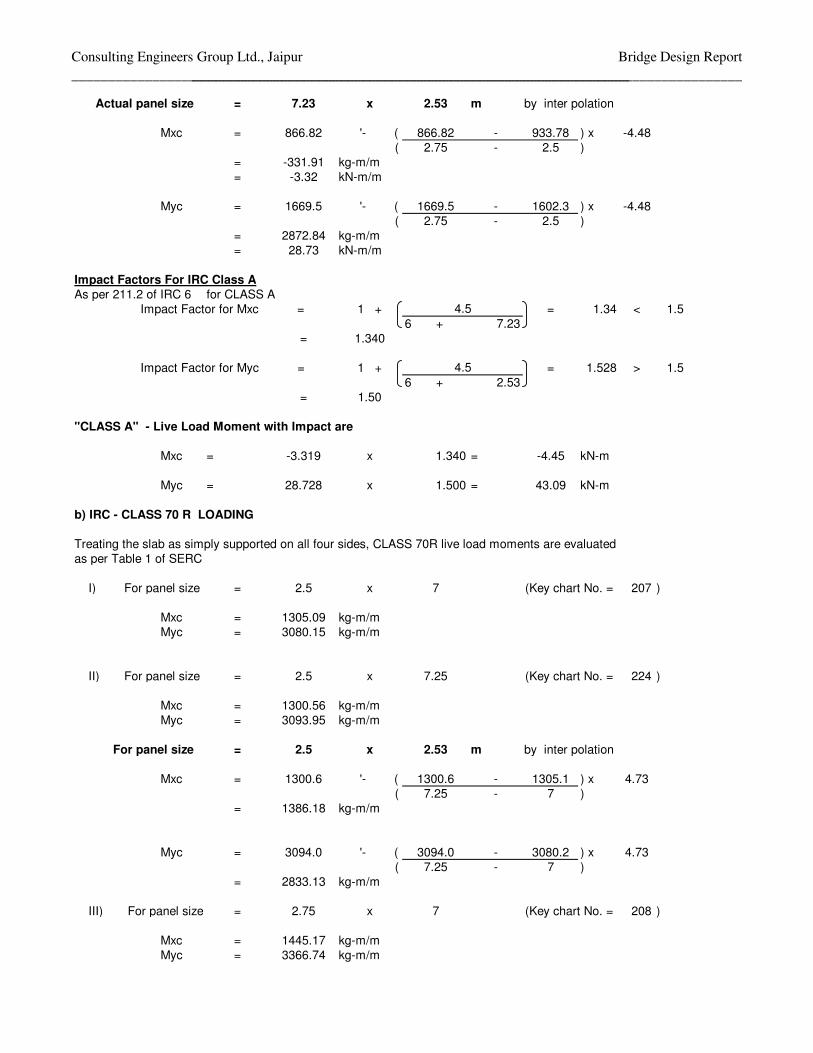
Consulting Engineers Group Ltd., Jaipur____________________________________________________________________________
Bridge Design Report___________________________________________________________________________
Actual panel size = 7.23 x 2.53 m by inter polation
Mxc = 866.82 '- ( 866.82 - 933.78 ) x -4.48 ( 2.75 - 2.5 )
= -331.91 kg-m/m= -3.32 kN-m/m
Myc = 1669.5 '- ( 1669.5 - 1602.3 ) x -4.48 ( 2.75 - 2.5 )
= 2872.84 kg-m/m= 28.73 kN-m/m
Impact Factors For IRC Class AAs per 211.2 of IRC 6 for CLASS A
Impact Factor for Mxc = 1 + = 1.34 < 1.56 + 7.23
= 1.340
Impact Factor for Myc = 1 + = 1.528 > 1.56 + 2.53
= 1.50
"CLASS A" - Live Load Moment with Impact are
Mxc = -3.319 x 1.340 = -4.45 kN-m
Myc = 28.728 x 1.500 = 43.09 kN-m
b) IRC - CLASS 70 R LOADING
Treating the slab as simply supported on all four sides, CLASS 70R live load moments are evaluated as per Table 1 of SERC
I) For panel size = 2.5 x 7 (Key chart No. = 207 )
Mxc = 1305.09 kg-m/mMyc = 3080.15 kg-m/m
II) For panel size = 2.5 x 7.25 (Key chart No. = 224 )
Mxc = 1300.56 kg-m/mMyc = 3093.95 kg-m/m
For panel size = 2.5 x 2.53 m by inter polation
Mxc = 1300.6 '- ( 1300.6 - 1305.1 ) x 4.73 ( 7.25 - 7 )
= 1386.18 kg-m/m
Myc = 3094.0 '- ( 3094.0 - 3080.2 ) x 4.73 ( 7.25 - 7 )
= 2833.13 kg-m/m
III) For panel size = 2.75 x 7 (Key chart No. = 208 )
Mxc = 1445.17 kg-m/mMyc = 3366.74 kg-m/m
4.5
4.5
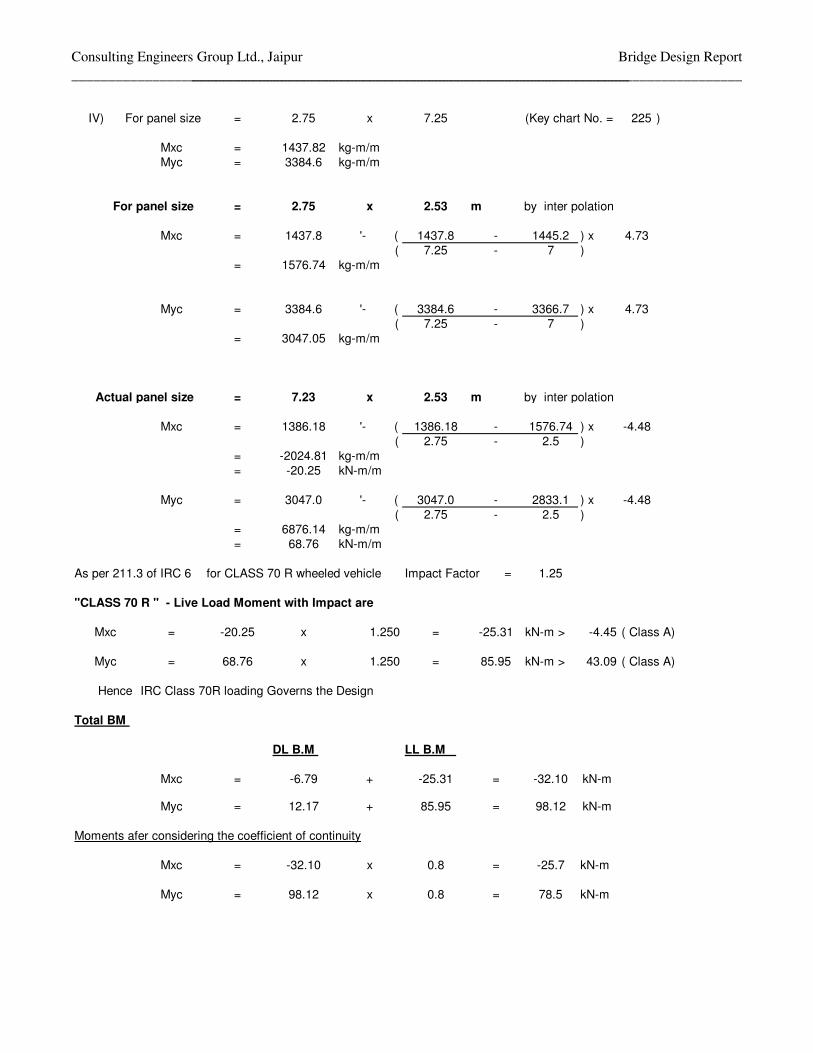
Consulting Engineers Group Ltd., Jaipur____________________________________________________________________________
Bridge Design Report___________________________________________________________________________
IV) For panel size = 2.75 x 7.25 (Key chart No. = 225 )
Mxc = 1437.82 kg-m/mMyc = 3384.6 kg-m/m
For panel size = 2.75 x 2.53 m by inter polation
Mxc = 1437.8 '- ( 1437.8 - 1445.2 ) x 4.73 ( 7.25 - 7 )
= 1576.74 kg-m/m
Myc = 3384.6 '- ( 3384.6 - 3366.7 ) x 4.73 ( 7.25 - 7 )
= 3047.05 kg-m/m
Actual panel size = 7.23 x 2.53 m by inter polation
Mxc = 1386.18 '- ( 1386.18 - 1576.74 ) x -4.48 ( 2.75 - 2.5 )
= -2024.81 kg-m/m= -20.25 kN-m/m
Myc = 3047.0 '- ( 3047.0 - 2833.1 ) x -4.48 ( 2.75 - 2.5 )
= 6876.14 kg-m/m= 68.76 kN-m/m
As per 211.3 of IRC 6 for CLASS 70 R wheeled vehicle Impact Factor = 1.25
"CLASS 70 R " - Live Load Moment with Impact are
Mxc = -20.25 x 1.250 = -25.31 kN-m > -4.45 ( Class A)
Myc = 68.76 x 1.250 = 85.95 kN-m > 43.09 ( Class A)
Hence IRC Class 70R loading Governs the Design
Total BM
DL B.M LL B.M
Mxc = -6.79 + -25.31 = -32.10 kN-m
Myc = 12.17 + 85.95 = 98.12 kN-m
Moments afer considering the coefficient of continuity
Mxc = -32.10 x 0.8 = -25.7 kN-m
Myc = 98.12 x 0.8 = 78.5 kN-m

Consulting Engineers Group Ltd., Jaipur____________________________________________________________________________
Bridge Design Report___________________________________________________________________________
DESIGN OF SLABGrade of Concrete = M 40
Grade of steel = Fe 415
As Per 303.3.3 σ cbc = 13.32 Mpam = 10σ st = 200 Mpa
n1 = 1 1 +10 x 13.32
= 0.400
j = 0.867R = 0.50 x 13.32 x 0.400 x 0.867
= 2.3080.5
d reqd = 78.50 x 10⁶
2.308 x 1000
= 184.44 < 215 mm ( Effective depth Provided)
Reinforcement for MycAst reqd For Myc = 78.50 x 10⁶
200 x 0.867 x 215= 2106 mm2 /m
Provide Tor - 20 @ 140 mm c/c at top and bottom
Ast Provided = 2244 mm2 /m
Reinforcement for MxcAst reqd For Mxc = -25.68 x 10⁶
200 x 0.867 x 215= -689 mm2 /m
Provide Tor - 12 @ 140 mm c/c at top and bottom
Ast Provided = 808 mm2 /m
200

CEG.Ltd., Jaipur Bridge Design Report
Consultancy Services for Feasibility Study and Detailed Project Preparation for Proposed Orissa State Road Project
DESIGN OF DIAPHRAGM

Consulting Engineers Group Ltd., Jaipur_________________________________________________________________________________
Bridge Design Report__________________________________________________________________
DESIGN OF END DIAPHRAGMSagging moment = Kn m
Hogging moment = Kn m
Shear force = Kn
Structural DesignDiaphragm span(c/c of girders) = m
= mAs per clause 29.2 of IS:4561.15 times span = > m
Hence adopt m as the effective spanDiaphragm depth = m
l / D = < for continuous beam
Hence the end diaphragm is designed as a deep beam as per clause29 of IS:456 - 2000.Lever arm Z = 0.2 ( L + 1.5 D)
= 0.2x ( 2.8 + 1.5 x = m1.8 ) = mm
= 200 MpaAllowable stress in H.Y.S.D σ st
Grade of concrete M 40 σ cbc = N/mm2
k =j =Q = N/mm2
+ ve Reinforcementx = mm2
x
Min. Reinforcement = 0.2 x 450 x 1800 = mm2
100
Hence provide 3 nos. Tor - 20 + 3 nos.Tor - 20reinforcement provided at bottom = mm2
in 0.25D-0.05L from bottom i.e in mm from bottom of diaphragm.
- ve Reinforcement
Ast = x 106 = mm2
x 1100 > mm2
=
106
200 1100
2.5
1122.364
1.11100
0.40000.8672.311
13.33
2.82.8
2.8
1.8
246.92
622.76
1221.1
310
3.222.8
1.561.82.8
246.92
622.76200
1620
1884.96
2830.7271620

Consulting Engineers Group Ltd., Jaipur_________________________________________________________________________________
Bridge Design Report__________________________________________________________________
Distribution of -ve Reinforcement
a ) at 0.2 x D = m
Ast = x 0.5 x 2.8 - 0.5 =1.8
= 1494
Hence provide 3 nos. Tor- 20 + 3 nos. Tor- 20= mm2
b ) Balance Ast = mm2
= to be distributed in 0.6D below the Reinforcement at (a) above.
0.6 x 1.8 = mHence, provide 13 nos Tor- 10 at middle = mm2
Since this is a deep beam shear does not govern. Hence provide Min. shear Reinforcement of 0.15 %
Asv = 0.15 x 1800 x 450 = mm2
100
provide 16 φ at 125 mm c/c = mm2
Total Shear = KN
Required Ast as hanging R/F = mm2
Required Ast per m length = mm2 /m
Provide 2 Legg 10 φ @ 150 mm c/c = mm2 /mSide face reinforcement0.1% of web area on either face with spacing not more than 450mm Required Ast = = mm2 /mProvide 5 nos 16 φ on either side. = mm2 /m
2830.727
SHEAR
810
1221.1
6105.5
847.9861
0.36
1.08
1005.31
1494.0
1884.96
945.77
1047.198
1021.02
1608.50
1215
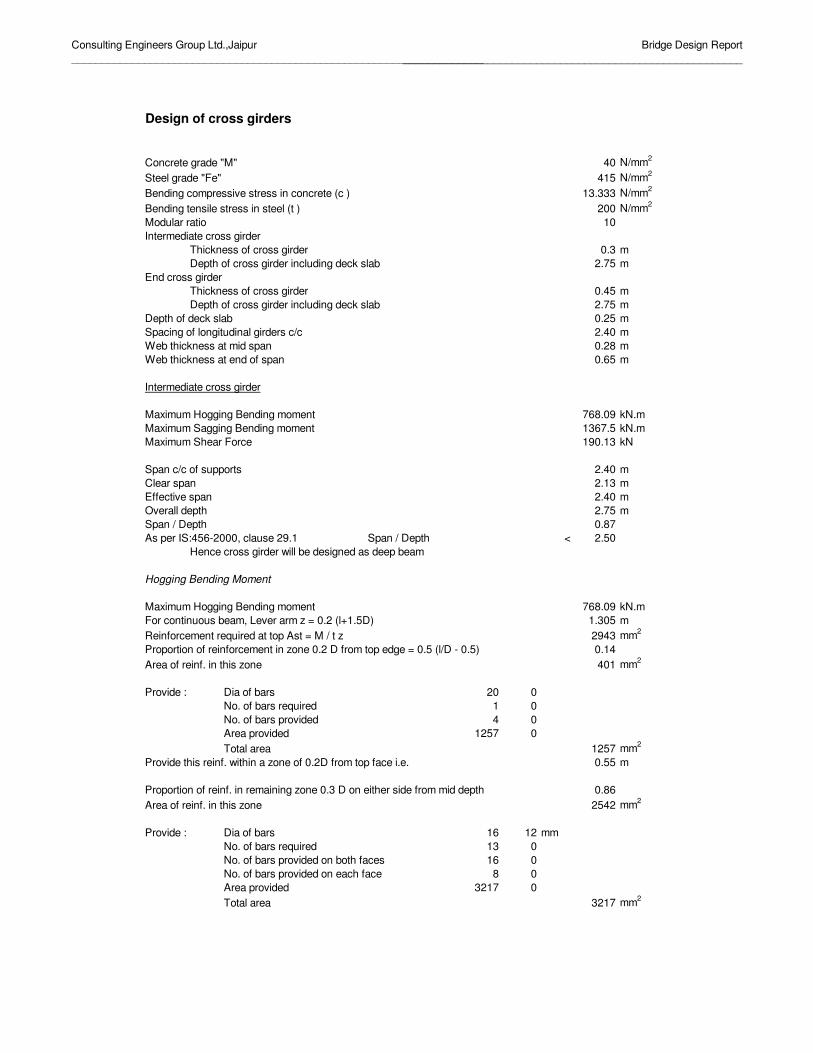
Consulting Engineers Group Ltd.,Jaipur____________________________________________________________________
Bridge Design Report________________________________________________________
Design of cross girders
Concrete grade "M" 40 N/mm2
Steel grade "Fe" 415 N/mm2
Bending compressive stress in concrete (c ) 13.333 N/mm2
Bending tensile stress in steel (t ) 200 N/mm2
Modular ratio 10Intermediate cross girder
Thickness of cross girder 0.3 mDepth of cross girder including deck slab 2.75 m
End cross girderThickness of cross girder 0.45 mDepth of cross girder including deck slab 2.75 m
Depth of deck slab 0.25 mSpacing of longitudinal girders c/c 2.40 mWeb thickness at mid span 0.28 mWeb thickness at end of span 0.65 m
Intermediate cross girder
Maximum Hogging Bending moment 768.09 kN.mMaximum Sagging Bending moment 1367.5 kN.mMaximum Shear Force 190.13 kN
Span c/c of supports 2.40 mClear span 2.13 mEffective span 2.40 mOverall depth 2.75 mSpan / Depth 0.87As per IS:456-2000, clause 29.1 Span / Depth < 2.50
Hence cross girder will be designed as deep beam
Hogging Bending Moment
Maximum Hogging Bending moment 768.09 kN.mFor continuous beam, Lever arm z = 0.2 (l+1.5D) 1.305 mReinforcement required at top Ast = M / t z 2943 mm2
Proportion of reinforcement in zone 0.2 D from top edge = 0.5 (l/D - 0.5) 0.14Area of reinf. in this zone 401 mm2
Provide : Dia of bars 20 0No. of bars required 1 0No. of bars provided 4 0Area provided 1257 0Total area 1257 mm2
Provide this reinf. within a zone of 0.2D from top face i.e. 0.55 m
Proportion of reinf. in remaining zone 0.3 D on either side from mid depth 0.86Area of reinf. in this zone 2542 mm2
Provide : Dia of bars 16 12 mmNo. of bars required 13 0No. of bars provided on both faces 16 0No. of bars provided on each face 8 0Area provided 3217 0Total area 3217 mm2

Consulting Engineers Group Ltd.,Jaipur____________________________________________________________________
Bridge Design Report________________________________________________________
Sagging Bending Moment
Maximum Sagging Bending moment due to all loads 1367.5 kN.mReinforcement required at bottom Ast = M / t z 5239 mm2
Minimum reinforcement percentage 0.2 %Minimum area of reinf. Required 1650 mm2
Reinforcement to be provided 5239 mm2
Provide : Dia of bars 32 20 mmNo. of bars required 7 0No. of bars provided 7 0Area provided 5630 0 mm2
Total area 5630 mm2
Provide this reinf. within a zone of (0.25 D-0.05 l) from bottom face i.e. 0.57 m
Design for Shear Force
Maximum Shear Force 190.13 kNAs per IS:456-2000, clause 29.3.3, deep beam will be designed for hanging actionReinforcement required for this action 951 mm2
Reinforcement required per meter length 792 mm2
Dia of stirrups 12 mmNo. of legs 2Spacing required 286 mmSpacing provided 125 mm

Consulting Engineers Group Ltd., Jaipur Bridge Design Report _______________________________________________________________________________
INPUT FILE: END.STD 1. STAAD PLANE END CROSS GIRDER DURING JACKED UP CONDITION 2. INPUT WIDTH 79 3. UNIT METER MTON 4. JOINT COORDINATES 5. 1 0 0 0; 2 0.51 0 0; 3 2.29 0 0; 4 2.8 0 0; 5 3.31 0 0 6. 6 5.09 0 0; 7 5.6 0 0; 8 6.11 0 0; 9 7.89 0 0; 10 8.4 0 0 7. MEMBER INCIDENCES 8. 1 1 2 9 1 1 9. MEMBER PROPERTY INDIAN 10. 1 TO 9 PRIS YD 1.0 ZD 1.0 11. SUPPORTS 12. 2 3 5 6 8 9 PINNED 13. CONSTANTS 14. E 3.6E+006 15. POISSON 0.15 ALL 16. *REACTION ON BEARING DUE TO DL+SIDL 17. LOAD 1 18. JOINT LOAD 19. 1 10 FY -122.11 20. 4 7 FY -99.38 21. PERFORM ANALYSIS 22. PRINT MEMBER FORCES MEMBER FORCES � ALL UNITS ARE -- MTON METE MEMBER LOAD JT AXIAL SHEAR-Y SHEAR-Z TORSION MOM-Y MOM-Z 1 1 1 0.00 -122.11 0.00 0.00 0.00 0.00 2 0.00 122.11 0.00 0.00 0.00 -62.28 2 1 2 0.00 36.70 0.00 0.00 0.00 62.28 3 0.00 -36.70 0.00 0.00 0.00 3.05 3 1 3 0.00 42.44 0.00 0.00 0.00 -3.05 4 0.00 -42.44 0.00 0.00 0.00 24.69 4 1 4 0.00 -56.94 0.00 0.00 0.00 -24.69 5 0.00 56.94 0.00 0.00 0.00 -4.35 5 1 5 0.00 0.00 0.00 0.00 0.00 4.35 6 0.00 0.00 0.00 0.00 0.00 -4.35 6 1 6 0.00 56.94 0.00 0.00 0.00 4.35 7 0.00 -56.94 0.00 0.00 0.00 24.69 7 1 7 0.00 -42.44 0.00 0.00 0.00 -24.69 8 0.00 42.44 0.00 0.00 0.00 3.05 8 1 8 0.00 -36.70 0.00 0.00 0.00 -3.05 9 0.00 36.70 0.00 0.00 0.00 -62.28 9 1 9 0.00 122.11 0.00 0.00 0.00 62.28 10 0.00 -122.11 0.00 0.00 0.00 0.00 23. FIN

CEG.Ltd., Jaipur Bridge Design Report
Consultancy Services for Feasibility Study and Detailed Project Preparation for Proposed Orissa State Road Project
APPENDIX

Consulting Engineers Group Ltd., Jaipur Bridge Design Report ________________________________________________________________________________
INPUT FILE: girder.STD 1. STAAD PLANE 2. START JOB INFORMATION 3. ENGINEER DATE 08-JUN-06 4. END JOB INFORMATION 5. INPUT WIDTH 79 6. UNIT METER MTON 7. JOINT COORDINATES 8. 1 0.000 0.0 0.0 9. 2 0.400 0.0 0.0 10. 3 2.688 0.0 0.0 11. 4 2.9 0.0 0.0 12. 5 4.150 0.0 0.0 13. 6 5.400 0.0 0.0 14. 7 7.900 0.0 0.0 15. 8 11.650 0.0 0.0 16. 9 15.400 0.0 0.0 17. 10 19.150 0.0 0.0 18. 11 22.900 0.0 0.0 19. 12 25.400 0.0 0.0 20. 13 26.650 0.0 0.0 21. 14 27.9 0.0 0.0 22. 15 28.113 0.0 0.0 23. 16 30.400 0.0 0.0 24. 17 30.800 0.0 0.0 25. MEMBER INCIDENCES 26. 1 1 2; 2 2 3; 3 3 4; 4 4 5; 5 5 6; 6 6 7; 7 7 8; 8 8 9; 9 9 10; 10 10 11 27. 11 11 12; 12 12 13; 13 13 14; 14 14 15; 15 15 16; 16 16 17 28. CONSTANTS 29. E 3.65E06 ALL 30. POISSON 0.15 ALL 31. DENSITY 2.5 ALL 32. MEMBER PROPERTY INDIAN 33. ****OUTER GIRDER 34. 6 TO 11 PRIS AX 0.9098 IX 0.0248 IZ 0.3951 35. 1 TO 3 14 TO 16 PRIS AX 1.0983 IX 0.0545 IZ 0.4184 36. 4 5 12 13 PRIS AX 1.2868 IX 0.0843 IZ 0.4417 37. SUPPORTS 38. 2 PINNED 39. 16 FIXED BUT FX MZ 40. *****************DEAD LOAD (SELF WEIGHT OF THE GIRDER) 41. LOAD 1 42. MEMBER LOAD 43. 6 TO 11 UNI GY -2.76525 44. 1 TO 2 15 TO 16 UNI GY -3.84664 45. 3 14 UNI GY -3.846624 46. 4 13 UNI GY -3.306124 47. 5 12 UNI GY -2.76525 48. ***************DIAPHRAM************** 49. LOAD 2 50. JOINT LOAD 51. 2 16 FY -4.268 52. 7 9 11 FY -2.9754 53. PERFORM ANALYSIS 54. PRINT MEMBER FORCES LIST 2 4 6 7 8 � MEMBER FORCES LIST 2 �

Consulting Engineers Group Ltd., Jaipur Bridge Design Report ________________________________________________________________________________
MEMBER END FORCES STRUCTURE TYPE = PLANE ----------------- ALL UNITS ARE -- MTON METE MEMBER LOAD JT AXIAL SHEAR-Y SHEAR-Z TORSION MOM-Y MOM-Z 2 1 2 0.00 44.86 0.00 0.00 0.00 0.31 3 0.00 -36.06 0.00 0.00 0.00 92.26 2 2 0.00 4.46 0.00 0.00 0.00 0.00 3 0.00 -4.46 0.00 0.00 0.00 10.21 4 1 4 0.00 35.24 0.00 0.00 0.00 -99.82 5 0.00 -31.11 0.00 0.00 0.00 141.29 2 4 0.00 4.46 0.00 0.00 0.00 -11.16 5 0.00 -4.46 0.00 0.00 0.00 16.74 6 1 6 0.00 27.65 0.00 0.00 0.00 -178.01 7 0.00 -20.74 0.00 0.00 0.00 238.50 2 6 0.00 4.46 0.00 0.00 0.00 -22.32 7 0.00 -4.46 0.00 0.00 0.00 33.47 7 1 7 0.00 20.74 0.00 0.00 0.00 -238.50 8 0.00 -10.37 0.00 0.00 0.00 296.83 2 7 0.00 1.49 0.00 0.00 0.00 -33.47 8 0.00 -1.49 0.00 0.00 0.00 39.05 8 1 8 0.00 10.37 0.00 0.00 0.00 -296.83 9 0.00 0.00 0.00 0.00 0.00 316.27 2 8 0.00 1.49 0.00 0.00 0.00 -39.05 9 0.00 -1.49 0.00 0.00 0.00 44.63 55. PRINT SUPPORT REACTION � SUPPORT REACTION � SUPPORT REACTIONS -UNIT MTON METE STRUCTURE TYPE = PLANE ----------------- JOINT LOAD FORCE-X FORCE-Y FORCE-Z MOM-X MOM-Y MOM Z 2 1 0.00 46.40 0.00 0.00 0.00 0.00 2 0.00 8.73 0.00 0.00 0.00 0.00 16 1 0.00 46.40 0.00 0.00 0.00 0.00 2 0.00 8.73 0.00 0.00 0.00 0.00 56. PRINT MAXFORCE ENVELOPE LIST 1 TO 16 � MAXFORCE ENVELOPE LIST 1 � MAX AND MIN FORCE VALUES AMONGST ALL SECTION LOCATIONS MEMB FY/ DIST LD MZ/ DIST LD FZ DIST LD MY DIST LD FX DIST LD 1 MAX 0.00 0.00 1 0.31 0.40 1 0.00 0.00 1 0.00 0.00 1 0.00 0.00 1 MIN -1.54 0.40 1 0.00 0.40 2 0.00 0.40 2 0.00 0.40 2 0.00 0.40 2

Consulting Engineers Group Ltd., Jaipur Bridge Design Report ________________________________________________________________________________
2 MAX 44.86 0.00 1 0.31 0.00 1 0.00 0.00 1 0.00 0.00 1 0.00 0.00 1 MIN 4.46 2.29 2 -92.26 2.29 1 0.00 2.29 2 0.00 2.29 2 0.00 2.29 2 3 MAX 36.06 0.00 1 -10.21 0.00 2 0.00 0.00 1 0.00 0.00 1 0.00 0.00 1 MIN 4.46 0.21 2 -99.82 0.21 1 0.00 0.21 2 0.00 0.21 2 0.00 0.21 2 4 MAX 35.24 0.00 1 -11.16 0.00 2 0.00 0.00 1 0.00 0.00 1 0.00 0.00 1 MIN 4.46 1.25 2 -141.29 1.25 1 0.00 1.25 2 0.00 1.25 2 0.00 1.25 2 5 MAX 31.11 0.00 1 -16.74 0.00 2 0.00 0.00 1 0.00 0.00 1 0.00 0.00 1 MIN 4.46 1.25 2 -178.01 1.25 1 0.00 1.25 2 0.00 1.25 2 0.00 1.25 2 6 MAX 27.65 0.00 1 -22.32 0.00 2 0.00 0.00 1 0.00 0.00 1 0.00 0.00 1 MIN 4.46 2.50 2 -238.50 2.50 1 0.00 2.50 2 0.00 2.50 2 0.00 2.50 2 7 MAX 20.74 0.00 1 -33.47 0.00 2 0.00 0.00 1 0.00 0.00 1 0.00 0.00 1 MIN 1.49 3.75 2 -296.83 3.75 1 0.00 3.75 2 0.00 3.75 2 0.00 3.75 2 8 MAX 10.37 0.00 1 -39.05 0.00 2 0.00 0.00 1 0.00 0.00 1 0.00 0.00 1 MIN 0.00 3.75 1 -316.27 3.75 1 0.00 3.75 2 0.00 3.75 2 0.00 3.75 2 9 MAX 0.00 0.00 1 -39.05 3.75 2 0.00 0.00 1 0.00 0.00 1 0.00 0.00 1 MIN -10.37 3.75 1 -316.27 0.00 1 0.00 3.75 2 0.00 3.75 2 0.00 3.75 2 10 MAX -1.49 0.00 2 -33.47 3.75 2 0.00 0.00 1 0.00 0.00 1 0.00 0.00 1 MIN -20.74 3.75 1 -296.83 0.00 1 0.00 3.75 2 0.00 3.75 2 0.00 3.75 2 11 MAX -4.46 0.00 2 -22.32 2.50 2 0.00 0.00 1 0.00 0.00 1 0.00 0.00 1 MIN -27.65 2.50 1 -238.50 0.00 1 0.00 2.50 2 0.00 2.50 2 0.00 2.50 2 12 MAX -4.46 0.00 2 -16.74 1.25 2 0.00 0.00 1 0.00 0.00 1 0.00 0.00 1 MIN -31.11 1.25 1 -178.01 0.00 1 0.00 1.25 2 0.00 1.25 2 0.00 1.25 2 13 MAX -4.46 0.00 2 -11.16 1.25 2

Consulting Engineers Group Ltd., Jaipur Bridge Design Report ________________________________________________________________________________
0.00 0.00 1 0.00 0.00 1 0.00 0.00 1 MIN -35.24 1.25 1 -141.29 0.00 1 0.00 1.25 2 0.00 1.25 2 0.00 1.25 2 14 MAX -4.46 0.00 2 -10.21 0.21 2 0.00 0.00 1 0.00 0.00 1 0.00 0.00 1 MIN -36.06 0.21 1 -99.82 0.00 1 0.00 0.21 2 0.00 0.21 2 0.00 0.21 2 15 MAX -4.46 0.00 2 0.31 2.29 1 0.00 0.00 1 0.00 0.00 1 0.00 0.00 1 MIN -44.86 2.29 1 -92.22 0.00 1 0.00 2.29 2 0.00 2.29 2 0.00 2.29 2 16 MAX 1.54 0.00 1 0.31 0.00 1 0.00 0.00 1 0.00 0.00 1 0.00 0.00 1 MIN 0.00 0.40 1 0.00 0.37 2 0.00 0.40 2 0.00 0.40 2 0.00 0.40 2 ********** END OF FORCE ENVELOPE FROM INTERNAL STORAGE ********** 57. FINISH *********** END OF THE STAAD.Pro RUN *********** **** DATE= NOV 22,2006 TIME= 17:37:15 ****

Consulting Engineers Group Ltd., Jaipur Bridge Design Report ________________________________________________________________________________ 110. ******************LIVE LOAD***************************** 111. DEFINE MOVING LOAD FILE SATY1 112. TYPE 1 CLASSA 1.125 113. TYPE 2 70RW 1.125 114. TYPE 3 70RT 1.1 115. ******************** 116. *FROM MEDIAN SIDE 117. *TWO LANE OF CLASS A 118. LOAD GENERATION 105 119. TYPE 1 -18.8 0 4.45 XINC 0.5 120. TYPE 1 -18.8 0 7.95 XINC 0.5 121. *70R WHEELED 122. LOAD GENERATION 92 123. TYPE 2 -13.4 0 5.81 XINC 0.5 124. *70R TRACKED TRAIN 125. LOAD GENERATION 75 126. TYPE 3 -4.576 0 5.93 XINC 0.5 127. ********************* 128. *FROM FOOTPATH SIDE 129. *TWO LANE OF CLASS A 130. *LOAD GENERATION 105 131. *TYPE 1 -18.8 0 4.3 XINC 0.5 132. *TYPE 1 -18.8 0 7.8 XINC 0.5 133. *70R WHEELED 134. *LOAD GENERATION 92 135. *TYPE 2 -13.4 0 5.66 XINC 0.5 136. *70R TRACKED 137. *LOAD GENERATION 75 138. *TYPE 3 -4.576 0 5.78 XINC 0.5 139. PERFORM ANALYSIS 140. *PRINT FORCE ENVELOPE NSECTION 2 LIST 18 34 50 66 141. *PRINT FORCE ENVELOPE NSECTION 2 LIST 20 36 52 68 142. *PRINT FORCE ENVELOPE NSECTION 2 LIST 22 38 54 70 143. PRINT FORCE ENVELOPE NSECTION 2 LIST 18 20 22 23 24 FORCE ENVELOPE NSECTION 2 MEMB DISTANCE FY LD MZ LD FZ LD MY LD 18 0.00 MAX 25.11 136 5.99 30 0.00 272 0.00 272 MIN -0.59 106 -0.23 210 0.00 272 0.00 272 1.14 MAX 24.92 138 3.42 1 0.00 272 0.00 272 MIN -0.59 106 -26.84 137 0.00 272 0.00 272 2.29 MAX 24.46 140 3.57 1 0.00 272 0.00 272 MIN -0.59 106 -54.36 138 0.00 272 0.00 272 |--------------------------------------------------------------------------- | MAX/MIN FORCE VALUES FOR MEMB 18, AMONGST ALL SECT LOCATIONS | FY/ DIST LD MZ/ DIST LD | FZ DIST LD MY DIST LD FX DIST LD | | MAX. 25.11 0.00 136 5.99 0.00 30 | 0.00 0.00 1 0.00 0.00 1 0.00 0.00 1 | MIN. -0.59 2.29 106 -54.36 2.29 138 | 0.00 2.29 272 0.00 2.29 272 0.00 2.29 272 |--------------------------------------------------------------------------- 20 0.00 MAX 24.46 140 3.60 1 0.00 272 0.00 272 MIN -0.59 106 -59.40 138 0.00 272 0.00 272 0.62 MAX 23.95 136 3.68 106 0.00 272 0.00 272

Consulting Engineers Group Ltd., Jaipur Bridge Design Report ________________________________________________________________________________ MIN -0.59 106 -74.25 138 0.00 272 0.00 272 1.25 MAX 23.95 136 4.05 106 0.00 272 0.00 272 MIN -0.59 106 -89.10 137 0.00 272 0.00 272 |--------------------------------------------------------------------------- | MAX/MIN FORCE VALUES FOR MEMB 20, AMONGST ALL SECT LOCATIONS | FY/ DIST LD MZ/ DIST LD | FZ DIST LD MY DIST LD FX DIST LD | | MAX. 24.46 0.00 140 4.05 1.25 106 | 0.00 0.00 1 0.00 0.00 1 0.00 0.00 1 | MIN. -0.59 1.25 106 -89.10 1.25 137 | 0.00 1.25 272 0.00 1.25 272 0.00 1.25 272 |--------------------------------------------------------------------------- 22 0.00 MAX 24.07 138 4.71 106 0.00 272 0.00 272 MIN -0.54 106 -119.01 137 0.00 272 0.00 272 1.25 MAX 23.68 140 5.39 106 0.00 272 0.00 272 MIN -0.54 106 -147.66 138 0.00 272 0.00 272 2.50 MAX 22.64 143 6.06 106 0.00 272 0.00 272 MIN -0.54 106 -175.11 140 0.00 272 0.00 272 |--------------------------------------------------------------------------- | MAX/MIN FORCE VALUES FOR MEMB 22, AMONGST ALL SECT LOCATIONS | FY/ DIST LD MZ/ DIST LD | FZ DIST LD MY DIST LD FX DIST LD | | MAX. 24.07 0.00 138 6.06 2.50 106 | 0.00 0.00 1 0.00 0.00 1 0.00 0.00 1 | MIN. -0.54 2.50 106 -175.11 2.50 140 | 0.00 2.50 272 0.00 2.50 272 0.00 2.50 272 |--------------------------------------------------------------------------- 23 0.00 MAX 14.86 150 6.02 106 0.00 272 0.00 272 MIN -4.47 216 -174.57 140 0.00 272 0.00 272 1.87 MAX 14.35 154 5.44 106 0.00 272 0.00 272 MIN -4.63 218 -191.07 142 0.00 272 0.00 272 3.75 MAX 13.70 150 4.85 106 0.00 272 0.00 272 MIN -4.63 218 -207.59 143 0.00 272 0.00 272 |--------------------------------------------------------------------------- | MAX/MIN FORCE VALUES FOR MEMB 23, AMONGST ALL SECT LOCATIONS | FY/ DIST LD MZ/ DIST LD | FZ DIST LD MY DIST LD FX DIST LD | | MAX. 14.86 0.00 150 6.02 0.00 106 | 0.00 0.00 1 0.00 0.00 1 0.00 0.00 1 | MIN. -4.63 3.75 218 -207.59 3.75 143 | 0.00 3.75 272 0.00 3.75 272 0.00 3.75 272 |--------------------------------------------------------------------------- 24 0.00 MAX 13.75 151 4.85 106 0.00 272 0.00 272 MIN -4.60 218 -207.47 143 0.00 272 0.00 272 1.87 MAX 13.29 154 4.28 106 0.00 272 0.00 272 MIN -4.60 218 -224.33 146 0.00 272 0.00 272 3.75 MAX 12.22 158 3.72 106 0.00 272 0.00 272 MIN -4.60 218 -238.92 148 0.00 272 0.00 272 |--------------------------------------------------------------------------- | MAX/MIN FORCE VALUES FOR MEMB 24, AMONGST ALL SECT LOCATIONS | FY/ DIST LD MZ/ DIST LD | FZ DIST LD MY DIST LD FX DIST LD

Consulting Engineers Group Ltd., Jaipur Bridge Design Report ________________________________________________________________________________ | | MAX. 13.75 0.00 151 4.85 0.00 106 | 0.00 0.00 1 0.00 0.00 1 0.00 0.00 1 | MIN. -4.60 3.75 218 -238.92 3.75 148 | 0.00 3.75 272 0.00 3.75 272 0.00 3.75 272 |--------------------------------------------------------------------------- 144. PRINT FORCE ENVELOPE NSECTION 2 LIST 24 40 56 72 FORCE ENVELOPE NSECTION 2 MEMB DISTANCE FY LD MZ LD FZ LD MY LD 24 0.00 MAX 13.75 151 4.85 106 0.00 272 0.00 272 MIN -4.60 218 -207.47 143 0.00 272 0.00 272 1.87 MAX 13.29 154 4.28 106 0.00 272 0.00 272 MIN -4.60 218 -224.33 146 0.00 272 0.00 272 3.75 MAX 12.22 158 3.72 106 0.00 272 0.00 272 MIN -4.60 218 -238.92 148 0.00 272 0.00 272 |--------------------------------------------------------------------------- | MAX/MIN FORCE VALUES FOR MEMB 24, AMONGST ALL SECT LOCATIONS | FY/ DIST LD MZ/ DIST LD | FZ DIST LD MY DIST LD FX DIST LD | | MAX. 13.75 0.00 151 4.85 0.00 106 | 0.00 0.00 1 0.00 0.00 1 0.00 0.00 1 | MIN. -4.60 3.75 218 -238.92 3.75 148 | 0.00 3.75 272 0.00 3.75 272 0.00 3.75 272 |--------------------------------------------------------------------------- 40 0.00 MAX 19.27 232 2.94 106 0.00 272 0.00 272 MIN -12.84 223 -188.10 142 0.00 272 0.00 272 1.87 MAX 13.02 236 2.83 106 0.00 272 0.00 272 MIN -20.07 227 -190.96 146 0.00 272 0.00 272 3.75 MAX 8.91 240 2.73 106 0.00 272 0.00 272 MIN -27.70 231 -177.70 147 0.00 272 0.00 272 |--------------------------------------------------------------------------- | MAX/MIN FORCE VALUES FOR MEMB 40, AMONGST ALL SECT LOCATIONS | FY/ DIST LD MZ/ DIST LD | FZ DIST LD MY DIST LD FX DIST LD | | MAX. 19.27 0.00 232 2.94 0.00 106 | 0.00 0.00 1 0.00 0.00 1 0.00 0.00 1 | MIN. -27.70 3.75 231 -190.96 1.87 146 | 0.00 3.75 272 0.00 3.75 272 0.00 3.75 272 |--------------------------------------------------------------------------- 56 0.00 MAX 12.36 55 2.90 106 0.00 272 0.00 272 MIN -6.36 223 -145.28 52 0.00 272 0.00 272 1.87 MAX 9.48 236 2.38 106 0.00 272 0.00 272 MIN -7.32 134 -148.00 56 0.00 272 0.00 272 3.75 MAX 8.06 240 1.87 106 0.00 272 0.00 272 MIN -8.38 138 -146.68 147 0.00 272 0.00 272 |--------------------------------------------------------------------------- | MAX/MIN FORCE VALUES FOR MEMB 56, AMONGST ALL SECT LOCATIONS | FY/ DIST LD MZ/ DIST LD | FZ DIST LD MY DIST LD FX DIST LD | | MAX. 12.36 0.00 55 2.90 0.00 106 | 0.00 0.00 1 0.00 0.00 1 0.00 0.00 1

Consulting Engineers Group Ltd., Jaipur Bridge Design Report ________________________________________________________________________________ | MIN. -8.38 3.75 138 -148.00 1.87 56 | 0.00 3.75 272 0.00 3.75 272 0.00 3.75 272 |--------------------------------------------------------------------------- 72 0.00 MAX 6.11 64 2.22 106 0.00 272 0.00 272 MIN -0.97 24 -111.98 52 0.00 272 0.00 272 1.87 MAX 5.87 59 2.12 106 0.00 272 0.00 272 MIN -0.97 24 -117.69 53 0.00 272 0.00 272 3.75 MAX 5.65 63 2.01 106 0.00 272 0.00 272 MIN -0.97 24 -123.46 54 0.00 272 0.00 272 |--------------------------------------------------------------------------- | MAX/MIN FORCE VALUES FOR MEMB 72, AMONGST ALL SECT LOCATIONS | FY/ DIST LD MZ/ DIST LD | FZ DIST LD MY DIST LD FX DIST LD | | MAX. 6.11 0.00 64 2.22 0.00 106 | 0.00 0.00 1 0.00 0.00 1 0.00 0.00 1 | MIN. -0.97 3.75 24 -123.46 3.75 54 | 0.00 3.75 272 0.00 3.75 272 0.00 3.75 272 |--------------------------------------------------------------------------- ********** END OF FORCE ENVELOPE FROM INTERNAL STORAGE ********** 145. LOAD LIST 148 158 132 146. PRINT MEMBER FORCES LIST 24 � MEMBER FORCES LIST 24 � MEMBER LOAD JT AXIAL SHEAR-Y SHEAR-Z TORSION MOM-Y MOM-Z 24 132 25 0.00 -1.74 0.00 0.54 0.00 -158.60 26 0.00 4.20 0.00 -0.54 0.00 144.50 148 25 0.00 11.85 0.00 0.41 0.00 -201.84 26 0.00 -7.65 0.00 -0.41 0.00 238.92 158 25 0.00 13.37 0.00 0.33 0.00 -152.03 26 0.00 -12.22 0.00 -0.33 0.00 198.15 147. ***** 148. LOAD LIST 143 150 139 149. PRINT MEMBER FORCES LIST 23 � MEMBER FORCES LIST 23 � MEMBER LOAD JT AXIAL SHEAR-Y SHEAR-Z TORSION MOM-Y MOM-Z 23 139 24 0.00 7.69 0.00 0.65 0.00 -174.39 25 0.00 -2.77 0.00 -0.65 0.00 198.64 143 24 0.00 12.41 0.00 0.62 0.00 -169.78 25 0.00 -8.94 0.00 -0.62 0.00 207.59 150 24 0.00 14.86 0.00 0.63 0.00 -144.01 25 0.00 -13.70 0.00 -0.63 0.00 195.41 150. ************* 151. LOAD LIST 140 143 150 152. PRINT MEMBER FORCES LIST 22 � MEMBER FORCES LIST 22 � MEMBER LOAD JT AXIAL SHEAR-Y SHEAR-Z TORSION MOM-Y MOM-Z 22 140 23 0.00 23.68 0.00 1.72 0.00 -117.69 24 0.00 -21.94 0.00 -1.72 0.00 175.11 143 23 0.00 22.64 0.00 1.87 0.00 -113.76 24 0.00 -22.64 0.00 -1.87 0.00 170.34 150 23 0.00 19.88 0.00 2.02 0.00 -94.93

Consulting Engineers Group Ltd., Jaipur Bridge Design Report ________________________________________________________________________________ 24 0.00 -19.88 0.00 -2.02 0.00 144.63 153. LOAD LIST 137 136 150 154. PRINT MEMBER FORCES LIST 20 � MEMBER FORCES LIST 20 � MEMBER END FORCES STRUCTURE TYPE = FLOOR ----------------- ALL UNITS ARE -- MTON METE MEMBER LOAD JT AXIAL SHEAR-Y SHEAR-Z TORSION MOM-Y MOM-Z 20 136 21 0.00 23.95 0.00 1.96 0.00 -58.91 22 0.00 -23.95 0.00 -1.96 0.00 88.84 137 21 0.00 23.89 0.00 2.07 0.00 -59.24 22 0.00 -23.89 0.00 -2.07 0.00 89.10 150 21 0.00 19.38 0.00 2.81 0.00 -46.20 22 0.00 -19.38 0.00 -2.81 0.00 70.42 155. LOAD LIST 138 140 150 156. PRINT MEMBER FORCES LIST 18 � MEMBER FORCES LIST 18 � MEMBER LOAD JT AXIAL SHEAR-Y SHEAR-Z TORSION MOM-Y MOM-Z 18 138 19 0.00 24.92 0.00 2.18 0.00 1.76 20 0.00 -23.76 0.00 -2.18 0.00 54.36 140 19 0.00 24.46 0.00 2.37 0.00 1.92 20 0.00 -24.46 0.00 -2.37 0.00 54.05 150 19 0.00 19.38 0.00 2.81 0.00 2.25 20 0.00 -19.38 0.00 -2.81 0.00 42.09 157. FINISH *********** END OF THE STAAD.Pro RUN ***********

Consulting Engineers Group Ltd., Jaipur Bridge Design Report ________________________________________________________________________________ INPUT FILE: SIDL.STD 1. STAAD FLOOR 2. START JOB INFORMATION 3. ENGINEER DATE 26-SEP-06 4. END JOB INFORMATION 5. INPUT WIDTH 79 6. UNIT METER MTON 7. JOINT COORDINATES 8. 1 0.000 0.0 0.0 9. 2 1.080 0.0 0.0 10. 3 3.368 0.0 0.0 11. 4 3.580 0.0 0.0 12. 5 4.830 0.0 0.0 13. 6 6.080 0.0 0.0 14. 7 8.580 0.0 0.0 15. 8 12.330 0.0 0.0 16. 9 16.080 0.0 0.0 17. 10 19.830 0.0 0.0 18. 11 23.580 0.0 0.0 19. 12 26.080 0.0 0.0 20. 13 27.330 0.0 0.0 21. 14 28.580 0.0 0.0 22. 15 28.793 0.0 0.0 23. 16 31.080 0.0 0.0 24. 17 32.160 0.0 0.0 25. REPEAT ALL 1 0.0 0.0 1.8 26. REPEAT 3 0.0 0.0 2.8 27. REPEAT 1 0.0 0.0 1.8 28. MEMBER INCIDENCES 29.1 1 2; 2 2 3;3 3 4; 4 4 5;5 5 6; 6 6 7;7 7 8; 8 8 9; 9 9 10; 10 10 11 30.11 11 12;12 12 13;13 13 14;14 14 15;15 15 16; 16 16 17;17 18 19; 18 19 20 31.19 20 21;20 21 22; 21 22 23;22 23 24;23 24 25; 24 25 26;25 26 27;26 27 28 32.27 28 29;28 29 30; 29 30 31;30 31 32;31 32 33;32 33 34;33 35 36; 34 36 37 33. 35 37 38; 36 38 39;37 39 40;38 40 41;39 41 42;40 42 43;41 43 44;42 44 45 34. 43 45 46; 44 46 47;45 47 48;46 48 49;47 49 50;48 50 51;49 52 53;50 53 54 35. 51 54 55; 52 55 56;53 56 57;54 57 58;55 58 59;56 59 60;57 60 61;58 61 62 36. 59 62 63;60 63 64;61 64 65;62 65 66;63 66 67;64 67 68;65 69 70; 66 70 71 37. 67 71 72;68 72 73;69 73 74;70 74 75;71 75 76;72 76 77;73 77 78; 74 78 79 38. 75 79 80; 76 80 81;77 81 82;78 82 83;79 83 84;80 84 85;81 86 87;82 87 88 39. 83 88 89; 84 89 90;85 90 91;86 91 92;87 92 93;88 93 94;89 94 95;90 95 96 40. 91 96 97; 92 97 98; 93 98 99; 94 99 100; 95 100 101; 96 101 102; 97 1 18 41. 98 18 35; 99 35 52; 100 52 69; 101 69 86; 102 2 19; 103 19 36; 104 36 53 42. 105 53 70; 106 70 87; 107 5 22; 108 22 39; 109 39 56;110 56 73;111 73 90 43. 112 7 24; 113 24 41; 114 41 58; 115 58 75; 116 75 92;117 8 25; 118 25 42 44. 119 42 59; 120 59 76; 121 76 93; 122 9 26; 123 26 43;124 43 60;125 60 77 45. 126 77 94; 127 10 27; 128 27 44; 129 44 61;130 61 78;131 78 95;132 11 28 46. 133 28 45; 134 45 62; 135 62 79; 136 79 96;137 13 30;138 30 47;139 47 64 47. 140 64 81; 141 81 98; 142 16 33;143 33 50;144 50 67;145 67 84;146 84 101 48. 147 17 34; 148 34 51; 149 51 68; 150 68 85; 151 85 102 49. MEMBER PROPERTY INDIAN 50. *OUTER GIRDER 51. 22 TO 27 70 TO 75 PRIS AX 1.906 IX 0.0404 IZ 1.3135 52. 17 18 31 32 65 66 79 80 PRIS AX 2.339 IX 0.1104 IZ 1.4253 53. 19 TO 21 28 TO 30 67 TO 69 76 TO 78 PRIS AX 2.122 IX 0.0754 IZ 1.3694 54. *INNER GIRDER

Consulting Engineers Group Ltd., Jaipur Bridge Design Report ________________________________________________________________________________ 55. 38 TO 43 54 TO 59 PRIS AX 1.806 IX 0.0393 IZ 1.2605 56. 33 34 47 TO 50 63 64 PRIS AX 2.239 IX 0.1093 IZ 1.3623 57. 35 TO 37 44 TO 46 51 TO 53 60 TO 62 PRIS AX 2.022 IX 0.0743 IZ 1.3114 58. *END DIAPHRAM 59. 103 TO 105 143 TO 145 PRIS AX 1.549 IX 0.054 IZ 0.6285 60. *CENTRAL DIAPHRAM 61. 113 TO 115 123 TO 125 133 TO 135 PRIS AX 1.478 IX 0.0240 IZ 0.5107 62. *CANTILEVER PORTION 63. 1 TO 16 81 TO 96 PRIS AX 0.001 IX 0.0001 IZ 0.0001 64. *TRANSVERSE MEMBERS 65. 107 TO112 116 TO122 126 TO132 136 TO141 PRIS AX 0.938 IX0.0098 IZ 0.0049 66. 102 106 142 146 PRIS AX 0.739 IX 0.0077 IZ 0.0038 67. 97 TO 101 147 TO 151 PRIS AX 0.0001 IX 0.0001 IZ 0.0001 68. CONSTANTS 69. E 2.2146E06 70. DEN CONC ALL 71. POISSON 0.15 72. SUPPORTS 73. 19 36 53 70 PINNED 74. 33 50 67 84 FIXED BUT FX MX MY MZ 75. **** SIDL INCLUDING FOOTPATH LL 76. LOAD 1 77. MEMBER LOAD 78. 1 TO 16 UNI GY -1.503 79. 17 TO 32 UNI GY -0.862 80. 33 TO 48 UNI GY -0.552 81. 49 TO 64 UNI GY -0.552 82. 65 TO 80 UNI GY -0.862 83. 81 TO 96 UNI GY -1.503 84. PERFORM ANALYSIS 85. PRINT MEMBER FORCES LIST 24 40 56 72 MEMBER FORCES LIST 24 MEMBER END FORCES STRUCTURE TYPE = FLOOR ----------------- ALL UNITS ARE -- MTON METE MEMBER LOAD JT AXIAL SHEAR-Y SHEAR-Z TORSION MOM-Y MOM-Z 24 1 25 0.00 1.23 0.00 -2.88 0.00 -164.74 26 0.00 2.00 0.00 2.88 0.00 163.30 40 1 42 0.00 6.91 0.00 0.52 0.00 -142.92 43 0.00 -4.84 0.00 -0.52 0.00 164.96 56 1 59 0.00 6.91 0.00 -0.52 0.00 -142.92 60 0.00 -4.84 0.00 0.52 0.00 164.96 72 1 76 0.00 1.23 0.00 2.88 0.00 -164.74 77 0.00 2.00 0.00 -2.88 0.00 163.30 86. PRINT MEMBER FORCES LIST 18 20 22 23 24 MEMBER FORCES LIST 18 MEMBER LOAD JT AXIAL SHEAR-Y SHEAR-Z TORSION MOM-Y MOM-Z 18 1 19 0.00 23.58 0.00 5.73 0.00 0.39 20 0.00 -21.61 0.00 -5.73 0.00 51.30

Consulting Engineers Group Ltd., Jaipur Bridge Design Report ________________________________________________________________________________ 20 1 21 0.00 21.42 0.00 5.73 0.00 -55.86 22 0.00 -20.35 0.00 -5.73 0.00 81.97 22 1 23 0.00 12.45 0.00 -1.74 0.00 -98.10 24 0.00 -10.30 0.00 1.74 0.00 126.54 23 1 24 0.00 11.84 0.00 3.10 0.00 -126.42 25 0.00 -8.60 0.00 -3.10 0.00 164.75 24 1 25 0.00 1.23 0.00 -2.88 0.00 -164.74 26 0.00 2.00 0.00 2.88 0.00 163.30 87. FINISH

Consulting Engineers Group Ltd., Jaipur Bridge Design Report ________________________________________________________________________________ INPUT FILE: SLAB.STD 1. STAAD PLANE 2. START JOB INFORMATION 3. ENGINEER DATE 26-SEP-06 4. END JOB INFORMATION 5. INPUT WIDTH 79 6. UNIT METER MTON 7. JOINT COORDINATES 8. 1 0.000 0.0 0.0 9. 2 1.080 0.0 0.0 10. 3 3.368 0.0 0.0 11. 4 3.580 0.0 0.0 12. 5 4.830 0.0 0.0 13. 6 6.080 0.0 0.0 14. 7 8.580 0.0 0.0 15. 8 12.330 0.0 0.0 16. 9 16.080 0.0 0.0 17. 10 19.830 0.0 0.0 18. 11 23.580 0.0 0.0 19. 12 26.080 0.0 0.0 20. 13 27.330 0.0 0.0 21. 14 28.580 0.0 0.0 22. 15 28.793 0.0 0.0 23. 16 31.080 0.0 0.0 24. 17 32.160 0.0 0.0 25. MEMBER INCIDENCES 26. 1 1 2; 2 2 3; 3 3 4; 4 4 5; 5 5 6; 6 6 7; 7 7 8; 8 8 9; 9 9 10; 10 10 11 27. 11 11 12; 12 12 13; 13 13 14; 14 14 15; 15 15 16; 16 16 17 28. DEFINE MATERIAL START 29. ISOTROPIC MATERIAL1 30. E 3.65E+006 31. POISSON 0.15 32. DENSITY 2.4026 33. DAMP 0.001 34. END DEFINE MATERIAL 35. MEMBER PROPERTY INDIAN 36. ****OUTER GIRDER 37. 6 TO 11 PRIS AX 0.9098 IX 0.0248 IZ 0.3951 38. 1 TO 3 14 TO 16 PRIS AX 1.0983 IX 0.0545 IZ 0.4184 39. 4 5 12 13 PRIS AX 1.2868 IX 0.0843 IZ 0.4417 40. CONSTANTS 41. MATERIAL MATERIAL1 MEMB 1 TO 16 42. SUPPORTS 43. 2 16 PINNED 44. *****************DEAD LOAD (SELF WEIGHT OF THE SLAB) 45. LOAD 1 46. MEMBER LOAD 47. *(2.8*0.5+1.8)*0.25*2.4 48. 1 TO 16 UNI GY -2 49. * *** SHUTTERING SLAB 50. LOAD 2 51. MEMBER LOAD 52. 1 TO 16 UNI GY -0.5 53. PERFORM ANALYSIS 54. PRINT MEMBER FORCES LIST 2 4 6 TO 8
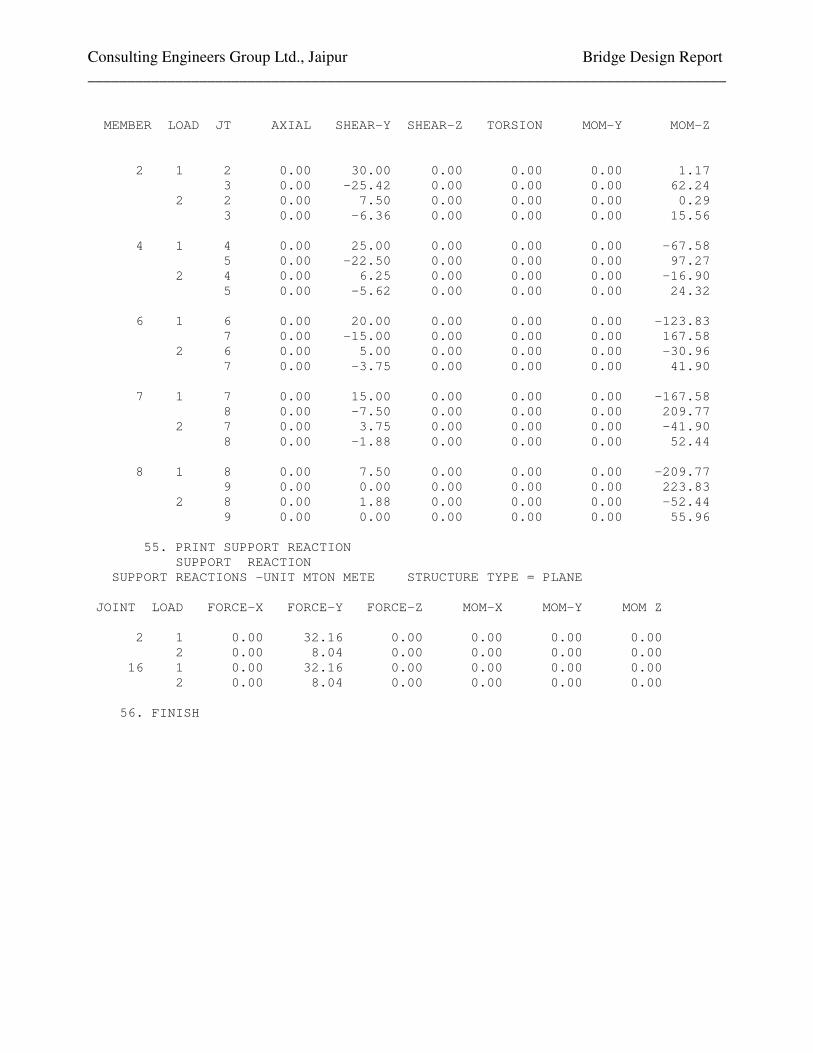
Consulting Engineers Group Ltd., Jaipur Bridge Design Report ________________________________________________________________________________ MEMBER LOAD JT AXIAL SHEAR-Y SHEAR-Z TORSION MOM-Y MOM-Z 2 1 2 0.00 30.00 0.00 0.00 0.00 1.17 3 0.00 -25.42 0.00 0.00 0.00 62.24 2 2 0.00 7.50 0.00 0.00 0.00 0.29 3 0.00 -6.36 0.00 0.00 0.00 15.56 4 1 4 0.00 25.00 0.00 0.00 0.00 -67.58 5 0.00 -22.50 0.00 0.00 0.00 97.27 2 4 0.00 6.25 0.00 0.00 0.00 -16.90 5 0.00 -5.62 0.00 0.00 0.00 24.32 6 1 6 0.00 20.00 0.00 0.00 0.00 -123.83 7 0.00 -15.00 0.00 0.00 0.00 167.58 2 6 0.00 5.00 0.00 0.00 0.00 -30.96 7 0.00 -3.75 0.00 0.00 0.00 41.90 7 1 7 0.00 15.00 0.00 0.00 0.00 -167.58 8 0.00 -7.50 0.00 0.00 0.00 209.77 2 7 0.00 3.75 0.00 0.00 0.00 -41.90 8 0.00 -1.88 0.00 0.00 0.00 52.44 8 1 8 0.00 7.50 0.00 0.00 0.00 -209.77 9 0.00 0.00 0.00 0.00 0.00 223.83 2 8 0.00 1.88 0.00 0.00 0.00 -52.44 9 0.00 0.00 0.00 0.00 0.00 55.96 55. PRINT SUPPORT REACTION SUPPORT REACTION SUPPORT REACTIONS -UNIT MTON METE STRUCTURE TYPE = PLANE JOINT LOAD FORCE-X FORCE-Y FORCE-Z MOM-X MOM-Y MOM Z 2 1 0.00 32.16 0.00 0.00 0.00 0.00 2 0.00 8.04 0.00 0.00 0.00 0.00 16 1 0.00 32.16 0.00 0.00 0.00 0.00 2 0.00 8.04 0.00 0.00 0.00 0.00 56. FINISH

CEG.Ltd., Jaipur Bridge Design Report
Consultancy Services for Feasibility Study and Detailed Project Preparation for Proposed Orissa State Road Project
BRIDGE AT CH:29+400
CEG.Ltd., Jaipur Bridge Design Report
Consultancy Services for Feasibility Study and Detailed Project Preparation for Proposed Orissa State Road Project
DESIGN OF SUBSTRUCTURE (ABUTMENT - PIER)

Consulting Engineers Group Ltd., Jaipur____________________________________________________________________________
Bridge Design Report_________________________________________________________________
F.R.L
H.F.L
G.L
216.189
0.1
0.0751.2
0.45 0.45
0.3
214.172
0.1
2.725
0.051.60
206.025
0.75
215.463215.163
209.907
0.225
213.963
204.975
205.2751.05
7.250
0.15
0.700

Consulting Engineers Group Ltd., Jaipur____________________________________________________________________________
Bridge Design Report_________________________________________________________________
2.825
0.15
0.8
0.875
0.15
4.25
0.875
2.825 0.90
7.250
2.50
0.8
1.600
0.700
1.80

Consulting Engineers Group Ltd., Jaipur____________________________________________________________________________
Bridge Design Report_________________________________________________________________
2.50
0.3
0.75
4.25
8.5

Consulting Engineers Group Ltd., Jaipur____________________________________________________________________________
Bridge Design Report_________________________________________________________________
Design Data :For design purposes, following parameters have been considered.
Grade of concrete = M -Abutment Cap = M -
Grade of reinforcement steel = Fe -Centre to Centre distance of A / Expansion joints = mCentre to Centre distance of Bearing = mDepth of superstructure = mmThickness of wearing coat = mmFormation level along C of carriage way = mSoffit level =Pedestal top level =Height of bearing and Pedestal = mL.W.L./Bed level = mH.F.L = mM.S.L = mFounding Level = mAbutment cap top level = mGross safe bearing capacity = t/m2
Live Load Class A two LaneClass 70R wheeled
Bearing :neoprene but during raising Tar paper bearing may be kept.Seismic zone = II
The following codes are used for the design of substructure:1 IRC : 6 - 20002 IRC : 21 - 20003 IRC : 78 - 2000
25
209.9070.000
216.189
41525
67056.00
9.200
204.975
(a)(b)
29.400
8.800
215.463
215.463215.463
214.172202.700

Consulting Engineers Group Ltd., Jaipur____________________________________________________________________________
Bridge Design Report_________________________________________________________________
As per clause 214.2 of IRC:6, horizontal braking force Fh, for each span is:For Class A 2 lane : Fh = x = t
For class 70R wheeled : Fh = x = t
Summary of Longitudinal Forces :
Dead load
Dead load of slab = t/mWearing coat = t/mCrashbarrier = t/mDead load reaction = tSidl reaction = t
0.2
0.2
47.72
49.5 9.896
9.544
Load Case
70R4.954.77
Class A 2 lane
Longitudinal horizontal force (t)
0.5 0.57.50
8.500.76 0.67
1.00066.97813.45
14.5610.924

Consulting Engineers Group Ltd., Jaipur____________________________________________________________________________
Bridge Design Report_________________________________________________________________
Dry Condition with L.La) Vertical load and their moments about C/L of Foundation base.I1 D.L Reaction eL ML eT MT
a Left span2 S.I.D.L
a Left span
4 L.La Left span
70R Wheeled Class A 2 Lane
II Substructure V ρρρρ P eL ML eT MT
1 Pedestala Left span
2 Abut cap RAbut cap Tr
3 Abut shaftup to G.Lbelow G.L
4 Footing5 Earth above
footing67 Earth wt on
heel side
b) Horizantal Forces and Moments withrespect to Base
1 Longitudinal Forces at bearing levelHL HT eL ML eT MT
2 Earth pressure
SummaryP = tML = t-mMT = t-m
A =ZL =ZT =
-263.2266.079 1.8 118.942 -2.213
080.429
P66.98 0.15
12.064
0
13.45 0.15 2.0176 0 0
10.047 0
34.6367.422 0.747.7249.48
0.150.15
7.158 1.16 55.355
02.4 00 0.15 0 0
2.1465 2.4 5.1516 0 0 0 04.779 2.4 11.47 0 0 0 0
10.334 2.4 24.801 0
09.8903 2.4 23.737 0
02.4 56.036
0 0 00 0 0
0 0 023.348118.73 1.80 213.71 0
0 0
0
4.77 50.0490 10.488
334.91 -263
0
10.488 0
30.813
512.16
37.23221.826
4.77 0
55.355268
462.11
128.15 19.222 55.355
463.05

Consulting Engineers Group Ltd., Jaipur____________________________________________________________________________
Bridge Design Report_________________________________________________________________
Check for Maximum Allowable Base Pressure:
Pmax = P + +
A
= + + = t/m2
Pmin = P - -
A
= - - = t/m2
b s P1
P4 Heel Toe
P3 P2b s
Toe3
4Base pressure diagram
21
Design of Toe slabLoadings Element Area factor Force L.A MomentDownward loads 1
2Upward base pressure
34 0.5
-16.618 1.4125 -23.472-7.9283 0.9417 -7.4658
10.362
5.2895
2.8251.60
1
MT
ZT
463.0530.813
268.1637.232
ZL
ML
55.35521.826
24.767
ML MT
ZL ZT
21.826463.05 268.16 55.355 5.2895
7.8257
2.0340.5 2.5425
1.41250.9417
1
37.232
16.618
19.694
22.231
2.825
24.767
0.3
0.75
4.25
7.250
30.813
2.8732.3942
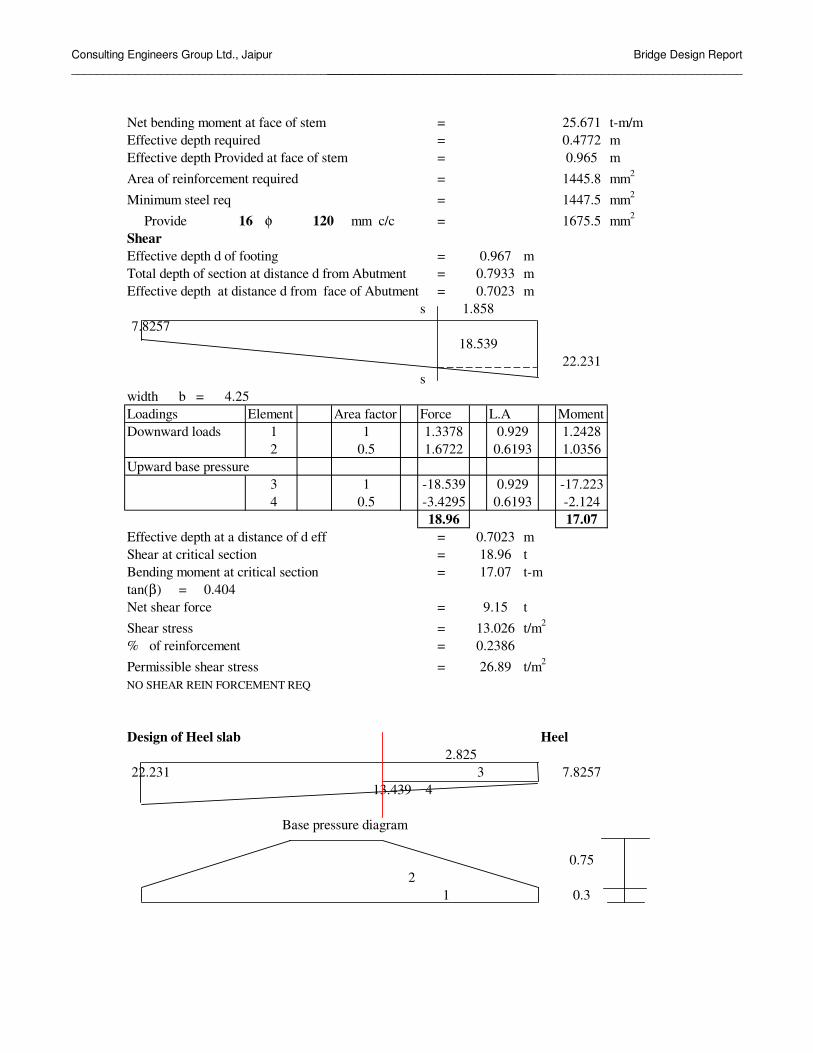
Consulting Engineers Group Ltd., Jaipur____________________________________________________________________________
Bridge Design Report_________________________________________________________________
Net bending moment at face of stem = t-m/mEffective depth required = mEffective depth Provided at face of stem = mArea of reinforcement required = mm2
Minimum steel req = mm2
Provide φ mm c/c = mm2
ShearEffective depth d of footing = mTotal depth of section at distance d from Abutment = mEffective depth at distance d from face of Abutment = m
s
swidth b =Loadings Element Area factor Force L.A MomentDownward loads 1
2Upward base pressure
34
Effective depth at a distance of d eff = mShear at critical section = tBending moment at critical section = t-mtan(β) =Net shear force = tShear stress = t/m2
% of reinforcement =Permissible shear stress = t/m2
NO SHEAR REIN FORCEMENT REQ
Design of Heel slab Heel
34
Base pressure diagram
21
7.8257
0.3
0.75
2.82522.231
13.439
0.404
0.238626.89
18.96 17.07
18.9617.07
0.5 -3.4295 0.6193 -2.1241 -18.539 0.929 -17.223
0.5 1.6722 0.6193 1.03561 1.3378 0.929 1.2428
1447.516 120 1675.5
0.9651445.8
25.6710.4772
13.026
0.7023
4.25
9.15
0.9670.79330.7023
22.231
7.82571.858
18.539

Consulting Engineers Group Ltd., Jaipur____________________________________________________________________________
Bridge Design Report_________________________________________________________________
Loadings Element Area factor Force L.A MomentDownward loads 1
2earth
Upward base pressure34
Net bending moment at face of stem = t-m/mEffective depth required = mEffective depth Provided at face of stem = mArea of reinforcement required = mm2
Minimum steel req = mm2
Provide φ mm c/c = mm2
ShearEffective depth d of footing = mTotal depth of section at distance d from Abutment = mEffective depth at distance d from face of Abutment = m
s
s
width b =Loadings Element Area factor Force L.A MomentDownward loads 1
2earth
Upward base pressure34
Effective depth at a distance of d eff = mShear at critical section = tBending moment at critical section = t-mtan(β) =Net shear force = tShear stress = t/m2
% of reinforcement =Permissible shear stress = t/m2
NO SHEAR REIN FORCEMENT REQ
0.565530.478
55.498 1.4125 78.39
36.501 0.929 33.909
26.790.6945
0.404
18.26112.68
26.79
0.5 -3.4295 0.6193 -2.1241 -7.8257 0.929 -7.2701
22.23111.517
7.8257
4.25
1496.325 125 3927
65.1380.76010.99753549
1 2.034 1.41250.5 2.5425 0.9417
1 -7.8257
28.26
28.26
1 1.3378 0.929
0.6945
0.9625
0.5 1.6722 0.6193 1.0356
0.7945
1.858
1.2428
-7.46580.5 -7.9283 0.9417
2.8732.3942
-11.0541.4125

Consulting Engineers Group Ltd., Jaipur____________________________________________________________________________
Bridge Design Report_________________________________________________________________
Dry Condition with L.La) Vertical load and their moments about Abutment Shaft bottomII Substructure V ρρρρ P eL ML eT MT
1 Pedestala Left span
2 Abut cap RAbut cap Tr
3 Abutment shaftup to G.Lbelow G.L
4 Earth pressure
b) Horizantal Forces and Moments withrespect to Abutment Shaft bottom
1 Longitudinal Forces at bearing levelHL HT eL ML eT MT
Summary for design of AbutmentP = tML = t-mMT = t-m
0 00 2.4 0 0.15
2.4 3.8637 0
0
00 0 00 0 0
4.77
2.4 023.737
63.871
9.8903
9.438
45.038
00 0
351
45.038
0
0 0 00
1.6099
4.77
55.355
0
414.81
0
192.02
9.438 00
4.779 2.4 11.47
10.334 2.4 24.801
351

Consulting Engineers Group Ltd., Jaipur____________________________________________________________________________
Bridge Design Report_________________________________________________________________
H.F.L Condition with L.La) Vertical load and their moments about C/L of Foundation base.I1 D.L Reaction eL ML eT MT
a Left span2 S.I.D.L
a Left span
3 L.La Left span
70R Wheeled Class A 2 Lane
II Substructure V ρρρρ P eL ML eT MT
1 Pedestala Left span2 Abut cap R
Abut cap Tr3 Abut shaft
up to H.F.Lbelow H.F.L
4 Footing5 Earth above
footing6 Earth Pressure 7 Earth wt on
heel side
b) Horizantal Forces and Moments withrespect to Base
1 Longitudinal Forces at bearing levelHL HT eL ML eT MT
SummaryP = tML = t-mMT = t-m
0.000
0.000 0.000
0.000
0.000
66.079 1.000 -2.213 -146.23
0.000 0.000
0.000
66.079
0.000
0.000 0.000 0.000
0.000 0.0000.000 0.000
0.000
55.35534.636
0.0000.000
11.470
49.480 0.150 7.422 0.70047.720 0.150 7.158
0.000
1.160
80.429 12.064
0.000P
66.978 0.150 10.047
0.00013.450 0.150 2.018 0.000
0.000 2.400 0.000 0.150
128.149 19.222 55.355
2.147 2.4000.000 0.000
5.152 0.000 0.0004.779 2.400
0.000 2.400
0.0000.00020.224 1.400 28.313 0.0000.00023.348 1.400 32.688
118.729 1.000 118.729 0.000
196.351 136.639 0.000
50.049
0.000 0.000
10.488
282.871
4.772 0.000 10.488
4.772 0.000 50.049 0.000
324.500205.91055.355

Consulting Engineers Group Ltd., Jaipur____________________________________________________________________________
Bridge Design Report_________________________________________________________________
Check for Maximum Allowable Base Pressure:
Pmax = P + +
A
= + + = t/m2
Pmin = P - -
A
= - - = t/m2
H.F.L Condition with L.La) Vertical load and their moments about Abutment Shaft bottom
II Substructure V ρρρρ P eL ML eT MT
1 Pedestala Left span
2 Abut cap RAbut cap Tr
3 Abut shaftup to H.F.Lbelow H.F.L
b) Horizantal Forces and Moments withrespect to Abutment Shaft bottom1 Longitudinal Forces at bearing level
HL HT eL ML eT MT
Earth pressure
Summary for design of Abutment shaftP = tML = t-mMT = t-m
0.000 0.000 0.000
0.0000.000 0.000
0.000
ZT
324.500 205.910
ML MT
ZL
18.59830.813 37.232 21.826
55.355
ML MT
ZL ZT
324.500 205.910 55.355 2.46530.813 37.232 21.826
0.000 2.400 0.000 0.150
1.610 2.400 3.864 0.0000.0000.000
0.000 0.0000.000
0.0004.779 2.400
0.000 2.40020.224 1.400 28.313 0.000 0.0000.000 0.000
45.038 9.438 0.000
0.000 0.000
0.000
171.795283.904
4.772 0.000 9.438
4.772 0.000
55.355
264.682
43.647
219.644
0.000 0.000
11.470
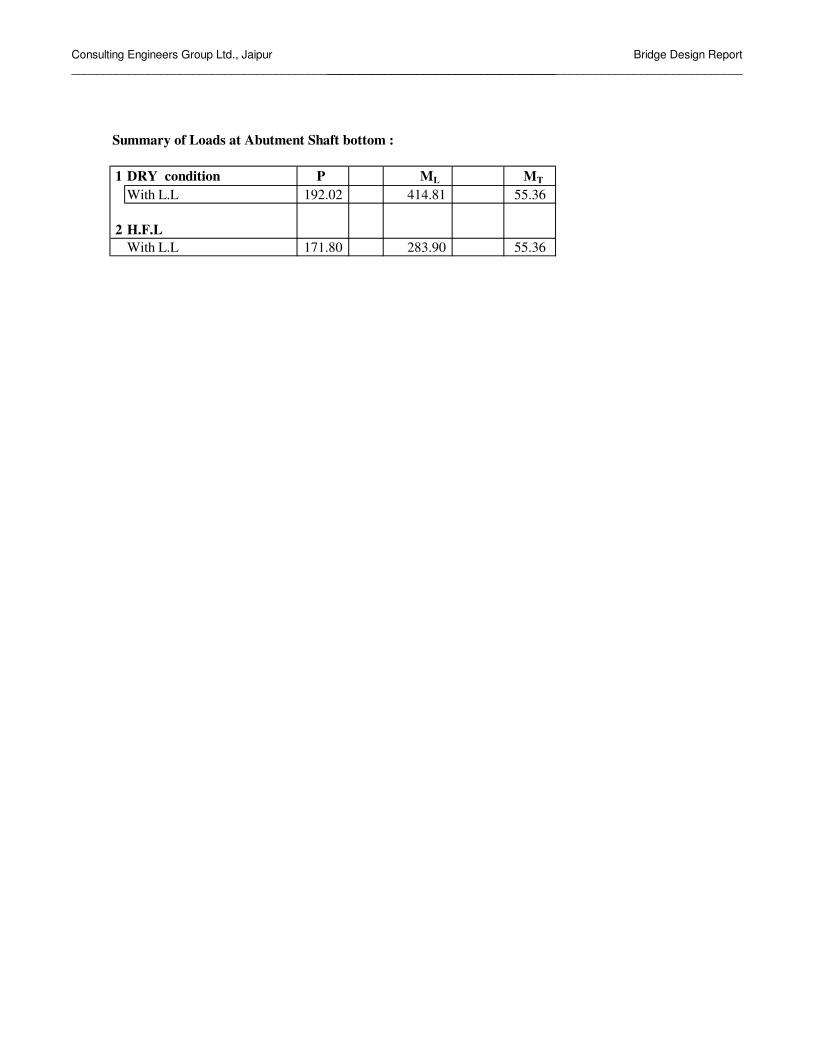
Consulting Engineers Group Ltd., Jaipur____________________________________________________________________________
Bridge Design Report_________________________________________________________________
Summary of Loads at Abutment Shaft bottom :
1 DRY condition P ML MT
With L.L
2 H.F.LWith L.L
192.02 414.81 55.36
171.80 283.90 55.36
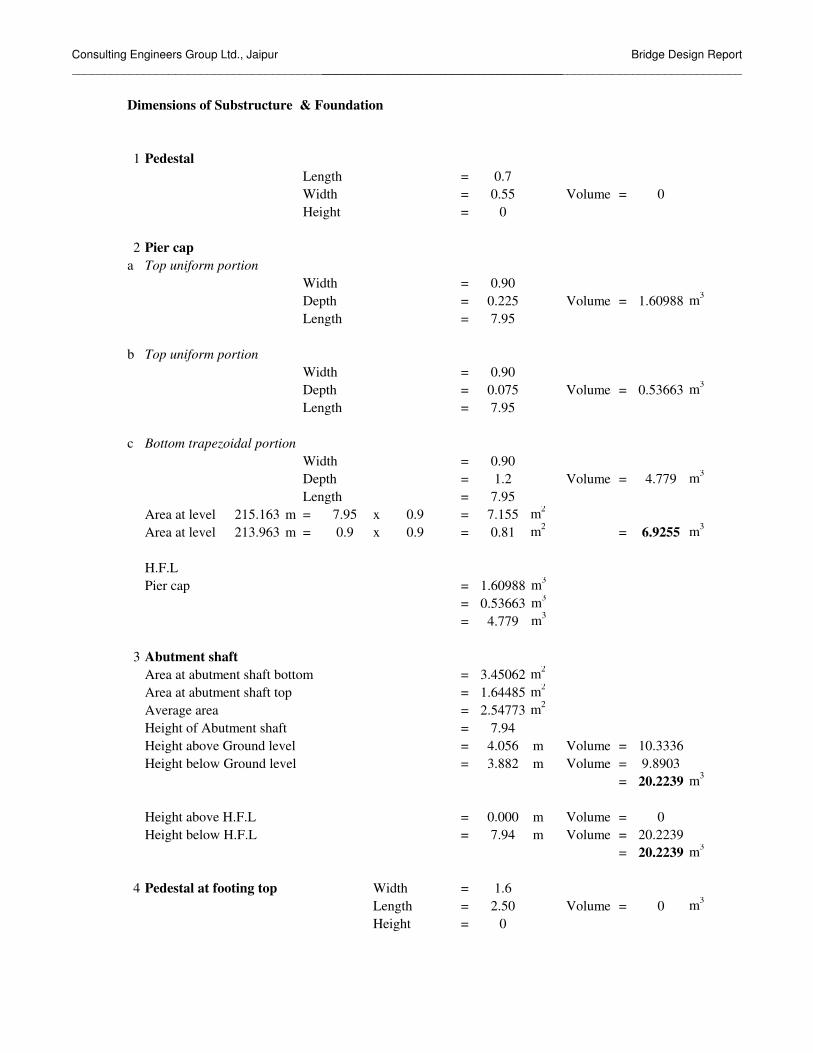
Consulting Engineers Group Ltd., Jaipur____________________________________________________________________________
Bridge Design Report_________________________________________________________________
Dimensions of Substructure & Foundation
1 PedestalLength =Width = Volume =Height =
2 Pier capa Top uniform portion
Width =Depth = Volume = m3
Length =
b Top uniform portionWidth =Depth = Volume = m3
Length =
c Bottom trapezoidal portionWidth =Depth = Volume = m3
Length =Area at level m = x = m2
Area at level m = x = m2 = m3
H.F.L Pier cap = m3
= m3
= m3
3 Abutment shaftArea at abutment shaft bottom = m2
Area at abutment shaft top = m2
Average area = m2
Height of Abutment shaft =Height above Ground level = m Volume =Height below Ground level = m Volume =
= m3
Height above H.F.L = m Volume =Height below H.F.L = m Volume =
= m3
4 Pedestal at footing top Width =Length = Volume = m3
Height =
0.7
0.53663
0
1.60988
0.901.2
3.882
7.94
0.90
0.550
0.90
0.075
0.2257.95
20.2239
215.163
9.8903
6.9255
4.779
10.3336
00
4.056
7.95
7.95
7.155
020.2239
213.963 0.9 0.9 0.817.95 0.9
0.0007.94
20.2239
1.62.50
2.54773
1.609880.536634.779
3.450621.64485

Consulting Engineers Group Ltd., Jaipur____________________________________________________________________________
Bridge Design Report_________________________________________________________________
5 Footing
at foundation levelWidth = mLength = mThickness at Root = mThickness at Tip = m
= m3
Volume of Overburdden earth below ground levelTotal volume x x = m3
Net volume below Ground level = m3
Wt of earth on Heel side above ground level = tSectional Properties of Footing
A = x = m2
ZL = x = m3
ZT = x = m3
66.0788
151.967118.729
4.250 30.813
4.9327.250
7.250
4.250
4.250 8.76042
7.250 3.01042
37.232
21.826
0.3
7.250
1.05
23.3484
4.25

Consulting Engineers Group Ltd., Jaipur____________________________________________________________________________
Bridge Design Report_________________________________________________________________
DESIGN OF ABUTMENT CAP:
For Outer bearing a =D =
Available effective depthusing mm dia of bars d = - -
= ma = = > 1d
= Pier cap designed as Cantilever
A1 A2 A3 A4
0.3
2.125
1.1258.5
2.25
25 1.5
0.1500.90
2.1251.425
1.4912
0.150
0.05 0.025
8.50
0.875 0.8752.25 2.25 2.25
3.38 1.13
2.5
1.2
3
0.300
2.125
1.2
1.50
1.425

Consulting Engineers Group Ltd., Jaipur____________________________________________________________________________
Bridge Design Report_________________________________________________________________
Bearings A1 & A4 are effective.A1
DLSIDLLL70RW due to Transverse moment A1 = x =
A1 = x = t
Summary of loads from superstructure:Loads on Outer bearings
A1DLSIDLLL
Selfweight of piercap upto section through outerbearing:
= + x x x= t
Distance of c.g from section = mCalculation of Cantilevermoment at bearing sectionMoment at the face due to load from outerbearing
= x = t-mDue to selfweight of Abutment cap = x = t-m
Total moment at the face of support = t-mTorsion at outerbearing section:
=Eccentricity =Moment = t-m5.9127
5.8321.1667
83.76297
0.1539.418
5.8322.13
16.7453.3626
55.35525.31
3.38
11.93
16.745
2.00
1.1667
3.36267.3807
0.65
0.93.00
7.3807
2.4
90.5676.804
55.3551.16
1.500
3.000.88
11.9339.418
2.13
0.3 1.50
0.3
39.42
47.72

Consulting Engineers Group Ltd., Jaipur____________________________________________________________________________
Bridge Design Report_________________________________________________________________
Longitudinal Reinforcement:M = = t-m
For, M - & Fe -N/mm2
N/mm2
Effective depth required = xx
= < O.KAst required =
x x= mm2
Provide nos mm dia bars in layers mm2
This reinforcement will provided in full length of Abutment cap.Check for Shear:At bearing section
Available Effective depth at root = mmDownward Load from Superstructure =
= tDownward Load due to self wt of Abutment cap = t
Total downward Load = t
After shear correction, S.F = V - M tanβd
= - x
= tEquivalent shear IRC:21-2000,cl:304.2.3.1
b = + = m2
Ve = V + x T = tb
Shear stress = x = N/mm2
xArea of tension reinforcement = %
τc = N/mm2
Provide minimum shear
90.567
200
R = 1.10590.567
�st =
25 41590.567
�cbc = 8.33
m = 10
10^71.105 900
K = 0.294j = 0.902
954.15 1425
200 0.90290.567
6 20 3769.92
45.25 90.567 0.41.425
19.827561
0.9 0.9 0.9
1.6 30.339
30.339 10000900 1425
0.2366
0.2940.2711
39.4185.83245.25
14253523.2002
142539.418
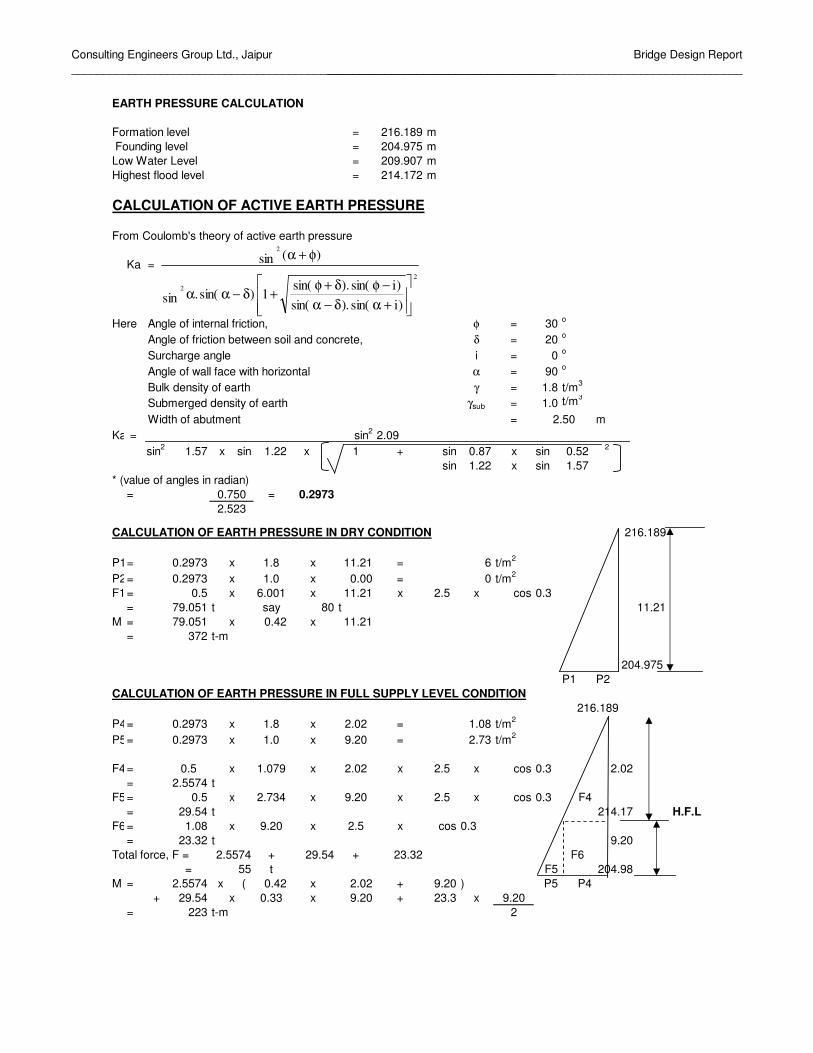
Consulting Engineers Group Ltd., Jaipur____________________________________________________________________________
Bridge Design Report_________________________________________________________________
EARTH PRESSURE CALCULATION
Formation level = 216.189 m Founding level = 204.975 mLow Water Level = 209.907 mHighest flood level = 214.172 m
CALCULATION OF ACTIVE EARTH PRESSURE
From Coulomb's theory of active earth pressure
Ka =
Here Angle of internal friction, φ = 30 o
Angle of friction between soil and concrete, δ = 20 o
Surcharge angle i = 0 o
Angle of wall face with horizontal α = 90 o
Bulk density of earth γ = 1.8 t/m3
Submerged density of earth γsub = 1.0 t/m3
Width of abutment = mKa* = sin2 2.09
sin2 1.57 x sin 1.22 x 1 + sin 0.87 x sin 0.52 2
sin 1.22 x sin 1.57* (value of angles in radian)
= 0.750 = 0.29732.523
CALCULATION OF EARTH PRESSURE IN DRY CONDITION
P1= 0.2973 x 1.8 x 11.21 = 6 t/m2
P2= 0.2973 x 1.0 x 0.00 = 0 t/m2
F1= 0.5 x 6.001 x 11.21 x 2.5 x cos 0.3= 79.051 t say 80 t 11.21
M = 79.051 x 0.42 x 11.21= 372 t-m
P1 P2CALCULATION OF EARTH PRESSURE IN FULL SUPPLY LEVEL CONDITION
P4= 0.2973 x 1.8 x 2.02 = 1.08 t/m2
P5= 0.2973 x 1.0 x 9.20 = 2.73 t/m2
F4= 0.5 x 1.079 x 2.02 x 2.5 x cos 0.3= 2.5574 t
F5= 0.5 x 2.734 x 9.20 x 2.5 x cos 0.3 F4= 29.54 t H.F.L
F6= 1.08 x 9.20 x 2.5 x cos 0.3= 23.32 t
Total force, F = 2.5574 + 29.54 + 23.32 F6= 55 t F5
M = 2.5574 x ( 0.42 x 2.02 + 9.20 ) P5 P4+ 29.54 x 0.33 x 9.20 + 23.3 x 9.20
= 223 t-m 2
2.50
216.189
216.189
204.98
214.17
2.02
204.975
9.209.20
���
�
���
�
+αδ−α−φδ+φ+δ−αα
φ+α
)isin().sin()isin().sin(
1)sin(.sin
)(sin2
2
2

Consulting Engineers Group Ltd., Jaipur____________________________________________________________________________
Bridge Design Report_________________________________________________________________
CALCULATION OF LIVE LOAD SURCHARGEDry F7P6= 0.2973 x 1.2 x 1.8 = 0.64 t/m2
F7= 0.64 x 11.21 x 3 x cos 0.3= 17 t
M = 17 x 10.61 = 90 t-m2 P6
H.F.L
P6= 0.2973 x 1.2 x 1.0 = 0.36 t/m2
F7= 0.6422 x 2.02 x 3 x cos 0.3 = t= 0.3568 x 9.20 x 3 x cos 0.3 = t
=
M = 3.043 + x 5.607 = tm
204.98
11.21
216.189
7.70852510.75154
7.708524503 60.28386
3.043011

Consulting Engineers Group Ltd., Jaipur____________________________________________________________________________
Bridge Design Report_________________________________________________________________
EARTH PRESSURE CALCULATION
Formation level = 216.189 mAbutment shaft bottom level = 206.025 mLow Water Level = 209.907 mHighest flood level = 214.172 m
CALCULATION OF ACTIVE EARTH PRESSURE
From Coulomb's theory of active earth pressure
Ka =
Here Angle of internal friction, φ = 30 o
Angle of friction between soil and concrete, δ = 20 o
Surcharge angle i = 0 o
Angle of wall face with horizontal α = 90 o
Bulk density of earth γ = 1.8 t/m3
Submerged density of earth γsub = 1.0 t/m3
Width of abutment = mKa* = sin2 2.09
sin2 1.57 x sin 1.22 x 1 + sin 0.87 x sin 0.52 2
sin 1.22 x sin 1.57* (value of angles in radian)
= 0.750 = 0.29732.523
CALCULATION OF EARTH PRESSURE IN DRY CONDITION
P1= 0.2973 x 1.8 x 10.16 = 5.44 t/m2
P2= 0.2973 x 1.0 x 0.00 = 0 t/m2
F1= 0.5 x 5.439 x 10.16 x 2.5 x cos 0.3= 64.941 t say 65 t 10.16
M = 64.941 x 0.42 x 10.16= 277 t-m
P1 P2CALCULATION OF EARTH PRESSURE IN FULL SUPPLY LEVEL CONDITION
P4= 0.2973 x 1.8 x 2.02 = 1.08 t/m2
P5= 0.2973 x 1.0 x 8.15 = 2.42 t/m2
F4= 0.5 x 1.079 x 2.02 x 2.5 x cos 0.3= 2.5574 t
F5= 0.5 x 2.422 x 8.15 x 3 x cos 0.3= 23.18 t H.F.L
F6= 1.08 x 8.15 x 2.5 x cos 0.3= 20.66 t
Total force, F = 2.5574 + 23.18 + 20.66= 46 t
M = 2.5574 x ( 0.42 x 2.02 + 8.15 ) P5 P4+ 23.18 x 0.33 x 8.15 + 20.7 x 8.15
= 169 t-m 2
2.50
8.15
206.03
2.02
214.17
216.189
8.15
216.189
206.025
���
�
���
�
+αδ−α−φδ+φ
+δ−αα
φ+α
)isin().sin()isin().sin(
1)sin(.sin
)(sin2
2
2

Consulting Engineers Group Ltd., Jaipur____________________________________________________________________________
Bridge Design Report_________________________________________________________________
CALCULATION OF LIVE LOAD SURCHARGEDryP6= 0.2973 x 1.2 x 1.8 = 0.64 t/m2
F7= 0.64 x 10.16 x 3 x cos 0.3= 15 t
M = 15 x 9.56 = 73 t-m2 P6
H.F.L
P6= 0.2973 x 1.2 x 1.0 = 0.36 t/m2
F7= 0.6422 x 2.02 x 3 x cos 0.3 = t= 0.3568 x 8.15 x 3 x cos 0.3 = t
=
M = 3.043 + x 5.082 = tm6.828460272 50.16682
3.0430116.82846
9.871471
10.16
206.03
216.189
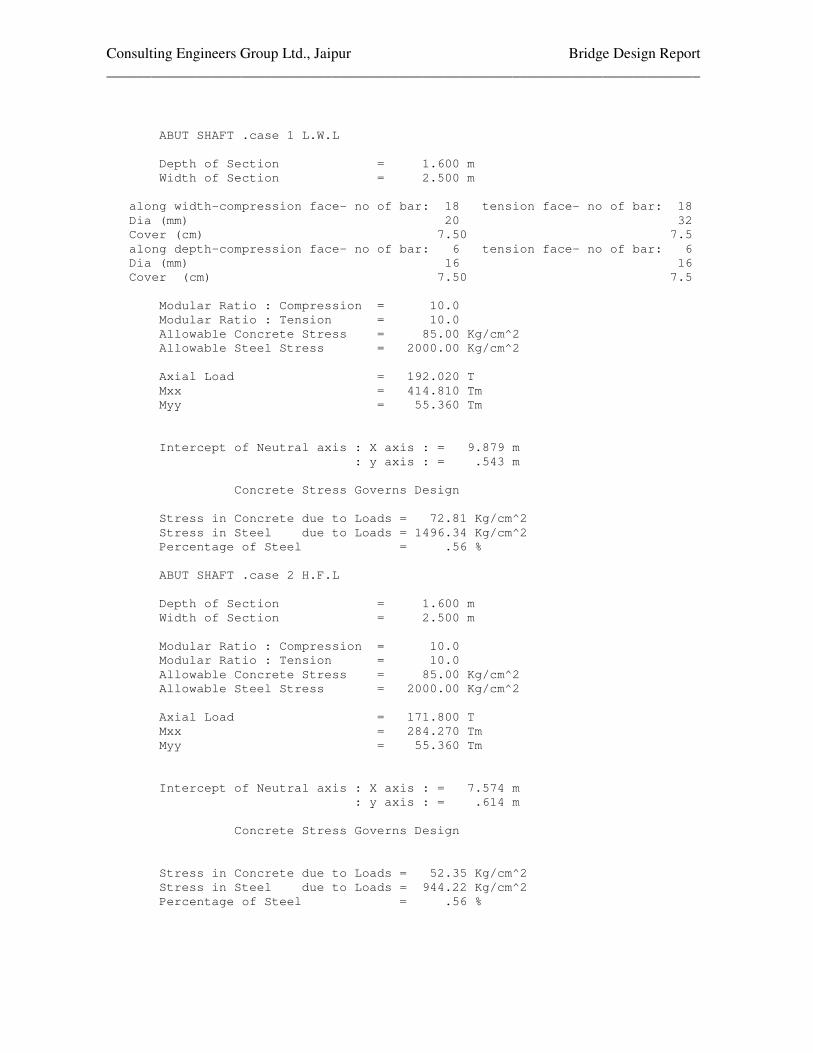
Consulting Engineers Group Ltd., Jaipur Bridge Design Report _______________________________________________________________________________ ABUT SHAFT .case 1 L.W.L Depth of Section = 1.600 m Width of Section = 2.500 m along width-compression face- no of bar: 18 tension face- no of bar: 18 Dia (mm) 20 32 Cover (cm) 7.50 7.5 along depth-compression face- no of bar: 6 tension face- no of bar: 6 Dia (mm) 16 16 Cover (cm) 7.50 7.5 Modular Ratio : Compression = 10.0 Modular Ratio : Tension = 10.0 Allowable Concrete Stress = 85.00 Kg/cm^2 Allowable Steel Stress = 2000.00 Kg/cm^2 Axial Load = 192.020 T Mxx = 414.810 Tm Myy = 55.360 Tm Intercept of Neutral axis : X axis : = 9.879 m : y axis : = .543 m Concrete Stress Governs Design Stress in Concrete due to Loads = 72.81 Kg/cm^2 Stress in Steel due to Loads = 1496.34 Kg/cm^2 Percentage of Steel = .56 % ABUT SHAFT .case 2 H.F.L Depth of Section = 1.600 m Width of Section = 2.500 m Modular Ratio : Compression = 10.0 Modular Ratio : Tension = 10.0 Allowable Concrete Stress = 85.00 Kg/cm^2 Allowable Steel Stress = 2000.00 Kg/cm^2 Axial Load = 171.800 T Mxx = 284.270 Tm Myy = 55.360 Tm Intercept of Neutral axis : X axis : = 7.574 m : y axis : = .614 m Concrete Stress Governs Design Stress in Concrete due to Loads = 52.35 Kg/cm^2 Stress in Steel due to Loads = 944.22 Kg/cm^2 Percentage of Steel = .56 %

Consulting Engineers Group Ltd., Jaipur Bridge Design Report _______________________________________________________________________________ INPUT FILE: CLASS A.STD 1. STAAD SPACE 2. INPUT WIDTH 72 3. UNIT METER MTON 4. PAGE LENGTH 1000 5. UNIT METER MTON 6. JOINT COORDINATES 7. 1 0.0 0 0;2 0.4 0 0;3 8.8 0 0;4 9.2 0 0 8. MEMBER INCIDENCES 9. 1 1 2 3 10. MEMBER PROPERTY CANADIAN 11. 1 TO 3 PRI YD 1.0 ZD 1.0 12. CONSTANT 13. E CONCRETE ALL 14. DENSITY CONCRETE ALL 15. POISSON CONCRETE ALL 16. SUPPORT 17. 2 3 PINNED 18. DEFINE MOVING LOAD 19. TYPE 1 LOAD 2*2.7 2*11.4 4*6.8 DIS 1.1 3.2 1.2 4.3 3 3 3 20. LOAD GENERATION 100 21. TYPE 1 -18.8 0. 0. XINC .2 22. PERFORM ANALYSIS 23. LOAD LIST 74 24. PRINT SUPPORT REACTION SUPPORT REACTION SUPPORT REACTIONS -UNIT MTON METE STRUCTURE TYPE = SPACE ----------------- JOINT LOAD FORCE-X FORCE-Y FORCE-Z MOM-X MOM-Y MOM Z 2 74 0.00 24.74 0.00 0.00 0.00 0.00 3 74 0.00 11.66 0.00 0.00 0.00 0.00 ************** END OF LATEST ANALYSIS RESULT ************** 25. FINISH

Consulting Engineers Group Ltd., Jaipur Bridge Design Report _______________________________________________________________________________ INPUT FILE: 70RW.STD 1. STAAD SPACE 2. INPUT WIDTH 72 3. UNIT METER MTON 4. PAGE LENGTH 1000 5. UNIT METER MTON 6. JOINT COORDINATES 7. 1 0.0 0 0;2 0.4 0 0;3 8.8 0 0;4 9.2 0 0 8. MEMBER INCIDENCES 9. 1 1 2 3 10. MEMBER PROPERTY CANADIAN 11. 1 TO 3 PRI YD 1.0 ZD 1.0 12. CONSTANT 13. E CONCRETE ALL 14. DENSITY CONCRETE ALL 15. POISSON CONCRETE ALL 16. SUPPORT 17. 2 3 PINNED 18. DEFINE MOVING LOAD 19. TYPE 1 LOAD 8.0 2*12 4*17.0 DIS 3.96 1.52 2.13 1.37 3.05 1.37 20. LOAD GENERATION 175 21. TYPE 1 -13.4 0. 0. XINC .2 22. PERFORM ANALYSIS 23. LOAD LIST 30 24. PRINT SUPPORT REACTION SUPPORT REACTION SUPPORT REACTIONS -UNIT MTON METE STRUCTURE TYPE = SPACE ----------------- JOINT LOAD FORCE-X FORCE-Y FORCE-Z MOM-X MOM-Y MOM Z � 2 30 0.00 47.72 0.00 0.00 0.00 0.00 3 30 0.00 20.28 0.00 0.00 0.00 0.00 ************** END OF LATEST ANALYSIS RESULT ************** 25. FINISH

Consulting Engineers Group Ltd., Jaipur Bridge Design Report _______________________________________________________________________________ INPUT FILE: 9.2 M SPAN SIDL.STD 1. STAAD FLOOR 2. START JOB INFORMATION 3. ENGINEER DATE 09-JUN-06 4. END JOB INFORMATION 5. INPUT WIDTH 79 6. UNIT METER MTON 7. JOINT COORDINATES 8. 1 0.0 0.0 0.0;2 0.02 0.0 0.0;3 0.4 0.0 0.0 10 8.4 0.0 0.0;11 8.8 0.0 0.0 9. 12 9.18 0.0 0.0;13 9.22 0.0 0.0;14 9.6 0.0 0.0 22180.00.0;2318.380.0 0.0 10. 24 18.4 0.0 0.0 11. REPEAT ALL 1 0.0 0.0 1.0 12. REPEAT 3 0.0 0.0 2.0 13. REPEAT 1 0.0 0.0 1.0 14. MEMBER INCIDENCES 15. 1 1 2 23 1 1 16. REPEAT 5 23 24 17. 139 1 25 143 1 24 18. REPEAT 23 5 1 19. CONSTANTS 20. E 2.7386E+006 21. POISSON 0.15 22. DENSITY 2.4 MEMB 1 TO 138 23. DENSITY 0.0001 MEMB 139 TO 258 24. MEMBER PROPERTY INDIAN 25. 2 TO 11 13 TO 22 117 TO 126 128 TO 137 PRIS AX 0.330 IX 0.024 IZ 0.012 26. 25 TO 34 36 TO 45 94 TO 103 105 TO 114 PRIS AX 0.990 IX 0.072 IZ 0.036 27. 48 TO 57 59 TO 68 71 TO 80 82 TO 91 PRIS AX 1.320 IX 0.096 IZ 0.048 28. 1 12 23 24 35 46 47 58 69 70 81 92 93 104 115 - 29. 116 127 138 PRIS AX 0.0001 IX 0.0002 IZ 0.0001 30. 139 TO 258 PRIS AX 0.0001 IX 0.0002 IZ 0.0001 31. SUPPORTS 32. 27 51 75 99 ENFORCED BUT FX FZ MX MY MZ 33. 38 62 86 110 ENFORCED BUT FX FZ MX MY MZ 34. 35 59 83 107 PINNED 35. 46 70 94 118 PINNED 36. MEMBER RELEASE 37. 1 24 47 93 116 END MZ 38. 23 46 92 115 138 START MZ 39. 12 35 58 81 104 127 START MZ 40. 12 35 58 81 104 127 END MZ 41. LOAD 1 SIDL 42. *** CRASH BARRIER 43. MEMBER LOAD 44. 25 TO 45 UNI GY -1.0 45. 94 TO 114 UNI GY -1.0 46. 25 TO 45 UMOM GX -1.0 47. 94 TO 114 UMOM GX 1.0 48. LOAD 2 WEARINGCOAT 49. MEMBER LOAD 50. 25 TO 114 UNI GY -0.2464 51. PERFORM ANALYSIS �
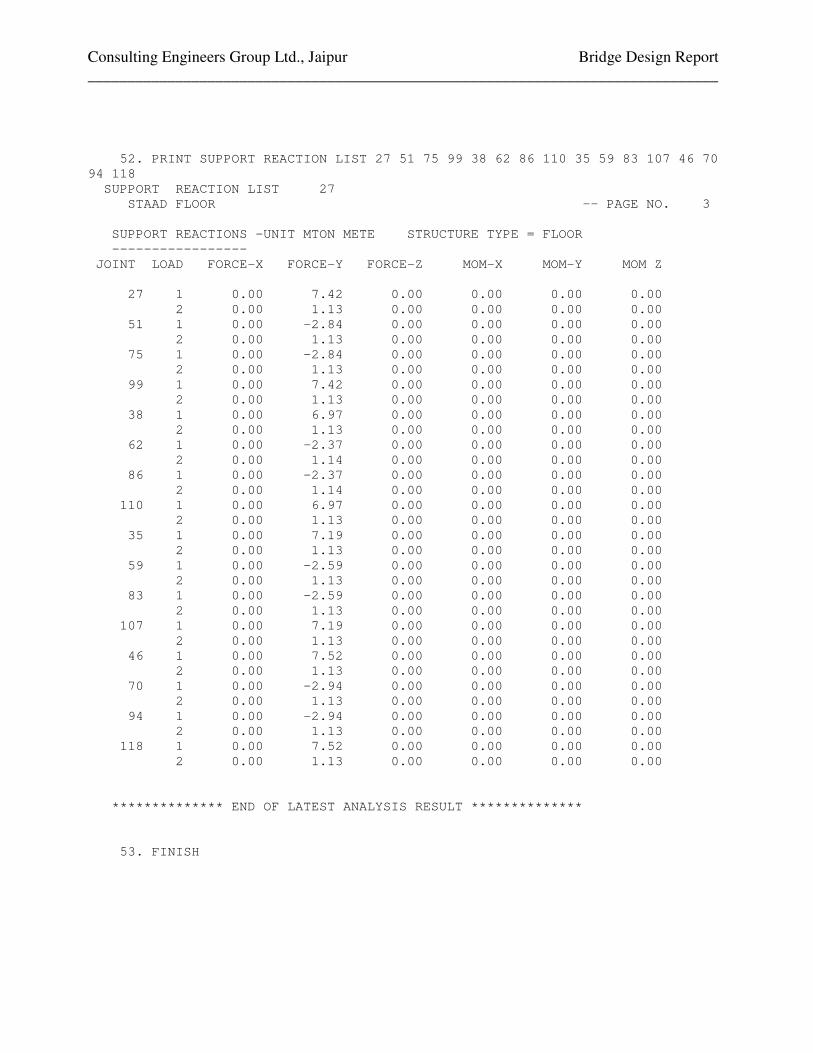
Consulting Engineers Group Ltd., Jaipur Bridge Design Report _______________________________________________________________________________ 52. PRINT SUPPORT REACTION LIST 27 51 75 99 38 62 86 110 35 59 83 107 46 70 94 118 � SUPPORT REACTION LIST 27 � STAAD FLOOR -- PAGE NO. 3 SUPPORT REACTIONS -UNIT MTON METE STRUCTURE TYPE = FLOOR ----------------- JOINT LOAD FORCE-X FORCE-Y FORCE-Z MOM-X MOM-Y MOM Z 27 1 0.00 7.42 0.00 0.00 0.00 0.00 2 0.00 1.13 0.00 0.00 0.00 0.00 51 1 0.00 -2.84 0.00 0.00 0.00 0.00 2 0.00 1.13 0.00 0.00 0.00 0.00 75 1 0.00 -2.84 0.00 0.00 0.00 0.00 2 0.00 1.13 0.00 0.00 0.00 0.00 99 1 0.00 7.42 0.00 0.00 0.00 0.00 2 0.00 1.13 0.00 0.00 0.00 0.00 38 1 0.00 6.97 0.00 0.00 0.00 0.00 2 0.00 1.13 0.00 0.00 0.00 0.00 62 1 0.00 -2.37 0.00 0.00 0.00 0.00 2 0.00 1.14 0.00 0.00 0.00 0.00 86 1 0.00 -2.37 0.00 0.00 0.00 0.00 2 0.00 1.14 0.00 0.00 0.00 0.00 110 1 0.00 6.97 0.00 0.00 0.00 0.00 2 0.00 1.13 0.00 0.00 0.00 0.00 35 1 0.00 7.19 0.00 0.00 0.00 0.00 2 0.00 1.13 0.00 0.00 0.00 0.00 59 1 0.00 -2.59 0.00 0.00 0.00 0.00 2 0.00 1.13 0.00 0.00 0.00 0.00 83 1 0.00 -2.59 0.00 0.00 0.00 0.00 2 0.00 1.13 0.00 0.00 0.00 0.00 107 1 0.00 7.19 0.00 0.00 0.00 0.00 2 0.00 1.13 0.00 0.00 0.00 0.00 46 1 0.00 7.52 0.00 0.00 0.00 0.00 2 0.00 1.13 0.00 0.00 0.00 0.00 70 1 0.00 -2.94 0.00 0.00 0.00 0.00 2 0.00 1.13 0.00 0.00 0.00 0.00 94 1 0.00 -2.94 0.00 0.00 0.00 0.00 2 0.00 1.13 0.00 0.00 0.00 0.00 118 1 0.00 7.52 0.00 0.00 0.00 0.00 2 0.00 1.13 0.00 0.00 0.00 0.00 ************** END OF LATEST ANALYSIS RESULT ************** 53. FINISH

Consulting Engineers Group Ltd., Jaipur Bridge Design Report _______________________________________________________________________________
INPUT FILE: 9.2 M SPAN DL.STD 1. STAAD FLOOR 2. START JOB INFORMATION 3. ENGINEER DATE 09-JUN-06 4. END JOB INFORMATION 5. INPUT WIDTH 79 6. UNIT METER MTON 7. JOINT COORDINATES 8. 1 0.0 0.0 0.0;2 0.02 0.0 0.0;3 0.4 0.0 0.0 10 8.4 0.0 0.0;11 8.8 0.0 0.0 9. 12 9.18 0.0 0.0;139.22 0.0 0.0;14 9.6 0.00.0 22 18 0.00.0;2318.380.0 0.0 10. 24 18.4 0.0 0.0 11. REPEAT ALL 1 0.0 0.0 1.0 12. REPEAT 3 0.0 0.0 2.0 13. REPEAT 1 0.0 0.0 1.0 14. MEMBER INCIDENCES 15. 1 1 2 23 1 1 16. REPEAT 5 23 24 17. 139 1 25 143 1 24 18. REPEAT 23 5 1 19. CONSTANTS 20. E 2.7386E+006 21. POISSON 0.15 22. DENSITY 2.4 MEMB 1 TO 138 23. DENSITY 0.0001 MEMB 139 TO 258 24. MEMBER PROPERTY INDIAN 25. 2 TO 11 13 TO 22 117 TO 126 128 TO 137 PRIS AX 0.330 IX 0.024 IZ 0.012 26. 25 TO 34 36 TO 45 94 TO 103 105 TO 114 PRIS AX 0.990 IX 0.072 IZ 0.036 27. 48 TO 57 59 TO 68 71 TO 80 82 TO 91 PRIS AX 1.320 IX 0.096 IZ 0.048 28. 1 12 23 24 35 46 47 58 69 70 81 92 93 104 115 - 29. 116 127 138 PRIS AX 0.0001 IX 0.0002 IZ 0.0001 30. 139 TO 258 PRIS AX 0.0001 IX 0.0002 IZ 0.0001 31. SUPPORTS 32. 27 51 75 99 ENFORCED BUT FX FZ MX MY MZ 33. 38 62 86 110 ENFORCED BUT FX FZ MX MY MZ 34. 35 59 83 107 PINNED 35. 46 70 94 118 PINNED 36. MEMBER RELEASE 37. 1 24 47 93 116 END MZ 38. 23 46 92 115 138 START MZ 39. 12 35 58 81 104 127 START MZ 40. 12 35 58 81 104 127 END MZ 41. LOAD 1 SELFWEIGHT 42. SELF Y -1 43. PERFORM ANALYSIS 44. PRINT SUPPORT REACTION LIST 27 51 75 99 38 62 86 110 35 59 83 107 46 70 94 118

Consulting Engineers Group Ltd., Jaipur Bridge Design Report _______________________________________________________________________________
� SUPPORT REACTION LIST 27 � SUPPORT REACTIONS -UNIT MTON METE STRUCTURE TYPE = FLOOR ----------------- JOINT LOAD FORCE-X FORCE-Y FORCE-Z MOM-X MOM-Y MOM Z � 27 1 0.00 16.77 0.00 0.00 0.00 0.00 51 1 0.00 12.24 0.00 0.00 0.00 0.00 75 1 0.00 12.24 0.00 0.00 0.00 0.00 99 1 0.00 16.77 0.00 0.00 0.00 0.00 38 1 0.00 16.42 0.00 0.00 0.00 0.00 62 1 0.00 12.60 0.00 0.00 0.00 0.00 86 1 0.00 12.60 0.00 0.00 0.00 0.00 110 1 0.00 16.42 0.00 0.00 0.00 0.00 35 1 0.00 16.58 0.00 0.00 0.00 0.00 59 1 0.00 12.44 0.00 0.00 0.00 0.00 83 1 0.00 12.44 0.00 0.00 0.00 0.00 107 1 0.00 16.58 0.00 0.00 0.00 0.00 46 1 0.00 16.86 0.00 0.00 0.00 0.00 70 1 0.00 12.16 0.00 0.00 0.00 0.00 94 1 0.00 12.16 0.00 0.00 0.00 0.00 118 1 0.00 16.86 0.00 0.00 0.00 0.00 ************** END OF LATEST ANALYSIS RESULT ************** 45. FINISH

CEG.Ltd., Jaipur Bridge Design Report
Consultancy Services for Feasibility Study and Detailed Project Preparation for Proposed Orissa State Road Project
DESIGN OF SUBSTRUCTURE (PIER)

Consulting Engineers Group Ltd., Jaipur________________________________________________________________________________________
Bridge Design Report________________________________________________________________________________________
Design Data :For design purposes, following parameters have been considered.
Grade of concrete = M -Pier Cap = M -
Grade of reinforcement steel = Fe -Centre to Centre distance between Expansion joints = mCentre to Centre distance of Bearing = mDepth of superstructure = mmThickness of wearing coat = mmFormation level along C of carriage way = mSoffit level =Pedestal top level =Height of bearing and Pedestal = mL.W.L./Bed level = mH.F.L = mM.S.L = mFounding Level = mPier cap top level = m
Gross safe bearing capacity = t/m2
Live Load Class A two LaneClass 70R wheeled
Bearing : neoprene but during raising Tar paper bearing may be kept.Seismic zone = II
The following codes are used for the design of substructure:1 IRC : 6 - 20002 IRC : 21 - 20003 IRC : 78 - 2000
25
209.3000.025
216.189
41525
67056.00
(a)(b)
9.200
215.438
215.438215.463
214.172205.452204.800
29.715
8.800

Consulting Engineers Group Ltd., Jaipur________________________________________________________________________________________
Bridge Design Report________________________________________________________________________________________
As per clause 214.2 of IRC:6, horizontal braking force Fh, for each span is:For Class A 2 lane : Fh = x = t
For class 70R wheeled : Fh = x = t
Summary of Longitudinal Forces :
Dead load
Dead load of slab = t/mWearing coat = t/mCrashbarrier = t/mDead load reaction = tSidl reaction = t
0.2 66.1
0.2 59.2 11.836
13.210
5.926.61
Class A 2 lane
Longitudinal horizontal force (t)
0.5 7.50
0.00
Load Case
Span dislodged condition70R
0.5
0.76 0.67
66.97813.45
8.5014.5610.924
1

Consulting Engineers Group Ltd., Jaipur________________________________________________________________________________________
Bridge Design Report________________________________________________________________________________________
H.F.L Condition with L.La) Vertical load and their moments about C/L of Foundation base.I1 D.L Reaction eL ML eT MT
a Left spanb Right span2 S.I.D.L
a Left spanb Right span
3 L.L Max Reaction casea Left span
70R Wheeled Class A 2 Lane
b Right span70R Wheeled Class A 2 Lane
4 L.L Max Long.Moment casea Left span
70R WheeledClass A 2 Lane
b Right span70R Wheeled Class A 2 Lane
Max Reaction case:Max Long. moment case:
II Substructure V ρρρρ P eL ML eT MT
1 Pedestala Left spanb Right span2 Pier cap R
Pier cap Tr3 Pier shaft
up to H.F.Lbelow H.F.L
4 Footing5 Earth above
footing6 Water current
b) Horizantal Forces and Moments withrespect to Base1 Longitudinal Forces at bearing level
HL HT eL ML eT MT
Summary Max Reaction case Max Long.moment caseP = tML = t-mMT = t-m 61.734
76.61854.694
395.651106.904
0.000
0.000
0.000
0.0000.000
0.000
226.907208.007
1.42018.860
0.400 19.096 0.700 33.418
4.816
47.150 0.400 18.860 1.160 54.694
0.700
0.000
0.000 -0.400 0.000 1.160 0.000
41.76033.600 -0.400 -13.440
P66.978 -0.400 -26.791 0.000 0.00066.978 0.400 26.791 0.000 0.000
0.00013.450 0.400 5.380 0.000 0.00013.450 -0.400 -5.380 0.000
0.700 23.52036.000 -0.400 -14.400 1.160
34.85825.580 0.400 10.232 0.700 17.90630.050 0.400 12.020 1.160
0.000 2.400 0.000 -0.400 0.000 0.000 0.0000.0000.0000.000 2.400
2.550 2.4000.000 0.400 0.000
0.000
6.120 0.0000.000 0.000 0.000
0.000
0.000 0.0000.000 0.000
5.700 2.400
0.000 2.4001.400 21.579 0.000
13.680
0.00023.224 1.400 32.513 0.000 0.000 0.000 0.000
0.00015.413
113.752 1.000 113.752 0.000
187.643 17.615 7.0400.000 7.0400.000 0.000
70.429
0.000 0.000
10.638
17.615
6.605 0.000 10.6636.605 0.000 70.429 0.000
414.55189.46483.658
160.857 0.000
6.880 -0.400 -2.752
47.740

Consulting Engineers Group Ltd., Jaipur________________________________________________________________________________________
Bridge Design Report________________________________________________________________________________________
Check for Maximum Allowable Base Pressure:
Pmax = P + +
A
= + + = t/m2
Pmin = P - -
A
= - - = t/m2
Max LongPmax = P + +
A
= + + = t/m2
Pmin = P - -
A
= - - = t/m2
H.F.L Condition with L.La) Vertical load and their moments about Pier Shaft bottom
II Substructure V ρρρρ P eL ML eT MT
1 Pedestala Left spanb Right span2 Pier cap R
Pier cap Tr3 Pier shaft
up to H.F.Lbelow H.F.L
4 Water current
b) Horizantal Forces and Moments withrespect to Pier Shaft bottom
1 Longitudinal Forces at bearing levelHL HT eL ML eT MT
31.900 30.837 29.242395.651 106.904 61.734 6.825
ML MT
ZL ZT
31.900 30.837 29.242395.651 106.904 61.734 17.981
ML MT
ZL ZT
0.0000.000 0.000
0.000
0.000
ZT
414.551 89.464
ML MT
ZL
18.75731.900 30.837 29.242
83.658
ML MT
ZL ZT
414.551 89.464 83.658 7.23331.900 30.837 29.242
0.000 2.400 0.000 -0.400 0.000 0.000 0.0000.000 0.0000.000
2.550 2.400 6.1202.400
0.00013.680 0.000
0.0000.000 0.400
0.0000.000
0.000 0.000 0.000
5.700 2.400
0.000 1.400 0.000 0.00015.413 1.400 21.579 0.000
6.9766.97617.593
6.605 0.000 9.613
0.0000.000 0.000
63.494 9.588
41.379 17.593
6.605 0.000 63.494 0.000
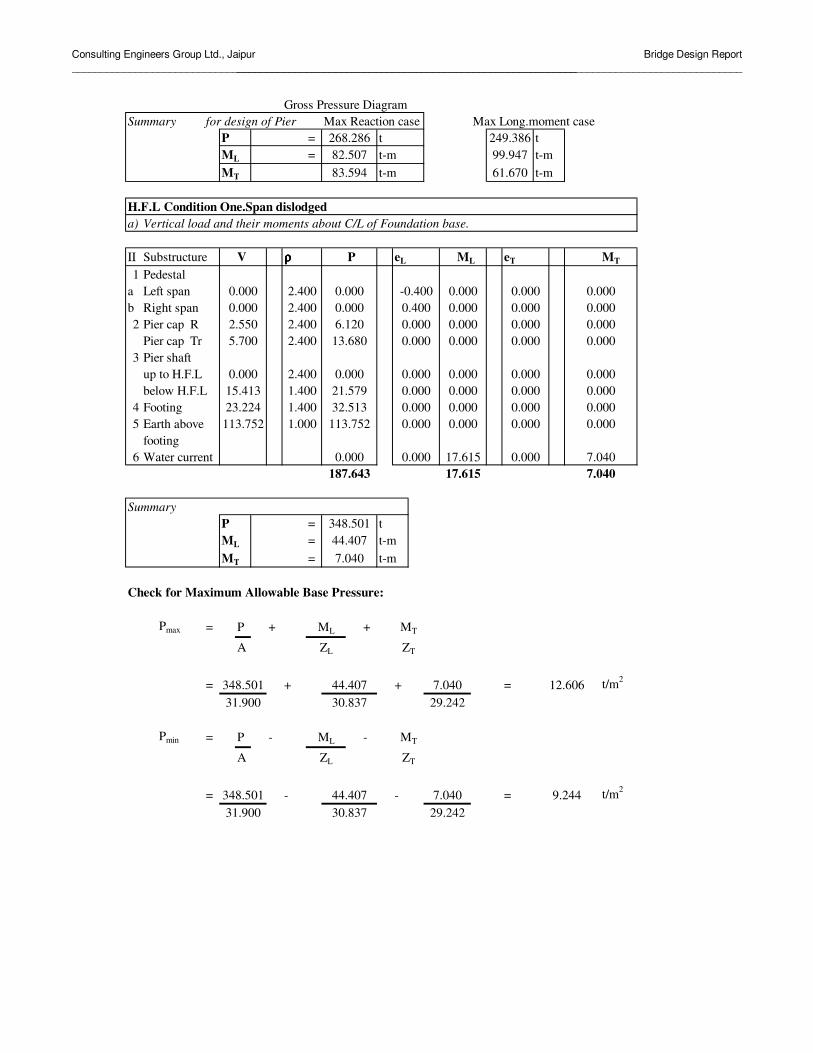
Consulting Engineers Group Ltd., Jaipur________________________________________________________________________________________
Bridge Design Report________________________________________________________________________________________
Gross Pressure DiagramSummary for design of Pier Max Reaction case Max Long.moment case
P = t tML = t-m t-mMT t-m t-m
H.F.L Condition One.Span dislodged a) Vertical load and their moments about C/L of Foundation base.
II Substructure V ρρρρ P eL ML eT MT
1 Pedestala Left spanb Right span2 Pier cap R
Pier cap Tr3 Pier shaft
up to H.F.Lbelow H.F.L
4 Footing5 Earth above
footing6 Water current
SummaryP = tML = t-mMT = t-m
Check for Maximum Allowable Base Pressure:
Pmax = P + +
A
= + + = t/m2
Pmin = P - -
A
= - - = t/m2
249.38699.94761.670
268.28682.50783.594
0.000 2.400 0.000 -0.400 0.000 0.000 0.0000.000 2.400 0.000 0.400 0.000 0.000 0.0002.550 2.400 6.120 0.000 0.000 0.000 0.0005.700 2.400 13.680 0.000 0.000 0.000 0.000
0.000 2.400 0.000 0.000 0.000 0.000 0.00015.413 1.400 21.579 0.000 0.000 0.000 0.00023.224 1.400 32.513 0.000 0.000 0.000 0.000
113.752 1.000 113.752 0.000 0.000
187.643 17.615 7.0400.000 7.0400.000
0.000 0.000
17.615
MT
ZL ZT
348.501 44.407
ML
7.040 12.60631.900 30.837 29.242
ML MT
ZL ZT
348.501 44.407 7.040 9.24431.900 30.837 29.242
0.000
348.50144.4077.040
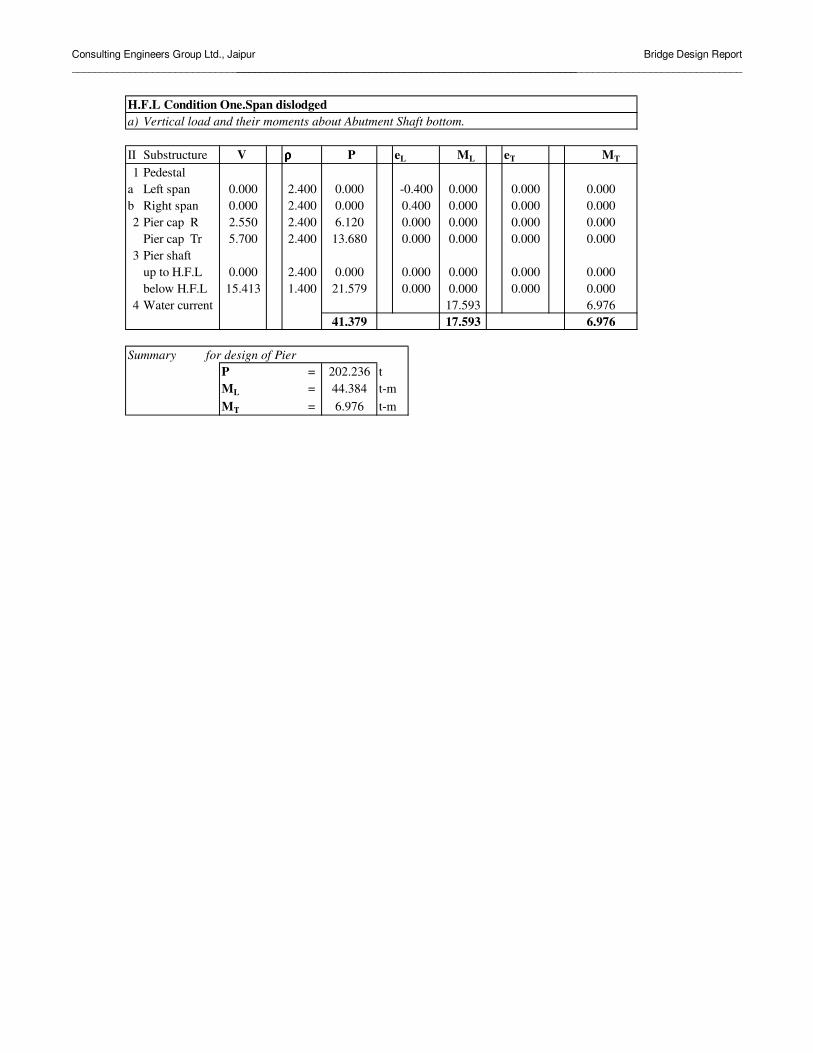
Consulting Engineers Group Ltd., Jaipur________________________________________________________________________________________
Bridge Design Report________________________________________________________________________________________
H.F.L Condition One.Span dislodgeda) Vertical load and their moments about Abutment Shaft bottom.
II Substructure V ρρρρ P eL ML eT MT
1 Pedestala Left spanb Right span2 Pier cap R
Pier cap Tr3 Pier shaft
up to H.F.Lbelow H.F.L
4 Water current
Summary for design of PierP = tML = t-mMT = t-m
0.000 2.400 0.000 -0.400 0.000 0.000 0.0000.000 2.400 0.000 0.400 0.000 0.000 0.0002.550 2.400 6.120 0.000 0.000 0.000 0.0005.700 2.400 13.680 0.000 0.000 0.000 0.000
0.000 2.400 0.000 0.00015.413 1.400 21.579 0.000
0.000 0.000 0.0000.000 0.0000.000
17.593 6.97617.593 6.976
202.23644.3846.976
41.379

Consulting Engineers Group Ltd., Jaipur________________________________________________________________________________________
Bridge Design Report________________________________________________________________________________________
Dry Condition with L.La) Vertical load and their moments about C/L of Foundation base.I1 D.L Reaction eL ML eT MT
a Left spanb Right span2 S.I.D.L
a Left spanb Right span
4 L.L Max Reaction casea Left span
70R Wheeled + Class AClass A 3 Lane
b Right span70R Wheeled + Class AClass A 3 Lane
4 L.L Max Longitudinal Moment casea Left span
70R Wheeled + Class AClass A 3 Lane
b Right span70R Wheeled + Class AClass A 3 Lane
Max Reaction case
Max Longitudinal Moment
II Substructure V ρρρρ P eL ML eT MT
1 Pedestala Left spanb Right span2 Pier cap R
Pier cap Tr3 Pier shaft
up to G.Lbelow G.L
4 Footing5 Earth above
footing
0 0160.86
0
P66.9866.98
-0.40.4 26.791
0 00
13.45 -0.4 -5.3802 0 0
-26.791
013.45 0.4 5.3802 0
0.4 0 0 0
-14.4 1.16 41.76-13.44 0.7
3633.6
-0.4-0.4 23.52
34.85825.58 0.4 10.232 0.7 17.90630.05 0.4 12.02 1.16
226.91 1.42 76.618
0 -0.4 0 1.16 06.88
00
2.42.4
00
0 -0.4 0 0
2.55 2.4 6.12 05.7 2.4 13.68 0
0 08.8386446 2.4 21.213 06.574671 2.4 15.779 0
023.22375113.75158 2 227.5 0
0 0 0
0
55.7370
-0.4 -2.752 0.7 4.816
54.69447.74 0.4 19.096 0.7 33.41847.15 0.4 18.86 1.16
54.694
0 0 0
0 0 00 0 0
0
208.01 18.86
340.03 0
002.4

Consulting Engineers Group Ltd., Jaipur________________________________________________________________________________________
Bridge Design Report________________________________________________________________________________________
b) Horizantal Forces and Moments withrespect to Base
1 Longitudinal Forces at bearing levelHL HT eL ML eT MT
Summary Max Reaction Max LongitudinalP = tML = t-mMT = t-m
A =ZL =
ZT =Max reaction caseCheck for Maximum Allowable Base Pressure:
Pmax = P + +
A
= + + = t/m2
Pmin = P - -
A
= - - = t/m2
Max Longitudinal moment case
Pmax = P + +
A
= + + = t/m2
Pmin = P - -
A
= - - = t/m254.694 12.41431.9 30.837 29.242
ML MT
ZL ZT
MT
ZT
54.694
6.61 70.4290 10.663
0
10.638 0
548.0489.28954.694
30.837
29.242
6.61 0
76.618
31.9
MT
ZT
566.9395231.9
71.84930.837
ZL
ML
76.61829.242
22.723
ML MT
ZL ZT
29.242566.93952 71.849 76.618 12.822
89.289
548.03952 89.289
21.94631.9 30.837 29.242
31.9 30.837
ML
ZL
548.03952
566.9471.849
70.429

Consulting Engineers Group Ltd., Jaipur________________________________________________________________________________________
Bridge Design Report________________________________________________________________________________________
Design of Footing in Transverse directionP4 b P1
P3 P2
bGross Pressure Diagram
Net Pressure diagram bBending moment at the face of pier b-b = t-mFooting is checked for shear at distance of d from face pierEffective depth d of footing = mTotal depth of section at distance d from pier = mEffective depth at distance d from face of pier = m
Bending moment at a distance of d from face of pier = t-mShear force at a distance d from face of pier = tNet shear force at a distance d from face of pier = t
(after correction)
Design for Flexure:M = Fe =
Permissible compressive stress σcbc = N/mm2
Permissible tensile stress σst = N/mm2
m =k =j =Q =
25 415
8.33
20010
0.290.91.1053
20.102
2.49
120.27101.34
42.06
0.96250.76010.6691
17.482
22.723
10.582
1.5275
13.75
5.50
12.822
14.882
15.442
5.800
18.102
239.82
10.58212.432 14.882
18.063

Consulting Engineers Group Ltd., Jaipur________________________________________________________________________________________
Bridge Design Report________________________________________________________________________________________
width b =
Effective depth required d = mmEffective depth provided = mm
Ast Required = mm2
Provide nos dia bars /m width
Check for shearShear stress at effective depth from pier = t/m2
% of steel provided =
Permissible shear stress = t/m2
Minimum Shear Reinforcement :
Asw =
Asw = x b = cm2/m
Provide 2 Legged @ = cm2/m
Dry Condition with L.La) Vertical load and their moments about Pier Shaft bottomII Substructure V ρρρρ P eL ML eT MT
1 Pedestala Left spanb Right span2 Pier cap R
Pier cap Tr3 Pier shaft
up to G.Lbelow G.L
0 0
2511.3
10 200 7.854
0.4 6.0933
5.50
628.08962.5
s 0.87 x fy
0.4
b x s 0.87 x fy
6 25
27.5380.2392
23.46
0 00 2.4 0 0.40 2.4 0 -0.4
2.4 6.12 0
00 0 00 0 0
0 0
02.4 015.779
0 0 000 0
0 0
2.55
56.792
6.574671
5.7 2.4 13.68
8.8386446 2.4 21.213
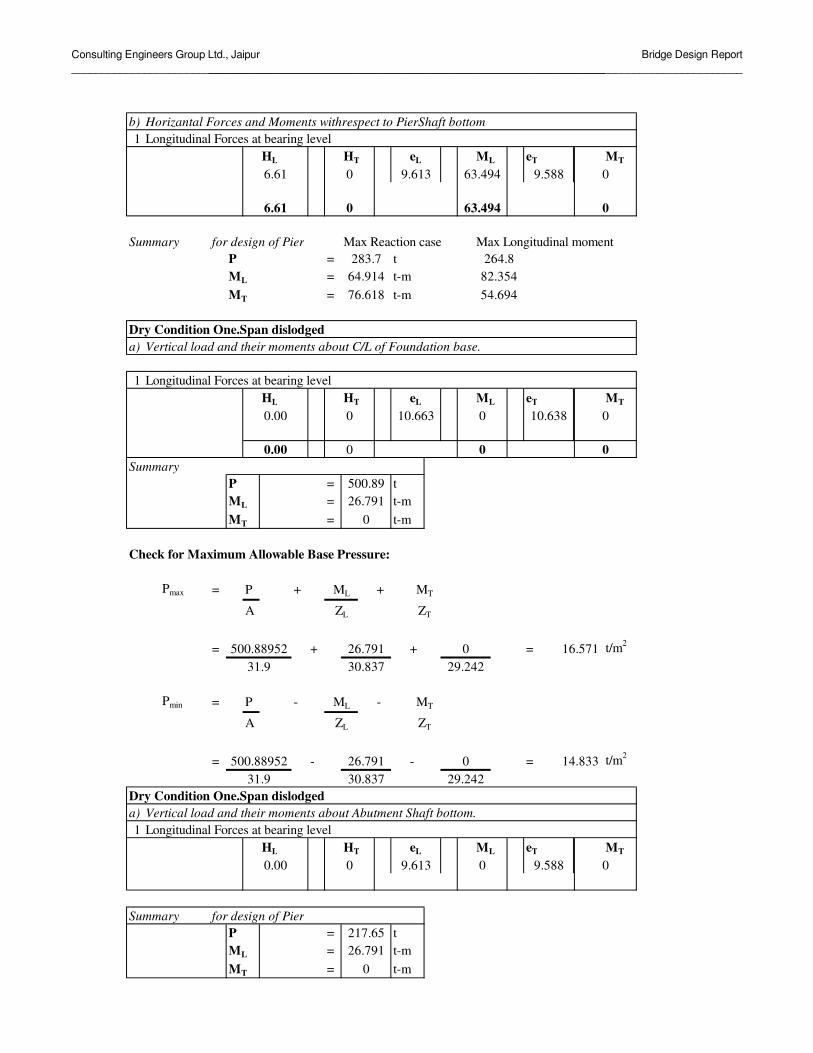
Consulting Engineers Group Ltd., Jaipur________________________________________________________________________________________
Bridge Design Report________________________________________________________________________________________
b) Horizantal Forces and Moments withrespect to PierShaft bottom1 Longitudinal Forces at bearing level
HL HT eL ML eT MT
Summary for design of Pier Max Reaction case Max Longitudinal momentP = tML = t-mMT = t-m
Dry Condition One.Span dislodged a) Vertical load and their moments about C/L of Foundation base.
1 Longitudinal Forces at bearing levelHL HT eL ML eT MT
SummaryP = tML = t-mMT = t-m
Check for Maximum Allowable Base Pressure:
Pmax = P + +
A
= + + = t/m2
Pmin = P - -
A
= - - = t/m2
Dry Condition One.Span dislodgeda) Vertical load and their moments about Abutment Shaft bottom.1 Longitudinal Forces at bearing level
HL HT eL ML eT MT
Summary for design of PierP = tML = t-mMT = t-m
0.00 0 9.613 0
0 0
9.588 0
16.571
29.242
10.663 0
63.494
63.4946.61 9.588 00 9.613
54.694
10.638 0
0 0
64.914264.8
82.354283.7
ZT
76.618
500.89
0.00 0
0.00 0
MT
ZL
31.9 30.837 29.242500.88952 26.791 0
ML MT
ZL ZT
500.88952 26.791 0 14.833
0
217.65
26.7910
26.791
ML
31.9 30.837
6.61

Consulting Engineers Group Ltd., Jaipur________________________________________________________________________________________
Bridge Design Report________________________________________________________________________________________
φφ
φ no.both sides
Summary of Loads at Pier Shaft bottom :
1 DRY condition P ML MT
With L.LSpan dislodged
2 H.F.LWith L.LSpan dislodged
20 1820 18
1680
820
16 6
2500
PLAN : PIER SHAFT
283.70 64.91 76.62217.65 26.79 0.00
268.29 82.51 83.59202.24 44.38 6.98
410 410

Consulting Engineers Group Ltd., Jaipur________________________________________________________________________________________
Bridge Design Report________________________________________________________________________________________
H.F.L
G.L
0
0.82205.850
0.3
215.438
215.138
0.3
213.938
214.172
209.3
0.75
2.49
1.2
204.800
205.100
205.850
1.05
0.820
5.800

Consulting Engineers Group Ltd., Jaipur________________________________________________________________________________________
Bridge Design Report________________________________________________________________________________________
Dimensions of Substructure & Foundation
1 PedestalLength =Width = Volume =Height =
2 Pier capa Top uniform portion
Width =Depth = Volume = m3
Length =b Bottom trapezoidal portion
Width =Depth = Volume = m3
Length =Area at level m = x = m2
Area at level m = x = m2 = m3
0.38.5
5.800
0
2.55
0.70.55
0
1.00
215.1388.25
5.50
0.41
5.71
1.2
1.50
1.50
0.41
2.49 1.68
8.5
213.938 1 1 18.5 1
0.820
8.5

Consulting Engineers Group Ltd., Jaipur________________________________________________________________________________________
Bridge Design Report________________________________________________________________________________________
3 Pier shaftDimension of pier shaft in longitudinal direction =Dimension of pier shaft in Transverse direction R = Area = m2
C =Height of pier shaft =Height above Ground level = m Volume =Height below Ground level = m Volume =
= m3
Height above H.F.L = m Volume =Height below H.F.L = m Volume =
= m3
4 Pedestal at footing top Width =Length = Volume = m3
Height =5 Footing
at foundation levelWidth = mLength = mThickness at Root = mThickness at TipGross Pressure Diagram = m
Volume = m3
15.4133
1.680.82
6.57467
1.91
8.83864
0
0.41
0
4.638
5.50
3.450
8.09
0.0008.09
0.825.50
23.2238
015.413315.4133
0.3
5.800
1.05

Consulting Engineers Group Ltd., Jaipur________________________________________________________________________________________
Bridge Design Report________________________________________________________________________________________
Net Pressure diagramVolume of Overburdden earth below ground level
Total volume x x = m3
Net volume below Ground level = m3
Sectional Properties of Footing
A = x = m2
ZL = x = m3
ZT = x = m3
Forces and Moments due to Watercurrent Force
Intensity of water current pressure = k V2 kg/m2
Assuming 20 degree variation in water current direction
H.F.L
Top of footing
Foundation level
Deepest scour
Water current Pressure in Transverse direction
R.L k Pressure = k V2 COS 20
H.F.LPier Shaft bottomTop of footingBottom of footingWater current Force in Transverse direction
Component Length Height Force HT of force Momentm m t
Pier t-mTop of footing t-m
143.55
8.720
113.752
5.500 31.900
205.850 0.66 13.2477521
5.800
5.800
5.500
5.500 5.60667
5.800
6.975935.800 1.0500.82
0.06418
4.500
52
214.172 0.66
5.04167
290.252257
52
9.00
0
0.0001
0.41078
8.322 1.03555 6.736460.699910.0917
30.837
29.242
205.850 1.5 30.1085275204.800 1.5 0.0073296

Consulting Engineers Group Ltd., Jaipur________________________________________________________________________________________
Bridge Design Report________________________________________________________________________________________
Water Current Pressure in Longtudinal direction
R.L k Pressure = k V2 SIN 20
H.F.LPier Shaft bottomTop of footingBottom of footingWater current Force in Longtudinal direction
Component Length Height Force HT of force Momentm m t
Pier t-mTop of footing t-m
Summary at PierShaft bottom level F MTransverse direction t-mLongitudinal direction t-m
0.02215
52
17.5930526
214.172 1.5 240.098141205.850 1.5 10.9586078205.850 1.5 10.9586078
1.03555 6.975925822.61162
204.800 1.5 0.00266776
17.59315.500 1.050 0.03165 0.699912.50 8.322 2.61162 6.73646

Consulting Engineers Group Ltd., Jaipur Bridge Design Report __________________________________________________________________________________________________ PIER SHAFT .case 1 L.W.L (MAX REACTION CASE) Depth of Section = .820 m Width of Section = 2.500 m along width-compression face- no of bar: 18 tension face- no of bar: 18 Dia (mm) 20 20 Cover (cm) 5.00 5.0 along depth-compression face- no of bar: 6 tension face- no of bar: 6 Dia (mm) 16 16 Cover (cm) 5.00 5.0 Modular Ratio : Compression = 10.0 Modular Ratio : Tension = 10.0 Allowable Concrete Stress = 85.00 Kg/cm^2 Allowable Steel Stress = 2000.00 Kg/cm^2 Axial Load = 283.700 T Mxx = 64.914 Tm Myy = 76.618 Tm Intercept of Neutral axis : X axis : = 5.253 m : y axis : = .757 m Concrete Stress Governs Design Stress in Concrete due to Loads = 47.85 Kg/cm^2 Stress in Steel due to Loads = 231.46 Kg/cm^2 Percentage of Steel = .67 % PIER SHAFT .case 2 H.F.L (MAX REACTION CASE) Depth of Section = .820 m Width of Section = 2.500 m Modular Ratio : Compression = 10.0 Modular Ratio : Tension = 10.0 Allowable Concrete Stress = 85.00 Kg/cm^2 Allowable Steel Stress = 2000.00 Kg/cm^2 Axial Load = 268.286 T Mxx = 82.507 Tm Myy = 83.594 Tm Intercept of Neutral axis : X axis : = 4.959 m : y axis : = .594 m Concrete Stress Governs Design Stress in Concrete due to Loads = 61.64 Kg/cm^2 Stress in Steel due to Loads = 486.49 Kg/cm^2 Percentage of Steel = .67 %

Consulting Engineers Group Ltd., Jaipur Bridge Design Report __________________________________________________________________________________________________ PIER SHAFT .case 3 L.W.L (SPAN DISLODGED) Depth of Section = .820 m Width of Section = 2.500 m Modular Ratio : Compression = 10.0 Modular Ratio : Tension = 10.0 Allowable Concrete Stress = 85.00 Kg/cm^2 Allowable Steel Stress = 2000.00 Kg/cm^2 Axial Load = 217.650 T Mxx = 26.791 Tm Myy = .010 Tm Intercept of Neutral axis : X axis : = ******* m : y axis : = .891 m Concrete Stress Governs Design Stress in Concrete due to Loads = 18.55 Kg/cm^2 Stress in Steel due to Loads = -25.21 Kg/cm^2 Percentage of Steel = .67 % PIER SHAFT .case 4 H.F.L(SPAN DISLODGED) Depth of Section = .820 m Width of Section = 2.500 m Modular Ratio : Compression = 10.0 Modular Ratio : Tension = 10.0 Allowable Concrete Stress = 85.00 Kg/cm^2 Allowable Steel Stress = 2000.00 Kg/cm^2 Axial Load = 202.236 T Mxx = 44.384 Tm Myy = 6.976 Tm Intercept of Neutral axis : X axis : = 33.465 m : y axis : = .655 m Concrete Stress Governs Design Stress in Concrete due to Loads = 25.31 Kg/cm^2 Stress in Steel due to Loads = 63.11 Kg/cm^2 Percentage of Steel = .67 %

Consulting Engineers Group Ltd., Jaipur___________________________________________________________________
Bridge Design Report_______________________________________________________________________________
For Outer bearing a =D =
Available effective depthusing mm dia of bars d = - -
= m
a = = > 1d
= Pier cap designed as Cantilever
A1A2 A3 A4
B1 B2 B3 B4
3.38 1.13
0.700
1.2
1.00
1.2
2.5003
0.3
25 1.5 0.05
8.5
0.875 0.875
2.125
2.25 2.25 2.25
2.1251.425
1.4912
1.5
0.025
1.1252.25
0.3
0.4
8.5
1.425

Consulting Engineers Group Ltd., Jaipur___________________________________________________________________
Bridge Design Report_______________________________________________________________________________
Loads on bearingBearings A1 & B1 are effective.
A1 B1DLSIDLLL70RW due to Transverse moment A1 = x =
B1 = x =A1 = x = t
B1 = x = t
Summary of loads from superstructure:Loads on Outer bearings
Left span Right spanB1 A1
DLSIDLLL
Selfweight of piercap upto section through outerbearing:
= + x x x= t
Distance of c.g from section = m
Calculation of Cantilevermoment at bearing sectionMoment at the face due to load from outerbearing
= x= t-m
Due to selfweight of pier cap = x = t-mTotal moment at the face of support = t-m
Torsion at outerbearing section:= -=
Eccentricity =Moment = t-m
1.5
149.817.56
2.125142.25225
0.88
34.858
3.0002.125
6.48 1.1667
66.942
2.00
0.65
3.000.3 1.50
0.3
30.05 1.16 34.858
0.4
36 1.16 41.76
1
3.38 4.6477
0.9631
34.6752.4078
16.745 16.7453.3625 3.3625
7.5125 9
2.46.48
1.1667
32.267
25.3141.76 3.38 5.568
25.31
16.745 16.7453.3625 3.36255.568 4.6477
9 7.512534.675 32.267

Consulting Engineers Group Ltd., Jaipur___________________________________________________________________
Bridge Design Report_______________________________________________________________________________
Longitudinal Reinforcement:M = = t-m
For, M - & Fe -N/mm2
N/mm2
Effective depth required = xx
= < O.K
Ast required =x x
= mm2
Provide nos mm dia bars in layers mm2
This reinforcement will provided in full length of pier cap.Check for Shear:At bearing section
Available Effective depth at root = mmDownward Load from Superstructure = +
= tDownward Load due to self wt of pier cap = tTotal downward Load = t
After shear correction, S.F = V + M tanβd
= + x
= tEquivalent shear IRC:21-2000,cl:304.2.3.1
b = + = m2
V = t
Shear stress = x = N/mm2
xArea of tension reinforcement = %
τc = N/mm2
Provide minimum shear
1000 14250.2201
0.4823
31.37
31.37 10000
31.369673
1 1 1
73.422 149.81 0.41.425
0.2966
66.9426.48
73.422
7 25 6872.22
32.267
5827.9363
142534.675
K = 0.294
j = 0.902
1164.2 1425
R = 1.105
25 415�cbc =
m =
1425
149.81
149.81
10^7
200
10
1.105
8.33
149.81
�st =
1000
200 0.902149.81
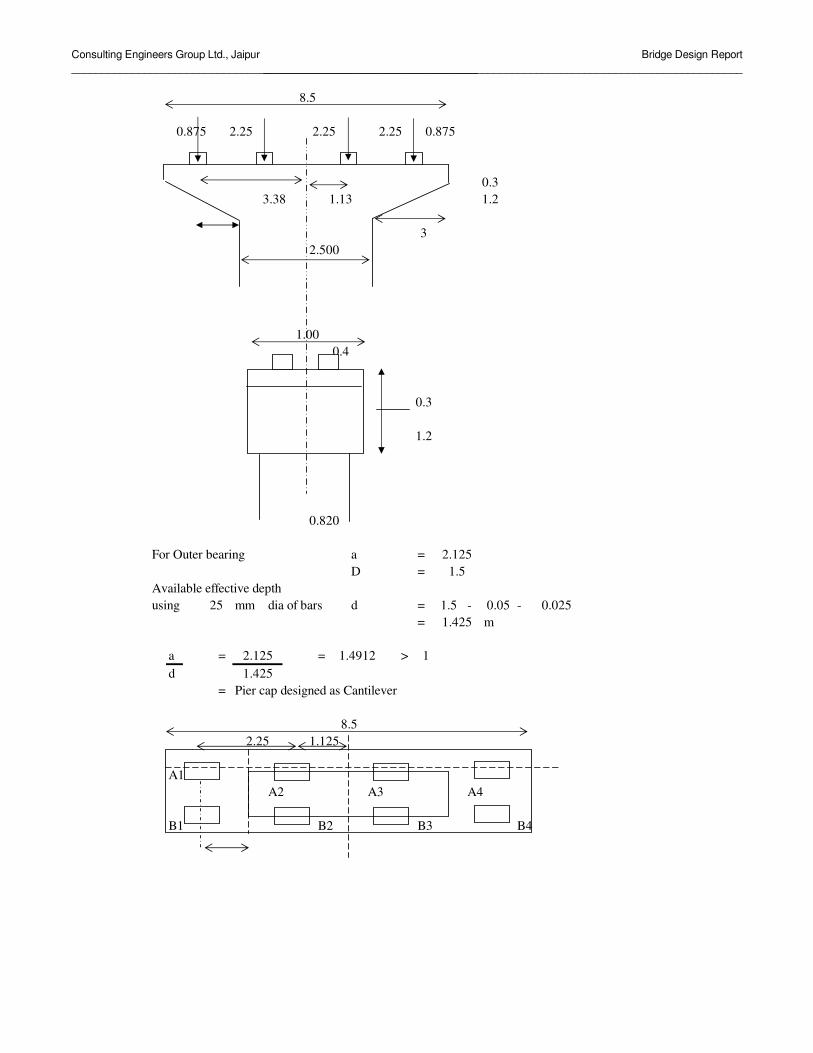
Consulting Engineers Group Ltd., Jaipur___________________________________________________________________
Bridge Design Report_______________________________________________________________________________
For Outer bearing a =D =
Available effective depthusing mm dia of bars d = - -
= m
a = = > 1d
= Pier cap designed as Cantilever
A1A2 A3 A4
B1 B2 B3 B4
0.3
0.4
8.5
1.425
2.25 1.125
0.025
2.1251.425
1.4912
1.5
25 1.5 0.05
8.5
0.875 0.875
2.125
2.25 2.25 2.25
3.38 1.13
0.820
1.2
1.00
1.2
2.5003
0.3

Consulting Engineers Group Ltd., Jaipur___________________________________________________________________
Bridge Design Report_______________________________________________________________________________
Loads on bearingBearings A1 & B1 are effective.
A1 B1DLSIDLLL70RW due to Transverse moment A1 = x =
B1 = x =A1 = x = t
B1 = x = t
Summary of loads from superstructure:Loads on Outer bearings
Left span Right spanB1 A1
DLSIDLLL
Selfweight of piercap upto section through outerbearing:
= + x x x= t
Distance of c.g from section = mCalculation of Cantilevermoment at bearing sectionMoment at the face due to load from outerbearing
= x= t-m
Due to selfweight of pier cap = x = t-mTotal moment at the face of support = t-m
Torsion at outerbearing section:= -=
Eccentricity =Moment = t-m
39.418 20.10711.93 0
7.3807 03.3625 3.3625
25.31
16.745 16.745
025.31
55.355 3.38 7.3807
2.46.48
1.1667
16.745 16.7453.3625 3.3625
0 11.930 1.16 0
0.4
47.72 1.16 55.355
1
6.48
3.38
39.418 20.10719.311
7.7243
2.00
0.65
3.000.3 1.50
0.30.88
0
1.1667134.05
7.56126.48997
1.5
3.0002.125
2.12559.525
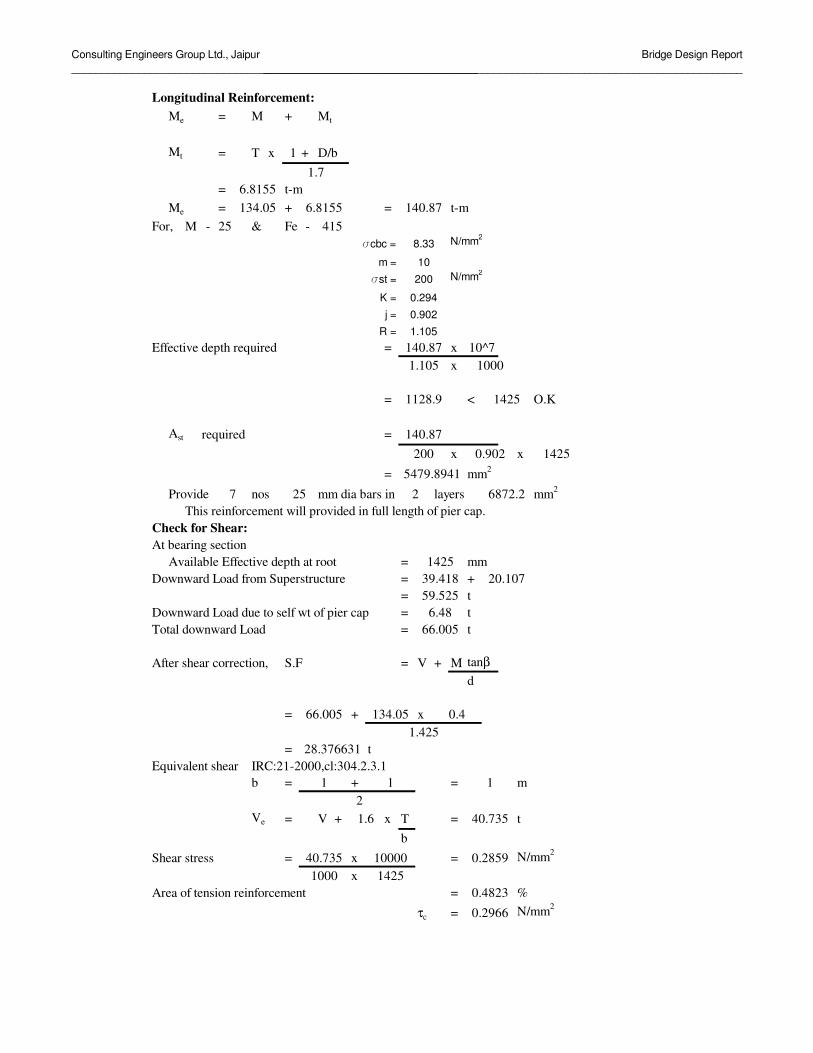
Consulting Engineers Group Ltd., Jaipur___________________________________________________________________
Bridge Design Report_______________________________________________________________________________
Longitudinal Reinforcement:Me = M + Mt
Mt = T x 1 + D/b
= t-mMe = + = t-m
For, M - & Fe -N/mm2
N/mm2
Effective depth required = xx
= < O.K
Ast required =x x
= mm2
Provide nos mm dia bars in layers mm2
This reinforcement will provided in full length of pier cap.Check for Shear:At bearing section
Available Effective depth at root = mmDownward Load from Superstructure = +
= tDownward Load due to self wt of pier cap = tTotal downward Load = t
After shear correction, S.F = V + M tanβd
= + x
= tEquivalent shear IRC:21-2000,cl:304.2.3.1
b = + = m2
Ve = V + x T = tb
Shear stress = x = N/mm2
xArea of tension reinforcement = %
τc = N/mm2
20.107
5479.8941
142539.418
1000
6.81551.7
140.87
140.87
10^7
140.87
1.105
6872.22
1128.9 1425
200 0.902 1425
�st = 200
415�cbc = 8.33
10
134.05 6.815525
m =
R = 1.105
K = 0.294
j = 0.902
59.5256.48
66.005
7 25
66.005 134.05 0.41.425
28.376631
1 1 1
1.6 40.735
40.735 100001000 1425
0.2859
0.4823
0.2966

Consulting Engineers Group Ltd., Jaipur Bridge Design Report ______________________________________________________________________________
INPUT FILE: 9.2 M SPAN CLASSA 70R.STD 1. STAAD FLOOR 2. START JOB INFORMATION 3. ENGINEER DATE 09-JUN-06 4. END JOB INFORMATION 5. INPUT WIDTH 79 6. PAGE LENGTH 1000 7. UNIT METER MTON 8. JOINT COORDINATES 9. 1 0.0 0.0 0.0;2 0.02 0.0 0.0;30.4 0.0 0.0 10 8.4 0.0 0.0; 11 8.8 0.0 0.0 10. 12 9.18 0.0 0.0;13 9.22 0.0 0.0;14 9.6 0.0 0.0 22 18 0.0 0.0; 23 18.38 0.0 0.0 11. 24 18.4 0.0 0.0 12. MEMBER INCIDENCES 13. 1 1 2 23 1 1 14. CONSTANTS 15. E 2.7386E+006 16. POISSON 0.15 17. DENSITY 2.4 ALL 18. MEMBER PROPERTY INDIAN 19. 1 TO 23 PRIS YD 1 ZD 1 20. SUPPORTS 21. 3 22 FIXED BUT FX MZ 22. 11 14 PINNED 23. MEMBER RELEASE 24. 1 START FX FY MZ 25. 12 START FX FY MZ 26. 23 END FX FY MZ 27. DEFINE MOVING LOAD 28. TYPE 1 LOAD 8 12 12 17 17 17 17 29. DIST 3.96 1.52 2.13 1.37 3.05 1.37 30. ** CLASS 70 RW 31. LOAD GENERATION 82 32. TYPE 1 -13.4 0 0 XINC 0.5 33. PERFORM ANALYSIS 34. **MAX REA 35. LOAD LIST 29 36. PRINT SUPPORT REACTION SUPPORT REACTION � ----------------- JOINT LOAD FORCE-X FORCE-Y FORCE-Z MOM-X MOM-Y MOM Z 3 29 0.00 18.95 0.00 0.00 0.00 0.00 22 29 0.00 15.00 0.00 0.00 0.00 0.00 11 29 0.00 30.05 0.00 0.00 0.00 0.00 14 29 0.00 36.00 0.00 0.00 0.00 0.00 37. ** MAX MOMENT 38. LOAD LIST 19 39. PRINT SUPPORT REACTION 3 19 0.00 32.85 0.00 0.00 0.00 0.00 22 19 0.00 0.00 0.00 0.00 0.00 0.00 11 19 0.00 47.15 0.00 0.00 0.00 0.00 14 19 0.00 0.00 0.00 0.00 0.00 0.00 40. FINISH

CEG.Ltd., Jaipur Bridge Design Report
Consultancy Services for Feasibility Study and Detailed Project Preparation for Proposed Orissa State Road Project
DESIGN OF SUPERSTRUCTURE

Consulting Engineers Group Ltd., Jaipur____________________________________________________________________
Bridge Design Report________________________________________________________________
DESIGN OF SOLID SLAB SUPERSTRUCTUE
DESIGN DATA
Span (c/c of exp. joint) = 9.20 mEff. Span ( c/c brgs.) = 8.800 mOverall Width of deck slab = 8.50 mWidth of carriageway = 7.50 mWidth of crash barrier = 0.50 mThickness of deck slab = 0.66 mTkickness of wearing coat = 0.056 mUnit wt of concrete = 2.40 t/m3
Grade of Concrete - M 25 25Grade of Reinforcement - Fe 415 (HYSD)
Live Load - One Lane of 70R Wheeled/ Tracked& One Lane of Class A
Permissible Compressive stress in Concrete - 850 t/m2
Permissible Tensile stress in Steel - 20400 t/m2
Modular ratio, m - 10Lever arm factor, j - 0.902Moment of resistance coefficient, Q - 112.75 t/m2
CALCULATION OF BENDING MOMENTS AT MID SPAN:
0.50 7.50 0.500.05 0.05
0.66
8.50
CROSS SECTIONDUE TO DEAD LOAD (Per metre width):
Deck slab = 0.660 x 2.40 = 1.584 t/m
BM at mid span = 1.584 x 8.80 2/ 8 = 15.333 tm/m
DUE TO SUPERIMPOSED DEAD LOAD (Per metre width):
Wearing coat ( @ 0.2t/m^2) = = 0.200 t/m
Crash barrier (@ 0.9 t/m on each side) = 2 x 0.90 / 8.50 = 0.212 t/m
Total = 0.412 t/m
BM at mid span = 0.412 x 8.80 2/ 8 = 3.986 tm/m
Tatal BM ( Due to DL & SIDL) = 15.333 + 3.986 = 19.32 tm/m
DUE TO LIVE LOAD:
The Superstructure has been analysed for Live load-Class 70R wheeled, class 70R tracked and Class A loading. Load positions for maximum bending moments are evaluated at (i) mid span (L/2) and (ii) at the section 1.5m from support.

Consulting Engineers Group Ltd., Jaipur____________________________________________________________________
Bridge Design Report________________________________________________________________
CALCULATION OF BENDING MOMENT AT MID SPAN (L/2) :
Due to Class 70R Wheeled Impact factor = 1.25
17 17 12 121.37 2.13 1.52
2.99 4.440.2 8.80 0.200
Due to Class 70R Tracked Impact factor = 1.108
70
1.515 5.77 1.5150.20 8.80 0.20
Since bending moment due to Class A is having lesser value as compared to Class 70R loadings. Hence the superstructure is checked for Class 70R wheeled and Class 70R tracked loading.
BA
BA
t t t t
t

Consulting Engineers Group Ltd., Jaipur____________________________________________________________________
Bridge Design Report________________________________________________________________
EFFECTIVE WIDTH OF SLAB
Effective width = beff = α.a.(1-a/ l0) + b1
Where L0 = the effective span a = the distance of centre of gravity of the concentrated load from the nearer supportα = A constant depending upon the ratio b/l0, where b is the width of the slab
b/l0 = 0.966 Hence as per cl. 305.16.2 of IRC:21, α = 2.439
b1 =
0.81 + 2x 0.065 = 0.922 m ( for all axles of class 70R )0.84 + 2x 0.065 = 0.952 m ( for class 70R Tracked )
CALCULATION OF EFFECTIVE WIDTH AND LOAD INTENSITY
LIVE LOAD a (m) b1 (m) α beff (m) beff/2 (m) Max. available width (m)
Load intensity (t/m)
17 2.990 0.922 2.439 5.737 2.869 6.929 2.45417 4.360 0.922 2.439 6.288 3.144 7.204 2.36012 2.310 0.922 2.439 5.077 2.539 6.599 1.81912 0.790 0.922 2.439 2.676 1.338 4.606 2.605
70 4.400 0.952 2.439 6.318 3.159 7.339 9.538
According to IRC: 21-2000 cl. 305.16.2 (iii) if the effective width of slab for a load overlaps with effective width of slab for an adjecent load, the resultant effective width for two loads equals to sum of respective effective width for each load minus the width of overlap.
Firstly effective width as per IRC:21 is evaluated then actual available width is compared with that value and corresponding load intensity per metre width is evaluated for each axle.
Class 70R Tracked
Class 70R Wheeled
the breadth of concentrated load over the deck slab after 450 dispersion through wearing coat
FOR MAXIMUM BM AT MID SPAN

Consulting Engineers Group Ltd., Jaipur____________________________________________________________________
Bridge Design Report________________________________________________________________
TRANSVERSE POSITION OF LIVE LOAD (CLASS 70 R WHEELED LOAD)
a
0.263
d1
L0
TRANSVERSE POSITION OF LIVE LOAD (CLASS 70 R TRACKED LOAD)
a
4.57
L0
8.50
2.12
0.84
Effe
ctiv
e w
idth
ava
ilabl
eE
ffect
ive
wid
th a
vaila
ble
0.81
0.81
1.93
2.13
Bef
f /22.
06
8.50
0.84
Bef
f/2
W1
W1
W2
W2
W1
W1
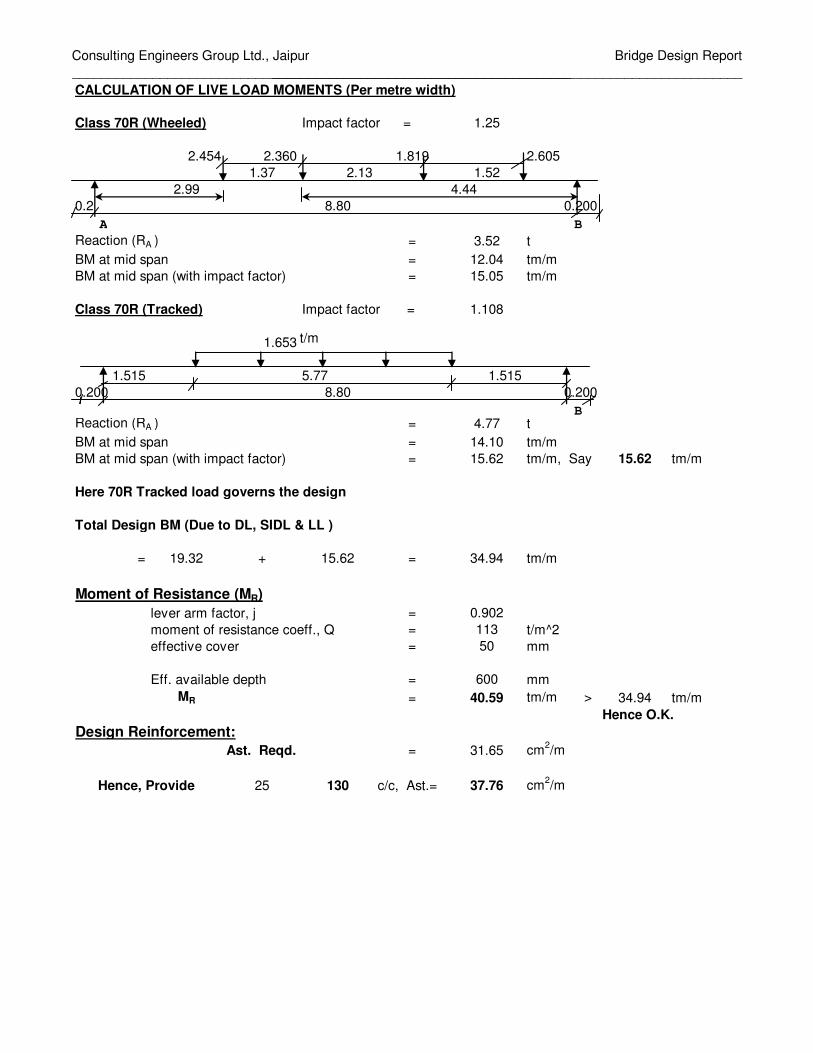
Consulting Engineers Group Ltd., Jaipur____________________________________________________________________
Bridge Design Report________________________________________________________________
CALCULATION OF LIVE LOAD MOMENTS (Per metre width)
Class 70R (Wheeled) Impact factor = 1.25
2.454 2.360 1.819 2.6051.37 2.13 1.52
2.99 4.440.2 8.80 0.200
Reaction (RA ) = 3.52 tBM at mid span = 12.04 tm/mBM at mid span (with impact factor) = 15.05 tm/m
Class 70R (Tracked) Impact factor = 1.108
1.653
1.515 5.77 1.5150.200 8.80 0.200
Reaction (RA ) = 4.77 tBM at mid span = 14.10 tm/mBM at mid span (with impact factor) = 15.62 tm/m, Say 15.62 tm/m
Here 70R Tracked load governs the design
Total Design BM (Due to DL, SIDL & LL )
= 19.32 + 15.62 = 34.94 tm/m
Moment of Resistance (MR)lever arm factor, j = 0.902moment of resistance coeff., Q = 113 t/m^2effective cover = 50 mm
Eff. available depth = 600 mmMR = 40.59 tm/m > 34.94 tm/m
Hence O.K.Design Reinforcement:
Ast. Reqd. = 31.65 cm2/m
Hence, Provide 25 130 c/c, Ast.= 37.76 cm2/m
BA
B
t/m

Consulting Engineers Group Ltd., Jaipur____________________________________________________________________
Bridge Design Report________________________________________________________________
CALCULATION OF BM AT Dist.X = 1.50 m FROM THE SUPPORT
BM AT DISTANCE X, (BM)X = w. L.x/2.( 1-x/L )
DUE TO DL, (BM)X = 1.584 x 5.475 = 8.67 tm/m
DUE TO SIDL, (BM)X = 0.412 x 5.475 = 2.25 tm/m
TOTAL BM = 8.67 + 2.25 = 10.93 tm/m
DUE TO LIVE LOADClass 70R (Wheeled) Impact factor = 1.25
17 17 12 121.37 2.13 1.52
1.500.2 8.80 0.20
Class 70R (Tracked) Impact factor = 1.108
0.779 70
0.721 4.570.20 1.50 8.80 0.20
Class A Impact factor = 1.304
11.4 11.4 2.7 2.71.2 3.20 1.1
1.500.20 8.80 0.20
Since bending moment due to Class A is having lesser value as compared to Class 70R loadings. Hence the superstructure is checked for Class 70R wheeled and Class 70R tracked loading.
BA
BA
BA
t t t t
t
t t t t

Consulting Engineers Group Ltd., Jaipur____________________________________________________________________
Bridge Design Report________________________________________________________________
CALCULATION OF EFFECTIVE WIDTH AND LOAD INTENSITY
LIVE LOAD a (m) b1 (m) α beff (m) beff /2 (m) Max. available width (m)
Load intensity (t/m)
17 1.500 0.922 2.626 4.190 2.095 6.120 2.77817 2.870 0.922 2.626 6.001 3.001 7.061 2.40812 3.800 0.922 2.626 6.593 3.296 7.356 1.63112 2.280 0.922 2.626 5.359 2.679 6.739 1.781
70 3.006 0.952 2.626 6.150 3.075 7.255 9.648
CALCULATION OF LIVE LOAD MOMENTS (Per metre width)
Class 70R (Wheeled) Impact factor = 1.25
2.778 2.408 1.631 1.7811.37 2.13 1.52
1.500.2 8.80 0.20
Reaction (RA ) = 5.09 tBM at the section = 7.64 tm/mBM at the section (with impact factor) = 9.55 tm/m
Class 70R (Tracked) Impact factor = 1.108
0.779 2.111
0.721 4.570.20 1.50 8.800 0.20
Reaction (RA ) = 6.35 tBM at the section = 8.89 tmBM at the section (with impact factor) = 9.84 tm/m, Say 10.00 tm/m
Here 70R Tracked load governs the design
Total Design BM (Due to DL, SIDL & LL)
= 10.93 + 10.00 = 20.93 tm/m
Design Reinforcement:Ast. Reqd. = 18.64 cm2/m
Hence, Provide φ φ φ φ 20 @ 130 c/c, Ast.= 24.15 cm2/m
Class 70R Tracked
Class 70R Wheeled
BA
B
t/m

CEG.Ltd., Jaipur Bridge Design Report
Consultancy Services for Feasibility Study and Detailed Project Preparation for Proposed Orissa State Road Project
BRIDGE AT CH:54+600

CEG.Ltd., Jaipur Bridge Design Report
Consultancy Services for Feasibility Study and Detailed Project Preparation for Proposed Orissa State Road Project
DESIGN OF SUBSTRUCTURE (ABUTMENT)

Consulting Engineers Group Ltd., Jaipur__________________________________________________________
Bridge Design Report__________________________________________________________________________________________
DESIGN DATA
Formation Level = 241.909 mGround Level = 236.941 mLowest Water Level = 232.000 mHighest Flood Level = 240.009 mFounding Level = 232.000 mThickness of bearing & pedestal = 0.000 mWidth of abutment = 12.000 mBouyancy factor = 1.0Safe Bearing Capacity = 37.600 t/sqmDry density of earth = 1.800 t/cumSubmerged density of earth = 1.0 t/cumSaturated density of earth = 2.000 t/cumCoefficient of base friction = 0.55Span (c/c of exp. joint) = 10.800 mOverall Width of deck slab = 12.000 mWidth of carriageway = 11.000 mWidth of crash barrier = 0.500 mDepth of Superstructure at mid = 0.925 mDepth of Superstructure at end = 0.775 mTkickness of wearing coat = 0.056 mUnit wt of concrete = 2.400 t/m3
Grade of Concrete - M 25 25Grade of Reinforcement - Fe 415 (HYSD)Live Load -
-Permissible Compressive stress in Concrete - 850 t/m2
Permissible Tensile stress in Steel - 20400 t/m2
Modular ratio, m - 10factor, k - 0.294Lever arm factor, j - 0.902Moment of Resistance - 113 t/m2
Thickness of returnwall 0.5 m
COEFFICIENT OF ACTIVE EARTH PRESSURE
AS PER COULOMB'S THEORY, COEFFICIENT OF ACTIVE EARTH PRESSURE ISKa = SIN2 (α+φ)
SIN2�� SIN(���� 2
1 +
WHEREφ = ANGLE OF INTERNAL FRICTION OF EARTHα = ANGLE OF INCLINATION OF BACK OF WALLδ = ANGLE OF INTERNAL FRICTION BETWEEN WALL & EARTHι = ANGLE OF INCLINATION OF BACKFILL
HERE φ = 30 o = 0.524 Radianα = 90 o = 1.571 Radianδ = 20 o = 0.349 Radianι = 0 o = 0 Radian
Ka = 0.2973Therefore, Horizontal coefficient of Active earth pressure = KaCOSφ = φ = φ = φ = Kha = 0.2794
One Lane of 70R Wheeled + Class A3 lanes of Class A
SIN(� + �).SIN(� - �)SIN(� - �).SIN(� + �)

Consulting Engineers Group Ltd., Jaipur__________________________________________________________
Bridge Design Report__________________________________________________________________________________________
HEIGHT OF ABUTMENT
Total height of abutment = Formation Level - Founding Level = 9.909 mFor DESIGN purpose, the height of abutment is considered as, say, = 9.910 m
CALCULATION OF ACTIVE EARTH PRESSURE
2water level 1
9.909
4 3
Active Earth Pressure Surcharge DRY. condition
a) Service Condition
1 LL Surcharge 1.0 1.200 0.67 79.73 4.955 395.022 0.5 9.909 4.98 296.27 4.162 1233.003 1.0 0.000 4.98 0.00 0.000 0.004 SubmgEarth 0.5 0.000 0.00 0.00 0.000 0.00
376.00 1628.02
b) Span Dislodge Condition
Net force = 376.00 - 79.73 = 296.27 tNet moment = 1628.02 - 395.02 = 1233.00 tm
H.F.L. condition
a) Service Condition
1 LL Surcharge 1.0 1.200 0.67 79.73 4.955 395.022 0.5 1.900 1.06 12.10 8.807 106.593 1.0 8.009 1.06 102.03 4.004 408.594 SubmgEarth 0.5 8.009 2.24 107.52 2.670 287.06
301.39 1197.26
b) Span Dislodge Condition
Net force = 301.39 - 79.73 = 221.66 tNet moment= 1197.26 - 395.02 = 802.24 tm
Area factor
TOTAL
TOTAL
Element no.
Area factorComponent
Dry Earth
Element No.
Component
Dry Earth
Pressure (t/m2)
Height (m)
Height (m)Pressure
(t/m2)Force (t)
C.G. from
base (m)Force (t)
Moment (tm)
Moment (tm)
C.G. from
base (m)

Consulting Engineers Group Ltd., Jaipur__________________________________________________________
Bridge Design Report__________________________________________________________________________________________
Forces & moments due to Abutment (Concrete) components
DRY Case :
Length Width Height Density Weight(m) (m) (m) (t/m3) (t)
1 1.0 2.000 12.00 0.500 2.40 28.80 1.000 28.802 0.5 2.000 12.00 0.700 2.40 20.16 1.333 26.883 1.0 3.500 12.00 0.500 2.40 50.40 4.450 224.284 0.5 3.500 12.00 0.700 2.40 35.28 3.867 136.425 1.0 0.700 12.00 8.628 2.40 173.94 2.850 495.736 0.5 0.500 12.00 8.628 2.40 62.12 2.333 144.957 stem rect 1.0 1.200 12.00 1.200 2.40 41.47 2.600 107.8310 Cap 1.0 0.700 12.00 0.300 2.40 6.05 2.850 17.2411 Dirt Wall 1.0 0.300 12.00 0.631 2.40 5.45 3.050 16.638 0.5 3.500 1.00 0.700 2.40 2.94 5.533 16.278a 1.0 3.500 1.00 9.409 2.40 79.04 4.950 391.23
505.65 1606.24
H.F.L. Case :
Length Width Height Density Weight Moment(m) (m) (m) (t/m3) (t) ,@ Toe
1 1.0 2.000 12.00 0.500 1.40 16.80 1.000 16.802 0.5 2.000 12.00 0.700 1.40 11.76 1.333 15.683 1.0 3.500 12.00 0.500 1.40 29.40 4.450 130.834 0.5 3.500 12.00 0.700 1.40 20.58 3.867 79.585 1.0 0.700 12.00 6.809 1.40 80.07 2.850 228.216 0.5 0.500 12.00 6.809 1.40 28.60 2.333 66.735 1.0 0.700 12.00 0.619 2.40 12.48 2.850 35.576 0.5 0.500 12.00 0.619 2.40 4.46 2.333 10.407 stem rect 1.0 1.200 12.00 1.200 1.40 24.19 2.600 62.9010 Cap 1.0 0.700 12.00 0.30 2.40 6.05 2.850 17.2411 Dirt Wall 1.0 0.300 12.00 0.63 2.40 5.45 3.050 16.638 0.5 3.500 1.00 0.70 1.40 1.72 5.533 9.498c 1.0 3.500 1.00 6.81 1.40 33.36 4.950 165.158d 1.0 3.500 1.00 1.90 2.40 15.96 4.950 79.00
290.88 934.20
TOTAL
Toe Slab
Stem Wall
Heel Slab
Area Factor
Component
Area Factor
TOTAL
Element No.
Element No.
Heel Slab
Toe Slab
Stem Wall
Component
Moment about toe
C.G.from toe (m)
Retutnwall
Returnwall
C.G.from toe (m)
Stem Wall

Consulting Engineers Group Ltd., Jaipur__________________________________________________________
Bridge Design Report__________________________________________________________________________________________
Forces & moments due to Earth and LL surcharge
DRY Case : Self weight of Earth
Length Width Height Density Weight Moment(m) (m) (m) (t/m3) (t) `@ Toe
8 0.5 3.500 11.00 0.700 1.8 24.26 5.533 134.21
8a 1.0 3.500 11.00 8.709 1.800 603.53 4.950 2987.49627.79 3121.70
H.F.L Case :
Length Width Height Density Weight Moment(m) (m) (m) (t/m3) (t) `@Toe
8 0.5 3.500 11.000 0.7 1.000 13.48 5.533 74.568c 1.0 3.500 11.000 6.809 1.000 262.15 4.95 1297.638d DRY 1.0 3.500 11.000 1.9 1.800 131.67 4.950 651.77
407.29 2023.95
L.L.SURCHARGE
Length Width Height Density Weight Moment`@ Toe
12 DRY EARTH 0.00 3.500 11.00 1.20 1.80 0.00 4.950 0.00
SUMMARY OF FORCES AND MOMENTS:
232.07 0.00 232.07 0.001133.44 1133.44 698.17 698.171365.51 1133.44 930.24 698.17383.51 296.27 308.91 221.66661.40 0.00 661.40 0.004727.95 4727.95 2958.15 2958.155389.35 4727.95 3619.55 2958.153.947 4.17 3.89 4.240.597 0.821 0.541 0.887814.89 930.93 503.25 619.28
69.73 0.00 69.73 0.001628.02 1233.00 1197.26 802.241697.75 1233.00 1266.99 802.24882.86 302.07 763.75 182.96
3.17 3.83 2.86 3.69 Safe against overturning
1.958 2.104 1.656 1.732 Safe against sliding
I.R.C 78-2000:cl706.3.4
Horz. braking forceEarth Pressure
Component
Span dislodged
Relieving Moment @ c/l base (M1)
ElementNo
Area Factor
Service Cond.
Total Vertical Load V = (a) + (b)Total Horizontal Force H =Moment @ toe due to (a)
Case. L.W.L.LOAD CASE
ElementNo
Area Factor
Component
TOTAL
ElementNo
Component
Area Factor
Case. H.F.L.
C.G.from toe (m)
C.G.from toe
C.G.from toe (m)
Service Cond.
Span dislodged
Vertical load from superstructure including LL surcharge (a)Vertical load from substructure (b)
Against sliding ( µ x V / H )
Total overturning Moment ( M2)
Factor of Safety
Moment @ toe due to (b)Total Moment @ toe (M)Dist. of C.G. of V from toe Z = M/V
Net moment ( M2-M1) = ML
eccentricity (e = Z -b/2)
overturning moment due to
Against overturning ( M / M2 )
SATURATED SOIL
TOTAL
DRY EARTH
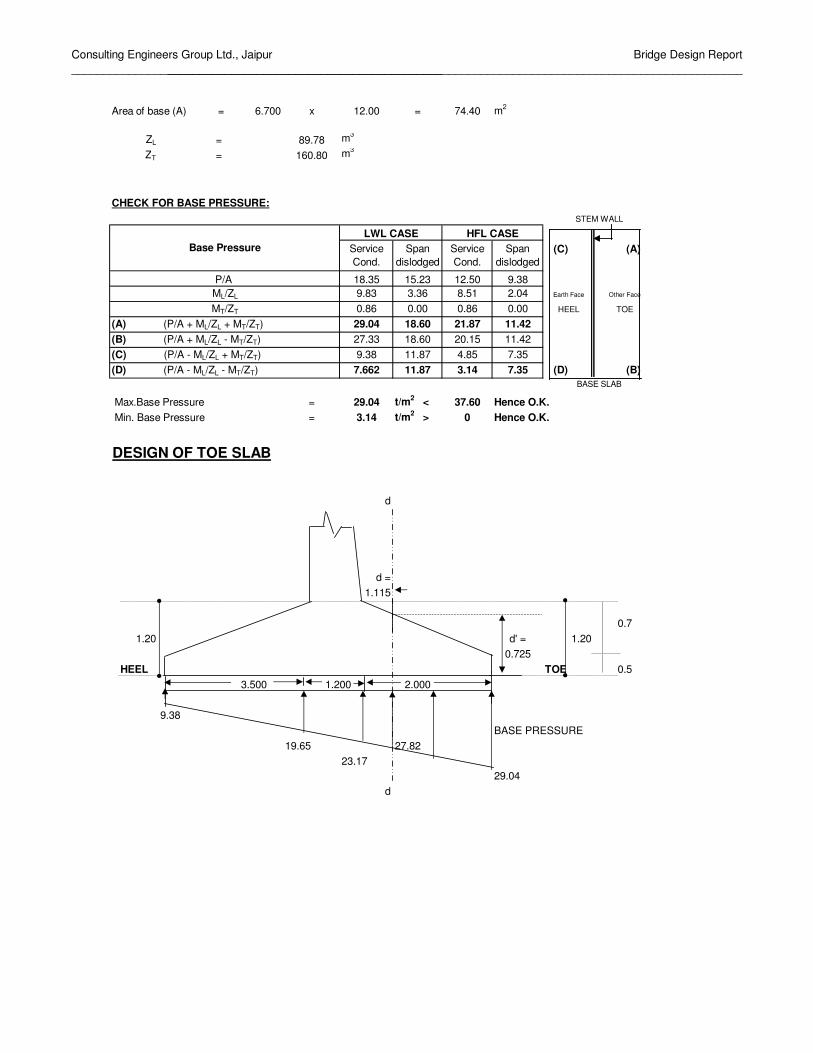
Consulting Engineers Group Ltd., Jaipur__________________________________________________________
Bridge Design Report__________________________________________________________________________________________
6.700 x 12.00 = 74.40 m2
ZL = 89.78 m3
ZT = 160.80 m3
CHECK FOR BASE PRESSURE:
(C) (A)
18.35 15.23 12.50 9.389.83 3.36 8.51 2.04 Earth Face Other Face
0.86 0.00 0.86 0.00 HEEL TOE
29.04 18.60 21.87 11.4227.33 18.60 20.15 11.429.38 11.87 4.85 7.357.662 11.87 3.14 7.35 (D) (B)
Max.Base Pressure = 29.04 t/m2 < 37.60 Hence O.K. Min. Base Pressure = 3.14 t/m2 > 0 Hence O.K.
DESIGN OF TOE SLAB
d
d =1.115
0.71.20 d' = 1.20
0.725HEEL TOE 0.5
3.500 2.000
9.38BASE PRESSURE
19.65 27.8223.17
29.04d
Base PressureLWL CASE
Span dislodged
Service Cond.
1.200
STEM WALL
BASE SLAB
HFL CASE
Area of base (A) =
Span dislodged
(C) (P/A - ML/ZL + MT/ZT)
Service Cond.
(B) (P/A + ML/ZL - MT/ZT)
(D) (P/A - ML/ZL - MT/ZT)
P/A ML/ZL
MT/ZT
(A) (P/A + ML/ZL + MT/ZT)

Consulting Engineers Group Ltd., Jaipur__________________________________________________________
Bridge Design Report__________________________________________________________________________________________
BENDING MOMENT AT FACE OF STEM
Element Area fact. force L.A. Moment1 1.0 2.400 1.000 2.4002 0.5 1.680 0.667 1.120
Rect. 1.0 -46.348 1.000 -46.348Trian. 0.5 -5.871 1.333 -7.828
-48.139 -50.656
Bending Moment at face of stem 50.656 tm/m
Effective depth required 0.670 m
Effective depth provided at face of stem 1.115 m
Area of Reinforcement required 2469 mm2
Minimum steel required 0.15% 1673 mm2 I.R.C 78-2000 Clause:707.2.7
Distribution steel 617 mm2/m12 φ , @ 150 C/C
mainsteel 2469 mm2 753.9822Hence provide , 25 φ , @ 175 C/C
0 φ , @ 175 C/CThere is no tension below foundation, hence foundation will not have negative momentat top. However in reference to clause 707.2.8 of IRC: 78-2000, the requirement of reinforcement at top is follows.Minimum steel reinfocement as per above clause 669 mm2/m
provide 12 φ , @ 150 C/C753.982
Check for Shear
SHEAR FORCE AT "d" FROM FACE OF STEM
Element Area fact. force L.A. Moment1 1.0 1.062 0.443 0.4702 0.5 0.743 0.295 0.219
Rect. 1.0 -24.624 0.443 -10.896Trian. 0.5 -0.540 0.590 -0.319
-23.359 -10.526
Effective depth ( d' ) at distence d 0.725 m
Shear force at critical section 23.4 t
Bending Moment at critical section 10.53 tm
tan β = 0.36
Net shear force S-M*tanβ/d' 18.10 t
Hence, Shear stress 24.97 t/m2
% of reinforcement 0.39
Permissible shear stress 27.92 t/m2 Hence O.K.
TOTAL
Upward base pressure
TOTAL
Upward Base pressure
Downward Loads
Loadings
Loadings
Downward loads

Consulting Engineers Group Ltd., Jaipur__________________________________________________________
Bridge Design Report__________________________________________________________________________________________
DESIGN OF HEEL SLAB
0.7 HEEL TOE
0.5003.500 2.000
7.66217.94
17.9421.46 27.33
BENDING MOMENT AND SHEAR FORCE AT FACE OF STEM
Element Area fact. force L.A. moment3 1 4.200 1.750 7.3504 0.5 2.940 1.167 3.4308 0.5 4.410 2.333 10.290
1 54.867 1.750 96.0170.5 4.410 2.333 5.1451 6.831 1.750 11.955
Rect. 1 -26.819 1.750 -46.932Trian. 0.5 -17.979 1.167 -20.976
32.860 66.278
Bending Moment at face of stem 66.278 tm
Effective depth required 0.767 mEffective depth provided at face of stem 1.115 m
Area of Reinforcement required 3232.56 mm2
Minimum steel 0.15% 1672.50 mm2 I.R.C 78-2000 Clause:707.2.7
Distribution steel 808.14 mm2/mmainsteel 3232.56 mm2
12 φ , @ 150 C/CHence provide , 25 φ , @ 150 C/C 753.9822
0 φ , @ 150 C/CThere is no tension below foundation, hence foundation will not have negative momentat top. However in reference to clause 707.2.8 of IRC: 78-2000, the requirement of reinforcement at top is follows.Minimum steel reinfocement as per above clause 836 mm2/m
provide 16 φ , @ 150 C/C1340.41
Loadings
1.200
TOTAL
8a
Downward Loads.
Upward base pressure

Consulting Engineers Group Ltd., Jaipur__________________________________________________________
Bridge Design Report__________________________________________________________________________________________
Check for Shear ( Critical section at face of stem )
Shear force at face of stem 32.86 t
tan β = 0.200Bending moment at face of stem 66.278 tmNet shear force S-M*tanβ /d 20.97 t
Hence, Shear stress 18.81 t/m2
% of reinforcement 0.29
Permissible shear stress 24.75 t/m2 Hence O.K.
DESIGN OF STEM WALL
0.30
1
7.428 8.7092
R.L. OF SECTION = 233.200 m
a) Service Condition
1 1 0.603 60.5 4.180 253.002 0.5 4.204 210.8 3.511 740.18
7.52 7.728 58.08278.88 1051.256
= Stem + dirt wall + cap + Load from superstructure= 256.712 + 5.45 + 6.05 + 232.07= 500.282 t
Longitudinal Moment = 1051.256 t-mTransverse Moment = 137.896 t-m
SUMMARY OF FORCES AND MOMENTS IN ABUTMENT SHAFT
DRY Condition
Element No. Area factor Height of E.P. diagram
SurchargeActive Earth Pressure.
Force L.A.Moment
tm8.359
Earth Pressure
8.359
HORIZONTAL FORCETOTAL
Total Vertical Load

Consulting Engineers Group Ltd., Jaipur__________________________________________________________
Bridge Design Report__________________________________________________________________________________________
b) Span Dislodged Condition
= Stem + dirt wall + cap + Load from superstructure= 256.712 + 5.45 + 6.05 + 0.00= 268.212 t
Longitudinal Moment = 993.176 t-mTransverse Moment = 0.000 t-m
H.F.L. condition
a) Service Condition
1 LL Surcharge 1.0 1.200 0.603 60.53 4.180 253.002 0.5 1.494 0.83 7.48 7.307 54.683 1.0 6.809 0.83 68.21 3.405 232.224 SubmgEarth 0.5 6.809 1.90 77.72 2.270 176.39
213.94 716.289
= Stem + dirt wall + cap + Load from superstructure= 121.151 + 5.45 + 6.05 + 232.07= 364.721 t
Longitudinal Moment = 774.368 t-mTransverse Moment = 137.896 t-m
b) Span Dislodged Condition
= Stem + dirt wall + cap + Load from superstructure= 121.151 + 5.45 + 6.05 + 0.00= 132.651 t
Longitudinal Moment = 716.289 t-mTransverse Moment = 0.000 t-m
0.95 m2 2375.000For horizontal reinforcement area of steel required for the stem at the section/metre = 185.4639 mm2
Providing 12 ,@ 47.62 c/c say, 150 C/C as horizontal reinforcement
Cross Sectional area
Moment (tm)
Total Vertical Load
Element no.
Component Area factor Height (m)Pressure
(t/m2)Force (t)
C.G. from
base (m)
Total Vertical Load
Dry Earth
TOTAL
Total Vertical Load

Consulting Engineers Group Ltd., Jaipur__________________________________________________________
Bridge Design Report____________________________________________________________________________________
As per clause 214.2 of IRC:6, horizontal braking force Fh, for each span is:For Class A Single lane : Fh = x = t
For class 70R Wheeled : Fh = x = t
For class A 3 lane Fh = x + x = tFor class 70R W +class A 1 lane
Fh = x + x = t
µ Rg = tFh/2 =
Summary of Longitudinal Forces :
Dead Loaddead load of slab = t/mTotal reaction = = twearing coat = t/m = tcrashbarrier = t/m = t
Transverse eccentricityClass 70RW+ Class A
e =
Class A 3 lane
e =
1.6866
5.3 0.7 0.7
55.163.095 26.6
6.84
6.65
55.2 0.05 26.6 12.362
26.6
Longitudinal horizontal force (t)
7.5155
0.2
Load Case
70RT+class A 1lane 7.52
5.320
0.2
11.0320.2 55.2
0.2
26.60.05
26.6
1.361.00
132.197.3181
10.8
1.6866
6.181
24.48132.19

Consulting Engineers Group Ltd., Jaipur__________________________________________________________
Bridge Design Report____________________________________________________________________________________
Summary of Dead load & Live loads from Superstructure. ( STAAD Pro)
P ML MT
Dead Load Reaction:t
SIDL t
L.L Max Reaction Case
70RT + Class A tClass A 3 Lane t
137.90232.07
81.7679.8
18.12
55.86
132.19
137.90
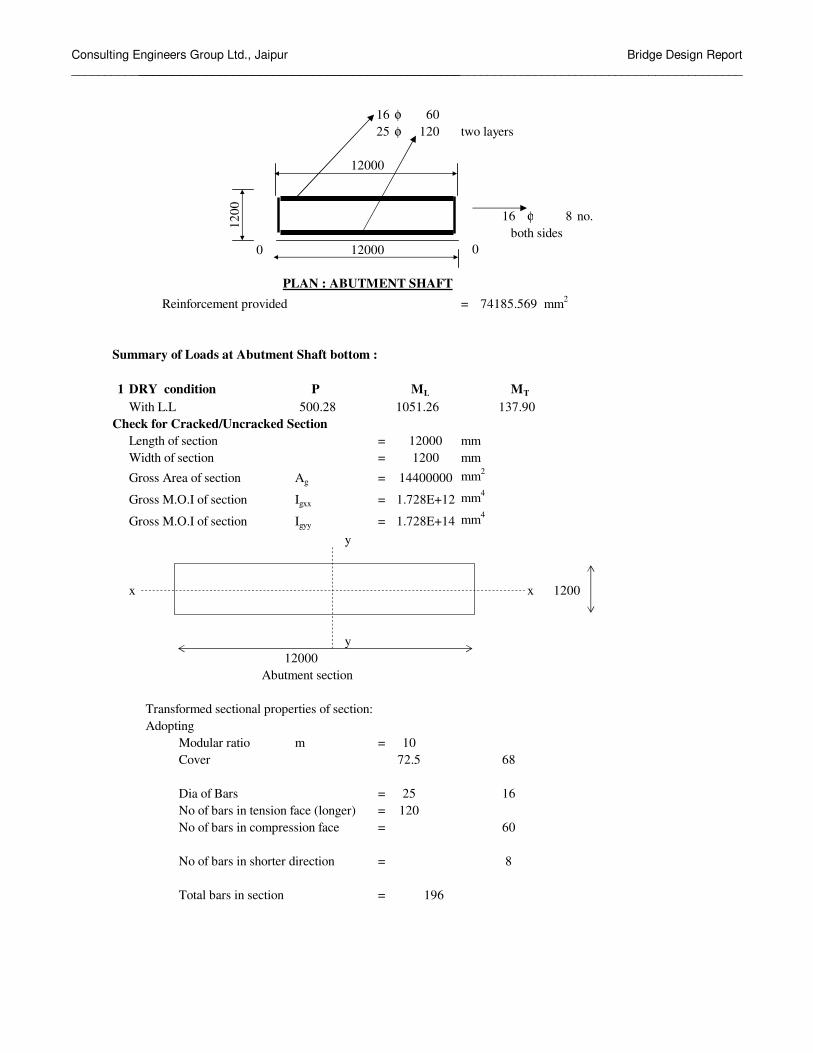
Consulting Engineers Group Ltd., Jaipur__________________________________________________________
Bridge Design Report__________________________________________________________________________________________
φφ two layers
φ no.both sides
Reinforcement provided = mm2
Summary of Loads at Abutment Shaft bottom :
1 DRY condition P ML MT
With L.LCheck for Cracked/Uncracked Section
Length of section = mmWidth of section = mm
Gross Area of section Ag = mm2
Gross M.O.I of section Igxx = mm4
Gross M.O.I of section Igyy = mm4
y
x x
y
Abutment section
Transformed sectional properties of section:Adopting
Modular ratio m =Cover
Dia of Bars =No of bars in tension face (longer) =No of bars in compression face =
No of bars in shorter direction =
Total bars in section =
0 0
8
196
25 16120
60
1200
12000
1072.5 68
1200
14400000
1.728E+12
1.728E+14
12000
12000
PLAN : ABUTMENT SHAFT74185.569
500.28 1051.26 137.90
12000
1200 16 8
16 6025 120

Consulting Engineers Group Ltd., Jaipur__________________________________________________________
Bridge Design Report__________________________________________________________________________________________
Steel Area As = mm2
% of Steel = %y
x x
y
Asx = mm2
Asy = mm2
Area of concrete Ac = Ag - As = mm2
C.G of Steel placed on longer face = mmC.G of Steel placed on shorter face = mm
Transformed Area of Section Atfm = mm2
Transformed M.Itxx = Igxx + 2 m - 1 Asxax2
= mm4
Zxx = M.Itxx = mm3
d/2Transformed M.Ityy = Igyy + 2 m - 1 Asyay2
= mm4
Zyy = M.Ityy = mm3
d/2
Permissible stressesMinimum Gross Moment of inertia Imin = mm4
Area of section = mm2
r = mmEffective length of Abutment shaft (IRC:21-2000 cl: 306.2.1)
Abutment shaft height L = mEffective length Leff = mSlenderness ratio = <Type of member = 1
1 Short ColumnStress reduction coefficient (IRC:21-2000 cl: 306.4.2,3) 2 Long Column
β =Permissible stresses : concrete
σcbc = N/mm2
σco = N/mm2
Tensile stress = N/mm2
Permissible stresses : Steel
σst = N/mm2
8.3333
6.25
0.61
200
11.31132.653 50
1
1.728E+12
14400000346.41016
9.426
2.02303E+12
3.372E+09
1.73819E+14
2.897E+10
14325814527.55932
15067670
525
5932
58905
1608.5
741860.5152
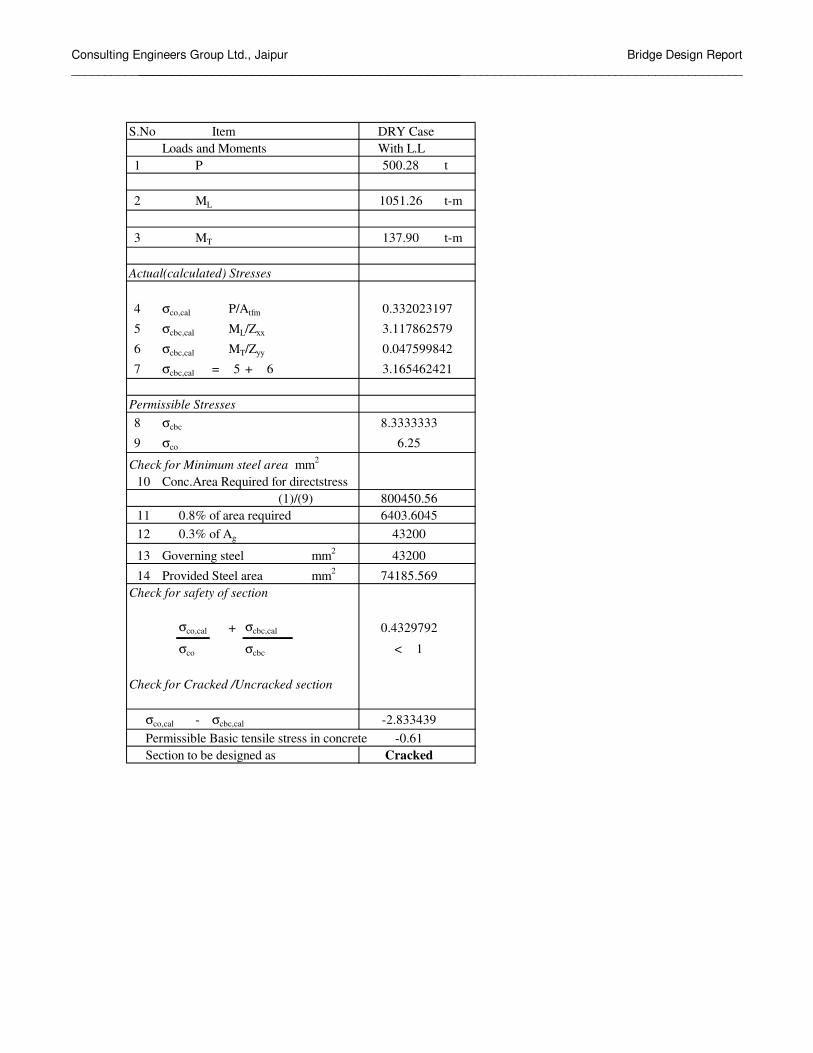
Consulting Engineers Group Ltd., Jaipur__________________________________________________________
Bridge Design Report__________________________________________________________________________________________
S.No Item DRY CaseLoads and Moments With L.L
1 P t
2 ML t-m
3 MT t-m
Actual(calculated) Stresses
4 σco,cal P/Atfm
5 σcbc,cal ML/Zxx
6 σcbc,cal MT/Zyy
7 σcbc,cal = 5 + 6
Permissible Stresses8 σcbc
9 σco
Check for Minimum steel area mm2
Conc.Area Required for directstress(1)/(9)
0.8% of area required0.3% of Ag
Governing steel mm2
Provided Steel area mm2
Check for safety of section
σco,cal + σcbc,cal
σco σcbc < 1
Check for Cracked /Uncracked section
σco,cal - σcbc,cal
Permissible Basic tensile stress in concreteSection to be designed as
-0.61Cracked
6.25
3.117862579
0.047599842
3.165462421
8.3333333
500.28
14 74185.569
0.4329792
-2.833439
12 43200
13 43200
10800450.56
11 6403.6045
1051.26
137.90
0.332023197

Consulting Engineers Group Ltd., Jaipur__________________________________________________________
Bridge Design Report__________________________________________________________________________________________
a
A B
b
X directionY direction
A' B'
Width of Solid return wall (a) =Width of Cantilever return wall =Avg Height of Solid return wall (b) =Height of Cantilever return at Tip =Height of Cantilever return at Root =Thickness of Solid Return at farther end =Thickness of Solid Return at Root =Thickness of Solid Return at bottom =Thickness of Solid Return at top =Thickness of Cantilever return =
Unit wt of Soil = t/m3
Grade of concrete = M 30σcbc = t/m2
m =σst = t/m2
k =j =
R = t/m2
Case (1) For uniformly distributed load over entire plate
a/b = For a/b = β1 = β2 =
For a/b = β1 = β2 =
a/b = β1 =β2 =
3.50
0.752.666667
0.50.50.50.5
4.00
9.059
241.909
232.850
0.75
3.504.00
9.059
2.666667
0.5
1.8
102010
204000.3333330.888889
151.1111
0.398
0.632
0.3863561 0.378256
0.3863561 0.375
0.5
0.353
0.631
0.419259

Consulting Engineers Group Ltd., Jaipur__________________________________________________________
Bridge Design Report__________________________________________________________________________________________
Live Load Surcharge:
q = x x = t/m2
σbmax = β1 x q x b2
t2
σamax = β2 x q x b2
t2
σbmax = x x = t/m2
For mm of width
Z = x = mm3
6 = m3
Hence Moment /m width along Y direction
MY /m width = x = t-m/m
σamax = x x = t/m2
For mm of width
Z = x = mm3
6 = m3
Hence Moment /m width along X direction
MX /m width = x = t-m/mCase (2) For Triangular loading due to earth pressure
a/b = For a/b = β1 = β2 =
For a/b = β1 = β2 =
a/b = β1 =β2 =
Earth pressure:
q = x x = t/m2
σbmax = β1 x q x b2
t2
σamax = β2 x q x b2
t2
σbmax = x x = t/m2
For mm of width
Z = x = mm3
6 = m3
0.2794 1.8 1.2 0.603504
0.378256 0.603504 82.070.25
74.9353
1000
1000 250000 41666667
0.041667
74.935304 0.041667 3.122304
0.4192586 0.603504 82.07 83.058230.25
1000
1000 250000 41666667
0.041667
83.058232 0.041667 3.46076
0.3863561 0.375 0.212 0.148
0.5 0.328 0.200
0.3863561 0.222538
0.152724
0.2794 1.8 9.059 4.555952
0.2225385 4.555952 82.07 332.81640.25
1000
1000 250000 41666667
0.041667

Consulting Engineers Group Ltd., Jaipur__________________________________________________________
Bridge Design Report__________________________________________________________________________________________
Hence Moment /m width along Y direction
MY /m width = x = t-m/m
σamax = x x = t/m2
For mm of width
Z = x = mm3
6 = m3
Hence Moment /m width along X direction
MX /m width = x = t-m/m
Total Moment in Solid Return /m height = t-m/mAlong X-direction
Total Moment in Solid Return /m width = t-m/mAlong Y-direction
Moment due to Cantilever Return:Moment due to earth pressure at face A - A '
M = x x x x x+ 0.5 x x 1.8 x x x
+ 0.5 x x 1.8 x x X2 x dx x - X+ x 1.8 x x x X x dx x - X
= + + x + x
= t-m
Design of cantilever Return:Assuming 50 mm cover and 12 mm dia bars.Effective depth available = - 50 - 20 - 6 = 424 mm
M = R x b x d2
= x x = t-m
Ast = x 10^6 = mm2
x xAst/m = mm2/m
Provide 12 mm dia @ mm c/c providing mm2 on earth face.
Provide 10 mm dia @ mm c/c providing mm2 on other face.Along Horizantal direction.
332.81644 0.041667 13.867350.1527241 4.555952 82.07 228.4059
0.251000
1000 250000 41666667
0.041667
228.40593 0.041667 9.516914
12.97767
16.98966
151.1111 2.666667 0.179776
21.33333 0.653796 10.66667
2.00
0.666667 4.00
0.2794 1.2
0.2794 1.95
0.2794
0.2794
0.750.5625
14.11063
3.621024 1.13157 0.11176
0.444444
4.004.00 2.00
1.8
4.00
72.44307
1835.283
500
688.231
14.1106320400 0.888889 0.424
150 753.9822
150 523.5988

Consulting Engineers Group Ltd., Jaipur__________________________________________________________
Bridge Design Report__________________________________________________________________________________________
Design of Solid Return:Moment due to Cantilever Return:Moment due to Earth pressure at face B-B '
M = x x x x x+ 0.5 x x 1.8 x x x
+ 0.5 x x 1.8 x x X2 x dx x - X+ x 1.8 x x x X x dx x - X
= + + x + x
= t-m
Moment in Solid Return /m height = + = t-m/m
Moment in Solid Return /m width = = t-m/m
Design of face B-B '
Moment in Solid Return /m height = t-m/m
Assuming 50 mm cover and 25 mm dia bars.Effective depth available = - 50 - 20 - 13 = 418 mm
M = R x b x d2
= x x = t-m
Ast = x 10^6 = mm2
x xAst/m = mm2/m
Provide 20 mm dia @ mm c/c providing mm2 on earth face.
Provide 12 mm dia @ mm c/c providing mm2 on other face.Along Horizantal direction.
Design of face A ' -B '
Moment in Solid Return /m width = t-m/m
Assuming 50 mm cover and 25 mm dia bars.Effective depth available = - 50 - 0 - 13 = 438 mm
M = R x b x d2
= x x = t-m
Ast = x 10^6 = mm2
x xAst/m = mm2/m
Provide 20 mm dia @ mm c/c providing mm2 on earth face.
Provide 12 mm dia @ mm c/c providing mm2 on other face.Along Vertical direction.
16.989669.059
4.005.50
5.50
0.653796 38.66667
0.2794 1.2 1.8 0.750.2794 0.5625 4.00
0.2794 0.444444 7.500.2794 1.95 0.666667 7.50
49.07871
12.97767 49.07871 18.39535
9.957816 3.1118175 0.11176 96
18.39535
500
151.1111 1 0.174306 26.33961
18.39535 2429.81920400 0.888889 0.4175
2429.819
125 2513.274
125 904.7787
16.98966
500
151.1111 1 0.191406 28.92361
16.98966 2141.55320400 0.888889 0.4375
2141.553
125 2513.274
125 904.7787

Consulting Engineers Group Ltd., Jaipur__________________________________________________________
Bridge Design Report__________________________________________________________________________________________
1. DESIGN FOR FORCES IN LONGITUDINAL DIRECTION
Active earth pressure Ka = 0.279384FOR NORMAL CASE, FA = 1.0unit wt of soil γ = 1.8
δ = 20clear span between return wall = 11.000 mwidth of return wall = 0.5Avg. cover to reinforcement. (FOR 2-3 LAYERS) = 0.150 mH (From formation level) = 8.709 m DESIGN FOR BENDING MOMENT
S.NO. UNITS 1H (FROM TOP) m 8.709
WIDTH OF RETURN AT THIS LEVEL m 3.500FORCE DUE TO EARTH PRESSURE t 107.527
MOMENT DUE TO EARTH PRESSURE tm 393.310FORCE DUE TO L.L. SURCHARGE t 29.632
MOMENT DUE TO L.L. SURCHARGE tm 129.032TOTAL MOMENT tm 522.342
DESIGN MOMENT tm 522.342REQUIRED EFFECTIVE DEPTH m 2.940
EFF. DEPTH AVAILABLE m 3.350AREA OF STEEL REQUIRED cm2 85.976
DIAMETER OF BAR PROVIDED mm 32TOTAL NO. OF BARS no. 12
cm2 96.51O.K.12.3
CHECK FOR SHEAR STRESS
SHEAR FORCE t 142.159SHEAR STRESS t/m2 84.871
Ast/bd x 100 % 0.513PERMISSIBLE SHEAR STRESS MPa 0.31PERMISSIBLE SHEAR STRESS t/m2 31.95
Asv/sv cm2/m 7.744
AREA OF STEEL PROVIDED

Consulting Engineers Group Ltd., Jaipur__________________________________________________________
Bridge Design Report__________________________________________________________________________________________
Design of Abutment Cap:
As the cap is fully supported on the abutment.Minimum thickness of the cap required as per cl: 710.8.2 of IRC:78-2000 is 200 mm.However the thickness of abutment cap is = mmAssuming a cap thickness of = mmVolume of Abutment cap = x x
= m3
Quantity of steel = 1 % of volume= x
= m3
Quantity of steel to be provided at top = m3
Quantity of steel to be provided at bottom = m3
Top & bottom face:Quantity of steel to be provided in Longitudinal direction= m3
Assuming a clear cover of = mmLength of bar - = mArea of steel required in Longitudinal direction
= mm2
Provide 8 nos of bars mm dia at top & bottom face.= mm2
Transverse steel:Quantity of steel to be provided in Longitudinal direction= m3
Assuming a clear cover of = mmAssuming a dia of bar = mmLength of bar - = m
Volume of each stirrup = m3
no of stirrups required for m/length = nosRequired Spacing =
= mmProvide mm dia bar mm c/c stirrups throught in length of abutment cap.
mm212 125
904.779
81000
8125
6.8E-05
12
904.779
0.006350
0.70 0.100 0.6
0.006311.9
529.412
12
5012.00 0.100 11.9
0.02520.01260.0126
0.0063
122.52
1100
2.52
3003000.3 0.70

Consulting Engineers Group Ltd., Jaipur__________________________________________________________
Bridge Design Report__________________________________________________________________________________________
Design of Dirt wall:Dirt wall designed as a vertical cantilever.
F1
F2
Intensity for rectangular portion = x x = t/m2
F1 = x x = tIntensity for triangular portion = x x = t/m2
F2 = x x = tM1 = x = t-mM2 = x = t-mM1+ M2 = t-mTotal moment at base of dirt wall /m length = t-m/m
Thickness of dirtwall = mAssuming a clear cover on either face = mmVertical steel on earth face:dia of steel bar = mmAvailable effective depth = - - = mm
effective depth req = = mmx
Ast req = = mm2/mx x
Minimum steel = x x = mm2/m
Provide mm dia bar mm c/c as vertical steel at earth face.mm2/m
Disrtibution steel on earth face:dia of steel bar = mmAvailable effective depth = - - = mm
0.3M = x = t-m/mAst req = = mm2/m
x x
Minimum steel as per IRC:21-200 cl:305.10 = mm2/m
Governing steel at earth face = mm2/mProvide mm dia bar mm c/c as vertical steel at earth face.
mm2/mVertical steel on earth face
As per IRC:21-200 cl:305.10 All faces provide minimum steel of = mm2/mProvide mm dia bar mm c/c as vertical steel at earth face.
mm2/mDistribution steel:As per IRC:21-200 cl:305.10 All faces provide minimum steel of = mm2/mProvide mm dia bar mm c/c as vertical steel at earth face.
mm2/m
0.67056
0.98
0.67056 12.00 0.98
0.2794 2.00 1.2
7.8938320.2794 2.00 0.98 0.548183
0.548183 12.00 0.98 3.2266047.893832 0.49 3.8719253.226604 0.41202 1.329425
5.201350.433446
0.350
12300 50 6 244
0.4334461.51 1000
53.57707
99.91099
0.12100
300 1000 360
0.433446200 0.889 244
12 200565.4867
12
0.1300340.3 0.433446
300 50 12 238
250
0.130034 30.72893200 0.889 238
250
25010 200
10 200392.6991
392.6991
392.6991
25010 200

Consulting Engineers Group Ltd., Jaipur__________________________________________________________
Bridge Design Report__________________________________________________________________________________________
7.500 0.3 0.420241.909
0.7511
0.981
slop V1:H 1.52.667 240.928
10 0.3008d 0.000
0.70 240.6284.000 0.00
0.000 240.628
H.F.L 240.0094.000
9b
7.4289.909
8c
L.W.L232
5 9a8a
6
233.200 0.70 0.50 233.200
0.700 8 9 0.7004 2 Founding
7 Lvl232.000
0.500 3 1 0.500
3.500 1.200 2.000
6.70

Consulting Engineers Group Ltd., Jaipur Bridge Design Report ________________________________________________________________________________
INPUT FILE: 70r.STD 3. STAAD PLANE 4. INPUT WIDTH 72 5. UNIT METER MTON 6. PAGE LENGTH 1000 7. UNIT METER MTON 8. JOINT COORDINATES 9. 1 0.00 0 0;2 0.4 0 0;3 10.4 0 0;4 10.8 0 0 10. MEMBER INCIDENCES 11. 1 1 2 3 12. MEMBER PROPERTY CANADIAN 13. 1 TO 3 PRI YD 1.0 ZD 1.0 14. CONSTANT 15. E CONCRETE ALL 16. DENSITY CONCRETE ALL 17. POISSON CONCRETE ALL 18. SUPPORT 19. 2 3 PINNED 20. DEFINE MOVING LOAD 21. TYPE 1 LOAD 8.0 2*12 4*17.0 DIS 3.96 1.52 2.13 1.37 3.05 1.37 22. LOAD GENERATION 175 23. TYPE 1 -13.4 0. 0. XINC .2 24. PERFORM ANALYSIS 25. LOAD LIST 55 26. PRINT SUPPORT REACTION SUPPORT REACTIONS -UNIT MTON METE STRUCTURE TYPE = PLANE ----------------- JOINT LOAD FORCE-X FORCE-Y FORCE-Z MOM-X MOM-Y MOM Z 2 55 0.00 36.84 0.00 0.00 0.00 0.00 3 55 0.00 55.16 0.00 0.00 0.00 0.00 ************** END OF LATEST ANALYSIS RESULT ************** 27. FINISH

Consulting Engineers Group Ltd., Jaipur Bridge Design Report ________________________________________________________________________________ INPUT FILE: CLAAS A.STD 3. STAAD PLANE 4. INPUT WIDTH 72 5. UNIT METER MTON 6. PAGE LENGTH 1000 7. UNIT METER MTON 8. JOINT COORDINATES 9. 1 0.00 0 0;2 0.4 0 0;3 10.4 0 0;4 10.8 0 0 10. MEMBER INCIDENCES 11. 1 1 2 3 12. MEMBER PROPERTY CANADIAN 13. 1 TO 3 PRI YD 1.0 ZD 1.0 14. CONSTANT 15. E CONCRETE ALL 16. DENSITY CONCRETE ALL 17. POISSON CONCRETE ALL 18. SUPPORT 19. 2 3 PINNED 20. DEFINE MOVING LOAD 21. TYPE 1 LOAD 2*2.7 2*11.4 4*6.8 DIS 1.1 3.2 1.2 4.3 3 3 3 22. LOAD GENERATION 202 23. TYPE 1 -18.8 0. 0. XINC .2 24. PERFORM ANALYSIS 25. LOAD LIST 74 26. PRINT SUPPORT REACTION SUPPORT REACTION SUPPORT REACTIONS -UNIT MTON METE STRUCTURE TYPE = PLANE ----------------- JOINT LOAD FORCE-X FORCE-Y FORCE-Z MOM-X MOM-Y MOM Z 2 74 0.00 26.60 0.00 0.00 0.00 0.00 3 74 0.00 9.80 0.00 0.00 0.00 0.00 ************** END OF LATEST ANALYSIS RESULT ************** 27. FINISH

Consulting Engineers Group Ltd., Jaipur Bridge Design Report ________________________________________________________________________________ Abutment SHAFT ..DRY NORMAL Depth of Section = 1.200 m Width of Section = 12.000 m along width-compression face- no of bar: 70 tension face- no of bar: 140 Dia (mm) 16 25 Cover (cm) 7.5 10.5 along depth-compression face- no of bar: 8 tension face- no of bar: 8 Dia (mm) 16 16 Cover (cm) 7.50 7.5 Modular Ratio : Compression = 10.0 Modular Ratio : Tension = 10.0 Allowable Concrete Stress = 85.00 Kg/cm^2 Allowable Steel Stress = 2040.00 Kg/cm^2 Axial Load = 500.282 T Mxx = 1051.256 Tm Myy = 137.896 Tm Intercept of Neutral axis : X axis : = 273.656 m : y axis : = .369 m Concrete Stress Governs Design Stress in Concrete due to Loads = 60.05 Kg/cm^2 Stress in Steel due to Loads = 1206.23 Kg/cm^2 Percentage of Steel = .60 % Abutment SHAFT ..DRY SPAN DISLODGED Depth of Section = 1.200 m Width of Section = 12.000 m Modular Ratio : Compression = 10.0 Modular Ratio : Tension = 10.0 Allowable Concrete Stress = 85.00 Kg/cm^2 Allowable Steel Stress = 2040.00 Kg/cm^2 Axial Load = 268.212 T Mxx = 993.176 Tm Myy = .010 Tm Intercept of Neutral axis : X axis : = ******* m : y axis : = .332 m Concrete Stress Governs Design Stress in Concrete due to Loads = 54.70 Kg/cm^2 Stress in Steel due to Loads = 1255.23 Kg/cm^2
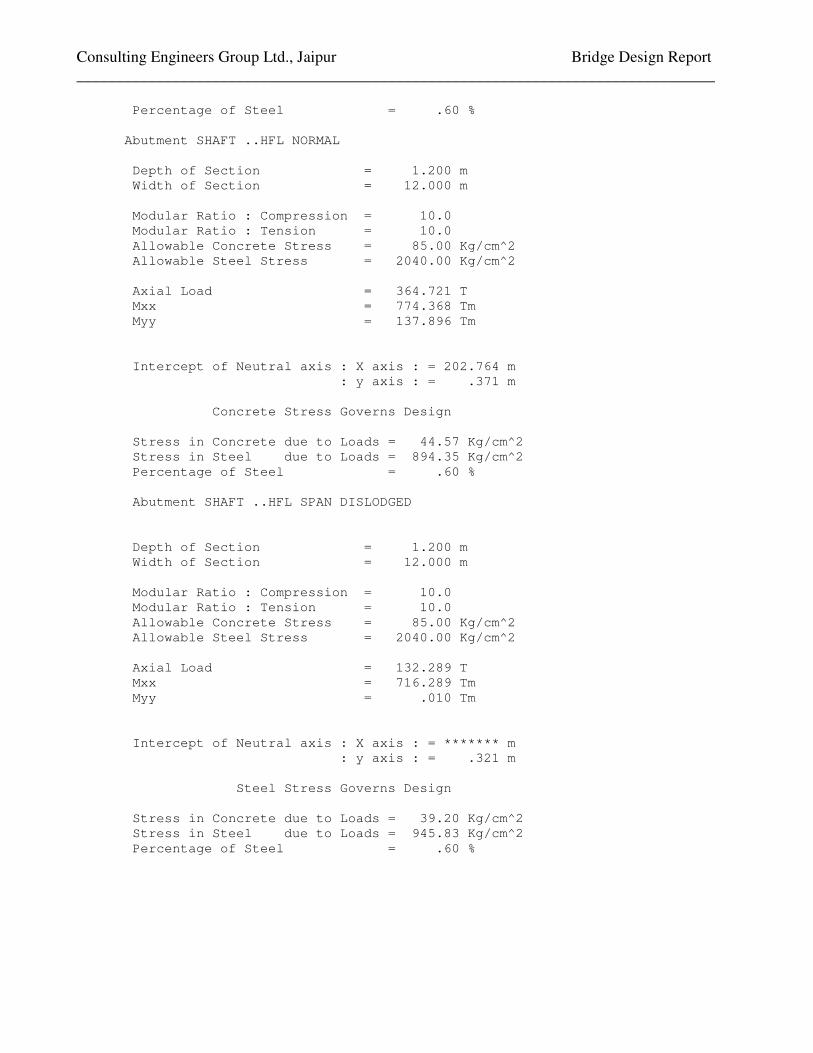
Consulting Engineers Group Ltd., Jaipur Bridge Design Report ________________________________________________________________________________ Percentage of Steel = .60 % Abutment SHAFT ..HFL NORMAL Depth of Section = 1.200 m Width of Section = 12.000 m Modular Ratio : Compression = 10.0 Modular Ratio : Tension = 10.0 Allowable Concrete Stress = 85.00 Kg/cm^2 Allowable Steel Stress = 2040.00 Kg/cm^2 Axial Load = 364.721 T Mxx = 774.368 Tm Myy = 137.896 Tm Intercept of Neutral axis : X axis : = 202.764 m : y axis : = .371 m Concrete Stress Governs Design Stress in Concrete due to Loads = 44.57 Kg/cm^2 Stress in Steel due to Loads = 894.35 Kg/cm^2 Percentage of Steel = .60 % Abutment SHAFT ..HFL SPAN DISLODGED Depth of Section = 1.200 m Width of Section = 12.000 m Modular Ratio : Compression = 10.0 Modular Ratio : Tension = 10.0 Allowable Concrete Stress = 85.00 Kg/cm^2 Allowable Steel Stress = 2040.00 Kg/cm^2 Axial Load = 132.289 T Mxx = 716.289 Tm Myy = .010 Tm Intercept of Neutral axis : X axis : = ******* m : y axis : = .321 m Steel Stress Governs Design Stress in Concrete due to Loads = 39.20 Kg/cm^2 Stress in Steel due to Loads = 945.83 Kg/cm^2 Percentage of Steel = .60 %

CEG.Ltd., Jaipur Bridge Design Report
Consultancy Services for Feasibility Study and Detailed Project Preparation for Proposed Orissa State Road Project
DESIGN OF SUBSTRUCTURE (PIER)

Consulting Engineers Group Ltd., Jaipur_______________________________________________________________________________________
Bridge Design Report____________________________________________________________________________
Design Data :For design purposes, following parameters have been considered.
Grade of concrete = M -Pier Cap = M -
Grade of reinforcement steel = Fe -Centre to Centre distance of A / Expansion joints = mCentre to Centre distance of Bearing = mDepth of superstructure = mmThickness of wearing coat = mmFormation level along C of carriage way = mSoffit level =Pedestal top level =Height of bearing and Pedestal = mL.W.L./Bed level = mH.F.L = mM.S.L = mFounding Level = mPier cap top level = m
S.B.C of Soil = t/m2
Live Load Class A three LaneClass 70R wheeled/Tracked + Class A
Maximum surface velocity of water = x m/sec = m/secSay, m/sec
The following codes are used for the design of substructure:1 IRC : 6 - 20002 IRC : 21 - 20003 IRC : 78 - 2000
1.70
10.40010.800
240.928
240.928240.928
37.600
240.009234.384233.441
56.00
(a)
2 1.200 1.7(b)
25
236.9410.000
241.909
41525
925
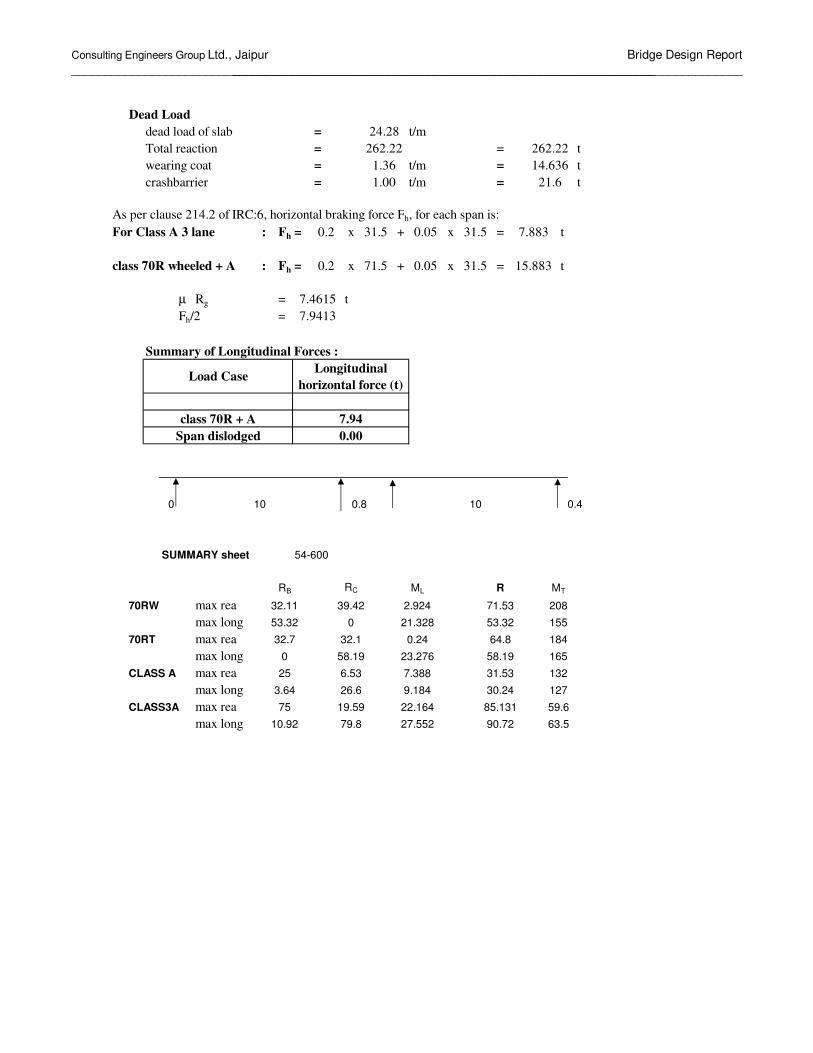
Consulting Engineers Group Ltd., Jaipur_______________________________________________________________________________________
Bridge Design Report____________________________________________________________________________
Dead Loaddead load of slab = t/mTotal reaction = = twearing coat = t/m = tcrashbarrier = t/m = t
As per clause 214.2 of IRC:6, horizontal braking force Fh, for each span is:For Class A 3 lane : Fh = x + x = t
class 70R wheeled + A : Fh = x + x = t
µ Rg = tFh/2 =
Summary of Longitudinal Forces :
0
SUMMARY sheet 54-600
RC
70RW max reamax long
70RT max reamax long
CLASS A max reamax long
CLASS3A max reamax long
Load Case
Span dislodgedclass 70R + A 7.94
Longitudinal horizontal force (t)
7.883
0.00
15.883
7.9413
0.2 71.5
0.2 31.5
0.05
262.2214.636
21.6
24.28262.22
1.361.00
31.5
7.4615
31.50.05
10 0.8 10 0.4
RB ML R MT
208
53.32 0 21.328 53.32 155
32.11 39.42 2.924 71.53
184
0 58.19 23.276 58.19 165
32.7 32.1 0.24 64.8
132
3.64 26.6 9.184 30.24 127
25 6.53 7.388 31.53
59.6
10.92 79.8 27.552 90.72 63.5
75 19.59 22.164 85.131

Consulting Engineers Group Ltd., Jaipur_______________________________________________________________________________________
Bridge Design Report____________________________________________________________________________
H.F.L Condition with L.La) Vertical load and their moments about C/L of Foundation base.I1 D.L Reaction eL ML eT MT
a Left spanb Right span2 S.I.D.L
a Left spanb Right span
4 L.L Max Reaction casea Left span
70R Wheeled + class AClass A 3 Lane
b Right span70R Wheeled + class AClass A 3 Lane
4 L.L Max Long.Moment casea Left span
70R Wheeled + class AClass A 3 Lane
b Right span70R Wheeled + class AClass A 3 Lane
Max Reaction case:Max Long. moment case:
II Substructure V ρρρρ P eL ML eT MT
1 Pedestala Left spanb Right span2 Pier cap R
Pier cap Tr3 Pier shaft
up to H.F.Lbelow H.F.L
4 Footing5 Earth above
footing6 Water current
71.82
300.62 0
9.828 -0.4 -3.9312
0 0
7.0012223.91 7.0012 19.236
0 19.2360 0
91.348 1 91.348 0
0 035.67 1.4 49.938 0 0 0 0
0 2.4
0052.688 1.4 73.763 0
2.4
0
0 00 0
0
0 0.4 0
0
8.856 00 0 0
00 2.4
3.69 2.4
0 2.4 0 -0.4
62.1417.631 0.4 7.0524 0.7 12.34235.307 0.4 14.123 1.76
0.7 47.2557.978 -0.4 -23.191 1.76
018.12 0.4 7.248 0 018.12 -0.4 -7.248 0
0 0132.19 0.4 52.876 0 0
P132.19 -0.4 -52.876
0
71.928 -0.4 -28.771 1.76 126.59
102.0467.5 -0.4 -27
6.8796
3.276 0.4 1.3104 1.76 5.7658
0.7
0.4 28.728 0.7 50.274
0 0 000
385.75375.82
19.94827.461
164.18132.36
0
0
0

Consulting Engineers Group Ltd., Jaipur_______________________________________________________________________________________
Bridge Design Report____________________________________________________________________________
b) Horizantal Forces and Moments withrespect to Base
1 Longitudinal Forces at bearing levelHL HT eL ML eT MT
Summary Max Reaction case Max Long.moment caseP = tML = t-mMT = t-m
Check for Maximum Allowable Base Pressure:
Pmax = P + +
A
= + + = t/m2
< t/m2
O.KPmin = P - -
A
= - - = t/m2
>O.K.NO.Tension
Max LongPmax = P + +
A
= + + = t/m2
< t/m2
O.KPmin = P - -
A
= - - = t/m2
>O.K.NO.Tension
43.05 88.253 25.1130.00
609.66 86.405 183.42 5.8787
ML MT
ZL ZT
ZL
22.44443.05 88.253 25.113
183.42
59.456 0
ZT
609.66 86.405
609.6686.405183.42
ML MT
7.94 0 7.487
7.94 0
59.456 7.487
599.7393.918
0
37.6
ML MT
ZL ZT
599.73 93.918 151.59 21.03243.05 88.253 25.113
37.6
ML MT
ZL ZT
599.73 93.918 151.59 6.830243.05 88.253 25.113
0.00
151.59
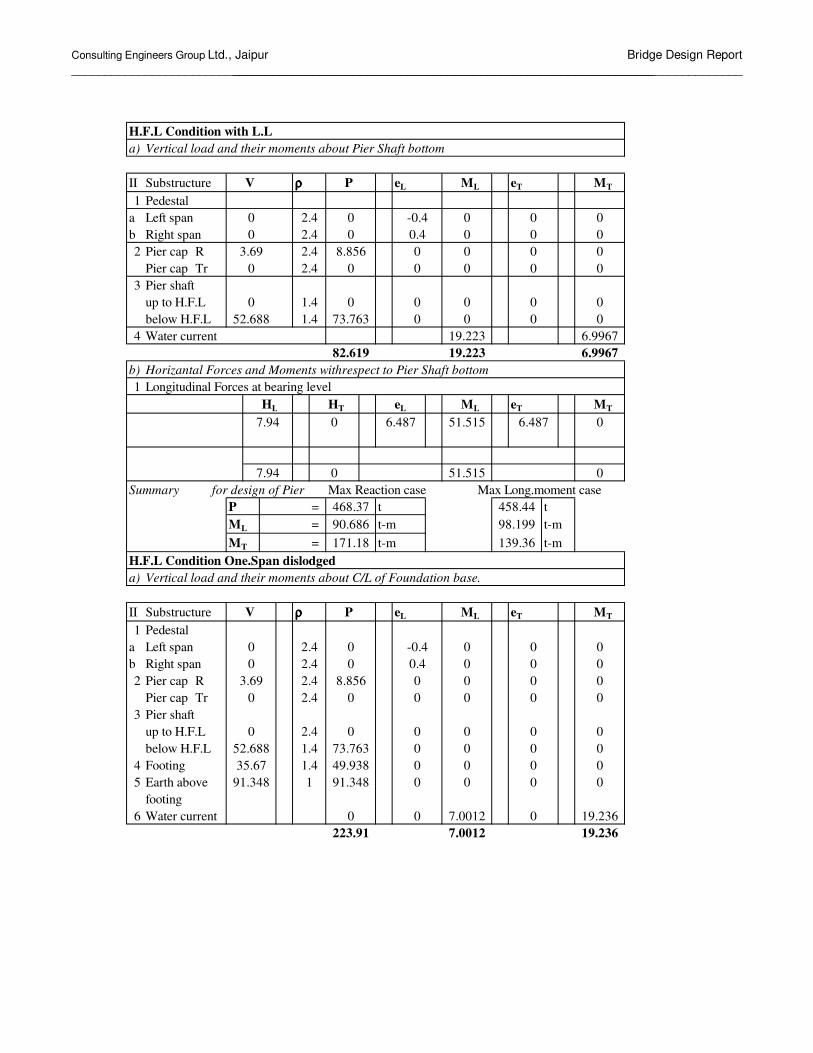
Consulting Engineers Group Ltd., Jaipur_______________________________________________________________________________________
Bridge Design Report____________________________________________________________________________
H.F.L Condition with L.La) Vertical load and their moments about Pier Shaft bottom
II Substructure V ρρρρ P eL ML eT MT
1 Pedestala Left spanb Right span2 Pier cap R
Pier cap Tr3 Pier shaft
up to H.F.Lbelow H.F.L
4 Water current
b) Horizantal Forces and Moments withrespect to Pier Shaft bottom1 Longitudinal Forces at bearing level
HL HT eL ML eT MT
Summary for design of Pier Max Reaction case Max Long.moment caseP = t tML = t-m t-mMT = t-m t-m
H.F.L Condition One.Span dislodged a) Vertical load and their moments about C/L of Foundation base.
II Substructure V ρρρρ P eL ML eT MT
1 Pedestala Left spanb Right span2 Pier cap R
Pier cap Tr3 Pier shaft
up to H.F.Lbelow H.F.L
4 Footing5 Earth above
footing6 Water current 0
91.348 0 0
223.91 7.0012 19.2360 19.2360
0
52.688 1.4
91.348 135.67 1.4 49.938 0
73.763 0
0
0 2.4 0 0 0 0 0
0 2.4 0 0
03.69 2.4 8.856 0 0 0 0
0 2.4 0 0.40
468.3790.686171.18
0 2.4 0 0-0.4 0
7.94 0 51.515 0
7.94 0 6.487
00 0
51.515 6.487 0
82.619 19.223 6.99676.996719.223
52.688 1.4 73.763 00 0 0
0 2.4
0 1.4 0 0
00
0 0
00 0.4
00
03.69 2.4 8.856
2.40 0
0
0 00 0
0 2.4 0 -0.4
0 0 00 0 0
0
7.0012
0 0
0 0
0
458.4498.199139.36

Consulting Engineers Group Ltd., Jaipur_______________________________________________________________________________________
Bridge Design Report____________________________________________________________________________
SummaryP = tML = t-mMT = t-m
Check for Maximum Allowable Base Pressure:
Pmax = P + +
A
= + + = t/m2
< t/m2
O.KPmin = P - -
A
= - - = t/m2
>O.K.NO.Tension
H.F.L Condition One.Span dislodgeda) Vertical load and their moments about Abutment Shaft bottom.
II Substructure V ρρρρ P eL ML eT MT
1 Pedestala Left spanb Right span2 Pier cap R
Pier cap Tr3 Pier shaft
up to H.F.Lbelow H.F.L
4 Water current
Summary for design of PierP = tML = t-mMT = t-m
383.2419.223
19.223 6.996719.223 6.9967
6.9967
82.619
524.537.001219.236
ML
0 0 00 0052.688 1.4 73.763 0
0 2.4 0 0
0 0 00 2.4 0 0 0 0 0
3.69 2.4 8.856 0
0 0 00 2.4 0 0.4 0 0 00 2.4 0 -0.4
43.05 88.253 25.1130.00
524.53 7.0012 19.236 11.339
MT
ZL ZT
43.05 88.253 25.113
37.6
MT
ZL ZT
524.53 7.0012
ML
19.236 13.029

Consulting Engineers Group Ltd., Jaipur_______________________________________________________________________________________
Bridge Design Report____________________________________________________________________________
Dry Condition with L.La) Vertical load and their moments about C/L of Foundation base.I1 D.L Reaction eL ML eT MT
a Left spanb Right span2 S.I.D.L
a Left spanb Right span
4 L.L Max Reaction casea Left span
70R Wheeled + Class AClass A 3 Lane
b Right span70R Wheeled + Class AClass A 3 Lane
4 L.L Max Longitudinal Moment casea Left span
70R Wheeled + Class AClass A 3 Lane
b Right span70R Wheeled + Class AClass A 3 Lane
Max Reaction case
Max Longitudinal Moment
II Substructure V ρρρρ P eL ML eT MT
1 Pedestala Left spanb Right span2 Pier cap R
Pier cap Tr3 Pier shaft
up to G.Lbelow G.L
4 Footing5 Earth above
footing
b) Horizantal Forces and Moments withrespect to Base
1 Longitudinal Forces at bearing levelHL HT eL ML eT MT
2.4 85.608 0
5.765871.82 0.4 28.728 0.7 50.2743.276 0.4 1.3104 1.76
-0.4 -3.9312 0.7
7.94 0 0
7.487 0
59.456
0
7.94 59.4560 7.487
399.4 0
0 035.67
91.348363 1.8 164.43 00 0 0
00 0 023.656637 2.4 56.776 0
34.888808 2.4 83.733 0
00 2.4 0 0 0 0 0
3.69 2.4 8.856 0
00
2.42.4
00
0 -0.4 0 0
385.75 19.948 164.18
132.36375.82 27.461
71.928 -0.4 -28.771 1.76 126.599.828 6.8796
47.25
62.1417.631 0.4 7.0524 0.7 12.34235.307 0.4 14.123
57.97867.5
-0.4-0.4
-23.191 1.76 102.04-27 0.7
0.4 0 0 0
0
0
018.12 0.4 7.248
00
18.12 -0.4 -7.248 0 0
-52.876P
132.19132.19
-0.40.4 0
1.76
0 0
0 0
0
52.876
0300.62 0

Consulting Engineers Group Ltd., Jaipur_______________________________________________________________________________________
Bridge Design Report____________________________________________________________________________
Summary Max Reaction Max LongitudinalP = tML = t-mMT = t-m
A =ZL =
ZT =Max reaction case:Check for Maximum Allowable Base Pressure:
Pmax = P + +
A
= + + = t/m2
< t/m2
O.KPmin = P - -
A
= - - = t/m2
>O.K.NO.Tension
Max Longmoment case:
Pmax = P + +
A
= + + = t/m2
< t/m2
O.KPmin = P - -
A
= - - = t/m2
>O.K.NO.Tension
43.05 88.253
ML
25.1130.00
785.15112 79.404 164.18 10.801
ML MT
ZL ZT
164.1825.113
25.676
37.6
MT
ZT
785.1511243.05
79.40488.253
ZL
ML
88.253
25.113
164.18
785.1579.404
43.05
775.2286.917132.36
MT
ZL ZT
775.22412 86.917 132.36 24.26343.05 88.253 25.113
37.6
ML MT
ZL ZT
0.00
775.22412 86.917 132.36 11.75243.05 88.253 25.113

Consulting Engineers Group Ltd., Jaipur_______________________________________________________________________________________
Bridge Design Report____________________________________________________________________________
Design of Footing in Transverse directionP4 b P1
P3 P2
bBending moment at the face of pier b-b = t-mFooting is checked for shear at distance of d from face pierEffective depth d of footing = mTotal depth of section at distance d from pier = mEffective depth at distance d from face of pier = m
Bending moment at a distance of d from face of pier = t-mShear force at a distance d from face of pier = tNet shear force at a distance d from face of pier = t
(after correction)
Design for Flexure:M = Fe =
Permissible compressive stress σcbc = N/mm2
Permissible tensile stress σst = N/mm2
m =k =j =Q =
width b =
Effective depth required d = mmEffective depth provided = mm
Ast Required = mm2/m
Provide nos dia bars /m width
23.876
3.500
0.8
17.338
0.435
18.914
12.30
10.801
19.138
17.33818.444
211.91
12.6
19.138
1.35
101.899.04
4.2466
25.676
0.9150.66110.5701
10
200
12.30
341.02915
4
1059.1
100.330.891.4815
30 415
20

Consulting Engineers Group Ltd., Jaipur_______________________________________________________________________________________
Bridge Design Report____________________________________________________________________________
Check for shearShear stress at effective depth from pier = t/m2
% of steel provided =
Permissible shear stress = t/m2
Dry Condition with L.La) Vertical load and their moments about Pier Shaft bottomII Substructure V ρρρρ P eL ML eT MT
1 Pedestala Left spanb Right span2 Pier cap R
Pier cap Tr3 Pier shaft
up to G.Lbelow G.L
b) Horizantal Forces and Moments withrespect to PierShaft bottom
1 Longitudinal Forces at bearing levelHL HT eL ML eT MT
Summary for design of Pier Max Reaction case Max Longitudinal momentP = tML = t-mMT = t-m
0 2.4 0
34.888808 2.4 83.733
3.69
7.94
164.18
0
71.462525.1978.976
0
535.12
6.487 00 6.487
0 0 0
51.515
00 0
0
51.515
0
0
7.94
2.4 056.776
149.37
23.656637
2.4 8.856 0
000
0 2.4 0 -0.40 2.4 0 0.4
132.36
14.1240.13
0
19.38
0
0
0 00 0
0 0 0
0.1385

Consulting Engineers Group Ltd., Jaipur_______________________________________________________________________________________
Bridge Design Report____________________________________________________________________________
Dry Condition One.Span dislodged a) Vertical load and their moments about C/L of Foundation base.
1 Longitudinal Forces at bearing levelHL HT eL ML eT MT
SummaryP = tML = t-mMT = t-m
Check for Maximum Allowable Base Pressure:
Pmax = P + +
A
= + + = t/m2
< t/m2
O.KPmin = P - -
A
= - - = t/m2
>O.K.NO.Tension
Dry Condition One.Span dislodgeda) Vertical load and their moments about Abutment Shaft bottom.1 Longitudinal Forces at bearing level
HL HT eL ML eT MT
Summary for design of PierP = tML = t-mMT = t-m0
449.99
00
0
ML
43.05 88.253 25.1130.00
700.02012 0 0 16.261
37.6
ML MT
ZL ZT
16.26143.05 88.253 25.113
700.02012 0 0
MT
ZL ZT
700.02
0
7.487 0 7.487 0
6.487 0
0.00 0 0 0
0.00 0 6.487 0
0.00 0 0
0.00 0

Consulting Engineers Group Ltd., Jaipur_______________________________________________________________________________________
Bridge Design Report____________________________________________________________________________
φφ
φ no.both sides
Reinforcement provided = mm2
Summary of Loads at Pier Shaft bottom :1 DRY condition P ML MT
Max ReactionWith L.LSpan dislodgedMax LongWith L.LSpan dislodged
2 H.F.LMax ReactionWith L.LSpan dislodgedMax LongWith L.LSpan dislodged
Check for Cracked/Uncracked SectionLength of section = mmWidth of section = mm
Gross Area of section Ag = mm2
Gross M.O.I of section Igxx = mm4
Gross M.O.I of section Igyy = mm4
y
x x
y
Abutment section
Transformed sectional properties of section:Adopting
Modular ratio m =Cover
Dia of Bars =No of bars in tension face (longer) =No of bars in compression face =
400
20 2045
45
800
11909
1070 70
800
9527185.2
5.081E+11
1.126E+14
11908.982
383.24 19.22 7.00
449.99 0.00 0.00
468.37 90.69 171.18
525.19 78.98 132.36449.99
11909
PLAN : PIER SHAFT30687.077
535.12 71.46 164.18
800
16 6
12000
20 4520 45
0.00 0.00
458.44 98.20 139.36
383.24 19.22 7.00

Consulting Engineers Group Ltd., Jaipur_______________________________________________________________________________________
Bridge Design Report____________________________________________________________________________
No of bars in shorter direction =
Total bars in section =
Steel Area As = mm2
% of Steel = %y
x x
y
Asx = mm2
Asy = mm2
Area of concrete Ac = Ag - As = mm2
C.G of Steel placed on longer face = mmC.G of Steel placed on shorter face = mm
Transformed Area of Section Atfm = mm2
Transformed M.Itxx = Igxx + 2 m - 1 Asx ax2
= mm4
Zxx = M.Itxx = mm3
d/2Transformed M.Ityy = Igyy + 2 m - 1 Asy ay2
= mm4
Zyy = M.Ityy = mm3
d/2
Permissible stressesMinimum Gross Moment of inertia Imin = mm4
Area of section = mm2
r = mmEffective length of Abutment shaft (IRC:21-2000 cl: 306.2.1)
Abutment shaft height L = mEffective length Leff = mSlenderness ratio = <Type of member = 1
1 Short ColumnStress reduction coefficient (IRC:21-2000 cl: 306.4.2,3) 2 Long Column
β =
Permissible stresses : concrete
σcbc = N/mm2
σco = N/mm2
Tensile stress = N/mm2
Permissible stresses : Steel
σst = N/mm2
8.3333
6.25
0.61
200
7.424432.149 50
1
5.081E+11
9527185.2230.94011
6.187
5.35828E+11
1.34E+09
1.13773E+14
1.911E+10
9496498.2330
5884.5
9803368.9
325
5884.5
14137
1885
6
102
306870.3221

Consulting Engineers Group Ltd., Jaipur_______________________________________________________________________________________
Bridge Design Report____________________________________________________________________________
S.No Item DRY Case (Max Reaction)Loads and Moments With L.L Spandislodged
1 P t t
2 ML t-m t-m
3 MT t-m t-m
Actual(calculated) Stresses
4 σco,cal P/Atfm
5 σcbc,cal ML/Zxx
6 σcbc,cal MT/Zyy
7 σcbc,cal = 5 + 6
Permissible Stresses
8 σcbc
9 σco
Check for Minimum steel area mm2
Conc.Area Required for directstress(1)/(9)
0.8% of area required
0.3% of Ag
Governing steel mm2
Provided Steel area mm2
Check for safety of section
σco,cal + σcbc,cal
σco σcbc < 1 < 1
Check for Cracked /Uncracked section
σco,cal - σcbc,cal
Permissible Basic tensile stress in concreteSection to be designed as Uncracked
-0.61
449.99
0.00
0.00
28582
30687
0.0734
0.459
6.25
7199765759.8
28582
0
0
0
8.3333
0.4590106
-0.61Uncracked
6.25
0.533473125
0.085926767
0.619399891
8.33333333
14 30687.077
0.16166385
-0.0735507
12 28581.5557
13 28581.5557
10856185.71
11 6849.48568
535.12
71.46
164.18
0.54584916

Consulting Engineers Group Ltd., Jaipur_______________________________________________________________________________________
Bridge Design Report____________________________________________________________________________
S.No Item H.F.L Case (Max Reaction)Loads and Moments With L.L Spandislodged
1 P t t
2 ML t-m t-m
3 MT t-m t-m
Actual(calculated) Stresses
4 σco,cal P/Atfm
5 σcbc,cal ML/Zxx
6 σcbc,cal MT/Zyy
7 σcbc,cal = 5 + 6
Permissible Stresses
8 σcbc
9 σco
Check for Minimum steel area mm2
Conc.Area Required for directstress(1)/(9)
0.8% of area required
0.3% of Ag
Governing steel mm2
Provided Steel area mm2
Check for safety of section
σco,cal + σcbc,cal
σco σcbc < 1 < 1
Check for Cracked /Uncracked section
σco,cal - σcbc,cal
Permissible Basic tensile stress in concreteSection to be designed as Uncracked
-0.61 -0.61Uncracked
0.16843022 0.0802
-0.2888011 0.2438
13 28581.5557 28582
14 30687.077 30687
11 5995.13967 4905.5
12 28581.5557 28582
6.25 6.25
10749392.459 613183
0.766565695 0.1471658
8.33333333 8.3333
0.676977088 0.143504
0.089588606 0.0036618
171.18 7.00
0.477764624 0.3909261
468.37 383.24
90.69 19.22

Consulting Engineers Group Ltd., Jaipur_______________________________________________________________________________________
Bridge Design Report____________________________________________________________________________
S.No Item DRY Case ( Max Longitudinal moment)Loads and Moments With L.L Spandislodged
1 P t t
2 ML t-m t-m
3 MT t-m t-m
Actual(calculated) Stresses
4 σco,cal P/Atfm
5 σcbc,cal ML/Zxx
6 σcbc,cal MT/Zyy
7 σcbc,cal = 5 + 6
Permissible Stresses8 σcbc
9 σco
Check for Minimum steel area mm2
Conc.Area Required for directstress(1)/(9)
0.8% of area required0.3% of Ag
Governing steel mm2
Provided Steel area mm2
Check for safety of section
σco,cal + σcbc,cal
σco σcbc < 1 < < 1
Check for Cracked /Uncracked section
σco,cal - σcbc,cal
Permissible Basic tensile stress in concreteSection to be designed as Uncracked
525.19 449.99
78.98 0.00
132.36 0.00
0.535723049 0.459010645
0.589559756 0
0.069271979 0
0.658831735 0
8.3333333 8.3333333
6.25 6.25
10840302.51 719976.11
11 6722.4201 5759.808912 28581.556 28581.556
13 28581.556 28581.556
14 30687.077 30687.077
0.1647755 0.0734417
-0.123109 0.4590106
-0.61 -0.61Uncracked

Consulting Engineers Group Ltd., Jaipur_______________________________________________________________________________________
Bridge Design Report____________________________________________________________________________
S.No Item H.F.L Case (Max Longitudinal)Loads and Moments With L.L Spandislodged
1 P t t
2 ML t-m t-m
3 MT t-m t-m
Actual(calculated) Stresses
4 σco,cal P/Atfm
5 σcbc,cal ML/Zxx
6 σcbc,cal MT/Zyy
7 σcbc,cal = 5 + 6
Permissible Stresses8 σcbc
9 σco
Check for Minimum steel area mm2
Conc.Area Required for directstress(1)/(9)
0.8% of area required0.3% of Ag
Governing steel mm2
Provided Steel area mm2
Check for safety of section
σco,cal + σcbc,cal
σco σcbc < 1 < 1
Check for Cracked /Uncracked section
σco,cal - σcbc,cal
Permissible Basic tensile stress in concreteSection to be designed as Uncracked
458.44 383.24
98.20 19.22
139.36 7.00
0.467638513 0.390926109
0.73306372 0.143503963
0.072933819 0.00366184
0.805997538 0.147165803
8.3333333 8.3333333
6.25 6.25
10733509.26 613182.86
11 5868.0741 4905.462912 28581.556 28581.556
13 28581.556 28581.556
14 30687.077 30687.077
0.1715419 0.0802081
Uncracked
-0.34 0.2437603
-0.61 -0.61

Consulting Engineers Group Ltd., Jaipur_______________________________________________________________________________________
Bridge Design Report____________________________________________________________________________
H.F.L
G.L
11.200
12.300
12.300
0.15
0.3
240.628
0.5
234.441
233.941
234.441
240.928
0.5233.441
240.009
236.941
1
12.30
240.628
12.000

Consulting Engineers Group Ltd., Jaipur_______________________________________________________________________________________
Bridge Design Report____________________________________________________________________________
0.3
0.000
0.8
3.5
0.000
1.000
0.5
0.5

Consulting Engineers Group Ltd., Jaipur_______________________________________________________________________________________
Bridge Design Report____________________________________________________________________________
Dimensions of Substructure & Foundation
1 PedestalLength =Width = Volume =Height =
2 Pier capa Top uniform portion
Width =Depth = Volume = m3
Length =b Bottom trapezoidal portion
Width =Depth = Volume = m3
Length =Area at level m = x = m2
Area at level m = x = m2 = m312.3 1
12.300
12.3
0.7
12.30
0
3.69
0
240.628240.628
12.3
0
3.69
0.550
1.000.3
1 12
1.1
1.212
11.200.4
3.500
1
12

Consulting Engineers Group Ltd., Jaipur_______________________________________________________________________________________
Bridge Design Report____________________________________________________________________________
3 Pier shaftDimension of pier shaft in longitudinal direction =Dimension of pier shaft in Transverse direction R = Area = m2
C =Height of pier shaft =Height above Ground level = m Volume =Height below Ground level = m Volume =
= m3
H.F.L Case:Height above H.F.L = m Volume =Height below H.F.L = m Volume =
= m3
4 Pedestal at footing top Width =
0
34.8888
58.545423.6566
9.46
52.688152.6881
0.00
12.3
11.20
2.500
6.19
0.0005.57
3.687
0.80
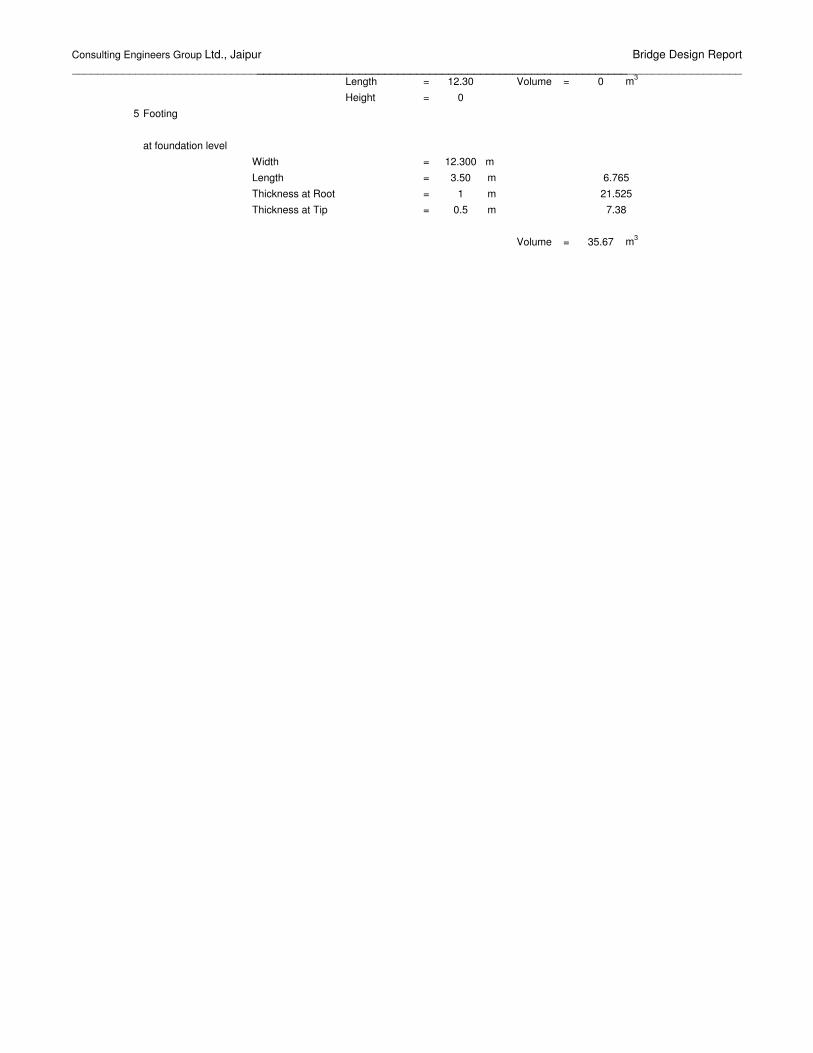
Consulting Engineers Group Ltd., Jaipur_______________________________________________________________________________________
Bridge Design Report____________________________________________________________________________
Length = Volume = m3
Height =5 Footing
at foundation levelWidth = mLength = mThickness at Root = mThickness at Tip = m
Volume = m3
0
21.5257.38
35.67
012.30
3.501
0.5
12.3006.765

Consulting Engineers Group Ltd., Jaipur_______________________________________________________________________________________
Bridge Design Report____________________________________________________________________________
Volume of Overburdden earth below ground levelTotal volume x x = m3
Net volume below Ground level = m3
Sectional Properties of Footing
A = x = m2
ZL = x = m3
ZT = x = m3
Forces and Moments due to Watercurrent Force
Intensity of water current pressure = k V2 kg/m2
Assuming 20 degree variation in water current direction
H.F.L
Top of footing
Foundation level
Deepest scour
Water current Pressure in Transverse direction
R.L k Pressure = k V2 COS 20
H.F.LPier Shaft bottomTop of footingBottom of footing
2.97093219233.441 1.5 0.0073296234.441 1.5234.441 0.66
88.253
25.113
52
240.009 0.66
0.04053
0.0001
3.500
3.500 25.215
12.300
3.500
12.300
12.300
1.30721016129.001003
52
91.3484
4.00
150.675
0
43.050
3.500
2.04167
5.625
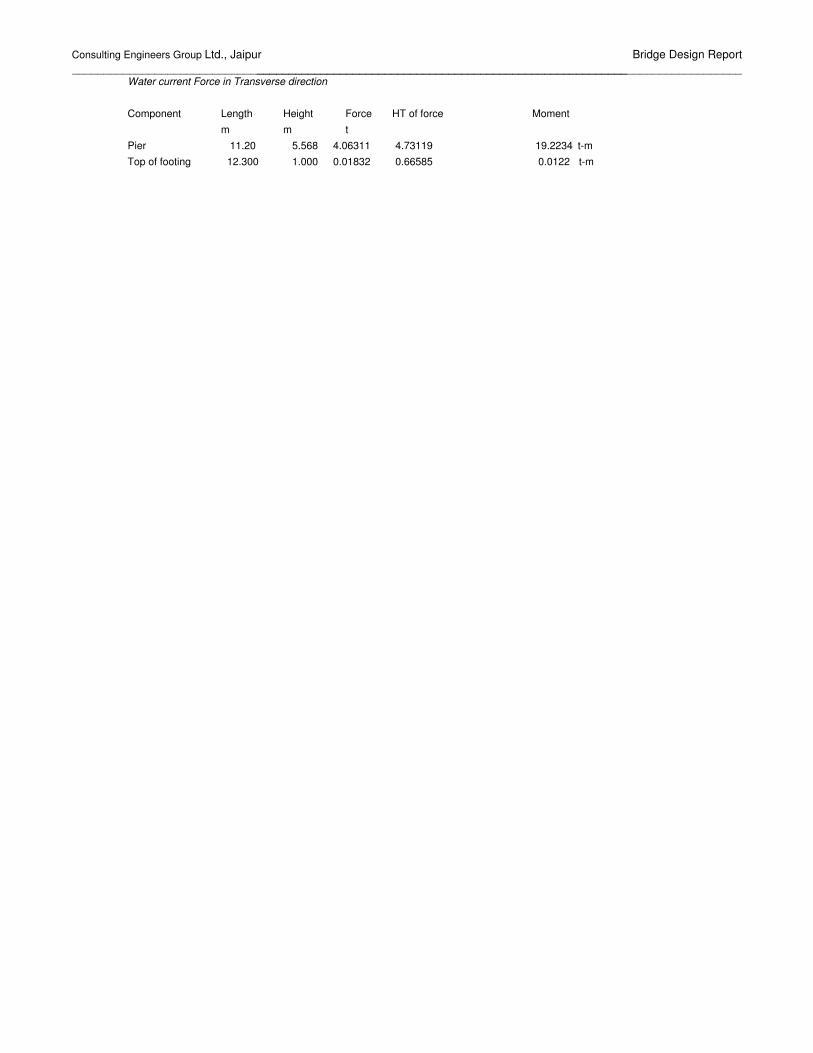
Consulting Engineers Group Ltd., Jaipur_______________________________________________________________________________________
Bridge Design Report____________________________________________________________________________
Water current Force in Transverse direction
Component Length Height Force HT of force Momentm m t
Pier t-mTop of footing t-m12.300 1.000 0.665850.01832
4.06311 4.731190.012219.223411.20 5.568

Consulting Engineers Group Ltd., Jaipur_______________________________________________________________________________________
Bridge Design Report____________________________________________________________________________
Water Current Pressure in Longtudinal direction
R.L k Pressure = k V2 SIN 20
H.F.LPier Shaft bottomTop of footingBottom of footingWater current Force in Longtudinal direction
Component Length Height Force HT of force Momentm m t
Pier t-mTop of footing t-m
Summary at Founding level F MLongitudinal direction t-mTransverse direction t-m
Summary at PierShaft bottom level F MLongitudina direction t-mTransverse direction t-m
4.73119
52
233.441 1.5 0.00266776
11.2012.300 1.000 0.00667 0.66585
5.568 1.47885
0.47578559234.441
6.99673388
4.081431.48552
19.23556427.00117281
4.06311 19.22336831.47885
1.5 1.08133089
240.009 0.66234.441 0.66
46.9525253
6.996730.00444

Consulting Engineers Group Ltd., Jaipur_______________________________________________________________________________________
Bridge Design Report____________________________________________________________________________
DESIGN OF PIER CAP
The pier cap is supported by pier shaft on all sides. Therefore pier cap has been designed as per clause 716.2.1 ,I.R.C:78-1987
The pier cap shall be reinforced with a total minimum of 1% steel in both directions as per clause 716.2.1 ,I.R.C:78-1987
Length of pier cap = 12 mwidth of pier cap = 1Depth of pier cap = 0.3
Rein forcement in the direction of length of pier
Area of steel required (mm2) = 1500 mm2 in each faceProviding steel by distributing equally at top& bottom = 8 16 dia
Area of steel provided (mm2) = 1608.495 mm2
Therefore providing 16dia 8 nos Reinforcement in the direction of width of pier
Therefore providing 12 dia stirrups @ 150mm c/c 8 nos 16 dia

Consulting Engineers Group Ltd., Jaipur_______________________________________________________________________________________
Bridge Design Report____________________________________________________________________________
REINFORCEMENT DETAILS OF PIER SHAFT
Design of pier wall
The pier wall on a conservative side has been analysed as a rectangular section (neglecting the semicircular cut &ease water on both end ) subjected to combined axial load and biaxial moments with the help of computer programme.The grade of concrete for pier shall be M30.The section of pier is checked conservatively at top of foundation.The minimum area of steel provided is 0.3% of gross crosssectional area as per IRC:21-2000
0.8
0.4 11.2 0.4
45 no of dia 20
6 no of16 dia
45 no of dia 20
Minimum Longitudinal Reinforcement required in pier shaft:
0.3% of the gross cross sectional area of pier shaft = 28800 mm2
Provided reinforcement = 30687.08 mm2
Transverse Reinforcement provided in pier shaft:(refer clause 306.3 IRC:21-2000)
Thickness of pier (least lateral dimension) = 800 mmDia of largest longitudinal bar = 20 mmdia of lateral ties required = 5
but >= 8 mm
The pitch of transverse reinforcement shall not exceed the lesser of the following
1 Least lateral dimension of pier = 800
2 twelve times dia of smallest longitudinal = 240reinforcement in pier shaft
3 = 300
Therefore allowable pitch of lateral ties = 240
Provide transverse reinforcement8 dia of lateral ties 150 mm c/c

Consulting Engineers Group Ltd., Jaipur_______________________________________________________________________________________
Bridge Design Report____________________________________________________________________________
SLENDERNESS EFFECT OF PIER WALL
Calculation of slenderness effect of pierwall:
height of pier shaft = h = 6.187
effective length of pier wall under service condition = 1.2 h = 7.4244(refer clause 306.1 IRC:21-2000)
Thickness of pier wall = 0.8
Radius of gyration = r d/sqrt(12) = 0.23094
Slenderness ratio of pier wall 1.2*h/r = 32.1486 < 50shortcolumn effect predominent
Since the pier shaft is acting as a short column, The reduction coefficientis 1I.e β 1
Reduced value of permissible stresses for steel and concrete are:
Grade of concrete = M30 30
concrete = 1020 t/m2
steel = 20400 t/m2
FOR ONE SPAN DISLODGED CONDITION :
Effective length of pier wall under service condition is 1.75*h = 10.82725
Slenderness ratio = 46.88337 < 50shortcolumn effect predominent
Since the pier shaft is acting as a short column, The reduction coefficientis 1I.e β 1
β = 1.5 - l/100r
= 1.031166Reduced value of permissible stresses for steel and concrete are:
Grade of concrete = M30 30
concrete = 1051.79 t/m2
steel = 21035.79 t/m2

Consulting Engineers Group Ltd., Jaipur Bridge Design Report _______________________________________________________________________________
INPUT FILE: 70RW.STD 1. STAAD SPACE 2. INPUT WIDTH 72 3. UNIT METER MTON 4. PAGE LENGTH 1000 5. UNIT METER MTON 6. JOINT COORDINATES 7. 1 0.02 0 0;2 0.4 0 0;3 10.4 0 0;4 10.78 0 0;5 10.82 0 0 8. 6 11.2 0 0;7 21.2 0 0;8 21.58 0 0 9. MEMBER INCIDENCES 10. 1 1 2 7 11. MEMBER PROPERTY CANADIAN 12. 1 TO 7 PRI YD 1.0 ZD 1.0 13. CONSTANT 14. E CONCRETE ALL 15. DENSITY CONCRETE ALL 16. POISSON CONCRETE ALL 17. SUPPORT 18. 2 3 6 7 PINNED 19. MEMBER RELEASE 20. 4 START FX FY FZ MX MY MZ 21. 4 END FX FY FZ MX MY MZ 22. DEFINE MOVING LOAD 23. TYPE 1 LOAD 8.0 2*12 4*17.0 DIS 3.96 1.52 2.13 1.37 3.05 1.37 24. LOAD GENERATION 175 25. TYPE 1 -13.4 0. 0. XINC .2 26. PERFORM ANALYSIS 27. ***MAX REA 28. LOAD LIST 78 29. PRINT SUPPORT REACTION SUPPORT REACTIONS -UNIT MTON METE STRUCTURE TYPE = SPACE ----------------- JOINT LOAD FORCE-X FORCE-Y FORCE-Z MOM-X MOM-Y MOM Z 2 78 0.00 16.89 0.00 0.00 0.00 0.00 3 78 0.00 32.11 0.00 0.00 0.00 0.00 6 78 0.00 39.42 0.00 0.00 0.00 0.00 7 78 0.00 11.58 0.00 0.00 0.00 0.00 30. ***MAX MOM 31. LOAD LIST 54 32. PRINT SUPPORT REACTION SUPPORT REACTIONS -UNIT MTON METE STRUCTURE TYPE = SPACE ----------------- JOINT LOAD FORCE-X FORCE-Y FORCE-Z MOM-X MOM-Y MOM Z 2 54 0.00 38.68 0.00 0.00 0.00 0.00 3 54 0.00 53.32 0.00 0.00 0.00 0.00 6 54 0.00 0.00 0.00 0.00 0.00 0.00 7 54 0.00 0.00 0.00 0.00 0.00 0.00 33. FINISH

Consulting Engineers Group Ltd., Jaipur Bridge Design Report ________________________________________________________________________________
INPUT FILE: CLASS A.STD 1. STAAD SPACE 2. INPUT WIDTH 72 3. UNIT METER MTON 4. PAGE LENGTH 1000 5. UNIT METER MTON 6. JOINT COORDINATES 7. 1 0.02 0 0;2 0.4 0 0;3 10.4 0 0;4 10.78 0 0;5 10.82 0 0 8. 6 11.2 0 0;7 21.2 0 0;8 21.58 0 0 9. MEMBER INCIDENCES 10. 1 1 2 7 11. MEMBER PROPERTY CANADIAN 12. 1 TO 7 PRI YD 1.0 ZD 1.0 13. CONSTANT 14. E CONCRETE ALL 15. DENSITY CONCRETE ALL 16. POISSON CONCRETE ALL 17. SUPPORT 18. 2 3 6 7 PINNED 19. MEMBER RELEASE 20. 4 START FX FY FZ MX MY MZ 21. 4 END FX FY FZ MX MY MZ 22. DEFINE MOVING LOAD 23. TYPE 1 LOAD 2*2.7 2*11.4 4*6.8 DIS 1.1 3.2 1.2 4.3 3 3 3 24. LOAD GENERATION 202 25. TYPE 1 -18.8 0. 0. XINC .2 26. PERFORM ANALYSIS 27. ***MAX REA 28. LOAD LIST 121 29. PRINT SUPPORT REACTION SUPPORT REACTIONS -UNIT MTON METE STRUCTURE TYPE = SPACE JOINT LOAD FORCE-X FORCE-Y FORCE-Z MOM-X MOM-Y MOM Z 2 121 0.00 3.20 0.00 0.00 0.00 0.00 3 121 0.00 25.00 0.00 0.00 0.00 0.00 6 121 0.00 6.53 0.00 0.00 0.00 0.00 7 121 0.00 13.87 0.00 0.00 0.00 0.00 30. ***MAX MOMENT 31. LOAD LIST 128 32. PRINT SUPPORT REACTION SUPPORT REACTIONS -UNIT MTON METE STRUCTURE TYPE = SPACE JOINT LOAD FORCE-X FORCE-Y FORCE-Z MOM-X MOM-Y MOM Z 2 128 0.00 1.75 0.00 0.00 0.00 0.00 3 128 0.00 3.64 0.00 0.00 0.00 0.00 6 128 0.00 26.60 0.00 0.00 0.00 0.00 7 128 0.00 9.80 0.00 0.00 0.00 0.00 33. FINISH

CEG.Ltd., Jaipur Bridge Design Report
Consultancy Services for Feasibility Study and Detailed Project Preparation for Proposed Orissa State Road Project
DESIGN OF SUPERSTRUCTURE

Consulting Engineers Group Ltd., Jaipur Bridge Design Report ________________________________________________________________________ For Design of superstructure of solid slab of 10.0 m refer MOST
STANDARD Drawing titled “STANDARD PLANS FOR 3.0 m TO 10.0 M
SPAN REINFORCED CEMENT CONCRETE (Solid slab superstructure
With & without footpaths)) FOR HIGHWAYS” Drg. No. SD/114.

CEG.Ltd., Jaipur Bridge Design Report
Consultancy Services for Feasibility Study and Detailed Project Preparation for Proposed Orissa State Road Project
BRIDGE AT CH:58+900

CEG.Ltd., Jaipur Bridge Design Report
Consultancy Services for Feasibility Study and Detailed Project Preparation for Proposed Orissa State Road Project
DESIGN OF SUBSTRUCTURE

Consulting Engineers Group Ltd., Jaipur_______________________________________________________________________________________
Bridge Design Report_____________________________________________________________________________________________
DESIGN DATA
Formation Level = 245.451 mGround Level = 239.785 mLowest Water Level = 235.785 mHighest Flood Level = 242.295 mFounding Level = 235.785 mThickness of bearing & pedestal = 0.300 mWidth of abutment = 12.000 mBouyancy factor = 1.0Gross Safe Bearing Capacity = 32.000 t/sqmDry density of earth = 1.800 t/cumSubmerged density of earth = 1.0 t/cumSaturated density of earth = 2.000 t/cumCoefficient of base friction = 0.5Span (c/c of exp. joint) = 21.600 mOverall Width of deck slab = 12.000 mWidth of carriageway = 11.000 mWidth of crash barrier = 0.500 mDepth of Superstructure = 2.100 mTkickness of wearing coat = 0.056 mUnit wt of concrete = 2.400 t/m3
no. of elastomeric bearing = 4size of elastomer brgs.( 500 x 250 x 50 mm )Grade of Concrete - M 25 25Grade of Reinforcement - Fe 415 (HYSD)Live Load -
-Permissible Compressive stress in Concrete - 850 t/m2
Permissible Tensile stress in Steel - 20400 t/m2
Modular ratio, m - 10factor, k - 0.294Lever arm factor, j - 0.902Moment of Resistance - 113 t/m2
Thickness of returnwall 0.5 m
COEFFICIENT OF ACTIVE EARTH PRESSURE
AS PER COULOMB'S THEORY, COEFFICIENT OF ACTIVE EARTH PRESSURE ISKa = SIN2 (α+φ)
SIN2�� SIN(���� 2
1 +
WHEREφ = ANGLE OF INTERNAL FRICTION OF EARTHα = ANGLE OF INCLINATION OF BACK OF WALLδ = ANGLE OF INTERNAL FRICTION BETWEEN WALL & EARTHι = ANGLE OF INCLINATION OF BACKFILL
HERE φ = 30 o = 0.524 Radianα = 90 o = 1.571 Radianδ = 20 o = 0.349 Radianι = 0 o = 0 Radian
Ka = 0.2973Therefore, Horizontal coefficient of Active earth pressure = KaCOSφ = φ = φ = φ = Kha = 0.2794
One Lane of 70R Wheeled + Class A3 lanes of Class A
SIN(� + �).SIN(� - �)SIN(� - �).SIN(� + �)

Consulting Engineers Group Ltd., Jaipur_______________________________________________________________________________________
Bridge Design Report_____________________________________________________________________________________________
HEIGHT OF ABUTMENT
Total height of abutment = Formation Level - Founding Level = 9.666 mFor DESIGN purpose, the height of abutment is considered as, say, = 9.670 m
CALCULATION OF ACTIVE EARTH PRESSURE
2water level 1
9.666
4 3
Active Earth Pressure Surcharge DRY. condition
a) Service Condition
1 LL Surcharge 1.0 1.200 0.67 77.78 4.833 375.892 0.5 9.666 4.86 281.92 4.060 1144.503 1.0 0.000 4.86 0.00 0.000 0.004 SubmgEarth 0.5 0.000 0.00 0.00 0.000 0.00
359.69 1520.38
b) Span Dislodge Condition
Net force = 359.69 - 77.78 = 281.92 tNet moment = 1520.38 - 375.89 = 1144.50 tm
H.F.L. condition
a) Service Condition
1 LL Surcharge 1.0 1.200 0.67 77.78 4.833 375.892 0.5 3.156 1.76 33.39 7.836 261.653 1.0 6.510 1.76 137.76 3.255 448.424 SubmgEarth 0.5 6.510 1.82 71.04 2.170 154.16
319.97 1240.12
b) Span Dislodge Condition
Net force = 319.97 - 77.78 = 242.20 tNet moment= 1240.12 - 375.89 = 864.23 tm
Force (t)
C.G. from
base (m)Force (t)
Moment (tm)
Moment (tm)
C.G. from
base (m)
Pressure (t/m2)
Height (m)
Height (m)Pressure
(t/m2)
Area factor
TOTAL
TOTAL
Element no.
Area factorComponent
Dry Earth
Element No.
Component
Dry Earth

Consulting Engineers Group Ltd., Jaipur_______________________________________________________________________________________
Bridge Design Report_____________________________________________________________________________________________
Forces & moments due to Abutment (Concrete) components
DRY Case :
Length Width Height Density Weight(m) (m) (m) (t/m3) (t)
1 1.0 2.200 12.00 0.500 2.40 31.68 1.100 34.852 0.5 2.200 12.00 0.700 2.40 22.18 1.467 32.523 1.0 3.600 12.00 0.500 2.40 51.84 5.200 269.574 0.5 3.600 12.00 0.700 2.40 36.29 4.600 166.925 1.0 1.200 12.00 6.910 2.40 238.81 2.800 668.676 0.5 0.000 12.00 6.910 2.40 0.00 2.200 0.007 stem rect 1.0 1.200 12.00 1.200 2.40 41.47 2.800 116.12
10 Cap 1.0 1.200 12.00 0.300 2.40 10.37 2.800 29.0311 Dirt Wall 1.0 0.300 12.00 2.106 2.40 18.20 3.250 59.148 0.5 3.600 1.00 0.700 2.40 3.02 5.800 17.54
8a 1.0 3.600 1.00 9.166 2.40 79.19 5.200 411.81533.05 1806.17
H.F.L. Case :
Length Width Height Density Weight Moment(m) (m) (m) (t/m3) (t) ,@ Toe
1 1.0 2.200 12.00 0.500 1.40 18.48 1.100 20.332 0.5 2.200 12.00 0.700 1.40 12.94 1.467 18.973 1.0 3.600 12.00 0.500 1.40 30.24 5.200 157.254 0.5 3.600 12.00 0.700 1.40 21.17 4.600 97.375 1.0 1.200 12.00 5.310 1.40 107.05 2.800 299.746 0.5 0.000 12.00 5.310 1.40 0.00 2.200 0.005 1.0 1.200 12.00 0.400 2.40 13.82 2.800 38.716 0.5 0.000 12.00 0.400 2.40 0.00 2.200 0.007 stem rect 1.0 1.200 12.00 1.200 1.40 24.19 2.800 67.74
10 Cap 1.0 1.200 12.00 0.30 2.40 10.37 2.800 29.0311 Dirt Wall 1.0 0.300 12.00 2.11 2.40 18.20 3.250 59.148 0.5 3.600 1.00 0.70 1.40 1.76 5.800 10.238c 1.0 3.600 1.00 5.31 1.40 26.76 5.200 139.168d 1.0 3.600 1.00 3.16 2.40 27.27 5.200 141.79
312.25 1079.46
Stem Wall
C.G.from toe (m)
Retutnwall
Returnwall
Moment about toe
C.G.from toe (m)
Area Factor
Component
Area Factor
TOTAL
Element No.
Element No.
Heel Slab
Toe Slab
Stem Wall
Component
Toe Slab
Stem Wall
Heel Slab
TOTAL

Consulting Engineers Group Ltd., Jaipur_______________________________________________________________________________________
Bridge Design Report_____________________________________________________________________________________________
Forces & moments due to Earth and LL surcharge
DRY Case : Self weight of Earth
Length Width Height Density Weight Moment(m) (m) (m) (t/m3) (t) `@ Toe
8 0.5 3.600 11.00 0.700 1.8 24.95 5.800 144.70
8a 1.0 3.600 11.00 8.466 1.800 603.46 5.200 3137.97628.40 3282.67
H.F.L Case :
Length Width Height Density Weight Moment(m) (m) (m) (t/m3) (t) `@Toe
8 0.5 3.600 11.000 0.7 1.000 13.86 5.800 80.398c 1.0 3.600 11.000 5.31 1.000 210.28 5.2 1093.448d DRY 1.0 3.600 11.000 3.156 1.800 224.96 5.200 1169.79
449.10 2343.61
L.L.SURCHARGE
Length Width Height Density Weight Moment`@ Toe
12 DRY EARTH 0.00 3.600 11.00 1.20 1.80 0.00 5.200 0.00
SUMMARY OF FORCES AND MOMENTS:
334.81 0.00 334.81 0.001161.45 1161.45 761.34 761.341496.27 1161.45 1096.16 761.34377.69 281.92 337.97 242.20937.48 0.00 937.48 0.00
5088.84 5088.84 3423.07 3423.076026.32 5088.84 4360.55 3423.074.028 4.38 3.98 4.500.528 0.881 0.478 0.996789.39 1023.76 524.00 758.37
141.48 0.00 141.48 0.001520.38 1144.50 1240.12 864.231661.86 1144.50 1381.60 864.23872.47 120.74 857.59 105.86
3.63 4.45 3.16 3.96 Safe against overturning
1.981 2.060 1.622 1.572 Safe against sliding
I.R.C 78-2000:cl706.3.4
TOTAL
DRY EARTH
Against overturning ( M / M2 )
Total Moment @ toe (M)Dist. of C.G. of V from toe Z = M/V
Net moment ( M2-M1) = ML
eccentricity (e = Z -b/2)
overturning moment due to
Factor of Safety
C.G.from toe (m)
Service Cond.
Span dislodged
Case. H.F.L.
C.G.from toe (m)
C.G.from toe
LOAD CASE
Vertical load from superstructure including LL surcharge (a)Vertical load from substructure (b)
Against sliding ( µ x V / H )
Total overturning Moment ( M2)
SATURATED SOIL
ElementNo
Area Factor
Component
TOTAL
ElementNo
Component
Area Factor
Span dislodged
Relieving Moment @ c/l base (M1)
ElementNo
Area Factor
Service Cond.
Total Vertical Load V = (a) + (b)Total Horizontal Force H =Moment @ toe due to (a)
Case. L.W.L.
Moment @ toe due to (b)
Horz. braking forceEarth Pressure
Component

Consulting Engineers Group Ltd., Jaipur_______________________________________________________________________________________
Bridge Design Report_____________________________________________________________________________________________
7.000 x 12.00 = 84.00 m2
ZL = 98.00 m3
ZT = 168.00 m3
CHECK FOR BASE PRESSURE:
(C) (A)
17.81 13.83 13.05 9.068.90 1.23 8.75 1.08 Earth Face Other Face
1.15 0.00 1.15 0.00 HEEL TOE
27.86 15.06 22.95 10.1425.57 15.06 20.65 10.1410.06 12.59 5.45 7.987.762 12.59 3.15 7.98 (D) (B)
Max.Base Pressure = 27.86 t/m2 < 32.00 Hence O.K. Min. Base Pressure = 3.15 t/m2 > 0 Hence O.K.
DESIGN OF TOE SLAB
d
d =1.115
0.71.20 d' = 1.20
0.760HEEL TOE 0.5
3.600 2.200
10.06BASE PRESSURE
19.21 25.1022.27
27.86d
(D) (P/A - ML/ZL - MT/ZT)
P/A ML/ZL
MT/ZT
(A) (P/A + ML/ZL + MT/ZT)(B) (P/A + ML/ZL - MT/ZT)(C) (P/A - ML/ZL + MT/ZT)
BASE SLAB
HFL CASESpan
dislodgedService Cond.
STEM WALL
Area of base (A) =
LWL CASESpan
dislodgedService Cond.
1.200
Base Pressure

Consulting Engineers Group Ltd., Jaipur_______________________________________________________________________________________
Bridge Design Report_____________________________________________________________________________________________
BENDING MOMENT AT FACE OF STEM
Element Area fact. force L.A. Moment1 1.0 2.640 1.100 2.9042 0.5 1.848 0.733 1.355
Rect. 1.0 -48.988 1.100 -53.886Trian. 0.5 -6.156 1.467 -9.028
-50.655 -58.655
Bending Moment at face of stem 58.655 tm/m
Effective depth required 0.721 m
Effective depth provided at face of stem 1.115 m
Area of Reinforcement required 2859 mm2
Minimum steel required 0.15% 1673 mm2 I.R.C 78-2000 Clause:707.2.7
Distribution steel 0.06% 669 mm2/mmainsteel 2859 mm2 12 φ , @ 150 C/C
753.9822Hence provide , 25 φ , @ 150 C/C
0 φ , @ 150 C/CThere is no tension below foundation, hence foundation will not have negative momentat top. However in reference to clause 707.2.8 of IRC: 78-2000, the requirement of reinforcement at top is follows.Minimum steel reinfocement as per above clause 250 mm2/m
provide 12 φ , @ 150 C/C753.9822
Check for Shear
SHEAR FORCE AT "d" FROM FACE OF STEM
Element Area fact. force L.A. Moment1 1.0 1.302 0.543 0.7062 0.5 0.911 0.362 0.330
Rect. 1.0 -27.237 0.543 -14.776Trian. 0.5 -1.497 0.723 -1.083
-26.521 -14.823
Effective depth ( d' ) at distence d 0.760 m
Shear force at critical section 26.5 t
Bending Moment at critical section 14.82 tm
tan β = 0.35
Net shear force S-M*tanβ/d' 19.78 t
Hence, Shear stress 26.02 t/m2
% of reinforcement 0.43
Permissible shear stress 29.33 t/m2 Hence O.K.
Downward loads
Loadings
Loadings
TOTAL
Upward base pressure
TOTAL
Upward Base pressure
Downward Loads

Consulting Engineers Group Ltd., Jaipur_______________________________________________________________________________________
Bridge Design Report_____________________________________________________________________________________________
DESIGN OF HEEL SLAB
0.7 HEEL TOE
0.5003.600 2.200
7.76216.92
16.9219.97 25.57
BENDING MOMENT AND SHEAR FORCE AT FACE OF STEM
Element Area fact. force L.A. moment3 1 4.320 1.800 7.7764 0.5 3.024 1.200 3.6298 0.5 4.536 2.400 10.886
1 54.860 1.800 98.7470.5 4.536 2.400 5.4431 6.852 1.800 12.333
Rect. 1 -27.944 1.800 -50.300Trian. 0.5 -16.483 1.200 -19.779
33.700 68.736
Bending Moment at face of stem 68.736 tm
Effective depth required 0.781 mEffective depth provided at face of stem 1.115 m
Area of Reinforcement required 3352.42 mm2
Minimum steel 0.15% 1672.50 mm2 I.R.C 78-2000 Clause:707.2.7
Distribution steel 0.06% 669.00 mm2/mmainsteel 3352.42 mm2
12 φ , @ 150 C/CHence provide , 25 φ , @ 125 C/C 753.9822
0 φ , @ 125 C/CThere is no tension below foundation, hence foundation will not have negative momentat top. However in reference to clause 707.2.8 of IRC: 78-2000, the requirement of reinforcement at top is follows.Minimum steel reinfocement as per above clause 250 mm2/m
provide 12 φ , @ 150 C/C753.9822
Loadings
Upward base pressure
TOTAL
Downward Loads.
1.200
8a

Consulting Engineers Group Ltd., Jaipur_______________________________________________________________________________________
Bridge Design Report_____________________________________________________________________________________________
Check for Shear ( Critical section at face of stem )
Shear force at face of stem 33.70 t
tan β = 0.194Bending moment at face of stem 68.736 tmNet shear force S-M*tanβ /d 21.71 t
Hence, Shear stress 19.47 t/m2
% of reinforcement 0.30
Permissible shear stress 25.10 t/m2 Hence O.K.
DESIGN OF STEM WALL0.30
1
5.710 8.4662
R.L. OF SECTION = 236.985 m
DRY Condition
a) Service Condition
1 1 0.603 58.8 4.058 238.502 0.5 4.081 198.8 3.409 677.49
18.00 14.600 262.80275.52 1178.79
= Stem + dirt wall + cap + Load from superstructure= 197.338 + 18.20 + 10.37 + 334.81= 560.716 t
Longitudinal Moment = 1178.787 t-mTransverse Moment = 192.801 t-m
b) Span Dislodged case
= Stem + dirt wall + cap + Load from superstructure= 197.338 + 18.20 + 10.37 + 0.00= 225.901 t
Longitudinal Moment = 915.987 t-mTransverse Moment = 0.000 t-m
SUMMARY OF FORCES AND MOMENTS IN ABUTMENT SHAFT
SurchargeActive Earth Pressure.
Element No. Area factor Height of E.P. diagram
Earth Pressure
HORIZONTAL FORCETOTAL
Total Vertical Load
Total Vertical Load
L.A.Moment
tm8.1168.116
Force

Consulting Engineers Group Ltd., Jaipur_______________________________________________________________________________________
Bridge Design Report_____________________________________________________________________________________________
H.F.L. condition
a) Service Condition
1 LL Surcharge 1.0 1.200 0.603 61.31 4.058 248.792 0.5 2.750 1.54 25.35 6.227 157.873 1.0 5.310 1.54 97.91 2.655 259.964 SubmgEarth 0.5 5.310 1.48 47.27 1.770 83.66
231.84 750.275
= Stem + dirt wall + cap + Load from superstructure= 120.874 + 18.20 + 10.37 + 334.81= 484.252 t
Longitudinal Moment = 1013.075 t-mTransverse Moment = 192.801 t-m
b) Span Dislodged case
= Stem + dirt wall + cap + Load from superstructure= 120.874 + 18.20 + 10.37 + 0.00= 149.437 t
Longitudinal Moment = 750.275 t-mTransverse Moment = 0.000 t-m
1.2 m2
For horizontal reinforcement area of steel required for the stem at the section/metre = 194.6531 mm2
Providing 12 ,@ 581.02 c/c say, 150 C/C as horizontal reinforcement
Cross Sectional area
Element no.
Moment (tm)
Dry Earth
TOTAL
Total Vertical Load
Height (m)Pressure
(t/m2)Force (t)
C.G. from
base (m)Component Area factor
Total Vertical Load

Consulting Engineers Group Ltd., Jaipur_______________________________________________________________________________________
Bridge Design Report_____________________________________________________________________________________________
Movement of Deck: Total Length of Bridge = m
= x = mmLongitudinal Force :
= x x mm= =
= MpaShear force per Bearing = x x x = N
= tTotal shear force for 4 bearings ( with 5 % increase )
= x 4 x = tRefer IRC : 6 clause 214.5.1.5;
% increase for variation in movement of spanTotal shear force = x = t
As per clause 214.2 of IRC:6, horizontal braking force Fh, for each span is:For Class A Single lane : Fh = x = t
For class 70R wheeled : Fh = x = t
For class A 3 lane Fh = x + x = tFor class 70R wheeled +class A 1 lane
Fh = x + x = tFor class A 3 lane
Longitudinal horizontal force = + = t Say, t
For class 70R wheeled +class A 1 laneLongitudinal horizontal force = + = t Say, t
Span dislodged conditionLongitudinal horizontal force = + = t Say, t
Summary of Longitudinal Forces :
Transverse eccentricityClass 70RW+ Class A
e =
21.6
6.358
50
100
13.28
0.2
0.2
55.40.05
14.0
1.376 1.05
55.4 11.080
5.780
13.850 6.358
0.2
0.2
1.1 5.780
Shear modulus 1.0
10
0.108
Size of bearingStrain in bearing 5.400
50
5000.108
250
1.376250 135001.0 500
18.02
2
22.770 6.358 17.7
0.000 6.358 6.358 7.02
0.00
0.0005 10800
Load Case
Span dislodged condition70R+class A 1lane
14.0018.00
Class A 3 lane
5.4
13.85
100 0.05 55.4 22.77
55.4
Longitudinal horizontal force (t)
20.000
77.033.095 36.87
6.841.6927
1.6927
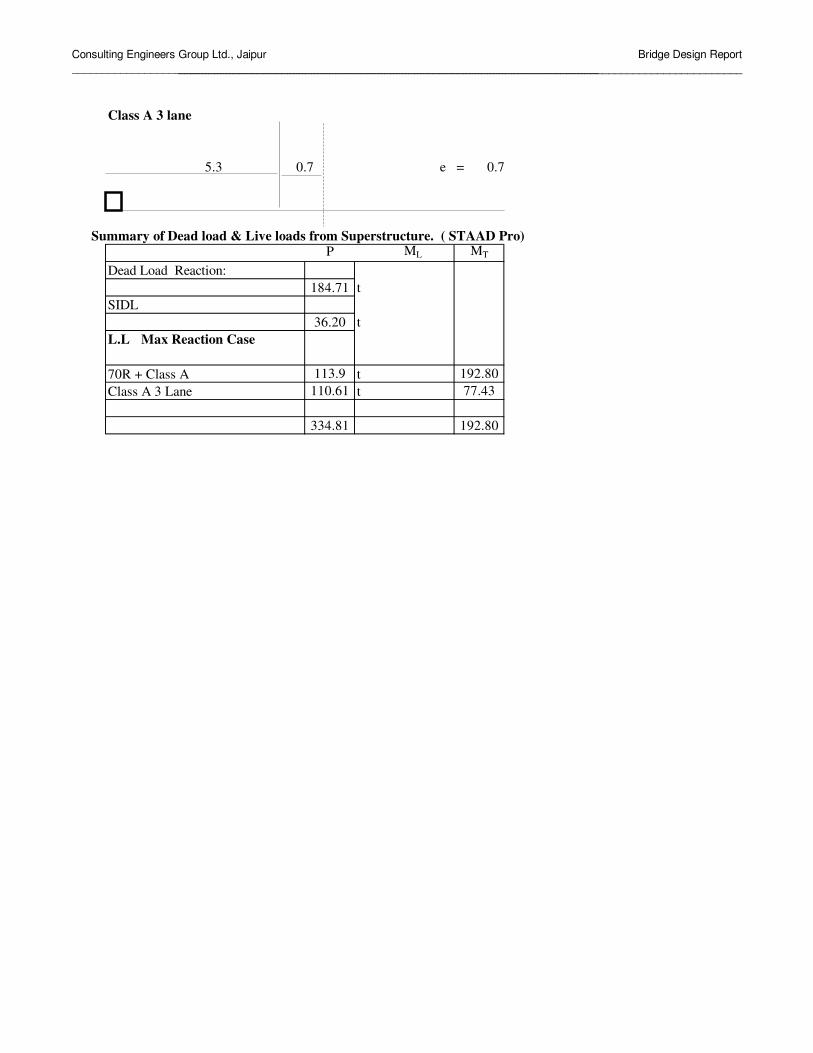
Consulting Engineers Group Ltd., Jaipur_______________________________________________________________________________________
Bridge Design Report_____________________________________________________________________________________________
Class A 3 lane
e =
Summary of Dead load & Live loads from Superstructure. ( STAAD Pro)P ML MT
Dead Load Reaction:t
SIDLt
L.L Max Reaction Case
70R + Class A tClass A 3 Lane t
192.8077.43
36.20
184.71
334.81
113.9110.61
192.80
5.3 0.7 0.7

Consulting Engineers Group Ltd., Jaipur_______________________________________________________________________________________
Bridge Design Report_____________________________________________________________________________________________
φφ
φ no.both sides
% Reinforcement provided = mm2
Summary of Loads at Abutment Shaft bottom :
1 DRY condition P ML MT
With L.LCheck for Cracked/Uncracked Section
Length of section = mmWidth of section = mm
Gross Area of section Ag = mm2
Gross M.O.I of section Igxx = mm4
Gross M.O.I of section Igyy = mm4
y
x x
y
Abutment section
Transformed sectional properties of section:Adopting
Modular ratio m =Cover
Dia of Bars =No of bars in tension face (longer) =No of bars in compression face =
No of bars in shorter direction =
Total bars in section =
16 9020 180
12000
1200 16 8
12000
PLAN : ABUTMENT SHAFT77861.232
560.72 1178.79 192.80
120001200
14400000
1.728E+12
1.728E+14
1200
12000
1070 68
20 16180
90
8
286
0 0

Consulting Engineers Group Ltd., Jaipur_______________________________________________________________________________________
Bridge Design Report_____________________________________________________________________________________________
Steel Area As = mm2
% of Steel = %y
x x
y
Asx = mm2
Asy = mm2
Area of concrete Ac = Ag - As = mm2
C.G of Steel placed on longer face = mmC.G of Steel placed on shorter face = mm
Transformed Area of Section Atfm = mm2
Transformed M.Itxx = Igxx + 2 m - 1 Asxax2
= mm4
Zxx = M.Itxx = mm3
d/2Transformed M.Ityy = Igyy + 2 m - 1 Asyay2
= mm4
Zyy = M.Ityy = mm3
d/2
Permissible stressesMinimum Gross Moment of inertia Imin = mm4
Area of section = mm2
r = mmEffective length of Abutment shaft (IRC:21-2000 cl: 306.2.1)
Abutment shaft height L = mEffective length Leff = mSlenderness ratio = <Type of member = 1
1 Short ColumnStress reduction coefficient (IRC:21-2000 cl: 306.4.2,3) 2 Long Column
β =Permissible stresses : concrete
σcbc = N/mm2
σco = N/mm2
Tensile stress = N/mm2
Permissible stresses : Steel
σst = N/mm2
778610.5407
525
5932
56549
1608.5
143221395305932
15100751
2.01392E+12
3.357E+09
1.73819E+14
2.897E+10
1.728E+12
14400000346.41016
9.42611.31132.653 50
1
8.3333
6.25
0.67
200

Consulting Engineers Group Ltd., Jaipur_______________________________________________________________________________________
Bridge Design Report_____________________________________________________________________________________________
S.No Item DRY CaseLoads and Moments With L.L
1 P t
2 ML t-m
3 MT t-m
Actual(calculated) Stresses
4 σco,cal P/Atfm
5 σcbc,cal ML/Zxx
6 σcbc,cal MT/Zyy
7 σcbc,cal = 5 + 6
Permissible Stresses8 σcbc
9 σco
Check for Minimum steel area mm2
Conc.Area Required for directstress(1)/(9)
0.8% of area required0.3% of Ag
Governing steel mm2
Provided Steel area mm2
Check for safety of section
σco,cal + σcbc,cal
σco σcbc < 1
Check for Cracked /Uncracked section
σco,cal - σcbc,cal
Permissible Basic tensile stress in concreteSection to be designed as
1178.79
192.80
0.37131642
10897145.09
11 7177.160712 43200
13 43200
14 77861.232
0.4888267
-3.207151-0.67
Cracked
6.25
3.511914483
0.066552525
3.578467008
8.3333333
560.72

Consulting Engineers Group Ltd., Jaipur_______________________________________________________________________________________
Bridge Design Report_____________________________________________________________________________________________
a
A B
b
X directionY direction
A' B'
Width of Solid return wall (a) =Width of Cantilever return wall =Avg Height of Solid return wall (b) =Height of Cantilever return at Tip =Height of Cantilever return at Root =Thickness of Solid Return at farther end =Thickness of Solid Return at Root =Thickness of Solid Return at bottom =Thickness of Solid Return at top =Thickness of Cantilever return =Unit wt of Soil = t/m3
Grade of concrete = M 30σcbc = t/m2
m =σst = t/m2
k =j =R = t/m2
Case (1) For uniformly distributed load over entire plate
a/b = For a/b = β1 = β2 =For a/b = β1 = β2 =
a/b = β1 =β2 = 0.460428
0.3980.632
0.4083485 0.427167
0.4083485 0.3750.5
0.3530.631
204000.3333330.888889151.1111
0.51.8
102010
0.50.50.50.5
8.8160.75
2.666667
2.666667
236.635
0.75
3.604.00
3.604.00
8.816
245.451

Consulting Engineers Group Ltd., Jaipur_______________________________________________________________________________________
Bridge Design Report_____________________________________________________________________________________________
Live Load Surcharge:q = x x = t/m2
σbmax = β1 x q x b2
t2
σamax = β2 x q x b2
t2
σbmax = x x = t/m2
For mm of widthZ = x = mm3
6 = m3
Hence Moment /m width along Y direction
MY /m width = x = t-m/mσamax = x x = t/m2
For mm of widthZ = x = mm3
6 = m3
Hence Moment /m width along X direction
MX /m width = x = t-m/mCase (2) For Triangular loading due to earth pressure
a/b = For a/b = β1 = β2 =For a/b = β1 = β2 =
a/b = β1 =β2 =
Earth pressure:q = x x = t/m2
σbmax = β1 x q x b2
t2
σamax = β2 x q x b2
t2
σbmax = x x = t/m2
For mm of widthZ = x = mm3
6 = m3
41666667
0.041667
0.251000
1000 250000
4.433743
0.2429474 4.433743 77.72 334.8774
0.161873
0.2794 1.8 8.816
0.5 0.328 0.200
0.4083485 0.242947
0.4083485 0.375 0.212 0.148
41666667
0.041667
86.386391 0.041667 3.599433
0.251000
1000 250000
0.4604283 0.603504 77.72 86.38639
0.041667
80.145837 0.041667 3.33941
0.2580.14584
10001000 250000 41666667
0.603504
0.427167 0.603504 77.72
0.2794 1.8 1.2

Consulting Engineers Group Ltd., Jaipur_______________________________________________________________________________________
Bridge Design Report_____________________________________________________________________________________________
Hence Moment /m width along Y direction
MY /m width = x = t-m/mσamax = x x = t/m2
For mm of widthZ = x = mm3
6 = m3
Hence Moment /m width along X direction
MX /m width = x = t-m/m
Total Moment in Solid Return /m height = t-m/mAlong X-direction
Total Moment in Solid Return /m width = t-m/mAlong Y-direction
Moment due to Cantilever Return:Moment due to earth pressure at face A - A '
M = x x x x x+ 0.5 x x 1.8 x x x+ 0.5 x x 1.8 x x X2 x dx x - X+ x 1.8 x x x X x dx x - X
= + + x + x
= t-m
Design of cantilever Return:Assuming 50 mm cover and 12 mm dia bars.Effective depth available = - 50 - 20 - 6 = 424 mm
M = R x b x d2
= x x = t-m
Ast = x 10^6 = mm2
x xAst/m = mm2/m
Provide 12 mm dia @ mm c/c providing mm2 on earth face.Provide 12 mm dia @ mm c/c providing mm2 on other face.
Along Horizantal direction.
150 753.9822180 628.3185
72.44307
1835.283
500
688.231
14.1106320400 0.888889 0.424
0.444444
4.004.00 2.00
1.8
4.00
14.11063
3.621024 1.13157 0.11176
0.666667 4.00
0.2794 1.2
0.2794 1.95
0.27940.2794
0.750.5625
12.8963
17.29263
151.1111 2.666667 0.179776
21.33333 0.653796 10.66667
2.00
41666667
0.041667
223.12485 0.041667 9.296869
0.251000
1000 250000
0.161873 4.433743 77.72 223.1249
334.8774 0.041667 13.95323

Consulting Engineers Group Ltd., Jaipur_______________________________________________________________________________________
Bridge Design Report_____________________________________________________________________________________________
Design of Solid Return:Moment due to Cantilever Return:Moment due to Earth pressure at face B-B '
M = x x x x x+ 0.5 x x 1.8 x x x+ 0.5 x x 1.8 x x X2 x dx x - X+ x 1.8 x x x X x dx x - X
= + + x + x
= t-m
Moment in Solid Return /m height = + = t-m/m
Moment in Solid Return /m width = = t-m/m
Design of face B-B '
Moment in Solid Return /m height = t-m/m
Assuming 50 mm cover and 20 mm dia bars.Effective depth available = - 50 - 20 - 10 = 420 mm
M = R x b x d2
= x x = t-m
Ast = x 10^6 = mm2
x xAst/m = mm2/m
Provide 20 mm dia @ mm c/c providing mm2 on earth face.Provide 12 mm dia @ mm c/c providing mm2 on other face.
Along Horizantal direction.Design of face A ' -B '
Moment in Solid Return /m width = t-m/m
Assuming 50 mm cover and 20 mm dia bars.Effective depth available = - 50 - 0 - 10 = 440 mm
M = R x b x d2
= x x = t-m
Ast = x 10^6 = mm2
x xAst/m = mm2/m
Provide 20 mm dia @ mm c/c providing mm2 on earth face.Provide 12 mm dia @ mm c/c providing mm2 on other face.
Along Vertical direction.
2167.359
130 2416.61130 869.9795
17.29263 2167.35920400 0.888889 0.44
17.29263
500
151.1111 1 0.1936 29.25511
2439.159
120 2617.994120 942.4778
18.57663 2439.15920400 0.888889 0.42
18.57663
500
151.1111 1 0.1764 26.656
10.13887 3.168396 0.11176 98.13333
50.07779
12.8963 50.07779 18.57663
0.2794 0.444444 7.600.2794 1.95 0.666667 7.60
5.60
0.653796 39.46667
0.2794 1.2 1.8 0.750.2794 0.5625 4.00
8.816
4.005.60
17.29263

Consulting Engineers Group Ltd., Jaipur_______________________________________________________________________________________
Bridge Design Report_____________________________________________________________________________________________
1. DESIGN FOR FORCES IN LONGITUDINAL DIRECTION
Active earth pressure Ka = 0.279384FOR NORMAL CASE, FA = 1.0unit wt of soil γ = 1.8
δ = 20clear span between return wall = 11.000 mwidth of return wall = 0.5Avg. cover to reinforcement. (FOR 2-3 LAYERS) = 0.150 mH (From formation level) = 8.466 m DESIGN FOR BENDING MOMENT
S.NO. UNITS 1H (FROM TOP) m 8.466
WIDTH OF RETURN AT THIS LEVEL m 3.600FORCE DUE TO EARTH PRESSURE t 101.610
MOMENT DUE TO EARTH PRESSURE tm 361.297FORCE DUE TO L.L. SURCHARGE t 28.805
MOMENT DUE TO L.L. SURCHARGE tm 121.932TOTAL MOMENT tm 483.229
DESIGN MOMENT tm 483.229REQUIRED EFFECTIVE DEPTH m 2.828
EFF. DEPTH AVAILABLE m 3.450AREA OF STEEL REQUIRED cm2 77.233
DIAMETER OF BAR PROVIDED mm 32TOTAL NO. OF BARS no. 12
cm2 96.51O.K.25.0
CHECK FOR SHEAR STRESS
SHEAR FORCE t 135.415SHEAR STRESS t/m2 78.502
Ast/bd x 100 % 0.448PERMISSIBLE SHEAR STRESS MPa 0.29PERMISSIBLE SHEAR STRESS t/m2 29.91
Asv/sv cm2/m 6.904
AREA OF STEEL PROVIDED

Consulting Engineers Group Ltd., Jaipur_______________________________________________________________________________________
Bridge Design Report_____________________________________________________________________________________________
Design of Abutment Cap:
As the cap is fully supported on the abutment.Minimum thickness of the cap required as per cl: 710.8.2 of IRC:78-2000 is 200 mm.However the thickness of abutment cap is = mmAssuming a cap thickness of = mmVolume of Abutment cap = x x
= m3
Quantity of steel = 1 % of volume= x
= m3
Quantity of steel to be provided at top = m3
Quantity of steel to be provided at bottom = m3
Top & bottom face:Quantity of steel to be provided in Longitudinal direction= m3
Assuming a clear cover of = mmLength of bar - = mArea of steel required in Longitudinal direction
= mm2
Provide 9 nos of bars mm dia at top & bottom face.= mm2
Transverse steel:Quantity of steel to be provided in Longitudinal direction= m3
Assuming a clear cover of = mmAssuming a dia of bar = mmLength of bar - = m
Volume of each stirrup = m3
no of stirrups required for m/length = nosRequired Spacing =
= mmProvide mm dia bar mm c/c stirrups throught in length of abutment cap.
mm2
3003000.3 1.20 12
4.32
1100
4.32
0.04320.02160.0216
0.010850
12.00 0.100 11.9
1.20 0.100 1.1
0.010811.9
907.563
12
0.00012
12
1017.88
0.010850
12 125904.779
81000
8125

Consulting Engineers Group Ltd., Jaipur_______________________________________________________________________________________
Bridge Design Report_____________________________________________________________________________________________
Design of Dirt wall:Dirt wall designed as a vertical cantilever.
F1
F2
Intensity for rectangular portion = x x = t/m2
F1 = x x = tIntensity for triangular portion = x x = t/m2
F2 = x x = tM1 = x = t-mM2 = x = t-mM1+ M2 = t-mTotal moment at base of dirt wall /m length = t-m/m
Thickness of dirtwall = mAssuming a clear cover on either face = mmVertical steel on earth face:dia of steel bar = mmAvailable effective depth = - - = mm
effective depth req = = mmx
Ast req = = mm2/mx x
Minimum steel = x x = mm2/m
Provide mm dia bar mm c/c as vertical steel at earth face.mm2/m
Disrtibution steel on earth face:dia of steel bar = mmAvailable effective depth = - - = mm
0.3M = x = t-m/mAst req = = mm2/m
x x
Minimum steel as per IRC:21-200 cl:305.10 = mm2/m
Governing steel at earth face = mm2/mProvide mm dia bar mm c/c as vertical steel at earth face.
mm2/mVertical steel on earth face
As per IRC:21-200 cl:305.10 All faces provide minimum steel of = mm2/mProvide mm dia bar mm c/c as vertical steel at earth face.
mm2/mDistribution steel:As per IRC:21-200 cl:305.10 All faces provide minimum steel of = mm2/mProvide mm dia bar mm c/c as vertical steel at earth face.
mm2/m392.6991
392.6991
25010 200
250
25010 200
10 200392.6991
250
0.774944 183.1309200 0.889 238
0.7749440.3 2.583147
300 50 12 238
12 200565.4867
12
595.4258
0.12100
300 1000 360
2.583147200 0.889 244
2.5831471.51 1000
130.7935
12300 50 6 244
30.997772.583147
0.350
16.94639 1.05 17.8445514.87046 0.88452 13.15322
1.176833 12.00 2.11 14.87046
0.2794 2.00 2.11 1.176833
0.67056
2.11
0.67056 12.00 2.11
0.2794 2.00 1.2
16.94639

Consulting Engineers Group Ltd., Jaipur_______________________________________________________________________________________
Bridge Design Report_____________________________________________________________________________________________
7.600 0.3 0.900245.451
0.7511
2.456
slop V1:H 1.52.667 242.995
10 0.3008d 0.000
1.20 242.6954.000 0.00
0.000 242.695
H.F.L 242.2953.600
9b8.466
5.710
8c
L.W.L235.785
5 9a8a
6
236.985 1.20 0.00 236.985
0.700 8 9 0.7004 2 Founding
7 Lvl235.785
0.500 3 1 0.500
3.600 1.200 2.200
7.00

Consulting Engineers Group Ltd., Jaipur Bridge Design Report ________________________________________________________________________________
INPUT FILE: 70RW.STD 1. STAAD SPACE 2. INPUT WIDTH 72 3. UNIT METER MTON 4. PAGE LENGTH 1000 5. UNIT METER MTON 6. JOINT COORDINATES 7. 1 0.00 0 0;2 0.3 0 0;3 21.3 0 0;4 21.6 0 0 8. MEMBER INCIDENCES 9. 1 1 2 3 10. MEMBER PROPERTY CANADIAN 11. 1 TO 3 PRI YD 1.0 ZD 1.0 12. CONSTANT 13. E CONCRETE ALL 14. DENSITY CONCRETE ALL 15. POISSON CONCRETE ALL 16. SUPPORT 17. 2 3 PINNED 18. DEFINE MOVING LOAD 19. TYPE 1 LOAD 8.0 2*12 4*17.0 DIS 3.96 1.52 2.13 1.37 3.05 1.37 20. LOAD GENERATION 175 21. TYPE 1 -13.4 0. 0. XINC .2 22. PERFORM ANALYSIS 23. LOAD LIST 109 24. PRINT SUPPORT REACTION SUPPORT REACTION SUPPORT REACTIONS -UNIT MTON METE STRUCTURE TYPE = SPACE ----------------- JOINT LOAD FORCE-X FORCE-Y FORCE-Z MOM-X MOM-Y MOM Z 2 109 0.00 22.97 0.00 0.00 0.00 0.00 3 109 0.00 77.03 0.00 0.00 0.00 0.00 ************** END OF LATEST ANALYSIS RESULT ************** 25. FINISH *********** END OF THE STAAD.Pro RUN ***********

Consulting Engineers Group Ltd., Jaipur Bridge Design Report ________________________________________________________________________________
INPUT FILE: CLASS A.STD 1. STAAD SPACE 2. INPUT WIDTH 72 3. UNIT METER MTON 4. PAGE LENGTH 1000 5. UNIT METER MTON 6. JOINT COORDINATES 7. 1 0.00 0 0;2 0.3 0 0;3 21.3 0 0;4 21.6 0 0 8. MEMBER INCIDENCES 9. 1 1 2 3 10. MEMBER PROPERTY CANADIAN 11. 1 TO 3 PRI YD 1.0 ZD 1.0 12. CONSTANT 13. E CONCRETE ALL 14. DENSITY CONCRETE ALL 15. POISSON CONCRETE ALL 16. SUPPORT 17. 2 3 PINNED 18. DEFINE MOVING LOAD 19. TYPE 1 LOAD 2*2.7 2*11.4 4*6.8 DIS 1.1 3.2 1.2 4.3 3 3 3 20. TYPE 2 LOAD 4*6.8 2*11.4 2*2.7 DIS 3 3 3 4.3 1.2 3.2 1.1 21. *LOAD GENERATION 202 22. *TYPE 1 -18.8 0. 0. XINC .2 23. LOAD GENERATION 202 24. TYPE 2 -18.8 0. 0. XINC .2 25. PERFORM ANALYSIS 26. LOAD LIST 130 27. PRINT SUPPORT REACTION SUPPORT REACTION SUPPORT REACTIONS -UNIT MTON METE STRUCTURE TYPE = SPACE ----------------- JOINT LOAD FORCE-X FORCE-Y FORCE-Z MOM-X MOM-Y MOM Z 2 130 0.00 13.13 0.00 0.00 0.00 0.00 3 130 0.00 36.87 0.00 0.00 0.00 0.00 28. FINISH
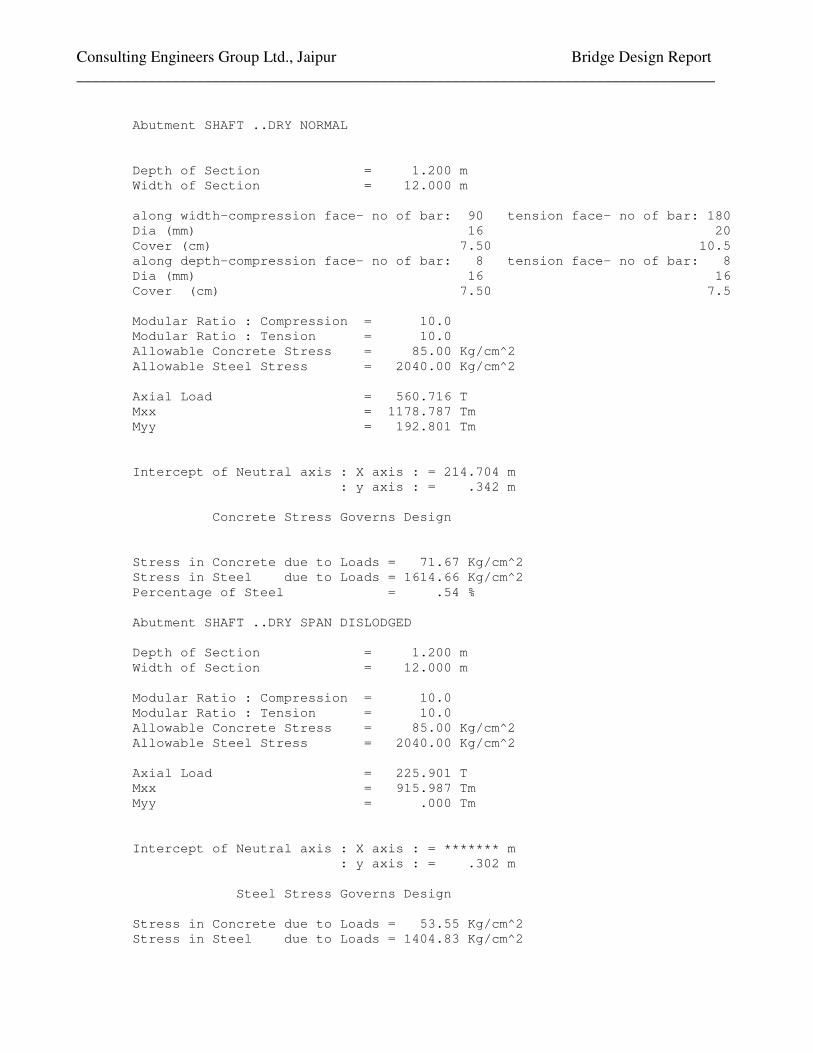
Consulting Engineers Group Ltd., Jaipur Bridge Design Report ________________________________________________________________________________ Abutment SHAFT ..DRY NORMAL Depth of Section = 1.200 m Width of Section = 12.000 m along width-compression face- no of bar: 90 tension face- no of bar: 180 Dia (mm) 16 20 Cover (cm) 7.50 10.5 along depth-compression face- no of bar: 8 tension face- no of bar: 8 Dia (mm) 16 16 Cover (cm) 7.50 7.5 Modular Ratio : Compression = 10.0 Modular Ratio : Tension = 10.0 Allowable Concrete Stress = 85.00 Kg/cm^2 Allowable Steel Stress = 2040.00 Kg/cm^2 Axial Load = 560.716 T Mxx = 1178.787 Tm Myy = 192.801 Tm Intercept of Neutral axis : X axis : = 214.704 m : y axis : = .342 m Concrete Stress Governs Design Stress in Concrete due to Loads = 71.67 Kg/cm^2 Stress in Steel due to Loads = 1614.66 Kg/cm^2 Percentage of Steel = .54 % Abutment SHAFT ..DRY SPAN DISLODGED Depth of Section = 1.200 m Width of Section = 12.000 m Modular Ratio : Compression = 10.0 Modular Ratio : Tension = 10.0 Allowable Concrete Stress = 85.00 Kg/cm^2 Allowable Steel Stress = 2040.00 Kg/cm^2 Axial Load = 225.901 T Mxx = 915.987 Tm Myy = .000 Tm Intercept of Neutral axis : X axis : = ******* m : y axis : = .302 m Steel Stress Governs Design Stress in Concrete due to Loads = 53.55 Kg/cm^2 Stress in Steel due to Loads = 1404.83 Kg/cm^2

Consulting Engineers Group Ltd., Jaipur Bridge Design Report ________________________________________________________________________________ Percentage of Steel = .54 % Abutment SHAFT ..HFL NORMAL Depth of Section = 1.200 m Width of Section = 12.000 m Modular Ratio : Compression = 10.0 Modular Ratio : Tension = 10.0 Allowable Concrete Stress = 85.00 Kg/cm^2 Allowable Steel Stress = 2040.00 Kg/cm^2 Axial Load = 484.252 T Mxx = 1013.075 Tm Myy = 192.801 Tm Intercept of Neutral axis : X axis : = 185.513 m : y axis : = .344 m Concrete Stress Governs Design Stress in Concrete due to Loads = 61.88 Kg/cm^2 Stress in Steel due to Loads = 1388.68 Kg/cm^2 Percentage of Steel = .54 % Abutment SHAFT ..HFL SPAN DISLODGED Depth of Section = 1.200 m Width of Section = 12.000 m Modular Ratio : Compression = 10.0 Modular Ratio : Tension = 10.0 Allowable Concrete Stress = 85.00 Kg/cm^2 Allowable Steel Stress = 2040.00 Kg/cm^2 Axial Load = 149.437 T Mxx = 750.275 Tm Myy = .000 Tm Intercept of Neutral axis : X axis : = ******* m : y axis : = .296 m Steel Stress Governs Design Stress in Concrete due to Loads = 43.71 Kg/cm^2 Stress in Steel due to Loads = 1179.01 Kg/cm^2 Percentage of Steel = .54 %

CEG.Ltd., Jaipur Bridge Design Report
Consultancy Services for Feasibility Study and Detailed Project Preparation for Proposed Orissa State Road Project
DESIGN OF SUPERSTRUCTURE

Consulting Engineers Group Ltd., Jaipur Bridge Design Report ________________________________________________________________________ For Design of Superstructure of RCC Girder 21.0 m span refer MOST
STANDARD Drawing titled “STANDARD PLANS FOR HIGHWAY
BRIDGES (R.C.C T-beam and Slab Superstructure)” Drg. No. SD/220 to
SD/226.