Growth Mechanism and Structure Evolution during Nucleation ...
Ultrasonics Sonochemistry 38 (2017) 256–270
Contents lists available at ScienceDirect
Ultrasonics Sonochemistry
journal homepage: www.elsevier .com/ locate/ul tson
Structural evolution, growth mechanism and photoluminescenceproperties of CuWO4 nanocrystals
http://dx.doi.org/10.1016/j.ultsonch.2017.03.0071350-4177/� 2017 Elsevier B.V. All rights reserved.
⇑ Corresponding author.E-mail address: [email protected] (L.S. Cavalcante).
E.L.S. Souza a, J.C. Sczancoski b, I.C. Nogueira c, M.A.P. Almeida d, M.O. Orlandi e, M.S. Li f, R.A.S. Luz a,M.G.R. Filho a, E. Longo e, L.S. Cavalcante a,⇑a PPGQ-CCN-GERATEC, Universidade Estadual do Piauí, Rua: João Cabral, N. 2231, P.O. Box 381, 64002-150 Teresina, PI, BrazilbDQ-UFSCar, Universidade Federal de São Carlos, P.O. Box 676, São Carlos, SP 13565-905, Brazilc ICE-Universidade Federal do Amazonas, Av. Rodrigo Otávio Japiim, P.O. Box 670, 69077-000 Manaus, AM, BrazildCCT-Universidade Federal do Maranhão, P.O. Box 322, 65080-805 São Luís, MA, BrazileDepartamento de Físico-Química, Universidade Estadual Paulista, 14800-060 Araraquara, SP, Brazilf IFSC-Universidade de São Paulo, P.O. Box 369, 13560-970 São Carlos, SP, Brazil
a r t i c l e i n f o a b s t r a c t
Article history:Received 31 January 2017Received in revised form 6 March 2017Accepted 6 March 2017Available online 8 March 2017
Keywords:CuWO4 crystalsSonochemistryClustersRaman spectroscopyTEM imagesPhotoluminescence properties
Copper tungstate (CuWO4) crystals were synthesized by the sonochemistry (SC) method, and then, heattreated in a conventional furnace at different temperatures for 1 h. The structural evolution, growthmechanism and photoluminescence (PL) properties of these crystals were thoroughly investigated. X-ray diffraction patterns, micro-Raman spectra and Fourier transformed infrared spectra indicated thatcrystals heat treated and 100 �C and 200 �C have water molecules in their lattice (copper tungstate dihy-drate (CuWO4�2H2O) with monoclinic structure), when the crystals are calcinated at 300 �C have the pres-ence of two phase (CuWO4�2H2O and CuWO4), while the others heat treated at 400 �C and 500 �C have asingle CuWO4 triclinic structure. Field emission scanning electron microscopy revealed a change in themorphological features of these crystals with the increase of the heat treatment temperature.Transmission electron microscopy (TEM), high resolution-TEM images and selected area electron diffrac-tion were employed to examine the shape, size and structure of these crystals. Ultraviolet–Visible spectraevidenced a decrease of band gap values with the increase of the temperature, which were correlatedwith the reduction of intermediary energy levels within the band gap. The intense photoluminescence(PL) emission was detected for the sample heat treat at 300 �C for 1 h, which have a mixture ofCuWO4�2H2O and CuWO4 phases. Therefore, there is a synergic effect between the intermediary energylevels arising from these two phases during the electronic transitions responsible for PL emissions.
� 2017 Elsevier B.V. All rights reserved.
1. Introduction published papers have reported on the structural features,
Hydrous copper tungstate (CuWO4�xH2O) crystals can be natu-rally found as a mineral, presenting colors from bright yellowishto green [1]. This mineral, also known as ‘‘Cuprotungstite”, has beendiscovered and analyzed by Whitney T. Schaller in 1892. However,the same designation also is adopted for copper tungstate(CuWO4), i.e., an oxide material belongs to wolframite sub-group[2]. Whitney T. Schaller verified that CuWO4�xH2O crystals arecomposed of two water molecules; therefore, it was posteriorlydescribed as copper tungstate dihydrate (CuWO4�2H2O) [1,2]. Ingeneral, CuWO4�2H2O crystals are easily produced by the reactionbetween copper nitrate and sodium tungstate precursors in aque-ous solutions, using specific pH and temperature conditions. Some
morphological aspects and electronic properties of this tungstate[3–12]. Particularly, some of these studies [3–7]. consider theCuWO4�2H2O as a raw or precursor precipitate formed during theinitial synthesis stages due to its favorable thermodynamic condi-tion [8–12].
In past years, CuWO4 crystals were obtained by several tradi-tional methods, mainly including oxide mixture or solid state reac-tion [13–17], flux growth technique [18,19], melting at a hightemperature [20], and Czochralski process [21]. Generally, thesetechniques require high temperatures, long processing times andsophisticated equipment with high maintenance costs [22]. Onthe other hand, to overcome these drawbacks, simple methodswere developed for the preparation of CuWO4 micro- andnanocrystals, such as precipitation reaction [23–26], polyol-mediated at low-temperature [27], hydrothermal conventional[28,29], and microwave-assisted synthesis [30].
E.L.S. Souza et al. / Ultrasonics Sonochemistry 38 (2017) 256–270 257
The wolframite-type monoclinic structure is commonly foundin tungstates composed of transition metals belonging to thefourth period of the periodic table (MnWO4 [31], FeWO4 [32],CoWO4 [33], NiWO4 [34], and ZnWO4 [35]). The only exception isCuWO4, which crystallizes in a triclinic structure at room temper-ature [36–38]. In addition, CuWO4 crystals exhibit a phase transi-tion from triclinic structure at low-pressure to monoclinicstructure at high-pressure (9.9 GPa) [39]. Therefore, whensubjected to extreme pressure environments, the researchers[40–43] have reported that these crystals have a monoclinic struc-ture characterized by space group (P2/c), point group symmetry(C4
2h) and two molecular formula units per unit cell (Z = 2)[43,44]. On the other hand, under low-pressure conditions at roomtemperature, these crystals exhibit a triclinic structure with spacegroup (P�1), point group symmetry (Ci) and two molecular formulaunits per unit cell (Z = 2) [45–47]. Moreover, CuWO4 crystals withtriclinic structure are influenced by Jahn-Teller effect due to thepresence of Cu2+ ions, which promote distortions on octahedral[CuO6] clusters. Consequently, this phenomenon gives rise to a d-orbital splitting, in which the degeneracy ofr-antibonding orbitalsis broken [48,49]. According to the literature [50,51], the Pauliexclusion principle can provide that the Cu2+ ions have an electronwith unpaired spin occupying the dx
2�y2 orbital, indicating that this
electronic level could produce a mid-gap band state. The additional
stabilization is greater in a Jahn–Teller-elongated Cu2+ ions (where3dz2 contains two electrons) [52].
Currently, the scientific studies on the electronic properties ofpure and doped CuWO4 have been mainly focused on the photocat-alytic (PC) degradation of organic dyes (Rhodamine B, eosin yellowdye and methylene blue) under ultraviolet and visible light [53–55], magnetic [56–59], photoelectrochemical water splitting [60–64], visible and solar-assisted water splitting [65,66], photoanodefor solar water oxidation [67,68], electrical transport [69], and pho-toluminescence (PL) [24,53,70]. An important point to be consid-ered is that the theoretical studies [16,71–75], performed bymeans of ab initio calculations based on the density-functional the-ory (DFT) for the electronic structure of CuWO4 crystals, haveshown that the conduction band (CB) of this oxide is composedof 3d orbitals (Cu atoms) and 5d orbitals (W atoms), while thevalence band (VB) is formed of 2p orbitals (O atoms).
Therefore, the aim of the present study was to investigate thestructural, morphological and optical properties of CuWO4 crystals.These crystals were initially synthesized by the sonochemistry (SC)method (30 min), and then, heat treated in a conventional furnaceat different temperatures for 1 h. A crystal growth mechanism wasproposed in order to explain the evolution of particle shape/sizewith the increase of the heat treatment temperature. Finally, theoptical properties of these crystals were investigated byUltraviolet-Visible spectroscopy and PL measurements at roomtemperature.
2. Experimental details
2.1. Synthesis of CuWO4 crystals
The synthesis of CuWO4 crystals is described as follows:1 � 10�3 mols of sodium tungstate dihydrate (Na2WO4�2H2O;99.5% purity, Sigma-Aldrich) and 1 � 10�3 mols of copper nitratetrihydrate [Cu(NO3)2�3H2O; 99% purity, Sigma-Aldrich] were sepa-
rately placed in two plastic tubes (Falcon – capacity of 50 mL) anddissolved with deionized water. The two solutions (pH = 6) weretransferred into a beaker (250 mL) and ultrasonicated for 30 minby means of an ultrasonic cleaner (model CPX-1800H, Branson –USA) at frequency of 42 kHz. These suspensions containing brightgreen precipitates were seven times washed (water and acetone)and centrifuged (8500 rpm for 10 min), and then, dried in a singlehot plate (60 �C for 30 min). Finally, the obtained CuWO4�2H2Oprecipitates were heat treated at different temperatures (100 �C,200 �C, 300 �C, 400 �C, and 500 �C for 1 h), maintaining a heatingrate of 5 �C.min�1. The increase in the heat treatment temperaturewas employed to monitor the crystallization process of singleCuWO4 phase.
CuWO4�2H2O crystals were synthesized via chemical reactionbetween hexaaquacopper(II) complex ion ([Cu(H2O)6]2+) and tung-state ions (WO2�
4 ) in aqueous solution. These ions were originatedby means of the complete dissolution of their respective chemicalprecursors [Na2WO4�2H2O and Cu(NO3)2�3H2O], as described inEqs. (1)--(3):
Na2WO4 � 2H2OðsÞ !H2O 2NaþðaqÞ þWO2�4ðaqÞ þ 2H2O ð1Þ
CuðNO3Þ2:3H2OðsÞ �!H2O ½CuðH2OÞ6�2þ þ 2NO�3ðaqÞ þ 3H2O ð2Þ
The heat treatment performed at low temperatures (from 100 �C to200 �C) was responsible for the partial removal of water moleculesbelonging to CuWO4�2H2O structure, according to Eq. (4):
CuWO4 � 2H2OðsÞ . . . x:H2OðadsÞ �!�100�Cand200�C=1hCuWO4:xH2OðsÞ þ 2H2OðgÞ
ð4ÞThe water removal (dehydration process) continues at low tem-
peratures (�300 �C); however, there is a mixture of CuWO4�xH2Oand CuWO4 phases, as proposed in Eq. (5):
2CuWO4 � xH2OðsÞ �!�300�C=1hCuWO4 � xH2OðsÞ þ CuWO4ðsÞ ð5Þ
The formation of single CuWO4 crystals occurs at temperaturesabove 400 �C, according to Eq. (6):
CuWO4 � xH2OðsÞ þ CuWO4ðsÞ �!�400�Cand500�C=1h2CuWO4ðsÞ þ xH2OðgÞ
ð6Þ
2.2. Characterizations of CuWO4 crystals
CuWO4 nanocrystals were structurally characterized by X-raydiffraction (XRD) with a DMax/2500PC diffractometer (Rigaku,Japan), using Cu-Ka radiation (k = 0.15406 nm). Data were col-lected over 2h ranging from 10� to 70�, employing a step scan of2�.min�1. Rietveld analysis was performed over 2h ranging from5� to 120�, at a scan step and step size of 1�.min�1 and 0.02�,respectively. Thermogravimetric analysis (TGA) and differentialthermal analysis (DTA) were carried out in a STA 409 thermal ana-lyzer (Netzsch, Germany). These thermal measurements were per-formed from room temperature to 550 �C under synthetic air flow(15 cm3.min�1), maintaining a heating rate of 10 �C.min�1. MicroRaman (M-Raman) spectra were recorded using a LabRAM HR800 spectrometer (Horiba Jobin Yvon, France). These spectra were
258 E.L.S. Souza et al. / Ultrasonics Sonochemistry 38 (2017) 256–270
obtained from 50 cm�1 to 1000 cm�1 with an Ar+ laser of 514.5 nm(model CCD DU420AOE325), maintaining a maximum outputpower of 6 mW. A 50 lm lens was used to prevent sample over-heating. Fourier Transform infrared (FT-IR) spectra were performedfrom 200 cm�1 to 1000 cm�1 with a Bomem–Michelson spec-trophotometer operated in transmittance mode (model MB-102).Ultraviolet–Visible (UV–Vis) spectra were taken using a Cary 5Gspectrophotometer (Varian, USA) operated in diffuse reflectancemode. The morphological features were examined by using a Supra35-VP field-emission scanning electron microscope (FE-SEM) (CarlZeiss, Germany) operated at 10 kV, and with a CM200 transmissionelectron microscope (TEM) (Philips/FEI, Netherlands) operated at200 kV. The shape, average size and crystal growth directions ofCuWO4 crystals were determined using the selected-area electrondiffraction (SAED) and high resolution (HR)-TEM, respectively. Thesamples for TEM and HR-TEM were prepared depositing(dropwise) dilute suspensions of CuWO4 crystals in acetone on300-mesh Cu grids. The photoluminescence (PL) spectra wereconducted at room temperature by using a Monospec 27monochromator (Thermal Jarrel Ash, USA) coupled to a R955photomultiplier (Hamamatsu Photonics, Japan). A krypton-ionlaser (Coherent Innova 90 K; k = 350 nm) was used as an excitationsource, maintaining a maximum output power at 500 mW. Thelaser beam passed through an optical chopper, so that the maxi-mum power incident on the sample was maintained at 14 mW.
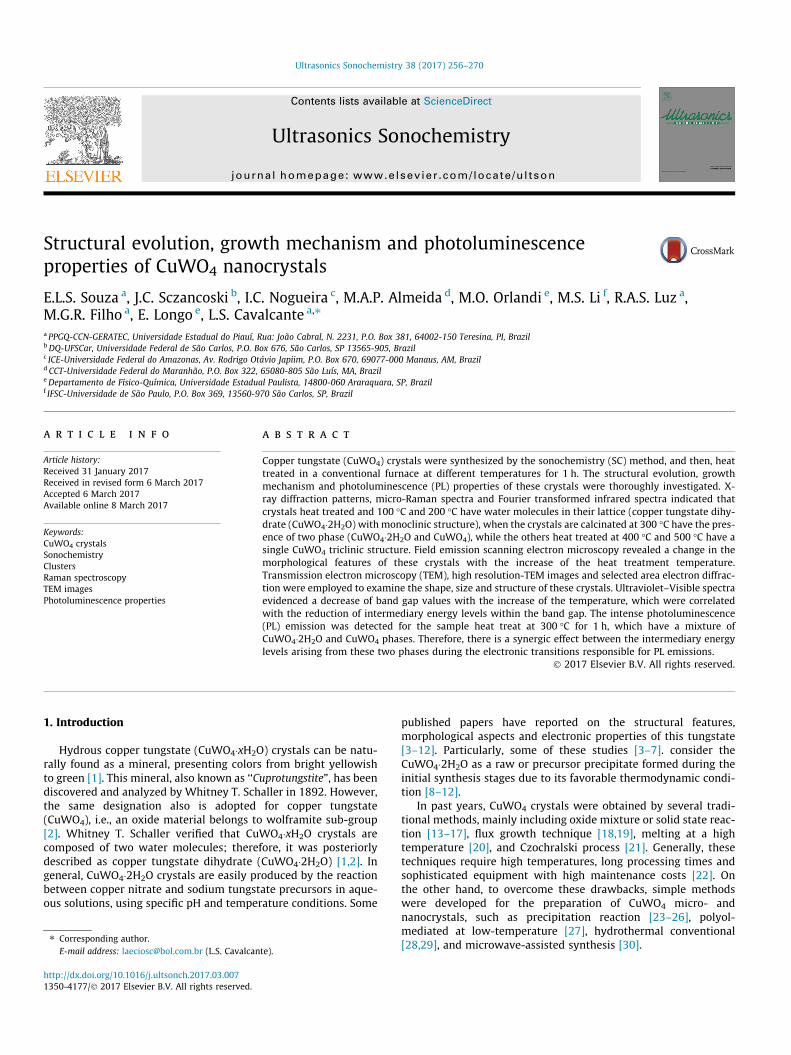
Fig. 1. XRD patterns of (a) CuWO4�2H2O and (b) CuWO4 crystals, respectively. Thevertical lines in red color indicate the position and relative intensity of XRD patternsfor CuWO4�2H2O phase reported in Joint Committee on Powder DiffractionStandards (JCPDS) card No. 33-0503. The symbol (�) is assigned to CuWO4 phase.The vertical lines in black color show the position and relative intensity of XRDpatterns for CuWO4 phase described in Inorganic Crystal Structure Database (ICSD)card No. 16009.
3. Results and discussions
3.1. Long-range structural analyses
Fig. 1(a, b) shows XRD patterns of CuWO4�2H2O and CuWO4
crystals heat treated at different temperatures, respectively.According to the literature [76], the degree of structural order/
disorder or periodicity of a crystalline lattice in oxide materials canbe analyzed by means of X-ray diffraction. In Fig. 1(a), the precip-itated crystals heat treated at 100 �C and 200 �C for 1 h revealedthe presence of wide XRD peaks assigned to CuWO4�2H2O mono-clinic structure. This widening can be due to the presence of watermolecules bonded in this crystalline structure (TGA and DTA pro-files in Support Information Fig. SI-1(a, b)) as well as because ofeffects of order–disorder [77], i.e., these crystals have not a com-plete long-range structural ordering. Increasing the heat treatmenttemperature up to 300 �C (Fig. 1(a)), XRD patterns revealed a mix-ture of CuWO4�2H2O and CuWO4 phases. Therefore, in this temper-ature occurs a significant elimination of water molecules inCuWO4�2H2O. Chen and Xu [28] described the CuWO4�2H2O crys-tals as a crystalline phase with monoclinic structure referring toJCPDS Card No. 33-0503. When the heat treatment was performedat 400 �C and 500 �C for 1 h, all XRD patterns showed diffractionpeaks ascribed to CuWO4 triclinic structure, in agreement withthe ICSD card No. 16009 [78]. In order to confirm this triclinicstructure, the structural refinement by means of Rietveld method[79] was performed for CuWO4 crystals heat treated at 500 �C for1 h.
The Rietveld method is based on the construction of diffractionpatterns calculated according to a structural model [80]. The calcu-lated patterns are adjusted to the observed pattern, providing thestructural parameters of the desired material and its diffractionprofile. In the present study, the Rietveld method was applied toestimate the atomic positions, lattice parameters, and unit cell vol-ume of CuWO4 crystals. The Rietveld refinement was performedusing the general structure analysis software (GSAS) program[81], in which the refined parameters were scale factor, back-ground, shift lattice constants, profile half-width parameters (u,v, w), isotropic thermal parameters, lattice parameters, strain ani-
sotropy factor, preferential orientation, factor occupancy, andatomic functional positions. The background was corrected usinga Chebyschev polynomial of the first order. The peak profile func-tion was modeled using a convolution of the Thompson–Cox–Hastings pseudo-Voigt (pV-TCH) function [82] with the asymmetryfunction described by Finger et al. [83] In order to explain the ani-sotropy in the half width of the reflections, the model by Stephens[84] was used.
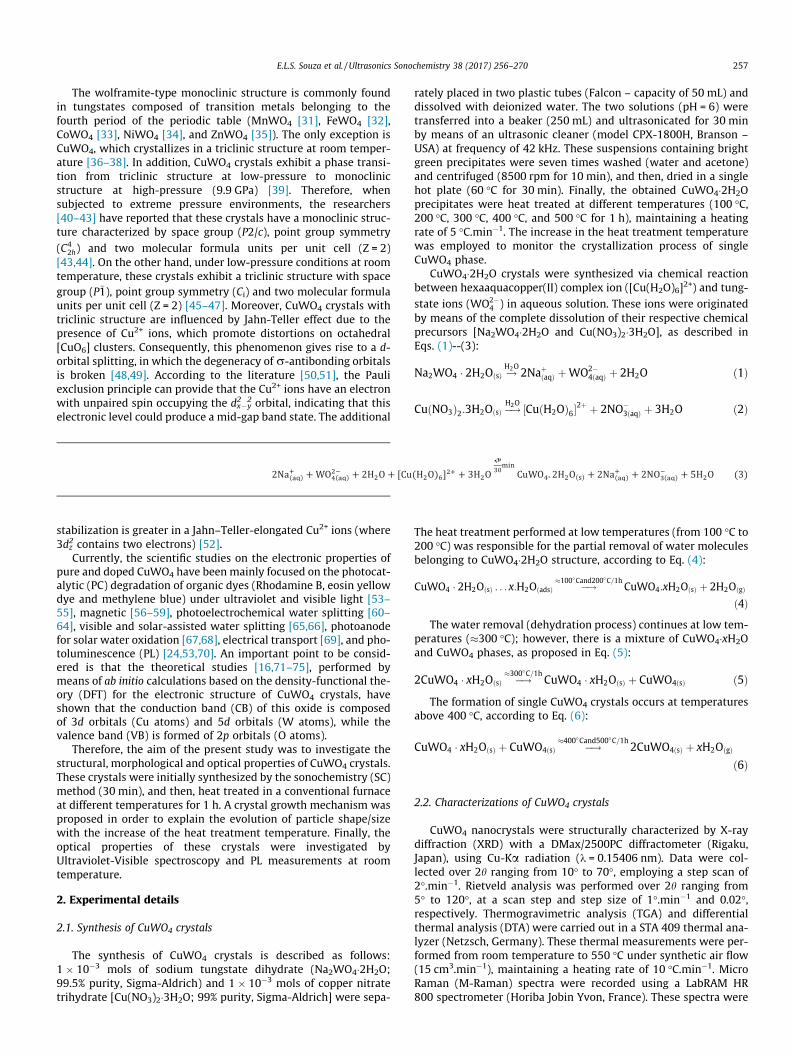
Fig. 2 shows the Rietveld refinement plot for CuWO4 crystalssynthesized by the SC method and heat treated at 500 �C for 1 h.
All structural refinement results obtained by the Rietveldmethod [80] are consistent with ICSD No. 16009 reported by Kihl-borg and Gebert [78]. According to the literature [85], singleCuWO4 crystals have a triclinic structure, presenting a space group(P�1), point group symmetry (Ci) and two molecular formula unitsper unit cell (Z = 2). The structural refinement confirmed thetriclinic structure for CuWO4 crystals (Fig. 2). In general, slight
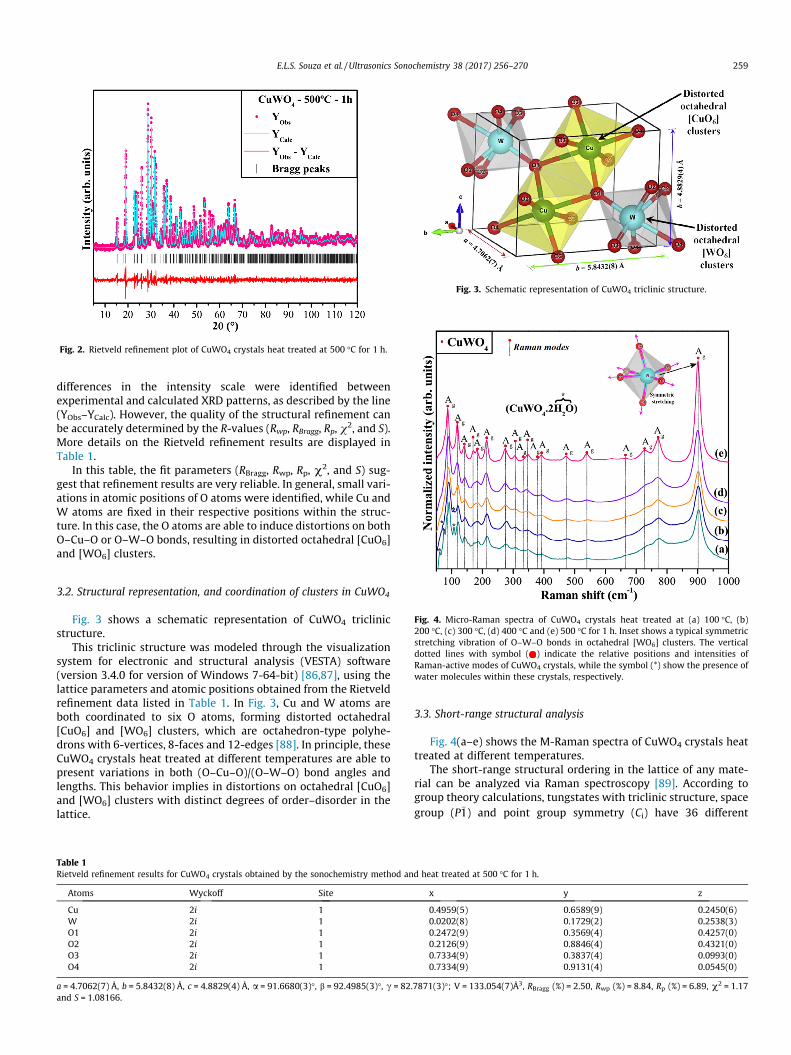
Fig. 2. Rietveld refinement plot of CuWO4 crystals heat treated at 500 �C for 1 h.
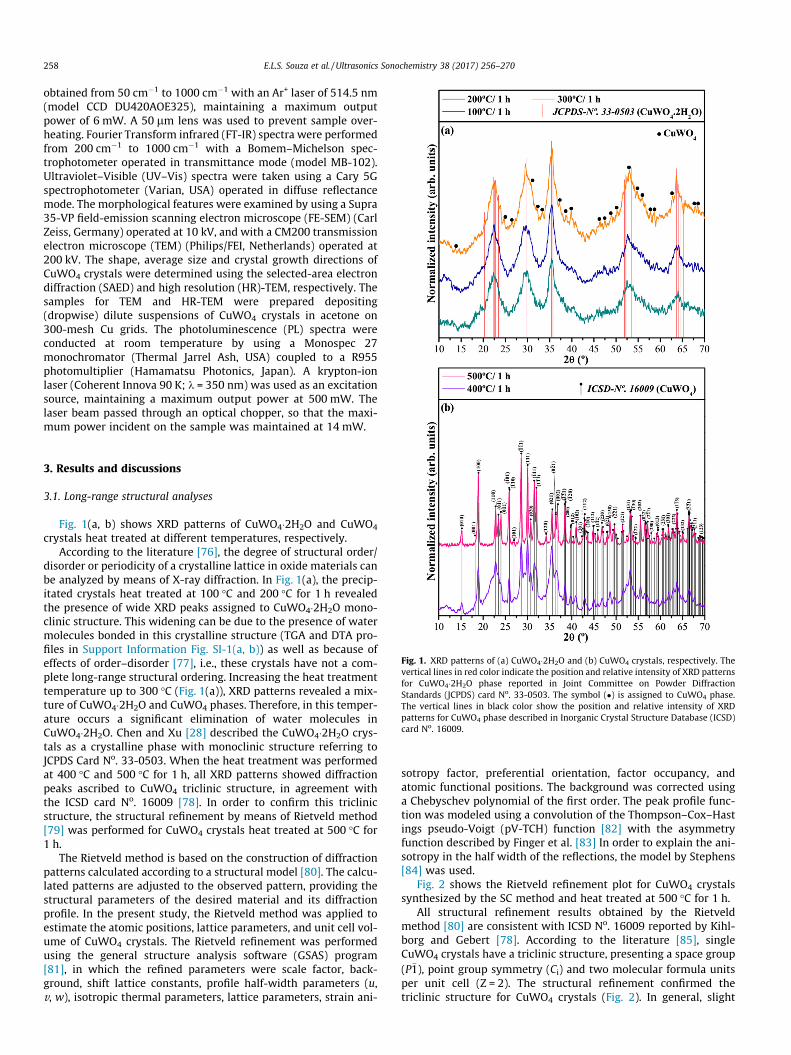
Fig. 3. Schematic representation of CuWO4 triclinic structure.
E.L.S. Souza et al. / Ultrasonics Sonochemistry 38 (2017) 256–270 259
differences in the intensity scale were identified betweenexperimental and calculated XRD patterns, as described by the line(YObs–YCalc). However, the quality of the structural refinement canbe accurately determined by the R-values (Rwp, RBragg, Rp, v2, and S).More details on the Rietveld refinement results are displayed inTable 1.
In this table, the fit parameters (RBragg, Rwp, Rp, v2, and S) sug-gest that refinement results are very reliable. In general, small vari-ations in atomic positions of O atoms were identified, while Cu andW atoms are fixed in their respective positions within the struc-ture. In this case, the O atoms are able to induce distortions on bothO–Cu–O or O–W–O bonds, resulting in distorted octahedral [CuO6]and [WO6] clusters.
Fig. 4. Micro-Raman spectra of CuWO4 crystals heat treated at (a) 100 �C, (b)200 �C, (c) 300 �C, (d) 400 �C and (e) 500 �C for 1 h. Inset shows a typical symmetricstretching vibration of O–W–O bonds in octahedral [WO6] clusters. The verticaldotted lines with symbol ( ) indicate the relative positions and intensities ofRaman-active modes of CuWO4 crystals, while the symbol (*) show the presence ofwater molecules within these crystals, respectively.
3.2. Structural representation, and coordination of clusters in CuWO4
Fig. 3 shows a schematic representation of CuWO4 triclinicstructure.
This triclinic structure was modeled through the visualizationsystem for electronic and structural analysis (VESTA) software(version 3.4.0 for version of Windows 7-64-bit) [86,87], using thelattice parameters and atomic positions obtained from the Rietveldrefinement data listed in Table 1. In Fig. 3, Cu and W atoms areboth coordinated to six O atoms, forming distorted octahedral[CuO6] and [WO6] clusters, which are octahedron-type polyhe-drons with 6-vertices, 8-faces and 12-edges [88]. In principle, theseCuWO4 crystals heat treated at different temperatures are able topresent variations in both (O–Cu–O)/(O–W–O) bond angles andlengths. This behavior implies in distortions on octahedral [CuO6]and [WO6] clusters with distinct degrees of order–disorder in thelattice.
Table 1Rietveld refinement results for CuWO4 crystals obtained by the sonochemistry method an
Atoms Wyckoff Site
Cu 2i 1W 2i 1O1 2i 1O2 2i 1O3 2i 1O4 2i 1
a = 4.7062(7) Å, b = 5.8432(8) Å, c = 4.8829(4) Å, a = 91.6680(3)�, b = 92.4985(3)�, c = 82.and S = 1.08166.
3.3. Short-range structural analysis
Fig. 4(a–e) shows the M-Raman spectra of CuWO4 crystals heattreated at different temperatures.
The short-range structural ordering in the lattice of any mate-rial can be analyzed via Raman spectroscopy [89]. According togroup theory calculations, tungstates with triclinic structure, spacegroup (P�1) and point group symmetry (Ci) have 36 different
d heat treated at 500 �C for 1 h.
x y z
0.4959(5) 0.6589(9) 0.2450(6)0.0202(8) 0.1729(2) 0.2538(3)0.2472(9) 0.3569(4) 0.4257(0)0.2126(9) 0.8846(4) 0.4321(0)0.7334(9) 0.3837(4) 0.0993(0)0.7334(9) 0.9131(4) 0.0545(0)
7871(3)�; V = 133.054(7)Å3, RBragg (%) = 2.50, Rwp (%) = 8.84, Rp (%) = 6.89, v2 = 1.17
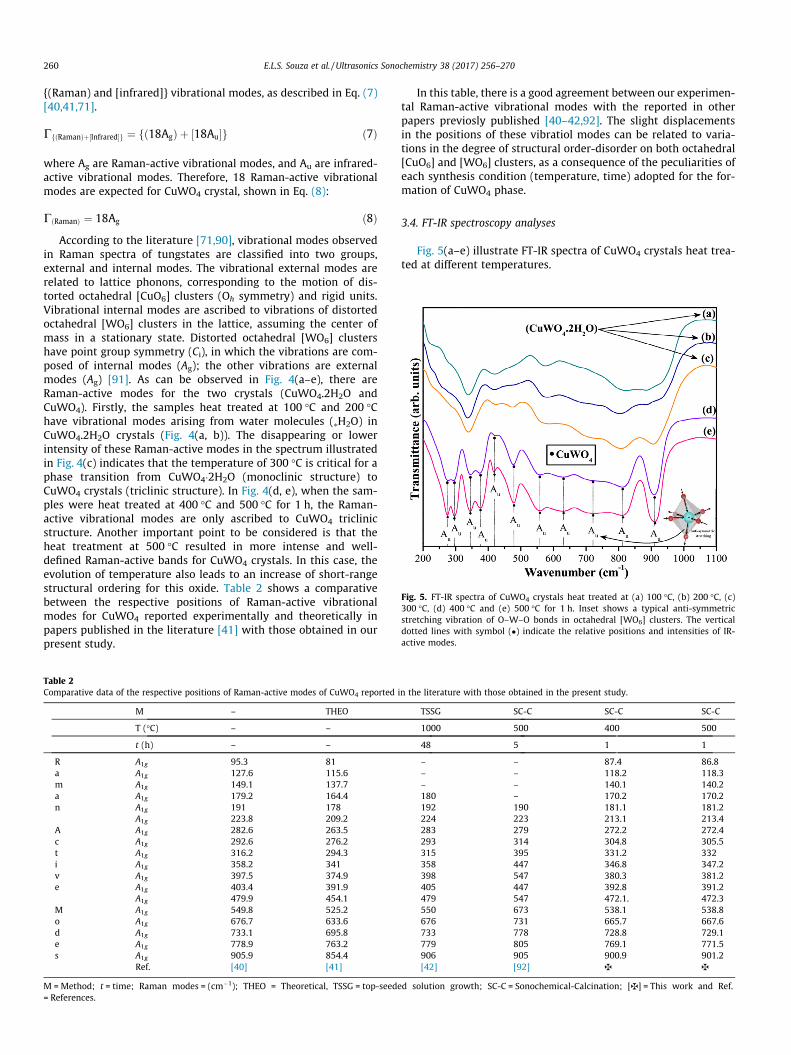
Fig. 5. FT-IR spectra of CuWO4 crystals heat treated at (a) 100 �C, (b) 200 �C, (c)300 �C, (d) 400 �C and (e) 500 �C for 1 h. Inset shows a typical anti-symmetricstretching vibration of O–W–O bonds in octahedral [WO6] clusters. The verticaldotted lines with symbol (�) indicate the relative positions and intensities of IR-active modes.
260 E.L.S. Souza et al. / Ultrasonics Sonochemistry 38 (2017) 256–270
{(Raman) and [infrared]} vibrational modes, as described in Eq. (7)[40,41,71].
CfðRamanÞþ½Infrared�g ¼ fð18AgÞ þ ½18Au�g ð7Þ
where Ag are Raman-active vibrational modes, and Au are infrared-active vibrational modes. Therefore, 18 Raman-active vibrationalmodes are expected for CuWO4 crystal, shown in Eq. (8):
CðRamanÞ ¼ 18Ag ð8ÞAccording to the literature [71,90], vibrational modes observed
in Raman spectra of tungstates are classified into two groups,external and internal modes. The vibrational external modes arerelated to lattice phonons, corresponding to the motion of dis-torted octahedral [CuO6] clusters (Oh symmetry) and rigid units.Vibrational internal modes are ascribed to vibrations of distortedoctahedral [WO6] clusters in the lattice, assuming the center ofmass in a stationary state. Distorted octahedral [WO6] clustershave point group symmetry (Ci), in which the vibrations are com-posed of internal modes (Ag); the other vibrations are externalmodes (Ag) [91]. As can be observed in Fig. 4(a–e), there areRaman-active modes for the two crystals (CuWO4.2H2O andCuWO4). Firstly, the samples heat treated at 100 �C and 200 �Chave vibrational modes arising from water molecules (⁄H2O) inCuWO4.2H2O crystals (Fig. 4(a, b)). The disappearing or lowerintensity of these Raman-active modes in the spectrum illustratedin Fig. 4(c) indicates that the temperature of 300 �C is critical for aphase transition from CuWO4�2H2O (monoclinic structure) toCuWO4 crystals (triclinic structure). In Fig. 4(d, e), when the sam-ples were heat treated at 400 �C and 500 �C for 1 h, the Raman-active vibrational modes are only ascribed to CuWO4 triclinicstructure. Another important point to be considered is that theheat treatment at 500 �C resulted in more intense and well-defined Raman-active bands for CuWO4 crystals. In this case, theevolution of temperature also leads to an increase of short-rangestructural ordering for this oxide. Table 2 shows a comparativebetween the respective positions of Raman-active vibrationalmodes for CuWO4 reported experimentally and theoretically inpapers published in the literature [41] with those obtained in ourpresent study.
Table 2Comparative data of the respective positions of Raman-active modes of CuWO4 reported i
M – THEO
T (�C) – –
t (h) – –
R A1g 95.3 81a A1g 127.6 115.6m A1g 149.1 137.7a A1g 179.2 164.4n A1g 191 178
A1g 223.8 209.2A A1g 282.6 263.5c A1g 292.6 276.2t A1g 316.2 294.3i A1g 358.2 341v A1g 397.5 374.9e A1g 403.4 391.9
A1g 479.9 454.1M A1g 549.8 525.2o A1g 676.7 633.6d A1g 733.1 695.8e A1g 778.9 763.2s A1g 905.9 854.4
Ref. [40] [41]
M = Method; t = time; Raman modes = (cm�1); THEO = Theoretical, TSSG = top-seede= References.
In this table, there is a good agreement between our experimen-tal Raman-active vibrational modes with the reported in otherpapers previosly published [40–42,92]. The slight displacementsin the positions of these vibratiol modes can be related to varia-tions in the degree of structural order-disorder on both octahedral[CuO6] and [WO6] clusters, as a consequence of the peculiarities ofeach synthesis condition (temperature, time) adopted for the for-mation of CuWO4 phase.
3.4. FT-IR spectroscopy analyses
Fig. 5(a–e) illustrate FT-IR spectra of CuWO4 crystals heat trea-ted at different temperatures.
n the literature with those obtained in the present study.
TSSG SC-C SC-C SC-C
1000 500 400 500
48 5 1 1
– – 87.4 86.8– – 118.2 118.3– – 140.1 140.2180 – 170.2 170.2192 190 181.1 181.2224 223 213.1 213.4283 279 272.2 272.4293 314 304.8 305.5315 395 331.2 332358 447 346.8 347.2398 547 380.3 381.2405 447 392.8 391.2479 547 472.1. 472.3550 673 538.1 538.8676 731 665.7 667.6733 778 728.8 729.1779 805 769.1 771.5906 905 900.9 901.2[42] [92] z z
d solution growth; SC-C = Sonochemical-Calcination; [z] = This work and Ref.
E.L.S. Souza et al. / Ultrasonics Sonochemistry 38 (2017) 256–270 261
According to the literature [93], IR spectra also is able to provideinformation on the degree of structural order-disorder in atomicbonds of ABO4 materials. Eq. (7) shows that the CuWO4 crystalswith triclinic structure have 18 Raman-active vibrational modesand 18 IR-active vibrational modes, as indicated by Eq. (9) [94]:
C½Infrared� ¼ 18Au ð9ÞAs illustrated in Fig. 5(a–e), only eleven IR-active vibrational
bands [Au modes] were detected in our IR spectra. This behavioris explained by the low symmetry of CuWO4 lattice and phononpattern associated with each mode that is in general complexand involves the whole unit cell [94]. However, the atom dynamicsassociated to highest energy modes can be understood on the basisof the main atomic shifts [94,95]. The band located at around910 cm�1 is related to symmetric stretching vibrations( O W?O?) in distorted octahedral [WO6] clusters. It wasnoted a smaller band at 812 cm�1, which cannot be related to opti-cal modes at zone center [94]. Another band of low intensity at720 cm�1 is related to anti-symmetric stretching vibrations in dis-torted octahedral [WO6] clusters (Inset Fig. 5). Also, it was noted ashoulder at 631 cm�1 [Au mode], which cannot be attributed tooptical modes [94]. The symmetric stretching vibrations( O W?O W?O?) between [WO6]–[WO6] clusters were ver-ified at 558 cm�1. On the other hand, the symmetric stretchingvibrations ( O Cu?O?) of distorted octahedral [CuO6] clusterswere detected at 478 cm�1. The small band at 417 cm�1 is arisingfrom symmetric bending vibrations (-O-W%O%) in [WO6] clus-ters.[94] Finally, the last four modes (from 275 cm�1 to 377 cm�1)are assigned to anti-symmetric (?O?Cu?O-Cu-O-) and sym-metric ( O Cu?O Cu?O?) stretching vibrations between[CuO6]–[CuO6] clusters, and symmetric bending vibrations(-O-Cu%O%) in [CuO6] clusters, respectively. A comparisonbetween the respective positions of IR-active vibrational modesof CuWO4 obtained in our study with others published in the liter-ature [41] are listed in Table 3. As expected in this table, our exper-imental IR-active vibrational modes are in good agreement withthe results verified in other papers [41,94–97]. In addition, we havenoted that some of these infrared vibrational modes of CuWO4
nanocrystals are similar to isostructural CuMoO4 crystals [98].
Table 3Comparative data of the respective positions of IR-active modes of CuWO4 reported in the
M THEO TSSG CP-C
T (�C) – 1000 450
t (h) – 48 6
I A1u – – –n A1u – – –f A1u – – –r A1u 101.4 – –a A1u 157.3 – –r A1u 214.2 – –e A1u 239 253 –d A1u 266.1 275 –
A1u 281 290 –Ac A1u 320.5 355 –ti A1u 332.3 – –ve A1u 383.8 395 –
A1u 438.9 466 500M A1u 474.8 540 –o A1u 516.5 600 –d A1u 639.6 722 –e A1u 727.7 760 748s A1u 852.7 911 876
Ref. [40] [94] [95]
M = method; T = temperature; t = time; IR-active modes = (cm�1); TSSG = Top-seeded soC = Sonochemical-Calcination; THEO = Theoretical, and [z] = this work.
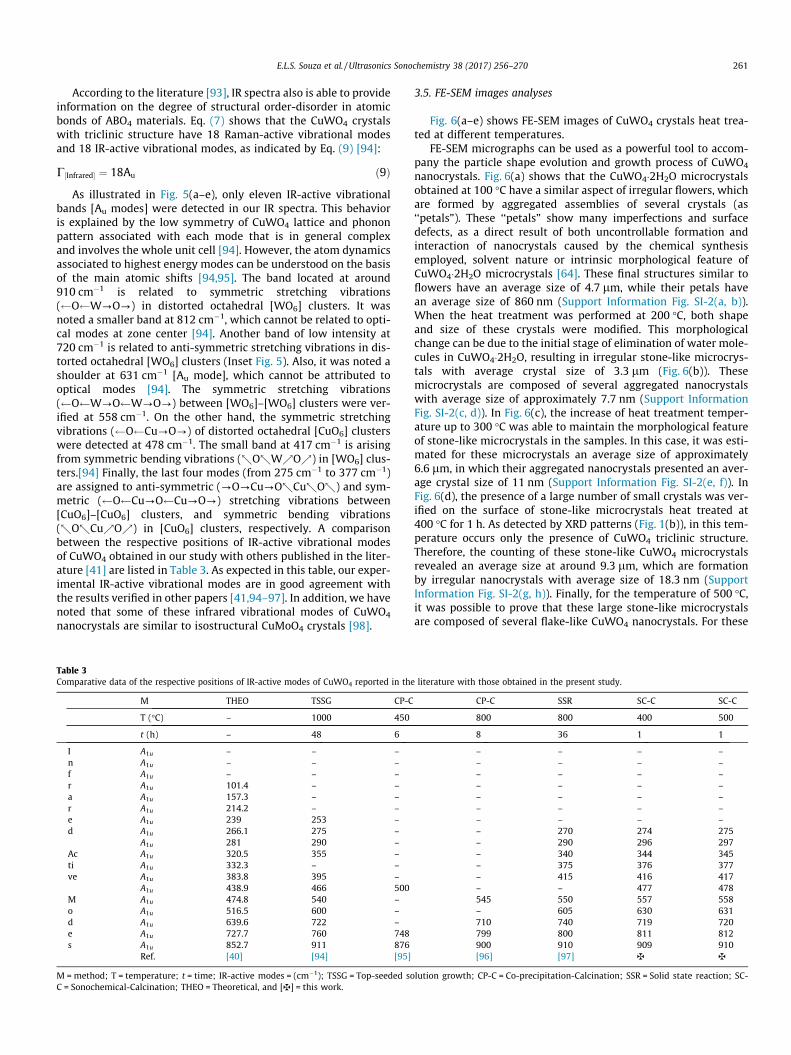
3.5. FE-SEM images analyses
Fig. 6(a–e) shows FE-SEM images of CuWO4 crystals heat trea-ted at different temperatures.
FE-SEM micrographs can be used as a powerful tool to accom-pany the particle shape evolution and growth process of CuWO4
nanocrystals. Fig. 6(a) shows that the CuWO4�2H2O microcrystalsobtained at 100 �C have a similar aspect of irregular flowers, whichare formed by aggregated assemblies of several crystals (as‘‘petals”). These ‘‘petals” show many imperfections and surfacedefects, as a direct result of both uncontrollable formation andinteraction of nanocrystals caused by the chemical synthesisemployed, solvent nature or intrinsic morphological feature ofCuWO4�2H2O microcrystals [64]. These final structures similar toflowers have an average size of 4.7 lm, while their petals havean average size of 860 nm (Support Information Fig. SI-2(a, b)).When the heat treatment was performed at 200 �C, both shapeand size of these crystals were modified. This morphologicalchange can be due to the initial stage of elimination of water mole-cules in CuWO4�2H2O, resulting in irregular stone-like microcrys-tals with average crystal size of 3.3 lm (Fig. 6(b)). Thesemicrocrystals are composed of several aggregated nanocrystalswith average size of approximately 7.7 nm (Support InformationFig. SI-2(c, d)). In Fig. 6(c), the increase of heat treatment temper-ature up to 300 �C was able to maintain the morphological featureof stone-like microcrystals in the samples. In this case, it was esti-mated for these microcrystals an average size of approximately6.6 lm, in which their aggregated nanocrystals presented an aver-age crystal size of 11 nm (Support Information Fig. SI-2(e, f)). InFig. 6(d), the presence of a large number of small crystals was ver-ified on the surface of stone-like microcrystals heat treated at400 �C for 1 h. As detected by XRD patterns (Fig. 1(b)), in this tem-perature occurs only the presence of CuWO4 triclinic structure.Therefore, the counting of these stone-like CuWO4 microcrystalsrevealed an average size at around 9.3 lm, which are formationby irregular nanocrystals with average size of 18.3 nm (SupportInformation Fig. SI-2(g, h)). Finally, for the temperature of 500 �C,it was possible to prove that these large stone-like microcrystalsare composed of several flake-like CuWO4 nanocrystals. For these
literature with those obtained in the present study.
CP-C SSR SC-C SC-C
800 800 400 500
8 36 1 1
– – – –– – – –– – – –– – – –– – – –– – – –– – – –– 270 274 275– 290 296 297– 340 344 345– 375 376 377– 415 416 417– – 477 478545 550 557 558– 605 630 631710 740 719 720799 800 811 812900 910 909 910[96] [97] z z
lution growth; CP-C = Co-precipitation-Calcination; SSR = Solid state reaction; SC-
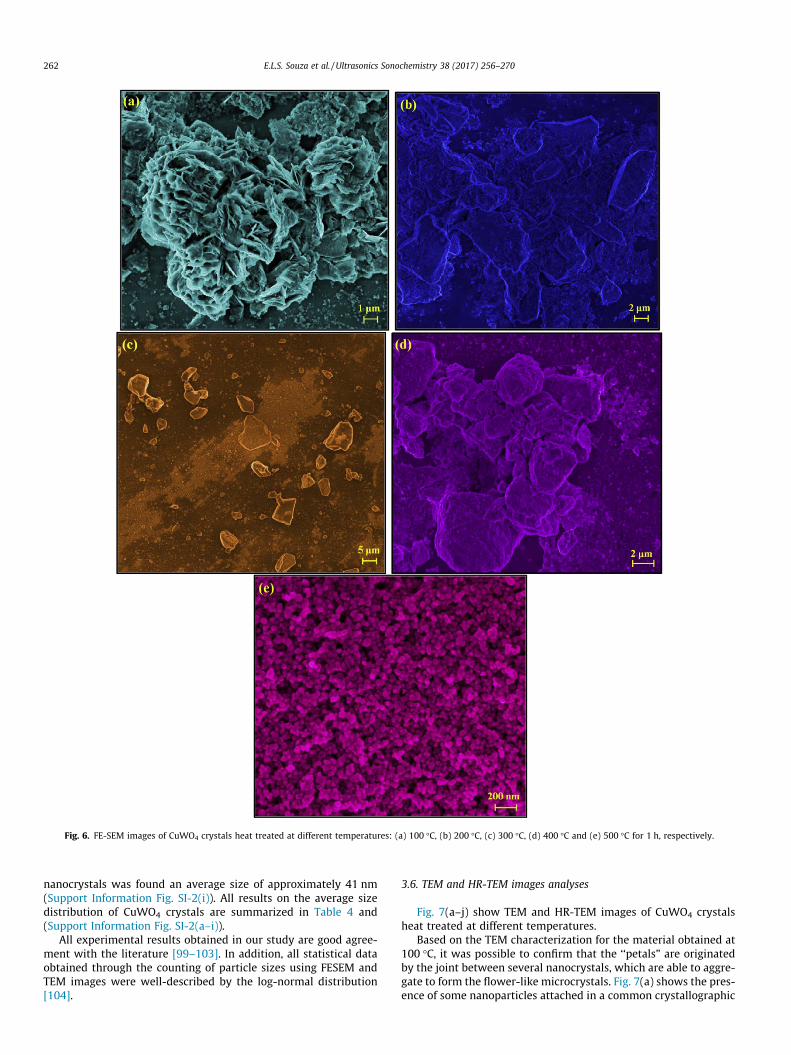
Fig. 6. FE-SEM images of CuWO4 crystals heat treated at different temperatures: (a) 100 �C, (b) 200 �C, (c) 300 �C, (d) 400 �C and (e) 500 �C for 1 h, respectively.
262 E.L.S. Souza et al. / Ultrasonics Sonochemistry 38 (2017) 256–270
nanocrystals was found an average size of approximately 41 nm(Support Information Fig. SI-2(i)). All results on the average sizedistribution of CuWO4 crystals are summarized in Table 4 and(Support Information Fig. SI-2(a–i)).
All experimental results obtained in our study are good agree-ment with the literature [99–103]. In addition, all statistical dataobtained through the counting of particle sizes using FESEM andTEM images were well-described by the log-normal distribution[104].
3.6. TEM and HR-TEM images analyses
Fig. 7(a–j) show TEM and HR-TEM images of CuWO4 crystalsheat treated at different temperatures.
Based on the TEM characterization for the material obtained at100 �C, it was possible to confirm that the ‘‘petals” are originatedby the joint between several nanocrystals, which are able to aggre-gate to form the flower-like microcrystals. Fig. 7(a) shows the pres-ence of some nanoparticles attached in a common crystallographic

Table 4Comparative results between the morphological features (crystal size and shape) and optical band gap energy (Egap) of CuWO4 crystals heat treated at different temperatures for1 h obtained in the present study with those reported in the literature.
M Crystal shape Average crystal size (nm)*/(lm) j T(�C) t(h) Egap (eV) Ref.
HC Hollow microspheres 300* 180 18 2.3 [99]SC-C Nanoparticles 30–50* 500 2 3.2 [100]HC/CC Nanoflakes 30*/1j 450 1 2.22 [101]MI-C Nanoparticles 31.8* 500 2 – [102]P-C Nanoparticles 50* 500 1 2.0 [103]SC-C Petal-like/Flower-like 860*/4.68j 100 1 2.45 zSC-C Flakes-like/Rough stones-like 7.664*/3.32j 200 1 2.28 zSC-C Flakes-like/Rough stones-like 11*/6.653j 300 1 2.34 zSC-C Flakes-like/Rough stones-like 18.3*/9.313j 400 1 2.24 zSC-C Flakes-like 41* 500 1 2.19 z
M =method; T = temperature; t = time; HC = Hydrothermal conventional; SC-C = Sonochemistry-Calcination; CC = Chemical conversion; MI-C = Microwave irradiation-Cal-cination; P-C = Polyol-Calcination; [z] = This work.
E.L.S. Souza et al. / Ultrasonics Sonochemistry 38 (2017) 256–270 263
orientation. HR-TEM image presented in Fig. 7(b) shows the pres-ence of nanocrystals with diameters of approximately 4 nm. Theinterplanar distance for these nanocrystals was estimated inapproximately 0.23 nm, which correspond to (200) crystallo-graphic plane of CuWO4 triclinic phase, which is present in smallpoints locally in the hydrated global lattice. The selected area elec-tron diffraction (SAED) image (inset in Fig. 7(b)) was indexed alsoas CuWO4 phase. In this case, it is important to emphasize thatboth TEM and SAED focused on some nanocrystals locally indicatethe CuWO4 phase, while X-ray patterns, due to be a long-rangetechnique, indicated the CuWO4�2H2O phase. The low resolutionTEM image for the sample obtained at 200 �C showed severalaggregated nanoparticles (Fig. 7(c)). SAED (not shown here) indi-cated the presence of low intensity rings related to nanocrystallineparticles, which is supported by HR-TEM image in Fig. 7(d). Thematerials heat treated at 300 �C are illustrated in Fig. 7(e, f). Again,the micrographs revealed that the stone-like CuWO4 microcrystalsare clearly formed by randomly distributed aggregated nanoparti-cles, as confirmed by low intensity rings in SAED (Inset in Fig. 7(f)).HR-TEM image also revealed the same interplanar distance(0.23 nm), as observed in Fig. 7(b), i.e., proving the CuWO4 triclinicphase. Exactly, this same behavior was also identified for the mate-rials obtained at 400 �C (Fig. 7(g, h)). For the material heat treatedat 500 �C, the existence of larger particles was identified, in whichsome of them are well-faceted (high degree of crystallinity). TEMimages also showed these particles are agglomerated instead ofaggregated, presenting an interplanar distance of 0.31 nm relatedto (�1�11) plane of CuWO4 triclinic phase. The other TEM and HR-TEM images can support the explanations above as found in Sup-port Information Figs. SI-3(a–j). All experimental results obtainedin this study are in good agreement with the literature and pre-sented in Table 4 [99–103]. Therefore, TEM images provides someadvantages over SEM images, specially confirming that larger par-ticles for samples obtained from 200 �C to 400 �C are composed ofsmaller nanoparticles. On the other hand, the particles observed at500 �C are single-crystalline. SAED agrees with XRD results, inwhich the synthesis method allowed the formation of crystallinenanoparticles of CuWO4.
3.7. Crystal growth mechanism
Fig. 8(a–k) shows a schematic representation of all stagesinvolved in the synthesis and growth of CuWO4 nanocrystals syn-thesized by the SC method and heat treated at different tempera-tures for 1 h.
Initially, there is the coulomb interaction between [Cu(H2O)6]2+
and WO2�4 complex ions in aqueous solution, promoting the forma-
tion of first CuWO4�2H2O nuclei (Fig. 8(a, b)). These nuclei control
the kinetics of nucleation and growth of CuWO4 nanocrystals. Inthe next growth stage (Fig. 8(c, d)), the crystals in the aqueousmedium are able to rotate and align to find a common crystallo-graphic plane via self-assembly process. As this process is uncon-trollable, there is the random and spontaneous aggregation ofnanocrystals, resulting in petal-like CuWO4�2H2O microcrystals(Fig. 8(e)). After heat treatment performed at 100 �C for 1 h,flower-like CuWO4�2H2Omicrocrystals are formed, which are com-posed of several petal-like crystals (Fig. 8(f)). The initial stage ofelimination of water molecules in CuWO4�2H2O due to the heattreatment temperature at 200 �C resulted in irregular stone-likemicrocrystals (Fig. 8(g)). The progressive removal of these watermolecules in the lattice with the increase of heat treatment pro-moted a phase transition from CuWO4�xH2O (monoclinic structure)to CuWO4 crystals (triclinic structure). However, for temperaturesof 300 �C and 400 �C, the morphological aspect of irregular stone-like microcrystals is maintained (Fig. 8(i, j)). Finally, when thematerials were heat treated at 500 �C, CuWO4 crystals grew bymeans of nanocrystals. These results can be proved through FESEM,TEM and HR-TEM images (Figs. 6(e) and 7(i, j)).
3.8. Uv–vis spectra and optical band gap energy
The optical band gap energy (Egap) was calculated using themethod proposed by Kubelka and Munk [105]. This methodologyis based on the transformation of diffuse reflectance measure-ments to estimate Egap values of semiconductors with good accu-racy [106]. The Kubelka–Munk Eq. (10) for any wavelength isdefined as:
FðR1Þ ð1� R1Þ2R1
¼ ks
ð10Þ
where F(R1) is the Kubelka–Munk function or absolute reflectanceof the sample. In our case, magnesium oxide (MgO) was adopted asstandard in reflectance measurements. R1 = Rsample/RMgO, where R1is the reflectance, k is the molar absorption coefficient, and s is thescattering coefficient. The optical band gap and absorption coeffi-cient of semiconductor oxides [107] can be calculated using the fol-lowing Eq. (11):
ahm ¼ C1ðhv � EgapÞn ð11Þwhere a is the linear absorption coefficient of the material, hm is thephoton energy, C1 is a proportionality constant, and n is a constantassociated to the type of electronic transition (n = 0.5, 2, 1.5, and 3for direct allowed, indirect allowed, direct forbidden, and indirectforbidden transitions, respectively). According to Lalic et al. [72]and Lacomba-Perale et al. [108] CuWO4 crystals have an opticalabsorption spectrum governed by indirect electronic transitions
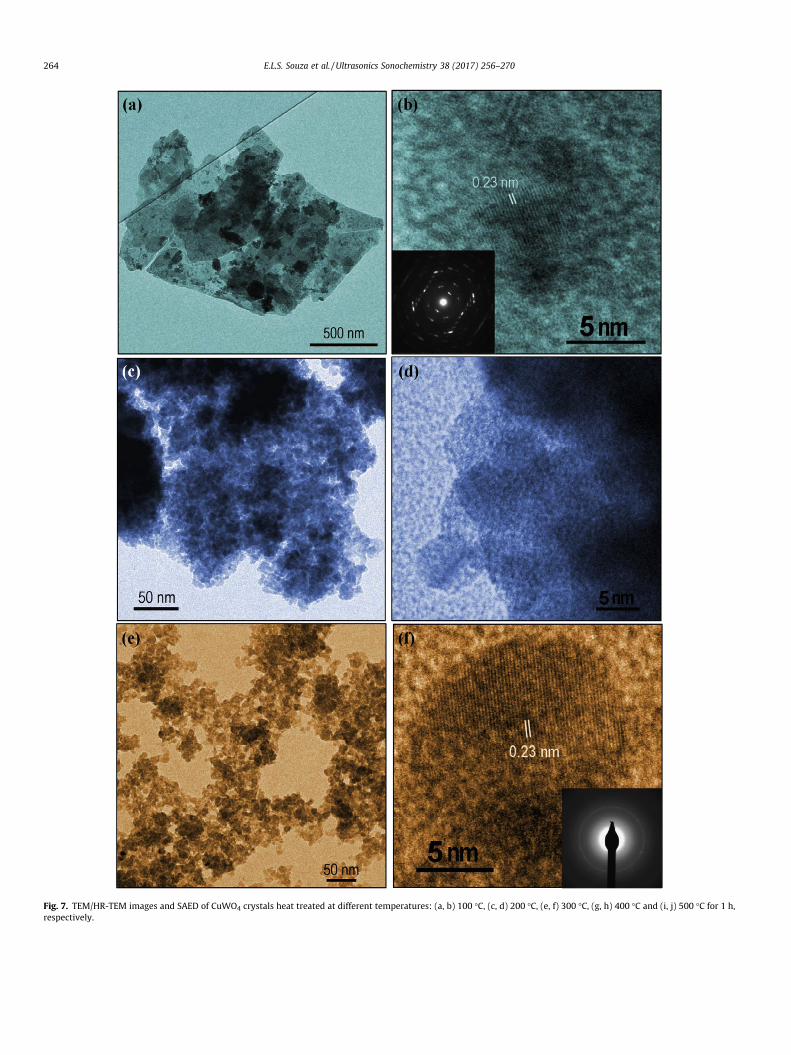
Fig. 7. TEM/HR-TEM images and SAED of CuWO4 crystals heat treated at different temperatures: (a, b) 100 �C, (c, d) 200 �C, (e, f) 300 �C, (g, h) 400 �C and (i, j) 500 �C for 1 h,respectively.
264 E.L.S. Souza et al. / Ultrasonics Sonochemistry 38 (2017) 256–270
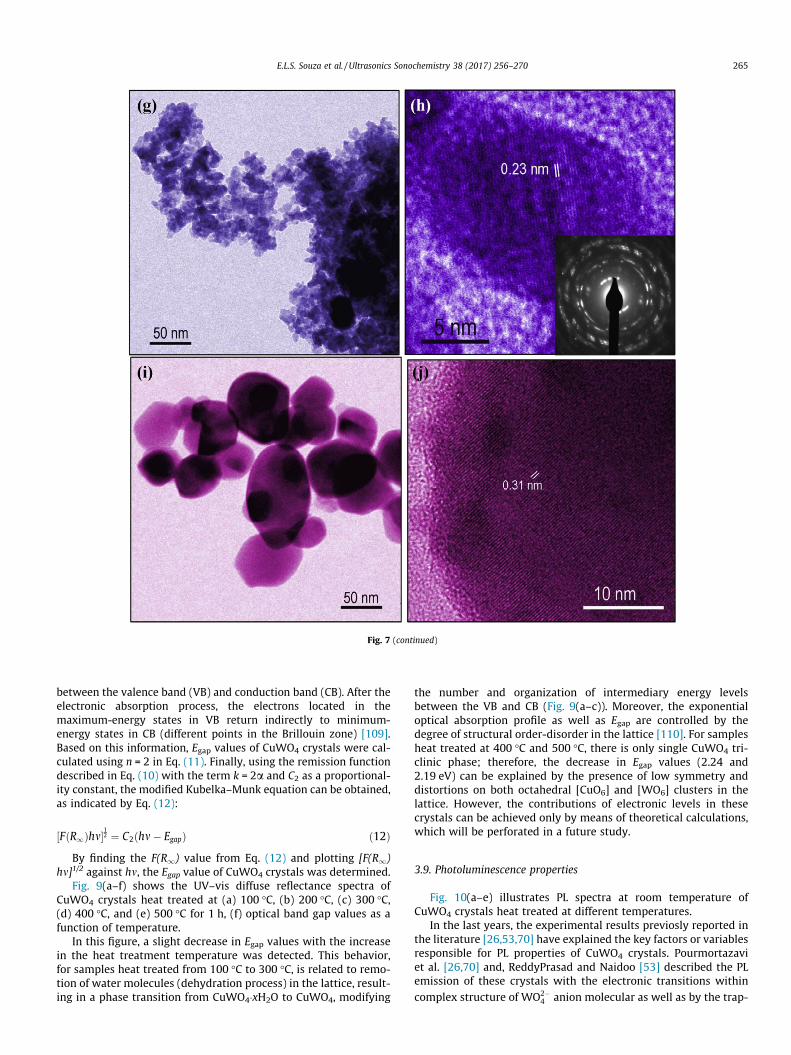
Fig. 7 (continued)
E.L.S. Souza et al. / Ultrasonics Sonochemistry 38 (2017) 256–270 265
between the valence band (VB) and conduction band (CB). After theelectronic absorption process, the electrons located in themaximum-energy states in VB return indirectly to minimum-energy states in CB (different points in the Brillouin zone) [109].Based on this information, Egap values of CuWO4 crystals were cal-culated using n = 2 in Eq. (11). Finally, using the remission functiondescribed in Eq. (10) with the term k = 2a and C2 as a proportional-ity constant, the modified Kubelka–Munk equation can be obtained,as indicated by Eq. (12):
½FðR1Þhm�12 ¼ C2ðhm� EgapÞ ð12Þ
By finding the F(R1) value from Eq. (12) and plotting [F(R1)hm]1/2 against hm, the Egap value of CuWO4 crystals was determined.
Fig. 9(a–f) shows the UV–vis diffuse reflectance spectra ofCuWO4 crystals heat treated at (a) 100 �C, (b) 200 �C, (c) 300 �C,(d) 400 �C, and (e) 500 �C for 1 h, (f) optical band gap values as afunction of temperature.
In this figure, a slight decrease in Egap values with the increasein the heat treatment temperature was detected. This behavior,for samples heat treated from 100 �C to 300 �C, is related to remo-tion of water molecules (dehydration process) in the lattice, result-ing in a phase transition from CuWO4�xH2O to CuWO4, modifying
the number and organization of intermediary energy levelsbetween the VB and CB (Fig. 9(a–c)). Moreover, the exponentialoptical absorption profile as well as Egap are controlled by thedegree of structural order-disorder in the lattice [110]. For samplesheat treated at 400 �C and 500 �C, there is only single CuWO4 tri-clinic phase; therefore, the decrease in Egap values (2.24 and2.19 eV) can be explained by the presence of low symmetry anddistortions on both octahedral [CuO6] and [WO6] clusters in thelattice. However, the contributions of electronic levels in thesecrystals can be achieved only by means of theoretical calculations,which will be perforated in a future study.
3.9. Photoluminescence properties
Fig. 10(a–e) illustrates PL spectra at room temperature ofCuWO4 crystals heat treated at different temperatures.
In the last years, the experimental results previosly reported inthe literature [26,53,70] have explained the key factors or variablesresponsible for PL properties of CuWO4 crystals. Pourmortazaviet al. [26,70] and, ReddyPrasad and Naidoo [53] described the PLemission of these crystals with the electronic transitions withincomplex structure of WO2�
4 anion molecular as well as by the trap-
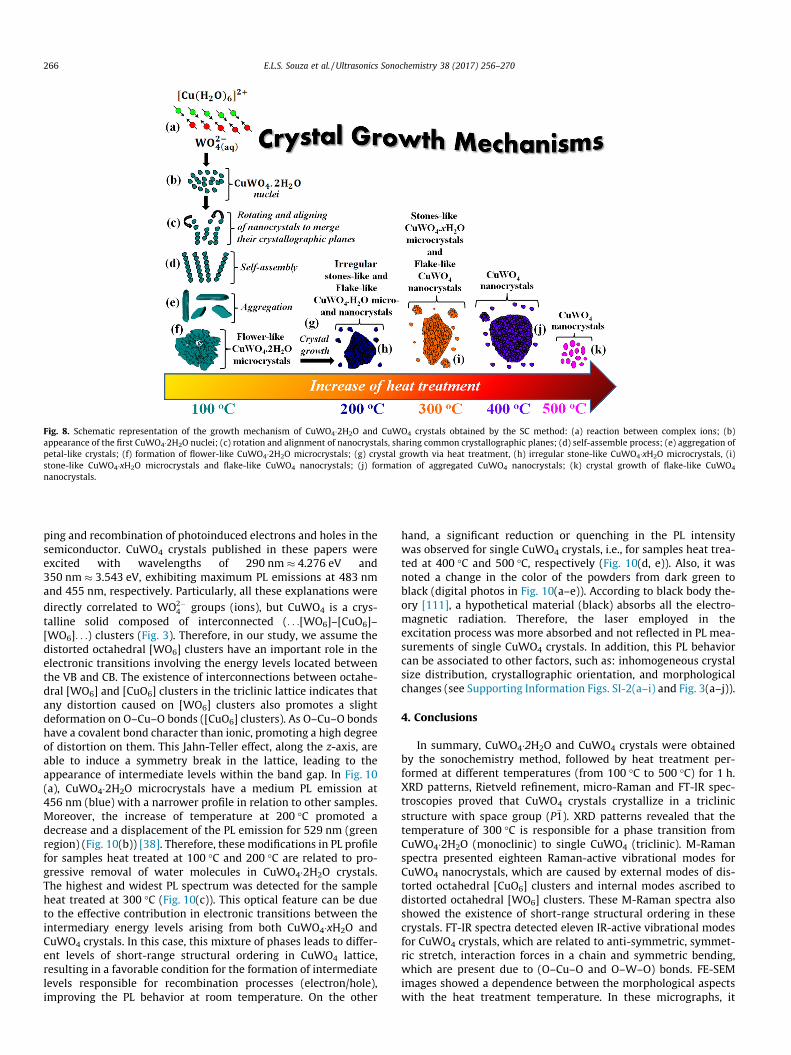
Fig. 8. Schematic representation of the growth mechanism of CuWO4�2H2O and CuWO4 crystals obtained by the SC method: (a) reaction between complex ions; (b)appearance of the first CuWO4�2H2O nuclei; (c) rotation and alignment of nanocrystals, sharing common crystallographic planes; (d) self-assemble process; (e) aggregation ofpetal-like crystals; (f) formation of flower-like CuWO4�2H2O microcrystals; (g) crystal growth via heat treatment, (h) irregular stone-like CuWO4�xH2O microcrystals, (i)stone-like CuWO4�xH2O microcrystals and flake-like CuWO4 nanocrystals; (j) formation of aggregated CuWO4 nanocrystals; (k) crystal growth of flake-like CuWO4
nanocrystals.
266 E.L.S. Souza et al. / Ultrasonics Sonochemistry 38 (2017) 256–270
ping and recombination of photoinduced electrons and holes in thesemiconductor. CuWO4 crystals published in these papers wereexcited with wavelengths of 290 nm � 4.276 eV and350 nm � 3.543 eV, exhibiting maximum PL emissions at 483 nmand 455 nm, respectively. Particularly, all these explanations weredirectly correlated to WO2�
4 groups (ions), but CuWO4 is a crys-talline solid composed of interconnected (. . .[WO6]–[CuO6]–[WO6]. . .) clusters (Fig. 3). Therefore, in our study, we assume thedistorted octahedral [WO6] clusters have an important role in theelectronic transitions involving the energy levels located betweenthe VB and CB. The existence of interconnections between octahe-dral [WO6] and [CuO6] clusters in the triclinic lattice indicates thatany distortion caused on [WO6] clusters also promotes a slightdeformation on O–Cu–O bonds ([CuO6] clusters). As O–Cu–O bondshave a covalent bond character than ionic, promoting a high degreeof distortion on them. This Jahn-Teller effect, along the z-axis, areable to induce a symmetry break in the lattice, leading to theappearance of intermediate levels within the band gap. In Fig. 10(a), CuWO4�2H2O microcrystals have a medium PL emission at456 nm (blue) with a narrower profile in relation to other samples.Moreover, the increase of temperature at 200 �C promoted adecrease and a displacement of the PL emission for 529 nm (greenregion) (Fig. 10(b)) [38]. Therefore, these modifications in PL profilefor samples heat treated at 100 �C and 200 �C are related to pro-gressive removal of water molecules in CuWO4�2H2O crystals.The highest and widest PL spectrum was detected for the sampleheat treated at 300 �C (Fig. 10(c)). This optical feature can be dueto the effective contribution in electronic transitions between theintermediary energy levels arising from both CuWO4�xH2O andCuWO4 crystals. In this case, this mixture of phases leads to differ-ent levels of short-range structural ordering in CuWO4 lattice,resulting in a favorable condition for the formation of intermediatelevels responsible for recombination processes (electron/hole),improving the PL behavior at room temperature. On the other
hand, a significant reduction or quenching in the PL intensitywas observed for single CuWO4 crystals, i.e., for samples heat trea-ted at 400 �C and 500 �C, respectively (Fig. 10(d, e)). Also, it wasnoted a change in the color of the powders from dark green toblack (digital photos in Fig. 10(a–e)). According to black body the-ory [111], a hypothetical material (black) absorbs all the electro-magnetic radiation. Therefore, the laser employed in theexcitation process was more absorbed and not reflected in PL mea-surements of single CuWO4 crystals. In addition, this PL behaviorcan be associated to other factors, such as: inhomogeneous crystalsize distribution, crystallographic orientation, and morphologicalchanges (see Supporting Information Figs. SI-2(a–i) and Fig. 3(a–j)).
4. Conclusions
In summary, CuWO4�2H2O and CuWO4 crystals were obtainedby the sonochemistry method, followed by heat treatment per-formed at different temperatures (from 100 �C to 500 �C) for 1 h.XRD patterns, Rietveld refinement, micro-Raman and FT-IR spec-troscopies proved that CuWO4 crystals crystallize in a triclinicstructure with space group (P�1). XRD patterns revealed that thetemperature of 300 �C is responsible for a phase transition fromCuWO4�2H2O (monoclinic) to single CuWO4 (triclinic). M-Ramanspectra presented eighteen Raman-active vibrational modes forCuWO4 nanocrystals, which are caused by external modes of dis-torted octahedral [CuO6] clusters and internal modes ascribed todistorted octahedral [WO6] clusters. These M-Raman spectra alsoshowed the existence of short-range structural ordering in thesecrystals. FT-IR spectra detected eleven IR-active vibrational modesfor CuWO4 crystals, which are related to anti-symmetric, symmet-ric stretch, interaction forces in a chain and symmetric bending,which are present due to (O–Cu–O and O–W–O) bonds. FE-SEMimages showed a dependence between the morphological aspectswith the heat treatment temperature. In these micrographs, it
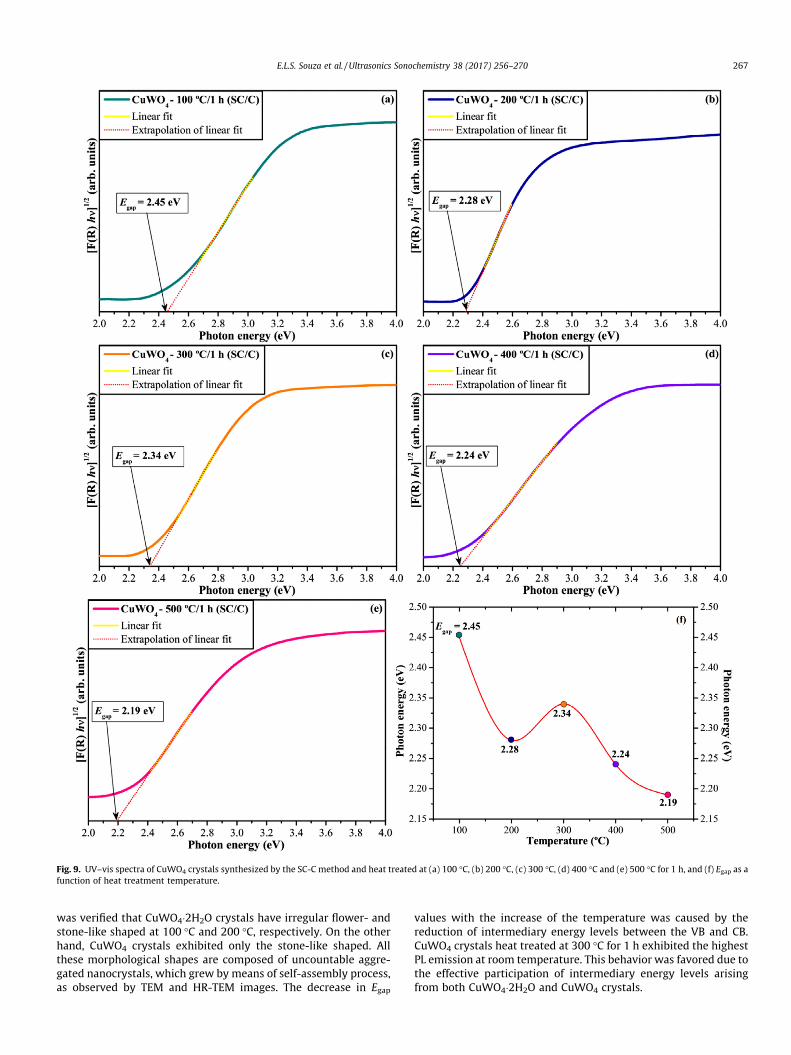
Fig. 9. UV–vis spectra of CuWO4 crystals synthesized by the SC-C method and heat treated at (a) 100 �C, (b) 200 �C, (c) 300 �C, (d) 400 �C and (e) 500 �C for 1 h, and (f) Egap as afunction of heat treatment temperature.
E.L.S. Souza et al. / Ultrasonics Sonochemistry 38 (2017) 256–270 267
was verified that CuWO4�2H2O crystals have irregular flower- andstone-like shaped at 100 �C and 200 �C, respectively. On the otherhand, CuWO4 crystals exhibited only the stone-like shaped. Allthese morphological shapes are composed of uncountable aggre-gated nanocrystals, which grew by means of self-assembly process,as observed by TEM and HR-TEM images. The decrease in Egap
values with the increase of the temperature was caused by thereduction of intermediary energy levels between the VB and CB.CuWO4 crystals heat treated at 300 �C for 1 h exhibited the highestPL emission at room temperature. This behavior was favored due tothe effective participation of intermediary energy levels arisingfrom both CuWO4�2H2O and CuWO4 crystals.
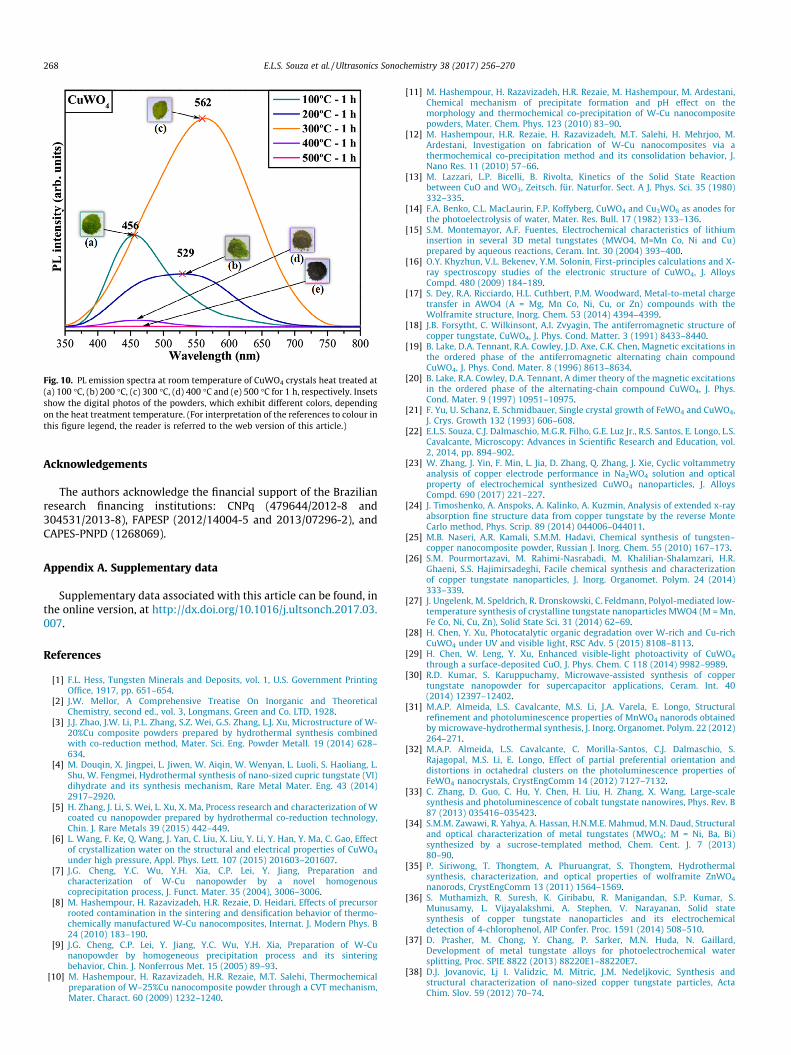
Fig. 10. PL emission spectra at room temperature of CuWO4 crystals heat treated at(a) 100 �C, (b) 200 �C, (c) 300 �C, (d) 400 �C and (e) 500 �C for 1 h, respectively. Insetsshow the digital photos of the powders, which exhibit different colors, dependingon the heat treatment temperature. (For interpretation of the references to colour inthis figure legend, the reader is referred to the web version of this article.)
268 E.L.S. Souza et al. / Ultrasonics Sonochemistry 38 (2017) 256–270
Acknowledgements
The authors acknowledge the financial support of the Brazilianresearch financing institutions: CNPq (479644/2012-8 and304531/2013-8), FAPESP (2012/14004-5 and 2013/07296-2), andCAPES-PNPD (1268069).
Appendix A. Supplementary data
Supplementary data associated with this article can be found, inthe online version, at http://dx.doi.org/10.1016/j.ultsonch.2017.03.007.
References
[1] F.L. Hess, Tungsten Minerals and Deposits, vol. 1, U.S. Government PrintingOffice, 1917, pp. 651–654.
[2] J.W. Mellor, A Comprehensive Treatise On Inorganic and TheoreticalChemistry, second ed., vol. 3, Longmans, Green and Co. LTD, 1928.
[3] J.J. Zhao, J.W. Li, P.L. Zhang, S.Z. Wei, G.S. Zhang, L.J. Xu, Microstructure of W-20%Cu composite powders prepared by hydrothermal synthesis combinedwith co-reduction method, Mater. Sci. Eng. Powder Metall. 19 (2014) 628–634.
[4] M. Douqin, X. Jingpei, L. Jiwen, W. Aiqin, W. Wenyan, L. Luoli, S. Haoliang, L.Shu, W. Fengmei, Hydrothermal synthesis of nano-sized cupric tungstate (VI)dihydrate and its synthesis mechanism, Rare Metal Mater. Eng. 43 (2014)2917–2920.
[5] H. Zhang, J. Li, S. Wei, L. Xu, X. Ma, Process research and characterization of Wcoated cu nanopowder prepared by hydrothermal co-reduction technology,Chin. J. Rare Metals 39 (2015) 442–449.
[6] L. Wang, F. Ke, Q. Wang, J. Yan, C. Liu, X. Liu, Y. Li, Y. Han, Y. Ma, C. Gao, Effectof crystallization water on the structural and electrical properties of CuWO4
under high pressure, Appl. Phys. Lett. 107 (2015) 201603–201607.[7] J.G. Cheng, Y.C. Wu, Y.H. Xia, C.P. Lei, Y. Jiang, Preparation and
characterization of W-Cu nanopowder by a novel homogenouscoprecipitation process, J. Funct. Mater. 35 (2004), 3006–3006.
[8] M. Hashempour, H. Razavizadeh, H.R. Rezaie, D. Heidari, Effects of precursorrooted contamination in the sintering and densification behavior of thermo-chemically manufactured W-Cu nanocomposites, Internat. J. Modern Phys. B24 (2010) 183–190.
[9] J.G. Cheng, C.P. Lei, Y. Jiang, Y.C. Wu, Y.H. Xia, Preparation of W-Cunanopowder by homogeneous precipitation process and its sinteringbehavior, Chin. J. Nonferrous Met. 15 (2005) 89–93.
[10] M. Hashempour, H. Razavizadeh, H.R. Rezaie, M.T. Salehi, Thermochemicalpreparation of W–25%Cu nanocomposite powder through a CVT mechanism,Mater. Charact. 60 (2009) 1232–1240.
[11] M. Hashempour, H. Razavizadeh, H.R. Rezaie, M. Hashempour, M. Ardestani,Chemical mechanism of precipitate formation and pH effect on themorphology and thermochemical co-precipitation of W-Cu nanocompositepowders, Mater. Chem. Phys. 123 (2010) 83–90.
[12] M. Hashempour, H.R. Rezaie, H. Razavizadeh, M.T. Salehi, H. Mehrjoo, M.Ardestani, Investigation on fabrication of W-Cu nanocomposites via athermochemical co-precipitation method and its consolidation behavior, J.Nano Res. 11 (2010) 57–66.
[13] M. Lazzari, L.P. Bicelli, B. Rivolta, Kinetics of the Solid State Reactionbetween CuO and WO3, Zeitsch. für. Naturfor. Sect. A J. Phys. Sci. 35 (1980)332–335.
[14] F.A. Benko, C.L. MacLaurin, F.P. Koffyberg, CuWO4 and Cu3WO6 as anodes forthe photoelectrolysis of water, Mater. Res. Bull. 17 (1982) 133–136.
[15] S.M. Montemayor, A.F. Fuentes, Electrochemical characteristics of lithiuminsertion in several 3D metal tungstates (MWO4, M=Mn Co, Ni and Cu)prepared by aqueous reactions, Ceram. Int. 30 (2004) 393–400.
[16] O.Y. Khyzhun, V.L. Bekenev, Y.M. Solonin, First-principles calculations and X-ray spectroscopy studies of the electronic structure of CuWO4, J. AlloysCompd. 480 (2009) 184–189.
[17] S. Dey, R.A. Ricciardo, H.L. Cuthbert, P.M. Woodward, Metal-to-metal chargetransfer in AWO4 (A = Mg, Mn Co, Ni, Cu, or Zn) compounds with theWolframite structure, Inorg. Chem. 53 (2014) 4394–4399.
[18] J.B. Forsytht, C. Wilkinsont, A.I. Zvyagin, The antiferromagnetic structure ofcopper tungstate, CuWO4, J. Phys. Cond. Matter. 3 (1991) 8433–8440.
[19] B. Lake, D.A. Tennant, R.A. Cowley, J.D. Axe, C.K. Chen, Magnetic excitations inthe ordered phase of the antiferromagnetic alternating chain compoundCuWO4, J. Phys. Cond. Mater. 8 (1996) 8613–8634.
[20] B. Lake, R.A. Cowley, D.A. Tennant, A dimer theory of the magnetic excitationsin the ordered phase of the alternating-chain compound CuWO4, J. Phys.Cond. Mater. 9 (1997) 10951–10975.
[21] F. Yu, U. Schanz, E. Schmidbauer, Single crystal growth of FeWO4 and CuWO4,J. Crys. Growth 132 (1993) 606–608.
[22] E.L.S. Souza, C.J. Dalmaschio, M.G.R. Filho, G.E. Luz Jr., R.S. Santos, E. Longo, L.S.Cavalcante, Microscopy: Advances in Scientific Research and Education, vol.2, 2014, pp. 894–902.
[23] W. Zhang, J. Yin, F. Min, L. Jia, D. Zhang, Q. Zhang, J. Xie, Cyclic voltammetryanalysis of copper electrode performance in Na2WO4 solution and opticalproperty of electrochemical synthesized CuWO4 nanoparticles, J. AlloysCompd. 690 (2017) 221–227.
[24] J. Timoshenko, A. Anspoks, A. Kalinko, A. Kuzmin, Analysis of extended x-rayabsorption fine structure data from copper tungstate by the reverse MonteCarlo method, Phys. Scrip. 89 (2014) 044006–044011.
[25] M.B. Naseri, A.R. Kamali, S.M.M. Hadavi, Chemical synthesis of tungsten–copper nanocomposite powder, Russian J. Inorg. Chem. 55 (2010) 167–173.
[26] S.M. Pourmortazavi, M. Rahimi-Nasrabadi, M. Khalilian-Shalamzari, H.R.Ghaeni, S.S. Hajimirsadeghi, Facile chemical synthesis and characterizationof copper tungstate nanoparticles, J. Inorg. Organomet. Polym. 24 (2014)333–339.
[27] J. Ungelenk, M. Speldrich, R. Dronskowski, C. Feldmann, Polyol-mediated low-temperature synthesis of crystalline tungstate nanoparticles MWO4 (M = Mn,Fe Co, Ni, Cu, Zn), Solid State Sci. 31 (2014) 62–69.
[28] H. Chen, Y. Xu, Photocatalytic organic degradation over W-rich and Cu-richCuWO4 under UV and visible light, RSC Adv. 5 (2015) 8108–8113.
[29] H. Chen, W. Leng, Y. Xu, Enhanced visible-light photoactivity of CuWO4
through a surface-deposited CuO, J. Phys. Chem. C 118 (2014) 9982–9989.[30] R.D. Kumar, S. Karuppuchamy, Microwave-assisted synthesis of copper
tungstate nanopowder for supercapacitor applications, Ceram. Int. 40(2014) 12397–12402.
[31] M.A.P. Almeida, L.S. Cavalcante, M.S. Li, J.A. Varela, E. Longo, Structuralrefinement and photoluminescence properties of MnWO4 nanorods obtainedby microwave-hydrothermal synthesis, J. Inorg. Organomet. Polym. 22 (2012)264–271.
[32] M.A.P. Almeida, L.S. Cavalcante, C. Morilla-Santos, C.J. Dalmaschio, S.Rajagopal, M.S. Li, E. Longo, Effect of partial preferential orientation anddistortions in octahedral clusters on the photoluminescence properties ofFeWO4 nanocrystals, CrystEngComm 14 (2012) 7127–7132.
[33] C. Zhang, D. Guo, C. Hu, Y. Chen, H. Liu, H. Zhang, X. Wang, Large-scalesynthesis and photoluminescence of cobalt tungstate nanowires, Phys. Rev. B87 (2013) 035416–035423.
[34] S.M.M. Zawawi, R. Yahya, A. Hassan, H.N.M.E. Mahmud, M.N. Daud, Structuraland optical characterization of metal tungstates (MWO4; M = Ni, Ba, Bi)synthesized by a sucrose-templated method, Chem. Cent. J. 7 (2013)80–90.
[35] P. Siriwong, T. Thongtem, A. Phuruangrat, S. Thongtem, Hydrothermalsynthesis, characterization, and optical properties of wolframite ZnWO4
nanorods, CrystEngComm 13 (2011) 1564–1569.[36] S. Muthamizh, R. Suresh, K. Giribabu, R. Manigandan, S.P. Kumar, S.
Munusamy, L. Vijayalakshmi, A. Stephen, V. Narayanan, Solid statesynthesis of copper tungstate nanoparticles and its electrochemicaldetection of 4-chlorophenol, AIP Confer. Proc. 1591 (2014) 508–510.
[37] D. Prasher, M. Chong, Y. Chang, P. Sarker, M.N. Huda, N. Gaillard,Development of metal tungstate alloys for photoelectrochemical watersplitting, Proc. SPIE 8822 (2013) 88220E1–88220E7.
[38] D.J. Jovanovic, Lj I. Validzic, M. Mitric, J.M. Nedeljkovic, Synthesis andstructural characterization of nano-sized copper tungstate particles, ActaChim. Slov. 59 (2012) 70–74.
E.L.S. Souza et al. / Ultrasonics Sonochemistry 38 (2017) 256–270 269
[39] J. Ruiz-Fuertes, A. Segura, F. Rodríguez, D. Errandonea, M.N. Sanz-Ortiz,Anomalous high-pressure Jahn-Teller behavior in CuWO4, Phys. Rev. Lett. 108(2012) 166402–166405.
[40] J. Ruiz-Fuertes, M.N. Sanz-Ortiz, J. González, F. Rodríguez, A. Segura, D.Errandonea, Optical absorption and Raman spectroscopy of CuWO4, J. Phys.Conf. Ser. 215 (2010) 012048–012052.
[41] J. Ruiz-Fuertes, D. Errandonea, R. Lacomba-Perales, A. Segura, J. González, F.Rodríguez, F.J. Manjón, S. Ray, P. Rodríguez-Hernández, A. Muñoz, Z. Zhu, C.Y.Tu, High-pressure structural phase transitions in CuWO4, Phys. Rev. B 81(2010) 224115–224124.
[42] J. Ruiz-Fuertes, D. Errandonea, A. Segura, F.J. Manjón, Z. Zhu, C.Y. Tu, Growth,characterization, and high-pressure optical studies of CuWO4, High Press. Res.28 (2008) 565–570.
[43] J. Ruiz-Fuertes, A. Friedrich, J. Pellicer-Porres, D. Errandonea, A. Segura, W.Morgenroth, E. Haussühl, C.Y. Tu, A. Polian, Structure solution of the high-pressure phase of CuWO4 and evolution of the Jahn-Teller distortion, Chem.Mater. 23 (2011) 4220–4226.
[44] P.F. Schofield, S.A.T. Redfern, Ferroelastic phase transition in the sanmartinite(ZnWO4)-cuproscheelite (CuWO4) solid solution, J. Phys.: Condens. Matter. 4(1992) 375–388.
[45] P.F. Schofield, C.M.B. Henderson, S.A.T. Redfern, G. van der Laan, Cu 2pabsorption spectroscopy as a probe for the site occupancy of (ZnxCul-x)WO4
solid solution, Phys. Chem. Minerals 20 (1993) 375–381.[46] P.F. Schofield, J.M. Charnock, G. Cressey, C.M.B. Henderson, An EXAFS study of
cation site distortions through the P2/c-P1 phase transition in the syntheticcuproscheelite-sanmartinite solid solution, Miner. Magaz. 58 (1994) 185–199.
[47] S.A.T. Redfern, P.F. Schofield, Order parameter saturation (plateau effect) as afunction of composition in the sanmartinite (ZnWO4) – cuproscheelite(CuWO4) solid solution, Phase Trans. 59 (1996) 25–38.
[48] M. Imada, A. Fujimori, Y. Tokura, Metal-insulator transitions, Rev. Mod. Phys.70 (1998) 1039–1263.
[49] P. Patureau, M. Josse, R. Dessapt, J.Y. Mevellec, F. Porcher, M. Maglione, P.Deniard, C. Payen, Incorporation of Jahn�Teller Cu2+ ions intomagnetoelectric multiferroic MnWO4: structural, magnetic, and dielectricpermittivity properties of Mn1�xCuxWO4 (x 0.25), Inorg. Chem. 54 (2015)10623–10631.
[50] J.P. Doumerc, J. Hejtmanek, J.P. Chaminade, M. Pouchard, M. Krussanova, Aphotoelectrochemical study of CuWO4 single crystals, Phys. Status Solidi A 82(1984) 285–294.
[51] K.J. Pyper, J.E. Yourey, B.M. Bartlett, Reactivity of CuWO4 inphotoelectrochemical water oxidation is dictated by a midgap electronicstate, J. Phys. Chem. C 117 (2013) 24726–24732.
[52] M.A. Halcrow, Interpreting and controlling the structures of six-coordinatecopper(II) centres – When is a compression really a compression?, DaltonTrans 1 (2003) 4375–4384.
[53] P. ReddyPrasad, E.B. Naidoo, Ultrasonic synthesis of high fluorescent C-dotsand modified with CuWO4 nanocomposite for effective photocatalyticactivity, J. Mol. Struct. 1098 (2015) 146–152.
[54] T. Montini, V. Gombac, A. Hameed, L. Felisari, G. Adami, P. Fornasiero,Synthesis, characterization and photocatalytic performance of transitionmetal tungstates, Chem. Phys. Lett. 30 (2010) 113–119.
[55] P. Schmitt, N. Brem, S. Schunk, C. Feldmann, Polyol-mediated synthesis andproperties of nanoscale molybdates/tungstates: Color, luminescence,catalysis, Adv. Funct. Mater. 21 (2011) 3037–3046.
[56] B. Schwarz, H. Ehrenberg, H. Weitzel, A. Senyshyn, B. Thybusch, M. Knapp, G.J.McIntyred, H. Fuess, Crystal chemistry, structure and magnetic propertiesof the Cu(MoxW1-x)O4 solid solution series, Philos. Mag. 88 (2008)1235–1258.
[57] B.C. Schwarz, H. Ehrenberg, H. Weitzel, H. Fuess, Investigation on theinfluence of particular structure parameters on the anisotropic spin-exchange interactions in the distorted wolframite-type oxides Cu(MoxW1-x)O4, Inorg. Chem. 46 (2007) 378–380.
[58] H.J. Koo, M.H. Whangbo, Spin dimer analysis of the anisotropic spin exchangeinteractions in the distorted Wolframite-Type oxides CuWO4, CuMoO4-III,and Cu(Mo0.25W0.75)O4, Inorg. Chem. 40 (2001) 2161–2169.
[59] J.E. Yourey, J.B. Kurtz, B.M. Bartlett, Structure, optical properties, andmagnetism of the full Zn1–xCuxWO4 (0 x 1) composition range, Inorg.Chem. 51 (2012) 10394–10401.
[60] Y. Tang, N. Rong, F. Liu, M. Chu, H. Dong, Y. Zhang, P. Xiao, Enhancement of thephotoelectrochemical performance of CuWO4 films for water splitting byhydrogen treatment, Appl. Surf. Sci. 361 (2016) 133–140.
[61] D. Bohra, W.A. Smith, Improved charge separation via Fe-doping of coppertungstate photoanodes, Phys. Chem. Chem. Phys. 17 (2015) 9857–9866.
[62] A. Martínez-García, V.K. Vendra, S. Sunkara, P. Haldankar, J. Jasinski, M.K.Sunkara, Tungsten oxide-coated copper oxide nanowire arrays for enhancedactivity and durability with photoelectrochemical water splitting, J. Mater.Chem. A 1 (2013) 15235–15241.
[63] M. Valenti, D. Dolat, G. Biskos, A. Schmidt-Ott, W.A. Smith, Enhancement ofthe photoelectrochemical performance of CuWO4 thin films for solar watersplitting by plasmonic nanoparticle functionalization, J. Phys. Chem. C 119(2015) 2096–2104.
[64] F. Zhan, J. Li, W. Li, Y. Liu, R. Xie, Y. Yang, Y. Li, Q. Chen, In situ formation ofCuWO4/WO3 heterojunction plates array films with enhancedphotoelectrochemical properties, Int. J. Hydrogen Energy 40 (2015) 6512–6520.
[65] N. Gaillard, Y. Chang, A. DeAngelisa, S. Higginsa, A. Braun, A nanocompositephotoelectrode made of 2.2 eV band gap copper tungstate (CuWO4) andmulti-wall carbon nanotubes for solar-assisted water splitting, Int. J.Hydrogen Energy 38 (2013) 3166–3176.
[66] J.E. Yourey, B.M. Bartlett, Electrochemical deposition andphotoelectrochemistry of CuWO4, a promising photoanode for wateroxidation, J. Mater. Chem. 21 (2011) 7651–7660.
[67] J.C. Hill, K.S. Choi, Synthesis and characterization of high surface area CuWO4
and Bi2WO6 electrodes for use as photoanodes for solar water oxidation, J.Mater. Chem. A 1 (2013) 5006–5014.
[68] S.K. Pilli, T.G. Deutsch, T.E. Furtak, L.D. Brown, J.A. Turner, A.M. Herring,BiVO4/CuWO4 heterojunction photoanodes for efficient solar driven wateroxidation, Phys. Chem. Chem. Phys. 15 (2013) 3273–3278.
[69] R. Bharati, R. Shanker, R.A. Singh, Electrical transport properties of CuWO4,Pramana 14 (1980) 449–454.
[70] S.M. Pourmortazavi, M. Rahimi-Nasrabadi, Y. Fazli, M. Mohammad-Zadeh,Taguchi method assisted optimization of electrochemical synthesis andstructural characterization of copper tungstate nanoparticles, Int. J. Refract.Met. Hard Mater. 51 (2015) 29–34.
[71] A. Kuzmin, A. Kalinko, R.A. Evarestov, Ab initio LCAO study of the atomic,electronic and magnetic structures and the lattice dynamics of triclinicCuWO4, Acta Mater. 61 (2013) 371–378.
[72] M.V. Lalic, Z.S. Popovic, F.R. Vukajlovic, Ab initio study of electronic, magneticand optical properties of CuWO4 tungstate, Comput. Mater. Sci. 50 (2011)1179–1186.
[73] P. Sarker, D. Prasher, N. Gaillard, M.N. Huda, Predicting a new photocatalystand its electronic properties by density functional theory, J. Appl. Phys. 114(2013) 133508–133517.
[74] V.V. Atuchin, I.B. Troitskaia, O.Y. Khyzhun, V.L. Bekenev, Y.M. Solonin,Electronic properties of h-WO3 and CuWO4 nanocrystals as determinedfrom X-ray spectroscopy and first-principles band-structure calculations,Inter. J. Appl. Phys. Mathem. 1 (2011) 19–23.
[75] J.C. Hill, Y. Ping, G.A. Galli, K.S. Choi, Synthesis, photoelectrochemicalproperties, and first principles study of n-type CuW1-xMoxO4 electrodesshowing enhanced visible light absorption, Energy Environ. Sci. 6 (2013)2440–2446.
[76] R.F. Gonçalves, L.S. Cavalcante, I.C. Nogueira, E. Longo, M.J. Godinho, J.C.Sczancoski, V.R. Mastelaro, I.M. Pinatti, I.L.V. Rosa, A.P.A. Marques, Rietveldrefinement, cluster modelling, growth mechanism and photoluminescenceproperties of CaWO4:Eu3+ microcrystals, CrystEngComm 17 (2015) 1654–1666.
[77] S.N. Guin, D. Sanyal, K. Biswas, The effect of order–disorder phase transitionsand band gap evolution on the thermoelectric properties of AgCuSnanocrystals, Chem. Sci. 7 (2016) 534–543.
[78] L. Kihlborg, E. Gebert, CuWO4, a distorted Wolframite-type structure, ActaCryst. Sec. B 26 (26) (1970) 1020–1026.
[79] H.M. Rietveld, Line profiles of neutron powder-diffraction peaks for structurerefinement, Acta Crystallogr. 22 (1967) 151–152.
[80] H.M. Rietveld, A profile refinement method for nuclear and magneticstructures, J. Appl. Crystallogr. 2 (1969) 65–71.
[81] A.C. Larson, R.B. Von Dreele, General Structure Analysis System (GSAS),National Laboratory, Los Alamos, 2001.
[82] P. Thompson, D.E. Cox, J.B. Hastings, Rietveld refinement of Debye-Scherrersynchrotron X-ray data from Al2O3, J. Appl. Cryst. 20 (1987) 79–83.
[83] L.W. Finger, D.E. Cox, A.P. Jephcoat, A correction for powder diffraction peakasymmetry due to axial divergence, J. Appl. Cryst. 27 (1994) 892–900.
[84] P.W. Stephens, Phenomenological model of anisotropic peak broadening inpowder diffraction, J. Appl. Cryst. 32 (1999) 281–289.
[85] P.F. Schofield, K.S. Knight, S.A.T. Redfern, G. Cressey, Distortion characteristicsacross the structural phase transition in (Cul-xZnx)WO4, Acta Cryst. Sec. B 53(1997) 102–112.
[86] K. Momma, F. Izumi, VESTA: a three-dimensional visualization system forelectronic and structural analysis, J. Appl. Crystallogr. 41 (2008) 653–658.
[87] K. Momma, F. Izumi, VESTA 3 for three-dimensional visualization of crystal,volumetric and morphology data, J. Appl. Crystallogr. 44 (2011) 1272–1276.
[88] L.S. Cavalcante, E. Moraes, M.A.P. Almeida, C.J. Dalmaschio, N.C. Batista, J.A.Varela, E. Longo, M. Siu Li, J. Andres, A. Beltran, A combined theoretical andexperimental study of electronic structure and optical properties of b-ZnMoO4 microcrystals, Polyhedron 54 (2013) 13–25.
[89] I.M. Pinatti, I.C. Nogueira, W.S. Pereira, P.F.S. Pereira, R.F. Gonçalves, J.A.Varela, E. Longo, I.L.V. Rosa, Structural and photoluminescence properties ofEu3+ doped a-Ag2WO4 synthesized by the green coprecipitationmethodology, Dalton Trans. 44 (2015) 17673–17685.
[90] R.L. Frost, L. Duong, M. Weier, Raman microscopy of selected tungstateminerals, Spectrochim. Acta Part A 60 (2004) 1853–1859.
[91] T.T. Basiev, A.A. Sobol, Y.K. Voronko, P.G. Zverev, Spontaneous Ramanspectroscopy of tungstate and molybdate crystals for Raman lasers, Opt.Mater. 15 (2000) 205–2016.
[92] R.K. Selvan, A. Gedanken, The sonochemical synthesis and characterization ofCu1�xNixWO4 nanoparticles/nanorods and their application inelectrocatalytic hydrogen evolution, Nanotechnology 20 (2009) 105602–105608.
[93] L.S. Cavalcante, M.A.P. Almeida, W. Avansi Jr., R.L. Tranquilin, E. Longo, N.C.Batista, V.R. Mastelaro, M. Siu Li, Cluster coordination andphotoluminescence properties of a–Ag2WO4 microcrystals, Inorg. Chem. 51(2012) 10675–10687.
270 E.L.S. Souza et al. / Ultrasonics Sonochemistry 38 (2017) 256–270
[94] J. Ruiz-Fuertes, J. Pellicer-Porres, A. Segura, P. Rodríguez-Hernández, A.Muñoz, Lattice and electronic contributions to the refractive index of CuWO4,J. Appl. Phys. 116 (2014) 103706–103711.
[95] H. Ramezanalizadeh, F. Manteghi, Design and development of a novel BiFeO3/CuWO4 heterojunction with enhanced photocatalytic performance for thedegradation of organic dyes, J. Photochem. Photobiol. A Chem. 338 (2017)60–71.
[96] A. Anspoks, A. Kalinko, J. Timoshenko, A. Kuzmin, Local structure relaxation innanosized tungstates, Solid State Commun. 183 (2014) 22–26.
[97] G.M. Clark, W.P. Doyle, Infra-red spectra of anhydrous molybdates andtungstates, Spectrochim. Acta 22 (1966) 1441–1447.
[98] A.W. Sleight, High pressure CuMoO4, Mater. Res. Bull. 8 (1973) 863–866.
[99] L. Liang, H. Liu, Y. Tian, Q. Hao, C. Liu, W. Wang, X. Xie, Fabrication of novelCuWO4 hollow microsphere photocatalyst for dye degradation under visible-light irradiation, Mater. Lett. 182 (2016) 302–304.
[100] S.M. Hosseinpour-mashkani, A. Sobhani-Nasa, Simple synthesis andcharacterization of copper tungstate nanoparticles: investigation ofsurfactant effect and its photocatalyst application, J. Mater. Sci. Mater.Electron. 27 (2016) 7548–7553.
[101] W. Ye, F. Chen, F. Zhao, N. Han, Y. Li, CuWO4 nanoflake array-based single-junction and heterojunction photoanodes for photoelectrochemical wateroxidation, ACS Appl. Mater. Interf. 8 (2016) 9211–9217.
[102] R.D. Kumar, Y. Andou, M. Sathish, S. Karuppuchamy, Synthesis ofnanostructured Cu-WO3 and CuWO4 for supercapacitor applications, J.Mater. Sci. Mater. Electron. 27 (2016) 2926–2932.
[103] X. Xie, M. Liu, C. Wang, L. Chen, J. Xu, Y. Cheng, H. Dong, F. Lu, W.H. Wang, H.Liu, W. Wang, Efficient photo-degradation of dyes using CuWO4
nanoparticles with electron sacrificial agents: a combination ofexperimental and theoretical exploration, RSC Adv. 6 (2016) 953–959.
[104] E. Limpert, W. Stahel, M. Abbt, Log-normal distributions across the sciences:keys and clues, BioScience 51 (2001) 341–352.
[105] P. Kubelka, F. Munk, Ein Beitrag zur optik der farbanstriche, Z. Fur Tech. Phys.12 (1931) 593–601.
[106] M.L. Myrick, M.N. Simcock, M. Baranowski, H. Brooke, S.L. Morgan, J.N.Mccutcheon, The Kubelka-Munk diffuse reflectance formula revisited, Appl.Spectrosc. Rev. 46 (2011) 140–165.
[107] R.A. Smith, Semiconductors, second ed., vol. 1, Cambridge University Press,London, 1978.
[108] R. Lacomba-Perales, J. Ruiz-Fuertes, D. Errandonea, D. Martınez-Garcıa, A.Segura, Optical absorption of divalent metal tungstates: correlation betweenthe band-gap energy and the cation ionic radius, Europhys. Lett. 83 (2008)37002–37011.
[109] E. Longo, D.P. Volanti, V.M. Longo, L. Gracia, I.C. Nogueira, M.A.P. Almeida, A.N. Pinheiro, M.M. Ferrer, L.S. Cavalcante, J. Andres, Toward an understandingof the growth of ag filaments on a-Ag2WO4 and their photoluminescentproperties: a combined experimental and theoretical study, J. Phys. Chem. C118 (2014) 1229–1239.
[110] R.A. Roca, J.C. Sczancoski, I.C. Nogueira, M.T. Fabbro, H.C. Alves, L. Gracia, L.P.S. Santos, C.P. de Sousa, J. Andrés, G.E. Luz Jr., E. Longo, L.S. Cavalcante, Facet-dependent photocatalytic and antibacterial properties of a-Ag2WO4 crystals:combining experimental data and theoretical insights, Catal. Sci. Technol. 5(2015) 4091–4107.
[111] M. Massoud, Blackbody Radiation. Engineering Thermofluids:Thermodynamics, Fluid Mechanics, and Heat Transfer, Springer-Verlag,Berling, 2005.