
Structural Mechanism of Transcriptional Autorepression of ...
Distribution Statement A. Approved for public release.
STRUCTURAL CHARACTERISTICS AND SWELLING MECHANISM OF TWO
COMMERCIAL NITRILE-BUTADIENE ELASTOMERS IN VARIOUS FLUIDS
M.S.Seehra*, M.Yalamanchi and V.Singh
Department of Physics, West Virginia University, Morgantown, WV 26506, USA
---------------------------------------------------------------------------------------------------------------------
ABSTRACT
Results on the structural characteristics and swelling mechanisms of the two commercial
elastomers viz. N0674-70 and peroxide cured N0741-75 in a variety of fluids are reported here.
The fluids used in these investigations included toluene, o-xylene, p-xylene, mesitylene, HISOL-
15, n-hexane, ethanol, tert-butyl alcohol, acetone, JP-8, S-8 and blends of S-8 plus HISOL-15
and S-8 plus toluene. Both changes in mass and volume of the rectangular disks of the samples
were monitored as a function of time. Structural characterization of the elastomer was done using
x-ray diffraction and FTIR spectroscopy. Time dependence of the recovery of swelling after the
elastomers are taken out of the fluids was monitored by x-ray diffraction and changes in mass. In
general swelling of the peroxide cured N0741-75 was less than that of N0674-70, percentage
changes in mass were less than the percentage changes in volume, and the swelling is strongly
fluid dependent.
For initial times, the swelling is interpreted in terms of diffusion of the fluid into the
elastomer. However, diffusion is not strictly Fickian in that the exponent differs from 0.5 for
Fickian diffusion, instead varying between 0.4 and 0.6 for different fluids. It is shown that the
results of maximum swelling can be interpreted in terms of compatibility of the Hansen
Solubility Parameters (HSP's) of the fluid and the elastomer, swelling decreasing on a Gaussian
curve as the HSP of the fluid deviates from that of the elastomer. Also, swelling is determined by
the polybutadiene component of the elastomer. In HISOL-15, a commercial aromatic solvent,
nitriles swell by about 55% and mixing of HISOL-15 with S-8 produces swelling linearly
proportional to the % of mixed HISOL-15. The observed few percent decrease in swelling on
long-term exposure may be related to loss of material and so eventual failure of the nitrile O-
rings.
Report Documentation Page Form ApprovedOMB No. 0704-0188
Public reporting burden for the collection of information is estimated to average 1 hour per response, including the time for reviewing instructions, searching existing data sources, gathering andmaintaining the data needed, and completing and reviewing the collection of information. Send comments regarding this burden estimate or any other aspect of this collection of information,including suggestions for reducing this burden, to Washington Headquarters Services, Directorate for Information Operations and Reports, 1215 Jefferson Davis Highway, Suite 1204, ArlingtonVA 22202-4302. Respondents should be aware that notwithstanding any other provision of law, no person shall be subject to a penalty for failing to comply with a collection of information if itdoes not display a currently valid OMB control number.
1. REPORT DATE 06 JAN 2012
2. REPORT TYPE Journal Article
3. DATES COVERED 06-01-2012 to 06-01-2012
4. TITLE AND SUBTITLE STRUCTURAL CHARACTERISTICS AND SWELLINGMECHANISM OF TWO COMMERICAL NITRILE-BUTADIENEELASTOMERS IN VARIOUS FLUIDS
5a. CONTRACT NUMBER w56hzv-07-c-0721
5b. GRANT NUMBER
5c. PROGRAM ELEMENT NUMBER
6. AUTHOR(S) M. Seehra; M. Yalamanchi; V. Singh
5d. PROJECT NUMBER
5e. TASK NUMBER
5f. WORK UNIT NUMBER
7. PERFORMING ORGANIZATION NAME(S) AND ADDRESS(ES) West Virginia University,Department of Physics,Morgantown,VA,26506
8. PERFORMING ORGANIZATION REPORT NUMBER ; #22413
9. SPONSORING/MONITORING AGENCY NAME(S) AND ADDRESS(ES) U.S. Army TARDEC, 6501 E.11 Mile Rd, Warren, MI, 48397-5000
10. SPONSOR/MONITOR’S ACRONYM(S) TARDEC
11. SPONSOR/MONITOR’S REPORT NUMBER(S) #22413
12. DISTRIBUTION/AVAILABILITY STATEMENT Approved for public release; distribution unlimited
13. SUPPLEMENTARY NOTES
14. ABSTRACT Results on the structural characteristics and swelling mechanisms of the two commercial elastomers viz.N0674-70 and peroxide cured N0741-75 in a variety of fluids are reported here. The fluids used in theseinvestigations included toluene, o-xylene, p-xylene, mesitylene, HISOL-15, n-hexane, ethanol, tert-butylalcohol, acetone, JP-8, S-8 and blends of S-8 plus HISOL-15 and S-8 plus toluene. Both changes in massand volume of the rectangular disks of the samples were monitored as a function of time. Structuralcharacterization of the elastomer was done using x-ray diffraction and FTIR spectroscopy. Timedependence of the recovery of swelling after the elastomers are taken out of the fluids was monitored byx-ray diffraction and changes in mass. In general swelling of the peroxide cured N0741-75 was less thanthat of N0674-70, percentage changes in mass were less than the percentage changes in volume, and theswelling is strongly fluid dependent. For initial times, the swelling is interpreted in terms of diffusion of thefluid into the elastomer. However, diffusion is not strictly Fickian in that the exponent differs from 0.5 forFickian diffusion, instead varying between 0.4 and 0.6 for different fluids. It is shown that the results ofmaximum swelling can be interpreted in terms of compatibility of the Hansen Solubility Parameters(HSP’s) of the fluid and the elastomer, swelling decreasing on a Gaussian curve as the HSP of the fluiddeviates from that of the elastomer. Also, swelling is determined by the polybutadiene component of theelastomer. In HISOL-15, a commercial aromatic solvent, nitriles swell by about 55% and mixing ofHISOL-15 with S-8 produces swelling linearly proportional to the % of mixed HISOL-15. The observedfew percent decrease in swelling on long-term exposure may be related to loss of material and so eventualfailure of the nitrile O-rings.

15. SUBJECT TERMS
16. SECURITY CLASSIFICATION OF: 17. LIMITATIONOF ABSTRACT
Same asReport (SAR)
18. NUMBEROF PAGES
23
19a. NAME OFRESPONSIBLE PERSON
a. REPORT unclassified
b. ABSTRACT unclassified
c. THIS PAGE unclassified
Standard Form 298 (Rev. 8-98) Prescribed by ANSI Std Z39-18
UNCLASSIFIED
UNCLASSIFIED
1. Introduction
The engines in most of the modern transportation vehicles used in the civilian and
military sectors are designed for fuels derived from the conventional petroleum crude oil. These
fuels contain a certain percentage of aromatics and sulfur which provide lubricity and the desired
amount of elastomer swelling of the O-rings to prevent fuel leaks. The synthetic fuels produced
by Fischer-Tropsch synthesis, if used in such engines, will have to be blended by appropriate
additives to achieve the desired amount of lubricity and elastomer swelling. Therefore it is highly
desirable to investigate and understand the swelling characteristics of commercial level
elastomers in different fluids.
Nitrile rubber elastomers are copolymers of polyacrylonitrile, -(CH2=CH-C≡N)-n and
polybutadiene, -(CH2-CH=CH-CH2)-n. The characteristics of a given elastomer are therefore
expected to depend on the percentages of these two primary components in the elastomer. In
recent years, results from a number of investigations have appeared in literature [1-5] in which
the authors have varied the relative compositions of these two components in laboratory prepared
samples and investigated their swelling characteristics in aromatics such as benzene, toluene and
xylene. These studies have provided considerable insight into such factors on the role of molar
volume of the fluid on its diffusion into specimens of various compositions [1-5].
The commercial elastomers such as O-rings usually contain additional components such
as plasticizers, fillers and curing agents in addition to polyacrylonitrile and polybutadiene. In
addition, the relative percentages of these components in a given elastomer are usually a trade
secret and not known accurately. A few years ago, Muzzell et al [6] carried out investigations of
the swelling and compatibility of three commercial elastomers (see Table 1) in synthetic S-5 fuel
blended with various percentages of the commercial A-150 aromatic solvent and in JP-5/JP-8
aviation fuels. In these investigations, magnitudes of the saturation swelling achieved after
several days of immersion in a fluid was the primary focus of attention. This work was followed
up by investigations by Graham et al [7] on the swelling characteristics of commercial nitrile O-
rings in selected aromatics blended in synthetic jet fuel.
The present study was undertaken to investigate the swelling characteristics of the same
there elastomers (Table 1) as used in the work by Muzzell et al [6] with a goal to reach a more
fundamental understanding of how saturation is achieved in different fluids and how it depends
on the characteristics of the fluids. For this purpose, we have used a variety of fluids, both
UNCLASSIFIED
UNCLASSIFIED
aromatics and alkanes and measured the time dependence of changes in mass and volume of the
elastomers. The obtained results are discussed in terms of diffusion phenomenon and on the
properties of the fluids such as their molar volumes and their Hansen Solubility Parameters
(HSP) [8]. Results on the swelling characteristics of the elastomers in thirteen different fluids
and fluid blends are reported. The compatibility of the HSP’s of an elastomer and a fluid are
shown to control the swelling observed in a given fluid. Details of these results and discussion
are presented in the following pages.
2. Experimental Procedures
2.1 Materials
In our research work, two commercially available elastomers viz. N0674-70 and peroxide
cured N0741-75 from Parker Co. were studied. A third elastomer V0884-75 was also studied
initially, but no further experiments were conducted on it as this fluorocarbon (V0884-75) did
not show any significant change in mass or volume when immersed in a solvent. Consequently
no data on V0884-75 is reported here. The descriptions of the elastomers used in our work are
shown in Table 1 [6].
Table 1: Elastomers investigated in this work.
Elastomer Name Elastomer Description
N0674-70 70-durometer nitrile, general purpose
N0741-75 75-durometer nitrile, peroxide cured
V0884-75 75-durometer fluorocarbon, non-black filled
The two nitrile elastomers contain polyacrylonitrile and polybutadiene in various
proportions in addition to fillers to provide strength to the elastomers. These elastomers are
typically found in some fuel systems of Army tactical and combat vehicles [6]. The solvents used
for the experiments were toluene, o-xylene, p-xylene, mesitylene, HISOL-15, n-hexane, ethanol,
tert-butyl alcohol, acetone, JP-8, S-8 and blends of S-8 plus HISOL-15 and S-8 plus toluene.
HISOL-15, a universal aromatic solvent, was kindly provided by SHELL Co. and JP-8 and S-8
were obtained through the courtesy of Pat Muzzell. All other fluids were purchased from
commercial sources (Alfa Aesar).
UNCLASSIFIED
UNCLASSIFIED
2.2 Procedures for measuring swelling:
From the available elastomers coupons, small rectangular disks were cut by means of a
sharp edged knife. The thickness, length and width of the disks were measured using a vernier
caliper with an accuracy of ±0.01 mm with typical dimensions of samples being about 10 x 10 x
2 mm3. All measurements were done at room temperature. For mass changes, we followed the
ASTM D471 method using a using a sensitive balance with an accuracy of ±0.1 mg. These
rectangular disk-shaped samples were immersed in about 20-30 ml of the solvent in small glass
test bottles. To measure changes with time, the immersed samples were periodically removed
from the glass bottle, the solvent on the elastomers was wiped off quickly using wipes, and the
sample was then weighed using the sensitive balance. The dimensions of the sample were
measured using the vernier caliper and the results were recorded. After measuring the weight and
the dimensions, the elastomer is immediately placed back in the bottle with the solvent. The time
taken for each set of measurements was kept to a minimum and was approximately 50-60
seconds. This procedure was continued until no change in the weight and volume was observed
in the elastomer i.e. until the elastomer swelling reaches saturation.
3. Structural Characterization of Elastomers
3.1 Fourier Transform Infra-red Spectroscopy (FTIR)
The primary area of focus was acquiring IR spectra of the two elastomer samples using
FTIR spectroscopy to study the chemical structure of the species present in the samples. A
Mattson Infinity Gold FTIR spectrometer was used to obtain the IR spectra. The IR spectrum of
polybutadiene and raw polyacrylonitrile butadiene sample was also acquired to examine how
different the chemical structure of the commercially available elastomer is when compared to the
pure elastomer sample. Techniques of attenuated total reflectance (ATR), photoacoustic
spectroscopy (PAS) and transmission spectroscopy using standard KBr method were tried to
obtain the best signal to noise IR spectra. For PAS and KBr methods, the samples were
powdered using laboriously hand grinding the samples on a plane white paper to obtain very fine
powder of these difficult-to-grind polymers.
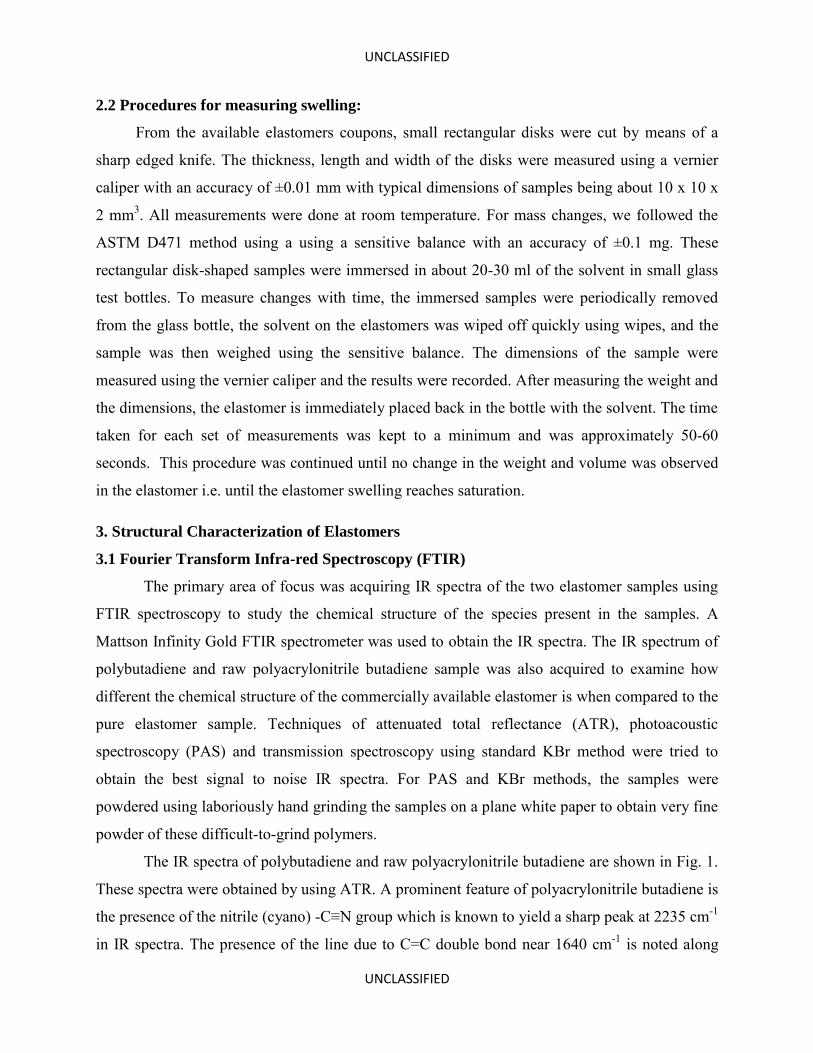
The IR spectra of polybutadiene and raw polyacrylonitrile butadiene are shown in Fig. 1.
These spectra were obtained by using ATR. A prominent feature of polyacrylonitrile butadiene is
the presence of the nitrile (cyano) -C≡N group which is known to yield a sharp peak at 2235 cm-1
in IR spectra. The presence of the line due to C=C double bond near 1640 cm-1 is noted along
UNCLASSIFIED
UNCLASSIFIED
with significant peaks near 1440 cm-1 and 969 cm-1 due to C-H bond in the butadiene part of the
nitrile rubber.
Figure 1: IR spectra of Polybutadiene and raw Polyacrylonitrile Butadiene acquired using ATR technique.
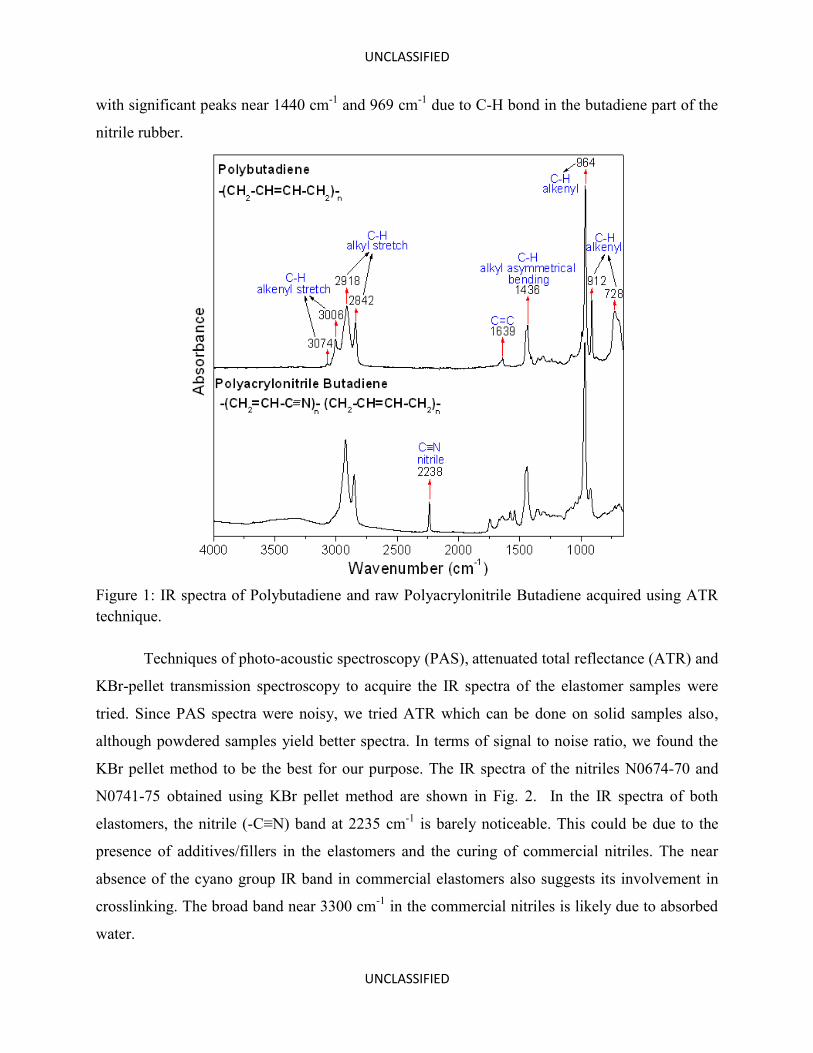
Techniques of photo-acoustic spectroscopy (PAS), attenuated total reflectance (ATR) and
KBr-pellet transmission spectroscopy to acquire the IR spectra of the elastomer samples were
tried. Since PAS spectra were noisy, we tried ATR which can be done on solid samples also,
although powdered samples yield better spectra. In terms of signal to noise ratio, we found the
KBr pellet method to be the best for our purpose. The IR spectra of the nitriles N0674-70 and
N0741-75 obtained using KBr pellet method are shown in Fig. 2. In the IR spectra of both
elastomers, the nitrile (-C≡N) band at 2235 cm-1 is barely noticeable. This could be due to the
presence of additives/fillers in the elastomers and the curing of commercial nitriles. The near
absence of the cyano group IR band in commercial elastomers also suggests its involvement in
crosslinking. The broad band near 3300 cm-1 in the commercial nitriles is likely due to absorbed
water.
UNCLASSIFIED
UNCLASSIFIED
Figure 2: IR spectra of N0674-70 and N0741-75 obtained using KBr pellet method.
3.2 X-ray Diffraction (XRD)
To study the swelling process at the microscopic level, x-ray diffraction (XRD) studies
were carried out on the two elastomer samples, N0674-70 and N0741-75, for three cases: (i) as-
received samples, (ii) samples immersed in toluene overnight and (iii) the same sample in (ii)
aired for several days. Room temperature wide angle XRD scans of these samples were carried
out using a Rigaku (D-Max) diffractometer and CuKα source with wavelength λ=0.15418 nm.
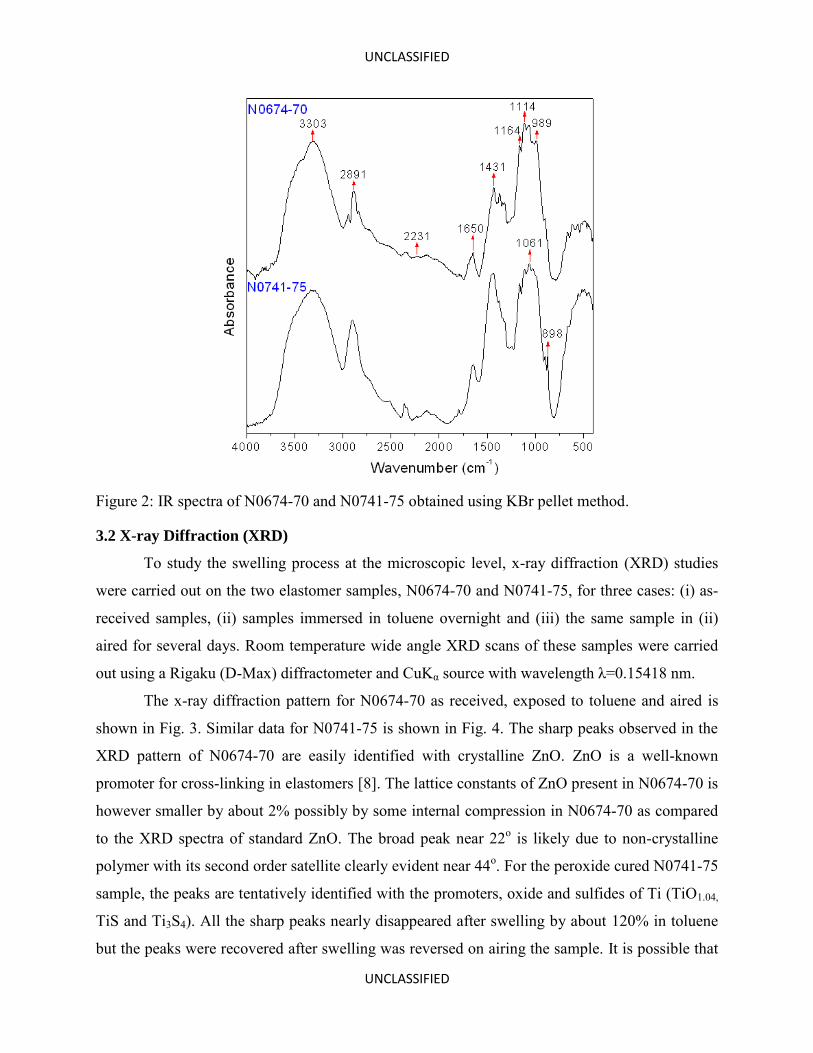
The x-ray diffraction pattern for N0674-70 as received, exposed to toluene and aired is
shown in Fig. 3. Similar data for N0741-75 is shown in Fig. 4. The sharp peaks observed in the
XRD pattern of N0674-70 are easily identified with crystalline ZnO. ZnO is a well-known
promoter for cross-linking in elastomers [8]. The lattice constants of ZnO present in N0674-70 is
however smaller by about 2% possibly by some internal compression in N0674-70 as compared
to the XRD spectra of standard ZnO. The broad peak near 22o is likely due to non-crystalline
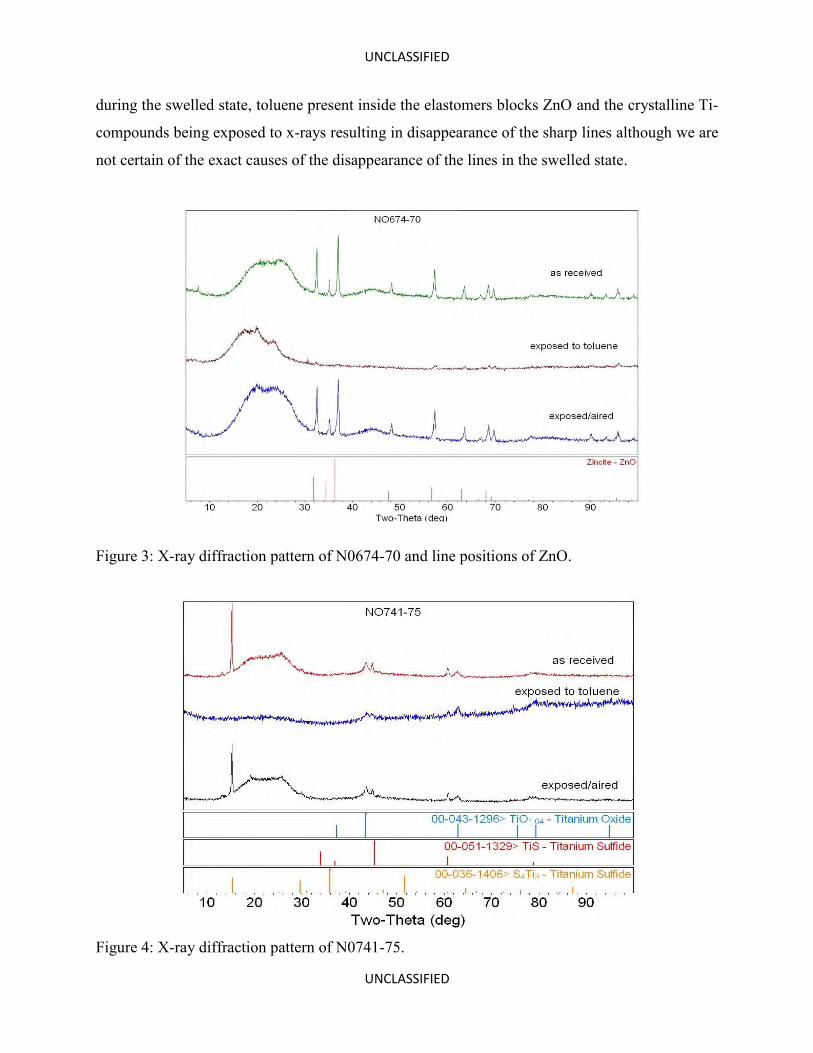
polymer with its second order satellite clearly evident near 44o. For the peroxide cured N0741-75
sample, the peaks are tentatively identified with the promoters, oxide and sulfides of Ti (TiO1.04,
TiS and Ti3S4). All the sharp peaks nearly disappeared after swelling by about 120% in toluene
but the peaks were recovered after swelling was reversed on airing the sample. It is possible that
UNCLASSIFIED
UNCLASSIFIED
during the swelled state, toluene present inside the elastomers blocks ZnO and the crystalline Ti-
compounds being exposed to x-rays resulting in disappearance of the sharp lines although we are
not certain of the exact causes of the disappearance of the lines in the swelled state.
Figure 3: X-ray diffraction pattern of N0674-70 and line positions of ZnO.
Figure 4: X-ray diffraction pattern of N0741-75.
UNCLASSIFIED
UNCLASSIFIED
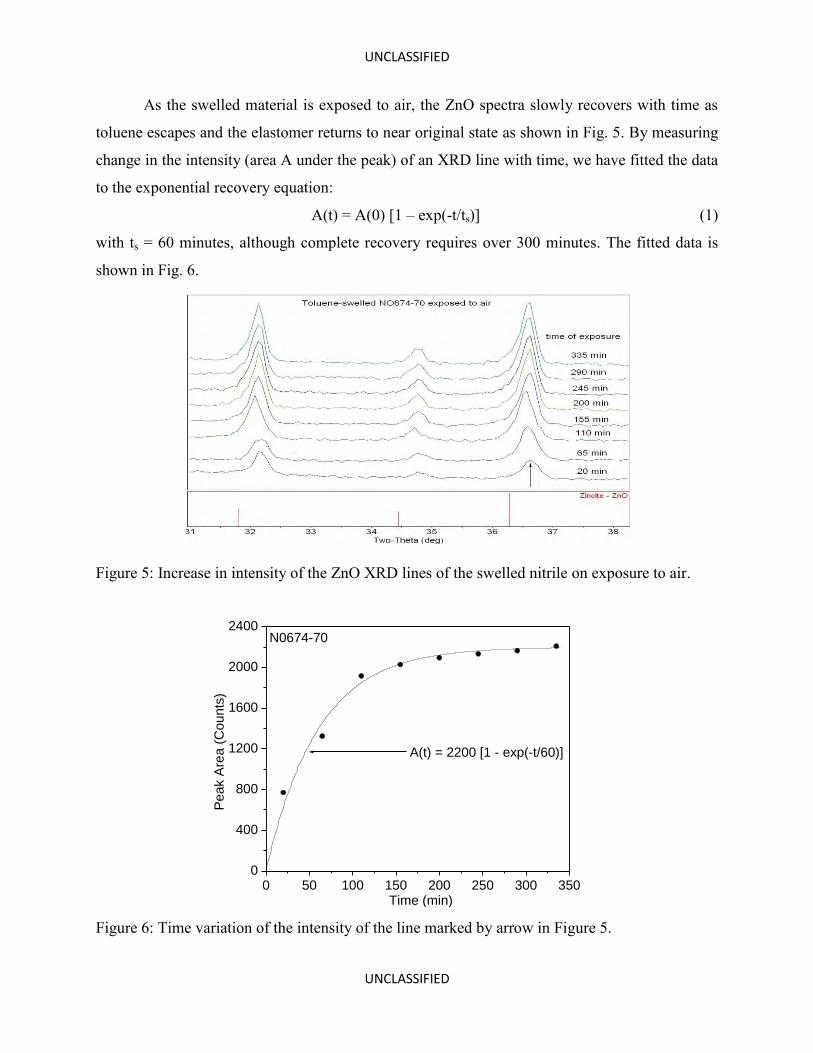
As the swelled material is exposed to air, the ZnO spectra slowly recovers with time as
toluene escapes and the elastomer returns to near original state as shown in Fig. 5. By measuring
change in the intensity (area A under the peak) of an XRD line with time, we have fitted the data
to the exponential recovery equation:
A(t) = A(0) [1 – exp(-t/ts)] (1)
with ts = 60 minutes, although complete recovery requires over 300 minutes. The fitted data is
shown in Fig. 6.
Figure 5: Increase in intensity of the ZnO XRD lines of the swelled nitrile on exposure to air.
Figure 6: Time variation of the intensity of the line marked by arrow in Figure 5.
0 50 100 150 200 250 300 3500
400
800
1200
1600
2000
2400
A(t) = 2200 [1 - exp(-t/60)]
N0674-70
Peak A
rea (
Counts
)
Time (min)
UNCLASSIFIED
UNCLASSIFIED
4. Experimental Results on Elastomer Swelling
4.1 Comparison of the change in mass and volume
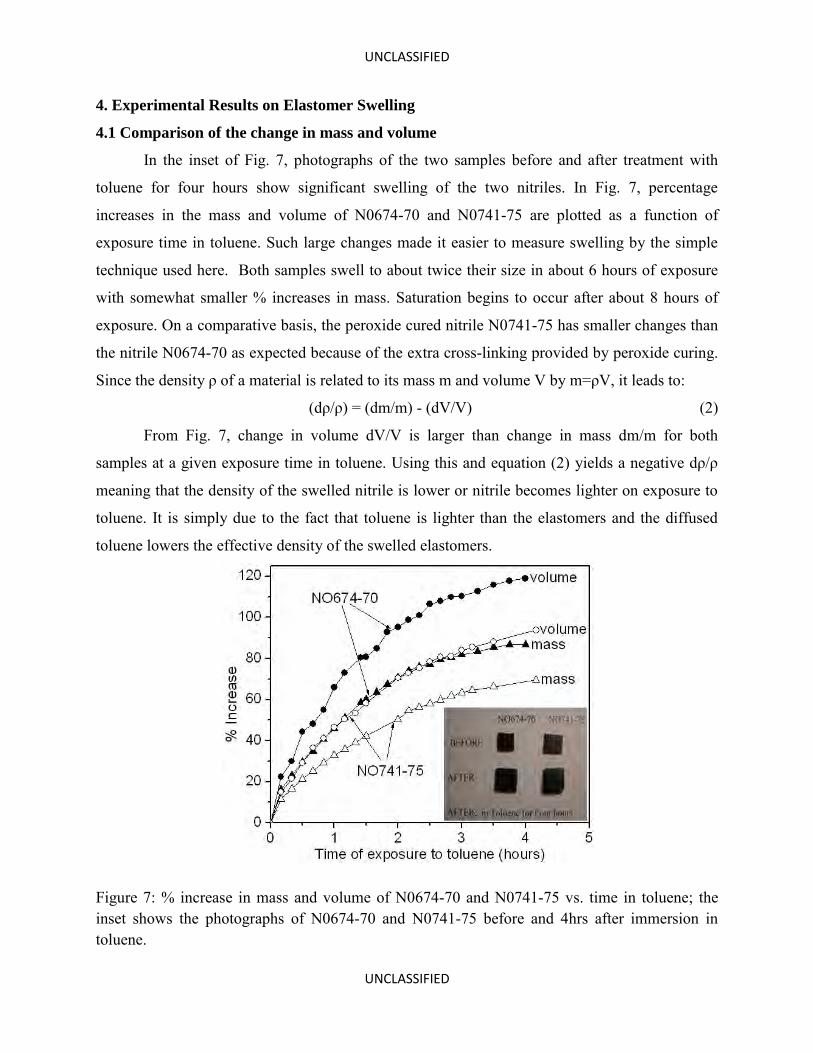
In the inset of Fig. 7, photographs of the two samples before and after treatment with
toluene for four hours show significant swelling of the two nitriles. In Fig. 7, percentage
increases in the mass and volume of N0674-70 and N0741-75 are plotted as a function of
exposure time in toluene. Such large changes made it easier to measure swelling by the simple
technique used here. Both samples swell to about twice their size in about 6 hours of exposure
with somewhat smaller % increases in mass. Saturation begins to occur after about 8 hours of
exposure. On a comparative basis, the peroxide cured nitrile N0741-75 has smaller changes than
the nitrile N0674-70 as expected because of the extra cross-linking provided by peroxide curing.
Since the density ρ of a material is related to its mass m and volume V by m=ρV, it leads to:
(dρ/ρ) = (dm/m) - (dV/V) (2)
From Fig. 7, change in volume dV/V is larger than change in mass dm/m for both
samples at a given exposure time in toluene. Using this and equation (2) yields a negative dρ/ρ
meaning that the density of the swelled nitrile is lower or nitrile becomes lighter on exposure to
toluene. It is simply due to the fact that toluene is lighter than the elastomers and the diffused
toluene lowers the effective density of the swelled elastomers.
Figure 7: % increase in mass and volume of N0674-70 and N0741-75 vs. time in toluene; the inset shows the photographs of N0674-70 and N0741-75 before and 4hrs after immersion in toluene.
UNCLASSIFIED
UNCLASSIFIED
4.2 Time dependence of swelling of elastomer
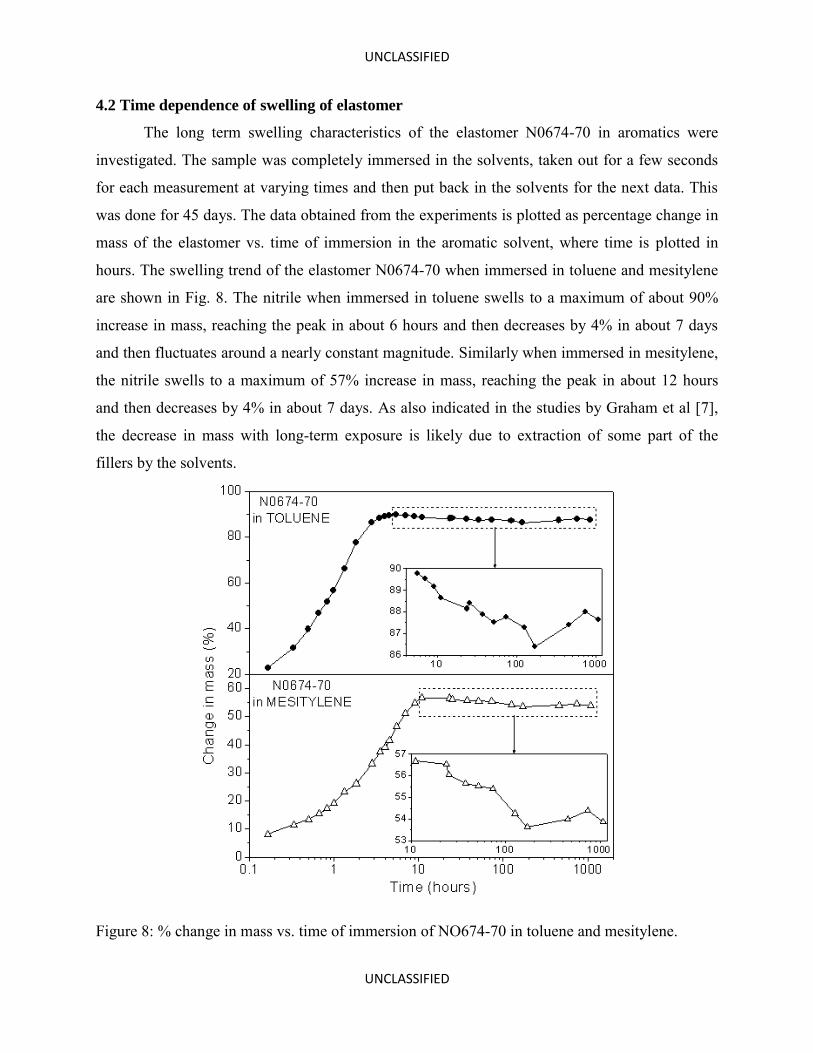
The long term swelling characteristics of the elastomer N0674-70 in aromatics were
investigated. The sample was completely immersed in the solvents, taken out for a few seconds
for each measurement at varying times and then put back in the solvents for the next data. This
was done for 45 days. The data obtained from the experiments is plotted as percentage change in
mass of the elastomer vs. time of immersion in the aromatic solvent, where time is plotted in
hours. The swelling trend of the elastomer N0674-70 when immersed in toluene and mesitylene
are shown in Fig. 8. The nitrile when immersed in toluene swells to a maximum of about 90%
increase in mass, reaching the peak in about 6 hours and then decreases by 4% in about 7 days
and then fluctuates around a nearly constant magnitude. Similarly when immersed in mesitylene,
the nitrile swells to a maximum of 57% increase in mass, reaching the peak in about 12 hours
and then decreases by 4% in about 7 days. As also indicated in the studies by Graham et al [7],
the decrease in mass with long-term exposure is likely due to extraction of some part of the
fillers by the solvents.
Figure 8: % change in mass vs. time of immersion of NO674-70 in toluene and mesitylene.
UNCLASSIFIED
UNCLASSIFIED
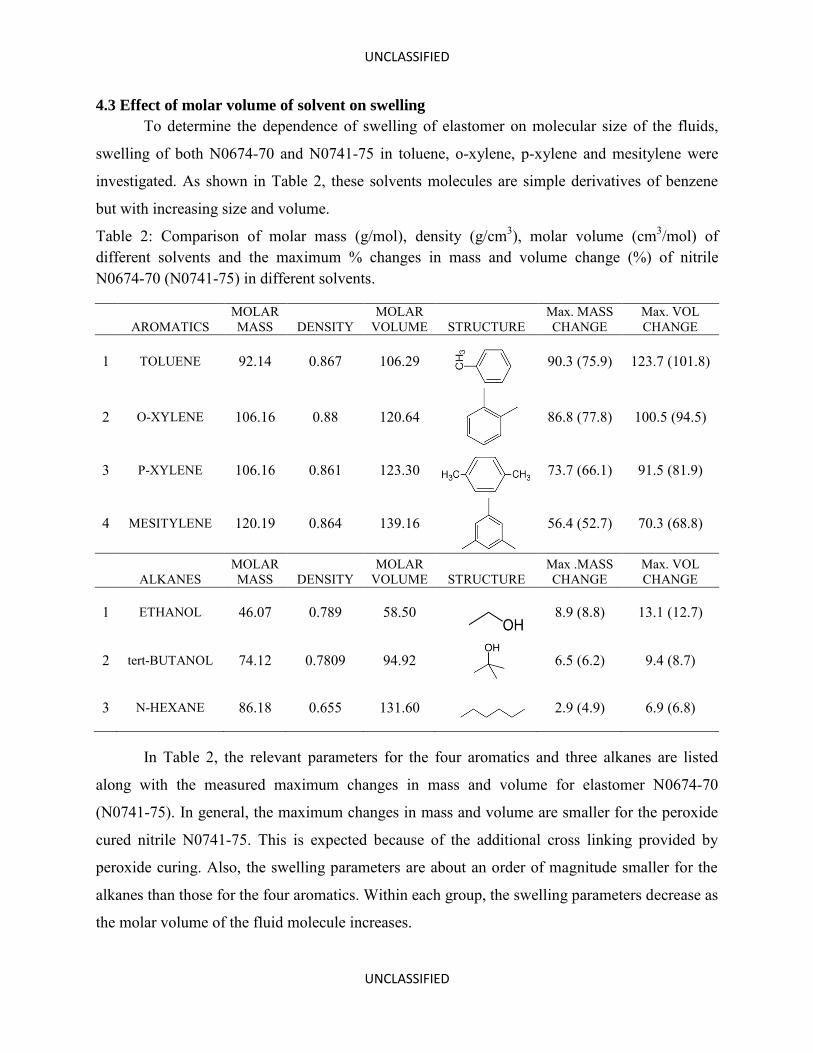
4.3 Effect of molar volume of solvent on swelling
To determine the dependence of swelling of elastomer on molecular size of the fluids,
swelling of both N0674-70 and N0741-75 in toluene, o-xylene, p-xylene and mesitylene were
investigated. As shown in Table 2, these solvents molecules are simple derivatives of benzene
but with increasing size and volume.
Table 2: Comparison of molar mass (g/mol), density (g/cm3), molar volume (cm3/mol) of different solvents and the maximum % changes in mass and volume change (%) of nitrile N0674-70 (N0741-75) in different solvents.
AROMATICS MOLAR MASS DENSITY
MOLAR VOLUME STRUCTURE
Max. MASS CHANGE
Max. VOL CHANGE
1 TOLUENE 92.14 0.867 106.29
90.3 (75.9) 123.7 (101.8)
2 O-XYLENE 106.16 0.88 120.64
86.8 (77.8) 100.5 (94.5)
3 P-XYLENE 106.16 0.861 123.30
73.7 (66.1) 91.5 (81.9)
4 MESITYLENE 120.19 0.864 139.16
56.4 (52.7) 70.3 (68.8)
ALKANES MOLAR MASS DENSITY
MOLAR VOLUME STRUCTURE
Max .MASS CHANGE
Max. VOL CHANGE
1 ETHANOL 46.07 0.789 58.50
8.9 (8.8) 13.1 (12.7)
2 tert-BUTANOL 74.12 0.7809 94.92
6.5 (6.2) 9.4 (8.7)
3 N-HEXANE 86.18 0.655 131.60
2.9 (4.9) 6.9 (6.8)
In Table 2, the relevant parameters for the four aromatics and three alkanes are listed
along with the measured maximum changes in mass and volume for elastomer N0674-70
(N0741-75). In general, the maximum changes in mass and volume are smaller for the peroxide
cured nitrile N0741-75. This is expected because of the additional cross linking provided by
peroxide curing. Also, the swelling parameters are about an order of magnitude smaller for the
alkanes than those for the four aromatics. Within each group, the swelling parameters decrease as
the molar volume of the fluid molecule increases.
UNCLASSIFIED
UNCLASSIFIED
The three alkanes, ethyl alcohol, tert-butanol and n-hexane, are non-polar molecules and
so have only weak chemical interaction with the polar nitrile bond of the elastomers. On the
other hand, the aromatics have a polar character and act strongly with the elastomers. Also, the
larger molecules diffuse more slowly. So both the chemical interactions and molecular size
contribute to the observe swelling of the elastomers.
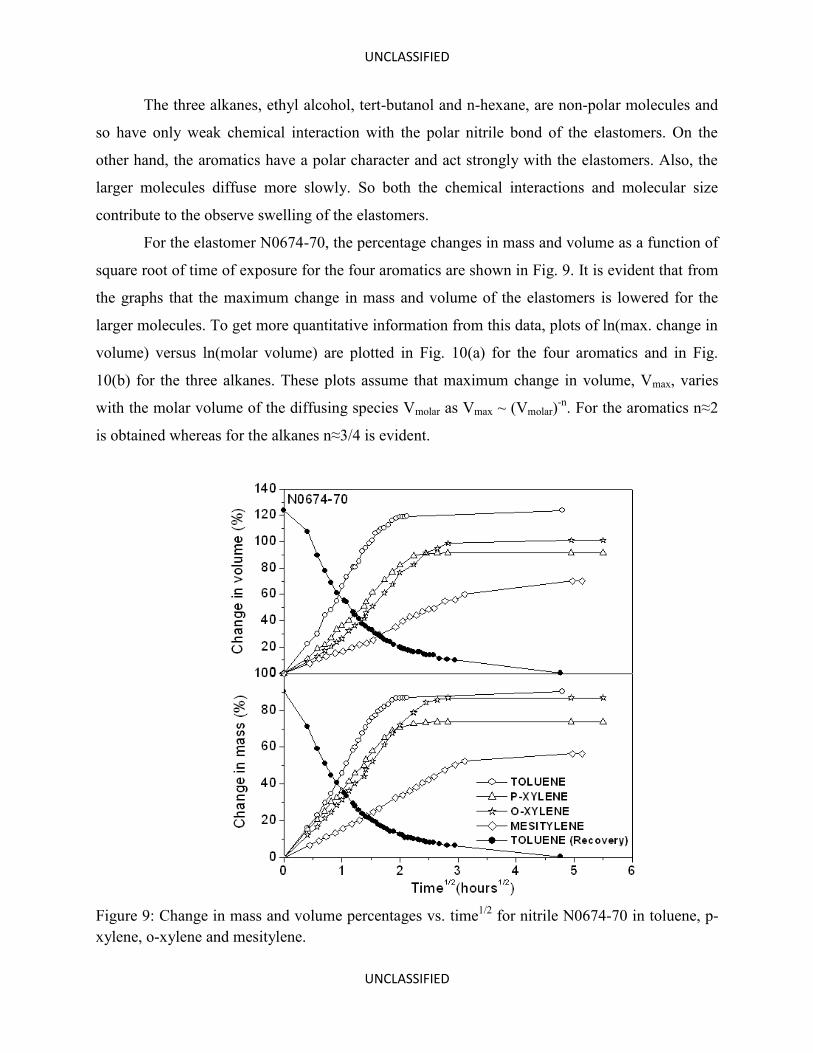
For the elastomer N0674-70, the percentage changes in mass and volume as a function of
square root of time of exposure for the four aromatics are shown in Fig. 9. It is evident that from
the graphs that the maximum change in mass and volume of the elastomers is lowered for the
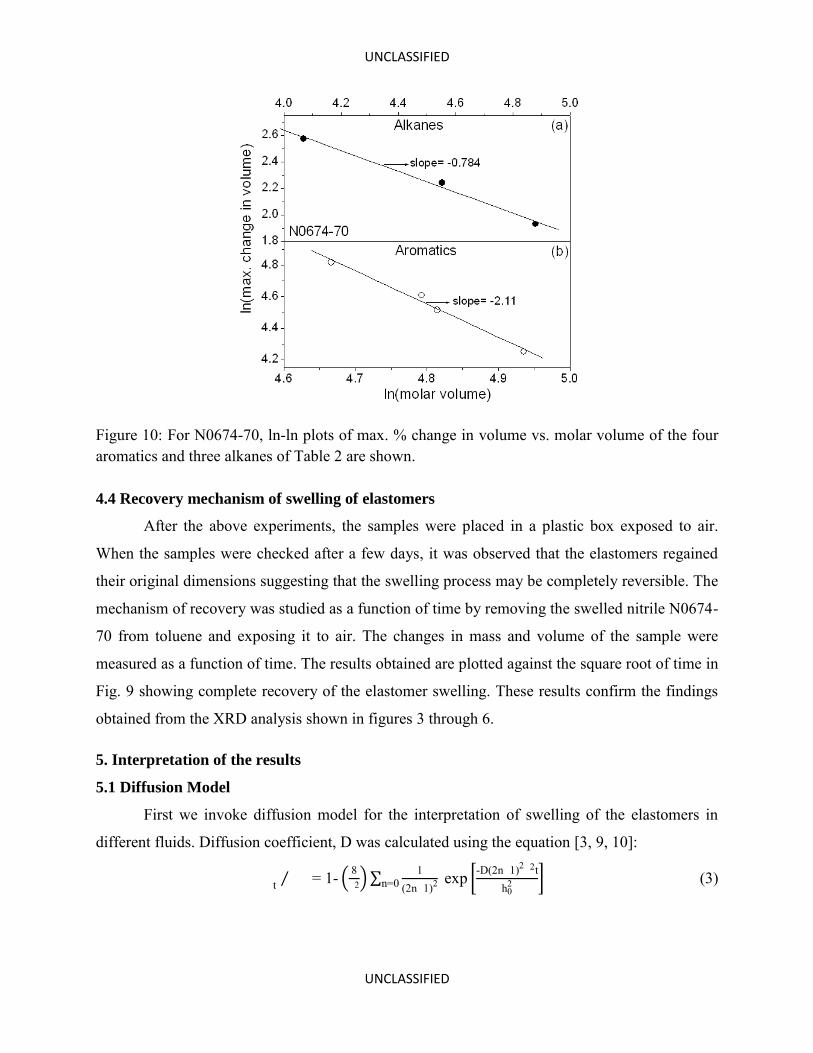
larger molecules. To get more quantitative information from this data, plots of ln(max. change in
volume) versus ln(molar volume) are plotted in Fig. 10(a) for the four aromatics and in Fig.
10(b) for the three alkanes. These plots assume that maximum change in volume, Vmax, varies
with the molar volume of the diffusing species Vmolar as Vmax ~ (Vmolar)-n. For the aromatics n≈2
is obtained whereas for the alkanes n≈3/4 is evident.
Figure 9: Change in mass and volume percentages vs. time1/2 for nitrile N0674-70 in toluene, p-xylene, o-xylene and mesitylene.
UNCLASSIFIED
UNCLASSIFIED
Figure 10: For N0674-70, ln-ln plots of max. % change in volume vs. molar volume of the four aromatics and three alkanes of Table 2 are shown.
4.4 Recovery mechanism of swelling of elastomers
After the above experiments, the samples were placed in a plastic box exposed to air.
When the samples were checked after a few days, it was observed that the elastomers regained
their original dimensions suggesting that the swelling process may be completely reversible. The
mechanism of recovery was studied as a function of time by removing the swelled nitrile N0674-
70 from toluene and exposing it to air. The changes in mass and volume of the sample were
measured as a function of time. The results obtained are plotted against the square root of time in
Fig. 9 showing complete recovery of the elastomer swelling. These results confirm the findings
obtained from the XRD analysis shown in figures 3 through 6.
5. Interpretation of the results
5.1 Diffusion Model
First we invoke diffusion model for the interpretation of swelling of the elastomers in
different fluids. Diffusion coefficient, D was calculated using the equation [3, 9, 10]:
t = 1- 8 2
1(2n 1)2
n=0 exp -D(2n 1)2 2t
h02 (3)
UNCLASSIFIED
UNCLASSIFIED
Here Qt and Q are defined as fractional change in mass at time t relative to t= for Q
(saturation) and h0 is the thickness of the elastomer. For initial times, diffusion of a fluid in an
elastomer of thickness h0 follows the equation [4]:
Qt / Q = 4 (Dt / ho2)n (4)
Here n= 1/2 for Fickian diffusion for which a plot of (Qt / Q ) vs. (t1/2 / ho) should be linear with
the slope = 4(D / )1/2. This allows determination of D for a given solvent and an elastomer.
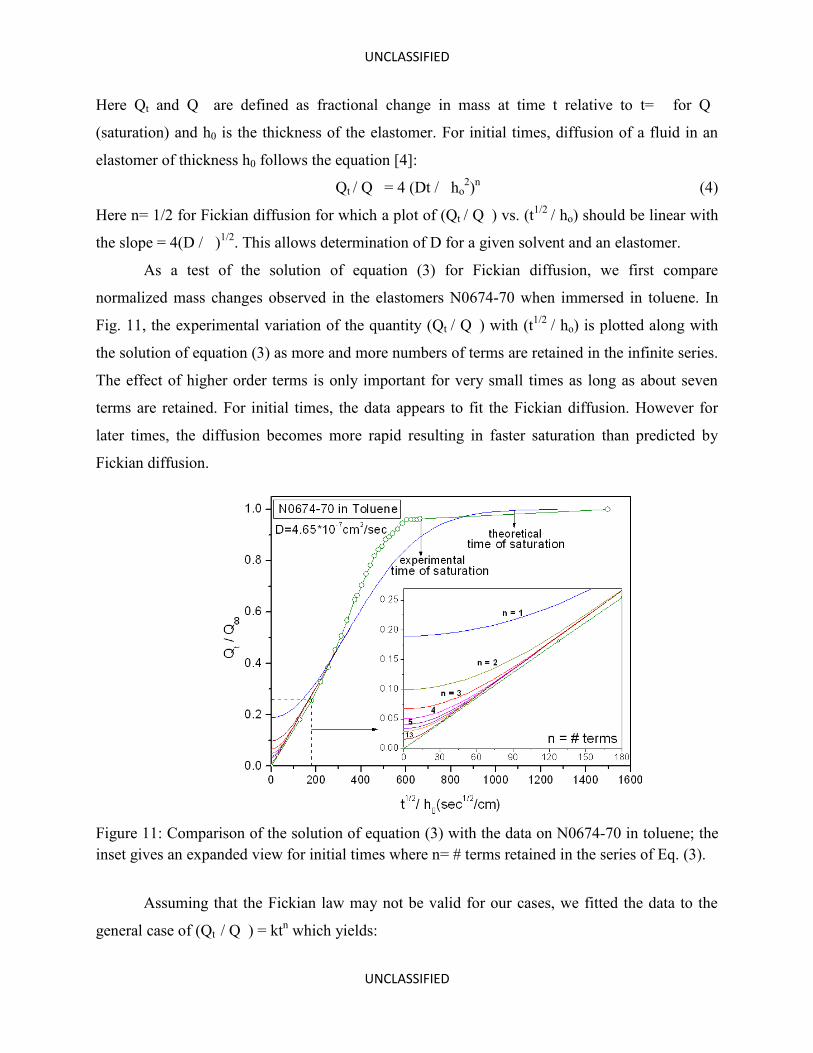
As a test of the solution of equation (3) for Fickian diffusion, we first compare
normalized mass changes observed in the elastomers N0674-70 when immersed in toluene. In
Fig. 11, the experimental variation of the quantity (Qt / Q ) with (t1/2 / ho) is plotted along with
the solution of equation (3) as more and more numbers of terms are retained in the infinite series.
The effect of higher order terms is only important for very small times as long as about seven
terms are retained. For initial times, the data appears to fit the Fickian diffusion. However for
later times, the diffusion becomes more rapid resulting in faster saturation than predicted by
Fickian diffusion.
Figure 11: Comparison of the solution of equation (3) with the data on N0674-70 in toluene; the inset gives an expanded view for initial times where n= # terms retained in the series of Eq. (3).
Assuming that the Fickian law may not be valid for our cases, we fitted the data to the
general case of (Qt / Q ) = ktn which yields:
UNCLASSIFIED
UNCLASSIFIED
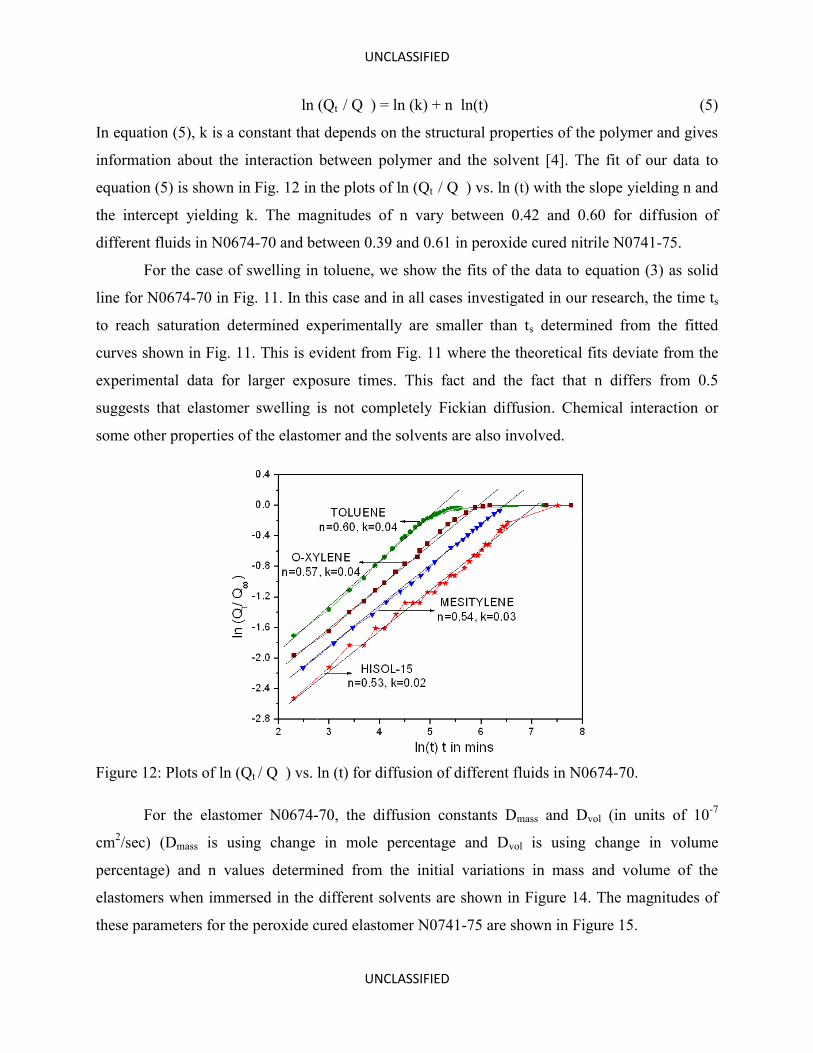
ln (Qt / Q ) = ln (k) + n ln(t) (5)
In equation (5), k is a constant that depends on the structural properties of the polymer and gives
information about the interaction between polymer and the solvent [4]. The fit of our data to
equation (5) is shown in Fig. 12 in the plots of ln (Qt / Q ) vs. ln (t) with the slope yielding n and
the intercept yielding k. The magnitudes of n vary between 0.42 and 0.60 for diffusion of
different fluids in N0674-70 and between 0.39 and 0.61 in peroxide cured nitrile N0741-75.
For the case of swelling in toluene, we show the fits of the data to equation (3) as solid
line for N0674-70 in Fig. 11. In this case and in all cases investigated in our research, the time ts
to reach saturation determined experimentally are smaller than ts determined from the fitted
curves shown in Fig. 11. This is evident from Fig. 11 where the theoretical fits deviate from the
experimental data for larger exposure times. This fact and the fact that n differs from 0.5
suggests that elastomer swelling is not completely Fickian diffusion. Chemical interaction or
some other properties of the elastomer and the solvents are also involved.
Figure 12: Plots of ln (Qt / Q ) vs. ln (t) for diffusion of different fluids in N0674-70.
For the elastomer N0674-70, the diffusion constants Dmass and Dvol (in units of 10-7
cm2/sec) (Dmass is using change in mole percentage and Dvol is using change in volume
percentage) and n values determined from the initial variations in mass and volume of the
elastomers when immersed in the different solvents are shown in Figure 14. The magnitudes of
these parameters for the peroxide cured elastomer N0741-75 are shown in Figure 15.
UNCLASSIFIED
UNCLASSIFIED
Figure 14: Comparison of Dmass, Dvol and n values of N0674-70 when immersed in the different solvents.
Figure 15: Comparison of Dmass, Dvol and n values of N0741-75 when immersed in the different solvents.
The main conclusions drawn from the diffusion experiments are as follows:
Swelling of elastomers in organic fluids occurs by diffusion of the fluid. However it also
depends on the properties of the fluid and the elastomer.
UNCLASSIFIED
UNCLASSIFIED
Uptake of the fluids as manifested in changes in mass and volume of the elastomers is
larger for N0674-70 than that for the peroxide cured N0741-75. This difference is likely
due to extra cross-linking produced by peroxide curing of N0741-75
Time to reach saturation in swelling varies inversely with D; larger the D, smaller is the
time needed to reach saturation. Mathematically this is also evident from equation (3)
since Dt appears in the exponent so that larger D will require fewer terms in the series.
Percentage change in volume is always larger than percentage change in mass because
the density of fluids is less than that of elastomer. The diffusion is only approximately Fickian since both the exponent n and the time ts
required for saturation are somewhat different than the prediction of the Fickian
diffusion.
The strength of the interaction of the aromatics (toluene, o-xylene, p-xylene, mesitylene,
HISOL-15) with the elastomers is nearly an order of magnitude larger than that of ethanol
and tert-butanol. These differences are likely due to the larger hydrogen bonding and
polar character of the aromatics [7].
5.2 Hansen Solubility Parameters
Our next effort on the interpretation of the results has been in terms of Hansen Solubility
Parameters (HSP’s), which are often used for understanding solubility of polymers in solvents.
The Hildebrand solubility parameter δ of a fluid is defined in terms of the cohesive energy
density (E/V) as:
δ = (E/V)1/2 (cal/cm3)1/2 (6)
where E is the measurable cohesive energy for a molar volume V of a fluid. Hansen extended
this concept by showing that contribution to E comes from three separate components: atomic
(dispersive) forces ED, molecular dipolar forces EP and molecular hydrogen bonding EH. This
leads to [11]:
δT2 = δd
2 δp2 δh
2 (7)
where δT2 = E/V, δd
2 = ED/V, δp2 = EP/V and δh
2 = EH/V. Here δd, δp and δh are the so called
Hansen solubility parameters (HSP).
The magnitudes of HSPs for standard solvents and polymers are now available in
literature [12]. The magnitudes of HSPs for various solvents used in our work are listed in Table
UNCLASSIFIED
UNCLASSIFIED
3 and those of the elastomers with different composition of polyacrylonitrile and polybutadiene
are listed in Table 4, the latter based on calculations.
Table 3: Hansen solubility parameters of various solvents.
Table 4: Hansen solubility parameters of various elastomers.
ELASTOMERS
HANSEN SOLUBILITY PARAMETERS δT δd δp δh Ro 1 ACRYLONITRILE BUTADINE ELASTOMER 21.0 18.6 8.8 4.2 9.62 2 POLYBUTADINE 18.0 17.5 2.3 3.4 6.55 3 POLYACRYLONITLE 27.4 21.7 14.1 9.1 10.9 POLYACRYLONITRILE POLYBUTADIENE 4 30.0% 70.0% 20.3 18.8 5.8 5.1 5 34.0% 66.0% 20.7 18.9 6.3 5.3 6 38.0% 62.0% 21.0 19.1 6.8 5.6 7 50.0% 50.0% 22.1 19.6 8.2 6.3
For any elastomer, in a 3D environment, if a sphere is drawn with its HSPs as the center
and radius Ro, all the solvents who’s HSPs fall within the sphere dissolve the elastomer
completely [12]. Using this concept one can identify the solvents which produce the maximum
change in volume and mass without performing the immersion tests. However the main difficulty
with this approach is the knowledge of Ro accurately which is often determined by measuring the
SOLVENTS
HANSEN SOLUBILITY PARAMETERS δT δd δp δh 1 TOLUENE 18.2 18.0 1.4 2.0 2 O-XYLENE 18.0 17.8 1.0 3.1 3 P-XYLENE 17.7 17.4 1.0 3.1 4 MESITYLENE 18.0 18.0 0.0 0.6 5 HISOL-15 17.7 17.4 0.0 3.1 6 JP-8 16.6 16.6 0.2 0.5 7 S-8 16.0 16.0 0.0 0.0 8 ETHYL ALCOHOL 26.5 15.8 8.8 19.4 9 TERT-BUTANOL 21.8 15.2 5.1 14.7 10 N-HEXANE 14.9 14.9 0 0 11 ACETONE 19.9 15.5 10.4 7.0 12 S8 + 20% HISOL 16.3 16.3 0 0.7 13 S8 + 37.5% TOLUENE 16.8 16.8 0.5 0.8
UNCLASSIFIED
UNCLASSIFIED
swelling of the elastomer in a variety of solvents. In Table 4, the calculated magnitudes of the
HSPs for different percentages of poly-acrylonitrile and poly-butadiene are listed. In the
literature, δT listed for standard elastomers is 21.0 which corresponds to 38% poly-acrylonitrile
and 62% polybutadiene.
The concept of HSPs for predicting miscibility of solvents and swelling of elastomers is
that materials with similar HSPs mix well. Conversely, swelling of polymers in solvents with
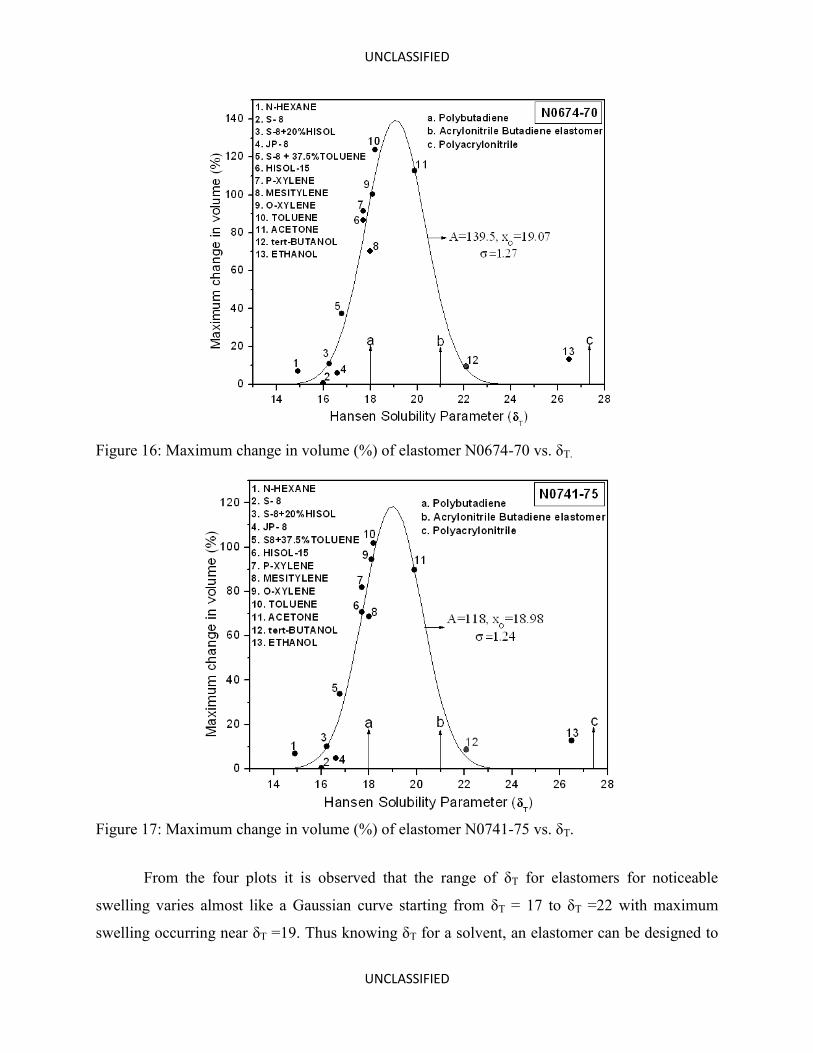
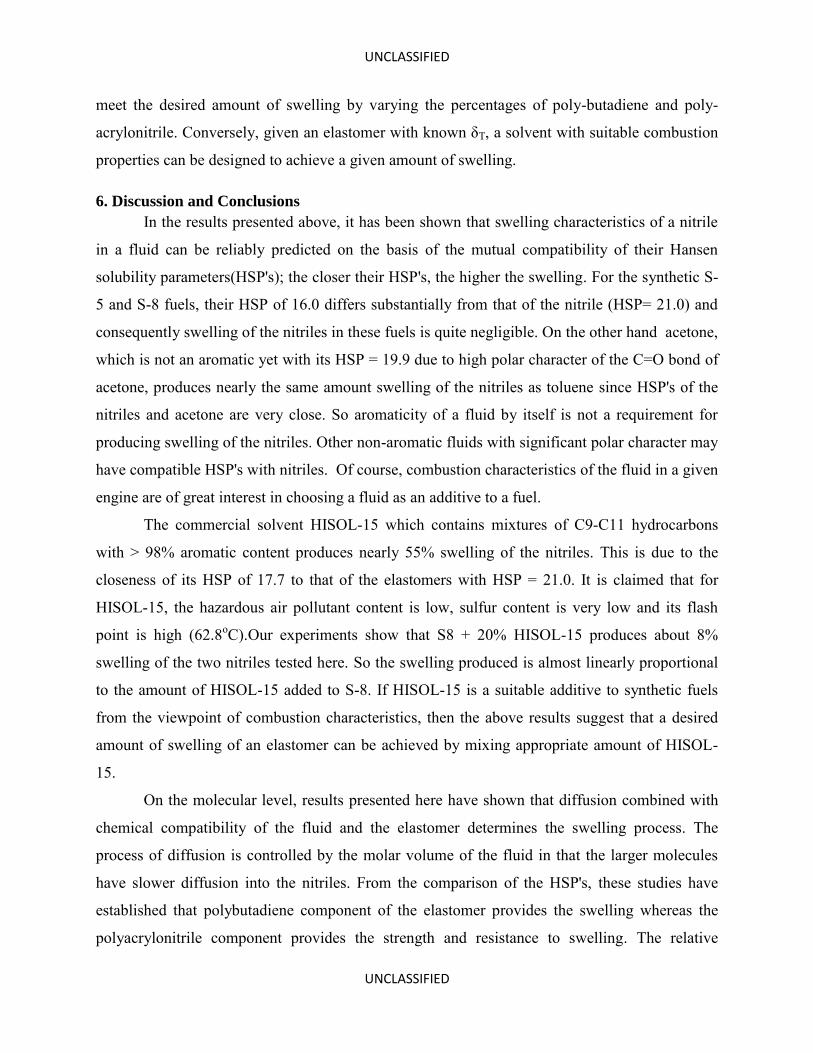
very different HSPs will be negligible. To quantify this concept for our work, we have plotted
the maximum change of volume (swelling) of the two elastomers against the known δT for all the
solvents used in our work. This comparison for the elastomer N0674-70 is shown in Fig. 16 and
for the elastomer N0741-75 in Fig. 17. In both the figures, the data points are fitted to a Gaussian
distribution:
f (x) = A exp[-(x-xo)2/2σ2] (8)
with magnitudes of A, xo, and standard deviation σ listed on the figures. Also the position of δT
for pure polybutadiene, pure polyacrylonitrile and an elastomer made up of 38%
polyacrylonitrile and 62% polybutadiene are marked by arrows. These plots provide considerable
insight into interpretation of our data as discussed below.
The value of δT for n-hexane (≈ 14.9) lies away from that of polybutadiene and the elastomer,
and it produces very small change in volume in the elastomer. It is noted that δT for pure
polybutadiene agrees nearly perfectly with that of toluene (δT ≈ 18.2), the fluid in which we
observe the highest swelling. This is in agreement with our experimental observation that a
sample of pure polybutadiene completely dissolves in toluene. The percentage change in volume
in elastomer N0674-70 when immersed in acetone (δT ≈ 19.9) is 112.8% which is a very high
swelling percentage. On the other hand, polyacrylonitrile has δT ≈ 27.4, much higher than those
of JP-8 and all solvents used here, making it essentially insoluble in them. Therefore swelling
observed in our elastomer can be interpreted to be primarily due to polybutadiene component of
the elastomers. Of course, in these comparisons, the role of fillers used in making the elastomer
is not taken into account. It has been suggested [2] that the fillers usually dampen the swelling
somewhat as they provide strength and prevent complete collapse of the elastomer during
swelling. The result that swelling observed in the elastomers may be primarily due to
polybutadiene component of the elastomers can be used to design elastomers for desired swelling
in a given fluid.
UNCLASSIFIED
UNCLASSIFIED
Figure 16: Maximum change in volume (%) of elastomer N0674-70 vs. δT.
Figure 17: Maximum change in volume (%) of elastomer N0741-75 vs. δT.
From the four plots it is observed that the range of δT for elastomers for noticeable
swelling varies almost like a Gaussian curve starting from δT = 17 to δT =22 with maximum
swelling occurring near δT =19. Thus knowing δT for a solvent, an elastomer can be designed to
UNCLASSIFIED
UNCLASSIFIED
meet the desired amount of swelling by varying the percentages of poly-butadiene and poly-
acrylonitrile. Conversely, given an elastomer with known δT, a solvent with suitable combustion
properties can be designed to achieve a given amount of swelling.
6. Discussion and Conclusions
In the results presented above, it has been shown that swelling characteristics of a nitrile
in a fluid can be reliably predicted on the basis of the mutual compatibility of their Hansen
solubility parameters(HSP's); the closer their HSP's, the higher the swelling. For the synthetic S-
5 and S-8 fuels, their HSP of 16.0 differs substantially from that of the nitrile (HSP= 21.0) and
consequently swelling of the nitriles in these fuels is quite negligible. On the other hand acetone,
which is not an aromatic yet with its HSP = 19.9 due to high polar character of the C=O bond of
acetone, produces nearly the same amount swelling of the nitriles as toluene since HSP's of the
nitriles and acetone are very close. So aromaticity of a fluid by itself is not a requirement for
producing swelling of the nitriles. Other non-aromatic fluids with significant polar character may
have compatible HSP's with nitriles. Of course, combustion characteristics of the fluid in a given
engine are of great interest in choosing a fluid as an additive to a fuel.
The commercial solvent HISOL-15 which contains mixtures of C9-C11 hydrocarbons
with > 98% aromatic content produces nearly 55% swelling of the nitriles. This is due to the
closeness of its HSP of 17.7 to that of the elastomers with HSP = 21.0. It is claimed that for
HISOL-15, the hazardous air pollutant content is low, sulfur content is very low and its flash
point is high (62.8oC).Our experiments show that S8 + 20% HISOL-15 produces about 8%
swelling of the two nitriles tested here. So the swelling produced is almost linearly proportional
to the amount of HISOL-15 added to S-8. If HISOL-15 is a suitable additive to synthetic fuels
from the viewpoint of combustion characteristics, then the above results suggest that a desired
amount of swelling of an elastomer can be achieved by mixing appropriate amount of HISOL-
15.
On the molecular level, results presented here have shown that diffusion combined with
chemical compatibility of the fluid and the elastomer determines the swelling process. The
process of diffusion is controlled by the molar volume of the fluid in that the larger molecules
have slower diffusion into the nitriles. From the comparison of the HSP's, these studies have
established that polybutadiene component of the elastomer provides the swelling whereas the
polyacrylonitrile component provides the strength and resistance to swelling. The relative
UNCLASSIFIED
UNCLASSIFIED
amounts of these components in an elastomer control its HSP (see Table 6) and hence
maximum swelling of the elastomers.
The shrinkage observed after long time exposure is likely due to extraction of the filler
material in the nitrile by the fluid since the mass of the sample decreases or due to the escape of
the fluid after reaching saturation. What role this shrinkage plays for the eventual failure of the
nitriles for sealing purposes was not investigated in this work. For this purpose, really long term
(years) exposure and cycling of the elastomer over many cycles is necessary followed by
thorough structural characterization of the failed elastomer. It may be speculated that the
breakdown of cross-linking and loss of strengthening fillers from the nitriles could lead to
elastomer failure.
Acknowledgements: Financial support for this research was provided by a contract from the U.
S. Army TACOM (contract # W56HZV-07-C-0721) awarded to the Consortium for Fossil Fuel
Research with G. P. Huffman as the Director of the Consortium. We are grateful
to program managers Patsy A. Muzzell and Eric R. Sattler for their support and suggestions.
Discussions with researchers from the University of Kentucky (Naresh Shah, Frank Huggins and
Jerry Huffman) on the results presented here have been very beneficial during the course of these
investigations.
Disclaimer: Reference herein to any specific commercial company, product, process, or service by trade name, trademark, manufacturer, or otherwise, does not necessarily constitute or imply its endorsement, recommendation, or favoring by the United States Government or the Department of the Army (DoA). The opinions of the authors expressed herein do not necessarily state or reflect those of the United States Government or the DoA, and shall not be used for advertising or product endorsement purposes.
7. References
* Corresponding author. Email: [email protected]
[1] Mathai AE, Thomas S. J. Macromol. Sci., Phys. 1996; B35 (2): 229-253.
[2] Mathai AE, Singh RP, Thomas S. Polym. Eng. Sci. 2003; 43: 704-715.
[3] George SC, Thomas S, Ninan KN, Polymer 1996; 37: 5839-5848.
[4] George S, Varughese KT, Thomas S. Polymer 2000; 41: 579-594.
UNCLASSIFIED
UNCLASSIFIED
[5] Varghese H, Bhagawan SS, Thomas S. J. Polym. Sci., Part B: Polym. Phys. 1999; 37: 1815-
1831.
[6] Muzzell P, Stavinoha L, Chapin R. Synthetic Fischer Tropsch JP-5/JP-8 Aviation Turbine
Fuel Elastomer Compatibility, Final Report to U.S. Army TARDEC, Warren, MI (February
2005).
[7] Graham JL, Striebich RC, Myers KJ, Minus DK, Harrison III WE. Energy Fuels 2006; 20:
759-765.
[8] Akiba M, Hashim AS. Prog. Polym. Sci. 1997; 22: 475-521.
[9] Crank J. The Mathematics of Diffusion, second edition, Oxford University, London, 1975.
[10] Shivaputrappa B, Harogappad A, Aminabhavi TM. Macromolecules 1991; 24: 2598-2605.
[11] Nielsen TB, Hansen CM. Polym. Test. 2005; 24: 1054-1061.
[12] Hansen C. Hansen Solubility Parameters-A User’s Handbook. CRC Press, Boca Raton,
2007.


![Mechanism of formation, structural characteristics and … · 2020. 2. 3. · 1 [Special Issue on Photoactive Mixed Metal Oxides] Mechanism of , structural characteristicsformation](https://static.fdocuments.net/doc/165x107/6039e4109a69d92aca5104c0/mechanism-of-formation-structural-characteristics-and-2020-2-3-1-special.jpg)


