Stress-strain relationships look similar to force-deformation relationships because:...stress is...
41
Stress-strain relationships look similar to force- deformation relationships because: ...stress is proportional to force ...strain is proportional to deformation 1 Deformation, mm Force, N YLD PT FAIL PT PROP LIMIT Strain = Deform/Length mm/mm Stress = Force Area N/mm 2 YLD PT FAIL PT PROP LIMIT Are a Lengt h
-
Upload
francis-wiggins -
Category
Documents
-
view
250 -
download
7
Transcript of Stress-strain relationships look similar to force-deformation relationships because:...stress is...
Stress-strain relationships look similar to force-deformation relationships because:...stress is proportional to force...strain is proportional to deformation
1
Deformation, mm
Force, N
YLD PTFAIL PT
PROP LIMIT
Strain = Deform/Length mm/mm
Stress = Force Area
N/mm2
YLD PTFAIL PT
PROP LIMIT
Area
Length
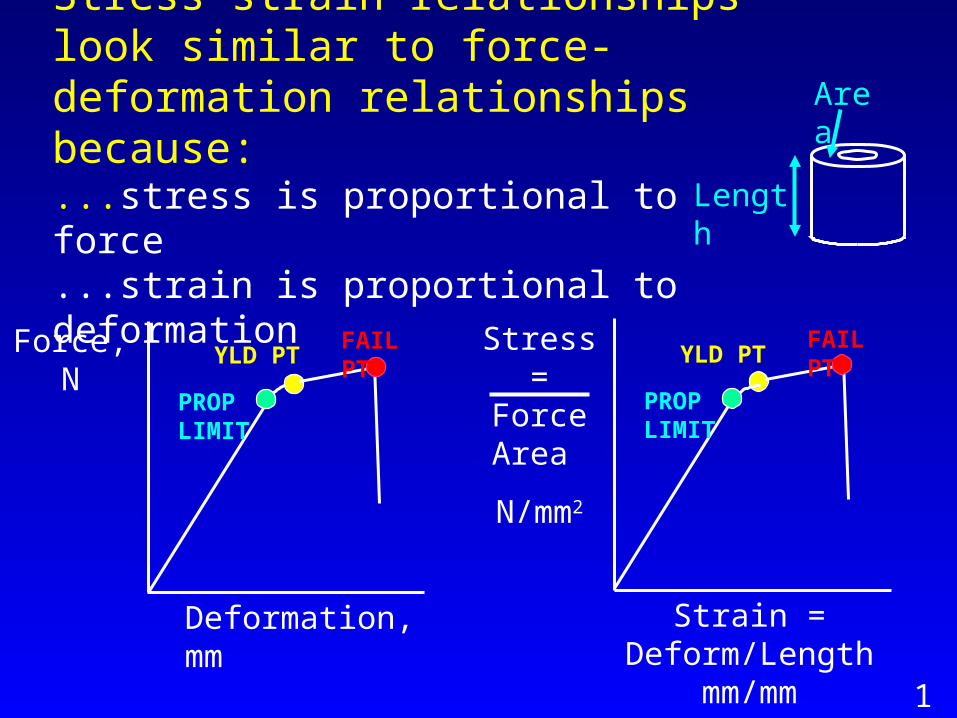
Hooke's Law (1676): ut tensio, sic vis
= E
• The slope of the graph represents the stiffness of the material: E = /
• E is the elastic modulus, in N/m2
Stress & strain are linearly proportional in “linear elastic” materials:
2

Stiffness vs. Strength• Stiffness: resistance to deformation
– expressed as force required to produce a given amount of deformation
• Strength: resistance to failure– expressed as force required to produce
• a permanent deformation: yield strength• a fracture: ultimate or fracture strength
• stiffness and strength may apply to either– a structure (e.g. a femoral diaphysis)– a material (e.g. cortical or trabecular bone tissue)
3
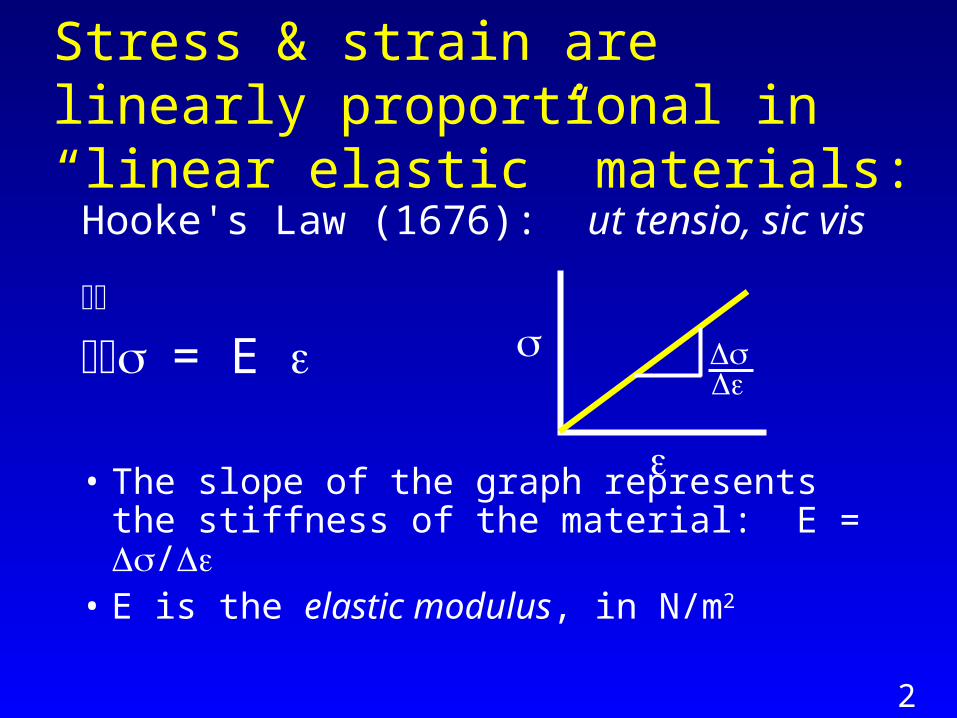
Strength Depends on Mode of Loading
4
Torsion
CompressionTension
Shear
Bending
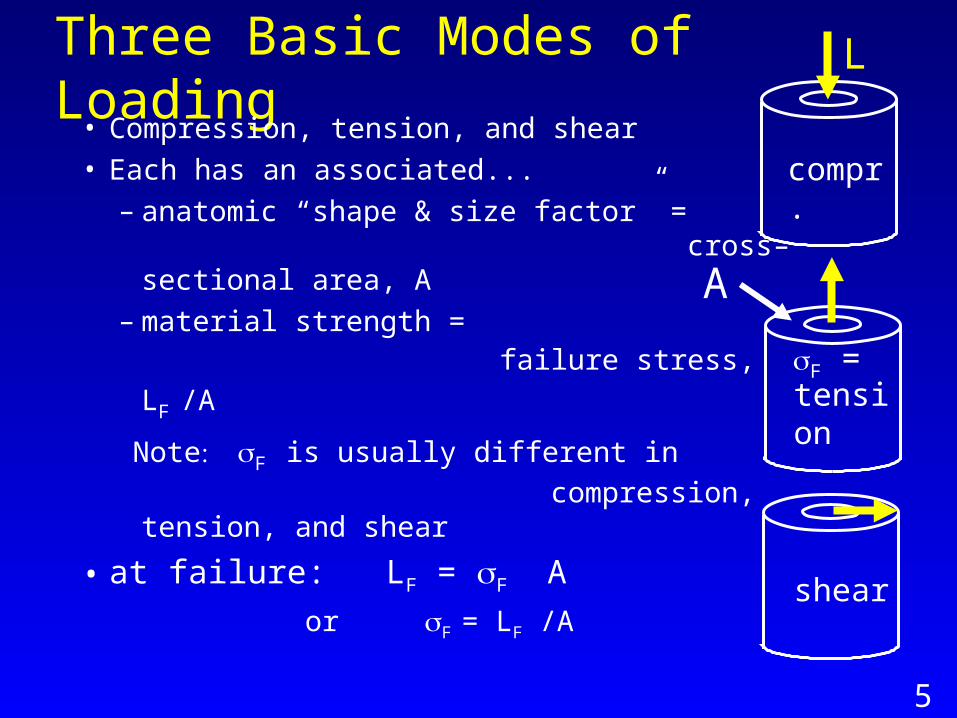
Three Basic Modes of Loading• Compression, tension, and shear• Each has an associated...
– anatomic “shape & size factor” = cross–sectional area, A
– material strength = failure stress, F = LF /A
NoteF is usually different in
compression, tension, and shear
• at failure: LF = F A
or F = LF /A
tension
compr.
shear
A
L
5
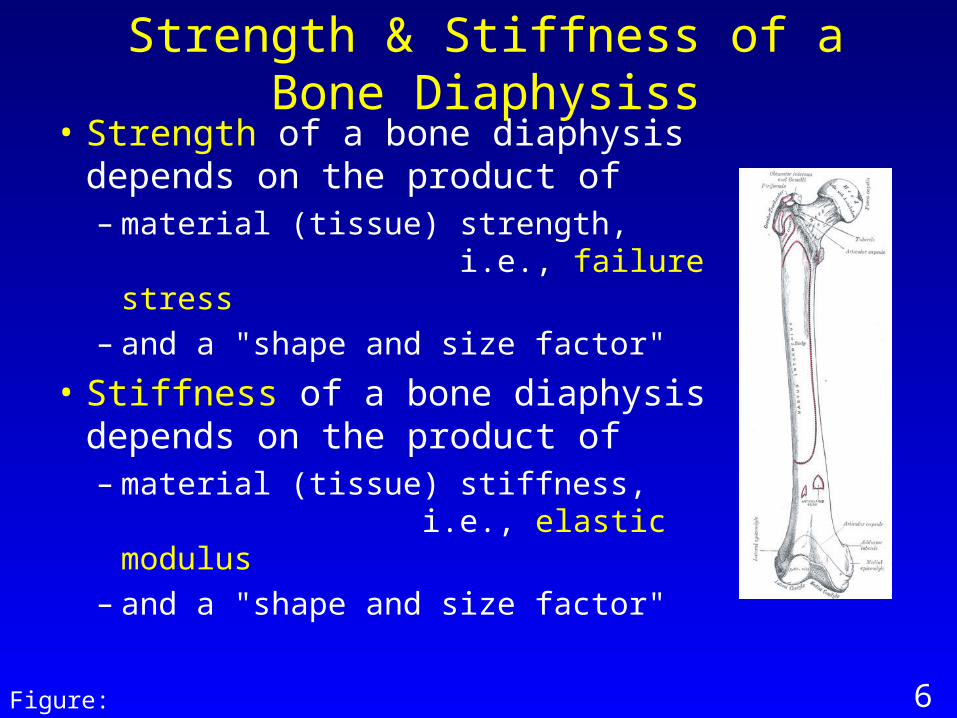
• Strength of a bone diaphysis depends on the product of– material (tissue) strength,
i.e., failure stress– and a "shape and size factor"
• Stiffness of a bone diaphysis depends on the product of– material (tissue) stiffness,
i.e., elastic modulus– and a "shape and size factor"
Strength & Stiffness of a Bone Diaphysiss
Figure: http://messenger.yahooligans.com/reference/gray/subjects/subject?id=59 6
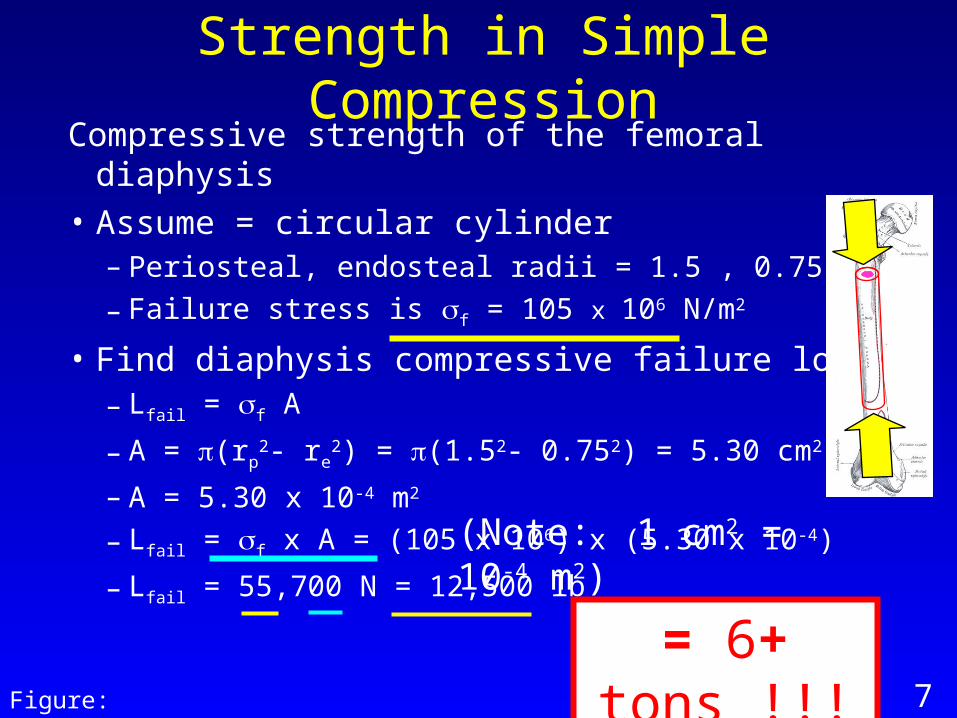
Compressive strength of the femoral diaphysis
• Assume = circular cylinder– Periosteal, endosteal radii = 1.5 , 0.75 cm
– Failure stress is f = 105 x 106 N/m2
• Find diaphysis compressive failure load – Lfail = f A
– A = (rp2- re
2) = (1.52- 0.752) = 5.30 cm2
– A = 5.30 x 10⁻⁴ m2
– Lfail = f x A = (105 x 106) x (5.30 x 10-4)
– Lfail = 55,700 N = 12,500 lb
Strength in Simple Compression
7Figure: http://messenger.yahooligans.com/reference/gray/subjects/subject?id=59
(Note: 1 cm2 = 10-4 m2)
= 6+ tons !!!

• Primary stresses = tension & compression*
• Zero stress at central ‘neutral plane’ (NP)
• Tensile and compressive stresses occur on opposite sides of NP
compression
tensionNPfixed
end
8
Flexure (Bending) of a Bone Diaphysis
Cantilever Bending
3-point Bending
4-point Bending
F
* also shear stress; see slide 47

• Flexural stresses = tension + compression
• Stress increases linearly – on tensile and compressive sides of NP
• Stress decreases with distance from fixed end
compression
tensionNPfixed
end
c
magnified section9
Cantilever Bending Example
F
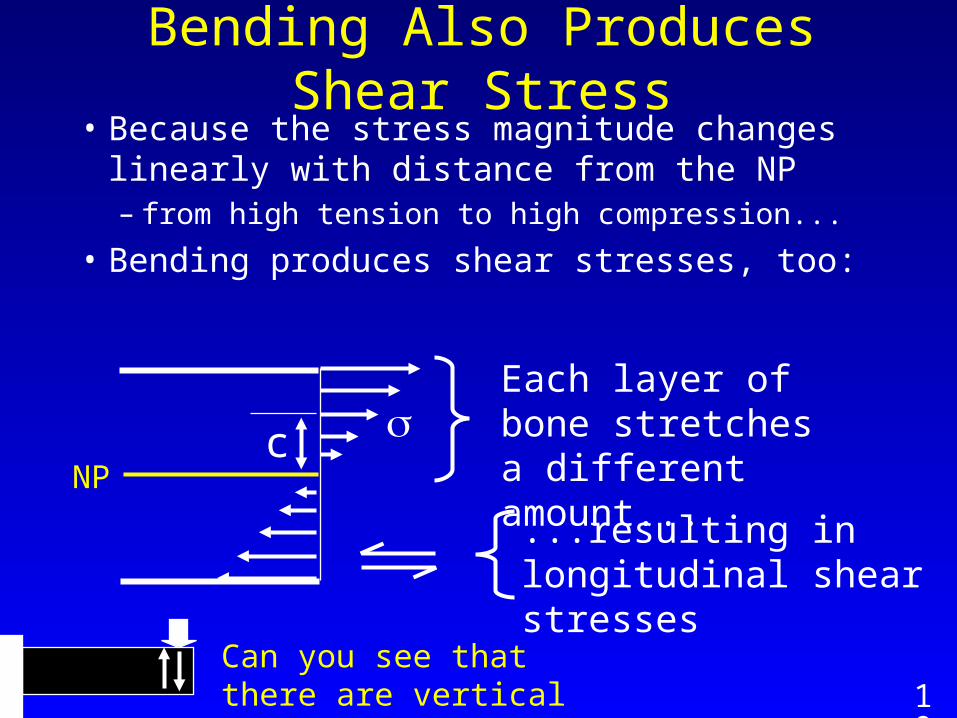
• Because the stress magnitude changes linearly with distance from the NP– from high tension to high compression...
• Bending produces shear stresses, too:
10
Bending Also Produces Shear Stress
Each layer of bone stretches a different amount...
...resulting in longitudinal shear stresses
c NP
Can you see that there are vertical shear stresses, too?

Cross-sectional Moment of Inertia, I
• “I” is the “anatomic shape and size factor" for bending
• Conceptually it is found by summing...– all the elements, A,
of cross–sectional area – each multiplied by y2,
the square of its distance from the “neutral plane”
– I = (A x y2)
Ayneutral
axis
For a circular cylinder, this works out to be I = ¼ (rp
4 – re4)
rpre
11
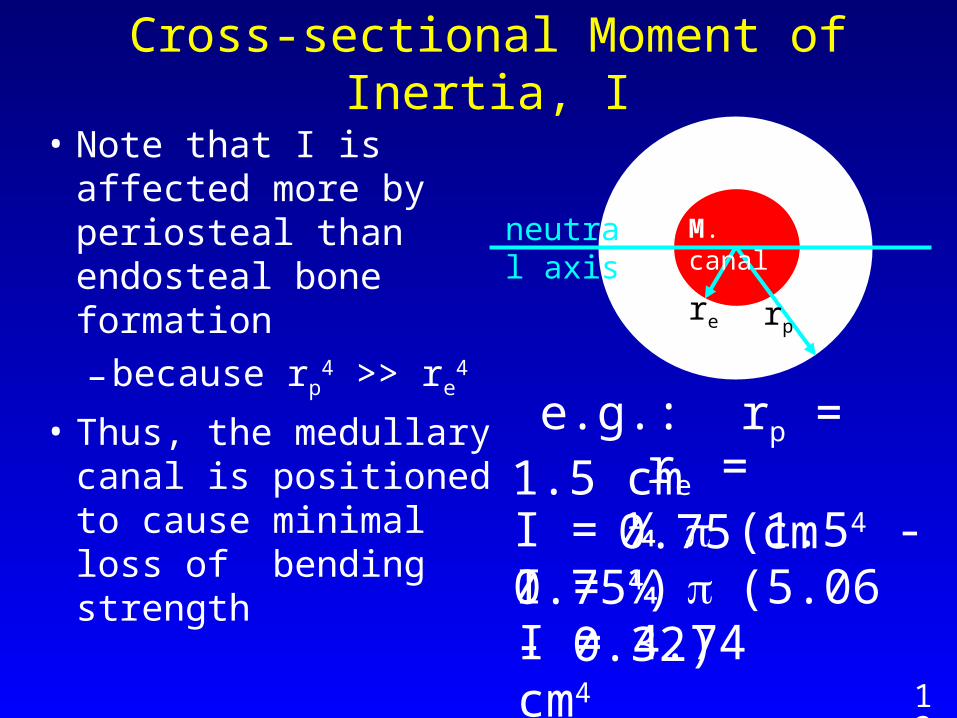
• Note that I is affected more by periosteal than endosteal bone formation
– because rp4 >> re
4
• Thus, the medullary canal is positioned to cause minimal loss of bending strength
Aneutral axis
rpre
12
Cross-sectional Moment of Inertia, I
e.g.: rp = 1.5 cm re = 0.75 cm
I = ¼ (1.54 - 0.754)I = ¼ (5.06 - 0.32) I = 4.74 cm4
M. canal
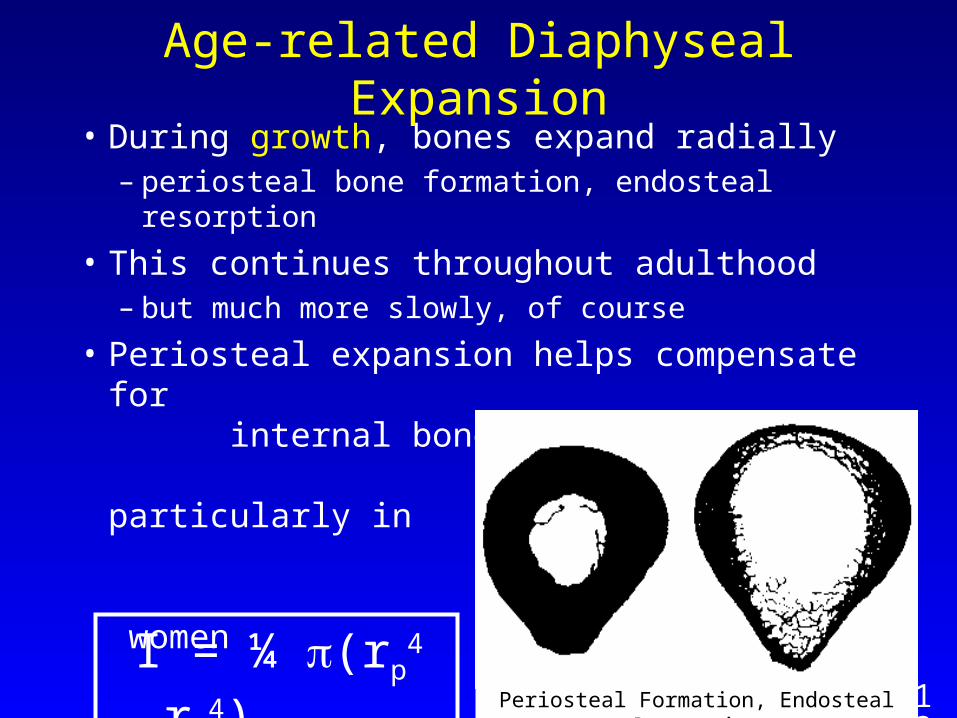
• During growth, bones expand radially– periosteal bone formation, endosteal resorption
• This continues throughout adulthood – but much more slowly, of course
• Periosteal expansion helps compensate for internal bone loss, particularly in postmenopausal women
Age-related Diaphyseal Expansion
13 I = ¼ (rp
4 – re4)
Periosteal Formation, Endosteal Resorption
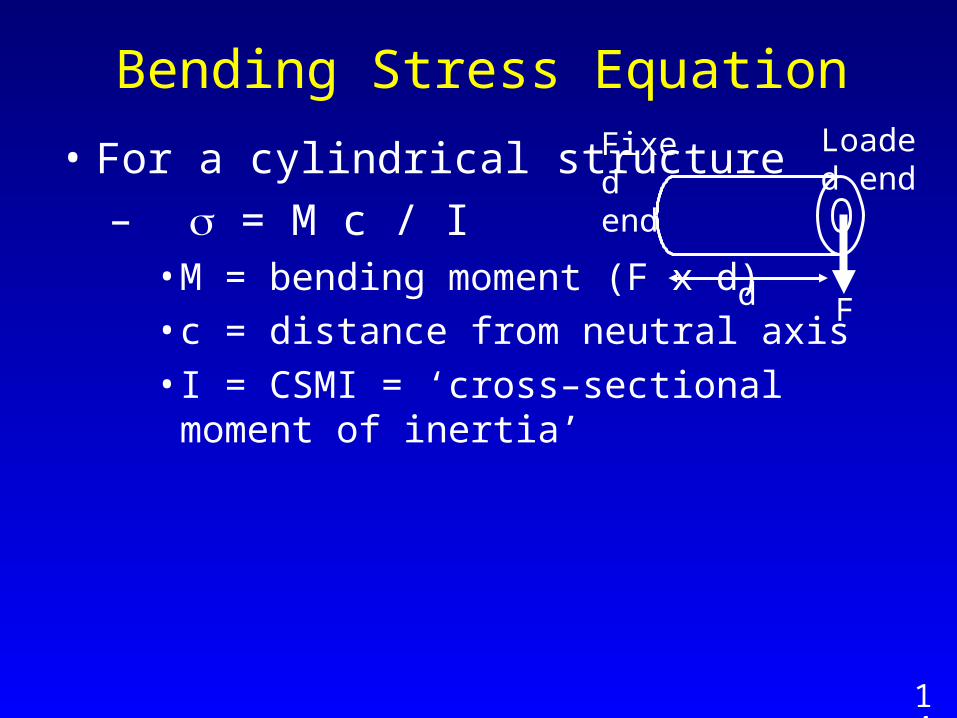
• For a cylindrical structure
– = M c / I• M = bending moment (F x d)• c = distance from neutral axis• I = CSMI = ‘cross–sectional moment of inertia’
Bending Stress Equation
14
d F
Fixed end
Loaded end
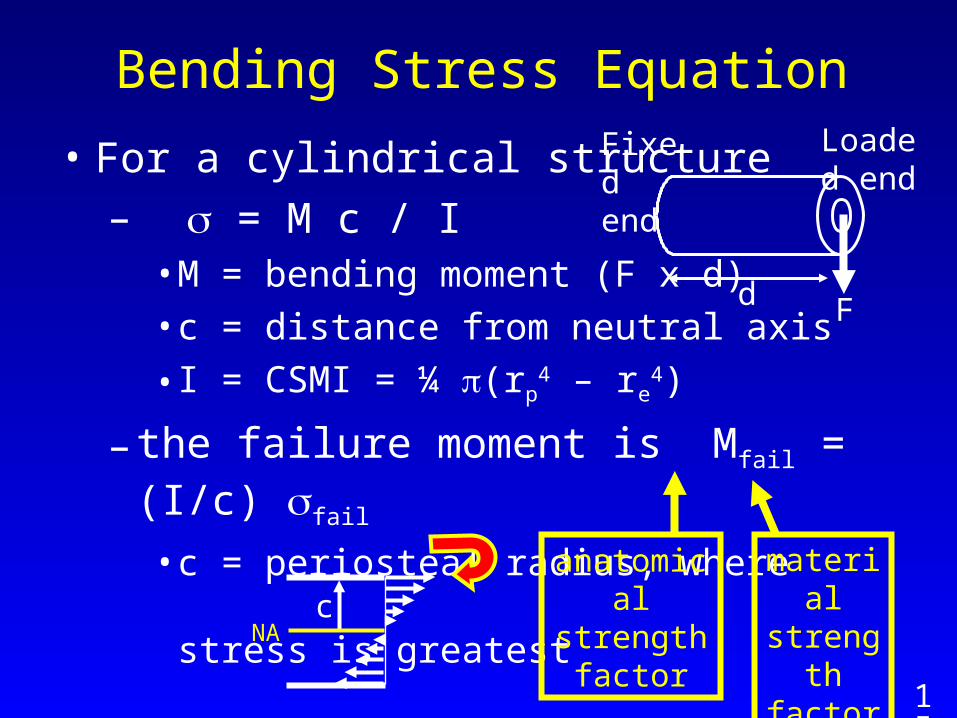
• For a cylindrical structure
– = M c / I• M = bending moment (F x d)• c = distance from neutral axis
• I = CSMI = ¼ (rp4 – re
4)
– the failure moment is Mfail = (I/c) fail
• c = periosteal radius, where stress is greatest
Bending Stress Equation
15
anatomical strength factor
material strength factorNA
c
d F
Fixed end
Loaded end

Torsional loading produces shear stresses between adjacent bone segments, and...
16
...between circumferential bone layers because outer layers stretch more...
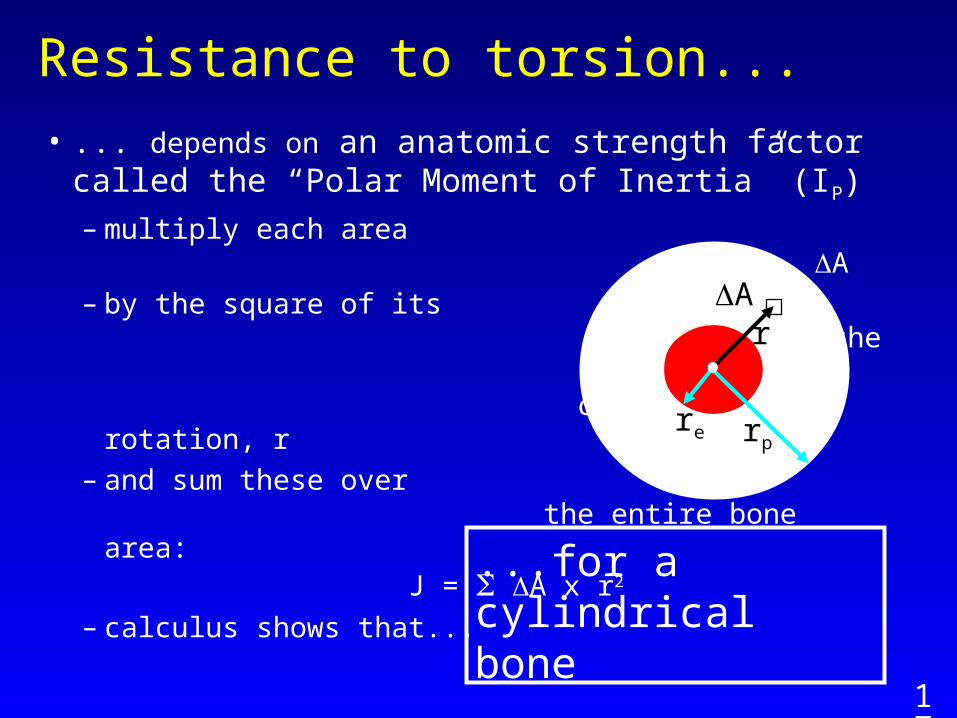
Resistance to torsion...
• ... depends on an anatomic strength factor called the “Polar Moment of Inertia” (IP)
– multiply each area element, A
– by the square of its distance from the center of rotation, r
– and sum these over the entire bone area: J = A x r2
– calculus shows that...
Ar
rpre
17
...for a cylindrical bone
IP = ½ (rp4 – re
4)

Angle of Twist• When a cylindrical bone of length L is subjected to a
twisting moment (torque) MT, the angle of twist between the ends, , is given by the equation:
where G = bone tissue shear modulus
IP = polar moment inertia = ¼ Rp4 - Re
4 )
Rp , Re = periosteal & endosteal radii 18
End View
L =
MT L G IP
Angle in radians (1 radian = 57.3o)
Rp
Re

Torsional Loading Example• A tibial diaphysis has the following properties
– shear modulus G = 8 x 10⁸ Pascals (N/m2)
– length L = 0.30 m, radii: rp = 0.015 m , re = 0.005 m
• It is subjected to a torque of MT = 10 N-m in a skiing mishap. How much would it twist?
• Solution, assuming a circular cross-section: I = ¼ Rp
4– Re4) = ¼ 0.0154 - 0.0054) = 3.9 x 10⁻⁸ m4
= MT L/G I = 10 x 0.30 / (8 x 108) x (3.9 x 10-8)
19
L = 3.0 / 31.2
= 5.51 degrees
= 0.096 radians
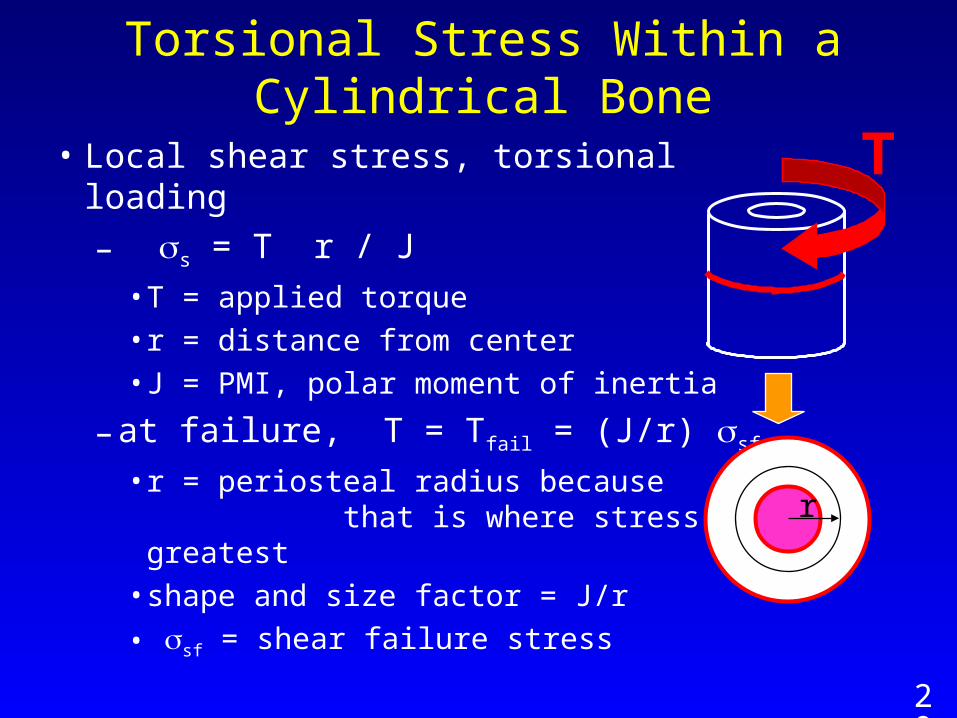
• Local shear stress, torsional loading
– s = T r / J
• T = applied torque• r = distance from center• J = PMI, polar moment of inertia
– at failure, T = Tfail = (J/r) sf
• r = periosteal radius because that is where stress is greatest
• shape and size factor = J/r
• sf = shear failure stress
Torsional Stress Within a Cylindrical Bone
20
T
r
J =½ (rp4 - re
4)
Typical small child:
J =½ (1.004 – 0.304)
Jchild =cm4
Typical adult:
J =½ (1.804 – 0.604)
Jadult =cm4
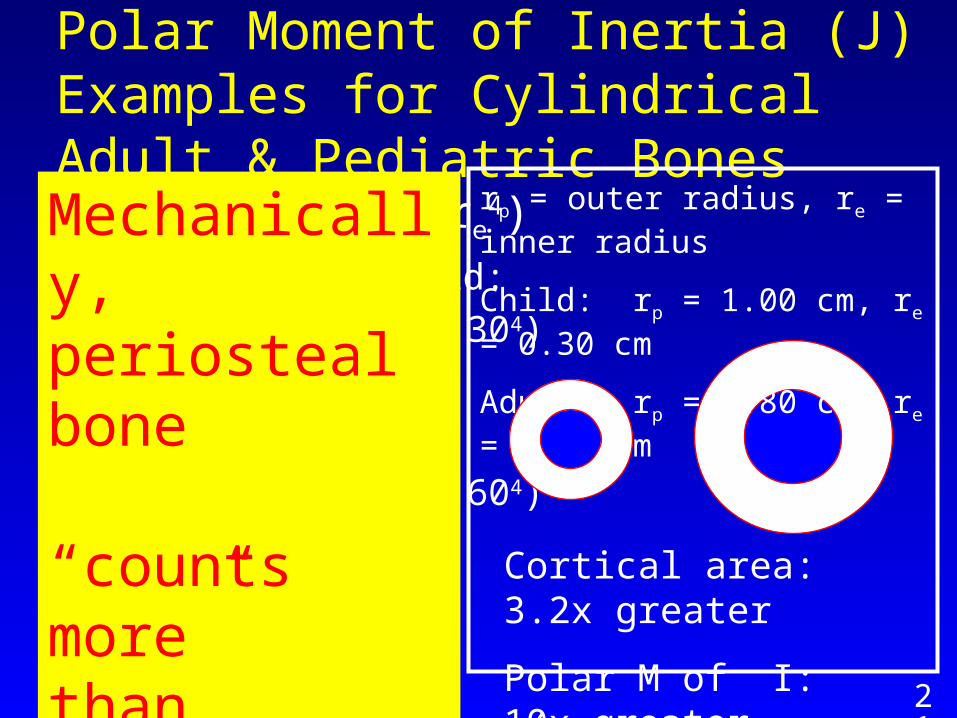
Polar Moment of Inertia (J) Examples for Cylindrical Adult & Pediatric Bones
rp = outer radius, re = inner radius
Child: rp = 1.00 cm, re = 0.30 cm
Adult: rp = 1.80 cm, re = 0.60 cm
21
Cortical area: 3.2x greater
Polar M of I: 10x greater
Mechanically, periosteal bone “counts more” than medullary bone when resisting torsion (similar for bending)

• stiffness = shape factor x elastic modulus*
• strength = shape factor x material strength
• compression**: Lfail = A fail
• torsion: Tfail = (J/r) fail
• bending: Mfail = (I/c) fail
• bone tissue governs material strength (fail)
• bone size & shape govern structural properties (A, J, r, I, c)
Summary: Bone Stiffness & Strength
22* or shear modulus ** or tension
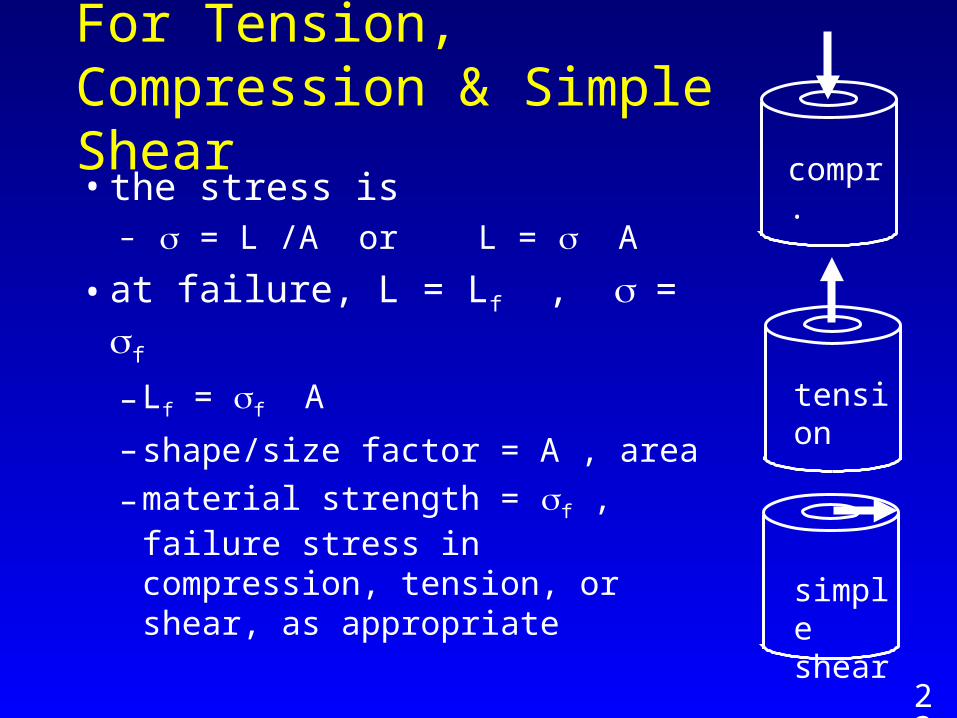
• the stress is– = L /A or L = A
• at failure, L = Lf , = f
– Lf = f A
– shape/size factor = A , area
– material strength = f , failure stress in compression, tension, or shear, as appropriate
tension
compr.
simple shear
For Tension, Compression & Simple Shear
23
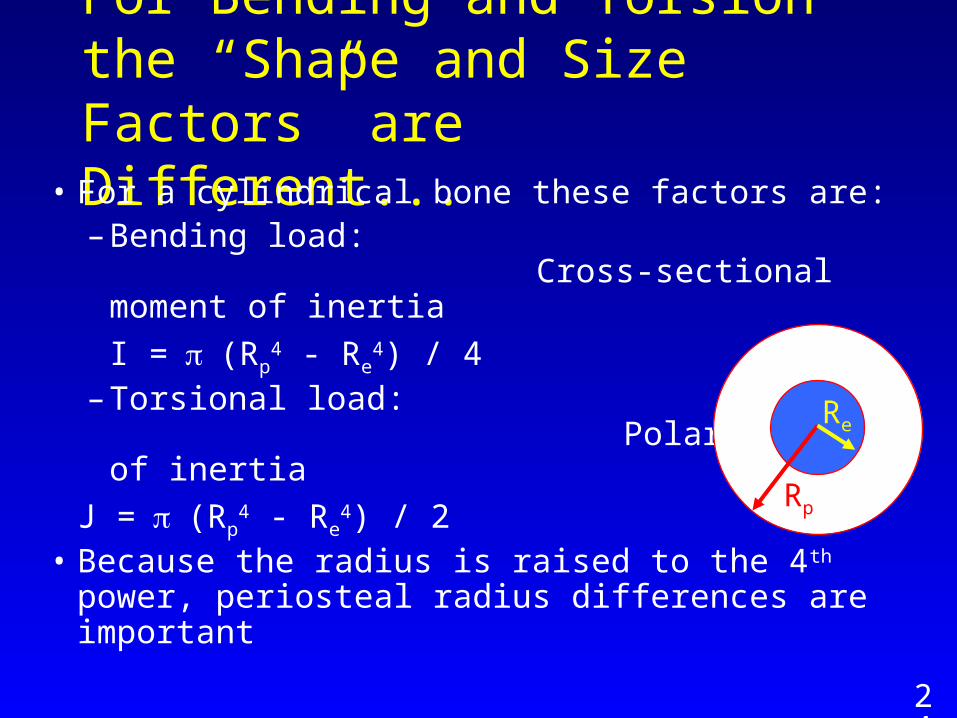
For Bending and Torsion the “Shape and Size Factors” are Different...
• For a cylindrical bone these factors are:– Bending load:
Cross-sectional moment of inertia
I =(Rp4 - Re
4) / 4– Torsional load:
Polar moment of inertia
J =(Rp4 - Re
4) / 2• Because the radius is raised to the 4th power,
periosteal radius differences are important
24
Rp
Re
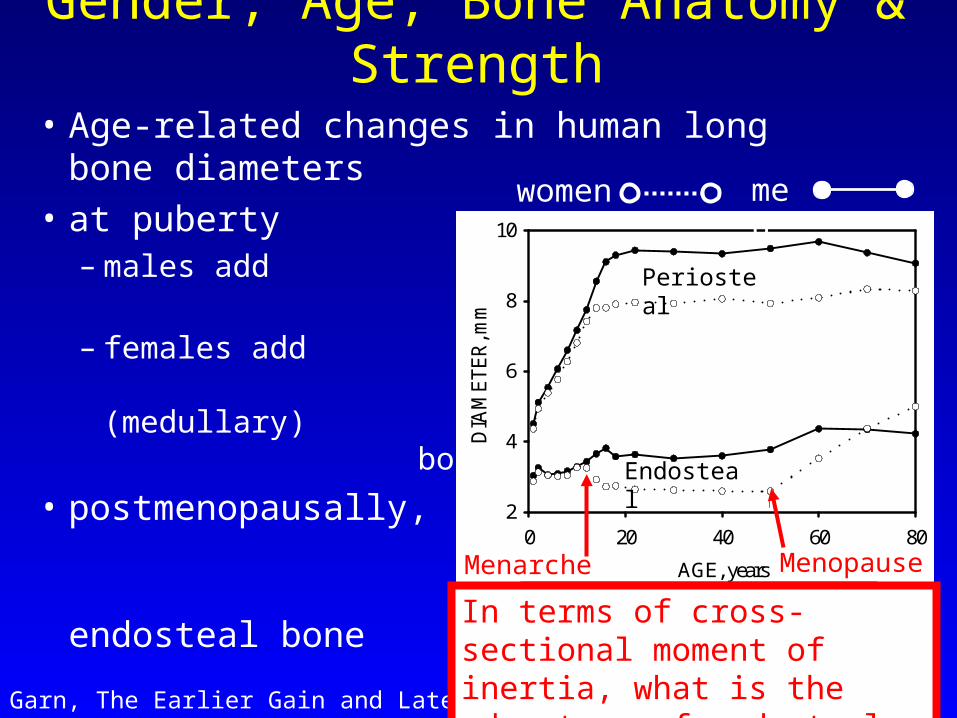
• Age-related changes in human long bone diameters
• at puberty– males add
periosteal bone– females add
endosteal (medullary) bone
• postmenopausally, women lose endosteal bone
AGE, years
0 20 40 60 80
DIA
ME
TE
R, m
m
2
4
6
8
10
MPMA
menwomen
Menarche Menopause
Gender, Age, Bone Anatomy & Strength
What are the mechanical implications of this?
Garn, The Earlier Gain and Later Loss of Bone, C.C. Thomas, Springfield, 1970.
In terms of cross-sectional moment of inertia, what is the advantage of endosteal vs. periosteal bone loss? 25
Periosteal
Endosteal
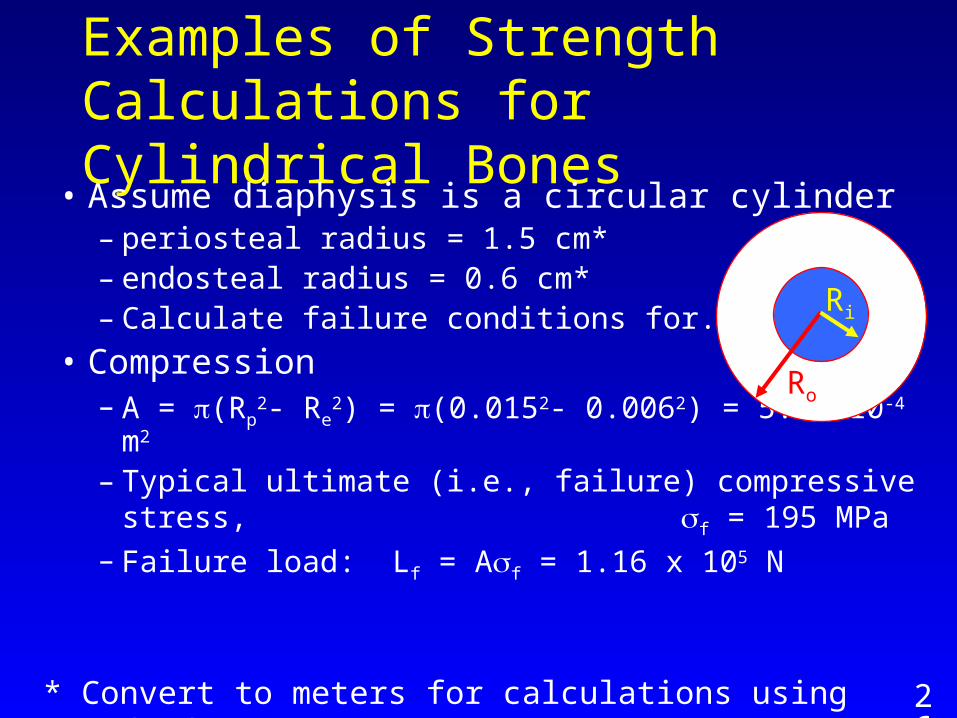
Examples of Strength Calculations for Cylindrical Bones
• Assume diaphysis is a circular cylinder– periosteal radius = 1.5 cm*– endosteal radius = 0.6 cm*– Calculate failure conditions for...
• Compression– A = (Rp
2- Re2) = (0.0152- 0.0062) = 5.94x10⁻⁴ m2
– Typical ultimate (i.e., failure) compressive stress, f = 195 MPa
– Failure load: Lf = Af = 1.16 x 10⁵ N
26
Ro
Ri
* Convert to meters for calculations using standard stress units.

Examples of Strength Calculations for Cylindrical Bones
• Bending strength: Mfail = (I/c) fail
– again, Rp = 3 cm, Re = 1.2 cm
– I =(Rp4 - Re
4) / 4 – I = (81.0- 2.1)/4 = 62.0 cm4
– assume c = Rp = 2 cm– Typical tensile fx stress = 13,300 N/cm2
– Mfail = (I/c) fail = (62/2) x 13,300
– Mfail = 412,300 N-cm = 4123 N-m
27
Ro
Ri
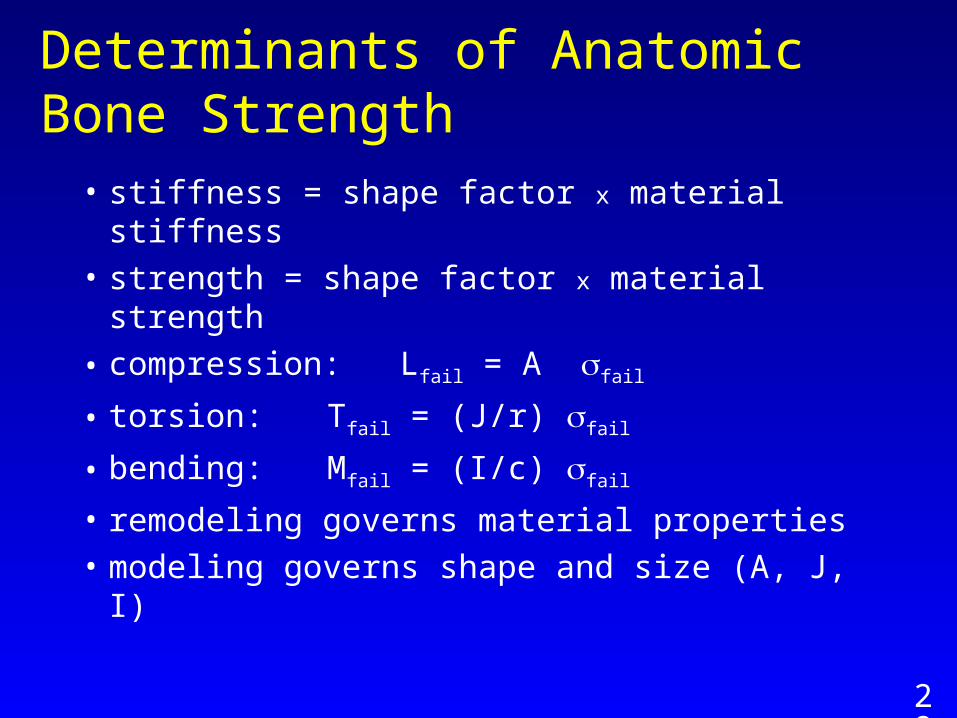
• stiffness = shape factor x material stiffness
• strength = shape factor x material strength
• compression: Lfail = A fail
• torsion: Tfail = (J/r) fail
• bending: Mfail = (I/c) fail
• remodeling governs material properties
• modeling governs shape and size (A, J, I)
Determinants of Anatomic Bone Strength
28

Cortical Bone ‘Grain’• Micro-CT images show
Haversian canals (osteons) generally align with stress directions
• Consequently, bone has a ‘grain’ and properties are direction dependent, e.g....
• Elastic Modulus, GPa:
Cooper et al, Anatomical Record, 274B:169, 2003
Red dots: Haversian canal junctions
Longitudinal Transverse 18.2 + 0.9 11.7 + 1.0
Human Cortical Bone
29
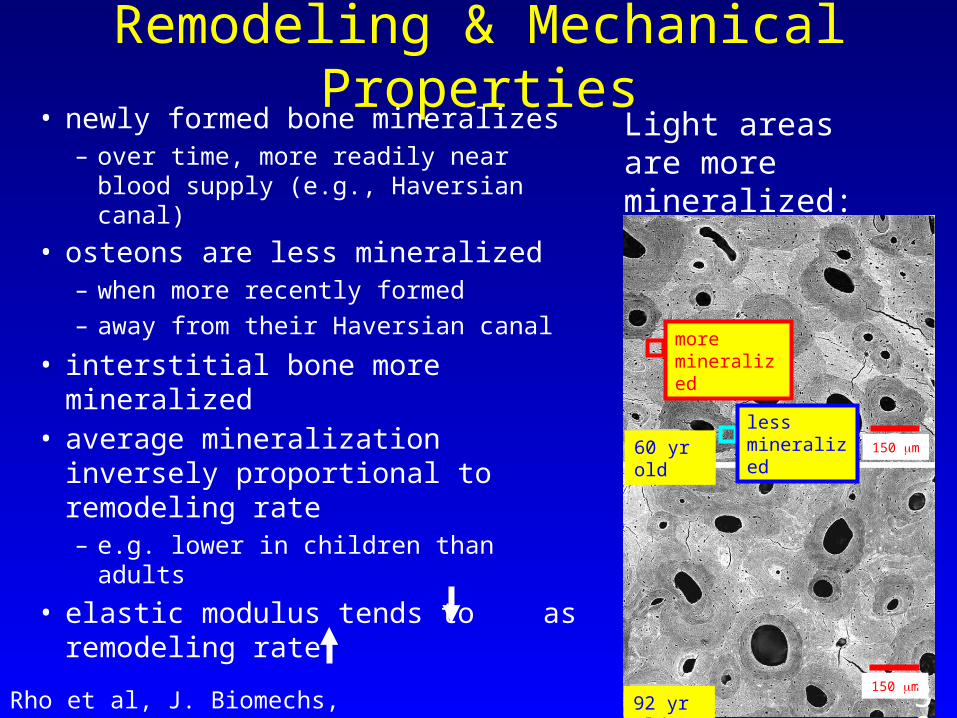
Remodeling & Mechanical PropertiesLight areas are more mineralized:
Rho et al, J. Biomechs, 35:189, 2002
• newly formed bone mineralizes
– over time, more readily near blood supply (e.g., Haversian canal)
• osteons are less mineralized
– when more recently formed
– away from their Haversian canal
• interstitial bone more mineralized• average mineralization inversely
proportional to remodeling rate
– e.g. lower in children than adults
• elastic modulus tends to as remodeling rate
less mineralized
more mineralized
92 yr old
60 yr old 150 m
150 m30
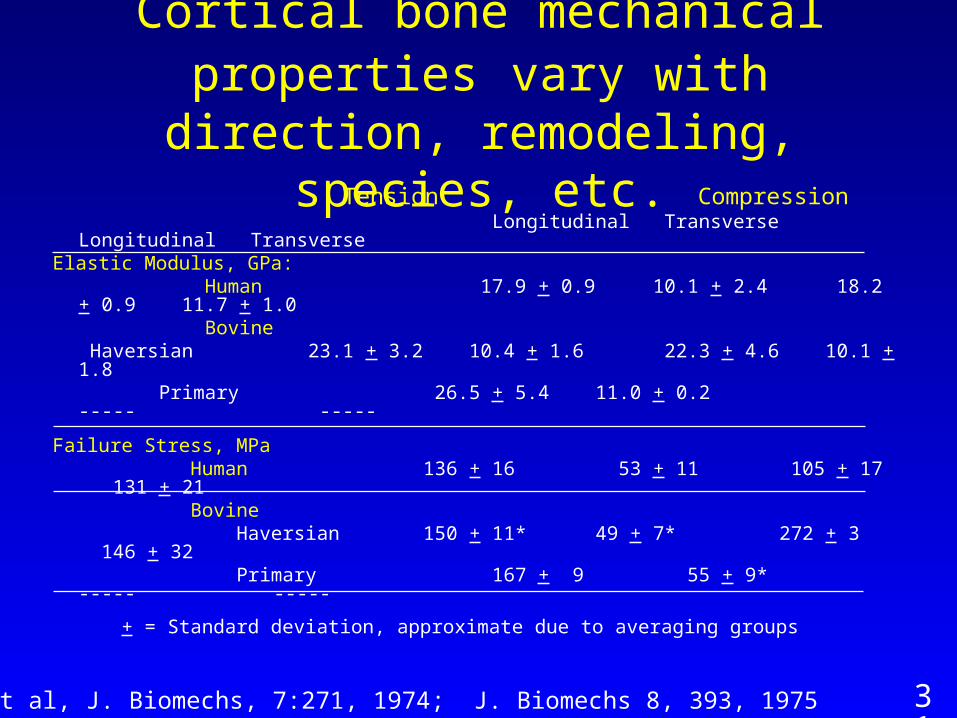
Tension Compression Longitudinal Transverse Longitudinal
Transverse Elastic Modulus, GPa: Human 17.9 + 0.9 10.1 + 2.4 18.2 + 0.9 11.7 + 1.0 Bovine
Haversian 23.1 + 3.2 10.4 + 1.6 22.3 + 4.6 10.1 + 1.8 Primary 26.5 + 5.4 11.0 + 0.2 ----- -----
Failure Stress, MPa Human 136 + 16 53 + 11 105 + 17 131 + 21 Bovine Haversian 150 + 11* 49 + 7* 272 + 3 146 + 32 Primary 167 + 9 55 + 9* ----- -----
+ = Standard deviation, approximate due to averaging groups
Cortical bone mechanical properties vary with direction, remodeling, species, etc.
31Reilly et al, J. Biomechs, 7:271, 1974; J. Biomechs 8, 393, 1975

32
Proposed molecular basis for bone toughening: protein-based molecular “glue” on mineralized collagen fibers
Unloaded
Loaded:
Hansma, PK, J Musculoskelet Neuronal Interact 2005; 5(4):313-315
Ca++ ions hypothesized to link non-collagenous proteins, e.g., osteopontin
Loading stretches...
& separates glue-like fibers, absorbing energy.
Unloaded fibers “re-coil”

Strain Rate Also Affects Cortical Bone Strength &
Stiffness• Greatest energy absorption
occurs at 0.01-0.1/sec – i.e., impact at ~ 2mi/hr
• At increased rates of loading, bone is – stronger & stiffer– but more brittle– no. of fx fragments increases
with applied energy
0
Strain, mm/mm
Stress, MPa
0.020.00
200
.001/sec
.01/sec
.1/sec
1/sec
300/sec
1500/sec
McElhaney, J.H., J. Applied Physiology, 21:1231, 1966
100
33

Bone is more brittle at high loading rates: higher impact energy = more small fragments
+ greater total fracture surface areaL
iber
ated
Sur
face
Are
a, m
m2
Energy absorbed in fx (Joules)
Energy groups
Beardsley et al, J. Orthop. Res 23:686, 2005
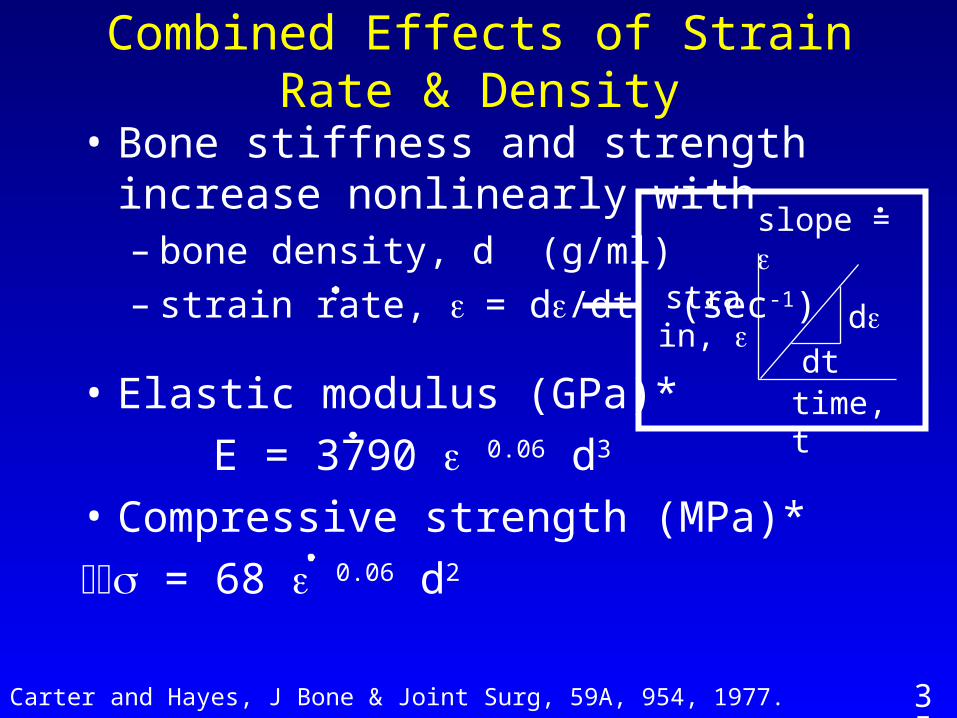
• Bone stiffness and strength increase nonlinearly with– bone density, d (g/ml)– strain rate, = d/dt (sec-1)
• Elastic modulus (GPa)*
E = 3790 0.06 d3
• Compressive strength (MPa)*
= 68 0.06 d2
Combined Effects of Strain Rate & Density
35Carter and Hayes, J Bone & Joint Surg, 59A, 954, 1977.
dt
dstrain,
time, t
slope = .

Bone structure is infinitely variable, but just 2 basic types
• Bone tissue is usually – cortical – trabecular– rarely “in between”
• Both osteons & trabeculae tend to be aligned with stress directions
APPARENT DENSITY, gm/cm
1.01.21.41.61.82.0
POROSITY
0.0 0.2 0.4 0.6 0.8 1.0
ULT
IMA
TE
ST
RE
SS
, MP
a
0
50
100
150
200
250
Martin, R.B. et al, Skeletal Tissue Mechanics, Springer Verlag, New York, NY 1998.
cortical bone
trabecular bone
36
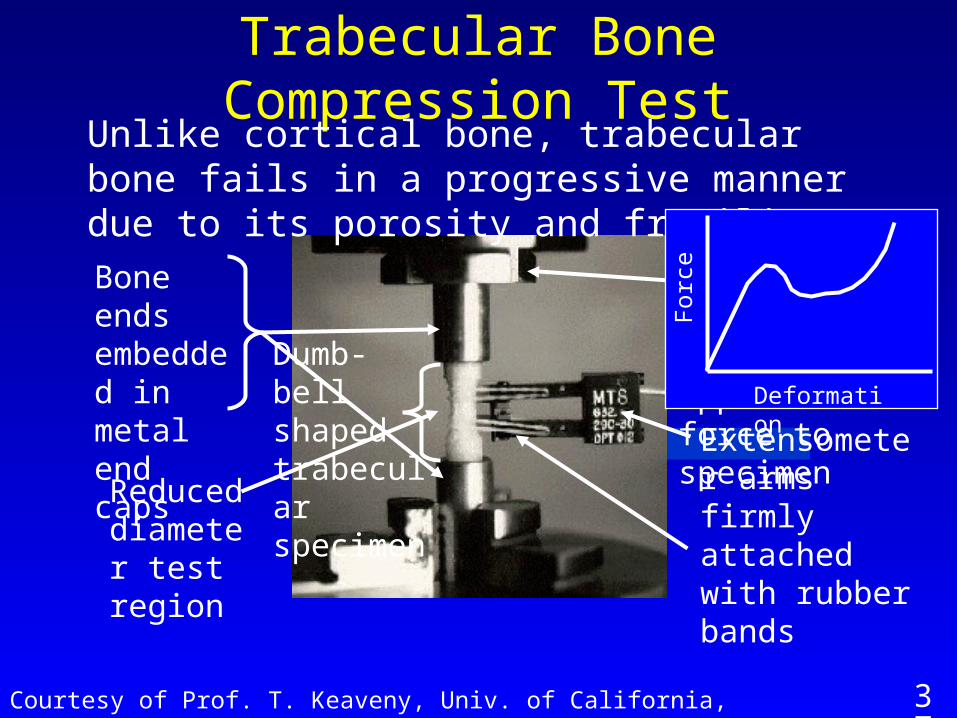
Trabecular Bone Compression Test
Courtesy of Prof. T. Keaveny, Univ. of California, Berkeley
Reduced diameter test region
Extensometer arms firmly attached with rubber bands
Bone ends embedded in metal end caps
37
Unlike cortical bone, trabecular bone fails in a progressive manner due to its porosity and fragility
Testing machine slowly applies force to specimenDumb-bell
shaped trabecular specimen
For
ce
Deformation
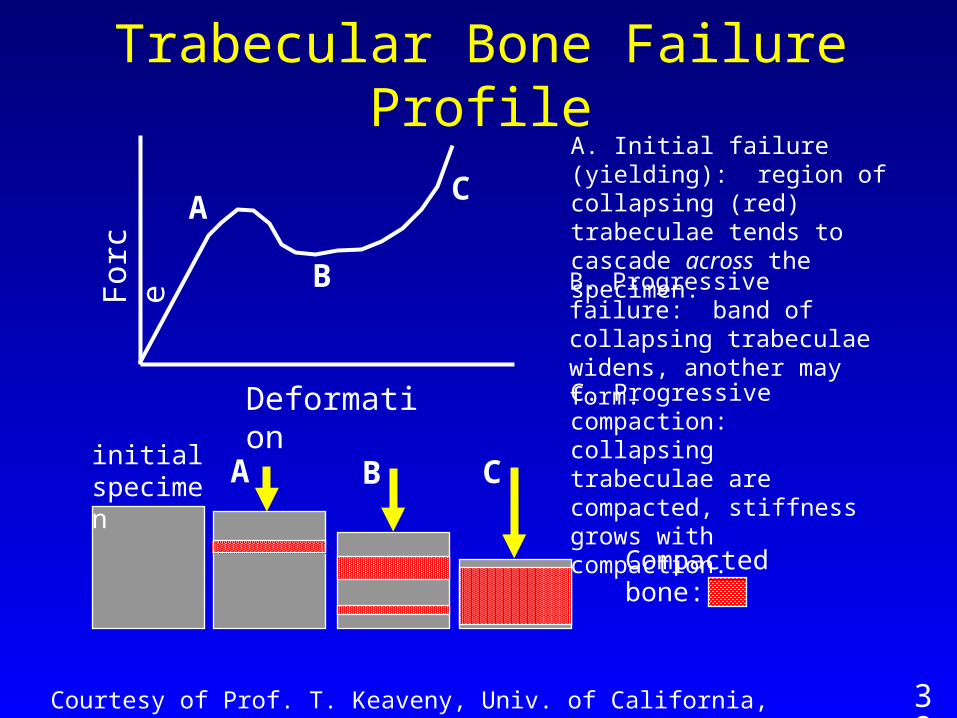
Trabecular Bone Failure ProfileA. Initial failure (yielding): region of collapsing (red) trabeculae tends to cascade across the specimen.
A
A
B. Progressive failure: band of collapsing trabeculae widens, another may form.
B
B
C. Progressive compaction: collapsing trabeculae are compacted, stiffness grows with compaction.C
C
For
ce
Deformation
initial specimen
Courtesy of Prof. T. Keaveny, Univ. of California, Berkeley 38
Compacted bone:
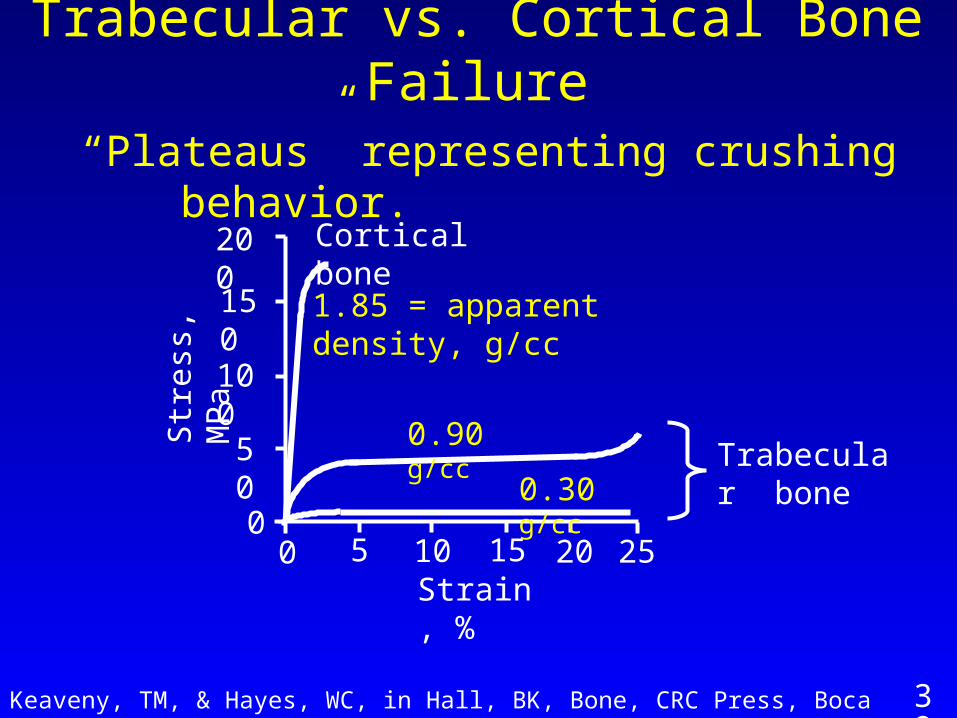
Trabecular vs. Cortical Bone Failure “Plateaus” representing crushing behavior.
Keaveny, TM, & Hayes, WC, in Hall, BK, Bone, CRC Press, Boca Raton, FL 1993. 39
Str
ess,
MP
a
0
50
100
200
150
0 5 10 15 20 25
0.30 g/cc
0.90 g/cc
1.85 = apparent density, g/cc
Strain, %
Cortical bone
Trabecular bone

In summary bone fractures are governed by...
http://www.nlm.nih.gov/medlineplus/ency/article/002966.htm
Nature of the bone Nature of the forces
Amount of energy40
The End
41Revised 3-8-07