
High strain rate deformation of Magnesium alloysdigitool.library.mcgill.ca/thesisfile119590.pdf ·...
216
High strain rate deformation of Magnesium alloys Mehdi Sanjari Department of Materials Engineering McGill University, Montreal March 2013 A thesis submitted to McGill University in partial fulfilment of the requirements for the degree of doctor of philosophy © Mehdi Sanjari, 2013
Transcript of High strain rate deformation of Magnesium alloysdigitool.library.mcgill.ca/thesisfile119590.pdf ·...
High strain rate deformation ofMagnesium alloys
Mehdi Sanjari
Department of Materials Engineering
McGill University, Montreal
March 2013
A thesis submitted to McGill University in partial fulfilmentof the requirements for the degree of doctor of philosophy
© Mehdi Sanjari, 2013

Abstract
The present study uses uniaxial compression testing over a wide range of strain rates to
analyze the microstructure and texture evolution during high speed rolling (HSR) for
AZ31B alloy and four Mg-Zn-Ce alloys. In the first part, the effects of strain rate on the
flow behaviour and microstructure evolution on AZ31 Mg alloy were studied by
compression testing over a wide range of strain rates (0.01-100 s-1) and temperatures
(300-450 °C). In the second part, high-speed rolling of 1000 m/min was employed to
successfully roll AZ31 alloy in one pass with 65% reduction in thickness at 300 °C and
450 °C. In the third part, a split Hopkinson pressure bar (SHPB) equipped with
induction radiation furnace was used to attain a strain rate, in compression, of 1200s-1 in
the temperature range of 25 to 350 °C and the result was compared with low strain rate
(0.01 s-1) compression behavior. As well, during high-speed rolling at 500 m/min, the
mill was interrupted, the sheet was withdrawn from rolling gap and the microstructure
and texture evolution was investigated. In the final part, the recrystallization and texture
evolution of four Mg-Zn-Ce sheets with a warm rolled microstructure obtained through
two stages that can be characterised as rough rolling and finish rolling, was investigated
at different stages of post-rolling annealing. The effect of rolling speed on the
recrystallization and texture evolution of four Mg-Zn-Ce alloys was investigated as-
deformed and after different stages of annealing.
The results showed that with increasing strain rate the twin-induced dynamic
recrystallization (DRX) fraction increased at a constant temperature during the
compression test over a wide range of strain rates, and the contribution of continuous
dynamic recrystallization (CDRX) is decreased. Also, the recrystallized volume fraction
increased significantly with strain rate. The flow behaviour was fitted to two types of
constitutive equation; (i) power law and (ii) hyperbolic sine. Average activation
energies of about 162 kJ/mol and 135 kJ/mol were obtained for the peak and steady-
state strain, respectively.
The rollability, texture and microstructure after high speed rolling of AZ31 in
comparison to low-speed rolling (LSR) (15m/min) improved significantly. It is
suggested that the double-peak and weaker basal texture obtained after HSR is
attributed to activation of compression and double twins. After annealing, the double-
peak basal texture is replaced by a single-peak, which may be due to preferential grain
V
growth of basal grains. Grain boundary misorientation analysis also shows that
coincident site lattice boundaries (CSL) related to contraction twins and secondary
twins are more numerous in the samples deformed at high strain rate. With increasing
strain for both rolling and compression at 200 °C, the splitting of basal poles was
observed, indicating the activation of more contraction twins and secondary twins
compared to low strain rate deformation.
Of the four Mg-Zn-Ce alloys, Mg-1Zn-1Ce, which had the highest Ce/Zn ratio, showed
the weakest as-rolled texture and the most homogenous shear banding/twinning.
Changing the Zn content changed particle size and, in alloys exhibiting texture
weakening, the static recrystallization mechanism altered.
On annealing of Mg-Zn-Ce alloys, the same regions of the microstructure, located by
hardness indentations, were examined and tracked by EBSD. Furthermore intragranular
misorientation axes (IGMA) analysis was used to investigate the associated deformation
mechanisms in the as deformed material. By combining these two methods, the
development of the recrystallization microstructure was investigated and preferential
nucleation sites, correlation between activated deformation mechanism and initial
orientation of the recrystallized grains was studied. The IGMA analysis also shows that
in Mg-1Zn-1Ce other types of dislocations rather than basal <a> are activated; in
particular prismatic <a> type, is activated during deformation. Therefore the weakening
of recrystallization texture during rolling resulting from the addition of RE elements is
linked with a change in dynamic recrystallization (DRX) behaviour. Since the Mg-1Zn-
1Ce alloy corresponds to the highest level of Ce in solid solution, the observed texture
weakening is possibly due to decreasing grain boundary mobility as a result of solute
partitioning of RE elements to dislocations and grain boundaries.
The results showed that by increasing the rolling speed more secondary and
compression twins were activated, which leads to the formation of more numerous local
shear bands and a more uniform microstructure. The rotational dynamic DRX
mechanism, in conjunction with the conventional DRX mechanism, is responsible for
this texture weakening during high speed rolling.

VI
Résumé
La présente étude a été réalisée à l’aide d’essais par compression uni-axiale en utilisant
une gamme variée de taux de déformation dans le but d’analyser la microstructure et
l’évolution de la texture lors du procédé de laminage à haute vitesse pour les alliages de
magnésium AZ31B et Mg-Zn-Ce. Dans la première partie, les effets du taux de
déformation sur le comportement de l’écoulement et l’évolution de la microstructure de
l’alliage AZ31B ont été étudiés par des essais de compression en utilisant une gamme
variée de taux de déformation (0.01-100s-1) et des variations de la température de (300-
450ºC).
Dans la seconde partie de cette étude, le laminage à vitesse rapide (100m/min.) a été
utilisé pour laminer l’alliage AZ31B avec succès dans une passe avec une réduction de
l’épaisseur de 65% à 300C et 450ºC. Dans la troisième partie de ce projet, une unité
d’essais Hopkinson (SHPB) équipée d’une fournaise à radiation a été utilisée afin
d’atteindre un taux de déformation de 1200s-1 avec une gamme de température de 25 à
350ºC. Le résultat a été comparé avec le faible taux de déformation de (0.01s-1). De
plus, au cours du laminage, à haute vitesse à 500 m/min., le laminoir a été arrêté, la
feuille a été retirée des rouleaux, la microstructure et la texture ont été analysées.
Dans la dernière partie de cette recherche, l’évolution de la recristallisation et la texture
de quatre feuilles d‘alliage Mg-Zn-Ce avec une microstructure roulée à chaud obtenue
après deux étapes qui a pu être caractérisée comme du laminage grossier et du laminage
final a été étudiée à différentes étapes après le recuit et après le laminage. L’effet de la
vitesse du laminage sur la recristallisation et l’évolution de la texture des quatre alliages
Mg-Zn-Ce ont été analysés tel que déformé et après différentes étapes de recuit. Les
résultats ont démontré qu’avec l’augmentation du taux de déformation, la
recristallisation dynamique des joints de maclage induits a augmenté à une température
constante au cours de l’essai de compression. Au-delà d’une gamme variée du taux de
déformation la contribution pour la recristallisation dynamique a diminuée. Aussi, la
fraction volumique recristallisée a augmentée de façon significative avec le taux de
déformation.
VII
Le comportement à l’écoulement a été relié à deux types d’équation constituante (i) loi
de la puissance et (ii) l’hyperbole sinusoïdale. Des énergies moyennes d’activation de
162 KJ/mole et 135 KJ/mole ont été obtenues respectivement pour le point maximum et
le taux de déformation continu. La facilité au laminage, la texture et la microstructure
après le laminage à haute vitesse de l’alliage AZ31B en comparaison au laminage à
basse vitesse (15m/min.) ont augmenté de manière significative. Il est suggéré que le
double point maximum et la faible texture de base obtenus suite au laminage à haute
vitesse sont attribués à l’activation provoquée par la compression et les doubles macles.
Après le recuit, le double point maximum de la texture de base est remplacé par un
point maximum simple qui est probablement causé par la croissance préférentielle des
grains de la texture de base. L’analyse de la désorientation des joints de grains montre
que les sites des bordures du réseau (CSL) sont reliés à la contraction des macles et des
macles secondaires qui sont plus nombreux dans les échantillons déformés à un taux de
déformation élevé. Avec l’augmentation de la déformation dans les deux cas, c’est-à-
dire le laminage et la compression effectués à 200ºC, la division des pôles de base a été
observée, ceci indiquant plus d’activation des macles et des macles secondaires en
comparaison du taux de déformation faible.
Des quatre alliages Mg-Zn-Ce, l’alliage Mg-1Zn-1Ce lequel avait le rapport Ce/Zn le
plus élevé a démontré la plus faible texture telle que laminée et le rapport le plus
homogène pour ce qui a trait au ratio pliage/maclage. En modifiant la teneur en zinc, la
grosseur des particules a changée et pour les alliages démontrant un affaiblissement de
la texture, le mécanisme de recristallisation a été modifié. Suite au recuit des alliages
Mg-Zn-Ce, les sites identiques de la microstructure identifiés par des essais de micro
dureté ont été examinés et suivis par EBSD. De plus, une analyse de la désorientation
des axes inter granulaires (IGMA) a été effectuée afin d’analyser les mécanismes de
déformation dans le matériel déformé. Ainsi à l’aide de la combinaison de ces deux
méthodes, le développement de la microstructure recristallisée a été analysé et les sites
préférentiels de nucléation, la corrélation entre les mécanismes de la déformation
activée et l’orientation initiale des grains recristallisés ont été étudiés. La méthode
d’analyse (IGMA) montre aussi que pour l’alliage Mg-1Zn-1Ce d’autres types de
dislocations en plus de la structure de base < a > sont activés; en particulier le type

VIII
prismatique < a > est activé au cours de la déformation. Par conséquent,
l’affaiblissement de la texture de recristallisation au cours du laminage qui résulte de
l’addition des éléments des terres rares est relié avec le comportement de la
recristallisation dynamique.
Alors que l’alliage Mg-1Zn-1Ce correspond à la plus haute teneur en Ce dans la
solution solide, la texture affaiblie observée est possiblement reliée à la mobilité des
bordures de grains comme résultant du fractionnement du soluté des éléments des terres
rares pour les dislocations et les joints de grains. Les résultats ont montré qu’en
augmentant la vitesse de laminage que plus de macles secondaires de compression ont
été produites, ce qui a conduit à la création d’un plus grand nombre de bandes de
cisaillement et une microstructure plus uniforme. Le mécanisme de recristallisation
dynamique rotationnel en relation avec le mécanisme (DRX) est responsable de
l’affaiblissement de la texture au cours du laminage à haute vitesse.
IX
Acknowledgments
My PhD career was not just the challenge of doing serious research but was also an
opportunity for me to better shape my vision of the worlds in which I am involved. It
would not have been possible to write this doctoral thesis without the help and support
of the kind people around me, to only some of whom it is possible to give particular
mention here.
First and foremost I offer my sincerest gratitude to my supervisor, Professor Steve Yue,
who has supported me throughout my thesis with his patience and knowledge whilst
allowing me the room to work in my own way. In all our meetings, I could feel his
idealistic push ad personal generosity, toward that which is the best. It was a pleasure
and great honour to work with him.
I would like to give special thanks to Prof In-Ho Jung for his support and guidance with
respect to for his invaluable suggestions and guidance for alloy design. I am also
grateful for having the opportunity of his prompt response, good advice, support and
friendship. I would like also to thank Dr. Elhachmi Essadiqi at CANMET-Materials
Technology Laboratory (Hamilton), who provided a great deal of assistance and astute
suggestions for my research, and providing related rolling and cam plastometer
experiments.
My thanks are due to Prof Hiroshi Utsunomiya at Osaka University, Japan for allowing
me to conduct high speed rolling experiments and hot tensile tests in his laboratory. I
deeply appreciated both Prof Sakai and Prof Utsunomiya for giving me the opportunity
to work with them and for their openness to teaching and learning. I truly enjoy working
in their friendly and supportive research group. I am also deeply grateful Prof Leo
Kestens and Roumen Petrov in Gent University for their scientific support and the use
of their laboratory facilities. They have oriented and supported me with promptness and
care, and have always been patient and encouraging in times of new ideas and

X
difficulties. I would like to sincerely thank Prof Jonas for his patient and sharing his
deep knowledge of material science with me. I am also grateful to Pierre Vermette for
his in-depth industrial experience. I am grateful to Professor Mary A. Wells (University
of Waterloo) for providing a hot-rolling facility.
In addition, I have been very privileged to get to know and to collaborate with many
other great people who became friends over the last several years in Montreal, Osaka
and Gent. Amongst my colleagues are in McGill hot-deformation lab, Ahmad Rezaeian,
Amir Farzadfar, Hashem Mousavi, Phuong Vo, Abu Syed Kabir, Huseyin Aydin, Jing
Su, Sriraman Rajagopalan, Vladimir Basabe, Lan Jiang and Salim Brahimi. My
appreciation also goes to my friends in the McGill University, Ehsan Masoumi, Alireza
Sadeghi, Atefeh Nabavi, Shirin Kaboli, Mohammad Shandiz, Mert Celikin, Amir
Rezaei Farkoosh, Yaneth Aguilar, Manas Paliwal and Étienne Martin.
I would like also thank Mr Miyamoto, Mr Hattori and Mr Muraoka for their kind
support for rolling experiments at Osaka University. Special thanks also go to Hadi
Pirgazi, Linsey Lapeire, Dr Sidor and Liesbet Van Landschoot for their assistance with
the EBSD experiments in Gent University.
I would like to thank the NSERC (Natural Sciences and Engineering Research Council
of Canada) Magnesium Strategic Research Network for their financial support. I also
gratefully appreciate the financial support provided by MEDA Fellowship from Faculty
of Engineering of McGill University.
XI
Contribution of authors
This thesis was prepared according to the guidelines for a manuscript-based thesis.
These guidelines are published by the Graduate and Postdoctoral Studies office of
McGill University.
The present thesis is comprised of the following six manuscripts; four of which are
published and two has been submitted:
M. Sanjari, S.A. Farzadfar, I.H. Jung, E. Essadiqi, S. Yue, Influence of strain rate onhot deformation behaviour and texture evolution of AZ31B, Materials Science andTechnology, 2012, 28 (4) , pp. 437-447 (Chapter 3).M. Sanjari, S.A. Farzadfar, H. Utsunomiya, T. Sakai, E. Essadiqi, S.Yue, High-speedrolling of AZ31 Mg alloy: texture and microstructure analysis, Materials Science andTechnology, Materials Science and Technology (United Kingdom),2012, 28 (8) , pp.928-933 (Chapter 4).M. Sanjari, S.A. Farzadfar, H. Utsunomiya, T. Sakai, E. Essadiqi, S.Yue,Microstructure and texture evolution of Mg-Zn-Ce magnesium alloys sheets andassociated restoration mechanisms during annealing, Materials Science andEngineering A, 2012, 561 , pp. 191-202 (Chapter 5).M. Sanjari, S.A. Farzadfar, H. Utsunomiya, T. Sakai, E. Essadiqi, S.Yue, A textureand microstructure analysis of high speed rolling of AZ31 using split Hopkinsonpressure bar results, Journal of Materials Science, (2013) 1-17 (Chapter 4).M. Sanjari, A. Farzadfar, H. Utsunomiya, E. Essadiqi, R. Petrov, L. Kestens, S.Yue,Promotion of texture weakening in magnesium by alloying and thermomechanicalprocessing-I alloying, submitted to J of Material Science (Chapter 6).M. Sanjari, A. Farzadfar, H. Utsunomiya, E. Essadiqi, R. Petrov, L. Kestens, S.Yue,Promotion of texture weakening in magnesium by alloying and thermomechanicalprocessing-II high speed rolling, submitted to J of Material Science (Chapter 6).
All the manuscripts were co-authored by Prof. Steve Yue, who supervised the research
projects, provided guidance and edited the manuscripts. All the experiments were
planned and conducted by the candidate. Throughout this project, Professor In-Ho Jung
provided me with expert guidance for alloy design using FactSage™ software. Dr

XII
Elhachmi Essadiqi also provided us the rolling and casting facilities and we had very
constructive discussions for carrying out the experiments. Professor H. Utsunomiya and
T. Sakai at the Osaka University provided us with the low and high speed rolling
facilities and also hot tensile testing. I would like to acknowledge the assistance of Amir
Farzadfar for carrying out some rolling experiments and EBSD sample preparation, and
his assistance in the preparation of the final manuscripts. For the preparation of the last
two papers, Professor Leo Kestens and Roumen Petrov from Gent University engaged
in stimulating and helpful discussions regarding texture and microstructure analysis and
some EBSD measurement, which greatly improved the quality of this work.
XIII
Table of contents
Chapter 1 ...................................................................................................................... 1
Introduction..................................................................................................................1
References.......................................................................................................................3
Chapter 2.......................................................................................................................5
Literature review............................................................................. ............................5
2.1 Deformation mechanisms in magnesium..................................................................5
2.1.1 Slip...................................................................................................................5
2.1.2 Twinning..........................................................................................................7
2.1.3 Twin formation and growth............................................................................11
2.1.4 Other deformation mechanisms......................................................................12
2.2 Restoration mechanisms..........................................................................................12
2.2.1 Dynamic restoration mechanism.....................................................................14
2.2.2 Static restoration processes after hot deformation...........................................16
2.2.3 Influence of deformation parameters on DRX mechanisms in magnesium.....19
2.2.3.1 Effect of the Zener-Hollomon parameter on DRX.......................................19
2.2.3.2 Initial grain size............................................................................................20
2.2.3.3 The effect of initial texture...........................................................................21
2.3. Texture evolution...................................................................................................22
2.4. Magnesium alloy systems......................................................................................23
2.4.1 Rare earth texture weakening...........................................................................25
2.4.2 Texture evolution during annealing.................................................................27
2.5 Rate dependent deformation of Mg alloys..............................................................29
XIV
2.5.1. The effect of strain rate on the recrystallized grain size..................................30
2.6. Rolling...................................... .............................................................................31
2.6.1 Deformation and texture evolution during high speed rolling.............................32
2.7 References ...................................... .....................................................................33
Chapter 3...................................... ...............................................................................37
Influence of strain rate on the hot deformation behavior and texture evolution of
AZ31B ...................................... ..................................................................................37
3.1 Introductions...................................... ....................................................................39
3.2 Experimental procedure...................................... ...................................................40
3.3. Results...................................... .............................................................................41
3.3.1 Stress-strain behaviour...................................... ...........................................41
3.3.2 Constitutive behaviour...................................... .............................................43
3.3.3 Power-law equation: ...................................... ................................................43
3.3.4 Hyperbolic sine equation...................................... ..........................................45
Chapter 4.......................................................................................................................61
Analysis of the microstructure and texture evolution during high speed rolling..61
4.1 A texture and microstructure analysis of high speed rolling of AZ31 using split
Hopkinson pressure bar results.................................................................................62
4.1.1 Introduction..........................................................................................................63
4.1. 2. Experiments........................................................................................................64
4. 1.2.1 Mechanical testing.....................................................................................64
4.1.2.2 Rolling experiments....................................................................................65
4.1.2.3 Material characterization...........................................................................66
4.1.3. Results and discussion.................................................................................67
XV
4.1.3.1 Uniaxial compression test.........................................................................67
4.1.3.1.2 Evolution of microstructure..................................................................68
4.1.3.1.3 The effect of strain rate on grain boundary character distributions...... 69
4.1.3.1.4 Deformation mechanism during high strain rate deformation...............75
4.1.3.1.5 Restoration mechanism during high strain rate deformation................79
4.1.3.2 High speed rolling of AZ31.....................................................................83
4.1.3.2.1 Microstructure and texture evolution....................................................83
4.1.4 Conclusions..........................................................................................................90
4.1.5 References............................................................................................................91
4.2 High speed rolling of Mg–3%Al–1%Zn alloy: texture and microstructureanalysis.........................................................................................................................94
4.2.1 Introduction..........................................................................................................95
4.2.2 Experimental procedure.......................................................................................95
4.2.3 Results and discussion.........................................................................................97
4.2.3.1 Microstructural characterization.......................................................................97
4.2.3.2 Texture evolution......................................................................................98
4.2.3.3 Deformation mechanisms during high speed rolling...............................100
4.2.3.4 Annealing behaviour of high speed rolled sheets.....................................103
4.2.4 Conclusion..........................................................................................................104
4.2.5 References..........................................................................................................104
Chapter 5....................................................................................................................107
Microstructure and texture evolution of Mg-Zn-Ce magnesium alloys sheets andassociated restoration mechanisms during annealing ..........................................107
5.1. Introduction..........................................................................................................109
5. 2. Experimental procedure......................................................................................110
5. 3. Results.................................................................................................................111
5. 3.1 Microstructure and second phase precipitate of rough rolled shee.......111
XVI
5.3.2 Finish rolled and annealed microstructure............................................115
5.3.3 Deformation texture of finish rolled sheets ........................................ 116
5.3.4 Microstructure and texture evolution during annealing........................118
5.3.5 Particle effect on texture and microstructure...................... ..................121
5.4. Discussion ...................... ...................... ...................... ...................... ...............123
5.4.1 The effect of rolling temperature on the as-rolled texture......................123
5.4.2 The effect of Ce/Zn ratio on the as-rolled texture..................................123
5.4.3 Microstructure and texture evolution during annealing.........................124
5.4.3.1 Texture evolution of AZ31 and Mg-4Zn-1Ce during annealing.........125
5.4.3.2 Texture evolution of Mg-1Zn-1Ce during annealing..........................127
5.4.5 Grain growth during annealing......................... ....................................130
5.5. Conclusions..........................................................................................................132
5.6 References.............................................................................................................132
Chapter 6................................................................................................................... 135
Promotion of texture weakening in magnesium by alloying and thermomechanical
processing...................................................................................................................135
6.1 The effect of alloying on texture weakening.....................................................136
6.1.1 Introduction............................................................................ ...........................137
6.1.2 Experimental procedure.....................................................................................138
6.1.2.1 Rolling experiments..............................................................................138
6.1.2.2 Material characterization ...................................................................139
6.1.2.3 In-grain misorientation axis analysis (IGMA)......................................139
6.1.3. Results............................................................................ ..................................139
6.1.3.1 Microstructure of rough rolled sheets ......................................................139
6.1.3.2 Texture and microstructure analysis of rough rolled sheets......................141
6.1.3.3 Determination of activated slip system in rough rolled material using
XVII
IGMA analysis............................................................................................................144
6.1.3.4 Tracking the microstructure of Mg-4Zn-1Ce during annealing.................146
6.1.3.4 Tracking the microstructure of Mg-1Zn-1Ce during annealing.................146
6.1.4. Discussion.........................................................................................................154
6.1.4.1 The effect of Ce/Zn ratio on microstructure..............................................154
6.1.4.2 Effect of alloying on the activated deformation mechanism.....................155
6.1.4.3 Static restoration mechanism during annealing.........................................157
6.1.5. Conclusion.........................................................................................................162
6.1.6 References..........................................................................................................163
6.2 The effect of thermomechanical processing on texture weakening................165
6.2.1. Introduction.......................................................................................................166
6.2.2 Experimental procedure.....................................................................................167
6.2.2.1 Rolling experiments...............................................................................167
6.2.2.2 Material characterization........................................................................167
6.2.3. Results...............................................................................................................168
6.2.3.1 The effect of HSR on microstructure and rollability ............................168
6.2.3.2 Deformation texture of finish rolled sheets...........................................169
6.2.3.3 Microstructure evolution of finish rolled samples during annealing.... 170
6.2.3.4 Texture evolution during annealing of finish rolled samples ...............171
6.2.3.5 Grain growth at Mg-4Zn-1Ce................................................................174
6.2.4. Discussion.........................................................................................................178
6.2.4.1 The microstructure homogeneity during HSR......................................178
6.2.4.2 Grain growth........................................................................................179
6.2.5. Conclusions.......................................................................................................181
6.2.6 References..........................................................................................................182
Chapter 7....................................................................................................................184
XVIII
Conclusion.................................................................................................................184
Chapter 8.....................................................................................................................187
Contributions to Original Knowledge.....................................................................187
Chapter 9.....................................................................................................................190
Future Work..............................................................................................................190
XIX
List of figures
Fig. 2.1: (a) Basal slip systems, (b) prismatic slip systems, (c) pyramidal slip systems, and (d)second-order pyramidal slip systems. ............................................................................................7
Fig. 2.2: The effect of deformation temperature on the CRSS value of slip systems and twinningin pure Mg [16]. ............................................................................................................................7
Fig. 2.3: (a) Schematic of representation of forming twin, (b) {10-12)[-1011] extensiontwinning in Mg crystals, (c) {1-101} [10-1-2] compression twinning [25]...................................8
Fig. 2.4: Schematic of {10-11}-{10-12}double twin based on Hartt and Reed-Hill’s finding[45]. .............................................................................................................................................10
Fig. 2.5: Microstructural mechanism map for pure magnesium (I - the area of transformation ofinitial twins into recrystallised grains) [86]. ................................................................................15
Fig. 2.6: (a) DRX in the grain boundary region in Mg deformed at medium temperatures [72],(b) EBSD map of AZ31 hot rolled at 375ºC. Progressive orientation gradient was found to beinvolved in subgrain formation (white lines) in the vicinity of original grain boundary (blacklines) [87]. ...................................................................................................................................15
Fig. 2.7: Schematic representation of the nucleation of recrystallization by the coalescence ofsubgrains (a) subgrain structure before nucleation, (b) coalescence of subgrains A and B [90]......................................................................................................................................................18
Fig. 2.8: Schematic representation of recrystallization by strain induced grain boundarymigration [77]. ...........................................................................................................................18
Fig. 2.9: (a) Influence of temperature on flow curve of AZ31 deformed in compression [97],and (b) influence of strain rate on the stress-strain curve behaviour of AZ31 magnesium alloycompressed at 300ºC [80]. ..........................................................................................................19
Fig. 2.10: Influence of initial grain size on dynamically recrystallized fraction and dynamicallygrain size in AZ31, deformed in compression at 300°C [83]. .....................................................20
Fig. 2.11: Mapping of the defect for rolling of AZ31 at various temperatures and reductions anda speed rolling of 2000 mm/min. .......................................................... .....................................32
Fig. 3.1: True stress–strain curves of AZ31b obtained from load displacement data at ε = 0.01 to100 s-1 and at temperature of: (a) 300°C, (b) 375°C, (c) 450°C, (d) 300°C represent the concaveand convex shape. .......................................................... .............................................................43
Fig. 3.2: Effect of temperature on the peak stress at various temperatures and strain rates........43
Fig. 3.3: The effect of strain rate on the peak strain of AZ31 at different temperatures........... 45
XX
Fig. 3.4: The standard analysis of the constitutive equation (Eq. 1) (a) Relation between peakstress and strain rate (b) Relation between peak stress and temperature......................................46
Fig. 3.5: The influence of the Zener–Hollomon parameter, Z, on the peak flow stress for the hotdeformation of magnesium alloy at peak strain and strain of 0.5 using calculated activationenergy. .........................................................................................................................................47
Fig. 3.6: The standard analysis of the constitutive equation (Eq. 2) (a) Relation between peakstress and strain rate (b) Relation between peak stress and temperature......................................47
Fig. 3.7: Microstructures of the specimens compressed to the strain of 0.3 at 375°C and a strainrate of (a) 0.01 s-1, (b) 1 s-1, (c) 10 s-1, (d) 60 s-1, and (e) 100 s-1. (f) DRX volume fraction atdifferent strain rates. .............................................................................. .....................................49
Fig. 3.8: Microstructures of the specimens compressed to the strain of 0.3 at a strain rate of 10s-1 and temperatures of (a) 300 °C, (b) 375 °C, and (c) 450 °C. (d) DRX volume fraction atdifferent temperatures. .......................................................... ...................................................50
Fig. 3.9: Microstructures of the specimens compressed to the strain of 0.7 at 375°C and strainrates of (a) 0.01 s-1, (b) 1 s-1, (c) 10 s-1, (d) 60 s-1, and (e) 100 s-1. .............................................51
Fig. 3.10: (0002) X-ray pole figure of the specimens compressed to the strain of 0.3 at 375°Cand strain rates of (a) 0.01 s-1, (b) 10 s-1, and (c) 100 s-1. ..........................................................52
Fig. 3.11: Density of basal poles versus deviation angle from compression direction (a) 370°C,(b) strain rate of 0.01 s-1, and (c) strain rate of 100 s-1.................................................................52
Fig. 3.12: Misorientation distribution angles for samples deformed at different strain rates and300°C. .......................................................... ..............................................................................54
Fig. 3.13: EBSD map of a sample deformed at 300ºC and 10 s-1to strain of 0.3. The sub-boundaries (5º<ω<15º) are demonstrated by white lines and the h igh angle boundaries areoutlined in a black line. (a) Orientation map displaying a secondary twin with the relatedcompression twin and matrix grain. (b) The secondary twin (green boundary) is created by theformation of a tensile twin (red boundary) inside a compression twin (yellow boundary). (c)(0001) pole figure illustrating the crystallographic arrangement of the different twins and thematrix grain. .......................................................... .....................................................................55
Fig. 3.14: EBSD measurements revealing evidence of CDRX. (a) Orientation map samplesdeformed in compression to a strain of 0.3 at a temperature of 375°C and a strain rate of 0.01 s -1
(The sub-boundaries (5º<ω<15º) are demonstrated by white lines and the high angle boundariesare outlined in a black line. (b) The cumulative misorientation along the arrow from a to thegrain boundary. .......................................................... ................................................................56
Fig. 3.15: EBSD map of a sample deformed at 450ºC and 0.01 s-1 to strain of 0.3. The sub-boundaries (5º<ω<15º) are demonstrated by white lines and the high angle boundaries areoutlined in a black line. .......................................................... ...................................................56
XXI
Fig. 3.16: Distribution of the misorientation angles between recrystallized grains and theirprimary twin hosts. .......................................................... ...........................................................58
Fig. 4.1.1: The stress-strain curve at various temperatures and average strain rate of the sampleis (a) 0.01 s-1 (b) 11000 s-1. .......................................................... ..............................................68
Fig. 4.1.2: Microstructure of the specimens compression-tested at various temperatures andstrain rates of 0.01 s-1and 1000 s-1 at strain of 0.2.. .......................................................... ..........68
Fig. 4.1.3: Zener-Holloman Parameter vs. flow stress at true strain of -0.2................................69
Fig. 4.1.4: IPF of the selected region at 200°C and strain rates of (a) 1000 s-1 and (b) 0.01 s-1,correlated rotation axes distribution (c) 1000 s-1 and (d) 0.01 s-1 , (e) misorientation angledistribution for both strain rates. .......................................................... .....................................73
Fig. 4.1.5: The {0002} pole figures of the samples deformed at 200°C and two strain rates of0.01 s-1 and 1200 s-1 and different strains........................................................... .........................76
Fig. 4.1.6: Propagation of the T-twin (red area) inside the favourite grain at the early stage ofdeformation. As the schematic hexagonal crystal and pole figure shows (bottom left), the basalplanes in the twinned are reorientated toward the compression. ................................................ 78
Fig. 4.1.7: C-twins and S-twins propagation inside a grain with favourable orientation. The highangle boundaries (15º<ω<180º) are outlined in a black line. (0001) pole figure illustrates thecrystallographic arrangement of the different C-twins, S-twins, and the matrix grain. Theselected area is displaying a S-twin with the related C-twin and matrix grain. The S-twin iscreated by the formation of a T-twin inside a C-twin. ........................... ....................................80
Fig. 4.1.8: Microstructures of the specimens compression-tested at a temperature of 350°C and astrain rate of 1000 s-1; quenched (a) immediately after deformation, (b) after 5 s. .....................81
Fig. 4.1.9: Kernel average misorientation (KAM) distribution of the S-twin and parent grainregions. The twins have higher KAM value than the parent grains. ...........................................82
Fig. 4.1.10: IPF maps for AZ31 deformed at 200°C and 1000 s-1 and annealed for 90 s. Thestatic recrystallized grains have almost the same shape as their parent S-twins, and the originalcoarse grains are not consumed by the recrystallization. In the bottom images, (0002) polefigures of initial parent grains and the SRX are shown. ........................... ..................................83
Fig. 4.1.11: The shape of RD-ND plane and the observation positions of the sheet produced byinterrupted rolling; the microstructure of the partially rolled sheet is shown at different positionof the entry to the exit of the deformed zone. ........................... ........................... .....................84
Fig. 4.1.12: (a) IPF of the region with 31% reduction, the related (0001) and 1010 pole figuresare also shown in the bottom of the graph for the same area, (b) Correlated rotation axesdistribution (top) and misorientation angle distribution (bottom), (c) IPF map and “Kikuchi bandcontrast” of the magnified region. The area squared by the blue line shows the formation of C-twin and S-twin inside the basal parent grains. ........................... ........................... ..................86
XXII
Fig. 4.1.13: IPF of the region with 71% reduction, the related (0001) and 1010 pole figures arealso shown in the bottom of the graph for the same area. ........................... ..............................87
Fig. 4.1.14: (a) IPF of the region in the exit point of the rolling gap with 100% reduction, therelated (0001) and (1010) pole figures are also shown in the bottom of the graph for the samescanned area, (b) Correlated rotation axes distribution (top) and misorientation angledistribution (bottom), (c) “Kikuchi band contrast” of the same area. ........................... .............88
Fig. 4.1.15: (a) IPF of the region in the 12 mm of exit point of the rolling gap, the related (0001)and (1010) pole figures are also shown in the bottom of the graph for the same scanned area, (b)Correlated rotation axes distribution (top) and misorientation angle distribution (bottom), (c)“Kikuchi band contrast” of the same area. ........................... ......................................................90
Fig. 4.1.16: (a) IPF and related (0001) pole figures of the region in the 12 mm of exit point ofthe rolling gap for the grains larger than the average (top) and the grains smaller than theaverage. ........................... .............................. ........................... ..............................................91
Fig. 4.2.1: Microstructure of AZ31 (a) rough rolled and annealed, and as-rolled sheet at (b)rolling speeds of 15 m/min and 300°C, (c) 1000 m/min and 300°C, (d) 15 m/min and 450°C(left: kernel average misorientation distribution; right: microstructure) and (e) 1000 m/min and450°C 1000 m/min. ........................... .............................. ........................... ..............................99
Fig. 4.2.2: {0002} PF for (a) rough rolled sample and finish rolled samples rolled at (b) rollingspeed of 15 m/min and 300°C, (c) 1000 m/min and 300°C, (d) 15 m/min and 450°C, and (e)1000 m/min and 450°C . ........................... .............................. ........................... ......................99
Fig. 4.2.3: (a-g) Inverse pole figure map and corresponding PF for different points of roll gapand (h) misorientation angle distribution for different points of roll gap. ................................102
Fig. 4.2.4: {0002} PF for samples rolled and annealed for 5 min at rolling speeds 1000 m/minand (a) 300°C, (b) 450°C, and IPF map for sample rolled at 300°C and 1000 m/min (c) as-rolled, (d) annealed for (d) 30 s and (e) 300 s, IPF for the grains smaller than 15 m (upper) andgrains larger than 15 m. ....................... ....................... ....................... ................................104
Fig. 5.1: The microstructure of the rough rolled and annealed samples for 15 min at 450°C: (a)Mg-1 Zn-0.5 Ce, (b) Mg-1 Zn-1Ce, (c) Mg-2 Zn-1Ce, (d) Mg-4 Zn-1 Ce, (e) AZ31, (f) the as-cast and homogenised microstructure of Mg-1 Zn-1Ce before rough rolling. ..........................111
Fig. 5.2: BSE images showing the morphology of the particles in the Mg-Zn-Ce alloys in the as-cast (left) and finish rolled (right) conditions. The composition of designated particles iscollected in table 5.1. ......................................................................................... .......................113
Fig. 5.3: TEM micrograph of Mg-1Zn-1Ce (a) as-cast and homogenized, and (b) finish rolledsamples at 450°C. .............................................................................. .......................................114
Fig. 5.4: The microstructure of the finish rolled samples of the Mg-Zn-Ce alloys rolled at 300°Cin the as-rolled condition (left side) and annealed for 15 min at 450°C (right side). The effect of
XXIII
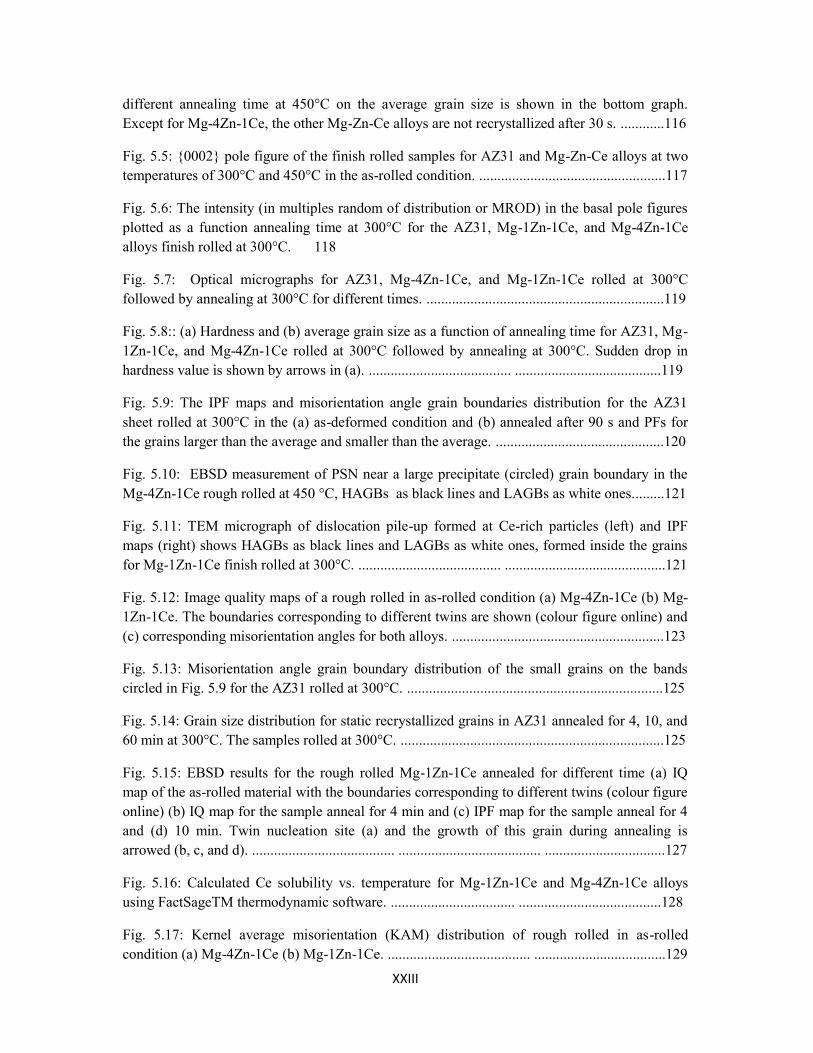
different annealing time at 450°C on the average grain size is shown in the bottom graph.Except for Mg-4Zn-1Ce, the other Mg-Zn-Ce alloys are not recrystallized after 30 s. ............116
Fig. 5.5: {0002} pole figure of the finish rolled samples for AZ31 and Mg-Zn-Ce alloys at twotemperatures of 300°C and 450°C in the as-rolled condition. ...................................................117
Fig. 5.6: The intensity (in multiples random of distribution or MROD) in the basal pole figuresplotted as a function annealing time at 300°C for the AZ31, Mg-1Zn-1Ce, and Mg-4Zn-1Cealloys finish rolled at 300°C. 118
Fig. 5.7: Optical micrographs for AZ31, Mg-4Zn-1Ce, and Mg-1Zn-1Ce rolled at 300°Cfollowed by annealing at 300°C for different times. .................................................................119
Fig. 5.8:: (a) Hardness and (b) average grain size as a function of annealing time for AZ31, Mg-1Zn-1Ce, and Mg-4Zn-1Ce rolled at 300°C followed by annealing at 300°C. Sudden drop inhardness value is shown by arrows in (a). ....................................... ........................................119
Fig. 5.9: The IPF maps and misorientation angle grain boundaries distribution for the AZ31sheet rolled at 300°C in the (a) as-deformed condition and (b) annealed after 90 s and PFs forthe grains larger than the average and smaller than the average. ..............................................120
Fig. 5.10: EBSD measurement of PSN near a large precipitate (circled) grain boundary in theMg-4Zn-1Ce rough rolled at 450 °C, HAGBs as black lines and LAGBs as white ones.........121
Fig. 5.11: TEM micrograph of dislocation pile-up formed at Ce-rich particles (left) and IPFmaps (right) shows HAGBs as black lines and LAGBs as white ones, formed inside the grainsfor Mg-1Zn-1Ce finish rolled at 300°C. ....................................... ............................................121
Fig. 5.12: Image quality maps of a rough rolled in as-rolled condition (a) Mg-4Zn-1Ce (b) Mg-1Zn-1Ce. The boundaries corresponding to different twins are shown (colour figure online) and(c) corresponding misorientation angles for both alloys. ..........................................................123
Fig. 5.13: Misorientation angle grain boundary distribution of the small grains on the bandscircled in Fig. 5.9 for the AZ31 rolled at 300°C. ......................................................................125
Fig. 5.14: Grain size distribution for static recrystallized grains in AZ31 annealed for 4, 10, and60 min at 300°C. The samples rolled at 300°C. ........................................................................125
Fig. 5.15: EBSD results for the rough rolled Mg-1Zn-1Ce annealed for different time (a) IQmap of the as-rolled material with the boundaries corresponding to different twins (colour figureonline) (b) IQ map for the sample anneal for 4 min and (c) IPF map for the sample anneal for 4and (d) 10 min. Twin nucleation site (a) and the growth of this grain during annealing isarrowed (b, c, and d). ....................................... ....................................... .................................127
Fig. 5.16: Calculated Ce solubility vs. temperature for Mg-1Zn-1Ce and Mg-4Zn-1Ce alloysusing FactSageTM thermodynamic software. .................................. .......................................128
Fig. 5.17: Kernel average misorientation (KAM) distribution of rough rolled in as-rolledcondition (a) Mg-4Zn-1Ce (b) Mg-1Zn-1Ce. ....................................... ....................................129
XXIV
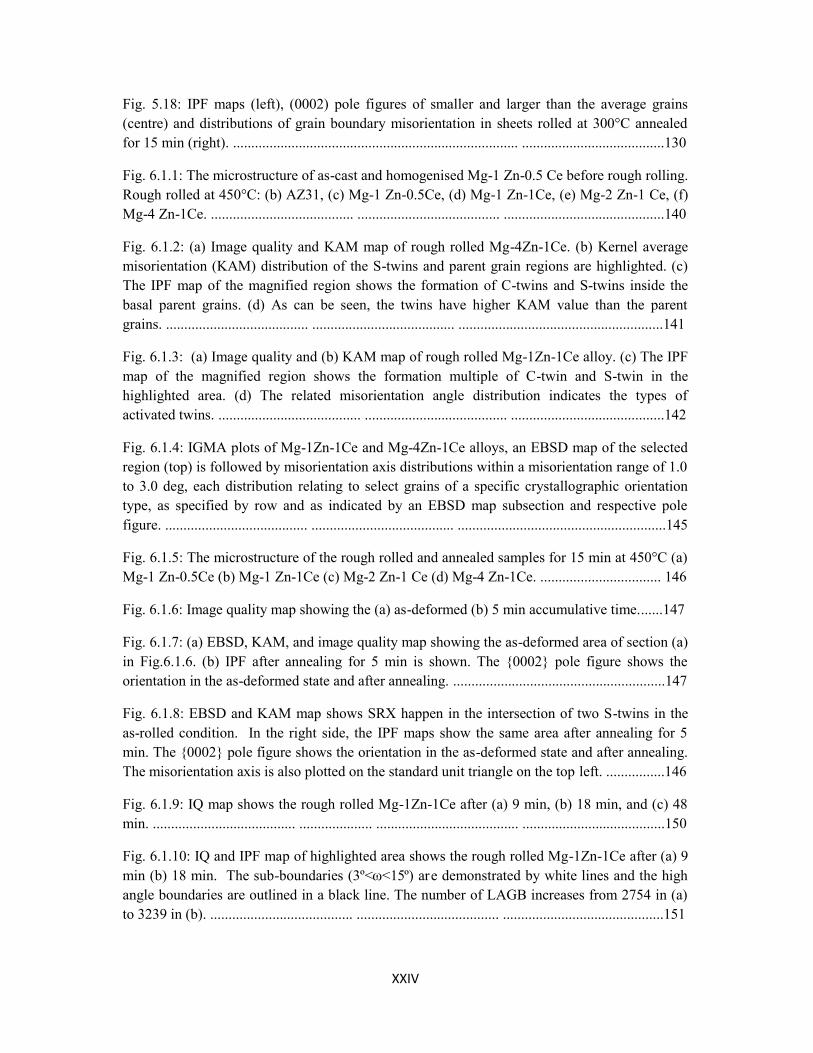
Fig. 5.18: IPF maps (left), (0002) pole figures of smaller and larger than the average grains(centre) and distributions of grain boundary misorientation in sheets rolled at 300°C annealedfor 15 min (right). .............................................................................. .......................................130
Fig. 6.1.1: The microstructure of as-cast and homogenised Mg-1 Zn-0.5 Ce before rough rolling.Rough rolled at 450°C: (b) AZ31, (c) Mg-1 Zn-0.5Ce, (d) Mg-1 Zn-1Ce, (e) Mg-2 Zn-1 Ce, (f)Mg-4 Zn-1Ce. ....................................... ....................................... ............................................140
Fig. 6.1.2: (a) Image quality and KAM map of rough rolled Mg-4Zn-1Ce. (b) Kernel averagemisorientation (KAM) distribution of the S-twins and parent grain regions are highlighted. (c)The IPF map of the magnified region shows the formation of C-twins and S-twins inside thebasal parent grains. (d) As can be seen, the twins have higher KAM value than the parentgrains. ....................................... ....................................... ........................................................141
Fig. 6.1.3: (a) Image quality and (b) KAM map of rough rolled Mg-1Zn-1Ce alloy. (c) The IPFmap of the magnified region shows the formation multiple of C-twin and S-twin in thehighlighted area. (d) The related misorientation angle distribution indicates the types ofactivated twins. ....................................... ....................................... ..........................................142
Fig. 6.1.4: IGMA plots of Mg-1Zn-1Ce and Mg-4Zn-1Ce alloys, an EBSD map of the selectedregion (top) is followed by misorientation axis distributions within a misorientation range of 1.0to 3.0 deg, each distribution relating to select grains of a specific crystallographic orientationtype, as specified by row and as indicated by an EBSD map subsection and respective polefigure. ....................................... ....................................... .........................................................145
Fig. 6.1.5: The microstructure of the rough rolled and annealed samples for 15 min at 450°C (a)Mg-1 Zn-0.5Ce (b) Mg-1 Zn-1Ce (c) Mg-2 Zn-1 Ce (d) Mg-4 Zn-1Ce. ................................. 146
Fig. 6.1.6: Image quality map showing the (a) as-deformed (b) 5 min accumulative time.......147
Fig. 6.1.7: (a) EBSD, KAM, and image quality map showing the as-deformed area of section (a)in Fig.6.1.6. (b) IPF after annealing for 5 min is shown. The {0002} pole figure shows theorientation in the as-deformed state and after annealing. ..........................................................147
Fig. 6.1.8: EBSD and KAM map shows SRX happen in the intersection of two S-twins in theas-rolled condition. In the right side, the IPF maps show the same area after annealing for 5min. The {0002} pole figure shows the orientation in the as-deformed state and after annealing.The misorientation axis is also plotted on the standard unit triangle on the top left. ................146
Fig. 6.1.9: IQ map shows the rough rolled Mg-1Zn-1Ce after (a) 9 min, (b) 18 min, and (c) 48min. ....................................... .................... ....................................... .......................................150
Fig. 6.1.10: IQ and IPF map of highlighted area shows the rough rolled Mg-1Zn-1Ce after (a) 9min (b) 18 min. The sub-boundaries (3º<ω<15º) are demonstrated by white lines and the highangle boundaries are outlined in a black line. The number of LAGB increases from 2754 in (a)to 3239 in (b). ....................................... ....................................... ............................................151

XXV
Fig. 6.1.11: IPF and image quality map showing samples annealed for (a) 9 min (b) 18 min. The{0002} pole figure shows the orientation marked in IPF map of (a) and (b). .......................151
Fig. 6.1.12: IQ and IPF map of highlighted area shows the rough rolled Mg-1Zn-1Ce after (a)18 min (b) 48 min. The sub-boundaries (3º<ω<15º) are demonstrated by white lines and thehigh angle boundaries are outlined in a black line. (c) The IGMA representation for grains areshown by hexagon in IPF map in (a), and (d) the {0002} pole figure shows the orientationmarked in IPF map of (a) and (b). ....................................... .....................................................152
Fig. 6.1.13: IQ and IPF map shows the rough rolled Mg-1Zn-1Ce after 48 min annealing. The{0002} pole figure shows the orientation distribution of the same area in the as-deformed andannealed area. ....................................... ....................................... ..........................................156
Fig. 6.1.14: EBSD map showing the as-deformed and annealed after 5 min. An SRX grain isnucleated in the triple junction point of the parent grains. The {0002} pole figure shows theorientation of parent grains and the nucleated SRX grain. The misorientation axis is also plottedon the standard unit triangle. ............................................................. .......................................159
Fig. 6.1.15: This misorientation gradient is demonstrated using misorientation angle distributionvs distance inside the grains in the Mg-4Zn-1Ce alloy. 161
Fig. 6.2.1: The appearance of as-rolled AZ31 and Mg-1Zn-1Ce rolled at rolled at 300°C androlling speed of 15 m/min and 1000 m/min. ..................................... .......................................168
Fig. 6.2.2: Optical micrographs for the as-rolled AZ31, Mg-Zn-Ce alloys rolled at 300°C androlling speed of 15 m/min and 1000 m/min....................................... .......................................168
Fig. 6.2.3 {0002} pole figure of the HSR and LSR rolled samples for AZ31 and Mg-Zn-Cealloys rolled at 300°C and rolling speed of 15 m/min and 1000 m/min. ..................................169
Fig. 6.2.4: (a) Average grain size and (b) hardness of the Mg-Zn-Ce alloys rolling rolled at300°C and rolling speed of 15 m/min and 1000 m/min as a function of annealing time. (c) Themicrostructure of selected annealing time. ....................................... ........................................170
Fig. 6.2.5: Result of X-ray texture measurement in the rolled and annealed Mg-Zn-Ce alloys,shown by volume percent of basal planes versus the tilt angle of basal poles from the ND and{0002} pole figures. .......................................................................... .......................................172
Fig. 6.2.6: (a) Image quality map of the LSR sheets at 300°C in the as-deformed condition ofMg-4Zn-1C, (b) IPF for the same region. (c) Image quality map of the LSR sheets at 300°Cafter annealing for 90 s (d IPF for the same region, (e) misorientation angle distribution........175
Fig. 6.2.7: (a) Image quality map of the LSR sheets at 300°C in the as-deformed condition ofMg-1Zn-1C, (b) IPF for the same region. (c) Image quality map of the LSR sheets at 300°Cafter annealing for 90 s (d) IPF for the same region, (e) misorientation angle distribution.......176
Fig. 6.2.8: IPF map (left), grain size distribution (center) and {0002} pole figure shows theorientation related to the grains classified in different group size after (a) 9 min and (b) 18 minannealing for Mg-4Zn-1Ce. ............................................................... .......................................177

XXVI
Fig. 6.2.9: The {0002} pole figures extracted from EBSD data for the Mg-4Zn-1Ce rough rolledsamples annealed at different annealing time (a) as-rolled, (b) 5 min, (c) 9 min, and (d) 18min. ....................................... ....................................... ............................................................181
Fig. 6.2.10: The misorientation angle distribution for the Mg-4Zn-1Ce rough rolled samplesannealed at different annealing times. ....................................... ...............................................181
XXVII
List of Tables
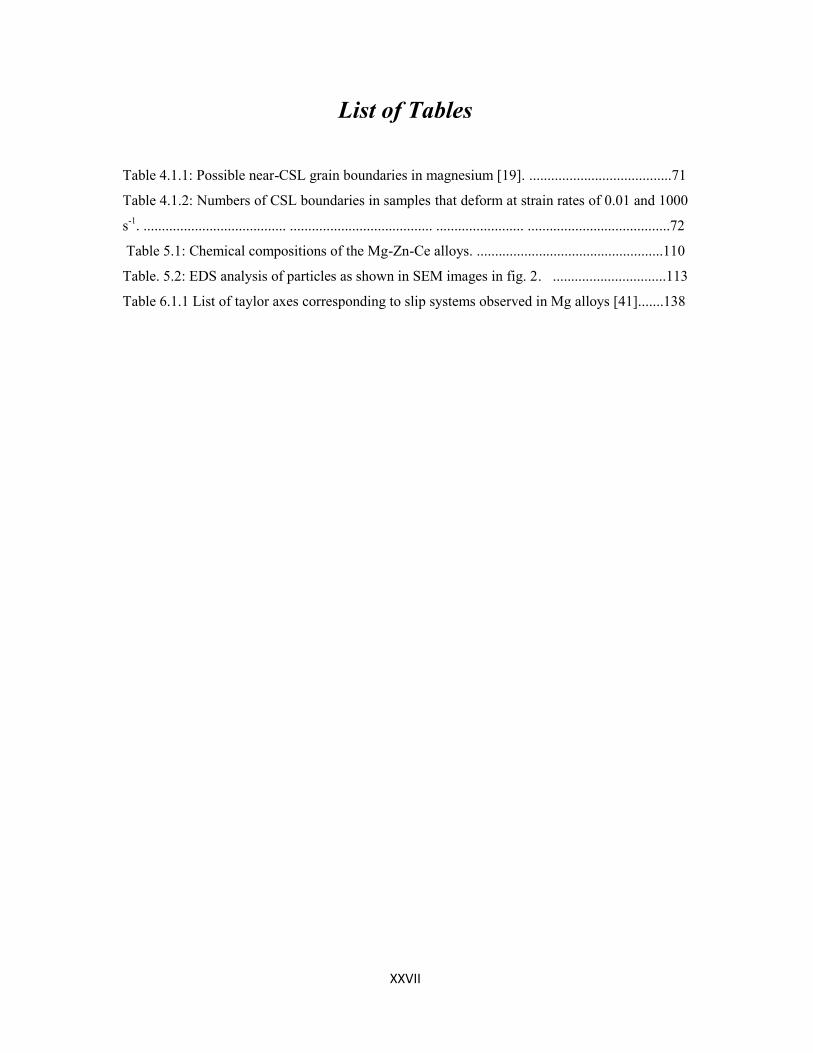
Table 4.1.1: Possible near-CSL grain boundaries in magnesium [19]. .......................................71
Table 4.1.2: Numbers of CSL boundaries in samples that deform at strain rates of 0.01 and 1000
s-1. ....................................... ....................................... ........................ .......................................72
Table 5.1: Chemical compositions of the Mg-Zn-Ce alloys. ...................................................110
Table. 5.2: EDS analysis of particles as shown in SEM images in fig. 2. ...............................113
Table 6.1.1 List of taylor axes corresponding to slip systems observed in Mg alloys [41].......138

Chapter 1. Introduction
1
Chapter 1
Introduction
Having the lowest density among all structural metals, magnesium has opened new
horizons for developing commercial alloys with successful use in a wide variety of
applications [1, 2]. The application of magnesium and magnesium alloys in the
automotive industry can reduce vehicle weight, and, consequently, fuel consumption can
be reduced [2-5].
However, the plasticity of Mg is restricted at low temperatures because: (a) only a
small number of deformation mechanisms can be activated [6, 7], and (b) a preferred
crystallographic orientation (texture) develops in wrought alloys, especially in flat-rolled
sheets [8-10]. This causes problems in sheet processing (i.e. hot and warm rolling) as
well as component manufacturing from the sheet. Therefore, manufacturing processes
such as rolling and stamping should be performed at elevated temperatures [1, 11]. These
barriers to the manufacturing process increase the price of magnesium wrought alloy
products and limits the use of Mg to castings [12, 13]. As a result, many studies have
been conducted to improve formability by investigating the effect of manufacturing
process parameters as well as identifying alloying additions that may enhance the
material performance [11, 14-18].
Recently it has been found that ‘high speed’ rolling of AZ31 can be successfully
performed at temperatures around 200 C, the temperature at which cracking takes place
at ‘conventional’ rolling speeds [4]. This is significant because Mg cools down rapidly
in the roll gap during hot rolling, necessitating a current industrial hot rolling schedule to
produce sheet that requires inter-pass reheating steps to maintain hot rollability until the
desired gauge is reached. As implied earlier, this leads to high costs and low
Chapter 1. Introduction
2
productivity. As an added dividend, the resulting microstructure due to high speed rolling
appears to be uniform, recrystallized and relatively fine.
The effects of strain rate, and temperature on the deformation behavior of cubic
materials have been studied extensively [19-22]. However, high strain rate deformation
of hexagonal materials such as Mg has received relatively little attention. Thus the first
goal of this research is to investigate the effect of strain rate in Mg alloys and study the
possibility of using high speed rolling to effectively minimise or eliminate the need for
inter-pass heating. In due course, this research focuses on the study of rate-dependent
response of some Mg alloys and elucidates the associated deformation mechanism
controlling.
As mentioned above, another main barrier for using magnesium is the development
of a strong preferred crystallographic orientation (texture) in wrought alloys, which
substantially limits the subsequent formability, especially in flat-rolled sheets. Plastic
anisotropy and tension-compression asymmetry are other disadvantages of the presence
of such a preferred orientation [16, 23-25]. Therefore, either the existing alloys must be
modified to enhance the ductility and formability, or new alloys must be developed. This
is of critical importance for an extended industrial use of magnesium sheets. It has
recently been found that the addition of rare earth (RE) elements, such as yttrium, cerium
or neodymium, significantly weakens the rolling or extrusion texture of Mg alloys [16,
18, 26-28]. To date the texture weakening mechanism has been associated with particle
stimulated mechanism (PSN) [29, 30], deformation or shear bands containing twins [16]
or retardation of dynamic recrystallization (DRX) [23]. However there is still a lack of
work regarding whether the RE-textures are mainly associated with changes in the
deformation texture or also with changes in the recrystallization texture. In particular,
only a little work has been done on the texture evolution and mechanisms of static
recrystallization (SRX) and optimal RE elements and compositions, second phase
formation, solute clustering, etc [14, 26, 28, 31].
Therefore the second goal is to investigate the texture weakening mechanisms related
to deformation and static recrystallization on annealing in Mg-Zn-Ce alloys.
Chapter 1. Introduction
3
As mentioned above, rare earths additions appear to be beneficial in terms of
weakening the texture of as-rolled sheet, and it is of interest to observe the effect of high
speed rolling on these alloys. It is also expected that the response of these new alloys to
high speed rolling will help identify the deformation mechanisms occurring during high
speed rolling. Therefore, the third goal of this study is to investigate the effect of HSR on
the formability, microstructure and texture of the Mg-Zn-Ce alloys and compare results
with conventional AZ31 alloy.
This thesis comprises six chapters. In Chapter 2, a literature review concerning
deformation and recrystallization mechanisms, texture evolution in Mg alloys during
deformation and subsequent annealing are presented. The first goal is addressed in
chapters 3 and 4. In chapter 3, to study the effect of strain rate on the evolution of
microstructure and texture, uniaxial hot compression of AZ31 over a wide range of strain
rate is presented. Detailed microstructure and texture examination by EBSD was carried
out in selected samples in order to clarify the predominant deformation and
recrystallization mechanisms at different strain rates. In Chapter 4, using the results of
uniaxial compression testing, the microstructure and texture evolution during high speed
rolling (HSR) of as-cast AZ31B alloy are analyzed. In the first part of this Chapter,
strains of about 1000 s-1, are used to determine the influence of this much higher strain
rate on the basic metrics and mechanisms of microstructure and texture evolution. In
order to apply this very high strain rate, a split Hopkinson pressure bar (SHPB) equipped
with induction radiation furnace was used. In the second part, high-speed rolling of 1000
m/min was employed to roll AZ31 alloy in one pass with 65% reduction in thickness and
the rollability, texture and microstructure were compared with low-speed rolling
(15m/min). The basic mechanisms elucidated from the compression tests were used to
understand the rolling results.
The second goal is the subject of Chapter 5, in which the texture weakening
mechanisms of adding RE elements is investigated with four alloys of the Mg-Zn-Ce
system. The effect of precipitates and solutes on the evolution of microstructure and
texture during and after rolling were studied and compared to that of AZ31. The third
Chapter 1. Introduction
4
goal is achieved in Chapter 6, where the response of these new alloys to high speed
rolling is investigated and the mechanisms during high speed rolling are studied.
References
[1] H.B. M. Avedesian, ASM specialty handbook. Magnesium and magnesium alloys. , ASM International,Materials Park, Ohio, 2000.[2] K.U. Kainer, F. Kaiser, Magnesium alloys and technology, Wiley Online Library, 2003.[3] C. Blawert, N. Hort, K. Kainer, Trans. Indian Inst. Met, 57 (2004) 397-408.[4] M.M. Avedesian, H. Baker, ASM international, 274 (1999).[5] I. Polmear, Materials Science and Technology, 10 (1994) 1-16.[6] S.R. Agnew, M.H. Yoo, C.N. Tomé, Acta Materialia, 49 (2001) 4277-4289.[7] M.R. Barnett, Metallurgical and Materials Transactions A: Physical Metallurgy and Materials Science,34 A (2003) 1799-1806.[8] M.R. Barnett, M.D. Nave, C.J. Bettles, Materials Science and Engineering A, 386 (2004) 205-211.[9] A. Styczynski, C. Hartig, J. Bohlen, D. Letzig, Scripta Materialia, 50 (2004) 943-947.[10] L.W.F. Mackenzie, M. Pekguleryuz, Materials Science and Engineering: A, 480 (2008) 189-197.[11] E. Doege, K. Dröder, Journal of Materials Processing Technology, 115 (2001) 14-19.[12] Y. Nakaura, A. Watanabe, K. Ohori, Materials Transactions, 47 (2006) 1031-1039.[13] A. Jäger, P. Lukáč, V. Gärtnerová, J. Haloda, M. Dopita, Materials Science and Engineering: A, 432(2006) 20-25.[14] T. Al-Samman, X. Li, Materials Science and Engineering A, 528 (2011) 3809-3822.[15] A.G. Beer, M.R. Barnett, Metallurgical and Materials Transactions A: Physical Metallurgy andMaterials Science, 38 (2007) 1856-1867.[16] J. Bohlen, M.R. Nürnberg, J.W. Senn, D. Letzig, S.R. Agnew, Acta Materialia, 55 (2007) 2101-2112.[17] X. Gong, S.B. Kang, S. Li, J.H. Cho, Materials & Design, 30 (2009) 3345-3350.[18] J.P. Hadorn, K. Hantzsche, S. Yi, J. Bohlen, D. Letzig, S.R. Agnew, Metallurgical and MaterialsTransactions A: Physical Metallurgy and Materials Science, 43 (2012) 1363-1375.[19] T. Hasegawa, Y. Sakurai, K. Okazaki, Materials Science and Engineering A, 346 (2003) 34-41.[20] S. Vaynman, M.E. Fine, S. Lee, H.D. Espinosa, Scripta Materialia, 55 (2006) 351-354.[21] S. Winkler, A. Thompson, C. Salisbury, M. Worswick, I. Riemsdijk, R. Mayer, Metallurgical andMaterials Transactions A: Physical Metallurgy and Materials Science, 39 A (2008) 1350-1358.[22] B. Wietbrock, W. Xiong, M. Bambach, G. Hirt, Steel Research International, 82 (2011) 63-69.[23] N. Stanford, M.R. Barnett, Materials Science and Engineering: A, 496 (2008) 399-408.[24] S.R. Agnew, O. Duygulu, International Journal of Plasticity, 21 (2005) 1161-1193.[25] S. Yi, J. Bohlen, F. Heinemann, D. Letzig, Acta Materialia, 58 (2010) 592-605.[26] K. Hantzsche, J. Bohlen, J. Wendt, K.U. Kainer, S.B. Yi, D. Letzig, Scripta Materialia, 63 (2010) 725-730.[27] J. Hadorn, K. Hantzsche, S. Yi, J. Bohlen, D. Letzig, J. Wollmershauser, S. Agnew, Metallurgical andMaterials Transactions A, 43 (2012) 1347-1362.[28] Y.B. Chun, J. Geng, N. Stanford, C.H.J. Davies, J.F. Nie, M.R. Barnett, Materials Science andEngineering: A, 528 (2011) 3653-3658.[29] E.A. Ball, P.B. Prangnell, Scripta Metallurgica et Materiala, 31 (1994) 111-116.[30] L.W.F. Mackenzie, G.W. Lorimer, F.J. Humphreys, T. Wilks, 2004, pp. 477-482.[31] N. Stanford, Materials Science and Engineering: A, 527 (2010) 2669-2677.
Chapter 2. Literature review
5
Chapter 2
Literature review
Magnesium alloys attract attention because of their high stiffness-to-weight ratio,
high thermal conductivity, good electromagnetic shielding characteristics, and ability to
re-cycle [1-3]. Therefore, these properties make them attractive for automotive
application [4, 5]. However, the formability of magnesium alloys is restricted by their
limited active slip systems, which is due to their hexagonal close-packed (HCP) crystal
structure [6, 7].
2.1 Deformation mechanisms in magnesium
Two types of deformation modes including twinning and slip play important roles in
Mg during deformation. With regard to slip, the slip systems with the lowest critical
resolved shear stress (CRSS) are those associated with {0001} basal planes [8]. The
systems with the next level of (CRSS) are, in order, the {0110} prismatic system, the{1011} pyramidal system, and the {1212} second-order pyramidal system [9]. Because
these CRSSs are much higher than for the basal plane, slip is much more difficult,
although these planes may play a limited role in plastic deformation. Since slip is then
largely due to one slip system, there is a high degree of plastic anisotropy, which is
increasingly pronounced at low temperatures [5], at which point twinning becomes
necessary to aid plastic deformation.
2.1.1 Slip
Slip is the glide of dislocations along definite crystallographic (slip) planes in
specific crystallographic (slip) directions, resulting in atomic displacement. The
combined glide of dislocations on different slip systems (i.e., slip plane and direction)
accommodates the imposed strains, resulting in a permanent shape change [10]. As

Chapter 2. Literature review
6
Taylor noted, in a randomly oriented polycrystalline metal, more than five independent
slip systems are needed to achieve uniform deformation [11]. When a dislocation reaches
a grain boundary, it cannot glide from one grain to another because of the change in
orientation of the slip system from one crystal to another. Therefore, to prevent failure in
the material, slip systems must be present to continue slip activity [11, 12]. In contrast to
body centered cubic (BCC) and face centred cubic (FCC) crystal structures, HCP crystals
cannot provide enough independent slip systems to fulfill the Taylor criterion [6, 12] due
to very different CRSS values of the slip systems [6]. Figure 2.1 schematically illustrates
the important slip systems in magnesium with their planes and directions. Among the
four dominant slip systems, three of them (basal, prismatic, and first-order pyramidal)
share a common close-packed slip direction of < 1120 > (or <a>) [2, 6]. The three main
sets of planes that contain the above slip directions are (i) {0001} or basal, (ii) three{1010} or prismatic, and (iii) six {1011} or pyramidal [13, 14]. The activation of these
slips systems can only provide four independent slip systems; which is still short of the
five required for accommodating any arbitrary strain path [15]. In particular, these slip
systems cannot generate a strain component along the c-axis direction. The strain along
this c-axis may be accommodated by second-order pyramidal slip or twinning. However,
because of limited active slip systems as a result of high CRSSs at room temperature, Mg
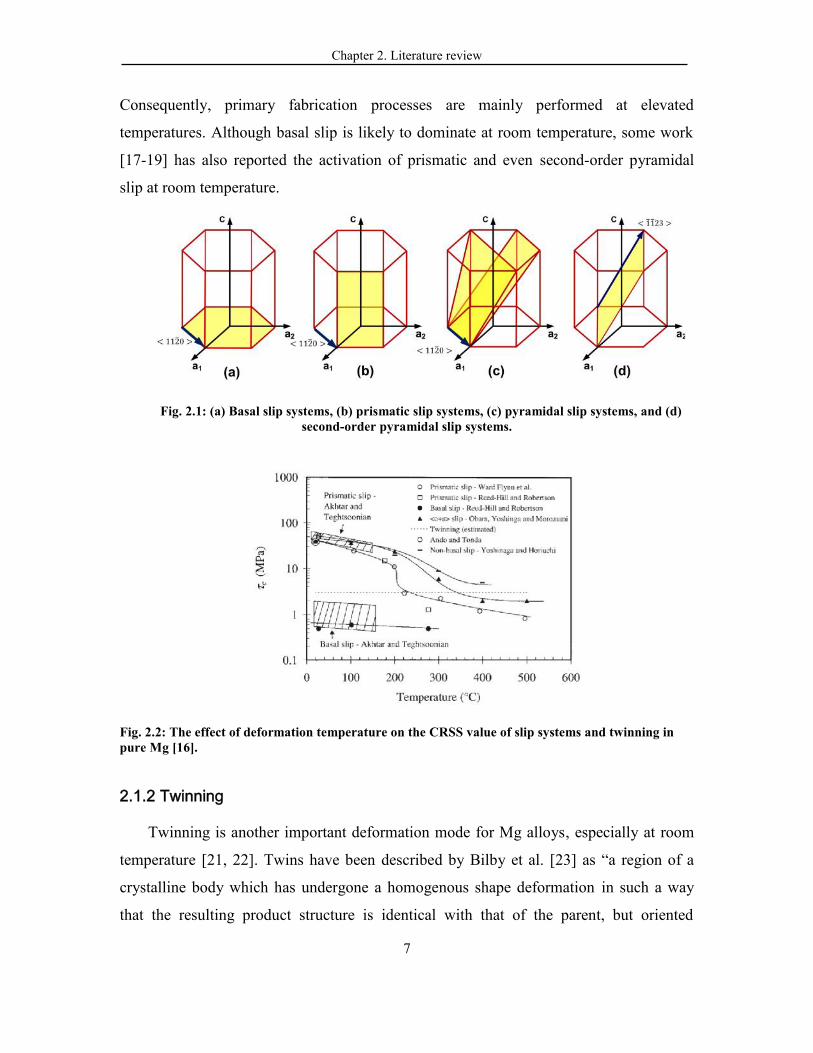
alloys have very poor formability at room temperature [3, 5]. The dependency of CRSSs
of various slip and twinning systems to temperatures are reported by Barnett [16] and
illustrated in figure 2.2. As can be seen from this figure, at room temperature, slip on
basal plane is predominant due to its low CRSS. The CRSS for the non-basal slip system
strongly depends on the temperature, the differences between basal slip and the non-basal
systems are much lower at higher temperatures (above 280°C) in comparison with
lower temperatures. On the other hand, the CRSSs for basal slip and twinning are
comparatively insensitive to temperature [16]. It was reported that, by activation of
additional systems, cross-slip from basal planes to non-basal planes is possible and,
therefore, the barriers to dislocation motion can be passed by this mechanism [17-19].
Therefore, increasing the deformation temperature can increase the activation of non-
basal plane systems, making plastic deformation more homogeneous [13, 16, 20].
Chapter 2. Literature review
7
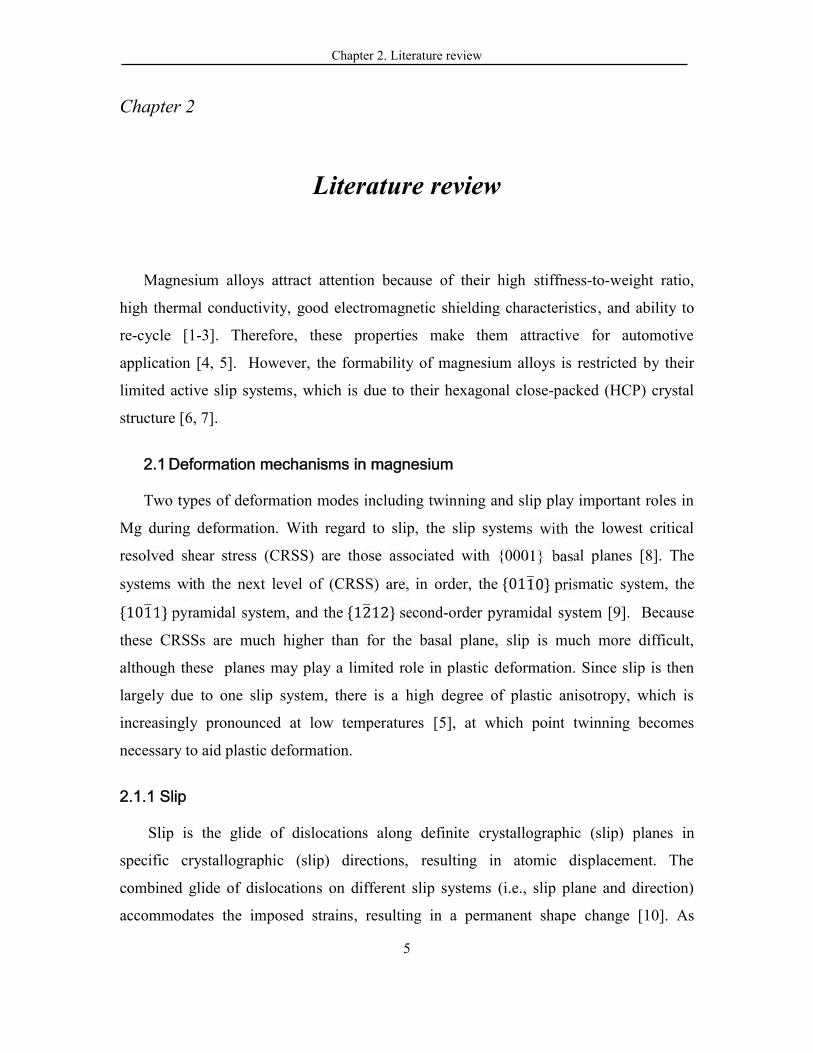
Consequently, primary fabrication processes are mainly performed at elevated
temperatures. Although basal slip is likely to dominate at room temperature, some work
[17-19] has also reported the activation of prismatic and even second-order pyramidal
slip at room temperature.
Fig. 2.1: (a) Basal slip systems, (b) prismatic slip systems, (c) pyramidal slip systems, and (d)second-order pyramidal slip systems.
Fig. 2.2: The effect of deformation temperature on the CRSS value of slip systems and twinning inpure Mg [16].
2.1.2 Twinning
Twinning is another important deformation mode for Mg alloys, especially at room
temperature [21, 22]. Twins have been described by Bilby et al. [23] as “a region of a
crystalline body which has undergone a homogenous shape deformation in such a way
that the resulting product structure is identical with that of the parent, but oriented
Chapter 2. Literature review
8
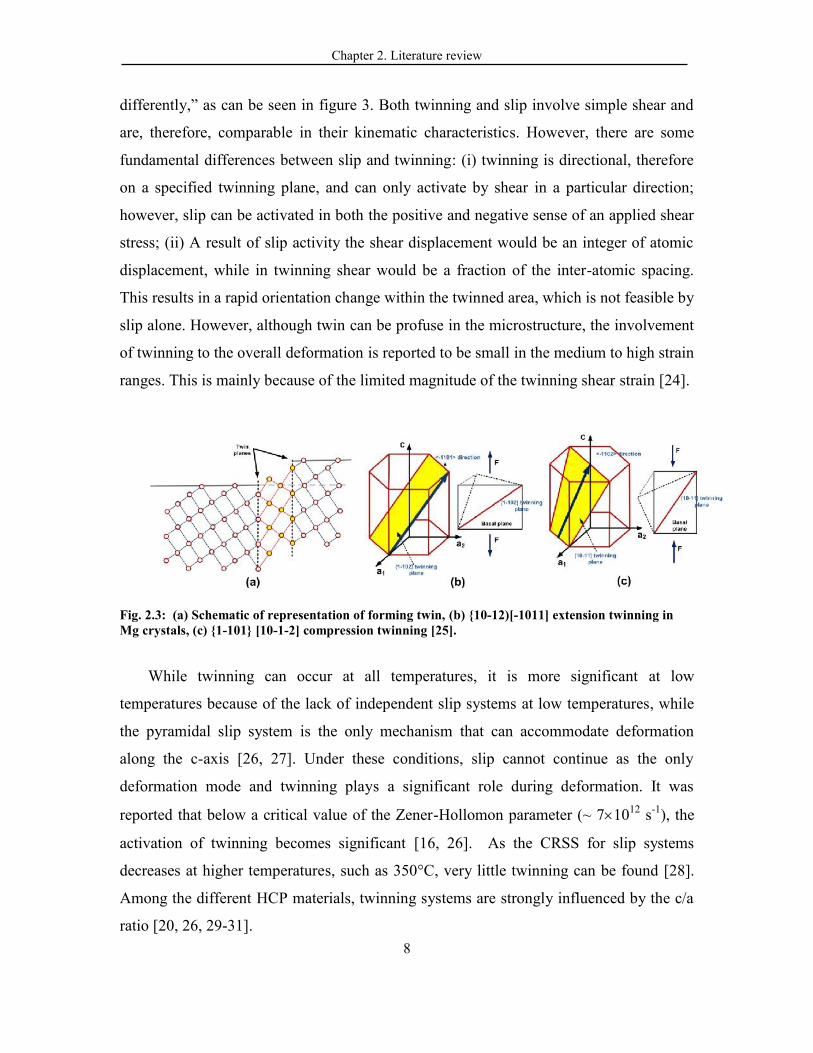
differently,” as can be seen in figure 3. Both twinning and slip involve simple shear and
are, therefore, comparable in their kinematic characteristics. However, there are some
fundamental differences between slip and twinning: (i) twinning is directional, therefore
on a specified twinning plane, and can only activate by shear in a particular direction;
however, slip can be activated in both the positive and negative sense of an applied shear
stress; (ii) A result of slip activity the shear displacement would be an integer of atomic
displacement, while in twinning shear would be a fraction of the inter-atomic spacing.
This results in a rapid orientation change within the twinned area, which is not feasible by
slip alone. However, although twin can be profuse in the microstructure, the involvement
of twinning to the overall deformation is reported to be small in the medium to high strain
ranges. This is mainly because of the limited magnitude of the twinning shear strain [24].
Fig. 2.3: (a) Schematic of representation of forming twin, (b) {10-12)[-1011] extension twinning inMg crystals, (c) {1-101} [10-1-2] compression twinning [25].
While twinning can occur at all temperatures, it is more significant at low
temperatures because of the lack of independent slip systems at low temperatures, while
the pyramidal slip system is the only mechanism that can accommodate deformation
along the c-axis [26, 27]. Under these conditions, slip cannot continue as the only
deformation mode and twinning plays a significant role during deformation. It was
reported that below a critical value of the Zener-Hollomon parameter (~ 71012 s-1), the
activation of twinning becomes significant [16, 26]. As the CRSS for slip systems
decreases at higher temperatures, such as 350°C, very little twinning can be found [28].
Among the different HCP materials, twinning systems are strongly influenced by the c/a
ratio [20, 26, 29-31].
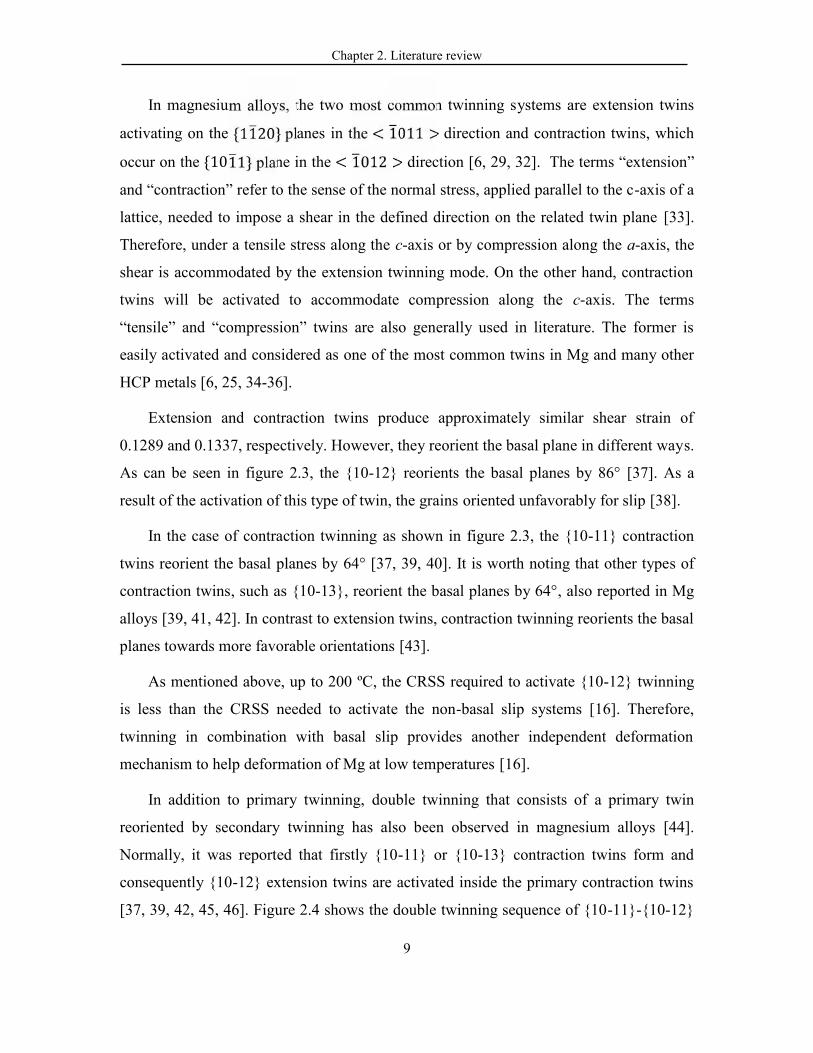
Chapter 2. Literature review
9
In magnesium alloys, the two most common twinning systems are extension twins
activating on the {1120} planes in the < 1011 > direction and contraction twins, which
occur on the {1011} plane in the < 1012 > direction [6, 29, 32]. The terms “extension”
and “contraction” refer to the sense of the normal stress, applied parallel to the c-axis of a
lattice, needed to impose a shear in the defined direction on the related twin plane [33].
Therefore, under a tensile stress along the c-axis or by compression along the a-axis, the
shear is accommodated by the extension twinning mode. On the other hand, contraction
twins will be activated to accommodate compression along the c-axis. The terms
“tensile” and “compression” twins are also generally used in literature. The former is
easily activated and considered as one of the most common twins in Mg and many other
HCP metals [6, 25, 34-36].
Extension and contraction twins produce approximately similar shear strain of
0.1289 and 0.1337, respectively. However, they reorient the basal plane in different ways.
As can be seen in figure 2.3, the {10-12} reorients the basal planes by 86° [37]. As a
result of the activation of this type of twin, the grains oriented unfavorably for slip [38].
In the case of contraction twinning as shown in figure 2.3, the {10-11} contraction
twins reorient the basal planes by 64° [37, 39, 40]. It is worth noting that other types of
contraction twins, such as {10-13}, reorient the basal planes by 64°, also reported in Mg
alloys [39, 41, 42]. In contrast to extension twins, contraction twinning reorients the basal
planes towards more favorable orientations [43].
As mentioned above, up to 200 ºC, the CRSS required to activate {10-12} twinning
is less than the CRSS needed to activate the non-basal slip systems [16]. Therefore,
twinning in combination with basal slip provides another independent deformation
mechanism to help deformation of Mg at low temperatures [16].
In addition to primary twinning, double twinning that consists of a primary twin
reoriented by secondary twinning has also been observed in magnesium alloys [44].
Normally, it was reported that firstly {10-11} or {10-13} contraction twins form and
consequently {10-12} extension twins are activated inside the primary contraction twins
[37, 39, 42, 45, 46]. Figure 2.4 shows the double twinning sequence of {10-11}-{10-12}
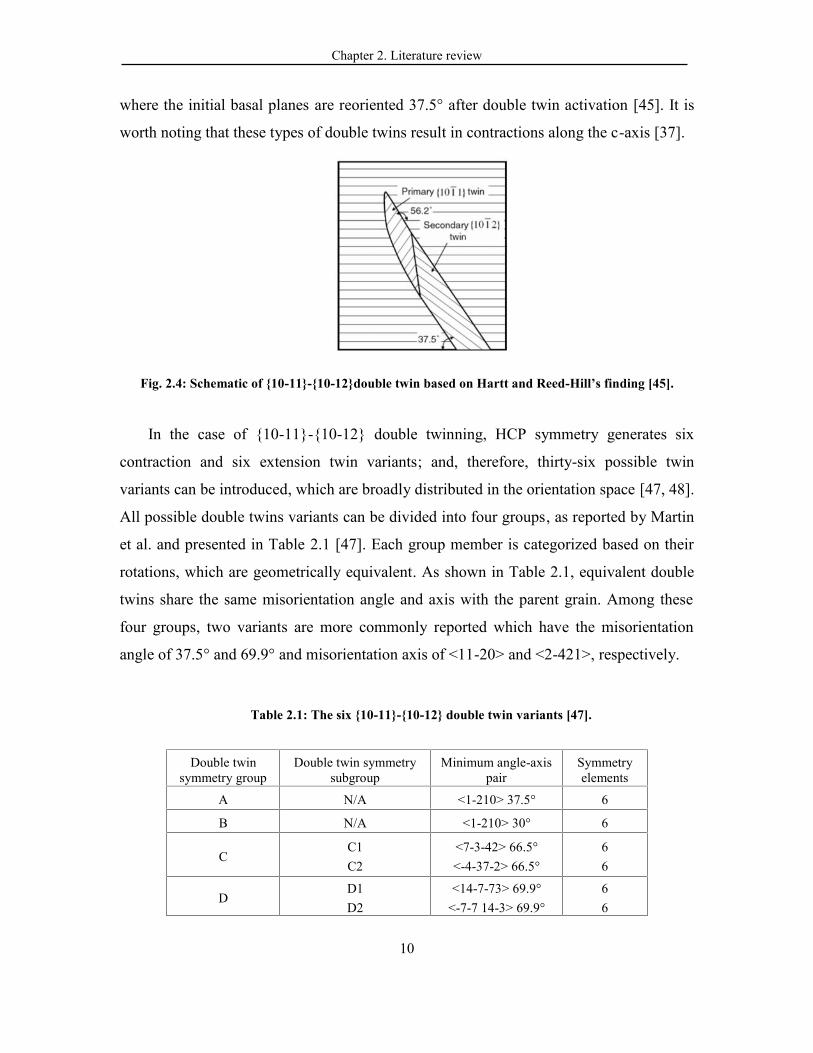
Chapter 2. Literature review
10
where the initial basal planes are reoriented 37.5° after double twin activation [45]. It is
worth noting that these types of double twins result in contractions along the c-axis [37].
Fig. 2.4: Schematic of {10-11}-{10-12}double twin based on Hartt and Reed-Hill’s finding [45].
In the case of {10-11}-{10-12} double twinning, HCP symmetry generates six
contraction and six extension twin variants; and, therefore, thirty-six possible twin
variants can be introduced, which are broadly distributed in the orientation space [47, 48].
All possible double twins variants can be divided into four groups, as reported by Martin
et al. and presented in Table 2.1 [47]. Each group member is categorized based on their
rotations, which are geometrically equivalent. As shown in Table 2.1, equivalent double
twins share the same misorientation angle and axis with the parent grain. Among these
four groups, two variants are more commonly reported which have the misorientation
angle of 37.5° and 69.9° and misorientation axis of <11-20> and <2-421>, respectively.
Table 2.1: The six {10-11}-{10-12} double twin variants [47].
Double twinsymmetry group
Double twin symmetrysubgroup
Minimum angle-axispair
Symmetryelements
A N/A <1-210> 37.5° 6
B N/A <1-210> 30° 6
CC1C2
<7-3-42> 66.5°<-4-37-2> 66.5°
66
DD1D2
<14-7-73> 69.9°<-7-7 14-3> 69.9°
66
Chapter 2. Literature review
11
2.1.3 Twin formation and growth
Although the mechanisms of the nucleation and growth of twins in HCP materials
are still not clear [6, 25, 29, 36, 49], there are some concepts that are generally accepted.
First of all, twin nucleation is an inhomogeneous process and some microscopic slip is
needed [50]. Secondly, as is the case for slip, twinning is activated on the most highly
stressed system and shear stress should reach to a critical value [25]. It is also reported
that the stress needed to nucleate a twin is usually higher than the growth stress [6, 49].
In the early stage of deformation, {10-12} extension twinning is reported to be
favored due to its lower CRSS value and also the more simple shuffle involved in this
type of twin [6]. When a extension twin forms, their boundaries are very mobile and the
twins readily thicken rather than producing further strain localizations [33]. On the other
hand, contraction twins do not thicken significantly in Mg [21, 43, 51]. This is may be
due to the fact that the amount of shear per unit volume produced by extension twins is
much smaller than contraction twins. Consequently, for the same amount of shear, a
larger volume fraction of extension twins is needed in comparison to contraction twins
[35].
The parameters that influence twin activation include grain size, temperature, strain
rate, stacking fault energy, and texture [26, 50]. In polycrystals, fine grain sizes resulted
in smaller twins and, due to increases in the ratio of twin surface area to volume, the
energy state of the material increases in the same volume fraction of twins. For this
reason, more energy is required to produce similar volume fraction of twins in finer grain
size microstructures [25]. Due to high twin interface energy, especially in Mg, [52],
forming twins is more difficult in fine grain [53].
Deformation condition also has significant influence on twin activity [16, 54-56]. By
decreasing the temperature and increasing the strain rate, the rate of increasing the stress
required for slip is more than the rate for twinning [16, 57]. Therefore, twin activation is
generally more significant at low temperatures and high strain rates [25, 35]. By
increasing the temperature, due to decreasing the CRSS, more non-basal slip is activated
Chapter 2. Literature review
12
and their activation provides the remaining independent slip systems required for
homogeneous deformation up to a temperature where no further twinning occurs [58-61].
2.1.4 Other deformation mechanisms
Other deformation mechanisms that occur in Mg alloys are kink bands, deformation
bands, transition band, and shear bands [62]. Shear bands are related to microscopic
inhomogenities and are usually observed at high strain levels [12]. They have a
morphology clearly associated with the deformation geometry [63]. These bands are
independent from the grain structure. For example, in rolling, shear bands occur at ~35
to the rolling plane and parallel to the transverse direction [64]. The amount of shear
banding increases in material with large grain sizes and decreases with deformation
temperature [24]. In this situation, the high amount of shear band has an important effect
on resulted texture [61]. Shear bands can also be preferred sites for the nucleation of
recrystallized grains [24].
2.2 Restoration mechanisms
As mentioned above, temperature has a large influence on the deformation of Mg
alloys because of the limited number of slip systems at room temperature. Above 225C,
more slip systems become thermally activated and magnesium alloys become more
deformable [1, 54]. Therefore, most forming of Mg alloys is performed at temperatures
higher than 225C [65]. During hot deformation, the dislocation density increases inside
the grains, which lead to work hardening of the materials [24, 66]. If there is no way to
reduce the stress concentration, this may cause fractures in the material. Most hot
deformation processes, such as rolling, are performed in several steps; therefore,
restoration processes can be categorized as either dynamic (during hot deformation) or
static (after hot deformation) [66]. Two main processes that can occur for both static and
dynamic conditions are recovery and recrystallization [24, 67].
Recovery is a structural transformation resulting from the rearrangement of
dislocation into a new arrangement and the annihilation of dislocation to lower the energy
Chapter 2. Literature review
13
level of deformed structures [68]. Doherty et al. [69] defined recrystallization as “the
formation of a new grain structure in a deformed material by the formation and migration
of high angle grain boundaries driven by the stored energy of deformation.”
The conditions needed for the above processes to happen depend on materials
properties and forming parameters, such as strain, strain rate, and temperature. Stacking
Fault Energy (SFE) is also one of the most important material properties determining
whether recovery or recrystallization will occur in the materials [24, 70]. In a material
with high SFE, only dynamic recovery (DRV) takes place. However, in materials with
low or medium SFE, dynamic recrystallization (DRX) can occur when strain in material
reaches a critical point [24]. Although, the reasonably high SFE of Mg alloys makes the
occurrences of DRX theoretically difficult, DRX in Mg alloys does take place and is
generally related to the lack of easily activated slip systems as well as the high mobility
of the grain boundary [71, 72].
Due to a more anisotropic plastic response of HCP metals compared to cubic metals,
the dislocation structures may not show the same starting configuration or develop in the
same way as cubic materials [24, 44, 73]. In cubic metals, enough slip systems can easily
be activated while there is some preferred slip system exists in HCP metals. Therefore,
the orientation and strain path can play a very important role in changing the deformed
and recovered substructure of HCP metals [12, 24, 74].
Recrystallization can be classified as continuous or discontinuous. In continuous
recrystallization, the migration of a high angle boundary is involved and a deformed
microstructure is abruptly transformed grains a free of deformation through the process of
grain nucleation and growth [75-77]. In discontinuous recrystallization, subgrain
coalescence is involved; the deformed microstructure is transformed by means of
dislocations rearrangement; and misorientation takes place, leading to the gradual
appearance of high angle boundaries and a recrystallized microstructure [72, 78, 79].
2.2.1 Dynamic restoration mechanism
Depending on the deformation condition, different recrystallization mechanism can
be activated in Mg alloys [78, 80]. For example, Kaibyshev et al. [78] studied the DRX of
Chapter 2. Literature review
14
Mg alloys at various strains and temperatures, as can be seen in figure 2.5. Based on
these references and some research [72, 81-83], the main suggested mechanisms are
explained as follows:
(i) Bulging or strain-induced boundary migration (SIBM) are reported to occur at
high temperatures. The driving force in this mechanism is the difference in dislocation
content on the two sides of the high angle grain boundary. This is because of different
dislocation storage rates as a result of different grain orientations or different storage
rates in the boundary regions [24, 68, 77]. It was reported that by increasing the
temperatures, the heterogeneity in the dislocation density leads to local migration or
bulging of high-angle boundaries in Mg alloys as a result of the easier activation of non-
basal slip. In this situation, the activation energy of the plastic flow is close to the
activation energy for volume self-diffusion and the controlling process reported to be
dislocation climb [74, 78, 80].
(ii) Subgrain DRX: This mechanism was reported by Ion et al. [72] for the
temperature range 425-699 K and can be summarized as follows: first, the grains oriented
with their basal plane parallel to the compression axis can be reoriented by twinning or
basal slip, as a result of which they become almost perpendicular to the compression axis.
In the next step local shearing near grain boundaries occurs because of the
inhomogeneous plasticity. It was reported that as a result of highly concentrated stresses
near the original grain boundaries, cross-slip of a dislocations on non-basal planes can
occur. The cross-slip of these a dislocations by the Friedel-Escaig mechanism resulted in
a transition from primary screw orientations to edge orientations [61, 73, 74]. These edge
dislocations are located on non-basal planes and reported to have high values of stacking
fault energy (SFE) [75, 76]. Consequently, such dislocations can easily climb and
rearrange to generate a low-angle boundary network near the original grain boundary.
(iii) Twinning Induced DRX: Twinning can potentially be nucleation sites for DRX
grains. Twinning increases with increasing grain size microstructure and strain rate, and
decreasing temperature [84]. Grosenor et al. [85] observed twinning induced DRX in an
AZ31 casting alloy. The occurrence of DRX nucleation depends on the strain rate and
temperature. In AZ31 at 250C and a low strain rate, twinning induced DRX has not been
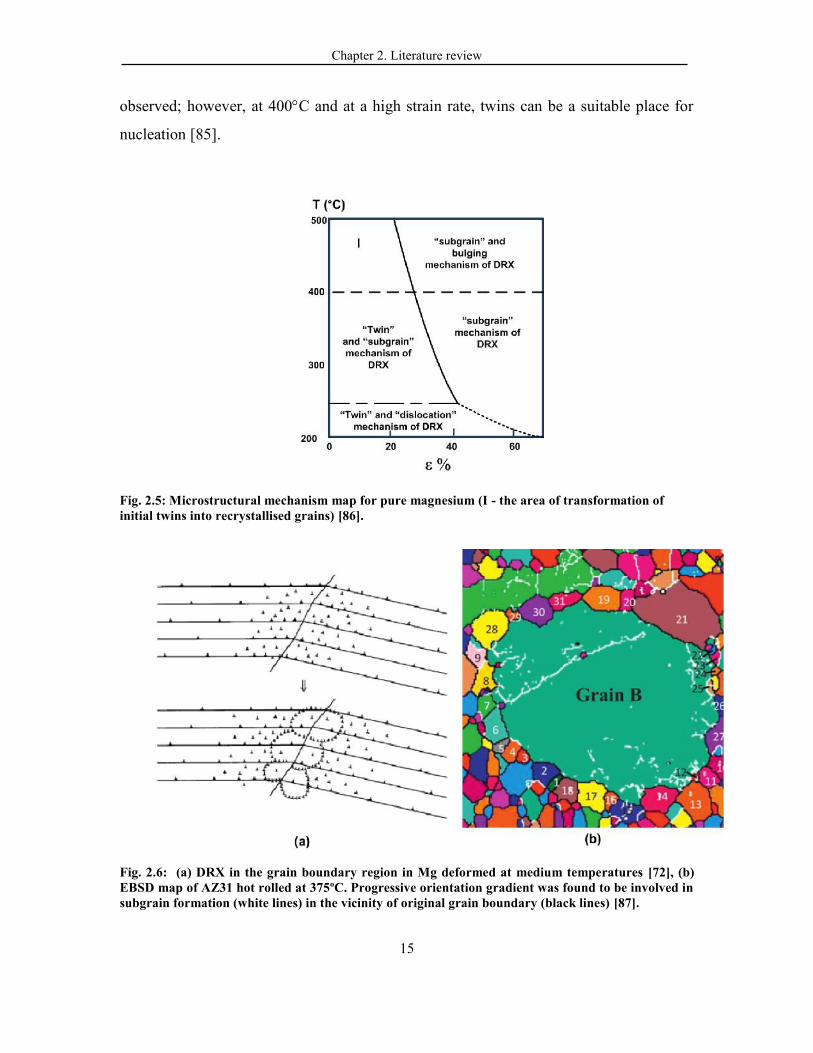
Chapter 2. Literature review
15
observed; however, at 400C and at a high strain rate, twins can be a suitable place for
nucleation [85].
Fig. 2.5: Microstructural mechanism map for pure magnesium (I - the area of transformation ofinitial twins into recrystallised grains) [86].
Fig. 2.6: (a) DRX in the grain boundary region in Mg deformed at medium temperatures [72], (b)EBSD map of AZ31 hot rolled at 375ºC. Progressive orientation gradient was found to be involved insubgrain formation (white lines) in the vicinity of original grain boundary (black lines) [87].
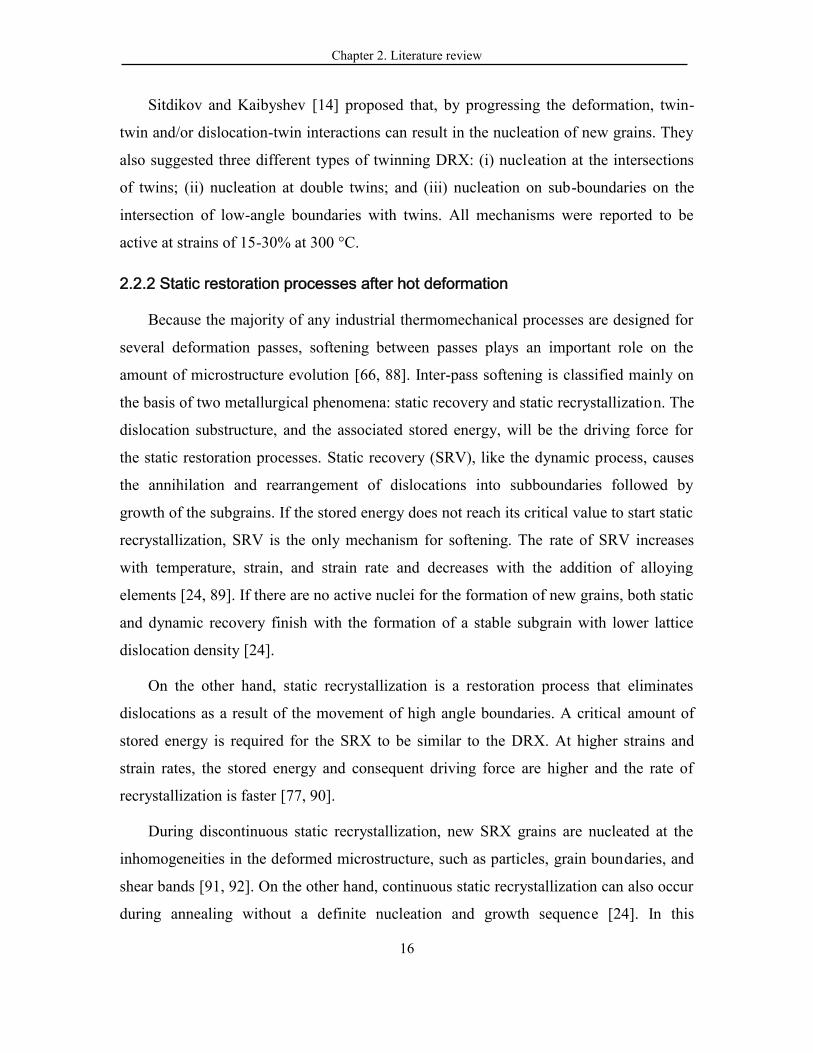
Chapter 2. Literature review
16
Sitdikov and Kaibyshev [14] proposed that, by progressing the deformation, twin-
twin and/or dislocation-twin interactions can result in the nucleation of new grains. They
also suggested three different types of twinning DRX: (i) nucleation at the intersections
of twins; (ii) nucleation at double twins; and (iii) nucleation on sub-boundaries on the
intersection of low-angle boundaries with twins. All mechanisms were reported to be
active at strains of 15-30% at 300 °C.
2.2.2 Static restoration processes after hot deformation
Because the majority of any industrial thermomechanical processes are designed for
several deformation passes, softening between passes plays an important role on the
amount of microstructure evolution [66, 88]. Inter-pass softening is classified mainly on
the basis of two metallurgical phenomena: static recovery and static recrystallization. The
dislocation substructure, and the associated stored energy, will be the driving force for
the static restoration processes. Static recovery (SRV), like the dynamic process, causes
the annihilation and rearrangement of dislocations into subboundaries followed by
growth of the subgrains. If the stored energy does not reach its critical value to start static
recrystallization, SRV is the only mechanism for softening. The rate of SRV increases
with temperature, strain, and strain rate and decreases with the addition of alloying
elements [24, 89]. If there are no active nuclei for the formation of new grains, both static
and dynamic recovery finish with the formation of a stable subgrain with lower lattice
dislocation density [24].
On the other hand, static recrystallization is a restoration process that eliminates
dislocations as a result of the movement of high angle boundaries. A critical amount of
stored energy is required for the SRX to be similar to the DRX. At higher strains and
strain rates, the stored energy and consequent driving force are higher and the rate of
recrystallization is faster [77, 90].
During discontinuous static recrystallization, new SRX grains are nucleated at the
inhomogeneities in the deformed microstructure, such as particles, grain boundaries, and
shear bands [91, 92]. On the other hand, continuous static recrystallization can also occur
during annealing without a definite nucleation and growth sequence [24]. In this
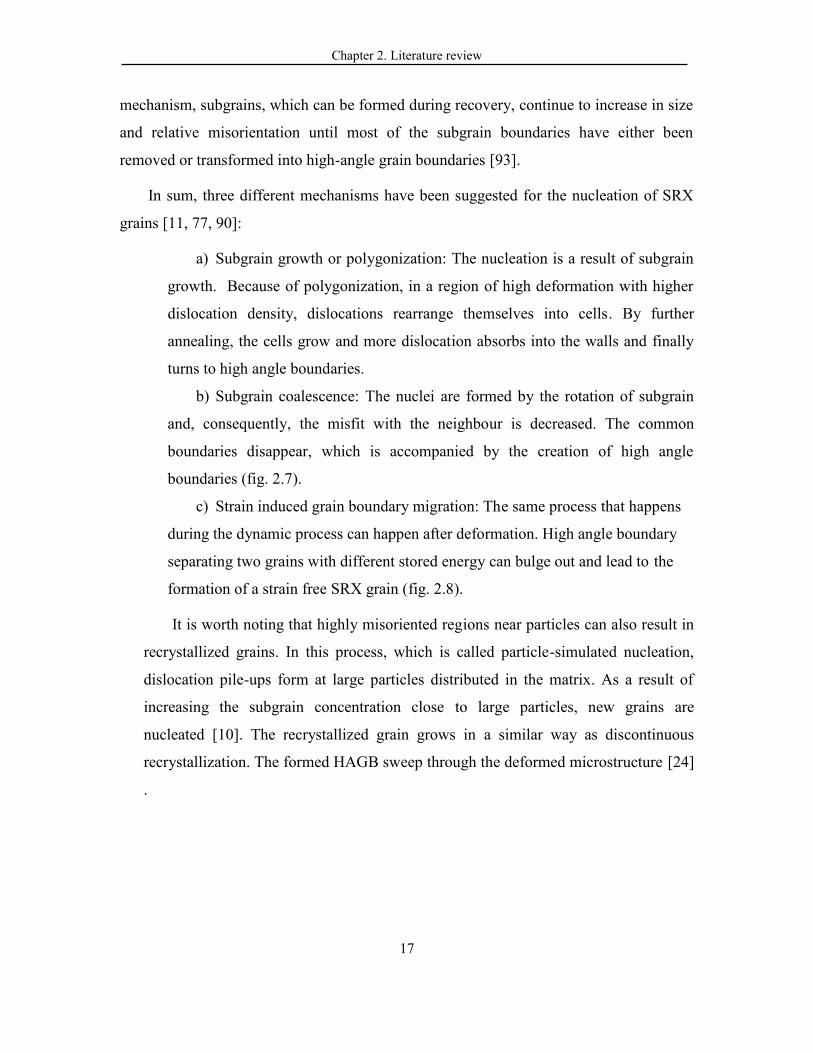
Chapter 2. Literature review
17
mechanism, subgrains, which can be formed during recovery, continue to increase in size
and relative misorientation until most of the subgrain boundaries have either been
removed or transformed into high-angle grain boundaries [93].
In sum, three different mechanisms have been suggested for the nucleation of SRX
grains [11, 77, 90]:
a) Subgrain growth or polygonization: The nucleation is a result of subgrain
growth. Because of polygonization, in a region of high deformation with higher
dislocation density, dislocations rearrange themselves into cells. By further
annealing, the cells grow and more dislocation absorbs into the walls and finally
turns to high angle boundaries.
b) Subgrain coalescence: The nuclei are formed by the rotation of subgrain
and, consequently, the misfit with the neighbour is decreased. The common
boundaries disappear, which is accompanied by the creation of high angle
boundaries (fig. 2.7).
c) Strain induced grain boundary migration: The same process that happens
during the dynamic process can happen after deformation. High angle boundary
separating two grains with different stored energy can bulge out and lead to the
formation of a strain free SRX grain (fig. 2.8).
It is worth noting that highly misoriented regions near particles can also result in
recrystallized grains. In this process, which is called particle-simulated nucleation,
dislocation pile-ups form at large particles distributed in the matrix. As a result of
increasing the subgrain concentration close to large particles, new grains are
nucleated [10]. The recrystallized grain grows in a similar way as discontinuous
recrystallization. The formed HAGB sweep through the deformed microstructure [24]
.
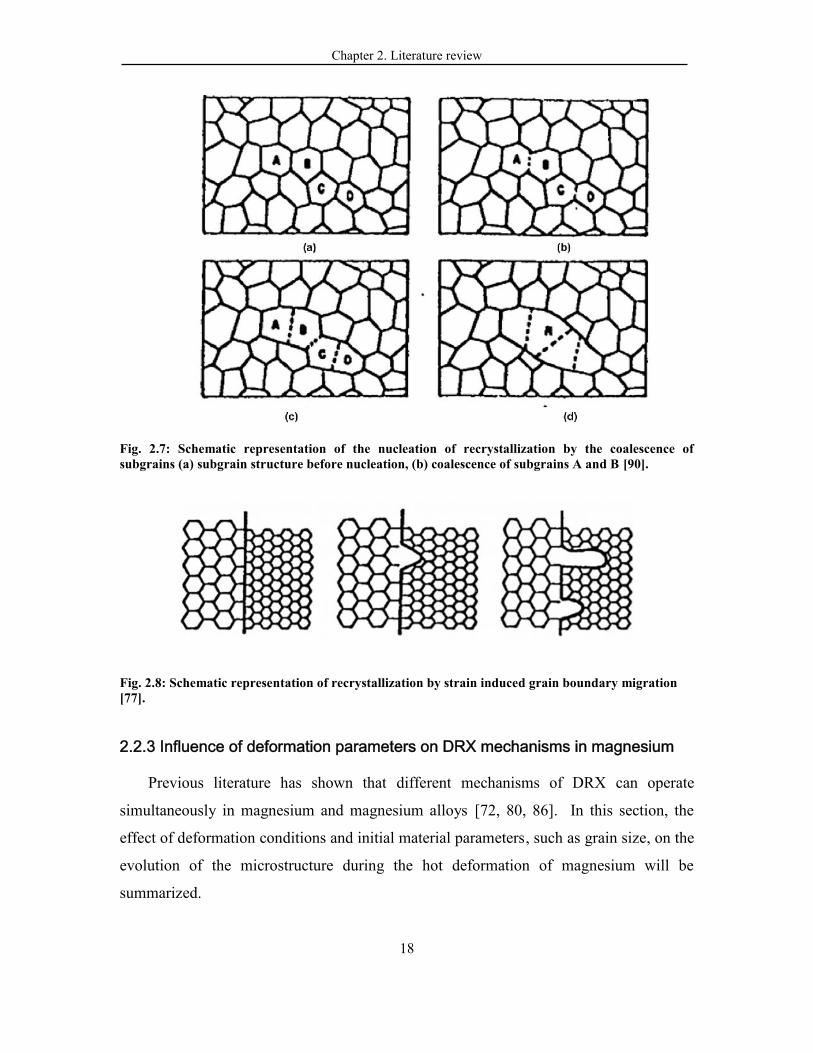
Chapter 2. Literature review
18
Fig. 2.7: Schematic representation of the nucleation of recrystallization by the coalescence ofsubgrains (a) subgrain structure before nucleation, (b) coalescence of subgrains A and B [90].
Fig. 2.8: Schematic representation of recrystallization by strain induced grain boundary migration[77].
2.2.3 Influence of deformation parameters on DRX mechanisms in magnesium
Previous literature has shown that different mechanisms of DRX can operate
simultaneously in magnesium and magnesium alloys [72, 80, 86]. In this section, the
effect of deformation conditions and initial material parameters, such as grain size, on the
evolution of the microstructure during the hot deformation of magnesium will be
summarized.
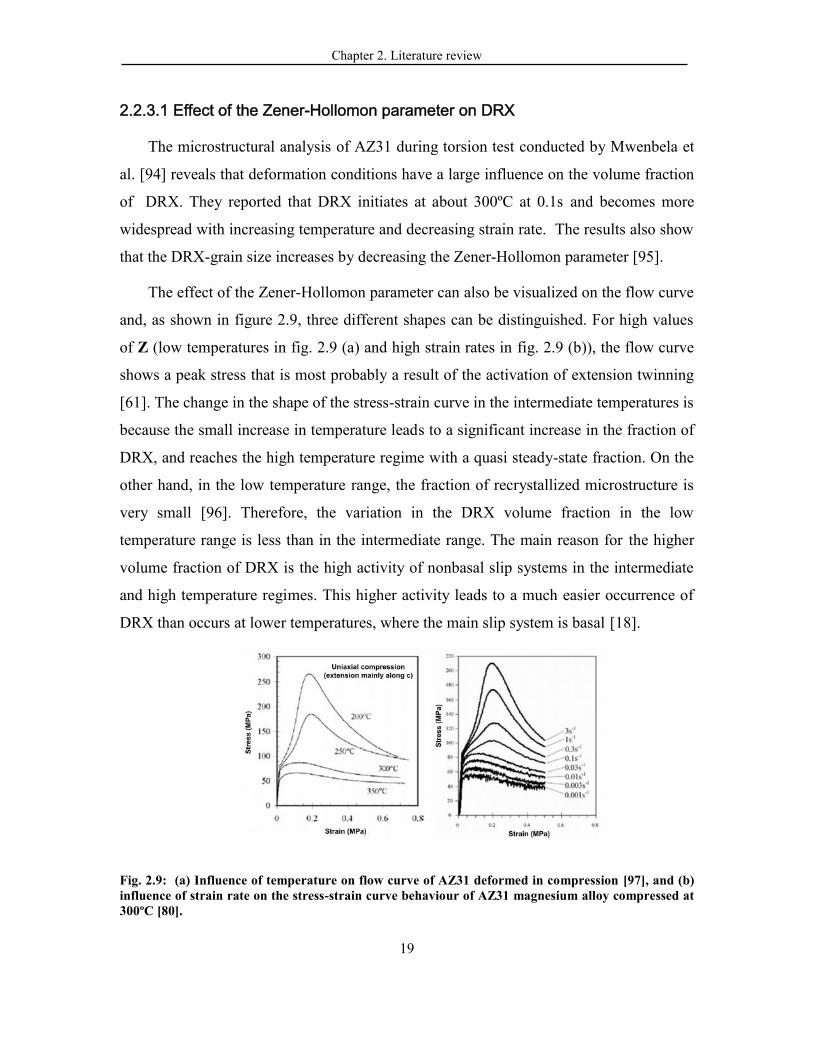
Chapter 2. Literature review
19
2.2.3.1 Effect of the Zener-Hollomon parameter on DRX
The microstructural analysis of AZ31 during torsion test conducted by Mwenbela et
al. [94] reveals that deformation conditions have a large influence on the volume fraction
of DRX. They reported that DRX initiates at about 300ºC at 0.1s and becomes more
widespread with increasing temperature and decreasing strain rate. The results also show
that the DRX-grain size increases by decreasing the Zener-Hollomon parameter [95].
The effect of the Zener-Hollomon parameter can also be visualized on the flow curve
and, as shown in figure 2.9, three different shapes can be distinguished. For high values
of Z (low temperatures in fig. 2.9 (a) and high strain rates in fig. 2.9 (b)), the flow curve
shows a peak stress that is most probably a result of the activation of extension twinning
[61]. The change in the shape of the stress-strain curve in the intermediate temperatures is
because the small increase in temperature leads to a significant increase in the fraction of
DRX, and reaches the high temperature regime with a quasi steady-state fraction. On the
other hand, in the low temperature range, the fraction of recrystallized microstructure is
very small [96]. Therefore, the variation in the DRX volume fraction in the low
temperature range is less than in the intermediate range. The main reason for the higher
volume fraction of DRX is the high activity of nonbasal slip systems in the intermediate
and high temperature regimes. This higher activity leads to a much easier occurrence of
DRX than occurs at lower temperatures, where the main slip system is basal [18].
Fig. 2.9: (a) Influence of temperature on flow curve of AZ31 deformed in compression [97], and (b)influence of strain rate on the stress-strain curve behaviour of AZ31 magnesium alloy compressed at300ºC [80].
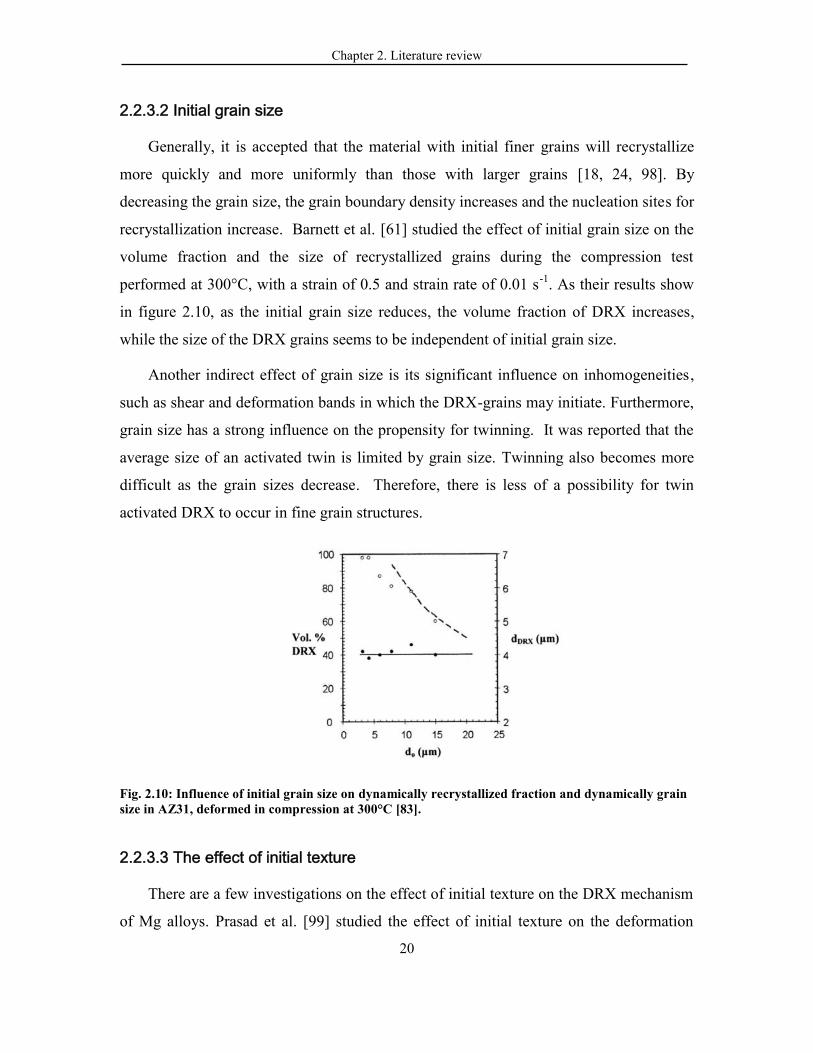
Chapter 2. Literature review
20
2.2.3.2 Initial grain size
Generally, it is accepted that the material with initial finer grains will recrystallize
more quickly and more uniformly than those with larger grains [18, 24, 98]. By
decreasing the grain size, the grain boundary density increases and the nucleation sites for
recrystallization increase. Barnett et al. [61] studied the effect of initial grain size on the
volume fraction and the size of recrystallized grains during the compression test
performed at 300°C, with a strain of 0.5 and strain rate of 0.01 s-1. As their results show
in figure 2.10, as the initial grain size reduces, the volume fraction of DRX increases,
while the size of the DRX grains seems to be independent of initial grain size.
Another indirect effect of grain size is its significant influence on inhomogeneities,
such as shear and deformation bands in which the DRX-grains may initiate. Furthermore,
grain size has a strong influence on the propensity for twinning. It was reported that the
average size of an activated twin is limited by grain size. Twinning also becomes more
difficult as the grain sizes decrease. Therefore, there is less of a possibility for twin
activated DRX to occur in fine grain structures.
Fig. 2.10: Influence of initial grain size on dynamically recrystallized fraction and dynamically grainsize in AZ31, deformed in compression at 300°C [83].
2.2.3.3 The effect of initial texture
There are a few investigations on the effect of initial texture on the DRX mechanism
of Mg alloys. Prasad et al. [99] studied the effect of initial texture on the deformation
Chapter 2. Literature review
21
behaviour of AZ31 using compression testing. The compression sample axis was
prepared in three directions: parallel to the ND, RD, and TD of the rolling direction.
Their study showed that the slip systems for the RD, TD, and ND samples are first- and
second-order pyramidal slip, first-order pyramidal slip and second-order pyramidal slip,
respectively. Kaibyshev et al. [100] reported that more DRX occurs in the samples
compressed along the 0° and 90° to the basal planes rather than the samples orientated
45° to the basal planes.
However, Barnett [18] reported that the progress of DRX is less sensitive to the
starting texture, and it is more dependent on the deformation conditions and initial grain
size. Huang et al. [101] reported that the initial texture strongly influences the
recrystallization behaviour and leads to changing the inclination angle of spilt basal
poles, ranging from ±15° to ±40°. In the samples with rolling direction perpendicular to
the initial extrusion direction, the sheet exhibits a moderate inclination angle of ±25°.
Li et al. [102] investigated the effect of initial texture on the deformation behaviour
of AZ31 by using rolling specimens machined out in such a way that the crystallographic
c-axis was parallel to the normal direction (type 1), parallel to the transverse direction,
and 30° inclined from the transverse direction (type 3) towards the rolling direction
[102]. The results show that there was not much recrystallization observed in type 1; on
the contrary, a certain extent of recrystallization took place in type 3. The main
deformation modes were also changed in different types of samples.
2.3. Texture evolution
As is well known, after most thermomechanical processing, a preferred orientation or
texture develops in the products [24]. The degree of the texture depends on the fraction of
grains that have the preferred orientation; this can be strongly affected by crystal
structure as well as the nature of the thermomechanical processes [103]. Magnesium,
which has a c/a ratio very close to the theoretical value, tends to form the basal texture;
i.e., the {0001} basal planes are parallel to the sheet surface due to rolling [44, 104], or,
due to a compression test, the basal planes align parallel to the compression plane [58].
Chapter 2. Literature review
22
The development of the texture in conventional Mg alloy sheets, such as AZ31 (Mg-
3Al-1Zn in wt%), has been investigated in a number of studies [44, 104-109]. In all
cases, a basal texture is presented in which most grains are oriented such that their basal
planes are nearly parallel to the sheet plane. By using texture modelling, Agnew et al.
[20] have shown that the formation of a sharp basal texture, with a single-peak in the
basal poles, is only associated with the activation of basal slip and tension twinning. Both
of these mechanisms tend to align the c-axis of grains with the direction of the
compressive strain.
In some cases, the basal poles of the conventional sheet alloys rotate away from the
normal direction towards the rolling direction and as a result of which a symmetrical
splitting of the basal texture is produced [105, 110]. The tendency to develop double-
peaks in basal poles in the rolling direction (RD) is associated with the activation of
second-order pyramidal c + a slip [20, 109], although some other work reported that it
is due to the activation of compression twinning and/or secondary twinning [111].
Contrary to Mg alloys, pure Mg has the single-peak basal texture after plane-strain
compression [112] as well as cold and hot rolling [44, 113].
It was reported that, regardless of which type of mechanism is activated (continuous
dynamic recrystallization (CDRX) or discontinuous dynamic recrystallization (DDRX)),
deformation texture is not accompanied by an obvious change from the non DRXed
deformation texture in Mg alloys [58]. In a study by Yi et al. [114], the authors described
the formation of a strong texture during DRX as a result of two facts: (i) Most of the new
recrystallized grains nucleated with similar orientations to the parent grains, although
with lower general intensity. The authors considered the small grains as the recrystallized
grains and, by comparing their orientation to the parent grains, concluded that the
textures of the DRX and matrix grains are similar. (ii) The high fracture strain resulted in
the formation of a strong deformation texture. Therefore, even though some grains
nucleated with a weaker texture at the beginning of DRX, the subsequent deformation of
these grains recreates the deformation texture component.
Jin et al. [115] explained the reason for intensifying the basal texture during the
deformation as follows: the grains with c-axes parallel to the compression axis (i.e., the
Chapter 2. Literature review
23
basal grains) are stable because the CRSS for the basal slip system is almost zero.
Therefore, these grains are less deformed compared to the grains with other orientations
and, subsequently, are less recrystallized. On the other hand, grains with other
orientations are deformed and subsequently consumed by repeated dynamic
recrystallization. Therefore, as the deformation continues, more grains with their c-axes
parallel to the applied stress are produced, as a result of which, the basal texture is
increasingly strengthened.
2.4. Magnesium alloy systems
Because of the limitations of mechanical properties and poor corrosion and oxidation
behaviour of pure magnesium, various magnesium alloy systems have been developed to
modify these disadvantages. The main alloying systems used for producing Mg wrought
alloys are AZ: magnesium-aluminum-zinc-manganese; ZK: magnesium-zinc-zirconium;
and ZM: magnesium-zinc-manganese [2, 65]. Among these alloys, AZ31 is generally
accepting as having an intermediate strength and ductility. An AZ31 sheet is also
considered to be a good substitute for a steel sheet and Al-sheet for transportation
applications because of its competitive specific stiffness and specific strength. Therefore,
the main alloying elements in wrought Mg alloys are Al and Zn.
The general effects of Zn on Mg alloys can be summarized as follows:
An increasing tendency to microporosity in as-cast materials, and if present in
quantities of more than 2 wt%, hot cracking can also occur during solidification [2,
116].
A weak grain refiner 43.
Suppressing the detrimental influence of Fe and Ni impurities on corrosion
behaviour [65].
The main effect of adding aluminum can be summarized as follows [117, 118]:
Improves strength, hardness, and castability.
A grain refiner.
Chapter 2. Literature review
24
Porosity (vol%) increases with Al up to 11 wt%.
However, the use of conventional magnesium wrought alloys such as AZ31 is
limited by low ductility at room temperature and high production cost. One of the reasons
for low formability of current magnesium wrought alloys is that texture develops in
wrought alloys. Therefore, either the existing alloys must be modified to weaken the
texture and enhance the ductility and formability or new alloys must be developed.
Texture weakening has often been observed in ternary systems such as Mg-Zn-RE or
Mg-Mn-RE alloys. The deformation texture of Mg-Zn alloys that contain no rare earth
elements is very similar to that of conventional Mg alloys such as AZ31. However, it has
recently been found that additions of rare earth elements to Mg-Zn alloys can develop
weaker deformation or annealing textures [104, 119]. A direct result of the noticeably
weakened texture in these alloys is the enhancement of ductility and the minimization of
the tension-compression asymmetry of wrought products [101, 120, 121]. In the
following section, the main aspects of alloying elements, especially the rare earth
elements, will be discussed.
2.4.1 Rare earth texture weakening
Ball and Prangnell [122] were one of the first authors who reported that alloys
containing additions of Y and RE elements can result in weaker texture during extrusion
in comparison with conventional Mg alloys. The reason for texture weakening in such
WE alloys containing yttrium and rare earth elements was described to be particle
stimulated nucleation (PSN) of recrystallization [122-124], although the reason for
enhanced PSN in combination with RE elements was not explained. PSN has been
reported as the texture weakening mechanism for Mg alloys by several other researchers
[122, 123]. However, it is generally accepted that not all precipitates are conducive to
PSN, which suggests that it is not the sole mechanism for RE-texture modification [125].
Laser et al. [110] reported on four different alloys based on conventional AZ31
containing micro-additions of cerium and calcium that show some texture improvement.
The alloys were hot rolled and tensile tested at room temperature. Their results showed
that the addition of less than 1 wt% Ce-rich mischmetal and Ca reduced the peak
Chapter 2. Literature review
25
intensity from 9 multiples of a random distribution (MORD) in AZ31 to only 3 MORD.
Bohlen et al. [104] studied the effect of Ce and Y additions (of less than 1 wt%) to Mg-
Zn alloys. Their results showed that the overall texture strength and the basal pole
intensity was lower for RE-containing alloys than for conventional alloys (ZM21 (2 wt%
Zn, 0.9 wt% Mn) and ZK10 (1 wt% Zn, 0.3 wt% Zr) alloys). The mechanical response of
the RE-containing alloys was also investigated, and it was determined that the anisotropy
of the yield and flow strengths was reversed and the planar anisotropy was reduced in
comparison to conventional alloys. This was first attributed to the higher amount of
intermetallic phases in RE-containing alloys, but approximately the same amount of
intermetallic phases was observed in ZM21 and ZE10 (1.3 wt% Zn, 0.1 wt% Ce) alloys,
calling this assumption into question. It was then hypothesized that either a distinction in
the nature of the intermetallics or the nature of the solid-solution alloy matrix might be
responsible for the observed texture weakening. The same modification effect of Ce on
the rolling texture of ZE10 alloys was also reported by Mackenzie et al. [119].
Changing the c/a ratio and consequently affecting the CRSS of basal slip and non-
basal slip was also reported to change the texture evolution mechanism. For example, a
reduction of c/a can enhance the activity of the non-basal slips [126]. The effect of Li, In,
and/or Zn addition on the lattice parameters of Mg alloys have been investigated by
Becerra et al. [127]. It was reported that Li decreased the c/a ratio of magnesium from
1.6424 to 1.6068. It has also been reported that a significant decrease in a can be
observed by adding In >0.2at% and Zn >0.2at% [127].
Li is reported to have large effect on the lattice parameters of Mg; adding 11 wt% Li
can change the HCP Mg to a Mg-Li solid solution with a BCC crystal structure.
Therefore, the CRSS of the prismatic slip and the strain-hardening rate decreases [126],
and more slip systems can be activated at lower temperatures [127].
Barnett et al. [44] characterized deformation microstructures and textures of the cold
rolling of pure Mg, Mg-0.2Ce, and AZ31. Their results showed that the rollability of Mg-
0.2Ce alloy was considerably higher with an increase of shear band density, which was
associated with the material within a shear band inclined from the basal pole. Hantzsche
et al. [128] studied the effect of Ce, Nd, and Y in the binary alloy system on the texture
Chapter 2. Literature review
26
development during the rolling. They suggested that the texture weakening mechanism is
connected with the appearance of deformation bands containing twins and retarded grain
growth.
Sandlöbes et al. [129] found that additional deformation modes cause a
homogeneous deformation with a weaker basal texture compared to pure Mg and other
classical Mg wrought alloys. Their studies showed a high activity of compression
twinning, secondary twinning, and pyramidal <c + a> slip in Mg-Y alloy. They assumed
that Y and other RE elements can change the SFE of certain types of dislocations and,
consequently, change the relative CRSS for <a> and <c + a> dislocations. Therefore, they
proposed a model that related the higher frequency of shear bands distribute the strain
more than in pure Mg. As a consequence, failure in shear bands occurs at a significantly
higher strain.
Chino et al. [121] also studied the effect of Ce addition on Mg–0.2 wt% (0.035 at%)
Ce rolled alloy. They suggested that the texture weakening is attributed to the
enhancement of the non-basal slip due to changing stacking fault energy. This can
strongly affect the recrystallization behaviour during hot rolling. They also studied the
effect of Y (up to 1.2 wt%) on the texture of a Mg-Zn alloy. The basal texture was
weakened and modified, as characterized by the splitting of basal poles toward the TD
and RD; this effect was hypothetically attributed to the activation of prismatic <a> slips
[33].
Stanford [130] also suggested that dislocation/solute interactions can play an
important role in texture weakening and, because of the large atomic radii, Ce and La are
the most effective texture modifiers. Since Ce exhibits small solid solubility in
magnesium, by increasing the Ce concentrations, alloys will have Ce in solid solutions as
well as in precipitates [131]. The size and morphologies of the particles can also affect
the mechanism of texture weakening by PSN and grain boundary pinning [132].
Moreover, both solute interactions and precipitates can strongly affect primary
recrystallization and grain growth during annealing.
Chapter 2. Literature review
27
2.4.2 Texture evolution during annealing
Although a large amount of work has been carried out on the texture evolution
during DRX in both rare earth and conventional wrought Mg [58, 72, 79, 133], little work
has been done on SRX during annealing after deformation [106, 134, 135]. For example,
Wendt et al. [136] observed a significant weakening of the texture after the annealing of
hot rolled ZEK100 alloy. The sheets, hot rolled at 300°C to a reduction of 83%, were re-
heated for 15 min between passes. The subsequent annealing at 400°C for 30 min
reduced the maximum intensity in the basal pole figures from 9.2 MROD, in the as-rolled
state, to 2.6 MROD. This significant weakening of the texture upon annealing was
accompanied by a complete recrystallization, resulting in a homogenous microstructure.
In another work by Li et al. [137] on AZ31, despite forming new grains with
different orientations from the deformed matrix, the deformation texture was retained
after annealing. They explained the retention of the deformed texture mainly by the
incomplete recrystallization of magnesium. Because the deformation is highly localized,
most of the matrix deformed only as a result of basal slip and cannot be consumed
entirely by new grains from compression twins. In another work on pure Mg, Yi et al.
[138] investigated the formation of new grains at the intersections of two double twins.
They reported that the orientation of new grains can be considered to be a rotation around
the c-axis with respect to the matrix grains, which causes the perseverance of the initial
basal texture.
Shear bands, twins, grain boundaries, and triple junctions were found to be the
preferential nucleation sites in magnesium alloys [129, 139, 140]. Both contraction and
extension twins can influence the recrystallized structure; however, each type shows
different contributions. Contraction and double twins have been reported in several
papers for their contribution during SRX. As mentioned earlier, these twins are oriented
favourably for basal slip and accommodate the majority of the applied strain, therefore
generating zones of flow localization [141]. Martin et al. [47] reported that after
recrystallization, most of the twin boundaries lose their character. Although a few that
remain are contraction twins, they showed that the double twins recrystallized faster. Li
Chapter 2. Literature review
28
et al. [137] reported that, while contraction twin boundaries have stable configurations
and are generally considered to be immobile, double twin boundaries are more mobile
and nucleation is initiated more readily in their vicinity. Levinson [142] reported that
contraction and double twins have a strong influence in the early stage of annealing in the
AZ31 cast samples, with 15% deformation. However, at longer annealing times, the
nucleation at grain boundaries dominated the structure as the SRX progressed. Therefore,
due to a lower fraction of twins compared with grain boundaries, the texture after
complete recrystallization was only slightly broadened from the initially strong c-axis
texture.
Martin et al. [143] reported that, during the annealing of AZ31 and AM30, although
the twin orientations are replaced by recrystallization orientations, these new grains do
not expand into the matrix; as a result of which, the final texture is not significantly
changed.
Another work by Mackenzie et al. [119] also obtained weak textures after annealing
of rolled Mg-1Zn (wt%) alloys containing 0.3, 0.6 and 1 wt% of Ce. EBSD examination
of texture evolution in Mg-1Zn-0.3Ce alloy after 60 s and 180 s annealing at 400°C
showed that nucleating grains have both basal and non-basal orientations. However, non-
basal grains grow at the expense of basal grains. Not seeing any evidence of PSN, the
authors concluded that a form of “solute drag” might change the orientation relationships
between grain boundaries.
2.5 Rate dependent deformation of Mg alloys
The effects of strain rate and temperature on the deformation behaviour of Mg alloys
are not yet completely understood. As mentioned before, more strain hardening is
observed at all temperatures when the material is deformed at a higher strain rate.
Ishikawa et al. [144] reported that the effect of strain rate is higher with decreasing
temperature of deformation in AZ31. However, the effect of temperature is less important
at high strain rate deformation such as 1000 s-1 of this alloy, which indicates that
diffusion is not rate-controlling at high strain rates. A study on the effect of temperature
Chapter 2. Literature review
29
at strain rate of 1 s−1 showed that the flow behaviour of AZ31 at this strain rate can still
be described by conventional creep equation, which demonstrates the contribution of
diffusion to the deformation [28, 145].
Ishikawa et al. [144] also found more twins in samples deformed at low strain rates
at room temperatures when compared with that of high strain rates (103s-1). They stated
that the fewer twins at higher strain rates may be related to the localization of the flow.
Barnett et al. [146] proposed boundary conditions of temperature, grain size, and stress
mode for twin dominated flow and slip dominated flow. This transition from twinning to
slip dominated flow occurs with decreasing grain size and increasing temperature. Lee et
al. [28] mentioned that strain rate also influences this transition and that increases in the
strain rate results in increases in the transition temperature. The occurrence of twinning in
AZ31 samples was associated with a high level of work hardening and can be responsible
for the concave shape in the stress-strain curve. They also reported that that the twinning
fraction increases with the increased of strain rate at 300C and the range of 0.01 to 10 s-1
and a strain of 0.1. At a constant strain rate of 10 s-1 and a temperature range of 200-
400C, the fraction of twinned area decreased up to 300C and then rapidly dropped with
further increases in temperature. However, the fraction of the twinned area increased
moderately when the strain rate was increasing at a constant temperature of 300C.
Sivakesavam et al. [147] studied the constitutive flow behaviour of as-cast
magnesium in the temperature range of 300-550C and the strain rate of 0.001-100s-1
using processing maps. They found that the maximum efficiency of power dissipation
occurs at 425C and 0.3 s-1, which are the optimum hot working condition for as-cast
magnesium alloy. For as-cast magnesium alloys at temperatures lower than 450C and
strain rates higher than 10 s-1, material shows twinning. They also reported that at higher
temperatures and strain rates, the material exhibits flow localization.
2.5.1. The effect of strain rate on the recrystallized grain size
Ishikawa et al. [144] also studied the effect of strain rate on the recrystallized grain
size at elevated temperatures. They found that at low strain rates, equiaxed and finer
grains were observed, showing that recrystallization occurs during deformation. In

Chapter 2. Literature review
30
contrast, the microstructure was not uniform at high strain rate deformation conditions.
This situation can be seen even at high temperatures, which implies that the deformation
is similar to the room temperature condition, i.e., it is still localized at 400C, for
example.
Moreover, it is seen that in high strain rate deformation, such as the strain rate of
103s-1, and at the temperature of 500C, the recrystallized grain size clearly deviates from
the relation shown at low strain rates [144]. They suggested that the recrystallization
mechanism at this condition is twinning induced DRX. In general, the mechanism for
deformation at a high strain rate, such as 1000 s-1, is supposed to be dislocation glide and
twinning.
Lee et al. [28] investigated the microstructure for strip-cast AZ31 deformed at a
strain rate of 10 s-1 and at different temperatures of 250, 300, and 350C. They found that
the most homogenous microstructure was obtained at 300C. The homogeneity of the
microstructure at this temperature has been related to the occurrence of DRX. However,
the microstructure is still homogenous at 350C because the twin boundaries that operate
as nucleation sites are not numerous enough. Additionally, since the temperature is not
sufficient for the growth of DRX grains at 250C, the microstructure at this temperature
is inhomogeneous.
Essadiqi et al. [148] also studied the effect of high strain deformation using a cam
plastometer. They found that by increasing the strain rate, the recrystallized grain size
become finer, up to the point where there is insufficient thermal energy for
recrystallization to occur.
2.6. Rolling
Because of the low formability of Mg alloys at room temperature, Mg alloys for
sheet application must be rolled at elevated temperatures. This requirement considerably
increases the cost of Mg sheets, and this is a big barrier to the acceptance of Mg alloys in
automotive application. Many studies have been conducted to optimize the process

Chapter 2. Literature review
31
parameters, microstructure, and mechanical parameters for rolling process in recent years
[108, 109, 149-152].
As mentioned in section 2.2, the temperature has a large influence on the formability
and rollability of Mg alloys. Yarita et al. [153] found that the maximum reduction to
produce Mg sheets without cracking is about 40% at a temperature of 200C, while less
than 20% is needed for temperatures below 155C. Barnett et al. [44] compared the cold
rolling reduction for Mg, Mg–0.2Ce, and Mg-3Al-1Zn. The reduction per pass was
restricted to 1%, and the maximum cold rolling reductions achieved in these alloys prior
to failure were ∼30, >90, and ∼15% for the above alloys, respectively. Liang et al. [149]
also studied the effect of reduction per pass in rolling process at 400C. They found that
the lowest average grain size can be achieved at 30% rolling reduction. However, when
the reduction reached above 30%, the average grain size decreased with increasing
rolling reduction due to the high grain boundary misorientation because of large strain
deformation.
Essadiqi et al. [148] studied the effects of temperatures, speed, and reduction per
pass on the microstructural evolution during hot rolling of AZ31. They worked on three
temperatures of 350, 400, and 450ºC, two rolling speeds of 20 and 50 rpm, and two
reductions of 15% and 30% per pass. Their results showed that rolling at 400C produces
a more homogenous microstructure, while rolling at higher temperatures produces a large
amount of coarse grains as a result of grain growth.
It was found by Sakai et al. [154] that reductions greater than 60% can be achieved
by single pass rolling at high speeds at room temperature. In that research, speeds of
approximately 1000 m/min were employed. Reducing the contact time between the
material and roll was one of the main reasons suggested for the workability improvement.
This resulted in an effective temperature rise of the sheet during rolling. Therefore, the
fracture and cracks caused by low formability in low temperature could be suppressed
significantly. Mapping of the defect for AZ31 at various temperatures and the speed
rolling of 2000 mm/min is shown in figure 2.11. The grain size reported for the sheet
rolled at 150ºC was relatively low (2.9 µm), which shows that high strain rate
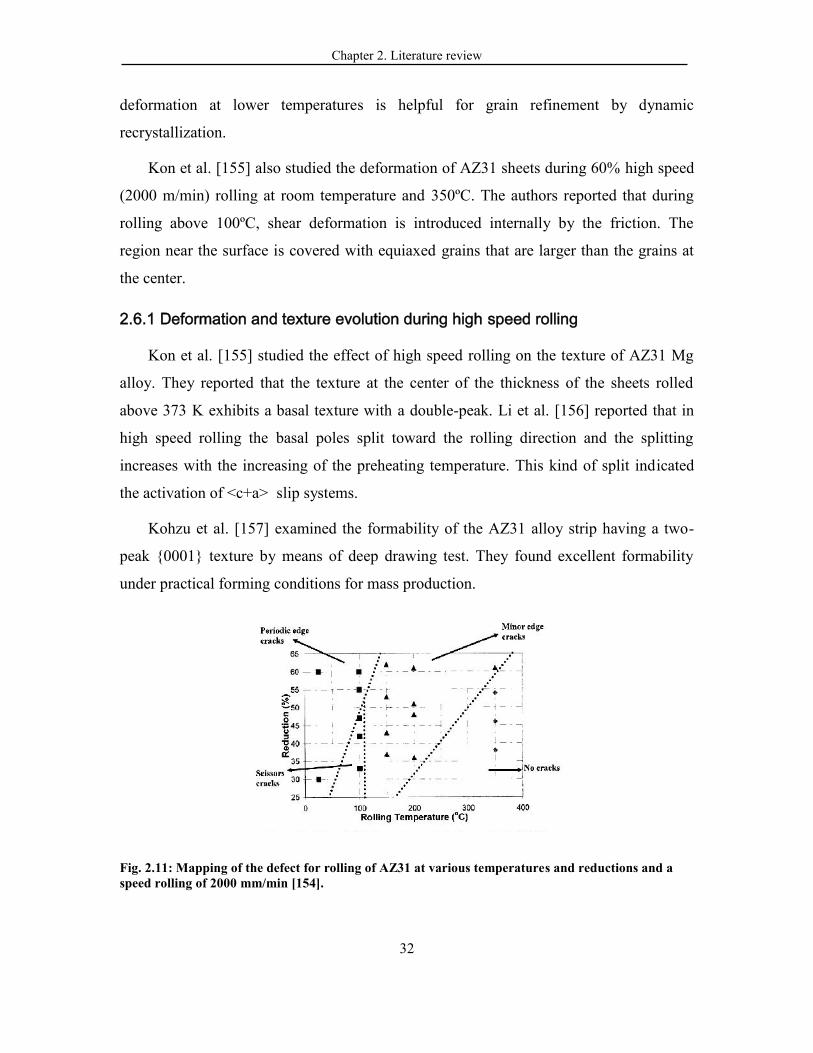
Chapter 2. Literature review
32
deformation at lower temperatures is helpful for grain refinement by dynamic
recrystallization.
Kon et al. [155] also studied the deformation of AZ31 sheets during 60% high speed
(2000 m/min) rolling at room temperature and 350ºC. The authors reported that during
rolling above 100ºC, shear deformation is introduced internally by the friction. The
region near the surface is covered with equiaxed grains that are larger than the grains at
the center.
2.6.1 Deformation and texture evolution during high speed rolling
Kon et al. [155] studied the effect of high speed rolling on the texture of AZ31 Mg
alloy. They reported that the texture at the center of the thickness of the sheets rolled
above 373 K exhibits a basal texture with a double-peak. Li et al. [156] reported that in
high speed rolling the basal poles split toward the rolling direction and the splitting
increases with the increasing of the preheating temperature. This kind of split indicated
the activation of <c+a> slip systems.
Kohzu et al. [157] examined the formability of the AZ31 alloy strip having a two-
peak {0001} texture by means of deep drawing test. They found excellent formability
under practical forming conditions for mass production.
Fig. 2.11: Mapping of the defect for rolling of AZ31 at various temperatures and reductions and aspeed rolling of 2000 mm/min [154].
Chapter 2. Literature review
33
2.7 References
[1] M.M. Avedesian, H. Baker, ASM international, 274 (1999).[2] K.U. Kainer, F. Kaiser, Magnesium alloys and technology, Wiley Online Library, 2003.[3] I. Polmear, Materials Science and Technology, 10 (1994) 1-16.[4] C. Blawert, N. Hort, K. Kainer, Trans. Indian Inst. Met, 57 (2004) 397-408.[5] E. Doege, K. Dröder, Journal of Materials Processing Technology, 115 (2001) 14-19.[6] P. Partridge, International Materials Reviews, 12 (1967) 169-194.[7] A. Staroselsky, L. Anand, International Journal of Plasticity, 19 (2003) 1843-1864.[8] S. Celotto, Acta Materialia, 48 (2000) 1775-1787.[9] C.S. Roberts, Magnesium and its Alloys, Wiley, 1960.[10] R. Abbaschian, L. Abbaschian, R.E. Reed-Hill, Physical metallurgy principles, Thomson Engineering,2008.[11] R.W.K. Honeycombe, (1975).[12] W.F. Hosford, R.M. Caddell, Metal forming: mechanics and metallurgy, Cambridge University Press,2011.[13] S.R. Agnew, O. Duygulu, 2003, pp. 177-188.[14] R.O. Kajbyshev, O.S. Sitdikov, Fizika Metallov i Metallovedenie, (1992) 103-114.[15] G. Groves, A. Kelly, Philosophical Magazine, 8 (1963) 877-887.[16] M.R. Barnett, Metallurgical and Materials Transactions A: Physical Metallurgy and Materials Science,34 A (2003) 1799-1806.[17] J. Qu, Effect of microstructure on static and dynamic mechanical properties of high strength steels,2007.[18] M.R. Barnett, Materials Science Forum, 419-422 (2003) 503-508.[19] A. Najafizadeh, J.J. Jonas, Vancouver, 2007, pp. 4932-4937.[20] S.R. Agnew, M.H. Yoo, C.N. Tomé, Acta Materialia, 49 (2001) 4277-4289.[21] M.R. Barnett, Materials Science and Engineering: A, 464 (2007) 1-7.[22] S. Godet, L. Jiang, A.A. Luo, J.J. Jonas, Scripta Materialia, 55 (2006) 1055-1058.[23] B. Bilby, A. Crocker, Proceedings of the Royal Society of London. Series A. Mathematical andPhysical Sciences, 288 (1965) 240-255.[24] F.J. Humphreys, M. Hatherly, Recrystallization and related annealing phenomena, Pergamon, 2004.[25] W.F. Hosford, Oxford University Press(USA), 1993, (1993) 248.[26] J.W. Christian, S. Mahajan, Progress in Materials Science, 39 (1995) 1-157.[27] R. Reed-Hill, W. Robertson, Trans. Met. Soc. AIME, 212 (1958).[28] B.H. Lee, W. Bang, S. Ahn, C.S. Lee, Metallurgical and Materials Transactions A: PhysicalMetallurgy and Materials Science, 39 A (2008) 1426-1434.[29] M. Yoo, Metallurgical and Materials Transactions A, 12 (1981) 409-418.[30] W. Püschl, Progress in Materials Science, 47 (2002) 415-461.[31] D.R. Thornburg, H.R. Piehler, Metallurgical Transactions A, 6 (1975) 1511-1523.[32] R. Gehrmann, M.M. Frommert, G. Gottstein, Materials Science and Engineering: A, 395 (2005) 338-349.[33] L. Jiang, J. Jonas, R. Mishra, A. Luo, A. Sachdev, S. Godet, Acta Materialia, 55 (2007) 3899-3910.[34] X. Lou, M. Li, R. Boger, S. Agnew, R. Wagoner, International Journal of Plasticity, 23 (2007) 44-86.[35] J.W. Christian, S. Mahajan, Progress in Materials Science, 39 (1995) 1-157.[36] S. Mahajan, Acta Metallurgica, 21 (1973) 255-260.[37] B.C. Wonsiewicz, Massachusetts Institute of Technology, 1966.[38] D. Brown, S. Agnew, M. Bourke, T. Holden, S. Vogel, C. Tomé, Materials Science and Engineering:A, 399 (2005) 1-12.[39] R.E. Reed-Hill, W.D. Robertson, Acta Metallurgica, 5 (1957) 717-727.[40] T. Al-Samman, B. Ahmad, G. Gottstein, Materials Science Forum, Trans Tech Publ, 2007, pp. 229-234.[41] R.E. Reed-Hill, W.D. Robertson, Acta Metallurgica, 5 (1957) 728-737.[42] R. Reed-Hill, Trans. Met. Soc. AIME, 218 (1960) 554-558.

Chapter 2. Literature review
34
[43] L. Jiang, J.J. Jonas, R.K. Mishra, A.A. Luo, A.K. Sachdev, S. Godet, Acta Materialia, 55 (2007) 3899-3910.[44] M.R. Barnett, M.D. Nave, C.J. Bettles, Materials Science and Engineering A, 386 (2004) 205-211.[45] W. Hartt, R. Reed-Hill, (1968).[46] H. Yoshinaga, T. Obara, S. Morozumi, Materials Science and Engineering, 12 (1973) 255-264.[47] É. Martin, L. Capolungo, L. Jiang, J.J. Jonas, Acta Materialia, 58 (2010) 3970-3983.[48] M.R. Barnett, Z. Keshavarz, A.G. Beer, X. Ma, Acta Materialia, 56 (2008) 5-15.[49] P. Partridge, Philosophical Magazine, 12 (1965) 1043-1054.[50] S. Mahajan, D. Williams, International Materials Reviews, 18 (1973) 43-61.[51] M.R. Barnett, Materials Science and Engineering: A, 464 (2007) 8-16.[52] J. Koike, T. Kobayashi, T. Mukai, H. Watanabe, M. Suzuki, K. Maruyama, K. Higashi, ActaMaterialia, 51 (2003) 2055-2065.[53] M.A. Meyers, O. Vöhringer, V.A. Lubarda, Acta Materialia, 49 (2001) 4025-4039.[54] A. Jain, S. Agnew, Materials Science and Engineering: A, 462 (2007) 29-36.[55] G. Proust, C.N. Tomé, A. Jain, S.R. Agnew, International Journal of Plasticity, 25 (2009) 861-880.[56] S.G. Hong, S.H. Park, C.S. Lee, Scripta Materialia, 64 (2011) 145-148.[57] D.W. Brown, S.R. Agnew, S. Abeln, W. Blumenthal, M.A.M. Bourke, M. Mataya, C.N. Tomé, S.C.Vogel, Materials Science Forum, Trans Tech Publ, 2005, pp. 1037-1042.[58] T. Al-Samman, G. Gottstein, Materials Science and Engineering A, 490 (2008) 411-420.[59] M. Li, T. Tamura, K. Miwa, Journal of Materials Research, 22 (2007) 3465.[60] H. McQueen, M. Myshlyaev, A. Mwembela, Canadian Metallurgical Quarterly, 42 (2003) 97-112.[61] M.R. Barnett, Z. Keshavarz, A.G. Beer, D. Atwell, Acta Materialia, 52 (2004) 5093-5103.[62] X. Yang, H. Miura, T. Sakai, in: T. Chandra, J.M. Torralba, T. Sakai (Eds.), Madrid, 2003, pp. 611-616.[63] M. Cockcroft, D. Latham, J Inst Metals, 96 (1968) 33-39.[64] S. Semiatin, J.J. Jonas, American Society for Metals, 1984, (1984) 299.[65] H.B. M. Avedesian, ASM specialty handbook. Magnesium and magnesium alloys. , ASMInternational, Materials Park, Ohio, 2000.[66] J.G. Lenard, M. Pietrzyk, L. Cser, Mathematical and physical simulation of the properties of hot rolledproducts, Elsevier Oxford, 1999.[67] M. Shamsi, M. Sanjari, A.Z. Hanzaki, Materials Science and Technology, 25 (2009) 1039-1045.[68] F. Humphreys, Acta Materialia, 45 (1997) 5031-5039.[69] R.D. Doherty, D.A. Hughes, F.J. Humphreys, J.J. Jonas, D.J. Jensen, M.E. Kassner, W.E. King, T.R.McNelley, H.J. McQueen, A.D. Rollett, Materials Science and Engineering: A, 238 (1997) 219-274.[70] A. Galiyev, O. Sitdikov, R. Kaibyshev, Materials Transactions, 44 (2003) 426-435.[71] H.J. Frost, M.F. Ashby, (1982).[72] S.E. Ion, F.J. Humphreys, S.H. White, Acta Metallurgica, 30 (1982) 1909-1919.[73] S. Balasubramanian, Massachusetts Institute of Technology, 1998.[74] M. Myshlyaev, H. McQueen, A. Mwembela, E. Konopleva, Materials Science and Engineering: A,337 (2002) 121-133.[75] T. Sakai, J.J. Jonas, Acta Metallurgica, 32 (1984) 189-209.[76] H. McQueen, J. Jonas, Plastic deformation of materials.(A 75-46501 24-26) New York, AcademicPress, Inc., 1975, (1975) 393-493.[77] P. Cotterill, P.R. Mould, Recrystallization and grain growth in metals, Surrey University PressLondon, 1976.[78] A. Galiyev, R. Kaibyshev, G. Gottstein, Acta Materialia, 49 (2001) 1199-1207.[79] J.C. Tan, M.J. Tan, Materials Science and Engineering A, 339 (2003) 124-132.[80] O. Sitdikov, R. Kaibyshev, Materials Transactions(Japan), 42 (2001) 1928-1937.[81] S.M. Fatemi-Varzaneh, A. Zarei-Hanzaki, H. Beladi, Materials Science and Engineering A, 456(2007) 52-57.[82] T. Al-Samman, K.D. Molodov, D.A. Molodov, G. Gottstein, S. Suwas, Acta Materialia, 60 (2012)537-545.[83] Y. Zhang, X. Zeng, C. Lu, W. Ding, Materials Science and Engineering: A, 428 (2006) 91-97.[84] R. Kaibyshev, O. Sitdikov, Physics of metals and metallography, 73 (1992) 635-642.[85] A. Grosvenor, C.H.J. Davies, Materials Science Forum, 426-432 (2003) 4567-4572.

Chapter 2. Literature review
35
[86] R.O. Kaibyshev, O.S. Sitdikov, The Third International Conference on Recrystallisation and RelatedPhenomena, (1996) 203-209[87] Z. Zhang, M.-p. Wang, S. Zhu, N. Jiang, Journal of Alloys and Compounds, 544 (2012) 159-165.[88] B. Aritzur, (1983).[89] L. Jin, D. Lin, D. Mao, X. Zeng, B. Chen, W. Ding, Materials Science and Engineering: A, 423 (2006)247-252.[90] R.W. Cahn, P. Haasen, Physical metallurgy. Vol. 2, North-Holland, 1996.[91] H. Jazaeri, F. Humphreys, Acta Materialia, 52 (2004) 3251-3262.[92] H. McQueen, Materials Science and Engineering: A, 387 (2004) 203-208.[93] M.R. Drury, J.L. Urai, Tectonophysics, 172 (1990) 235-253.[94] A. Mwembela, E.B. Konopleva, H.J. McQueen, Scripta Materialia, 37 (1997) 1789-1795.[95] P.D. Hodgson, Journal of Materials Processing Technology, 60 (1996) 27-33.[96] A. Galiyev, R. Kaibyshev, G. Gottstein, Magnesium Technology, (2002) 181-185.[97] M.R. Barnett, Materials Science Forum, Trans Tech Publ, 2003, pp. 515-520.[98] D.A. Porter, K.E. Easterling, Phase transformations in metals and alloys, CRC, 1992.[99] Y.V.R.K. Prasad, K.P. Rao, Materials Science and Engineering: A, 432 (2006) 170-177.[100] O.A Kaibyshev, Recrystallisation’90, Minerals, Metals & Materials Society, Wollongong, Australia,1990.[101] X. Huang, K. Suzuki, Y. Chino, Scripta Materialia, 63 (2010) 395-398.[102] X. Li, W. Qi, Materials Science and Engineering: A, 560 (2013) 321-331.[103] H.J. Bunge, P.R. Morris, Texture analysis in materials science: mathematical methods, ButterworthsLondon, 1982.[104] J. Bohlen, M.R. Nürnberg, J.W. Senn, D. Letzig, S.R. Agnew, Acta Materialia, 55 (2007) 2101-2112.[105] S. Abdessameud, D. Bradai, Canadian Metallurgical Quarterly, 48 (2009) 433-442.[106] X. Huang, K. Suzuki, Y. Chino, Journal of Alloys and Compounds, 509 (2011) 4854-4860.[107] A. Jäger, P. Lukáč, V. Gärtnerová, J. Haloda, M. Dopita, Materials Science and Engineering: A, 432(2006) 20-25.[108] S.H. Kim, Y.M. Seo, C.D. Yim, B.S. You, 2005, pp. 530-535.[109] A. Styczynski, C. Hartig, J. Bohlen, D. Letzig, Scripta Materialia, 50 (2004) 943-947.[110] T. Laser, C. Hartig, M.R. Nürnberg, D. Letzig, R. Bormann, Acta Materialia, 56 (2008) 2791-2798.[111] S.L. Couling, F. Pashak, L. Sturkey, Trans. ASM, 51 (1959) 94-107.[112] M.D. Nave, M.R. Barnett, Scripta Materialia, 51 (2004) 881-885.[113] E. Kelley, W. HOSFORD, TRANS MET SOC AIME, 242 (1968).[114] S.B. Yi, S. Zaefferer, H.G. Brokmeier, Materials Science and Engineering: A, 424 (2006) 275-281.[115] Q. Jin, S.-Y. Shim, S.-G. Lim, Scripta Materialia, 55 (2006) 843-846.[116] I. Polmear, Light alloys: from traditional alloys to nanocrystals, Butterworth-Heinemann, 2005.[117] M. Fujita, N. Sakate, S. Hirahara, Y. Yamamoto, JSAE Review(Japan), 16 (1995) 299-301.[118] P.L. Schaffer, Y.C. Lee, A.K. Dahle, Magnesium Technology 2001 as held at the 2001 TMS AnnualMeeting, 2001, pp. 87-94.[119] L.W.F. Mackenzie, M.O. Pekguleryuz, Scripta Materialia, 59 (2008) 665-668.[120] S. Yi, J. Bohlen, F. Heinemann, D. Letzig, Acta Materialia, 58 (2010) 592-605.[121] Y. Chino, M. Kado, M. Mabuchi, Materials Science and Engineering: A, 494 (2008) 343-349.[122] E.A. Ball, P.B. Prangnell, Scripta Metallurgica et Materiala, 31 (1994) 111-116.[123] L.W.F. Mackenzie, B. Davis, F.J. Humphreys, G.W. Lorimer, Materials Science and Technology, 23(2007) 1173-1180.[124] G.W. Lorimer, L.W.F. Mackenzie, F.J. Humphreys, T. Wilks, 2005, pp. 99-102.[125] T. Al-Samman, X. Li, Materials Science and Engineering A, 528 (2011) 3809-3822.[126] G.V. Raynor, The physical metallurgy of magnesium and its alloys, Pergamon, 1959.[127] A. Becerra, M. Pekguleryuz, Journal of Materials Research, 23 (2008) 3379-3386.[128] K. Hantzsche, J. Bohlen, J. Wendt, K.U. Kainer, S.B. Yi, D. Letzig, Scripta Materialia, 63 (2010)725-730.[129] S. Sandlöbes, S. Zaefferer, I. Schestakow, S. Yi, R. Gonzalez-Martinez, Acta Materialia, 59 (2011)429-439.[130] N. Stanford, Materials Science and Engineering: A, 527 (2010) 2669-2677.[131] N. Stanford, M.R. Barnett, Materials Science and Engineering: A, 496 (2008) 399-408.
Chapter 2. Literature review
36
[132] Y.B. Chun, J. Geng, N. Stanford, C.H.J. Davies, J.F. Nie, M.R. Barnett, Materials Science andEngineering: A, 528 (2011) 3653-3658.[133] S.Q. Zhu, H.G. Yan, J.H. Chen, Y.Z. Wu, J.Z. Liu, J. Tian, Scripta Materialia, 63 (2010) 985-988.[134] S.A. Farzadfar, E. Martin, M. Sanjari, E. Essadiqi, S. Yue, Journal of Materials Science, 47 (2012)5488-5500.[135] M. Sanjari, S.F. Farzadfar, T. Sakai, H. Utsunomiya, E. Essadiqi, I.H. Jung, S. Yue, MaterialsScience and Engineering A, 561 (2012) 191-202.[136] J. Wendt, K.U. Kainer, G. Arruebarrena, K. Hantzsche, J. Bohlen, D. Letzig, 2009, pp. 289-293.[137] X. Li, P. Yang, L.N. Wang, L. Meng, F. Cui, Materials Science and Engineering: A, 517 (2009) 160-169.[138] S. Yi, I. Schestakow, S. Zaefferer, Materials Science and Engineering: A, 516 (2009) 58-64.[139] H. Yan, S.W. Xu, R.S. Chen, S. Kamado, T. Honma, E.H. Han, Scripta Materialia, 64 (2011) 141-144.[140] M. Sanjari, S.A. Farzadfar, I.H. Jung, E. Essadiqi, S. Yue, Materials Science and Technology, (2011).[141] L. Jiang, J.J. Jonas, A.A. Luo, A.K. Sachdev, S. Godet, Scripta Materialia, 54 (2006) 771-775.[142] A.J. Levinson, (2012).[143] É. Martin, J.J. Jonas, Acta Materialia, 58 (2010) 4253-4266.[144] K. Ishikawa, H. Watanabe, T. Mukai, Journal of Materials Science, 40 (2005) 1577-1582.[145] T. Mukai, M. Yamanoi, H. Watanabe, K. Ishikawa, K. Higashi, Materials transactions-JIM, 42(2001) 1177-1181.[146] M.R. Barnett, Journal of Light Metals, 1 (2001) 167-177.[147] O. Sivakesavam, Y.V.R.K. Prasad, Materials Science and Engineering: A, 362 (2003) 118-124.[148] E. Essadiqi, M.T. Shehata, A. Javaid, C. Galvani, K. Spencer, S. Yue, R. Verna, Third InternationalConference on Light Metals Technology, Saint-Sauveur, Quebec, Canada, 2007, pp. 177-182.[149] S. Liang, H. Sun, Z. Liu, E. Wang, Journal of Alloys and Compounds, 472 (2009) 127-132.[150] M.T. Pérez-Prado, J.A. Del Valle, O.A. Ruano, Scripta Materialia, 50 (2004) 667-671.[151] H.M. Chen, S.B. Kang, H.S. Yu, G.H. Min, Cailiao Kexue yu Gongyi/Material Science andTechnology, 16 (2008) 42-46.[152] R. Kawalla, M. Oswald, C. Schmidt, M. Ullmann, H.P. Vogt, N.D. Cuong, 2008, pp. 177-182.[153] I. Yarita, T. Hashizume, K.Takamatsu, Journal of the Japan Society for Technology of Plasticity, 47(2006) 973-977.[154] T. Sakai, Y. Watanabe, H. Utsunomiya, Materials Science Forum 618-619(PART 4), (2009) 483-486.[155] H. Kon, T. Sakai, H. Utsunomiya, S. Minamiguchi, Materials Transactions, 48 (2007) 2023-2027.[156] H. Li, E. Hsu, J. Szpunar, H. Utsunomiya, T. Sakai, Journal of Materials Science, 43 (2008) 7148-7156.[157] M. Kohzu, F. Yoshida, K. Higashi, 2003, pp. 321-326.
Chapter 3. Influence of strain rate
37
Chapter 3
Influence of strain rate on the hot-deformation
behavior and texture evolution of AZ31B
In this Chapter, the effect of strain rate studies on the hot deformation behaviour,
microstructure and texture of cast AZ31 alloy at a wide range of strain rate are presented.
In order to apply low strain rates (0.01 and 1s-1), a computer controlled servo-hydraulic
materials testing system (MTS) and for higher strain rates of 10 to 100 s-1, a cam
plastometer was used. Detailed microstructure and texture examination by EBSD was
carried out in selected samples in order to clarify the predominant deformation and
recrystallization mechanisms at different strain rates. This alloy was chosen as a
reference since it is the one of the Mg alloys most commonly considered for industrial
applications.
Chapter 3. Influence of strain rate
38
* This section has been published: M. Sanjari, S.A. Farzadfar, I.H. Jung, E. Essadiqi, S.
Yue, Influence of strain rate on hot deformation behaviour and texture evolution of AZ31B, Materials
Science and Technology, (2012) VOL 28 NO 4 437.
In this work, the effects of strain rate on the flow behaviour and microstructure
evolution on AZ31 Mg alloy were studied by compression testing over a wide range of
strain rates (0.01-100 s-1) and temperatures 300-450°C. Also, the influence of different
strain rates on the dynamic recrystallization (DRX) mechanisms and texture evolution
was investigated. The results showed that with increasing strain rates the twin-induced
DRX fraction increased at a constant temperature and the contribution of continuous
dynamic recrystallization (CDRX) decreased. Upon increasing the strain rate, the
formation of tensile twins intensified the basal texture in the deformed sample. Also, the
recrystallized volume fraction increased significantly with the strain rate. The flow
behaviour was fitted into two types of constitutive equations: (i) power-law and (ii)
hyperbolic sine. Average activation energies of about 162 kJ/mol and 135 kJ/mol were
obtained for the peak and steady-state strain, respectively.
Chapter 3. Influence of strain rate
39
3.1 Introduction
Magnesium has the lowest density of all of the industrially significant metals and
alloys, which makes it a very attractive candidate for applications such as automotive,
railway, and aerospace industries [1, 2]. However, magnesium and its alloys generally
exhibit low ductility due to limitations of the deformation mechanisms [3]. Therefore, it
is necessary to improve the deformability of magnesium by using secondary
manufacturing processes such as rolling and extrusion [1, 4]. To optimize the processing
for plastic forming, it is important to understand the effect of temperature and strain rate
on flow behaviour and microstructure evolution. To date, the effect of temperature on the
flow behaviour and deformation mechanism of magnesium alloy has been extensively
investigated [3, 5-7]. However, the effect of strain rate, especially high strain rates greater
than 1s-1, at which most secondary forming processes are performed, has rarely been
examined systematically. A study by Lee et al. [8] on the effect of strain rates from 0.01
to 10 s-1 to a strain of 0.1 showed that the twinning fraction increases with increasing
strain rate at 573 K. Essadiqi et al. [9] also studied the effect of high strain deformation
using a cam plastometer. They found that with an increase in strain rate, for a given
strain, the recrystallized grain size becomes finer and the strain triggering dynamic
recrystallization increases. Ishikawa et al. [10] studied high temperature compressive
properties in an AZ31 magnesium alloy over a wide strain rate range. Their analysis
indicated that the deformation at high strain rates of 1000 s-1 is proceeded by dislocation
glide and twinning. The latter was even observed at elevated temperatures.
The goal of this study is to investigate the high-temperature deformation behaviour
of the AZ31 alloy by compression tests over the strain rate range from 0.010 to 100 s-1,
with the aim of determining the influence of strain rate on the flow behaviour,
microstructure, and texture evolution.
Detailed microstructure and texture examination by EBSD was carried out in
selected samples in order to clarify the predominant deformation and recrystallization
mechanisms at different strain rates.
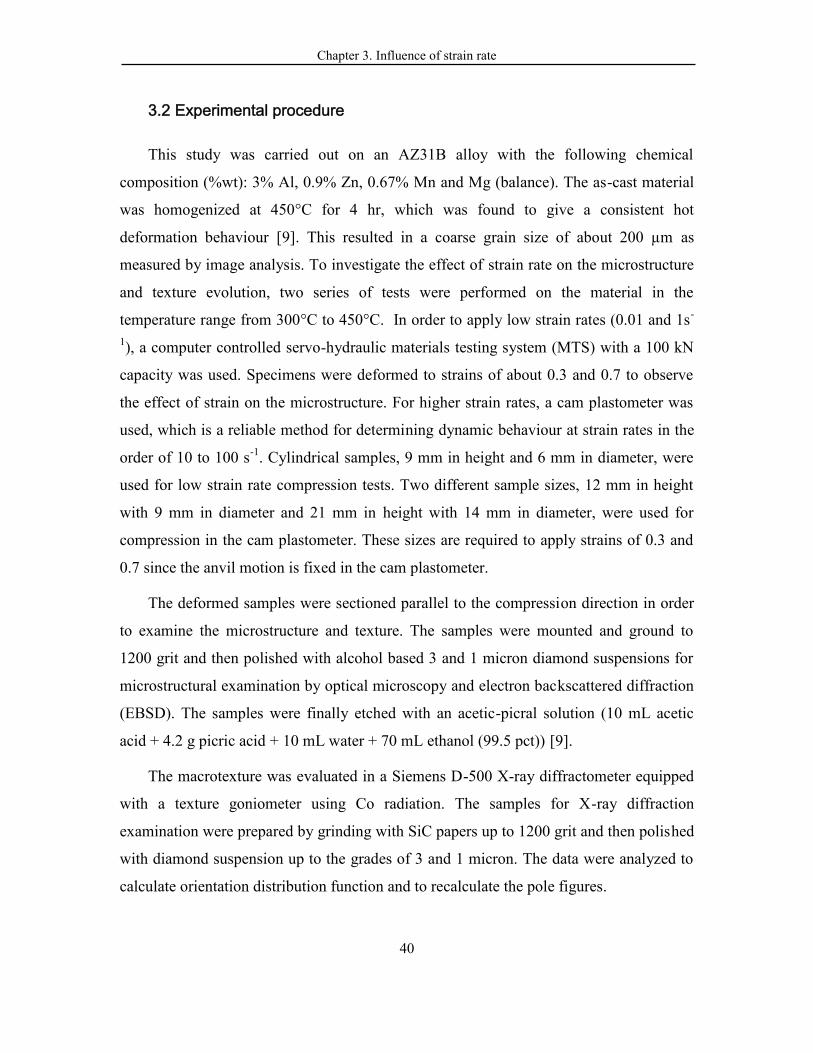
Chapter 3. Influence of strain rate
40
3.2 Experimental procedure
This study was carried out on an AZ31B alloy with the following chemical
composition (%wt): 3% Al, 0.9% Zn, 0.67% Mn and Mg (balance). The as-cast material
was homogenized at 450°C for 4 hr, which was found to give a consistent hot
deformation behaviour [9]. This resulted in a coarse grain size of about 200 µm as
measured by image analysis. To investigate the effect of strain rate on the microstructure
and texture evolution, two series of tests were performed on the material in the
temperature range from 300°C to 450°C. In order to apply low strain rates (0.01 and 1s-
1), a computer controlled servo-hydraulic materials testing system (MTS) with a 100 kN
capacity was used. Specimens were deformed to strains of about 0.3 and 0.7 to observe
the effect of strain on the microstructure. For higher strain rates, a cam plastometer was
used, which is a reliable method for determining dynamic behaviour at strain rates in the
order of 10 to 100 s-1. Cylindrical samples, 9 mm in height and 6 mm in diameter, were
used for low strain rate compression tests. Two different sample sizes, 12 mm in height
with 9 mm in diameter and 21 mm in height with 14 mm in diameter, were used for
compression in the cam plastometer. These sizes are required to apply strains of 0.3 and
0.7 since the anvil motion is fixed in the cam plastometer.
The deformed samples were sectioned parallel to the compression direction in order
to examine the microstructure and texture. The samples were mounted and ground to
1200 grit and then polished with alcohol based 3 and 1 micron diamond suspensions for
microstructural examination by optical microscopy and electron backscattered diffraction
(EBSD). The samples were finally etched with an acetic-picral solution (10 mL acetic
acid + 4.2 g picric acid + 10 mL water + 70 mL ethanol (99.5 pct)) [9].
The macrotexture was evaluated in a Siemens D-500 X-ray diffractometer equipped
with a texture goniometer using Co radiation. The samples for X-ray diffraction
examination were prepared by grinding with SiC papers up to 1200 grit and then polished
with diamond suspension up to the grades of 3 and 1 micron. The data were analyzed to
calculate orientation distribution function and to recalculate the pole figures.
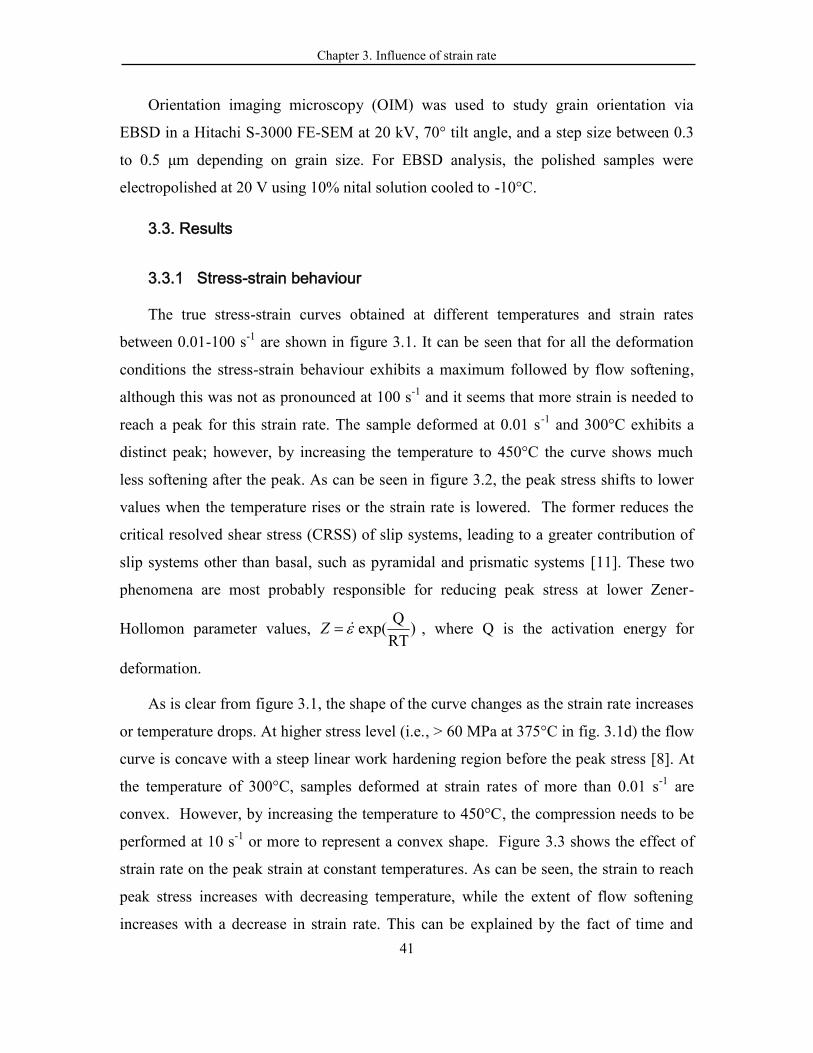
Chapter 3. Influence of strain rate
41
Orientation imaging microscopy (OIM) was used to study grain orientation via
EBSD in a Hitachi S-3000 FE-SEM at 20 kV, 70° tilt angle, and a step size between 0.3
to 0.5 μm depending on grain size. For EBSD analysis, the polished samples were
electropolished at 20 V using 10% nital solution cooled to -10°C.
3.3. Results
3.3.1 Stress-strain behaviour
The true stress-strain curves obtained at different temperatures and strain rates
between 0.01-100 s-1 are shown in figure 3.1. It can be seen that for all the deformation
conditions the stress-strain behaviour exhibits a maximum followed by flow softening,
although this was not as pronounced at 100 s-1 and it seems that more strain is needed to
reach a peak for this strain rate. The sample deformed at 0.01 s-1 and 300°C exhibits a
distinct peak; however, by increasing the temperature to 450°C the curve shows much
less softening after the peak. As can be seen in figure 3.2, the peak stress shifts to lower
values when the temperature rises or the strain rate is lowered. The former reduces the
critical resolved shear stress (CRSS) of slip systems, leading to a greater contribution of
slip systems other than basal, such as pyramidal and prismatic systems [11]. These two
phenomena are most probably responsible for reducing peak stress at lower Zener-
Hollomon parameter values, )RTQexp(Z , where Q is the activation energy for
deformation.
As is clear from figure 3.1, the shape of the curve changes as the strain rate increases
or temperature drops. At higher stress level (i.e., > 60 MPa at 375°C in fig. 3.1d) the flow
curve is concave with a steep linear work hardening region before the peak stress [8]. At
the temperature of 300°C, samples deformed at strain rates of more than 0.01 s-1 are
convex. However, by increasing the temperature to 450°C, the compression needs to be
performed at 10 s-1 or more to represent a convex shape. Figure 3.3 shows the effect of
strain rate on the peak strain at constant temperatures. As can be seen, the strain to reach
peak stress increases with decreasing temperature, while the extent of flow softening
increases with a decrease in strain rate. This can be explained by the fact of time and
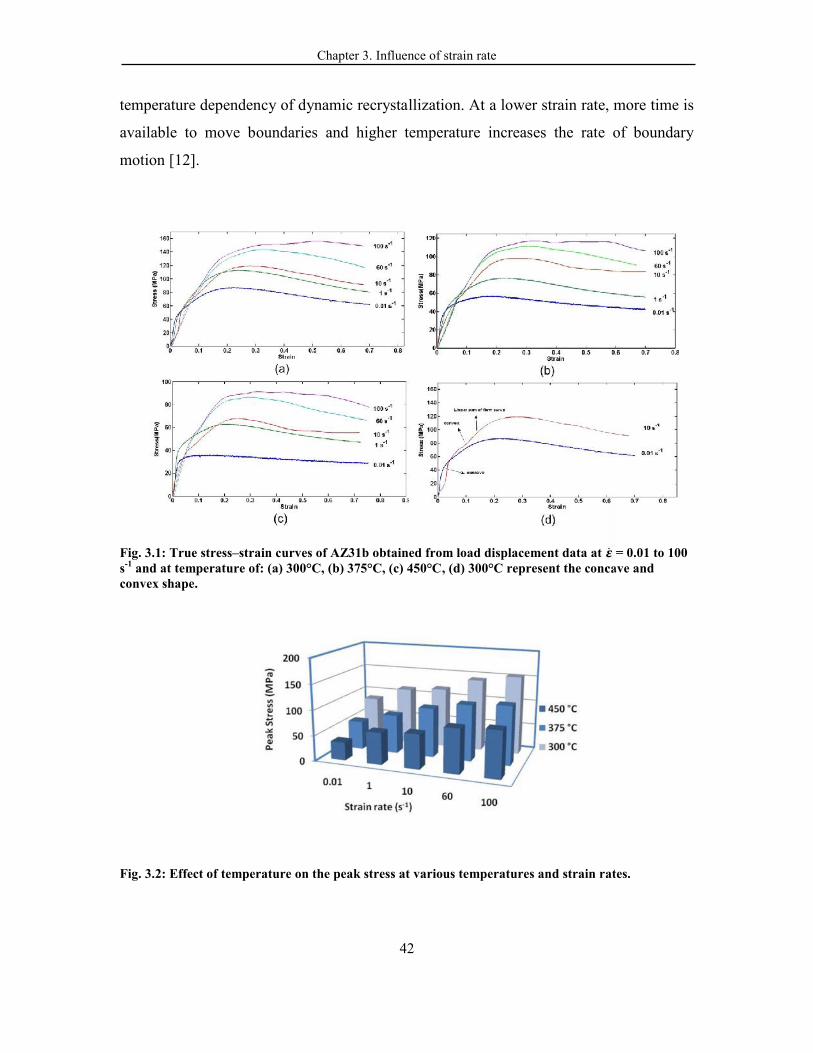
Chapter 3. Influence of strain rate
42
temperature dependency of dynamic recrystallization. At a lower strain rate, more time is
available to move boundaries and higher temperature increases the rate of boundary
motion [12].
Fig. 3.1: True stress–strain curves of AZ31b obtained from load displacement data at ̇ = 0.01 to 100s-1 and at temperature of: (a) 300°C, (b) 375°C, (c) 450°C, (d) 300°C represent the concave andconvex shape.
Fig. 3.2: Effect of temperature on the peak stress at various temperatures and strain rates.

Chapter 3. Influence of strain rate
43
3.3.2 Constitutive behaviour
In the case of Mg alloys, the dependence of on temperature (T) and strain rate ( )
during high-temperature deformation can be expressed using the following power-law
equation [13]:
(1))RTQexp(-σCε n
1
where Q is the effective activation energy, R is the gas constant, and C1 and n are
material constants.
A hyperbolic sine equation was suggested by McQueen [14] for AZ31 to express the
combined effect of temperature and strain rate on the peak flow stress:
(2))RTQexp(-)(sinh n
2 C
where is a constant of the order of 0.05 MPa -1. In this work, both equations are
used and the values of the constants are extracted.
3.3.3 Power-law equation:
The value of n at a constant strain and temperature can be estimated by the following
equation:
(3)loglog1
Tn
If the peak stress or the steady-state flows are considered, the condition of the
constant strain does not need to be considered in the estimation of n in Eq. (3).
For the calculation of activation energy, the following Eq. 4 was derived:
(4)1log
log
T
nRQ
Chapter 3. Influence of strain rate
44
Figures 3.4(a) and (b) show the variation in ln peak vs ln and ln peak vs 1000/T,
which are calculated using Eqs. (3) and (4), respectively. The peak stresses are used from
the data illustrated in figure 3.2. An average value of 13.3 is obtained for n, which is
higher than the typical value of n (i.e., 7) [6, 15]. It was reported that a high value of the
stress exponent could be as a result of the presence of fine oxides in the specimens [16].
As can be seen in figure 3.4, the slope of the linearly fitted line changes with increasing
temperature, which can be indicative of a change in the deformation mechanism.
The average value of Q/n obtained from the data in figure 3.4(b) is 12.15 kJ/mol. This value
yields the average effective activation energy of 162 kJ/mol.
Barnett et al. [17] suggested that the influence of deformation mode and texture on
flow stress at low strains is reduced at higher strains where the steady-state flow stress is
approached. The above calculations were, therefore, repeated at the strain of 0.6, which
seems to be the onset of the steady state regime. The value for the activation energy and
stress exponent calculated at the strain of 0.6 are 143 kJ/mol and 11.3, respectively.
The average value of 162 kJ/mol is larger than that of Mg self-diffusion (Qsd=135
kJ/mol), Al diffusion in Mg (143 kJ/mol), and creep (140 kJ/mol) [18]. Two mechanisms
have been suggested for the larger value of activation energy. The first one is that the cross-
slip of screw dislocation from the basal to the prismatic planes overcomes the constriction energy
of 160 kJ/mol. The second mechanism is that the deformation is controlled by dislocation
climb rather than diffusion due to its large grain size and high strain rate deformation
specially at lower strain [19].
Fig. 3.3: The effect of strain rate on the peak strain of AZ31 at different temperatures.
10-2
10-1
100
101
1020
0.2
0.4
0.6
PeakStrain
Strain Rate (s-1)
300 C370 C450 C
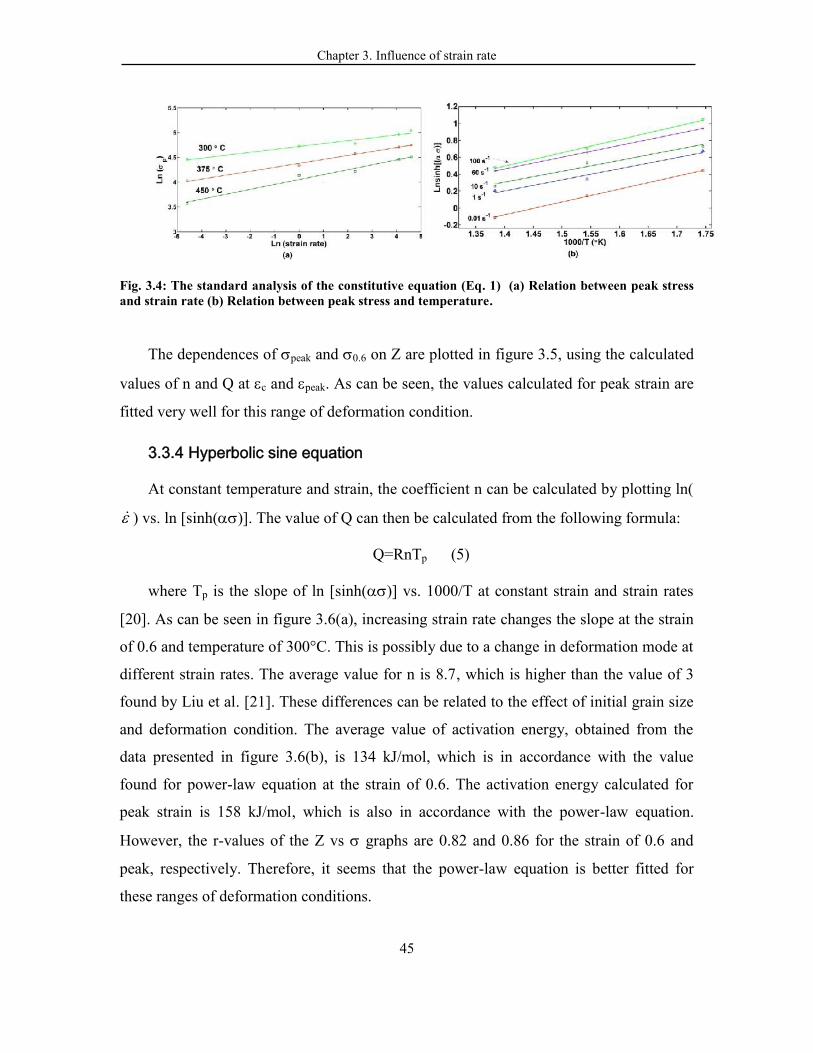
Chapter 3. Influence of strain rate
45
Fig. 3.4: The standard analysis of the constitutive equation (Eq. 1) (a) Relation between peak stressand strain rate (b) Relation between peak stress and temperature.
The dependences of peak and 0.6 on Z are plotted in figure 3.5, using the calculated
values of n and Q at c and peak. As can be seen, the values calculated for peak strain are
fitted very well for this range of deformation condition.
3.3.4 Hyperbolic sine equation
At constant temperature and strain, the coefficient n can be calculated by plotting ln(
) vs. ln [sinh()]. The value of Q can then be calculated from the following formula:
Q=RnTp (5)
where Tp is the slope of ln [sinh()] vs. 1000/T at constant strain and strain rates
[20]. As can be seen in figure 3.6(a), increasing strain rate changes the slope at the strain
of 0.6 and temperature of 300°C. This is possibly due to a change in deformation mode at
different strain rates. The average value for n is 8.7, which is higher than the value of 3
found by Liu et al. [21]. These differences can be related to the effect of initial grain size
and deformation condition. The average value of activation energy, obtained from the
data presented in figure 3.6(b), is 134 kJ/mol, which is in accordance with the value
found for power-law equation at the strain of 0.6. The activation energy calculated for
peak strain is 158 kJ/mol, which is also in accordance with the power-law equation.
However, the r-values of the Z vs graphs are 0.82 and 0.86 for the strain of 0.6 and
peak, respectively. Therefore, it seems that the power-law equation is better fitted for
these ranges of deformation conditions.

Chapter 3. Influence of strain rate
46
Fig. 3.5: The influence of the Zener–Hollomon parameter, Z, on the peak flow stress for the hotdeformation of magnesium alloy at peak strain and strain of 0.5 using calculated activation energy.
Fig. 3.6: The standard analysis of the constitutive equation (Eq. 2) (a) Relation between peak stressand strain rate (b) Relation between peak stress and temperature.
3.3.5 Microstructural characterization
The effects of strain rate on the microstructure of samples compressed to the strain of
0.3 at 375°C are shown in figure 3.7. At the strain rate of 0.01s-1, the recrystallized
grains can be found along the initial grain boundaries. At strain rate of 1s-1, some twins
can be seen in the microstructure; however, most of grains are still nucleated at grain
boundaries. At the higher strain rate of 10 s-1, new fine grains are observable within
twins, and by increasing the strain rate to 60 1s-1, the recrystallized grain size is
increased. At the strain rate of 100 s-1, the microstructure is almost fully recrystallized.
As can be seen figure 3.7f, the recrystallized volume fraction is considerably lower at the
low strain rates of 0.01 s-1 and 1 s-1.
108 1010 1012 1014 1016 101820
40
60
80
100
120
140
160
180
Z (s-1)
(MPa)
= cy=6.5864 x0.0823
R2=0.963
=0.6y=6.4253 x0.0881
R2=0.8742
Chapter 3. Influence of strain rate
47
As shown by the arrows in figure 3.7d, the original large as-cast grains are divided
by twins, and then DRX occurs on these twins. This indicates that the twins can act as
nucleation sites for DRX.
The effect of temperature on the microstructure at constant strain rate of 10 s-1 is
shown in figure 3.8. Twins can be observed at temperatures of 300°C and 375°C;
however, no twinning can be found at 450°C in the deformed microstructure consisting
of fine and nearly uniform equiaxed grains (as shown in fig. 3.8c). The DRX volume
fraction is also increased, as can be seen in figure 3.8d.
At a larger strain of 0.7 (fig. 3.9), DRX occurs inside parent grains and the volume
fraction of DRX grains increases. At the strain rate of 0.01 s-1 and strain of 0.7 (fig. 3.9a),
multiple new layers of fine grains are nucleated at the grain boundaries. In general, it can
be seen that there are distinct bimodal structures consisting of a fraction of the original
deformed grains with a fraction of newly developed grains. With increasing strain rate at
a constant temperature of 375°C to 1 s-1, the DRX volume fraction increases and it seems
that DRX also occurs on some twins. Some regions without DRX still can be found at a
strain rate of 10 and 60 s-1. In these regions, DRX is hard to initiate so “island”
microstructures form in the microstructure. At a strain rate of 100 s-1, the microstructure
is almost entirely recrystallized. The recrystallized grain size reduces when the strain rate
increases from 10 to 100 s-1.
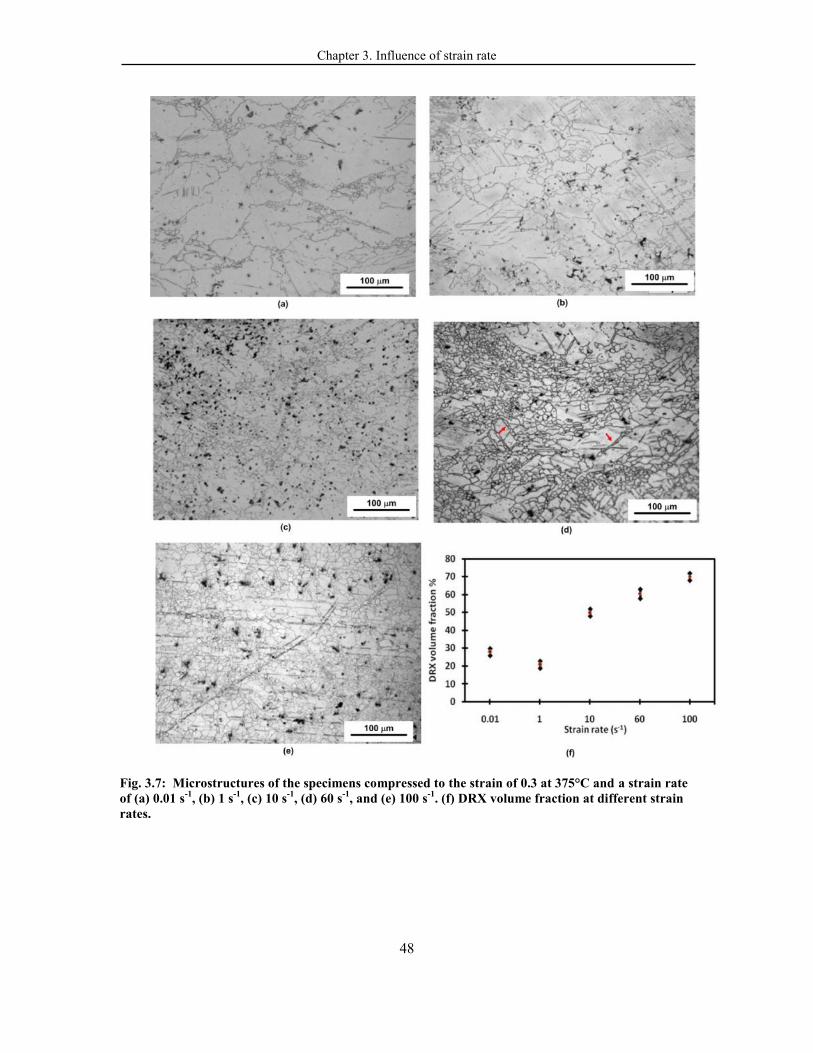
Chapter 3. Influence of strain rate
48
Fig. 3.7: Microstructures of the specimens compressed to the strain of 0.3 at 375°C and a strain rateof (a) 0.01 s-1, (b) 1 s-1, (c) 10 s-1, (d) 60 s-1, and (e) 100 s-1. (f) DRX volume fraction at different strainrates.
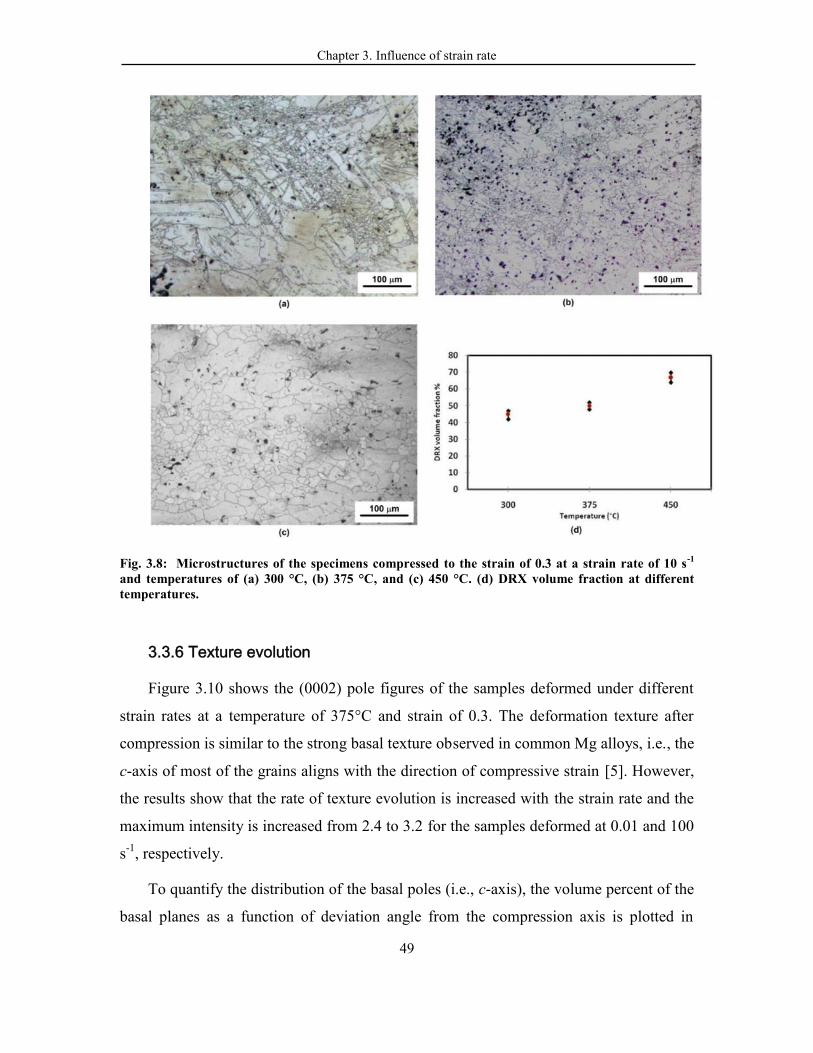
Chapter 3. Influence of strain rate
49
Fig. 3.8: Microstructures of the specimens compressed to the strain of 0.3 at a strain rate of 10 s-1
and temperatures of (a) 300 °C, (b) 375 °C, and (c) 450 °C. (d) DRX volume fraction at differenttemperatures.
3.3.6 Texture evolution
Figure 3.10 shows the (0002) pole figures of the samples deformed under different
strain rates at a temperature of 375°C and strain of 0.3. The deformation texture after
compression is similar to the strong basal texture observed in common Mg alloys, i.e., the
c-axis of most of the grains aligns with the direction of compressive strain [5]. However,
the results show that the rate of texture evolution is increased with the strain rate and the
maximum intensity is increased from 2.4 to 3.2 for the samples deformed at 0.01 and 100
s-1, respectively.
To quantify the distribution of the basal poles (i.e., c-axis), the volume percent of the
basal planes as a function of deviation angle from the compression axis is plotted in
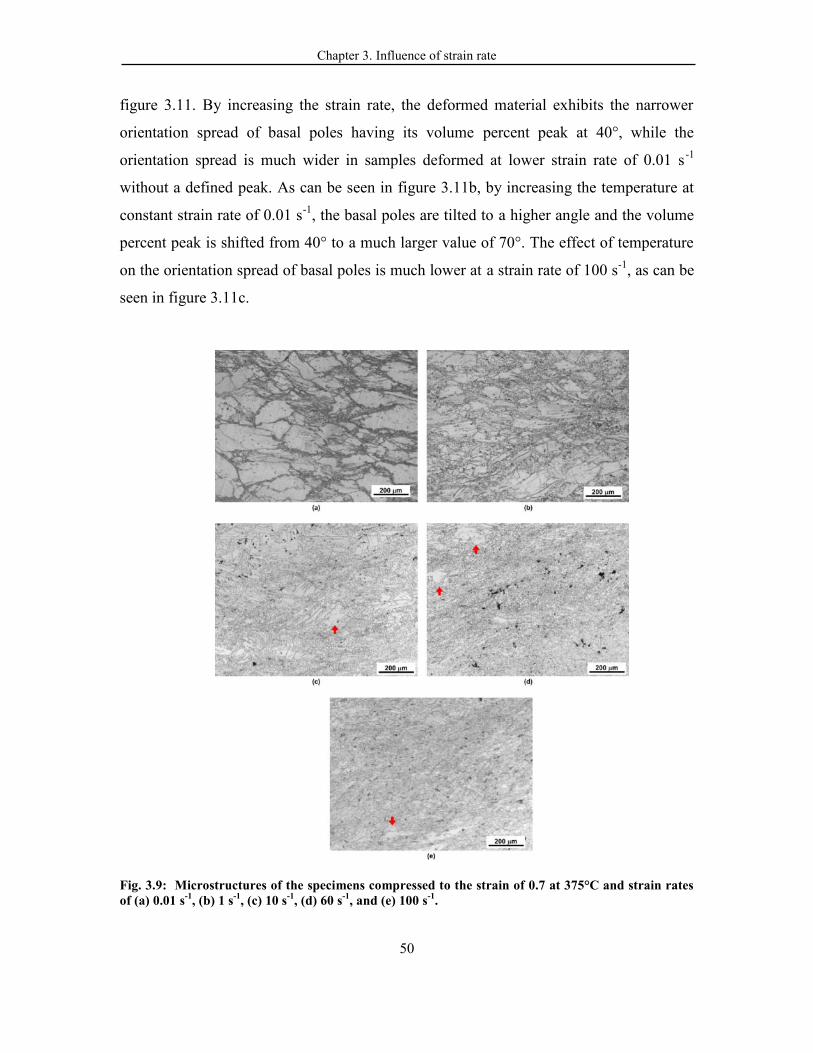
Chapter 3. Influence of strain rate
50
figure 3.11. By increasing the strain rate, the deformed material exhibits the narrower
orientation spread of basal poles having its volume percent peak at 40°, while the
orientation spread is much wider in samples deformed at lower strain rate of 0.01 s -1
without a defined peak. As can be seen in figure 3.11b, by increasing the temperature at
constant strain rate of 0.01 s-1, the basal poles are tilted to a higher angle and the volume
percent peak is shifted from 40° to a much larger value of 70°. The effect of temperature
on the orientation spread of basal poles is much lower at a strain rate of 100 s-1, as can be
seen in figure 3.11c.
Fig. 3.9: Microstructures of the specimens compressed to the strain of 0.7 at 375°C and strain ratesof (a) 0.01 s-1, (b) 1 s-1, (c) 10 s-1, (d) 60 s-1, and (e) 100 s-1.
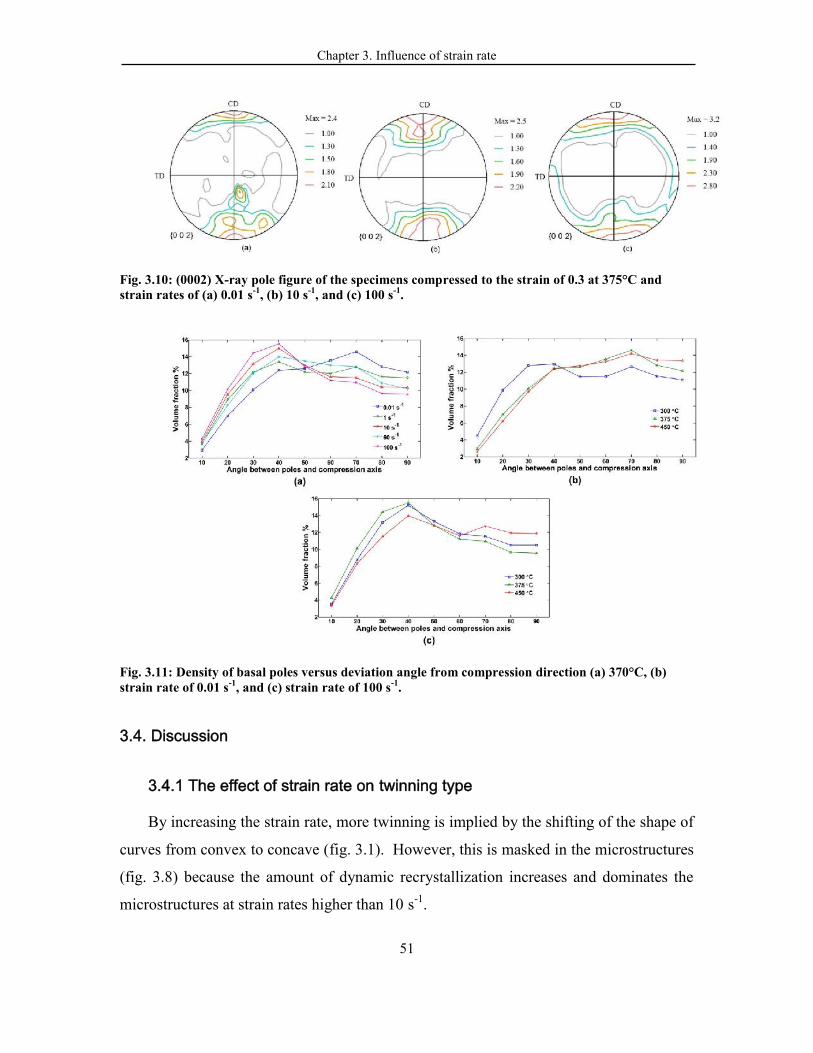
Chapter 3. Influence of strain rate
51
Fig. 3.10: (0002) X-ray pole figure of the specimens compressed to the strain of 0.3 at 375°C andstrain rates of (a) 0.01 s-1, (b) 10 s-1, and (c) 100 s-1.
Fig. 3.11: Density of basal poles versus deviation angle from compression direction (a) 370°C, (b)strain rate of 0.01 s-1, and (c) strain rate of 100 s-1.
3.4. Discussion
3.4.1 The effect of strain rate on twinning type
By increasing the strain rate, more twinning is implied by the shifting of the shape of
curves from convex to concave (fig. 3.1). However, this is masked in the microstructures
(fig. 3.8) because the amount of dynamic recrystallization increases and dominates the
microstructures at strain rates higher than 10 s-1.
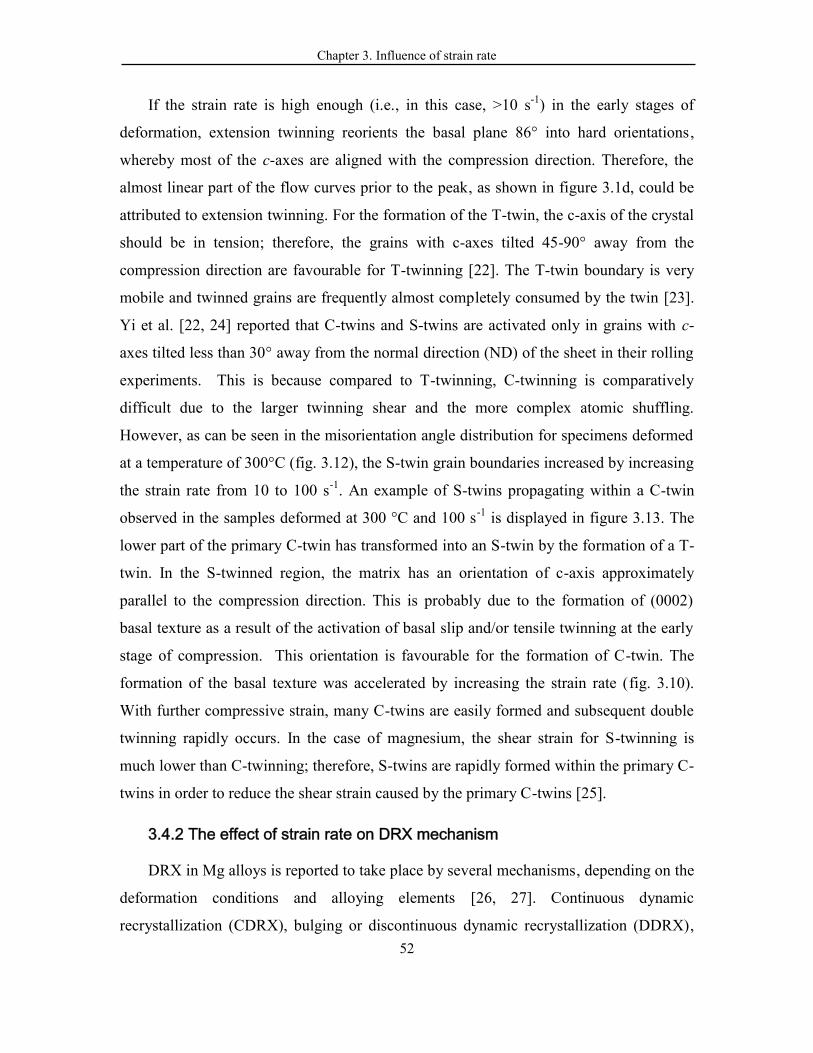
Chapter 3. Influence of strain rate
52
If the strain rate is high enough (i.e., in this case, >10 s-1) in the early stages of
deformation, extension twinning reorients the basal plane 86° into hard orientations,
whereby most of the c-axes are aligned with the compression direction. Therefore, the
almost linear part of the flow curves prior to the peak, as shown in figure 3.1d, could be
attributed to extension twinning. For the formation of the T-twin, the c-axis of the crystal
should be in tension; therefore, the grains with c-axes tilted 45-90° away from the
compression direction are favourable for T-twinning [22]. The T-twin boundary is very
mobile and twinned grains are frequently almost completely consumed by the twin [23].
Yi et al. [22, 24] reported that C-twins and S-twins are activated only in grains with c-
axes tilted less than 30° away from the normal direction (ND) of the sheet in their rolling
experiments. This is because compared to T-twinning, C-twinning is comparatively
difficult due to the larger twinning shear and the more complex atomic shuffling.
However, as can be seen in the misorientation angle distribution for specimens deformed
at a temperature of 300°C (fig. 3.12), the S-twin grain boundaries increased by increasing
the strain rate from 10 to 100 s-1. An example of S-twins propagating within a C-twin
observed in the samples deformed at 300 °C and 100 s-1 is displayed in figure 3.13. The
lower part of the primary C-twin has transformed into an S-twin by the formation of a T-
twin. In the S-twinned region, the matrix has an orientation of c-axis approximately
parallel to the compression direction. This is probably due to the formation of (0002)
basal texture as a result of the activation of basal slip and/or tensile twinning at the early
stage of compression. This orientation is favourable for the formation of C-twin. The
formation of the basal texture was accelerated by increasing the strain rate (fig. 3.10).
With further compressive strain, many C-twins are easily formed and subsequent double
twinning rapidly occurs. In the case of magnesium, the shear strain for S-twinning is
much lower than C-twinning; therefore, S-twins are rapidly formed within the primary C-
twins in order to reduce the shear strain caused by the primary C-twins [25].
3.4.2 The effect of strain rate on DRX mechanism
DRX in Mg alloys is reported to take place by several mechanisms, depending on the
deformation conditions and alloying elements [26, 27]. Continuous dynamic
recrystallization (CDRX), bulging or discontinuous dynamic recrystallization (DDRX),
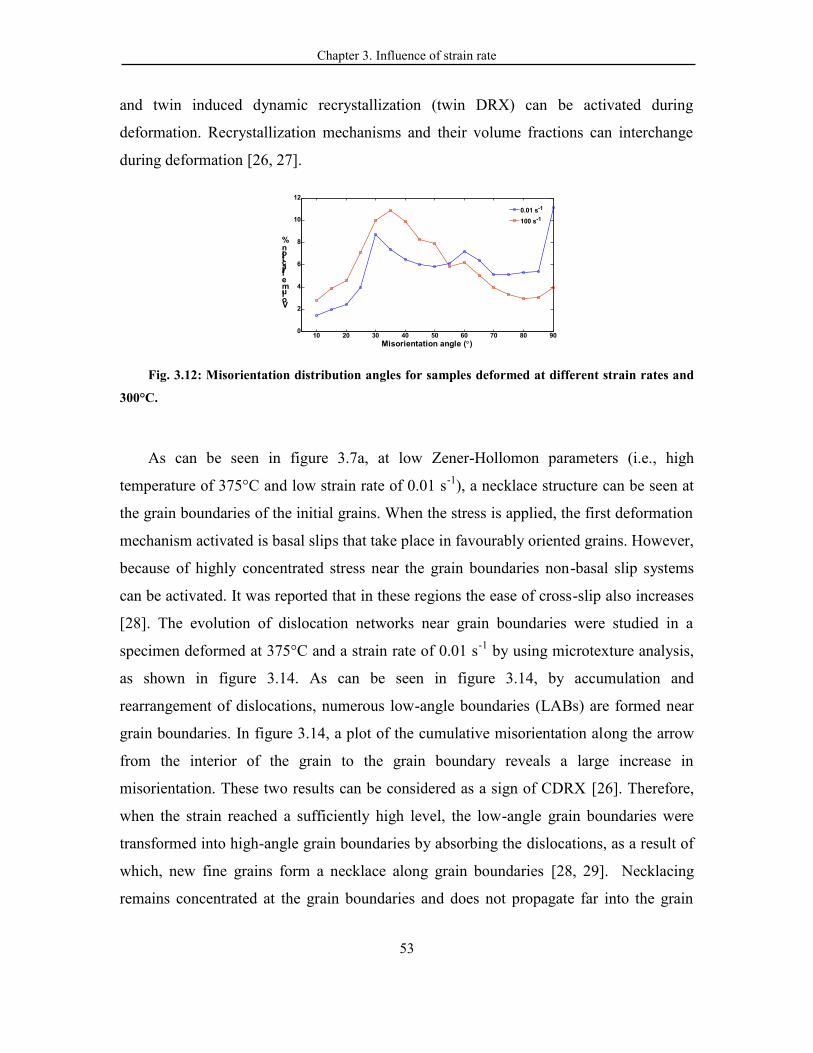
Chapter 3. Influence of strain rate
53
and twin induced dynamic recrystallization (twin DRX) can be activated during
deformation. Recrystallization mechanisms and their volume fractions can interchange
during deformation [26, 27].
Fig. 3.12: Misorientation distribution angles for samples deformed at different strain rates and
300°C.
As can be seen in figure 3.7a, at low Zener-Hollomon parameters (i.e., high
temperature of 375°C and low strain rate of 0.01 s-1), a necklace structure can be seen at
the grain boundaries of the initial grains. When the stress is applied, the first deformation
mechanism activated is basal slips that take place in favourably oriented grains. However,
because of highly concentrated stress near the grain boundaries non-basal slip systems
can be activated. It was reported that in these regions the ease of cross-slip also increases
[28]. The evolution of dislocation networks near grain boundaries were studied in a
specimen deformed at 375°C and a strain rate of 0.01 s-1 by using microtexture analysis,
as shown in figure 3.14. As can be seen in figure 3.14, by accumulation and
rearrangement of dislocations, numerous low-angle boundaries (LABs) are formed near
grain boundaries. In figure 3.14, a plot of the cumulative misorientation along the arrow
from the interior of the grain to the grain boundary reveals a large increase in
misorientation. These two results can be considered as a sign of CDRX [26]. Therefore,
when the strain reached a sufficiently high level, the low-angle grain boundaries were
transformed into high-angle grain boundaries by absorbing the dislocations, as a result of
which, new fine grains form a necklace along grain boundaries [28, 29]. Necklacing
remains concentrated at the grain boundaries and does not propagate far into the grain
10 20 30 40 50 60 70 80 900
2
4
6
8
10
12
Misorientation angle ()
Volumefraction%
0.01 s-1
100 s-1
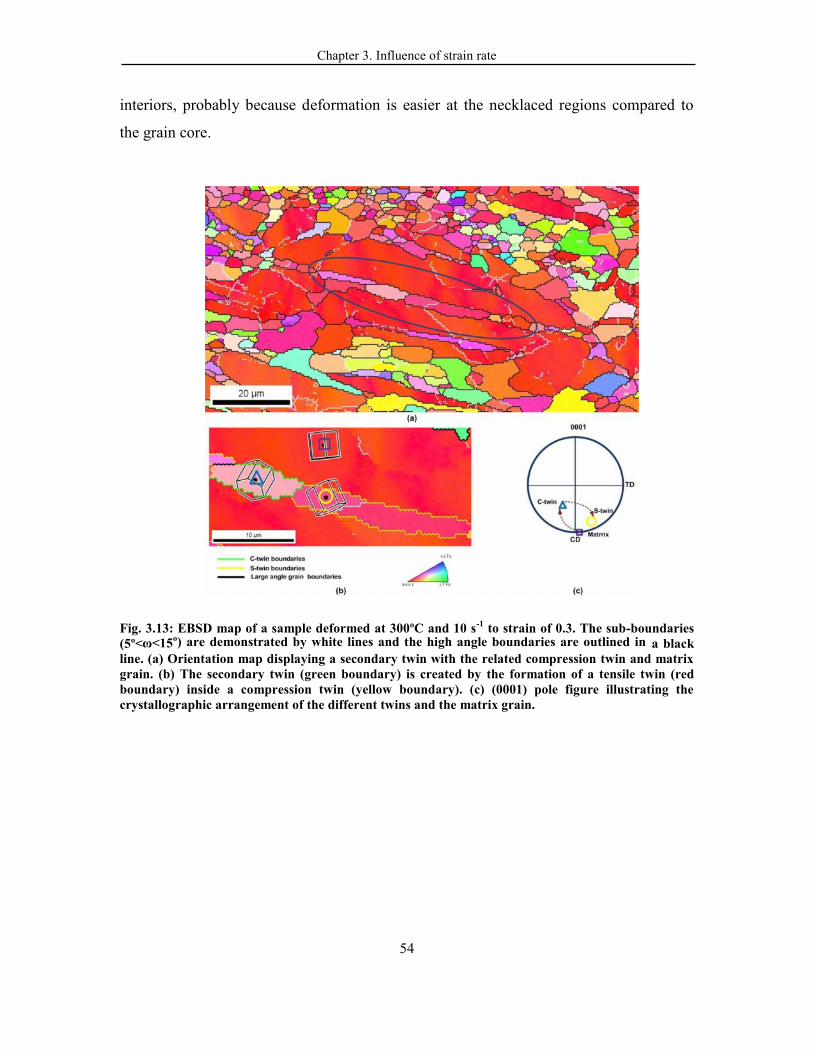
Chapter 3. Influence of strain rate
54
interiors, probably because deformation is easier at the necklaced regions compared to
the grain core.
Fig. 3.13: EBSD map of a sample deformed at 300ºC and 10 s-1 to strain of 0.3. The sub-boundaries(5º<ω<15º) are demonstrated by white lines and the high angle boundaries are outlined in a blackline. (a) Orientation map displaying a secondary twin with the related compression twin and matrixgrain. (b) The secondary twin (green boundary) is created by the formation of a tensile twin (redboundary) inside a compression twin (yellow boundary). (c) (0001) pole figure illustrating thecrystallographic arrangement of the different twins and the matrix grain.
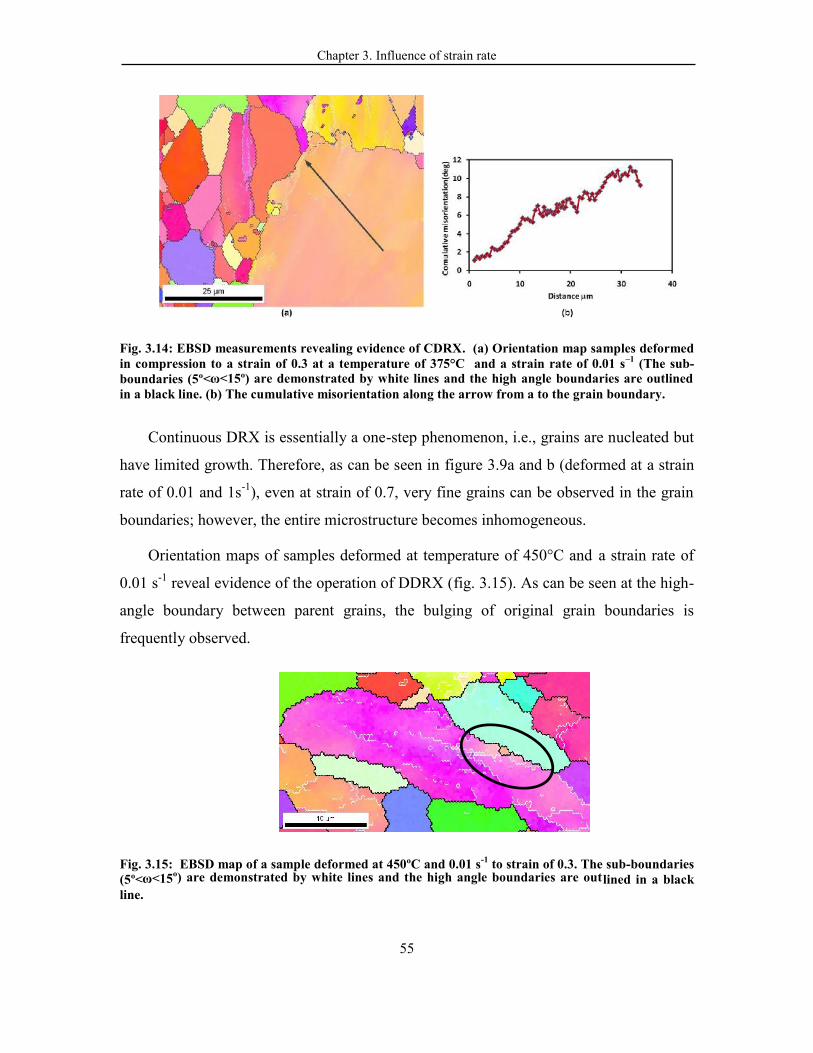
Chapter 3. Influence of strain rate
55
Fig. 3.14: EBSD measurements revealing evidence of CDRX. (a) Orientation map samples deformedin compression to a strain of 0.3 at a temperature of 375°C and a strain rate of 0.01 s–1 (The sub-boundaries (5º<ω<15º) are demonstrated by white lines and the high angle boundaries are outlinedin a black line. (b) The cumulative misorientation along the arrow from a to the grain boundary.
Continuous DRX is essentially a one-step phenomenon, i.e., grains are nucleated but
have limited growth. Therefore, as can be seen in figure 3.9a and b (deformed at a strain
rate of 0.01 and 1s-1), even at strain of 0.7, very fine grains can be observed in the grain
boundaries; however, the entire microstructure becomes inhomogeneous.
Orientation maps of samples deformed at temperature of 450°C and a strain rate of
0.01 s-1 reveal evidence of the operation of DDRX (fig. 3.15). As can be seen at the high-
angle boundary between parent grains, the bulging of original grain boundaries is
frequently observed.
Fig. 3.15: EBSD map of a sample deformed at 450ºC and 0.01 s-1 to strain of 0.3. The sub-boundaries(5º<ω<15º) are demonstrated by white lines and the high angle boundaries are outlined in a blackline.
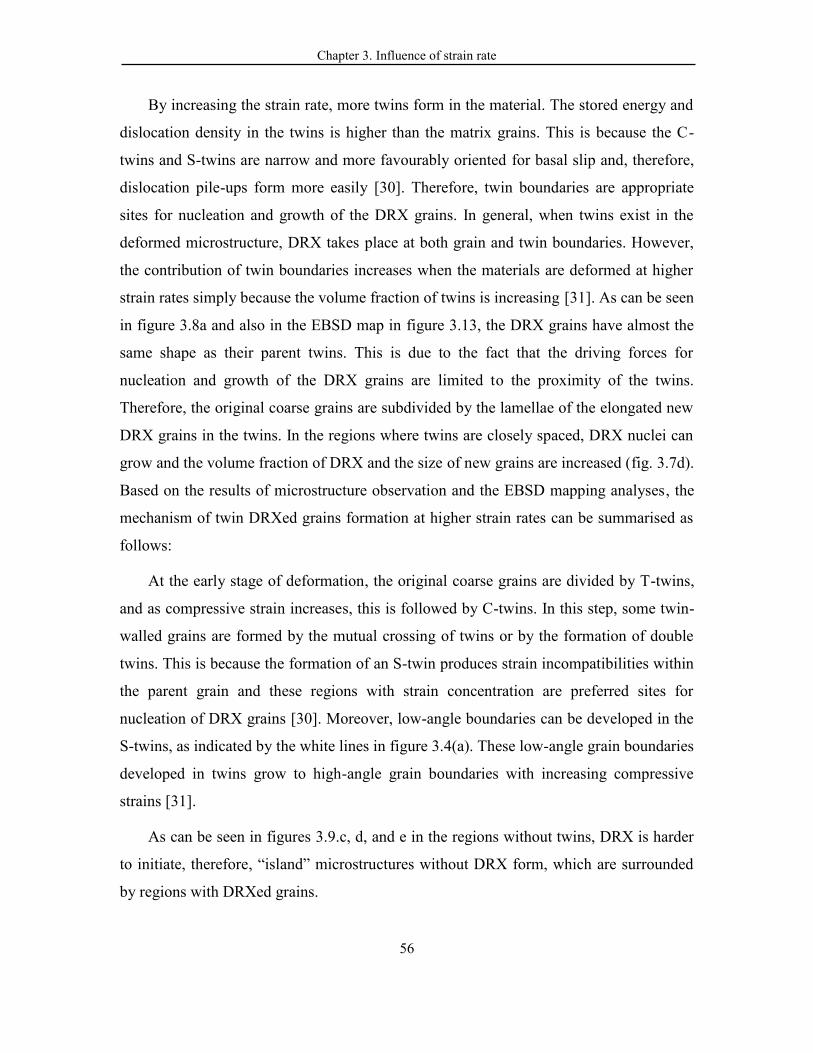
Chapter 3. Influence of strain rate
56
By increasing the strain rate, more twins form in the material. The stored energy and
dislocation density in the twins is higher than the matrix grains. This is because the C-
twins and S-twins are narrow and more favourably oriented for basal slip and, therefore,
dislocation pile-ups form more easily [30]. Therefore, twin boundaries are appropriate
sites for nucleation and growth of the DRX grains. In general, when twins exist in the
deformed microstructure, DRX takes place at both grain and twin boundaries. However,
the contribution of twin boundaries increases when the materials are deformed at higher
strain rates simply because the volume fraction of twins is increasing [31]. As can be seen
in figure 3.8a and also in the EBSD map in figure 3.13, the DRX grains have almost the
same shape as their parent twins. This is due to the fact that the driving forces for
nucleation and growth of the DRX grains are limited to the proximity of the twins.
Therefore, the original coarse grains are subdivided by the lamellae of the elongated new
DRX grains in the twins. In the regions where twins are closely spaced, DRX nuclei can
grow and the volume fraction of DRX and the size of new grains are increased (fig. 3.7d).
Based on the results of microstructure observation and the EBSD mapping analyses, the
mechanism of twin DRXed grains formation at higher strain rates can be summarised as
follows:
At the early stage of deformation, the original coarse grains are divided by T-twins,
and as compressive strain increases, this is followed by C-twins. In this step, some twin-
walled grains are formed by the mutual crossing of twins or by the formation of double
twins. This is because the formation of an S-twin produces strain incompatibilities within
the parent grain and these regions with strain concentration are preferred sites for
nucleation of DRX grains [30]. Moreover, low-angle boundaries can be developed in the
S-twins, as indicated by the white lines in figure 3.4(a). These low-angle grain boundaries
developed in twins grow to high-angle grain boundaries with increasing compressive
strains [31].
As can be seen in figures 3.9.c, d, and e in the regions without twins, DRX is harder
to initiate, therefore, “island” microstructures without DRX form, which are surrounded
by regions with DRXed grains.
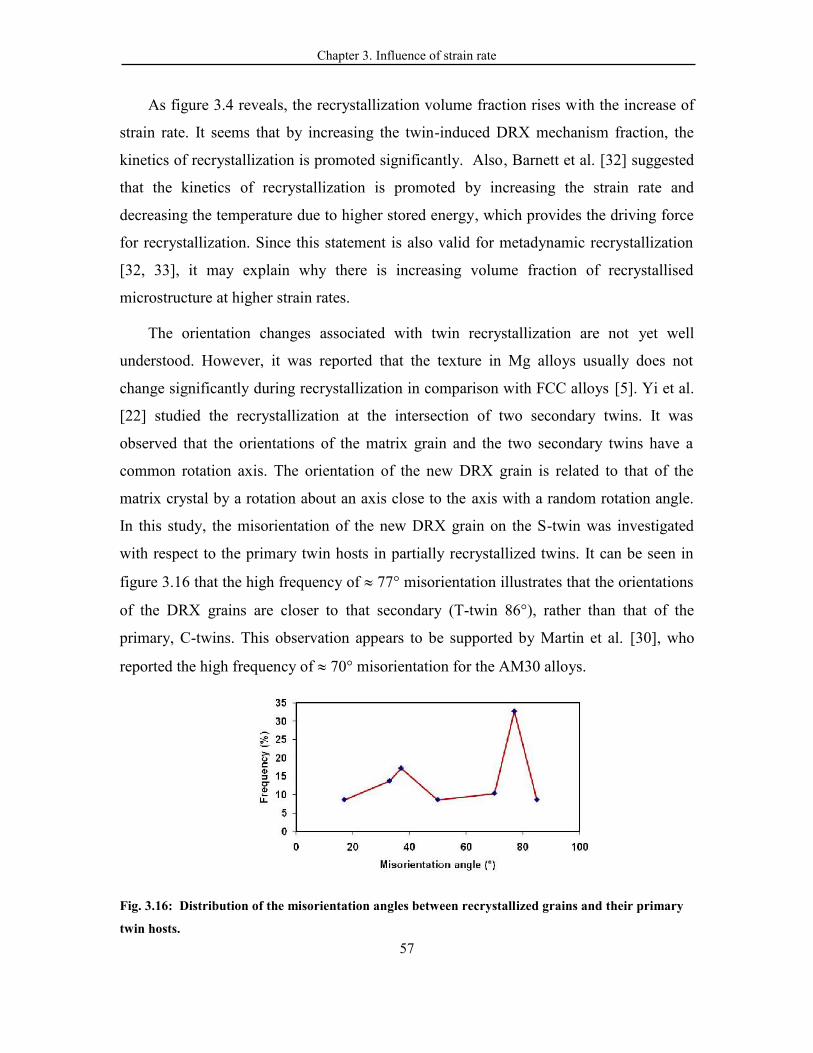
Chapter 3. Influence of strain rate
57
As figure 3.4 reveals, the recrystallization volume fraction rises with the increase of
strain rate. It seems that by increasing the twin-induced DRX mechanism fraction, the
kinetics of recrystallization is promoted significantly. Also, Barnett et al. [32] suggested
that the kinetics of recrystallization is promoted by increasing the strain rate and
decreasing the temperature due to higher stored energy, which provides the driving force
for recrystallization. Since this statement is also valid for metadynamic recrystallization
[32, 33], it may explain why there is increasing volume fraction of recrystallised
microstructure at higher strain rates.
The orientation changes associated with twin recrystallization are not yet well
understood. However, it was reported that the texture in Mg alloys usually does not
change significantly during recrystallization in comparison with FCC alloys [5]. Yi et al.
[22] studied the recrystallization at the intersection of two secondary twins. It was
observed that the orientations of the matrix grain and the two secondary twins have a
common rotation axis. The orientation of the new DRX grain is related to that of the
matrix crystal by a rotation about an axis close to the axis with a random rotation angle.
In this study, the misorientation of the new DRX grain on the S-twin was investigated
with respect to the primary twin hosts in partially recrystallized twins. It can be seen in
figure 3.16 that the high frequency of 77° misorientation illustrates that the orientations
of the DRX grains are closer to that secondary (T-twin 86°), rather than that of the
primary, C-twins. This observation appears to be supported by Martin et al. [30], who
reported the high frequency of 70° misorientation for the AM30 alloys.
Fig. 3.16: Distribution of the misorientation angles between recrystallized grains and their primary
twin hosts.
Chapter 3. Influence of strain rate
58
3.4.3 Texture evolution
The basal intensity is increased by increasing the strain rate at deformation
temperature of 375°C, as can be seen in figure 3.9. This can be due to an increase in the
amount of extension twinning in the early stage of deformation and it leads to the rapid
and complete twinning of the grains that are favourably oriented. Indeed, the orientation
changes produced by twinning are much larger than the reorientations associated with
slip [24].
On the other hand, the c-axis of the T-twin DRX grain is parallel to the compression
stress. Such a grain orientation cannot deform easily and is not favorable for basal slip
because the resolved shear stress is nearly zero. Therefore, these grains are less work
hardened compared with grains with other orientations and relatively resistant to DRX.
However, new grains with other orientations may easily be consumed by repeated DRX.
With deformation progress, more and more grains with their c-axes parallel to
compression stress would survive [34]. Therefore, the basal texture is progressively
strengthened.
3.5 Conclusions
The hot compression flow stress and microstructure evolution of AZ31b alloys at
different temperatures and strain rates were investigated. The following conclusions can
be drawn from the analysis:
1. At the same temperature, with higher strain rates, or under the same strain
rate, but with higher temperatures, DRX is more extensive.
2. At higher strain rates (≥10 s-1), twins form, and since DRX occurs at twins
frequently, this explains why DRX is more extensive at higher strain rates. This
also results in a more homogeneous microstructure.
3. At the early stage of deformation, the T-twins are formed, and with further
compressive strain, many C-twins are formed and subsequent double twin rapidly
occur in these twins. Upon increasing the strain rate, the formation of twins and
Chapter 3. Influence of strain rate
59
subsequent twin-induced DRX intensified the basal texture in the deformed
sample.
4. The average activation energy for deformation of 162 kJ/mol was obtained
for the peak strain of the deformed samples. This is larger than the value for self-
diffusion in Mg.
3.6 References
[1] H.B. M. Avedesian, ASM specialty handbook. Magnesium and magnesium alloys. , ASM International,Materials Park, Ohio, 2000.[2] T. Mukai, Materials Science and Technology, 16 (2000) 1314-1319.[3] S.R. Agnew, O. Duygulu, International Journal of Plasticity, 21 (2005) 1161-1193.[4] Y.Z. Wu, H.G. Yan, J.H. Chen, S.Q. Zhu, B. Su, P.L. Zeng, Materials Science and Engineering A, 527(2010) 3670-3675.[5] T. Al-Samman, G. Gottstein, Materials Science and Engineering A, 490 (2008) 411-420.[6] M.R. Barnett, Journal of Light Metals, 1 (2001) 167-177.[7] S. Spigarelli, M.E. Mehtedi, M. Cabibbo, E. Evangelista, J. Kaneko, A. Jäger, V. Gartnerova, MaterialsScience and Engineering A, 462 (2007) 197-201.[8] B.H. Lee, W. Bang, S. Ahn, C.S. Lee, Metallurgical and Materials Transactions A: Physical Metallurgyand Materials Science, 39 A (2008) 1426-1434.[9] M.T.S. E. Essadiqi, A. Javaid, C. Galvani, K. Spencer, S. Yue, and R. Verna, International Conferenceon Light Metals Technology, Saint-Sauveur, Quebec, Canada, 2007, pp. 177-182.[10] K. Ishikawa, H. Watanabe, T. Mukai, Journal of Materials Science, 40 (2005) 1577-1582.[11] M. Shamsi, M. Sanjari, A.Z. Hanzaki, Materials Science and Technology, 25 (2009) 1039-1045.[12] A.G. Beer, M.R. Barnett, Materials Science and Engineering A, 485 (2008) 318-324.[13] M.F.A. H.J. Frost, Deformation-mechanism maps for metals and alloys first ed., pergamon press,Oxford [Oxfordshire] ; New York, 1982.[14] H.J. McQueen, M. Myshlaev, M. Sauerborn, A. Mwembela, 2000, pp. 355-362.[15] H. Guangjie, W. Lingyun, H. Guangshen, P. Fushen, 2005, pp. 215-218.[16] Q. Guo, H.G. Yan, H. Zhang, Z.H. Chen, Z.F. Wang, Materials Science and Technology, 21 (2005)1349-1354.[17] M.R. Barnett, Z. Keshavarz, A.G. Beer, D. Atwell, Acta Materialia, 52 (2004) 5093-5103.[18] G. Moreau, J.A. Cornet, D. Calais, Journal of Nuclear Materials, 38 (1971) 197-202.[19] S. Spigarelli, M. Cabibbo, E. Evangelista, M. Talianker, V. Ezersky, Materials Science andEngineering A, 289 (2000) 172-181.[20] J.G. Lenard, M. Pietrzyk, L. Cser, The Resistance of the Material to Deformation, Mathematical andPhysical Simulation of the Properties of Hot Rolled Products, Elsevier Science Ltd, Oxford, 1999, pp. 61-84.[21] Y. Liu, X. Wu, Metallurgical and Materials Transactions A: Physical Metallurgy and MaterialsScience, 37 (2006) 7-17.[22] S. Yi, I. Schestakow, S. Zaefferer, Materials Science and Engineering: A, 516 (2009) 58-64.[23] L. Jiang, J.J. Jonas, R.K. Mishra, A.A. Luo, A.K. Sachdev, S. Godet, Acta Materialia, 55 (2007) 3899-3910.[24] S. Godet, L. Jiang, A.A. Luo, J.J. Jonas, Scripta Materialia, 55 (2006) 1055-1058.[25] S.W. Xu, S. Kamado, N. Matsumoto, T. Honma, Y. Kojima, Materials Science and Engineering: A,527 (2009) 52-60.[26] A.G. Beer, M.R. Barnett, Metallurgical and Materials Transactions A: Physical Metallurgy andMaterials Science, 38 (2007) 1856-1867.[27] A. Galiyev, R. Kaibyshev, G. Gottstein, Acta Materialia, 49 (2001) 1199-1207.

Chapter 3. Influence of strain rate
60
[28] S. Spigarelli, M.E. Mehtedi, M. Cabibbo, E. Evangelista, J. Kaneko, A. Jäger, V. Gartnerova,Materials Science and Engineering: A, 462 (2007) 197-201.[29] J.C. Tan, M.J. Tan, Materials Science and Engineering A, 339 (2003) 124-132.[30] É. Martin, J.J. Jonas, Acta Materialia, 58 (2010) 4253-4266.[31] S.W. Xu, N. Matsumoto, S. Kamado, T. Honma, Y. Kojima, Scripta Materialia, 61 (2009) 249-252.[32] A.G. Beer, M.R. Barnett, Materials Science and Engineering: A, 485 (2008) 318-324.[33] A. Mwembela, E.B. Konopleva, H.J. McQueen, Scripta Materialia, 37 (1997) 1789-1795.[34] Q. Jin, S.-Y. Shim, S.-G. Lim, Scripta Materialia, 55 (2006) 843-846.
Chapter 4. Analysis the microstructure and texture evolution
61
Chapter 4
Analysis of the microstructure and texture
evolution during high speed rolling
The results of the previous chapter concerned strain rates up to 100 s-1. In the first
part of this Chapter, strains of about 1000 s-1, are used to determine the influence of this
much higher strain rate on the basic metrics and mechanisms of microstructure and
texture evolution. In order to apply this very high strain rate, a split Hopkinson pressure
bar (SHPB) equipped with induction radiation furnace was used. In the second part, high-
speed rolling of 1000 m/min was employed to roll AZ31 alloy in one pass with 65%
reduction in thickness and the rollability, texture and microstructure were compared with
low-speed rolling (15m/min). The basic mechanisms elucidated from the compression
tests were used to understand the rolling results.
Chapter 4. Analysis the microstructure and texture evolution
62
4.1 A texture and microstructure analysis of high speed
rolling of AZ31 using split Hopkinson pressure bar results
* This section has been published: M. Sanjari, S.A. Farzadfar, H. Utsunomiya, T. Sakai, E. Essadiqi,
S.Yue, A texture and microstructure analysis of high speed rolling of AZ31 using split Hopkinson pressure
bar results, Journal of Materials Science, (2013) 1-17
The present study used very high strain rate uniaxial compression testing to analyze
the microstructure and texture evolution during high speed rolling (HSR) of as-cast
AZ31B alloy. A split Hopkinson pressure bar (SHPB) equipped with an induction
radiation furnace was used to attain a strain rate of 1200s-1 in the temperature range of 25
to 350°C and the result was compared with low strain rate (0.01 s-1) behaviour. As well,
high speed rolling at 500 m/min was employed to successfully roll AZ31 alloy in one
pass with a 71% reduction at 200°C. During rolling, the mill was suddenly stopped and
the sheet was withdrawn from the rolling gap and the microstructure and texture
evolution was observed. Grain boundary misorientation analysis shows that coincident
site lattice (CLS) boundaries related to contraction twins and secondary twins is more
numerous in the samples deformed at a high strain rate. The splitting of basal poles was
observed when strain was increased for both rolling and compression at 200°C, indicating
the activation of more contraction twins and secondary twins compared to low strain rate
deformation. Also, the recrystallized volume fraction increased significantly with strain
rate, probably as a result of increasing the twin-induced recrystallization fraction. On
annealing of the samples compressed at 200°C, secondary twins and their vicinity were
observed to be the preferential sites for nucleation and it seems that rapid recrystallization
on secondary twins contributes to the basal texture weakening. Therefore, an increasing
number of such twins increases the texture weakening.
Chapter 4. Analysis the microstructure and texture evolution
63
4.1.1 Introduction
Nowadays, an understanding of the strain rate dependence of material behaviour is
very important because of the improved and faster manufacturing processes in modern
industry [1, 2]. As well, many engineering components within the aerospace and
automotive industries may be subjected to impact events (e.g., crashes) [3-5]. High strain
rate deformations during the manufacturing processes include high speed machining,
friction stir welding, and high speed rolling [3]. In contrast to cubic materials, high strain
rate deformation of hexagonal materials, such as magnesium, has received relatively little
attention. As magnesium alloys have a hexagonal closed-packed structure, they exhibit
restricted plasticity at low temperatures [6, 7]. Therefore, manufacturing processes such
as rolling and stamping need to be performed at elevated temperatures [6]. This barrier in
the manufacturing process increases the price of magnesium alloy products [8].
However, recent studies have shown that “high speed” rolling (HSR) of AZ31 can be
successfully performed at temperatures around 200C, the temperature at which cracking
takes place in ordinary rolling speed [9, 10]. This is significant because magnesium
sheets cool down rapidly in the roll gap during hot rolling, which is why the current
industrial hot rolling schedule to produce sheet requires inter-pass reheating steps to
maintain hot rollability until the desired gauge is reached [11]. Furthermore, some results
show that the sheets obtained by HSR exhibit a fine-grained microstructure (mean grain
size of 2-3 m) [11, 12], with good mechanical properties [13]. Based on these
advantages, HSR is a promising process to produce high-quality rolled magnesium alloy
sheets at a low cost.
Material response to high speed deformation processes depends on many parameters,
such as deformation temperature, initial microstructure, alloying content, initial texture,
and state of stress [2]. Ishikawa et al. [14] reported that the effect of strain rate is higher
with decreasing temperature of deformation of AZ31. Lee et al. [8] studied the effect of a
wide range of strain rates (0.01 to 10 s-1) at the strain of 0.1. The results showed that the
twinning fraction increases with increases in the strain rate at 300°C.
Chapter 4. Analysis the microstructure and texture evolution
64
Ulacia et al. [15] studied the mechanical behaviour of AZ31 magnesium alloys with
different initial texture at a high strain rate of 1200 s-1 using a Hopkinson test machine
and compared the results with that obtained at a low strain rate. The results showed that
the rate of decrease in the critical resolved shear stress (CRSS) of non-basal systems with
temperature is smaller at high strain rates than those at low strain rates. Also, they found
that, at early stages of deformation, the activation of tensile twinning (T-twinning) is
increased at high strain rates and remains the principal deformation mechanism in
compression tests along the RD even at the very high temperature of 400°C. What is not
clearly available in the literature is the effect of strain rate on the twinning characteristics
and on the texture evolution rate. In addition, the mechanism that makes single pass
large draught rolling possible and the evolution of microstructure and textures during
high speed rolling are not fully understood.
Therefore, the main goal of this research is to correlate the texture and microstructure
evolution during compression tests at low and high strain rates to investigate the
microstructure and texture evolution during HSR. The main approach was to study the
texture and microstructure evolution of HSR from entry to exit in the samples stopped
during the rolling. The texture and microstructure were studied at the plane perpendicular
to the transverse direction in the deformation zone of the withdrawn sheet.
4.1. 2. Experiments
4. 1.2.1 Mechanical testing
A complete testing schedule was performed in order to compare the mechanical
behaviour of the AZ31B at dynamic strain rate (1200 s-1) and low strain rates (0.01 s-1).
This study was carried out on an AZ31 alloy with the following composition in weight
percent: 3% Al, 0.9% Zn, 0.67% Mn and Mg (balance). The as-cast material was
homogenized at 450°C for 4 hr, which has been found to give a consistent hot
deformation behaviour. This resulted in a coarse grain size of about 200 µm, as measured
by image analysis. To investigate the effect of strain rate on the microstructure and
texture evolution, two series of tests were performed on the material in the temperature
Chapter 4. Analysis the microstructure and texture evolution
65
range of 150°C to 350°C. In order to apply low strain rates (0.01 s-1), a computer
controlled servo-hydraulic materials testing system (MTS) with a 100 kN capacity was
used. For very high strain rates, a split Hopkinson pressure bar (SHPB) was used, which
is a reliable method for determining dynamic behaviour at strain rates in the order of 200
to 2000s-1. In the SHPB machine, incident and transmitting bars are instrumented with
strain gauges, which register the elastic strain in the bars during propagation of elastic
longitudinal waves [16]. The voltage history for the duration of the test was recorded
using a digital oscilloscope connected to the gages. The recorded voltages from the test
are converted into their respective microstrains to determine the force and displacement
history in the specimen. More details can be found in reference [17]. In this study, the
applied strain rate was 1200 s-1. Cylindrical samples with 6 mm height and 6 mm
diameter were used for all of the compression tests. The deformed samples were
sectioned through the longitudinal direction in order to examine microstructure and the
texture.
4.1.2.2 Rolling experiments
For HSR, a two-high laboratory rolling mill with 530 mm rolls was used to perform
a single pass with different reduction and various rolling speeds that can be changed from
200 m/min to 2600 m/min. The specimens were quenched approximately 7 ms after
rolling by a water spray attached closely to the exit of the mill. More details about the
HSR experiments can be found in the previous works [10].
Commercial 2.5 mm thick AZ31B (Mg-3%Al-1%Zn-0.4%Mn) annealed sheets
produced by Magnesium Elektron North America, Inc. were received. Specimens 30 mm
in width and 300 mm in length were cut from the sheets and subjected to the rolling
experiment. The initial microstructure was comprised of equiaxed grains with a mean
grain size of 18 µm. The grain size was inhomogeneously distributed ranging from 10 to
50 µm.
Prior to the rolling, a specimen was held for 15 min at 200°C in an electronic tube
furnace, then supplied to the mill through the pinch roller. The rolling was conducted in a
single-pass operation with a reduction in thickness of 71%. The peripheral speed of the
Chapter 4. Analysis the microstructure and texture evolution
66
rolls was 500 m/min. The average estimated strain rate during 71% rolling is 4.9 × 10² s-
1. The rolls were neither heated nor lubricated. The rotating rolls were stopped during
rolling and the specimen in the roll gap was rapidly cooled down by the cold (room
temperature) rolls that were in contact with the specimen, whereas the part of the
specimen that had exited the rolls was quenched by a water spray attached close to the
exit of the mill.
Microstructures on the longitudinal section (TD plane) were observed by an optical
microscope. EBSP measurements were performed by FE-SEM also on the TD plane.
4.1.2.3 Material characterization
For microstructural examination by optical microscopy, the samples were mounted
and ground to 1200 grit and then polished with alcohol based 3 and 1 micron diamond
suspensions. The samples were finally etched with acetic picral solution (10 mL acetic
acid + 4.2 g picric acid + 10 mL water + 70 mL ethanol (99.5 pct)).
For texture analysis, the Siemens D-500 X-ray diffractometer equipped with texture
Goniometer using Co radiation was utilized. The samples for X-ray diffraction
examination were also prepared by grinding with SiC papers up to 1200 grit and then
polishing with diamond suspension up to the grades of 3 and 1 micron. The data were
analyzed to calculate the orientation distribution function and to recalculate the pole
figures.
Orientation imaging microscopy (OIM) was used to study grain orientation via
EBSD in a Hitachi S-3000 FE-SEM at 20 kV, 70° tilt angle, and a step size between 0.3
to 0.5 μm, depending on the deformation condition. For EBSD analysis, the polished
samples were electropolished at 20 V, using 10% nital solutions cooled to -10 to -30°C.
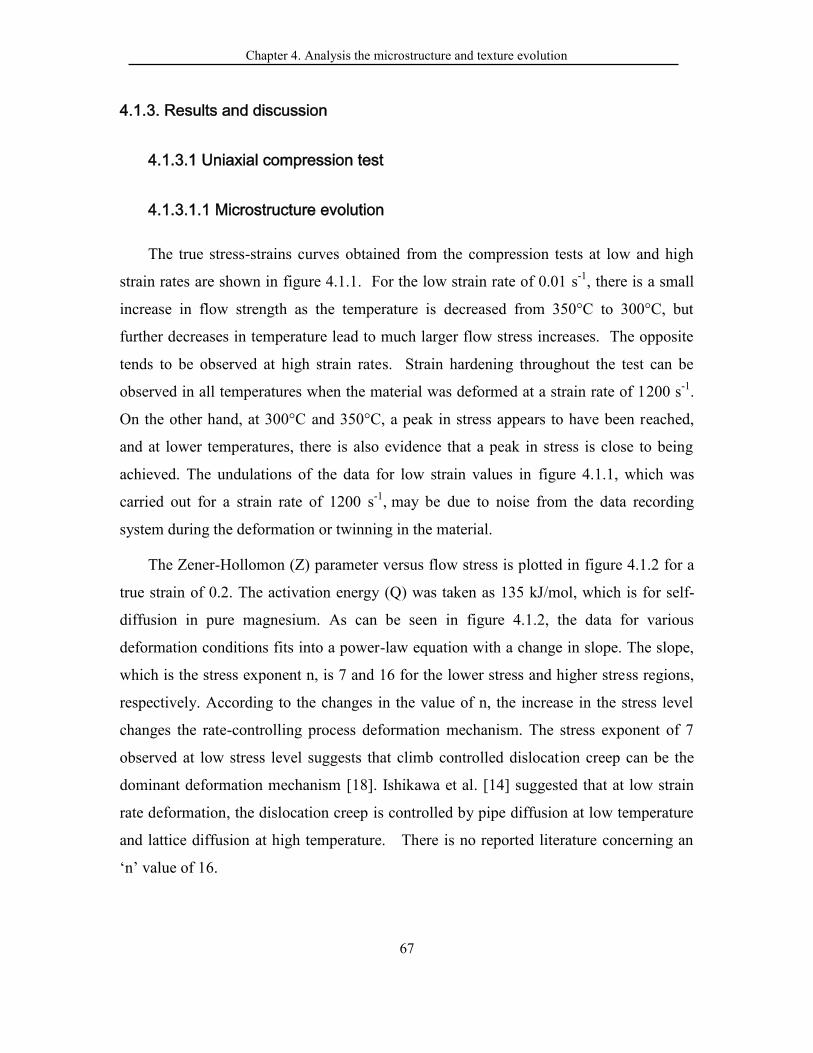
Chapter 4. Analysis the microstructure and texture evolution
67
4.1.3. Results and discussion
4.1.3.1 Uniaxial compression test
4.1.3.1.1 Microstructure evolution
The true stress-strains curves obtained from the compression tests at low and high
strain rates are shown in figure 4.1.1. For the low strain rate of 0.01 s-1, there is a small
increase in flow strength as the temperature is decreased from 350°C to 300°C, but
further decreases in temperature lead to much larger flow stress increases. The opposite
tends to be observed at high strain rates. Strain hardening throughout the test can be
observed in all temperatures when the material was deformed at a strain rate of 1200 s-1.
On the other hand, at 300°C and 350°C, a peak in stress appears to have been reached,
and at lower temperatures, there is also evidence that a peak in stress is close to being
achieved. The undulations of the data for low strain values in figure 4.1.1, which was
carried out for a strain rate of 1200 s-1, may be due to noise from the data recording
system during the deformation or twinning in the material.
The Zener-Hollomon (Z) parameter versus flow stress is plotted in figure 4.1.2 for a
true strain of 0.2. The activation energy (Q) was taken as 135 kJ/mol, which is for self-
diffusion in pure magnesium. As can be seen in figure 4.1.2, the data for various
deformation conditions fits into a power-law equation with a change in slope. The slope,
which is the stress exponent n, is 7 and 16 for the lower stress and higher stress regions,
respectively. According to the changes in the value of n, the increase in the stress level
changes the rate-controlling process deformation mechanism. The stress exponent of 7
observed at low stress level suggests that climb controlled dislocation creep can be the
dominant deformation mechanism [18]. Ishikawa et al. [14] suggested that at low strain
rate deformation, the dislocation creep is controlled by pipe diffusion at low temperature
and lattice diffusion at high temperature. There is no reported literature concerning an
‘n’ value of 16.
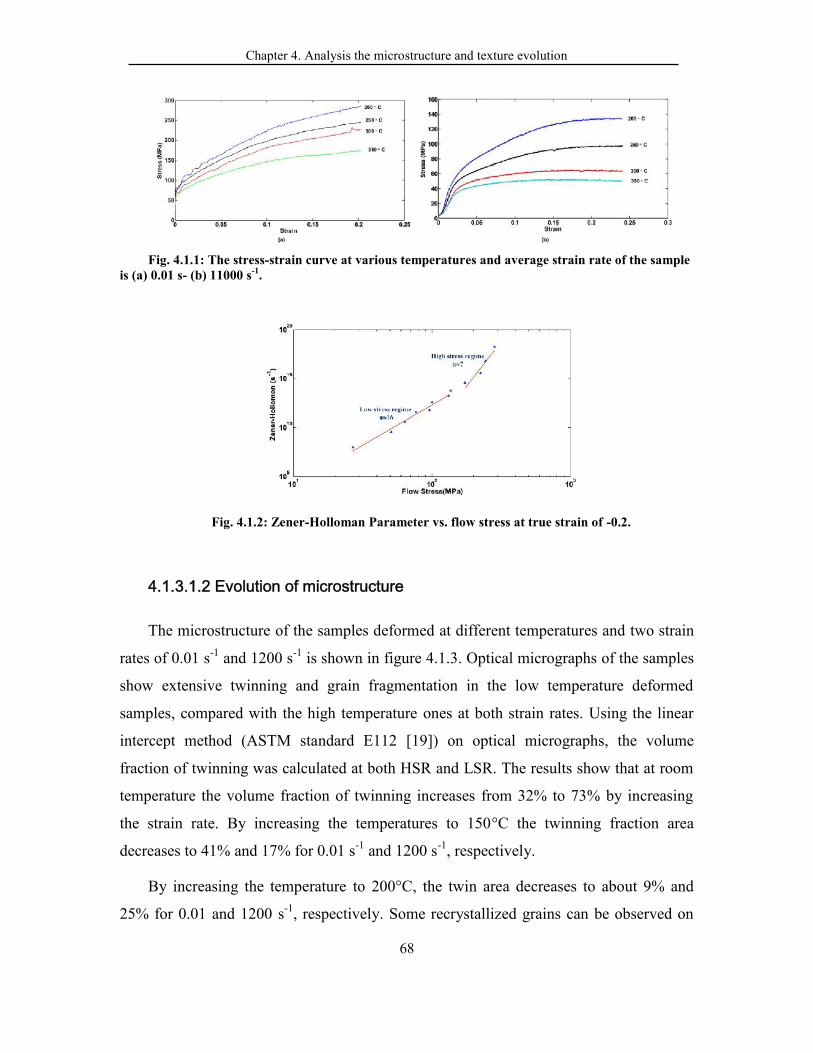
Chapter 4. Analysis the microstructure and texture evolution
68
Fig. 4.1.1: The stress-strain curve at various temperatures and average strain rate of the sampleis (a) 0.01 s- (b) 11000 s-1.
Fig. 4.1.2: Zener-Holloman Parameter vs. flow stress at true strain of -0.2.
4.1.3.1.2 Evolution of microstructure
The microstructure of the samples deformed at different temperatures and two strain
rates of 0.01 s-1 and 1200 s-1 is shown in figure 4.1.3. Optical micrographs of the samples
show extensive twinning and grain fragmentation in the low temperature deformed
samples, compared with the high temperature ones at both strain rates. Using the linear
intercept method (ASTM standard E112 [19]) on optical micrographs, the volume
fraction of twinning was calculated at both HSR and LSR. The results show that at room
temperature the volume fraction of twinning increases from 32% to 73% by increasing
the strain rate. By increasing the temperatures to 150°C the twinning fraction area
decreases to 41% and 17% for 0.01 s-1 and 1200 s-1, respectively.
By increasing the temperature to 200°C, the twin area decreases to about 9% and
25% for 0.01 and 1200 s-1, respectively. Some recrystallized grains can be observed on
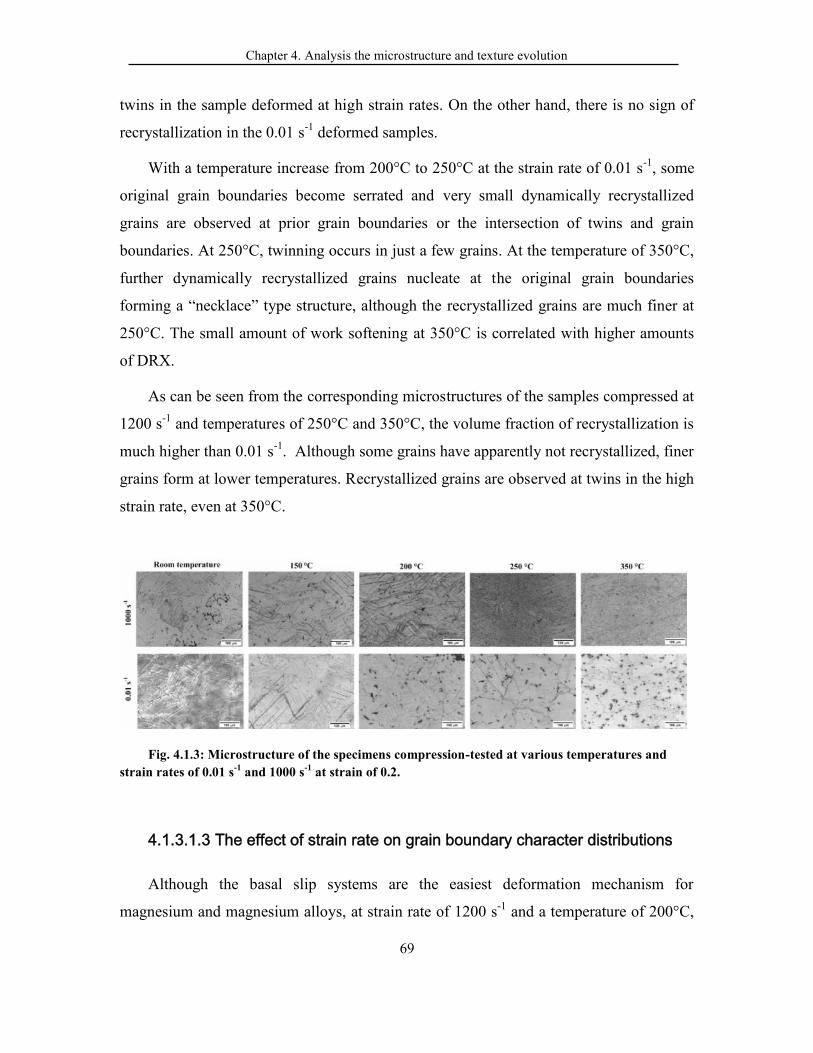
Chapter 4. Analysis the microstructure and texture evolution
69
twins in the sample deformed at high strain rates. On the other hand, there is no sign of
recrystallization in the 0.01 s-1 deformed samples.
With a temperature increase from 200°C to 250°C at the strain rate of 0.01 s-1, some
original grain boundaries become serrated and very small dynamically recrystallized
grains are observed at prior grain boundaries or the intersection of twins and grain
boundaries. At 250°C, twinning occurs in just a few grains. At the temperature of 350°C,
further dynamically recrystallized grains nucleate at the original grain boundaries
forming a “necklace” type structure, although the recrystallized grains are much finer at
250°C. The small amount of work softening at 350°C is correlated with higher amounts
of DRX.
As can be seen from the corresponding microstructures of the samples compressed at
1200 s-1 and temperatures of 250°C and 350°C, the volume fraction of recrystallization is
much higher than 0.01 s-1. Although some grains have apparently not recrystallized, finer
grains form at lower temperatures. Recrystallized grains are observed at twins in the high
strain rate, even at 350°C.
Fig. 4.1.3: Microstructure of the specimens compression-tested at various temperatures andstrain rates of 0.01 s-1 and 1000 s-1 at strain of 0.2.
4.1.3.1.3 The effect of strain rate on grain boundary character distributions
Although the basal slip systems are the easiest deformation mechanism for
magnesium and magnesium alloys, at strain rate of 1200 s-1 and a temperature of 200°C,
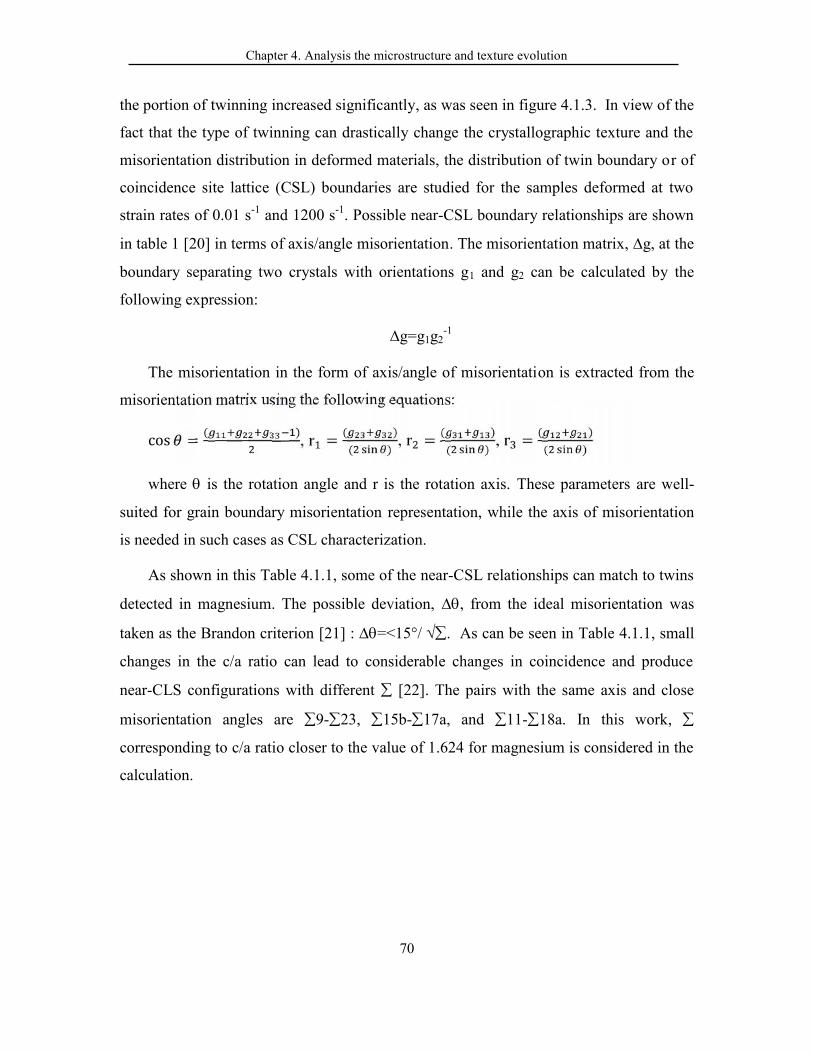
Chapter 4. Analysis the microstructure and texture evolution
70
the portion of twinning increased significantly, as was seen in figure 4.1.3. In view of the
fact that the type of twinning can drastically change the crystallographic texture and the
misorientation distribution in deformed materials, the distribution of twin boundary or of
coincidence site lattice (CSL) boundaries are studied for the samples deformed at two
strain rates of 0.01 s-1 and 1200 s-1. Possible near-CSL boundary relationships are shown
in table 1 [20] in terms of axis/angle misorientation. The misorientation matrix, g, at the
boundary separating two crystals with orientations g1 and g2 can be calculated by the
following expression:
g=g1g2-1
The misorientation in the form of axis/angle of misorientation is extracted from the
misorientation matrix using the following equations:cos = ( ), r = ( )( ) , r = ( )( ) , r = ( )( )where is the rotation angle and r is the rotation axis. These parameters are well-
suited for grain boundary misorientation representation, while the axis of misorientation
is needed in such cases as CSL characterization.
As shown in this Table 4.1.1, some of the near-CSL relationships can match to twins
detected in magnesium. The possible deviation, , from the ideal misorientation was
taken as the Brandon criterion [21] : =<15°/ . As can be seen in Table 4.1.1, small
changes in the c/a ratio can lead to considerable changes in coincidence and produce
near-CLS configurations with different [22]. The pairs with the same axis and close
misorientation angles are 9-23, 15b-17a, and 11-18a. In this work,
corresponding to c/a ratio closer to the value of 1.624 for magnesium is considered in the
calculation.
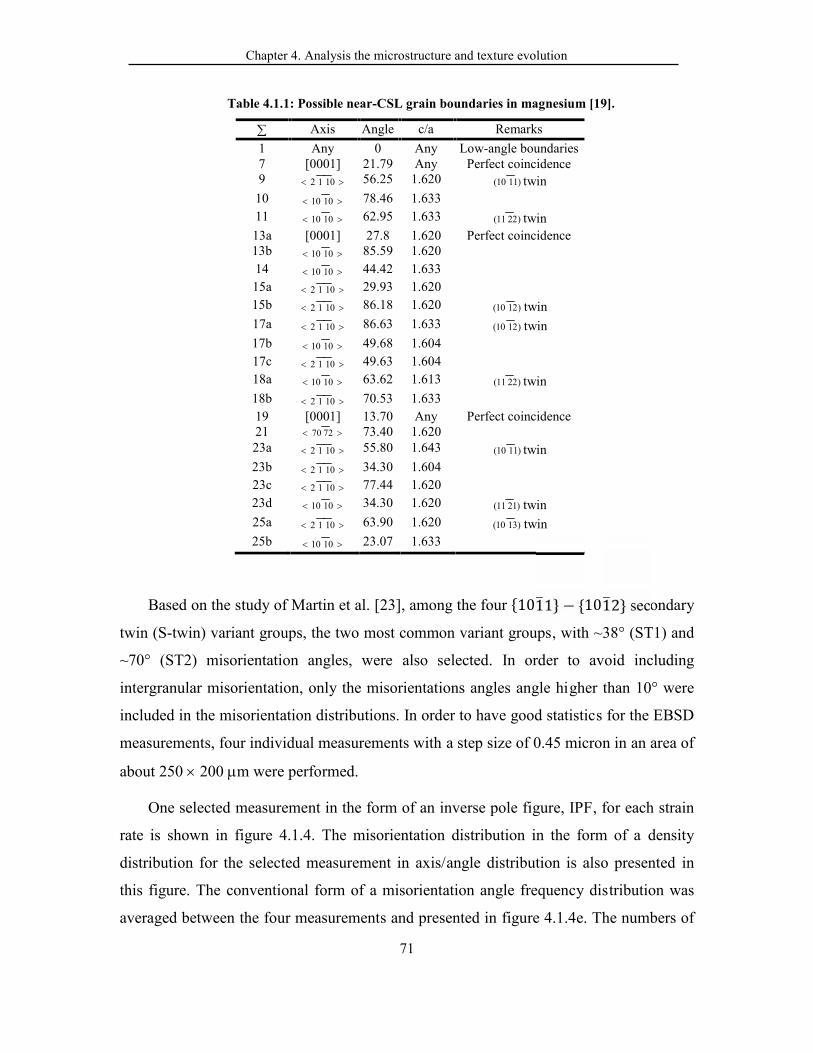
Chapter 4. Analysis the microstructure and texture evolution
71
Table 4.1.1: Possible near-CSL grain boundaries in magnesium [19].
Axis Angle c/a Remarks1 Any 0 Any Low-angle boundaries7 [0001] 21.79 Any Perfect coincidence9 2 1 10 56.25 1.620 (10 11) twin
10 10 10 78.46 1.63311 10 10 62.95 1.633 (11 22) twin13a [0001] 27.8 1.620 Perfect coincidence13b 10 10 85.59 1.62014 10 10 44.42 1.63315a 2 1 10 29.93 1.62015b 2 1 10 86.18 1.620 (10 12) twin17a 2 1 10 86.63 1.633 (10 12) twin17b 10 10 49.68 1.60417c 2 1 10 49.63 1.60418a 10 10 63.62 1.613 (11 22) twin18b 2 1 10 70.53 1.63319 [0001] 13.70 Any Perfect coincidence21 70 72 73.40 1.62023a 2 1 10 55.80 1.643 (10 11) twin23b 2 1 10 34.30 1.60423c 2 1 10 77.44 1.62023d 10 10 34.30 1.620 (11 21) twin25a 2 1 10 63.90 1.620 (10 13) twin25b 10 10 23.07 1.633
Based on the study of Martin et al. [23], among the four {1011} − {1012} secondary
twin (S-twin) variant groups, the two most common variant groups, with ~38° (ST1) and
~70° (ST2) misorientation angles, were also selected. In order to avoid including
intergranular misorientation, only the misorientations angles angle higher than 10° were
included in the misorientation distributions. In order to have good statistics for the EBSD
measurements, four individual measurements with a step size of 0.45 micron in an area of
about 250 200 m were performed.
One selected measurement in the form of an inverse pole figure, IPF, for each strain
rate is shown in figure 4.1.4. The misorientation distribution in the form of a density
distribution for the selected measurement in axis/angle distribution is also presented in
this figure. The conventional form of a misorientation angle frequency distribution was
averaged between the four measurements and presented in figure 4.1.4e. The numbers of
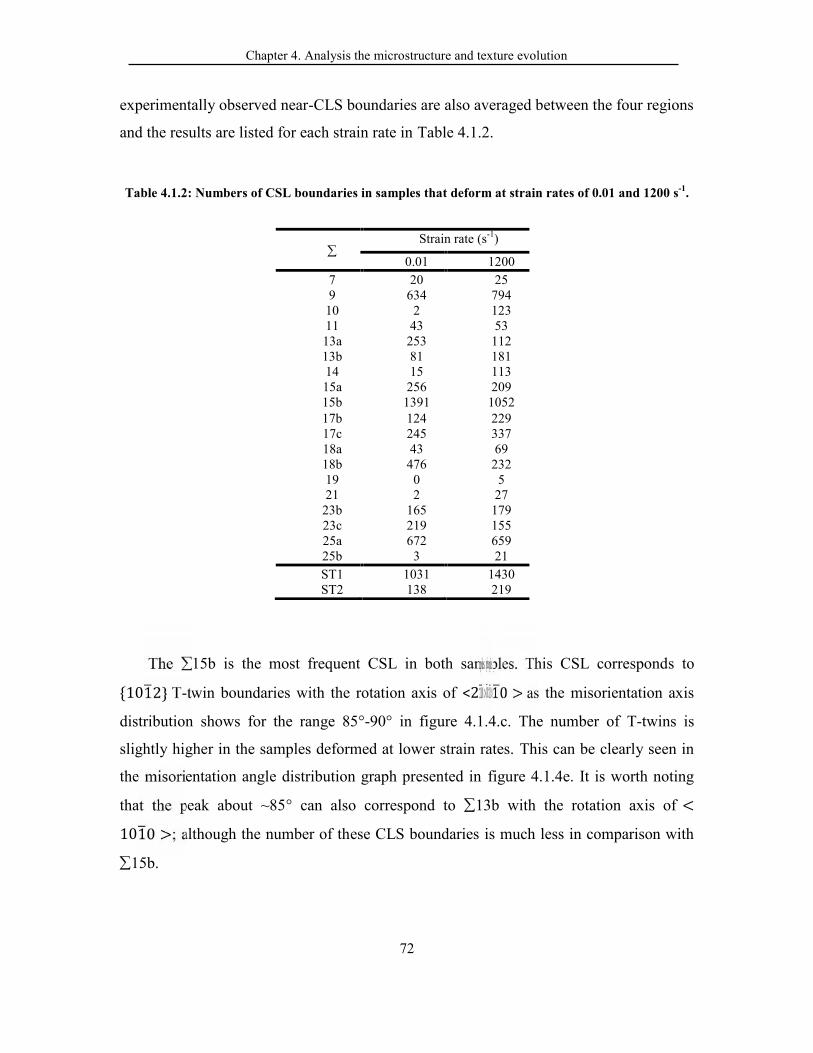
Chapter 4. Analysis the microstructure and texture evolution
72
experimentally observed near-CLS boundaries are also averaged between the four regions
and the results are listed for each strain rate in Table 4.1.2.
Table 4.1.2: Numbers of CSL boundaries in samples that deform at strain rates of 0.01 and 1200 s-1.
Strain rate (s-1)
0.01 12007 20 259 634 794
10 2 12311 43 5313a 253 11213b 81 18114 15 11315a 256 20915b 1391 105217b 124 22917c 245 33718a 43 6918b 476 23219 0 521 2 27
23b 165 17923c 219 15525a 672 65925b 3 21ST1ST2
1031138
1430219
The 15b is the most frequent CSL in both samples. This CSL corresponds to{1012} T-twin boundaries with the rotation axis of <2110 > as the misorientation axis
distribution shows for the range 85°-90° in figure 4.1.4.c. The number of T-twins is
slightly higher in the samples deformed at lower strain rates. This can be clearly seen in
the misorientation angle distribution graph presented in figure 4.1.4e. It is worth noting
that the peak about ~85° can also correspond to 13b with the rotation axis of <1010 >; although the number of these CLS boundaries is much less in comparison with
15b.
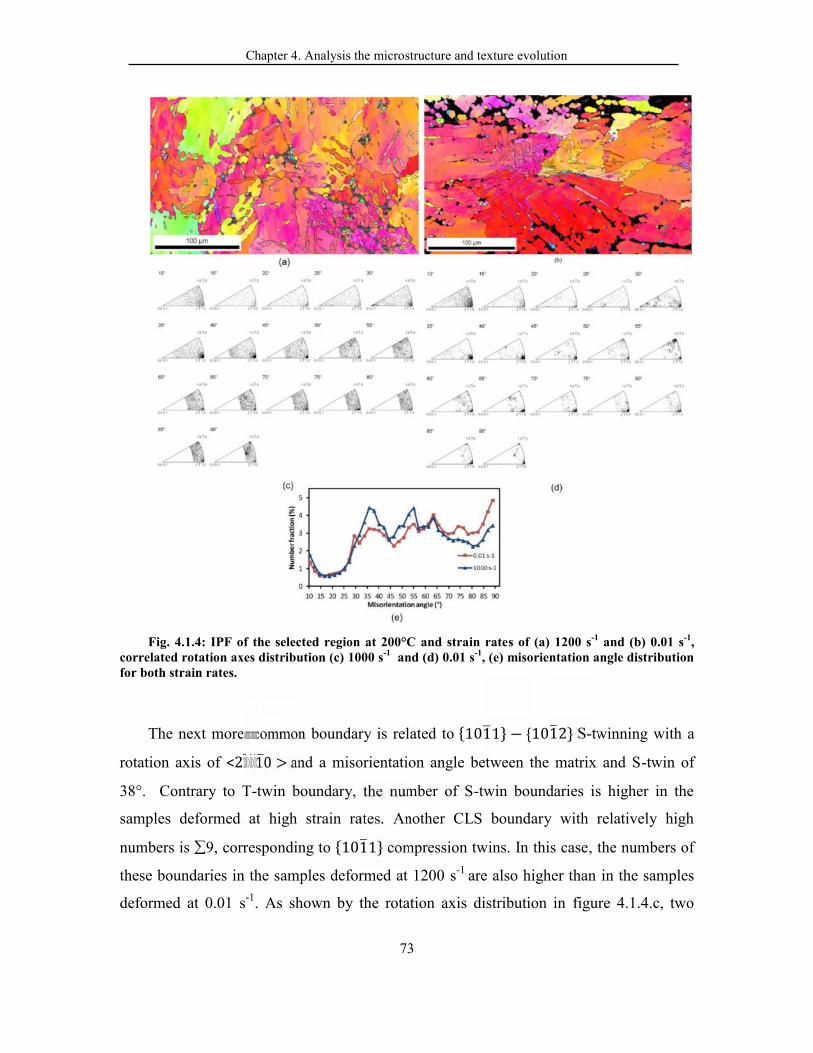
Chapter 4. Analysis the microstructure and texture evolution
73
Fig. 4.1.4: IPF of the selected region at 200°C and strain rates of (a) 1200 s-1 and (b) 0.01 s-1,correlated rotation axes distribution (c) 1000 s-1 and (d) 0.01 s-1, (e) misorientation angle distributionfor both strain rates.
The next more common boundary is related to {1011} − {1012} S-twinning with a
rotation axis of <2110 > and a misorientation angle between the matrix and S-twin of
38°. Contrary to T-twin boundary, the number of S-twin boundaries is higher in the
samples deformed at high strain rates. Another CLS boundary with relatively high
numbers is 9, corresponding to {1011} compression twins. In this case, the numbers of
these boundaries in the samples deformed at 1200 s-1 are also higher than in the samples
deformed at 0.01 s-1. As shown by the rotation axis distribution in figure 4.1.4.c, two

Chapter 4. Analysis the microstructure and texture evolution
74
strong maxima exist for the axes close to <2110 > and <1010 >. By this means that the
55° misorientation peak can be partially contributed to the 17b and 17c. The Brandon
criterion [21] tolerance for the these two CLS relationship is about 3.7 and can be
included in the interval axes distribution of 50-55°. As can be seen in Table 4.1.2, the
numbers of these two CLS relationships are also relatively high.
The misorientation angle distribution shows another distinct peak at about 75°,
especially for samples that deform at strain rate of 0.01 s-1. As the rotation axes
distribution shows, the <2110 > dominate for this misorientation angle range; therefore,
18b boundaries can be responsible for this peak, although 21 can also partially
contribute to this peak.
Another important peak that is typically found in magnesium sheets with a strong
basal texture is the peak around 30° [9, 24-26]. Although, it has been proposed that the
presence of the 30° peak is related to the appearance of near-CSL boundaries [27, 28],
there is no complete analysis of the CSL boundary in these two studies.
It can be seen from the rotation axis distribution for both strain rates that the axis
concentration is in that part of the standard stereographic triangle close to [0001] and
< 2110 > . Therefore, the existence of 30° can be related to the 13a and 15a
boundaries with the [0001] and <2110 > misorientation axis, respectively (table 1). It is
worth noting that, because of the [0001] rotation axis, which is parallel to the c-axis, the
13a boundary belongs to the CSL relationships independent of the c/a ratio and can be
considered as perfect coincidence [22].
Wu et al. [29] reported that misorientations on he [0001] axis can be caused by the
interaction of the dislocations responsible for slip on different slip systems, especially
prismatic dislocation interactions. These interactions on different parallel planes of each
slip system can produce dislocation arrays, which can transform into dislocation grain
boundaries. There is a possibility that a similar mechanism is responsible for the
development of 13a boundaries especially in samples deformed at lower strain rate of
0.01 s-1,and this can be considered as the more activated slip system of this type at this
Chapter 4. Analysis the microstructure and texture evolution
75
strain rate. As the results in Table 4.1.2 show, the {1021} twin with <1010 > axis is less
activated in both conditions.
As a general conclusion, it appears that the CLS boundaries related to C-twins and
the boundaries related to S-twins are more numerous in samples deformed at high strain
rates. On the other hand, the CLS boundaries corresponding to T-twins and the CLS
boundaries responsible for 30° peak are found more often in the microstructure.
4.1.3.1.4 Deformation mechanism during high strain rate deformation
Based on the approximate values of the CRSS for principal slip/twinning modes in
AZ31 reported by Barnett [30], it is clear that the twinning and pyramidal slip systems
can play an important role during deformation at low and high temperatures, respectively.
It was reported that reducing the deformation temperature and increasing the strain rate is
expected to enhance twinning [31]. One possible reason is that by increasing the strain
rate the CRSS value for the prismatic and pyramidal is increasing while the CRSS value
does not change for basal slip and twinning [15, 30].
To study the effect of strain rate on the texture evolution, the pole figures of the
samples deformed at 200°C and two strain rates of 0.01 s-1 and 1200 s-1 and different
strains were analyzed (fig. 4.1.5). According to these results, at all strains, the bulk
texture of the deformed samples showed the typical basal texture of compressed Mg
alloys, with the majority of c-axes of the grains aligned with the compression direction.
At the early stage of deformation (strain of 0.1), the rate of texture evolution is higher in
the samples deformed with higher strain rate and the maximum intensity is increased
from 2.0 to 2.4 for the samples deformed at 0.01 and 1200 s-1, respectively. By increasing
the strain to 0.2, the maximum intensity increased to 2.4 and 2.6 for strain rates of 0.01
and 1200 s-1, respectively. At the strain rate of 1200 s-1, the initiation of basal splitting
can be observed, which is clearer at 0.3 strain. The maximum intensity does not change
significantly and is slightly increased from 2.5 to 2.6. On the other hand, for 0.01 s-1 the
maximum intensity increased from 2.4 to 2.6 and the splitting of texture is not as clear as
at the strain rate of 1200 s-1.
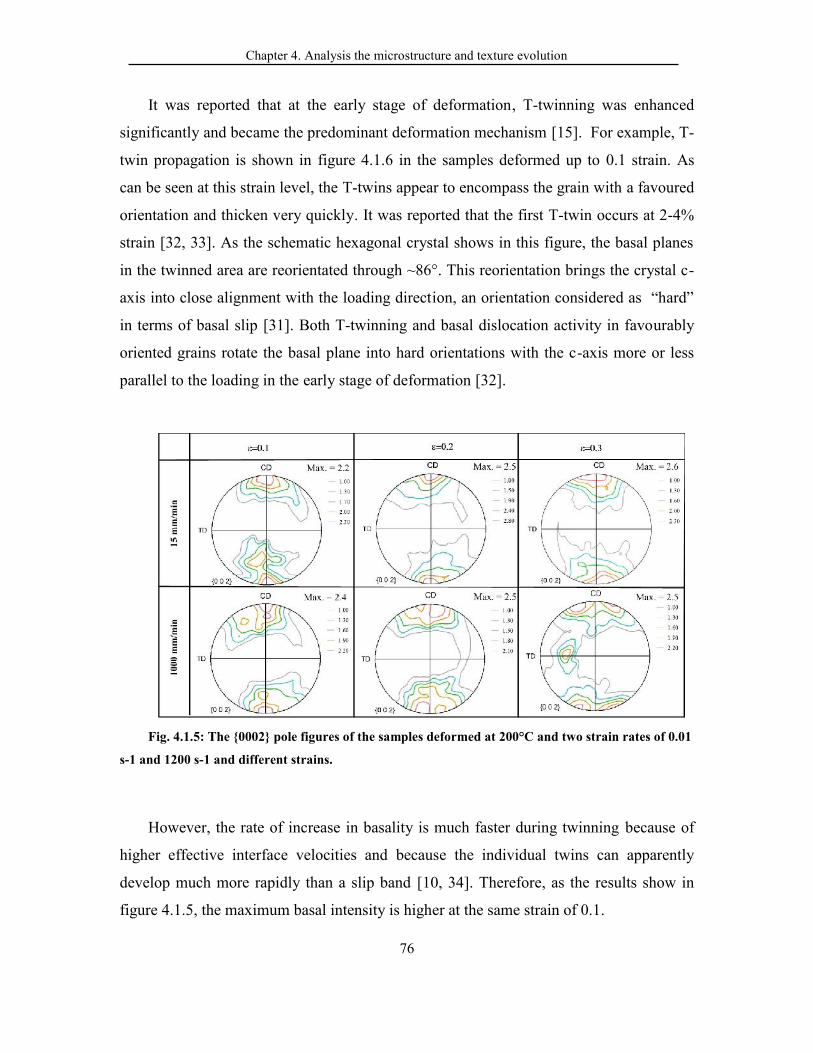
Chapter 4. Analysis the microstructure and texture evolution
76
It was reported that at the early stage of deformation, T-twinning was enhanced
significantly and became the predominant deformation mechanism [15]. For example, T-
twin propagation is shown in figure 4.1.6 in the samples deformed up to 0.1 strain. As
can be seen at this strain level, the T-twins appear to encompass the grain with a favoured
orientation and thicken very quickly. It was reported that the first T-twin occurs at 2-4%
strain [32, 33]. As the schematic hexagonal crystal shows in this figure, the basal planes
in the twinned area are reorientated through ~86°. This reorientation brings the crystal c-
axis into close alignment with the loading direction, an orientation considered as “hard”
in terms of basal slip [31]. Both T-twinning and basal dislocation activity in favourably
oriented grains rotate the basal plane into hard orientations with the c-axis more or less
parallel to the loading in the early stage of deformation [32].
Fig. 4.1.5: The {0002} pole figures of the samples deformed at 200°C and two strain rates of 0.01
s-1 and 1200 s-1 and different strains.
However, the rate of increase in basality is much faster during twinning because of
higher effective interface velocities and because the individual twins can apparently
develop much more rapidly than a slip band [10, 34]. Therefore, as the results show in
figure 4.1.5, the maximum basal intensity is higher at the same strain of 0.1.
Chapter 4. Analysis the microstructure and texture evolution
77
It is worth noting that by forming contraction twins (C-twins) the basal planes are
reoriented by 56º around a <2110 > axis. This orientation change facilitates glide on the
basal planes [35]. However, the activity of T-twinning is much higher than the C-
twinning particularly at the early stages of deformation [36]. It was reported that the T-
twinning would be activated in grains tilted 45-90° away from the compression direction
[37]. On the other hand, Yi et al. [37] reported that C-twins can be activated in grains
with c-axes tilted less than 30° away from the normal direction (ND) of the sheet in their
rolling experiments. This is because of the more complex atomic shuffling and larger
twinning shear needed for the activation of C-twins in comparison with T-twins [36].
However, as was shown in the previous section, by increasing the strain to 0.2, the
volume fraction of both types of C-twins increases, especially in the samples deformed at
the high strain rate of 1200 s-1. Furthermore, the initiation of basal splitting can be
observed in samples deformed at a high strain rate of 1200 s-1 and there is no sign of
splitting for the samples deformed at a low strain rate of 0.01 s-1. It has been hypothesized
that a potential mechanism for basal poles splitting toward the RD during the rolling can
be the promotion of S-twinning [38] and/or <c+a> slip systems [39]. The critical resolved
shear stress (CRSS) of <c+a> slip systems is very high at 200°C, leading to very low
contribution of this type of slip system [40]. It was also reported that under dynamic
conditions, the CRSS of non-basal slip systems remains higher than that of twinning [15].
An example of the formation of several C-twins and S-twins inside a grain with
favourable orientation is shown in figure 4.1.7. As can be seen, most of the C-twins are
already transformed to S-twins. As the PF shows, the c-axis of this both upper and lower
grains is almost oriented toward the compression direction (which is favourable for the
formation of C-twins [36]), most probably due to activation of basal slip and/or tensile
twinning at the early stage of compression. By increasing the reduction, many C-twins
are formed inside the basal parent grains. As can be seen, it has been previously reported
that C-twins in AZ31 often lead to subsequent S-twinning with the development of T-
twins inside this C-twins [32, 37, 41].

Chapter 4. Analysis the microstructure and texture evolution
78
Fig. 4.1.6: Propagation of the T-twin (red area) inside the favourite grain at the early stage ofdeformation (=0.1) As the schematic hexagonal crystal and pole figure shows (bottom left), the basalplanes in the twinned are reorientated toward the compression.
An example of S-twin propagating within C-twins is highlighted in figure 4.1.7. The
right part shows the primary C-twin, which reoriented the basal planes by 56º around a
<2110 > axis, as demonstrated by the stereographic triangle. In the left part, an S-twin
appears because of the formation of a T-twin inside the primary C-twin. The resulting
misorientation related to initial parent grains in this case is 36.6º around a <1-210> axis.
It is interesting to note that the misorientation between the primary compression and the
resulted S-twin is always 56º around a <2110 > axis because of the formation of T-
twins. In the case of magnesium, the shear strain for T-twinning is much lower than C-
twinning [37]; therefore, S-twins are rapidly formed within the primary C-twins in order
to reduce the shear strain caused by the primary C-twins. As can be seen in the pole
figure of the upper and lower grain, at this deformation condition, the pole splitting is
most probably because of the formation of this S-twinning. The volume fraction of S-
twinning increased by increasing the strain rate to 1200 s-1, as already discussed in
Chapter 4. Analysis the microstructure and texture evolution
79
section 3.1.3, and this is the main reason for clear basal splitting at a strain of 0.3
deformed under the high strain rate.
4.1.3.1.5 Restoration mechanism during high strain rate deformation
As was seen in figure 4.1.3, at 350°C, even though the microstructure is completely
recrystallized, there is no sign of recrystallization on the stress-strain curves (fig. 4.1.1),
which suggests that static recrystallization is taking place immediately after deformation
has been completed. Therefore, to investigate the effect of post-dynamic static
recrystallization on the microstructure after deformation at high strain rate and
temperature of 350°C, samples were quenched after holding for 5 s. The microstructure
of the sample is shown in Figure 8(a) and compared to the sample immediately quenched
after deformation, revealing average grain sizes of 26 and 10 µm, respectively. This high
rate of coarsening suggests that metadynamic recrystallization is extremely rapid, and
that even quenching might have been insufficient to stop metadynamic recrystallization
from the beginning. Beer et al. [42] suggested that the kinetics of recrystallization is
promoted by increasing the strain rate and decreasing the temperature due to higher
stored energy at larger values of Z. They mentioned that this is because of the “double”
effect of increasing temperature: enhancing the boundary mobility and nucleation rate, on
the one hand, and decreasing the stored energy (i.e., the driving force of
recrystallization), on the other side.
As was discussed earlier, by increasing the strain rate, more twins form in the
material, which also considerably influences the recrystallization mechanism [15, 36, 43].
Martin et al. [44] reported that the formation of an S-twin at the initial twin boundary will
produce incompatibilities within the parent grain, generating further plastic deformation
inside the parent grain and on the other side of the boundary. This can result in an
increasing accommodation strain in these regions, which can be relaxed either by slip or
by slip and twinning [44, 45]. In the EBSD maps, this higher value of dislocation density
and stored energy can be connected to local misorientation [46]. The kernel average
misorientation (KAM), constructed by calculating the average misorientation of each
measurement point up to its third adjacent neighbour scanned point is illustrated in figure
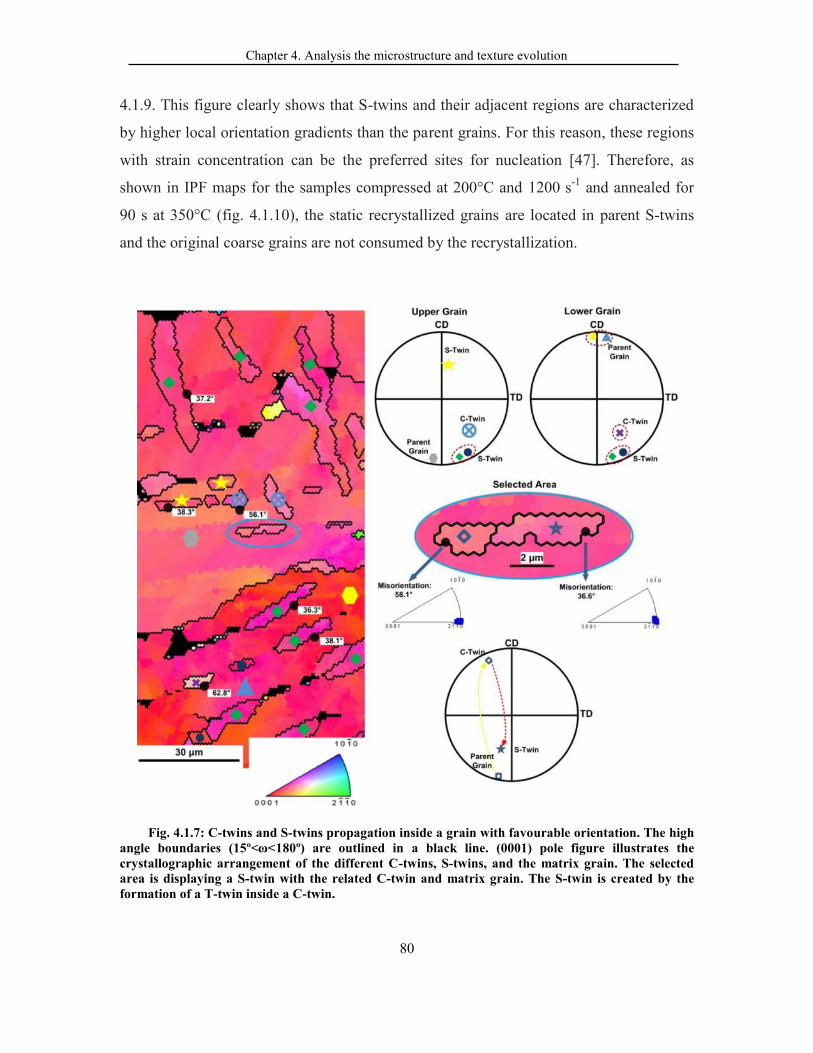
Chapter 4. Analysis the microstructure and texture evolution
80
4.1.9. This figure clearly shows that S-twins and their adjacent regions are characterized
by higher local orientation gradients than the parent grains. For this reason, these regions
with strain concentration can be the preferred sites for nucleation [47]. Therefore, as
shown in IPF maps for the samples compressed at 200°C and 1200 s-1 and annealed for
90 s at 350°C (fig. 4.1.10), the static recrystallized grains are located in parent S-twins
and the original coarse grains are not consumed by the recrystallization.
Fig. 4.1.7: C-twins and S-twins propagation inside a grain with favourable orientation. The highangle boundaries (15º<ω<180º) are outlined in a black line. (0001) pole figure illustrates thecrystallographic arrangement of the different C-twins, S-twins, and the matrix grain. The selectedarea is displaying a S-twin with the related C-twin and matrix grain. The S-twin is created by theformation of a T-twin inside a C-twin.
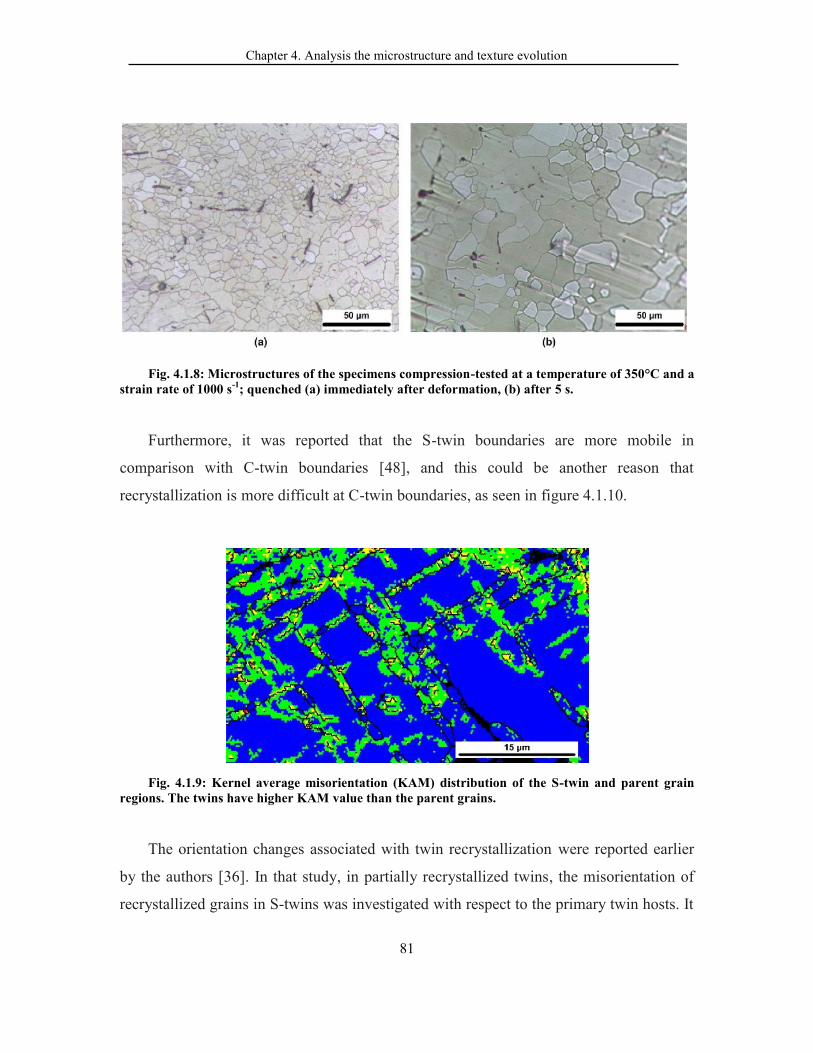
Chapter 4. Analysis the microstructure and texture evolution
81
Fig. 4.1.8: Microstructures of the specimens compression-tested at a temperature of 350°C and astrain rate of 1000 s-1; quenched (a) immediately after deformation, (b) after 5 s.
Furthermore, it was reported that the S-twin boundaries are more mobile in
comparison with C-twin boundaries [48], and this could be another reason that
recrystallization is more difficult at C-twin boundaries, as seen in figure 4.1.10.
Fig. 4.1.9: Kernel average misorientation (KAM) distribution of the S-twin and parent grainregions. The twins have higher KAM value than the parent grains.
The orientation changes associated with twin recrystallization were reported earlier
by the authors [36]. In that study, in partially recrystallized twins, the misorientation of
recrystallized grains in S-twins was investigated with respect to the primary twin hosts. It

Chapter 4. Analysis the microstructure and texture evolution
82
was concluded that the orientations of the recrystallized grains are closer to that of
secondary T-twin (86°), rather than that of the primary C-twins. In general, as can be seen
from the pole figure for parent grains and twin recrystallized grains in figure 4.1.10, the
orientation of twin recrystallized grains has a much wider distribution than that of the
initial basal parent. Furthermore, a slight shift in the major texture component can be
observed, and new components, related to the S-twins, also appear after recrystallization
(arrowed in fig. 4.1.10).
Thus, it seems that rapid recrystallization on S-twins contributes to the basal texture
weakening during the first 90 s of annealing. However, as mentioned earlier, the main
problem is that the un-twinned matrix grains are not consumed by the growth of the twin-
based nuclei [49], and, consequently, if the volume fraction of the twinned area is small,
the twin recrystallization cannot lead to significant texture modification.
Fig. 4.1.10: IPF maps for AZ31 deformed at 200°C and 1000 s-1 and annealed for 90 s. The staticrecrystallized grains have almost the same shape as their parent S-twins, and the original coarsegrains are not consumed by the recrystallization. In the bottom images, (0002) pole figures of initialparent grains and the SRX are shown.

Chapter 4. Analysis the microstructure and texture evolution
83
4.1.3.2 High speed rolling of AZ31
In this part of the work, the microstructure and texture evolution during HSR will be
correlated to the results of compression test results, presented in section 4.1.3.2.
4.1.3.2.1 Microstructure and texture evolution
To study the microstructure and texture evolution of high speed rolled samples, the
rolling mill was suddenly stopped, and the deformed sheet was withdrawn from the work
rolls immediately. The shape and microstructure of the partially rolled sheet was
examined by observing the RD-ND plane from the entry to the exit of the deformed zone
and shown in figure 4.1.11. The different sections on which microstructure and texture
were examined are indicated by numbered squares. Based on the sheet thickness in the
rolling gap, the reduction at different points was calculated and specified in figure 4.1.11.
It is worth noting that the sheet remaining in the roll gap was quenched by the cold rolls,
as suggested by some authors [12]. However, metadynamic restoration can be extremely
rapid in AZ31 at high strain rates, and this quenching might have even been insufficient
to stop metadynamic restoration from progressing. Therefore, the microstructure obtained
here is possibly a combination of dynamic, meta-dynamic, and even static restoration
processes.
Fig. 4.1.11: The shape of RD-ND plane and the observation positions of the sheet produced byinterrupted rolling; the microstructure of the partially rolled sheet is shown at different position ofthe entry to the exit of the deformed zone.
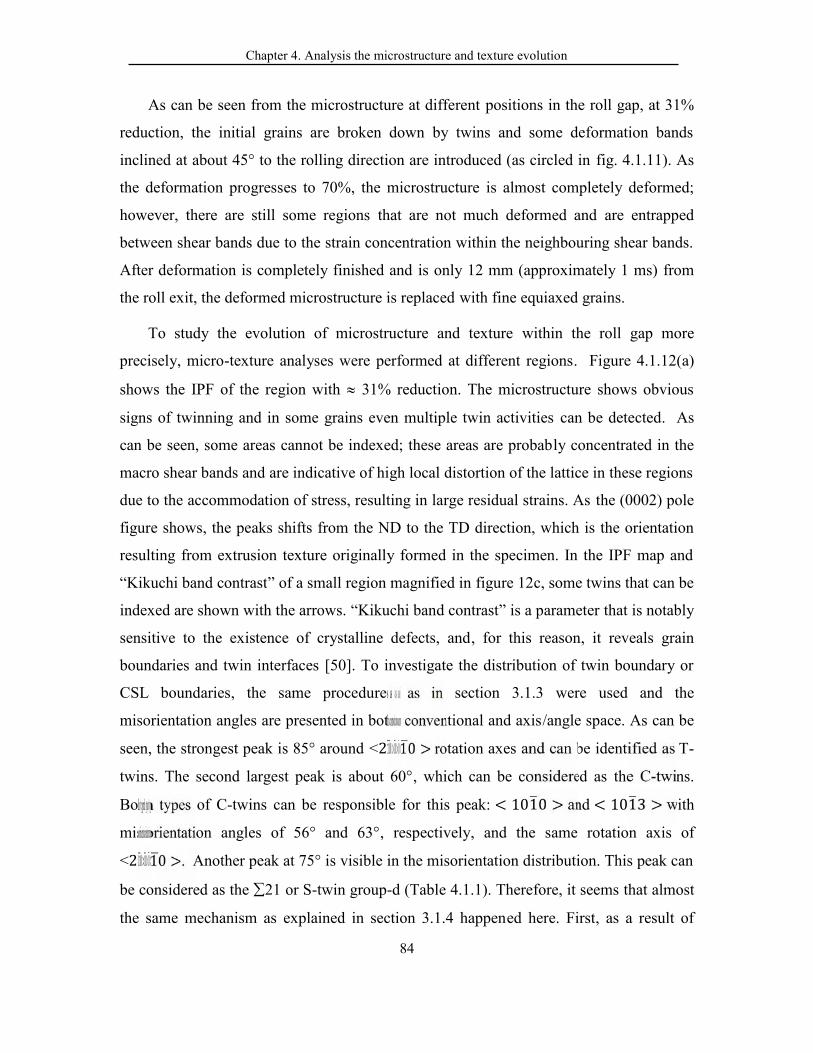
Chapter 4. Analysis the microstructure and texture evolution
84
As can be seen from the microstructure at different positions in the roll gap, at 31%
reduction, the initial grains are broken down by twins and some deformation bands
inclined at about 45° to the rolling direction are introduced (as circled in fig. 4.1.11). As
the deformation progresses to 70%, the microstructure is almost completely deformed;
however, there are still some regions that are not much deformed and are entrapped
between shear bands due to the strain concentration within the neighbouring shear bands.
After deformation is completely finished and is only 12 mm (approximately 1 ms) from
the roll exit, the deformed microstructure is replaced with fine equiaxed grains.
To study the evolution of microstructure and texture within the roll gap more
precisely, micro-texture analyses were performed at different regions. Figure 4.1.12(a)
shows the IPF of the region with 31% reduction. The microstructure shows obvious
signs of twinning and in some grains even multiple twin activities can be detected. As
can be seen, some areas cannot be indexed; these areas are probably concentrated in the
macro shear bands and are indicative of high local distortion of the lattice in these regions
due to the accommodation of stress, resulting in large residual strains. As the (0002) pole
figure shows, the peaks shifts from the ND to the TD direction, which is the orientation
resulting from extrusion texture originally formed in the specimen. In the IPF map and
“Kikuchi band contrast” of a small region magnified in figure 12c, some twins that can be
indexed are shown with the arrows. “Kikuchi band contrast” is a parameter that is notably
sensitive to the existence of crystalline defects, and, for this reason, it reveals grain
boundaries and twin interfaces [50]. To investigate the distribution of twin boundary or
CSL boundaries, the same procedures as in section 3.1.3 were used and the
misorientation angles are presented in both conventional and axis/angle space. As can be
seen, the strongest peak is 85° around <2110 > rotation axes and can be identified as T-
twins. The second largest peak is about 60°, which can be considered as the C-twins.
Both types of C-twins can be responsible for this peak: < 1010 > and < 1013 > with
misorientation angles of 56° and 63°, respectively, and the same rotation axis of
<2110 >. Another peak at 75° is visible in the misorientation distribution. This peak can
be considered as the 21 or S-twin group-d (Table 4.1.1). Therefore, it seems that almost
the same mechanism as explained in section 3.1.4 happened here. First, as a result of

Chapter 4. Analysis the microstructure and texture evolution
85
activation basal slip and tensile twins, the texture of (0002)matrixparallel with rolling sheet
plane are developed in most of the grains (coloured in red in fig. 4.1.12 (c)) and the
original grains are divided by primary tensile twins and, subsequently, C-twins [36, 51],
as squared by the blue line in figure 4.1.12 (c). In the meanwhile, double twins involving
secondary {1012} tensile twins are rapidly propagated inside the primary C-twins as the
deformation progressed in the rolling gap.
As can be seen in figure 4.1.13, at a deformation reduction of 71%, because of high
local strains and dislocation densities in heavily deformed grains, kikuchi patterns could
not be obtained in the present study. However, as the {0002} pole figure shows, the basal
poles split into double-peaks in the RD direction. As was discussed in section 3.1.4, this
is most probably because of activation of the C-twins and S-twins.
Fig. 4.1.12: (a) IPF of the region with 31% reduction, the related (0001) and (1010) polefigures are also shown in the bottom of the graph for the same area, (b) Correlated rotation axesdistribution (top) and misorientation angle distribution (bottom), (c) IPF map and “Kikuchi bandcontrast” of the magnified region. The area squared by the blue line shows the formation of C-twinand S-twin inside the basal parent grains.
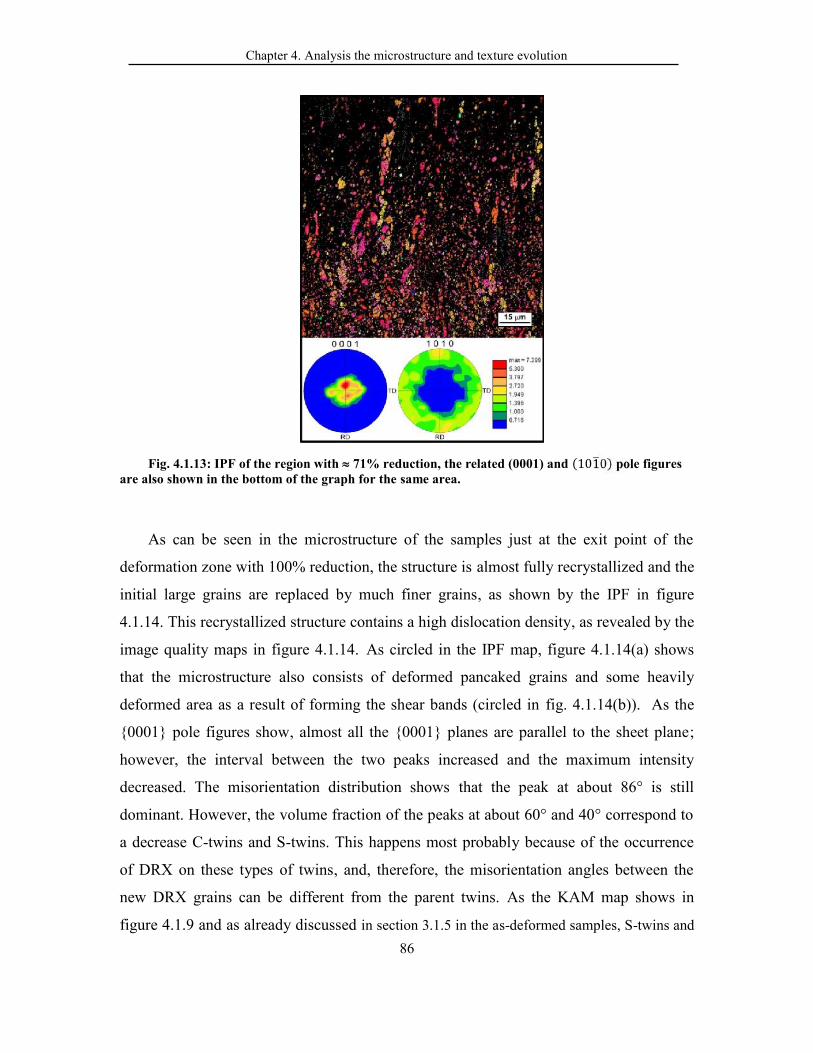
Chapter 4. Analysis the microstructure and texture evolution
86
Fig. 4.1.13: IPF of the region with 71% reduction, the related (0001) and (1010) pole figuresare also shown in the bottom of the graph for the same area.
As can be seen in the microstructure of the samples just at the exit point of the
deformation zone with 100% reduction, the structure is almost fully recrystallized and the
initial large grains are replaced by much finer grains, as shown by the IPF in figure
4.1.14. This recrystallized structure contains a high dislocation density, as revealed by the
image quality maps in figure 4.1.14. As circled in the IPF map, figure 4.1.14(a) shows
that the microstructure also consists of deformed pancaked grains and some heavily
deformed area as a result of forming the shear bands (circled in fig. 4.1.14(b)). As the
{0001} pole figures show, almost all the {0001} planes are parallel to the sheet plane;
however, the interval between the two peaks increased and the maximum intensity
decreased. The misorientation distribution shows that the peak at about 86° is still
dominant. However, the volume fraction of the peaks at about 60° and 40° correspond to
a decrease C-twins and S-twins. This happens most probably because of the occurrence
of DRX on these types of twins, and, therefore, the misorientation angles between the
new DRX grains can be different from the parent twins. As the KAM map shows in
figure 4.1.9 and as already discussed in section 3.1.5 in the as-deformed samples, S-twins and
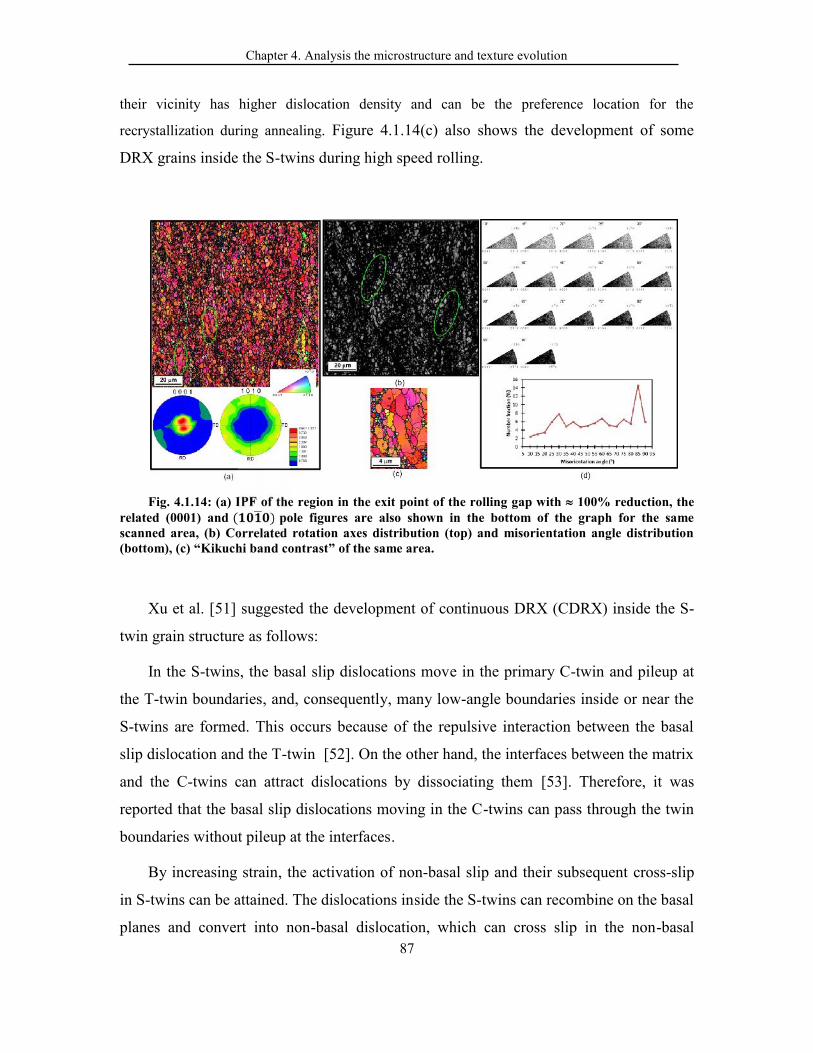
Chapter 4. Analysis the microstructure and texture evolution
87
their vicinity has higher dislocation density and can be the preference location for the
recrystallization during annealing. Figure 4.1.14(c) also shows the development of some
DRX grains inside the S-twins during high speed rolling.
Fig. 4.1.14: (a) IPF of the region in the exit point of the rolling gap with 100% reduction, therelated (0001) and ( ) pole figures are also shown in the bottom of the graph for the samescanned area, (b) Correlated rotation axes distribution (top) and misorientation angle distribution(bottom), (c) “Kikuchi band contrast” of the same area.
Xu et al. [51] suggested the development of continuous DRX (CDRX) inside the S-
twin grain structure as follows:
In the S-twins, the basal slip dislocations move in the primary C-twin and pileup at
the T-twin boundaries, and, consequently, many low-angle boundaries inside or near the
S-twins are formed. This occurs because of the repulsive interaction between the basal
slip dislocation and the T-twin [52]. On the other hand, the interfaces between the matrix
and the C-twins can attract dislocations by dissociating them [53]. Therefore, it was
reported that the basal slip dislocations moving in the C-twins can pass through the twin
boundaries without pileup at the interfaces.
By increasing strain, the activation of non-basal slip and their subsequent cross-slip
in S-twins can be attained. The dislocations inside the S-twins can recombine on the basal
planes and convert into non-basal dislocation, which can cross slip in the non-basal
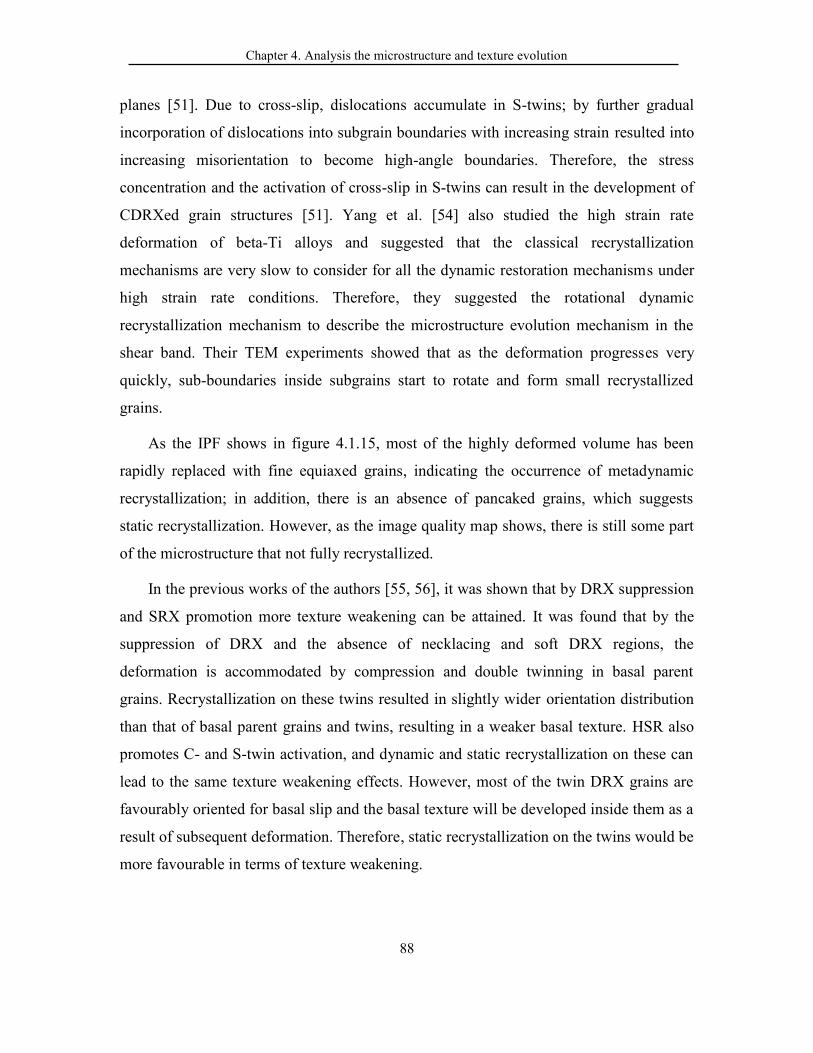
Chapter 4. Analysis the microstructure and texture evolution
88
planes [51]. Due to cross-slip, dislocations accumulate in S-twins; by further gradual
incorporation of dislocations into subgrain boundaries with increasing strain resulted into
increasing misorientation to become high-angle boundaries. Therefore, the stress
concentration and the activation of cross-slip in S-twins can result in the development of
CDRXed grain structures [51]. Yang et al. [54] also studied the high strain rate
deformation of beta-Ti alloys and suggested that the classical recrystallization
mechanisms are very slow to consider for all the dynamic restoration mechanisms under
high strain rate conditions. Therefore, they suggested the rotational dynamic
recrystallization mechanism to describe the microstructure evolution mechanism in the
shear band. Their TEM experiments showed that as the deformation progresses very
quickly, sub-boundaries inside subgrains start to rotate and form small recrystallized
grains.
As the IPF shows in figure 4.1.15, most of the highly deformed volume has been
rapidly replaced with fine equiaxed grains, indicating the occurrence of metadynamic
recrystallization; in addition, there is an absence of pancaked grains, which suggests
static recrystallization. However, as the image quality map shows, there is still some part
of the microstructure that not fully recrystallized.
In the previous works of the authors [55, 56], it was shown that by DRX suppression
and SRX promotion more texture weakening can be attained. It was found that by the
suppression of DRX and the absence of necklacing and soft DRX regions, the
deformation is accommodated by compression and double twinning in basal parent
grains. Recrystallization on these twins resulted in slightly wider orientation distribution
than that of basal parent grains and twins, resulting in a weaker basal texture. HSR also
promotes C- and S-twin activation, and dynamic and static recrystallization on these can
lead to the same texture weakening effects. However, most of the twin DRX grains are
favourably oriented for basal slip and the basal texture will be developed inside them as a
result of subsequent deformation. Therefore, static recrystallization on the twins would be
more favourable in terms of texture weakening.
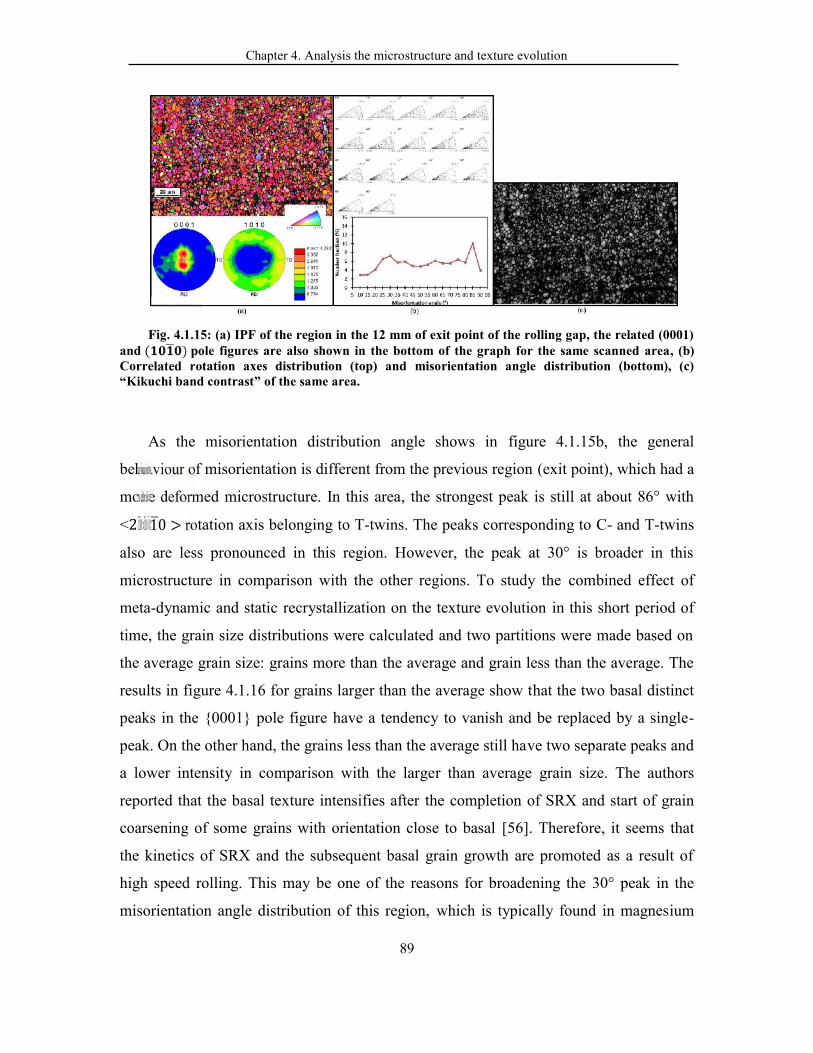
Chapter 4. Analysis the microstructure and texture evolution
89
Fig. 4.1.15: (a) IPF of the region in the 12 mm of exit point of the rolling gap, the related (0001)and ( ) pole figures are also shown in the bottom of the graph for the same scanned area, (b)Correlated rotation axes distribution (top) and misorientation angle distribution (bottom), (c)“Kikuchi band contrast” of the same area.
As the misorientation distribution angle shows in figure 4.1.15b, the general
behaviour of misorientation is different from the previous region (exit point), which had a
more deformed microstructure. In this area, the strongest peak is still at about 86° with
<2110 > rotation axis belonging to T-twins. The peaks corresponding to C- and T-twins
also are less pronounced in this region. However, the peak at 30° is broader in this
microstructure in comparison with the other regions. To study the combined effect of
meta-dynamic and static recrystallization on the texture evolution in this short period of
time, the grain size distributions were calculated and two partitions were made based on
the average grain size: grains more than the average and grain less than the average. The
results in figure 4.1.16 for grains larger than the average show that the two basal distinct
peaks in the {0001} pole figure have a tendency to vanish and be replaced by a single-
peak. On the other hand, the grains less than the average still have two separate peaks and
a lower intensity in comparison with the larger than average grain size. The authors
reported that the basal texture intensifies after the completion of SRX and start of grain
coarsening of some grains with orientation close to basal [56]. Therefore, it seems that
the kinetics of SRX and the subsequent basal grain growth are promoted as a result of
high speed rolling. This may be one of the reasons for broadening the 30° peak in the
misorientation angle distribution of this region, which is typically found in magnesium
Chapter 4. Analysis the microstructure and texture evolution
90
sheets with a strong basal texture [9, 24-26]. As the rollability of magnesium increases
significantly with HSR [9], it is suggested, to prevent the occurrence of DRX and
subsequent grain growth after rolling, that HSR should be performed at the lowest
possible temperature. Furthermore, decreasing the rolling temperature and increasing the
rolling speed increases the volume fraction of S-twinning, which proved to be useful in
alleviating the basal texture.
Fig. 4.1.16: (a) IPF and related (0001) pole figures of the region in the 12 mm of exit point of therolling gap for the grains larger than the average (top) and the grains smaller than the average.
4.1.4 Conclusions
Microstructure and texture development during very high strain rate uniaxial
compression tests and high speed large draught rolling of as-cast AZ31B alloy were
investigated. The following conclusions can be drawn from the analysis:
1- At the same temperature, with higher strain rates, DRX is more extensive,
most probably due to increasing in the twin-induced recrystallization fraction.
Chapter 4. Analysis the microstructure and texture evolution
91
2- Grain boundary misorientation distribution analysis shows that coincident
site lattice boundaries related to contraction twins and secondary twins are more
numerous in the samples deformed at high strain rates.
3- By increasing the strain rate at the early stage of deformation, T-twins
propagate quickly, and with additional compressive strain many C-twins are
nucleated and subsequent double twinning rapidly occurs in these twins.
4- By progressing the strain for both rolling and compression at 200°C, basal
pole splitting was observed, indicating the activation of more contraction and
secondary twins compared to low strain rate deformation.
5- Metadynamic restoration is very fast at a strain rate of 1200s-1, indicating
that immediate quenching may have been insufficient to freeze the microstructure
after deformation. The same conclusion is valid for HSR, since only 12 mm (i.e.,
about 1 ms) from the roll exit, the deformed microstructure is replaced by fine
equiaxed grains as a result of combined metadynamic and static recrystallization.
6- On annealing of the samples compressed at 200 °C, secondary twins and
their vicinity are the preferential area for nucleation.
7- By increasing the S-twins area, more texture weakening can be achieved.
In cases of high speed rolling, this can be achieved by decreasing the rolling
temperature and increasing the rolling speed.
4.1.5 References
[1] A. Panteli, J.D. Robson, I. Brough, P.B. Prangnell, Materials Science and Engineering A, 556 (2012)31-42.[2] A. Muraoka, H. Utsunomiya, R. Matsumoto, T. Sakai, Journal of Physics: Conference Series, 379(2012).[3] M.A. Meyers, Dynamic behavior of materials, Wiley-Interscience, 1994.[4] M. Meyers, U. Andrade, A. Chokshi, Metallurgical and Materials Transactions A, 26 (1995) 2881-2893.[5] J.W. McCauley, E. Strassburger, P. Patel, B. Paliwal, K.T. Ramesh, Experimental Mechanics, (2012) 1-27.[6] H.B. M. Avedesian, ASM specialty handbook. Magnesium and magnesium alloys. , ASM International,Materials Park, Ohio, 2000.[7] S.R. Agnew, O. Duygulu, International Journal of Plasticity, 21 (2005) 1161-1193.[8] T. Sakai, Y. Watanabe, H. Utsunomiya, Materials Science Forum 618-619(PART 4), (2009) 483-486.
Chapter 4. Analysis the microstructure and texture evolution
92
[9] M. Sanjari, S.A. Farzadfar, H. Utsunomiya, T. Sakai, E. Essadiqi, S. Yue, Materials Science andTechnology (United Kingdom), 28 (2012) 928-933.[10] H. Utsunomiya, T. Sakai, S. Minamiguchi, H. Koh, 2006, pp. 201-204.[11] T. Sakai, A. Hashimoto, G. Hamada, H. Utsunomiya, 2011, pp. 369-372.[12] M. Sanjari, S.A. Farzadfar, S. Yue, E. Essadiqi, 2010, pp. 481-486.[13] T. Sakai, Y. Watanabe, H. Utsunomiya, 2009, pp. 483-486.[14] K. Ishikawa, H. Watanabe, T. Mukai, Journal of Materials Science, 40 (2005) 1577-1582.[15] I. Ulacia, N.V. Dudamell, F. Gálvez, S. Yi, M.T. Pérez-Prado, I. Hurtado, Acta Materialia, 58 (2010)2988-2998.[16] I.K. Senchenkov, N.F. Andrushko, International Applied Mechanics, (2008) 1-10.[17] W. Dabboussi, J.A. Nemes, International Journal of Mechanical Sciences, 47 (2005) 1282-1299.[18] S.e. Hsu, G.R. Edwards, O.D. Sherby, Acta Metallurgica, 31 (1983) 763-772.[19] Anon, Annual Book of ASTM Standards, (1980).[20] R. Bonnet, E. Cousineau, D.H. Warrington, Acta Crystallographica Section A, 37 (1981) 184-189.[21] D.G. Brandon, Acta Metallurgica, 14 (1966) 1479-1484.[22] A. Ostapovets, P. Šedá, A. Jäger, P. Lejček, Scripta Materialia, 64 (2011) 470-473.[23] É. Martin, L. Capolungo, L. Jiang, J.J. Jonas, Acta Materialia, 58 (2010) 3970-3983.[24] M.R. Barnett, M.D. Nave, C.J. Bettles, Materials Science and Engineering A, 386 (2004) 205-211.[25] S. Biswas, S. Singh Dhinwal, S. Suwas, Acta Materialia, 58 (2010) 3247-3261.[26] K. Hantzsche, J. Bohlen, J. Wendt, K.U. Kainer, S.B. Yi, D. Letzig, Scripta Materialia, 63 (2010) 725-730.[27] L. Jin, D. Lin, D. Mao, X. Zeng, W. Ding, Journal of Alloys and Compounds, 426 (2006) 148-154.[28] X. Huang, K. Suzuki, N. Saito, Materials Science and Engineering: A, 508 (2009) 226-233.[29] B.L. Wu, G. Wan, Y.D. Zhang, X.H. Du, F. Wagner, C. Esling, Materials Science and Engineering: A,527 (2010) 3365-3372.[30] M.R. Barnett, Metallurgical and Materials Transactions A: Physical Metallurgy and Materials Science,34 A (2003) 1799-1806.[31] A.G. Beer, M.R. Barnett, Materials Science and Engineering: A, 423 (2006) 292-299.[32] M. Knezevic, A. Levinson, R. Harris, R.K. Mishra, R.D. Doherty, S.R. Kalidindi, Acta Materialia, 58(2010) 6230-6242.[33] L. Jiang, J.J. Jonas, R.K. Mishra, A.A. Luo, A.K. Sachdev, S. Godet, Acta Materialia, 55 (2007) 3899-3910.[34] T. Al-Samman, G. Gottstein, Materials Science and Engineering A, 490 (2008) 411-420.[35] L. Jiang, J.J. Jonas, A.A. Luo, A.K. Sachdev, S. Godet, Scripta Materialia, 54 (2006) 771-775.[36] M. Sanjari, S.A. Farzadfar, I.H. Jung, E. Essadiqi, S. Yue, Materials Science and Technology, (2011).[37] S. Yi, I. Schestakow, S. Zaefferer, Materials Science and Engineering: A, 516 (2009) 58-64.[38] S.L. Couling, F. Pashak, L. Sturkey, Trans. ASM, 51 (1959) 94-107.[39] S.R. Agnew, M.H. Yoo, C.N. Tomé, Acta Materialia, 49 (2001) 4277-4289.[40] M. Shamsi, M. Sanjari, A.Z. Hanzaki, Materials Science and Technology, 25 (2009) 1039-1045.[41] O. Muránsky, D.G. Carr, M.R. Barnett, E.C. Oliver, P. Šittner, Materials Science and Engineering: A,496 (2008) 14-24.[42] A.G. Beer, M.R. Barnett, Materials Science and Engineering A, 485 (2008) 318-324.[43] B.H. Lee, W. Bang, S. Ahn, C.S. Lee, Metallurgical and Materials Transactions A: PhysicalMetallurgy and Materials Science, 39 A (2008) 1426-1434.[44] É. Martin, L. Capolungo, L. Jiang, J.J. Jonas, Acta Materialia, 58 (2010) 3970-3983.[45] S. Mahajan, Acta Metallurgica, 21 (1973) 255-260.[46] T. Takahashi, D. Ponge, D. Raabe, Steel Research International, 78 (2007) 38-44.[47] F.J. Humphreys, M. Hatherly, Recrystallization and related annealing phenomena, Pergamon, 2004.[48] É. Martin, J.J. Jonas, Acta Materialia, 58 (2010) 4253-4266.[49] E. Martin, L. Jiang, S. Godet, J.J. Jonas, International Journal of Materials Research, 100 (2009) 576-583.[50] N. Bozzolo, L. Chan, A.D. Rollett, Journal of Applied Crystallography, 43 (2010) 596-602.[51] S.W. Xu, S. Kamado, N. Matsumoto, T. Honma, Y. Kojima, Materials Science and Engineering: A,527 (2009) 52-60.[52] M.H. Yoo, Metallurgical Transactions A, 12 (1981) 409-418.

Chapter 4. Analysis the microstructure and texture evolution
93
[53] J. Koike, T. Kobayashi, T. Mukai, H. Watanabe, M. Suzuki, K. Maruyama, K. Higashi, ActaMaterialia, 51 (2003) 2055-2065.[54] Y. Yang, F. Jiang, B.M. Zhou, X.M. Li, H.G. Zheng, Q.M. Zhang, Materials Science and Engineering:A, 528 (2011) 2787-2794.[55] S.A. Farzadfar, E. Martin, M. Sanjari, E. Essadiqi, S. Yue, Journal of Materials Science, 47 (2012)5488-5500.[56] M. Sanjari, A. Farzadfar, T. Sakai, H. Utsunomiya, E. Essadiqi, I.-H. Jung, S. Yue, Materials Scienceand Engineering: A.
Chapter 4. Analysis the microstructure and texture evolution
94
4.2 High speed rolling of Mg–3%Al–1%Zn alloy: texture and
microstructure analysis
* M. Sanjari, S.A. Farzadfar, H. Utsunomiya, T. Sakai, E. Essadiqi, S.Yue, High-speed rolling of
AZ31 Mg alloy: texture and microstructure analysis, Materials Science and Technology, Materials Science
and Technology (United Kingdom),2012, 28 (8) , pp. 928-933
High speed rolling (HSR) of 1000 m/min was employed to successfully roll AZ31
alloy in one pass with a 65% reduction in thickness at 300°C and 450°C. The rollability,
texture, and microstructure after high speed rolling in comparison to low speed rolling
(LSR) (15 m/min) improved significantly. It is suggested that the double-peak and
weaker basal texture obtained after HSR is attributed to the activation of compression and
double twins. After annealing, the double-peak basal texture is replaced by a single-peak
one, which may be due to the preferential grain growth of basal grains.
Chapter 4. Analysis the microstructure and texture evolution
95
4.2.1 Introduction
Having the lowest density of all structural metals, magnesium has opened new
horizons for developing commercial alloys with successful use in a wide variety of
applications [1, 2]. In recent years, the usage of wrought magnesium alloys has increased
in, for example, the automotive and electronic industries [1]. The application of
magnesium alloys in the automotive industry can reduce vehicle weight and,
consequently, fuel consumption. Sheet Mg is one way to increase the usage of Mg.
However, the plasticity of Mg is restricted at low temperatures because: (a) only a small
number of deformation mechanisms can be activated [3-5] and (b) preferred
crystallographic orientation (texture) develops in wrought alloys, especially in flat-rolled
sheets [6-8]. This causes problems in sheet processing as well as component
manufacturing from the sheets. However, somewhat independent of alloy composition,
there is some recent evidence that “high-speed” rolling (HSR) of AZ31 can be
successfully performed at temperatures around 200C, the temperature at which cracking
takes place at ordinary rolling speed [9, 10]. This is significant because Mg cools down
rapidly in the roll gap during hot rolling, which is why the current industrial hot rolling
schedule to produce sheet requires inter-pass reheating steps to maintain hot rollability
until the desired gauge is reached. Furthermore, based on the data available in the
literature [10-12], the sheet obtained by high speed rolling exhibited a fine-grained
microstructure (mean grain size of 2-3 m), with good mechanical properties. For these
advantages, HSR is a promising process to produce high-quality rolled magnesium alloy
sheets at a low cost.
The goal of this research is thus to investigate the mechanisms responsible for the
much higher rollability and the grain refinement after HSR. The main approach was to
study the texture and microstructure evolution from HSR pass entry to exit.
4.2.2 Experimental procedure
This study was carried out on an AZ31B alloy with the following chemical
composition (%wt): 3% Al, 0.9% Zn, 0.67% Mn and Mg (balance). Plates with a
thickness of 6 mm cast in steel-moulds were cut and machined into small plates with a
Chapter 4. Analysis the microstructure and texture evolution
96
dimension of 70 mm x 110 mm x 11 mm. The as-cast material was homogenized at
450°C for 4 hr, which was found to give consistent hot deformation behaviour [9].
The rolling experiment was conducted through two steps: rough rolling and finish
rolling. Roughing was performed using a low-speed two-high mill with 320 mm rolls
running at 15 m/min, the samples being rolled for three consecutive passes of 12-15% per
pass at 450°C. The sheets were preheated at 450°C for 10 min before rolling. The
samples were reheated for 10 min between each pass to keep the rolling temperature
constant. The rough rolled samples were subsequently annealed at 450°C for 15 min. For
the finish rolling, a two-high laboratory HSR mill with 530 mm rolls was used to
perform a single pass with a reduction in thickness of about 60% at either 300°C or
450°C and rolling speed of 1000 m/min at each temperature. The specimens were
quenched approximately 7 ms [10] after rolling by a water spray attached closely to the
exit of the mill. The rolls were neither heated nor lubricated. More details about the HSR
experiments can be found in previous works [10].
The samples were cut in RD-ND (rolling and normal directions) plan and mounted
and ground to 1200 grit and then polished with alcohol based 3 and 1 micron diamond
suspensions for microstructural examination by optical microscopy. The samples were
finally etched with an acetic-picral solution (10 mL acetic acid + 4.2 g picric acid + 10
mL water + 70 mL ethanol (99.5 pct)). The macro-texture was evaluated in a Siemens D-
500 X-ray diffractometer equipped with a texture goniometer using Co radiation in TD-
RD plan. The data were analyzed to calculate orientation distribution function and to
recalculate the pole figures.
Orientation imaging microscopy (OIM) was used to study grain orientation via
EBSD in a Hitachi S-3000 FE-SEM at 20 kV, 70° tilt angle, and a step size between 0.3
to 0.5 μm depending on deformation condition. For EBSD analysis, the polished samples
were electropolished at 20 V using 10% nital solution cooled to -10 to -30°C.
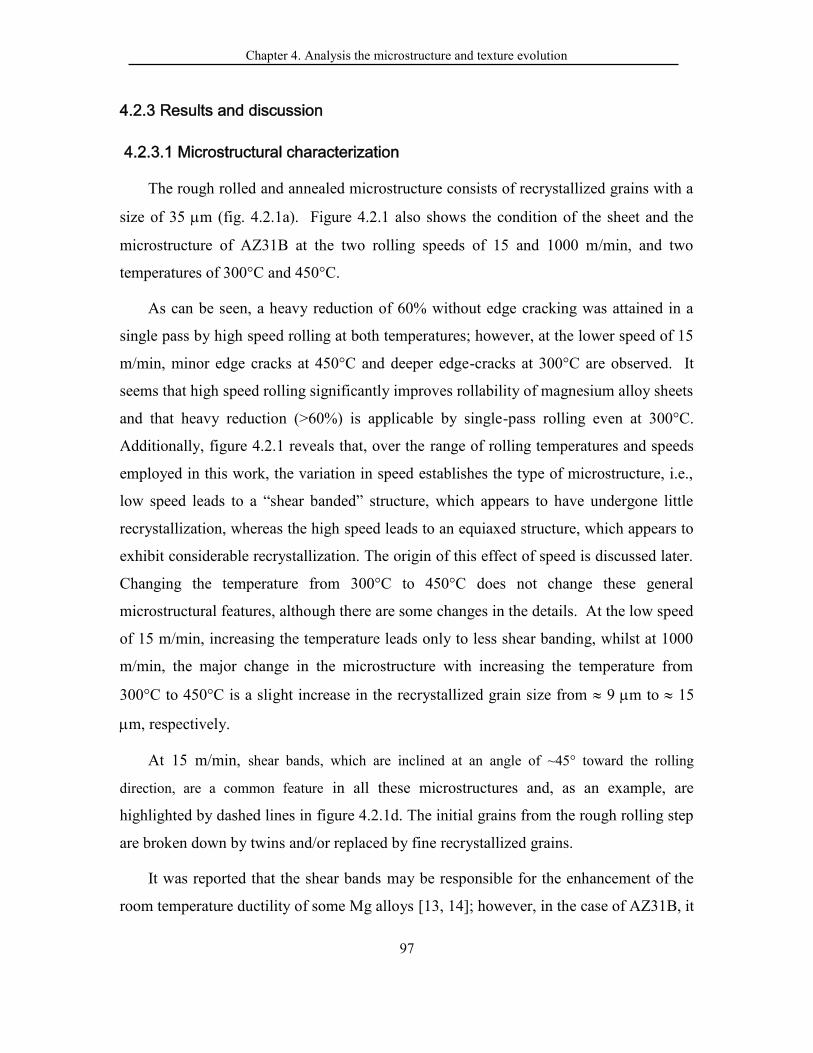
Chapter 4. Analysis the microstructure and texture evolution
97
4.2.3 Results and discussion
4.2.3.1 Microstructural characterization
The rough rolled and annealed microstructure consists of recrystallized grains with a
size of 35 m (fig. 4.2.1a). Figure 4.2.1 also shows the condition of the sheet and the
microstructure of AZ31B at the two rolling speeds of 15 and 1000 m/min, and two
temperatures of 300°C and 450°C.
As can be seen, a heavy reduction of 60% without edge cracking was attained in a
single pass by high speed rolling at both temperatures; however, at the lower speed of 15
m/min, minor edge cracks at 450°C and deeper edge-cracks at 300°C are observed. It
seems that high speed rolling significantly improves rollability of magnesium alloy sheets
and that heavy reduction (>60%) is applicable by single-pass rolling even at 300°C.
Additionally, figure 4.2.1 reveals that, over the range of rolling temperatures and speeds
employed in this work, the variation in speed establishes the type of microstructure, i.e.,
low speed leads to a “shear banded” structure, which appears to have undergone little
recrystallization, whereas the high speed leads to an equiaxed structure, which appears to
exhibit considerable recrystallization. The origin of this effect of speed is discussed later.
Changing the temperature from 300°C to 450°C does not change these general
microstructural features, although there are some changes in the details. At the low speed
of 15 m/min, increasing the temperature leads only to less shear banding, whilst at 1000
m/min, the major change in the microstructure with increasing the temperature from
300°C to 450°C is a slight increase in the recrystallized grain size from 9 m to 15
m, respectively.
At 15 m/min, shear bands, which are inclined at an angle of ~45° toward the rolling
direction, are a common feature in all these microstructures and, as an example, are
highlighted by dashed lines in figure 4.2.1d. The initial grains from the rough rolling step
are broken down by twins and/or replaced by fine recrystallized grains.
It was reported that the shear bands may be responsible for the enhancement of the
room temperature ductility of some Mg alloys [13, 14]; however, in the case of AZ31B, it
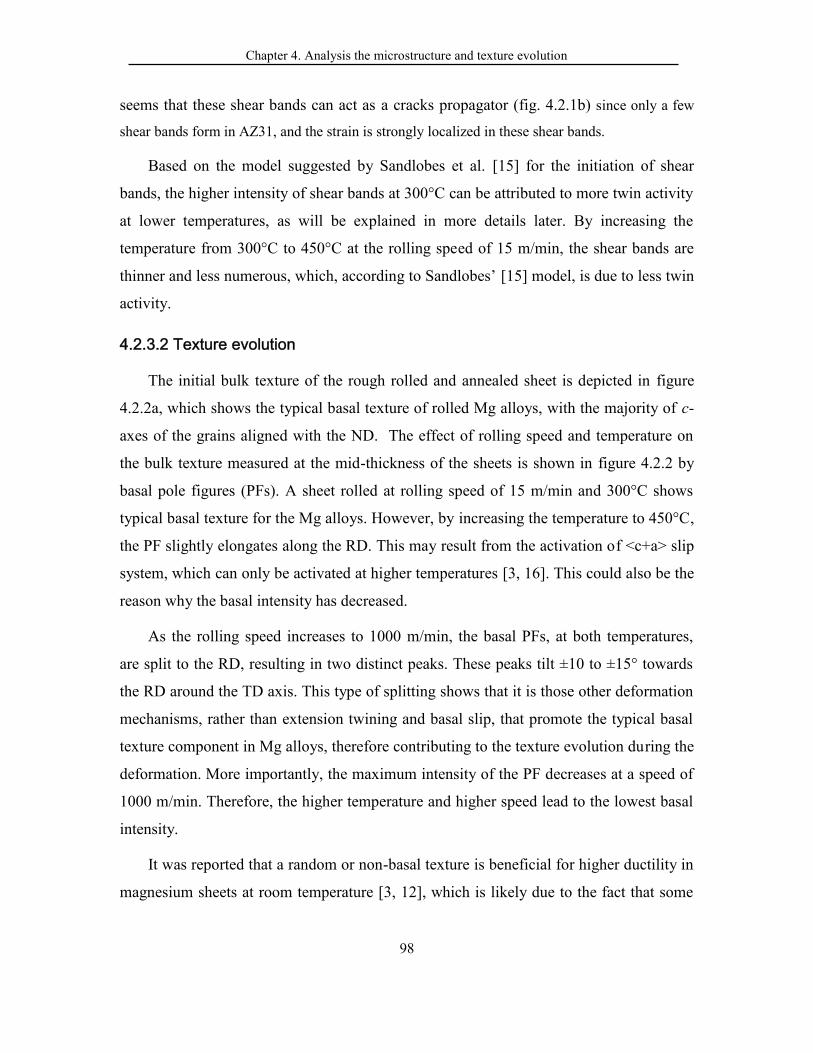
Chapter 4. Analysis the microstructure and texture evolution
98
seems that these shear bands can act as a cracks propagator (fig. 4.2.1b) since only a few
shear bands form in AZ31, and the strain is strongly localized in these shear bands.
Based on the model suggested by Sandlobes et al. [15] for the initiation of shear
bands, the higher intensity of shear bands at 300°C can be attributed to more twin activity
at lower temperatures, as will be explained in more details later. By increasing the
temperature from 300°C to 450°C at the rolling speed of 15 m/min, the shear bands are
thinner and less numerous, which, according to Sandlobes’ [15] model, is due to less twin
activity.
4.2.3.2 Texture evolution
The initial bulk texture of the rough rolled and annealed sheet is depicted in figure
4.2.2a, which shows the typical basal texture of rolled Mg alloys, with the majority of c-
axes of the grains aligned with the ND. The effect of rolling speed and temperature on
the bulk texture measured at the mid-thickness of the sheets is shown in figure 4.2.2 by
basal pole figures (PFs). A sheet rolled at rolling speed of 15 m/min and 300°C shows
typical basal texture for the Mg alloys. However, by increasing the temperature to 450°C,
the PF slightly elongates along the RD. This may result from the activation of <c+a> slip
system, which can only be activated at higher temperatures [3, 16]. This could also be the
reason why the basal intensity has decreased.
As the rolling speed increases to 1000 m/min, the basal PFs, at both temperatures,
are split to the RD, resulting in two distinct peaks. These peaks tilt ±10 to ±15° towards
the RD around the TD axis. This type of splitting shows that it is those other deformation
mechanisms, rather than extension twining and basal slip, that promote the typical basal
texture component in Mg alloys, therefore contributing to the texture evolution during the
deformation. More importantly, the maximum intensity of the PF decreases at a speed of
1000 m/min. Therefore, the higher temperature and higher speed lead to the lowest basal
intensity.
It was reported that a random or non-basal texture is beneficial for higher ductility in
magnesium sheets at room temperature [3, 12], which is likely due to the fact that some
Chapter 4. Analysis the microstructure and texture evolution
99
of the grains in the weaker basal texture and/or non-basal texture have an orientation
favourable for dislocation glide on the basal plan [4].
Fig. 4.2.1: Microstructure of AZ31 (a) rough rolled and annealed, and as-rolled sheet at (b) rollingspeeds of 15 m/min and 300°C, (c) 1000 m/min and 300°C, (d) 15 m/min and 450°C (left: kernelaverage misorientation distribution; right: microstructure) and (e) 1000 m/min and 450°C 1000m/min.
Fig. 4.2.2: {0002} PF for (a) rough rolled sample and finish rolled samples rolled at (b) rolling speedof 15 m/min and 300°C, (c) 1000 m/min and 300°C, (d) 15 m/min and 450°C, and (e) 1000 m/minand 450°C.
Chapter 4. Analysis the microstructure and texture evolution
100
4.2.3.3 Deformation mechanisms during high speed rolling
By using a visco-plastic self-consistent model, Li et al. [16] reported that the
activation of <c+a> slip systems is promoted at high speed rolling due to the heat
generated during deformation. Cottam et al. [17] showed that texture changes, observed
at high levels of yttrium, can be attributed to the reduction in critical resolved shear stress
for <c+a> slip at 400°C. Agnew et al. [3] also reported that the activation of <c+a> slip
can have a significant role in splitting the basal poles from the ND towards the RD in the
plain strain compression of yttrium and lithium containing Mg alloys. However, as can be
seen in figure 4.2.2c, even at 300°C the splitting can be observed for the sheet rolled at
high speed. Therefore, it seems that all systems except <c+a> slip systems are also
responsible for splitting at least at lower temperatures.
It has been hypothesized by Couling [18] that secondary twining can be a potential
mechanism to promote the splitting of the basal poles toward the RD. A study by Lee et
al. [19] on the effect of strain rates from 0.01 to 10 s-1 showed that the twinning fraction
increases with increasing strain rate at 300°C. It is known that twins form more rapidly
than a slip band mainly due to their high effective interface velocities [11]. Moreover,
since sufficient slip systems are highly unlikely to form at high strain rates, twining
formation could play a very important role in providing enough deformation mechanisms.
In this work, to study the microstructure and texture evolution more precisely during the
high speed rolling, the rolling mill was suddenly stopped and the deformed sheet was
withdrawn from the work rolls immediately.
The microstructure and texture evolution of the rolled sheet was examined by
observing the RD-ND plane from the entry to the exit of the deformed zone. Figure 4.2.3
shows the microstructure and micro-texture of the samples deformed at 300°C and 1000
m/min. Although the microstructure was quenched by the cold rolls, as suggested by
some authors [20], metadynamic restoration can be extremely rapid in AZ31 at high
strain rates, and even this quenching might have been insufficient to stop meta-dynamic
restoration from progressing. Therefore, the microstructure obtained here is possibly a
combination of dynamic, meta-dynamic, and even static restoration processes.
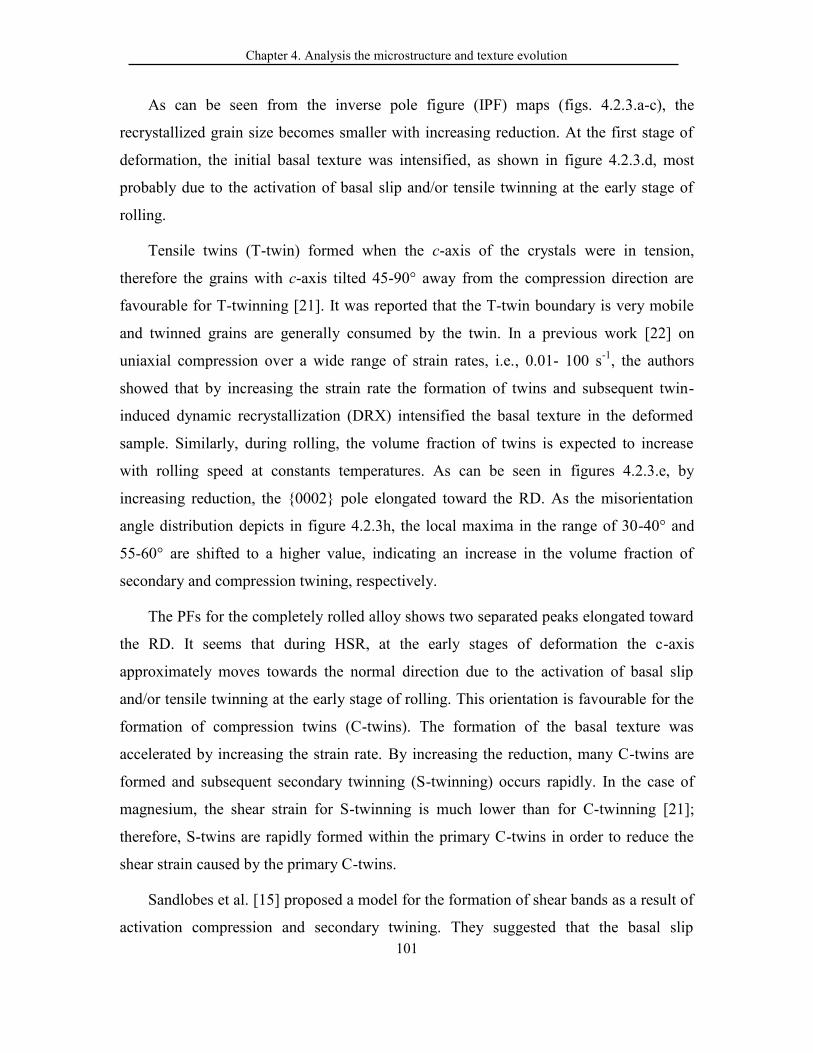
Chapter 4. Analysis the microstructure and texture evolution
101
As can be seen from the inverse pole figure (IPF) maps (figs. 4.2.3.a-c), the
recrystallized grain size becomes smaller with increasing reduction. At the first stage of
deformation, the initial basal texture was intensified, as shown in figure 4.2.3.d, most
probably due to the activation of basal slip and/or tensile twinning at the early stage of
rolling.
Tensile twins (T-twin) formed when the c-axis of the crystals were in tension,
therefore the grains with c-axis tilted 45-90° away from the compression direction are
favourable for T-twinning [21]. It was reported that the T-twin boundary is very mobile
and twinned grains are generally consumed by the twin. In a previous work [22] on
uniaxial compression over a wide range of strain rates, i.e., 0.01- 100 s-1, the authors
showed that by increasing the strain rate the formation of twins and subsequent twin-
induced dynamic recrystallization (DRX) intensified the basal texture in the deformed
sample. Similarly, during rolling, the volume fraction of twins is expected to increase
with rolling speed at constants temperatures. As can be seen in figures 4.2.3.e, by
increasing reduction, the {0002} pole elongated toward the RD. As the misorientation
angle distribution depicts in figure 4.2.3h, the local maxima in the range of 30-40° and
55-60° are shifted to a higher value, indicating an increase in the volume fraction of
secondary and compression twining, respectively.
The PFs for the completely rolled alloy shows two separated peaks elongated toward
the RD. It seems that during HSR, at the early stages of deformation the c-axis
approximately moves towards the normal direction due to the activation of basal slip
and/or tensile twinning at the early stage of rolling. This orientation is favourable for the
formation of compression twins (C-twins). The formation of the basal texture was
accelerated by increasing the strain rate. By increasing the reduction, many C-twins are
formed and subsequent secondary twinning (S-twinning) occurs rapidly. In the case of
magnesium, the shear strain for S-twinning is much lower than for C-twinning [21];
therefore, S-twins are rapidly formed within the primary C-twins in order to reduce the
shear strain caused by the primary C-twins.
Sandlobes et al. [15] proposed a model for the formation of shear bands as a result of
activation compression and secondary twining. They suggested that the basal slip
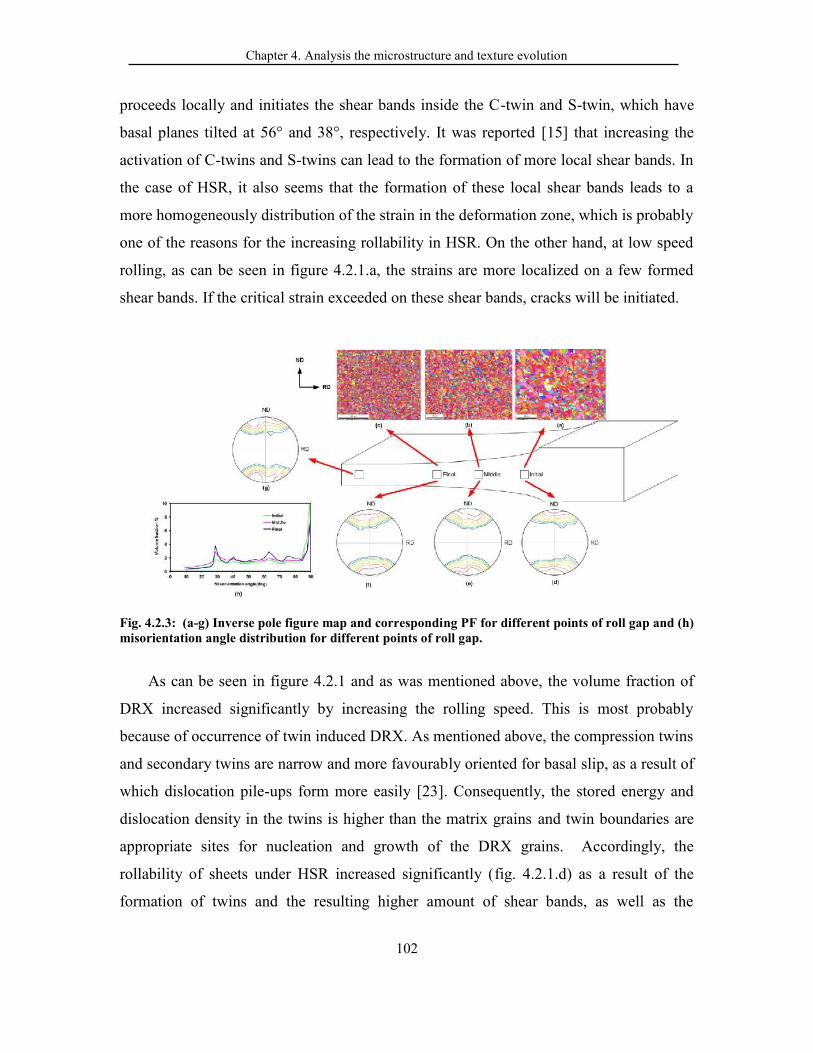
Chapter 4. Analysis the microstructure and texture evolution
102
proceeds locally and initiates the shear bands inside the C-twin and S-twin, which have
basal planes tilted at 56° and 38°, respectively. It was reported [15] that increasing the
activation of C-twins and S-twins can lead to the formation of more local shear bands. In
the case of HSR, it also seems that the formation of these local shear bands leads to a
more homogeneously distribution of the strain in the deformation zone, which is probably
one of the reasons for the increasing rollability in HSR. On the other hand, at low speed
rolling, as can be seen in figure 4.2.1.a, the strains are more localized on a few formed
shear bands. If the critical strain exceeded on these shear bands, cracks will be initiated.
Fig. 4.2.3: (a-g) Inverse pole figure map and corresponding PF for different points of roll gap and (h)misorientation angle distribution for different points of roll gap.
As can be seen in figure 4.2.1 and as was mentioned above, the volume fraction of
DRX increased significantly by increasing the rolling speed. This is most probably
because of occurrence of twin induced DRX. As mentioned above, the compression twins
and secondary twins are narrow and more favourably oriented for basal slip, as a result of
which dislocation pile-ups form more easily [23]. Consequently, the stored energy and
dislocation density in the twins is higher than the matrix grains and twin boundaries are
appropriate sites for nucleation and growth of the DRX grains. Accordingly, the
rollability of sheets under HSR increased significantly (fig. 4.2.1.d) as a result of the
formation of twins and the resulting higher amount of shear bands, as well as the
Chapter 4. Analysis the microstructure and texture evolution
103
subsequent DRX on twins. The combination of shear banding and DRX can dissipate the
deformation energy and release the stress concentration.
4.2.3.4 Annealing behaviour of high speed rolled sheets
The (0002) PFs of the high speed rolled sheet deformed at 300°C and 450°C and
annealed at 400°C for 300 s are shown in figures 4.2.4.a–b. As can be seen, the double-
peak observed in the as-rolled sheet has been replaced by a single-peak at both
temperatures; however, the maximum intensity is nearly constant. Mackenzie et al. [8]
reported the same phenomena for the AZ31–3Li rolled at 350°C and annealed at 400°C
for 10 min. Abdessameud [24] also observed replacing a double-peak by a single-peak in
a twin roll casted AZ31 alloy rolled to an 80% thickness reduction and annealed at 450°C
for 72 hours.
The IPF maps for the sheet rolled at 300°C and 1000 m/min and annealed for 30 s
and 300 s are shown in Fig 4 c-e. As can be seen, after annealing the as-rolled material
for 30 s, normal grain growth takes place and the average grain size increases (fig.
4.2.4.d). The texture of the samples does not significantly change during this step.
However, by increasing the annealing time to 300 s, some grains with basal plane almost
parallel to the sheet plane start to grow, as can be seen in the inverse pole figures in
figure 4.2.4.e. It seems that preferential grain growth of basal grains at the expense of
randomly oriented grains happens during the annealing of rolled sheet.
Fig. 4.2.4: {0002} PF for samples rolled and annealed for 5 min at rolling speeds 1000 m/min and (a)300°C, (b) 450°C, and IPF map for sample rolled at 300°C and 1000 m/min (c) as-rolled, (d) annealedfor (d) 30 s and (e) 300 s, IPF for the grains smaller than 15 m (upper) and grains larger than 15m.

Chapter 4. Analysis the microstructure and texture evolution
104
4.2.4 Conclusion
In summary, this study revealed that the rollability of magnesium alloy sheets is
significantly improved at HSR of 1000 m/min. The texture in the mid-thickness layer is a
split basal texture, possibly due to the increased activity of <c+a> slip and compression
and secondary twinning. It seems that more C-twin and S-twin activation leads to the
formation of local shear bands and, therefore, more homogeneously distribution of the
strain in the deformation zone. Also, due to formation of more twins, the amount of DRX
increases and dissipates the deformation energy and releases the stress concentration. Due
to the preferential grain growth of basal grains, the double-peak observed in the as-rolled
sheets has been replaced by a single-peak; however; the maximum intensity is nearly
constant.
4.2.5 References
[1] H.B. M. Avedesian, ASM specialty handbook. Magnesium and magnesium alloys. , ASMInternational, Materials Park, Ohio, 2000.[2] M. Shamsi, M. Sanjari, A.Z. Hanzaki, Materials Science and Technology, 25 (2009) 1039-1045.[3] S.R. Agnew, M.H. Yoo, C.N. Tomé, Acta Materialia, 49 (2001) 4277-4289.[4] A. Galiyev, R. Kaibyshev, G. Gottstein, Acta Materialia, 49 (2001) 1199-1207.[5] A. Mwembela, E.B. Konopleva, H.J. McQueen, Scripta Materialia, 37 (1997) 1789-1795.[6] S.R. Agnew, O. Duygulu, International Journal of Plasticity, 21 (2005) 1161-1193.[7] M.R. Barnett, Metallurgical and Materials Transactions A: Physical Metallurgy and MaterialsScience, 34 A (2003) 1799-1806.[8] L.W.F. Mackenzie, M. Pekguleryuz, Materials Science and Engineering: A, 480 (2008) 189-197.[9] H. Kon, T. Sakai, H. Utsunomiya, S. Minamiguchi, Materials Transactions, 48 (2007) 2023-2027.[10] H. Utsunomiya, T. Sakai, S. Minamiguchi, H. Koh, in, 2006, pp. 201-204.[11] G. Hamada, T. Sakai, H. Utsunomiya, in, 2010, pp. 227-231.[12] T. Sakai, Y. Watanabe, H. Utsunomiya, in, 2009, pp. 483-486.[13] M.R. Barnett, M.D. Nave, C.J. Bettles, Materials Science and Engineering A, 386 (2004)205-211.[14] H. Yan, S.W. Xu, R.S. Chen, S. Kamado, T. Honma, E.H. Han, Scripta Materialia, 64 (2011)141-144.[15] S. Sandlöbes, S. Zaefferer, I. Schestakow, S. Yi, R. Gonzalez-Martinez, Acta Materialia, 59(2011) 429-439.[16] H. Li, E. Hsu, J. Szpunar, H. Utsunomiya, T. Sakai, Journal of Materials Science, 43 (2008)7148-7156.

Chapter 4. Analysis the microstructure and texture evolution
105
[17] R. Cottam, J. Robson, G. Lorimer, B. Davis, Materials Science and Engineering: A, 485(2008) 375-382.[18] S.L. Couling, F. Pashak, L. Sturkey, Trans. ASM, 51 (1959) 94-107.[19] B.H. Lee, W. Bang, S. Ahn, C.S. Lee, Metallurgical and Materials Transactions A: PhysicalMetallurgy and Materials Science, 39 A (2008) 1426-1434.[20] M. Sanjari, S.A. Farzadfar, S. Yue, E. Essadiqi, in, 2010, pp. 481-486.[21] S. Yi, I. Schestakow, S. Zaefferer, Materials Science and Engineering: A, 516 (2009) 58-64.[22] M. Sanjari, S.A. Farzadfar, I.H. Jung, E. Essadiqi, S. Yue, Materials Science andTechnology, (2011).[23] É. Martin, J.J. Jonas, Acta Materialia, 58 (2010) 4253-4266.[24] S. Abdessameud, D. Bradai, Canadian Metallurgical Quarterly, 48 (2009) 433-442.

Chapter 4. Analysis the microstructure and texture evolution
106
Chapter 5. Microstructure and texture evolution of Mg-Zn-Ce magnesium alloys
107
Chapter 5
Microstructure and texture evolution of Mg-Zn-Ce
magnesium alloys sheets and associated restoration
mechanisms during annealing
It has recently been found that the addition of rare earth (RE) elements significantly
weakens the rolling texture of Mg alloys. Therefore in this Chapter, the texture and
microstructure evolution in four Mg-Zn-Ce alloys was compared to that of Mg-3Al-1Zn
(AZ31) alloy following rolling and subsequent isothermal annealing. To do that, the
nucleation and growth of recrystallized grains will be studied in both as-deformed and
annealing state in Mg-Zn-Ce systems and compare with AZ31 as a reference alloy. In
addition the effect of precipitates will be investigated in the Mg-Zn-Ce alloys systems by
changing the Ce and Zn contents in the alloy.
Chapter 5. Microstructure and texture evolution of Mg-Zn-Ce magnesium alloys
108
* This section has been published: M. Sanjari, S.A. Farzadfar, H. Utsunomiya, T. Sakai, E. Essadiqi,S. Yue, Microstructure and texture evolution of Mg-Zn-Ce magnesium alloys sheets and associatedrestoration mechanisms during annealing, Materials Science and Engineering A, 2012, 561 , pp. 191-202
The texture evolution in four Mg-Zn-Ce alloys was compared to that of Mg-3Al-1Zn
(AZ31) alloy following rolling and subsequent isothermal annealing. All the as-cast and
homogenized alloys were rolled through two stages that can be characterised as rough
rolling and finish rolling, respectively. To investigate the effect of finish rolling
temperature, one finish rolling pass with a 65% reduction in thickness was performed at
300°C and 450°C. Of the studied compositions, the Mg-1Zn-1Ce, which had the highest
Ce/Zn ratio, showed the weakest as-rolled texture and homogenous shear
banding/twinning. Changing the Zn content changed the particle size in alloys subject to texture
weakening and altered the static recrystallization mechanism. On annealing, the maximum
intensity of basal pole figures decreased as recrystallization progressed. In the Mg-1Zn-
1Ce (which had the highest Ce/Zn), texture weakening is maintained even after full
recrystallization when grain coarsening occurs. However, in the Mg-4Zn-1Ce and AZ31
alloys, texture strengthening occurs when grain coarsening occurs, and the double split
basal peak is replaced by a single peak. In these two alloys, grain coarsening is also
accompanied by a bimodal grain size, whereas in the Mg-1Zn-1Ce alloy the grain
coarsening leads to a uniform grain size. It is concluded that the differences between the
Ce bearing alloys is related to Zn; increasing Zn decreases the solubility of Ce, which can
influence texture changes.
Chapter 5. Microstructure and texture evolution of Mg-Zn-Ce magnesium alloys
109
5.1. Introduction
One of the major obstacles for using magnesium alloys is that a preferred
crystallographic orientation (texture) develops in wrought alloys [1-3], which
substantially limits the subsequent formability, especially in flat-rolled sheets. It has
recently been found that the addition of rare earth (RE) elements, such as yttrium, cerium,
or neodymium, significantly weakens the rolling or extrusion texture of Mg alloys [4-9].
The texture weakening mechanism has been associated with different mechanisms, such
as particle stimulated mechanism (PSN) [10, 11] or deformation or shear bands
containing twins [5] or retardation of dynamic recrystallization (DRX) [12]. Mackenzie et
al. [7] found that the basal texture component was weakened and replaced by a
component in which basal poles are rotated towards the transverse direction in Mg-Zn-
Ce alloys. Hantzsche et al. [4] studied the effect of Ce, Nd, and Y in the binary alloy
system on the texture development during the rolling. They suggested that the texture
weakening mechanism is connected with the appearance of deformation bands containing
twins and retarded grain growth. Al-Samman et al. [13] studied the effect of selected rare
earths on the final texture of ZEK100 rolled and annealed. They found that PSN was one
of the mechanisms for texture weakening; however, they found that solute related effects
play a more significant role in highly soluble alloys, such as Gd and Nd. Stanford [8] also
suggested that dislocation/solute interactions can play an important role in texture
weakening and, because of the large atomic radii, Ce and La are the most effective
texture modifiers. Since Ce exhibits small solid solubility in magnesium, by increasing
the Ce concentrations, alloys will have Ce in solid solution as well as in precipitates [12].
The size and morphologies of the particles can also affect the mechanism of texture
weakening by PSN and grain boundary pinning [14]. Moreover, both solute interactions
and precipitates can strongly affect primary recrystallization and grain growth during the
annealing process.
Although the crystallographic texture evolution of Mg alloys have already been
studied as a function of alloying elements and different thermomechanical processing
parameters, there is still a lack of work regarding whether the RE-textures are mainly
associated with changes in the deformation texture or also with changes in the
Chapter 5. Microstructure and texture evolution of Mg-Zn-Ce magnesium alloys
110
recrystallization texture. In particular, little work has been done on the texture evolution
and elucidation of static recrystallization (SRX) mechanism and optimal RE elements and
compositions, second phase formation, solute clustering, etc. [4, 8, 13, 14].
In this study, the nucleation and growth of recrystallized grains will be studied in
both as-deformed and annealing state in Mg-Zn-Ce systems and compared with AZ31 as
a reference alloy. In addition, the effect of precipitates will be investigated in the Mg-Zn-
Ce alloys systems by changing the Ce and Zn contents in the alloy.
5. 2. Experimental procedure
The following four alloys in the Mg-Zn-Ce system were cast into ingots of 70 mm x
110 mm x 500 mm and machined into plates 70 mm x 110 mm x 6 mm thickness:
1- Mg-1Zn-0.5Ce
2- Mg-1Zn-1Ce
3- Mg-2Zn-1Ce
4- Mg-4Zn-1Ce
The chemical compositions of the Mg-Zn-Ce alloys are shown in table 5.1. The as-
cast material was homogenized at 450°C for 24 hr. To compare the results with the
commercial AZ31 alloy, an AZ31 alloy with the following chemical composition (%wt):
3% Al, 0.9% Zn, 0.67% Mn and Mg (balance) was cast as a plate with 6 mm thickness
and homogenized at 350°C for 4 hr.
The rolling experiments were conducted through two steps: rough rolling and finish
rolling, which were explained in Chapter 4.
The samples were cut in RD-ND planes, mounted, ground, and etched as explained
in Chapter 4. To quantify the volume fractions of the phases in the Mg-Zn-Ce alloys,
quantitative metallographic studies were also performed using the image-analysis toolbox
of the Clemex Vision Lite imaging system to quantify the volume fractions of the phases
in accordance with ASTM E1245 [15]. The macro-texture was evaluated in a Siemens D-
500 X-ray diffractometer equipped with a texture goniometer using Co radiation in TD-
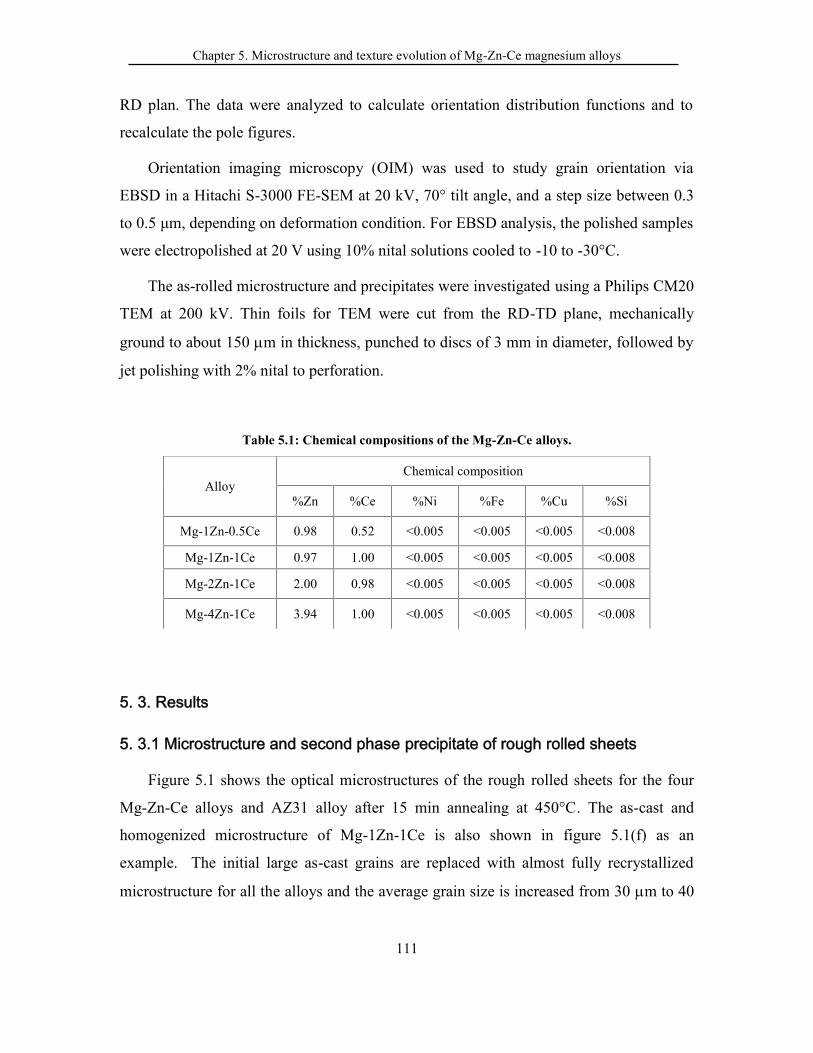
Chapter 5. Microstructure and texture evolution of Mg-Zn-Ce magnesium alloys
111
RD plan. The data were analyzed to calculate orientation distribution functions and to
recalculate the pole figures.
Orientation imaging microscopy (OIM) was used to study grain orientation via
EBSD in a Hitachi S-3000 FE-SEM at 20 kV, 70° tilt angle, and a step size between 0.3
to 0.5 μm, depending on deformation condition. For EBSD analysis, the polished samples
were electropolished at 20 V using 10% nital solutions cooled to -10 to -30°C.
The as-rolled microstructure and precipitates were investigated using a Philips CM20
TEM at 200 kV. Thin foils for TEM were cut from the RD-TD plane, mechanically
ground to about 150 m in thickness, punched to discs of 3 mm in diameter, followed by
jet polishing with 2% nital to perforation.
Table 5.1: Chemical compositions of the Mg-Zn-Ce alloys.
5. 3. Results
5. 3.1 Microstructure and second phase precipitate of rough rolled sheets
Figure 5.1 shows the optical microstructures of the rough rolled sheets for the four
Mg-Zn-Ce alloys and AZ31 alloy after 15 min annealing at 450°C. The as-cast and
homogenized microstructure of Mg-1Zn-1Ce is also shown in figure 5.1(f) as an
example. The initial large as-cast grains are replaced with almost fully recrystallized
microstructure for all the alloys and the average grain size is increased from 30 m to 40
AlloyChemical composition
%Zn %Ce %Ni %Fe %Cu %Si
Mg-1Zn-0.5Ce 0.98 0.52 <0.005 <0.005 <0.005 <0.008
Mg-1Zn-1Ce 0.97 1.00 <0.005 <0.005 <0.005 <0.008
Mg-2Zn-1Ce 2.00 0.98 <0.005 <0.005 <0.005 <0.008
Mg-4Zn-1Ce 3.94 1.00 <0.005 <0.005 <0.005 <0.008
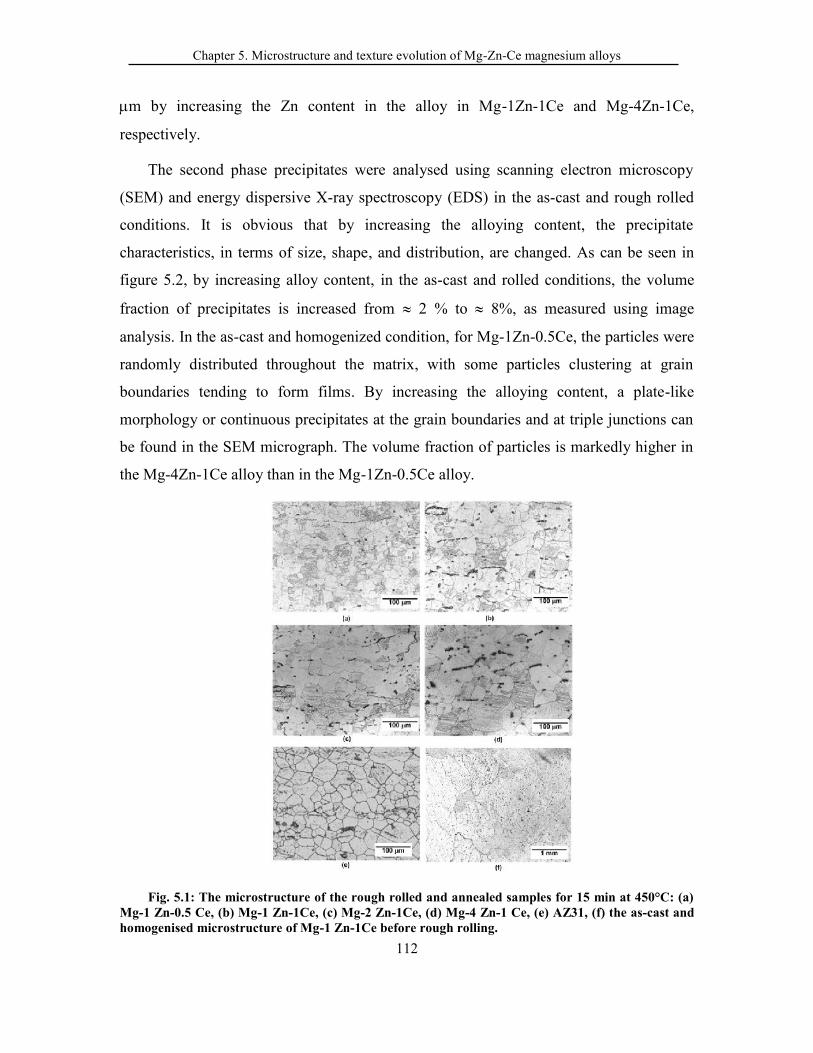
Chapter 5. Microstructure and texture evolution of Mg-Zn-Ce magnesium alloys
112
m by increasing the Zn content in the alloy in Mg-1Zn-1Ce and Mg-4Zn-1Ce,
respectively.
The second phase precipitates were analysed using scanning electron microscopy
(SEM) and energy dispersive X-ray spectroscopy (EDS) in the as-cast and rough rolled
conditions. It is obvious that by increasing the alloying content, the precipitate
characteristics, in terms of size, shape, and distribution, are changed. As can be seen in
figure 5.2, by increasing alloy content, in the as-cast and rolled conditions, the volume
fraction of precipitates is increased from 2 % to 8%, as measured using image
analysis. In the as-cast and homogenized condition, for Mg-1Zn-0.5Ce, the particles were
randomly distributed throughout the matrix, with some particles clustering at grain
boundaries tending to form films. By increasing the alloying content, a plate-like
morphology or continuous precipitates at the grain boundaries and at triple junctions can
be found in the SEM micrograph. The volume fraction of particles is markedly higher in
the Mg-4Zn-1Ce alloy than in the Mg-1Zn-0.5Ce alloy.
Fig. 5.1: The microstructure of the rough rolled and annealed samples for 15 min at 450°C: (a)Mg-1 Zn-0.5 Ce, (b) Mg-1 Zn-1Ce, (c) Mg-2 Zn-1Ce, (d) Mg-4 Zn-1 Ce, (e) AZ31, (f) the as-cast andhomogenised microstructure of Mg-1 Zn-1Ce before rough rolling.
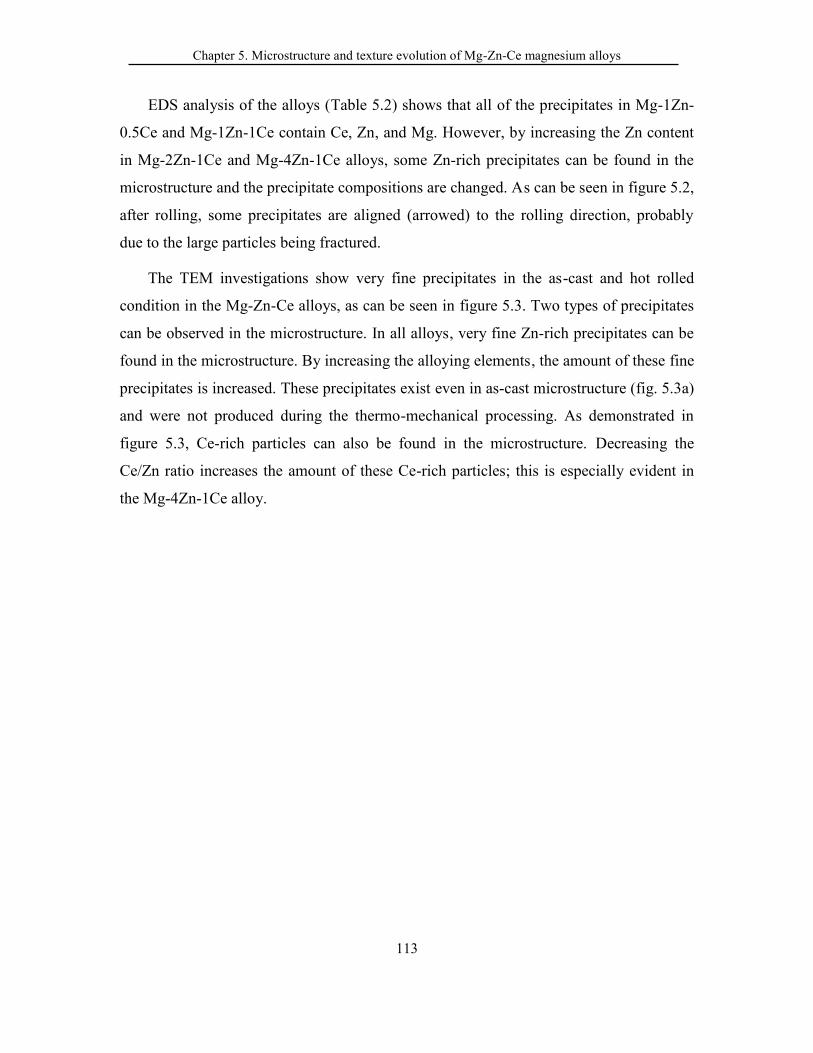
Chapter 5. Microstructure and texture evolution of Mg-Zn-Ce magnesium alloys
113
EDS analysis of the alloys (Table 5.2) shows that all of the precipitates in Mg-1Zn-
0.5Ce and Mg-1Zn-1Ce contain Ce, Zn, and Mg. However, by increasing the Zn content
in Mg-2Zn-1Ce and Mg-4Zn-1Ce alloys, some Zn-rich precipitates can be found in the
microstructure and the precipitate compositions are changed. As can be seen in figure 5.2,
after rolling, some precipitates are aligned (arrowed) to the rolling direction, probably
due to the large particles being fractured.
The TEM investigations show very fine precipitates in the as-cast and hot rolled
condition in the Mg-Zn-Ce alloys, as can be seen in figure 5.3. Two types of precipitates
can be observed in the microstructure. In all alloys, very fine Zn-rich precipitates can be
found in the microstructure. By increasing the alloying elements, the amount of these fine
precipitates is increased. These precipitates exist even in as-cast microstructure (fig. 5.3a)
and were not produced during the thermo-mechanical processing. As demonstrated in
figure 5.3, Ce-rich particles can also be found in the microstructure. Decreasing the
Ce/Zn ratio increases the amount of these Ce-rich particles; this is especially evident in
the Mg-4Zn-1Ce alloy.
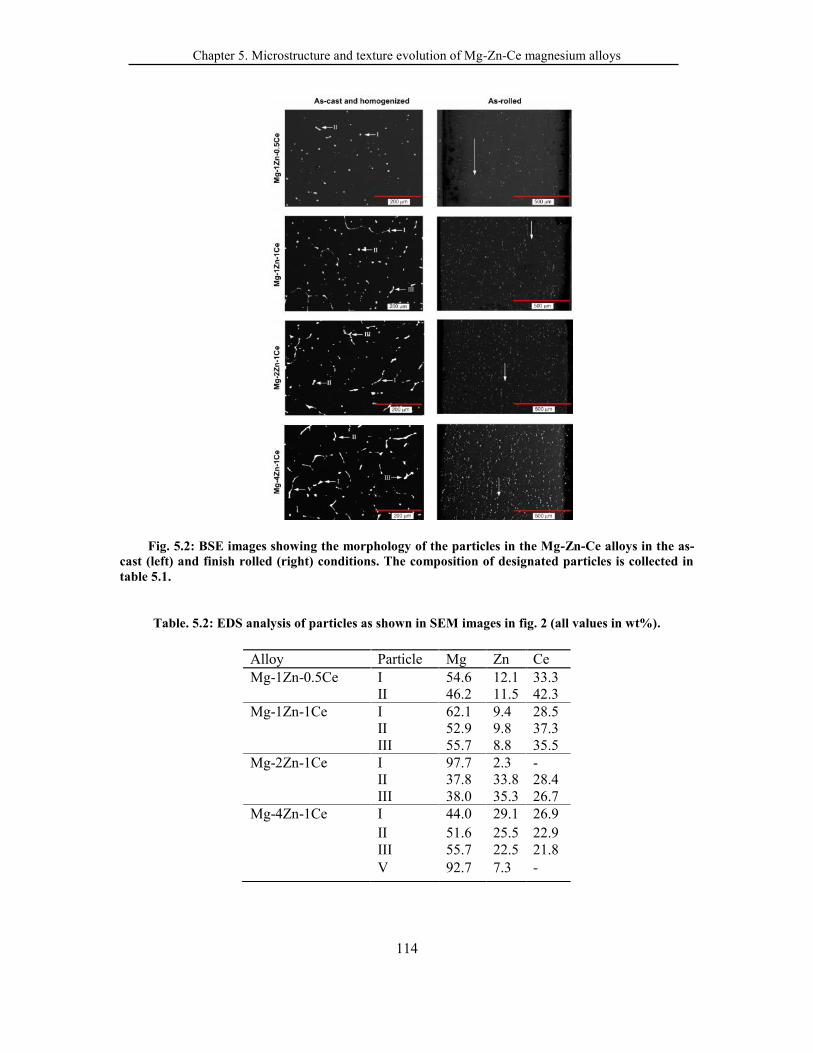
Chapter 5. Microstructure and texture evolution of Mg-Zn-Ce magnesium alloys
114
Fig. 5.2: BSE images showing the morphology of the particles in the Mg-Zn-Ce alloys in the as-cast (left) and finish rolled (right) conditions. The composition of designated particles is collected intable 5.1.
Table. 5.2: EDS analysis of particles as shown in SEM images in fig. 2 (all values in wt%).
Alloy Particle Mg Zn CeMg-1Zn-0.5Ce I 54.6 12.1 33.3
II 46.2 11.5 42.3Mg-1Zn-1Ce I 62.1 9.4 28.5
II 52.9 9.8 37.3III 55.7 8.8 35.5
Mg-2Zn-1Ce I 97.7 2.3 -II 37.8 33.8 28.4III 38.0 35.3 26.7
Mg-4Zn-1Ce I 44.0 29.1 26.9II 51.6 25.5 22.9III 55.7 22.5 21.8V 92.7 7.3 -
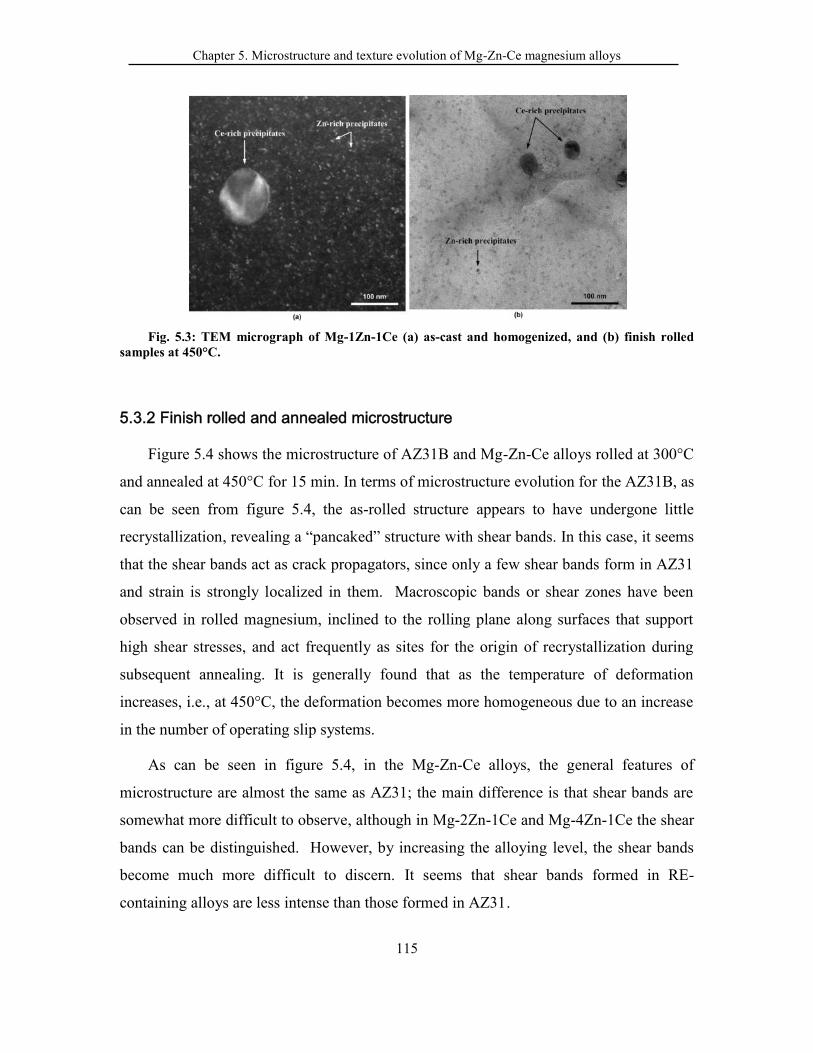
Chapter 5. Microstructure and texture evolution of Mg-Zn-Ce magnesium alloys
115
Fig. 5.3: TEM micrograph of Mg-1Zn-1Ce (a) as-cast and homogenized, and (b) finish rolledsamples at 450°C.
5.3.2 Finish rolled and annealed microstructure
Figure 5.4 shows the microstructure of AZ31B and Mg-Zn-Ce alloys rolled at 300°C
and annealed at 450°C for 15 min. In terms of microstructure evolution for the AZ31B, as
can be seen from figure 5.4, the as-rolled structure appears to have undergone little
recrystallization, revealing a “pancaked” structure with shear bands. In this case, it seems
that the shear bands act as crack propagators, since only a few shear bands form in AZ31
and strain is strongly localized in them. Macroscopic bands or shear zones have been
observed in rolled magnesium, inclined to the rolling plane along surfaces that support
high shear stresses, and act frequently as sites for the origin of recrystallization during
subsequent annealing. It is generally found that as the temperature of deformation
increases, i.e., at 450°C, the deformation becomes more homogeneous due to an increase
in the number of operating slip systems.
As can be seen in figure 5.4, in the Mg-Zn-Ce alloys, the general features of
microstructure are almost the same as AZ31; the main difference is that shear bands are
somewhat more difficult to observe, although in Mg-2Zn-1Ce and Mg-4Zn-1Ce the shear
bands can be distinguished. However, by increasing the alloying level, the shear bands
become much more difficult to discern. It seems that shear bands formed in RE-
containing alloys are less intense than those formed in AZ31.
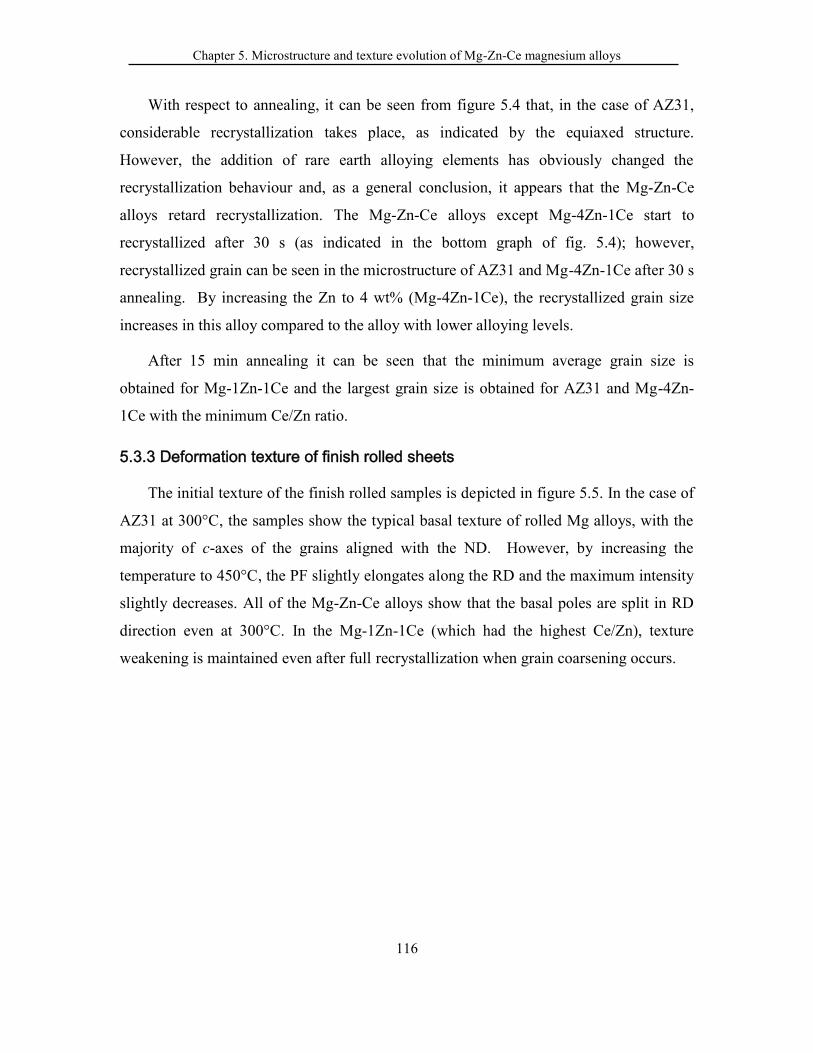
Chapter 5. Microstructure and texture evolution of Mg-Zn-Ce magnesium alloys
116
With respect to annealing, it can be seen from figure 5.4 that, in the case of AZ31,
considerable recrystallization takes place, as indicated by the equiaxed structure.
However, the addition of rare earth alloying elements has obviously changed the
recrystallization behaviour and, as a general conclusion, it appears that the Mg-Zn-Ce
alloys retard recrystallization. The Mg-Zn-Ce alloys except Mg-4Zn-1Ce start to
recrystallized after 30 s (as indicated in the bottom graph of fig. 5.4); however,
recrystallized grain can be seen in the microstructure of AZ31 and Mg-4Zn-1Ce after 30 s
annealing. By increasing the Zn to 4 wt% (Mg-4Zn-1Ce), the recrystallized grain size
increases in this alloy compared to the alloy with lower alloying levels.
After 15 min annealing it can be seen that the minimum average grain size is
obtained for Mg-1Zn-1Ce and the largest grain size is obtained for AZ31 and Mg-4Zn-
1Ce with the minimum Ce/Zn ratio.
5.3.3 Deformation texture of finish rolled sheets
The initial texture of the finish rolled samples is depicted in figure 5.5. In the case of
AZ31 at 300°C, the samples show the typical basal texture of rolled Mg alloys, with the
majority of c-axes of the grains aligned with the ND. However, by increasing the
temperature to 450°C, the PF slightly elongates along the RD and the maximum intensity
slightly decreases. All of the Mg-Zn-Ce alloys show that the basal poles are split in RD
direction even at 300°C. In the Mg-1Zn-1Ce (which had the highest Ce/Zn), texture
weakening is maintained even after full recrystallization when grain coarsening occurs.
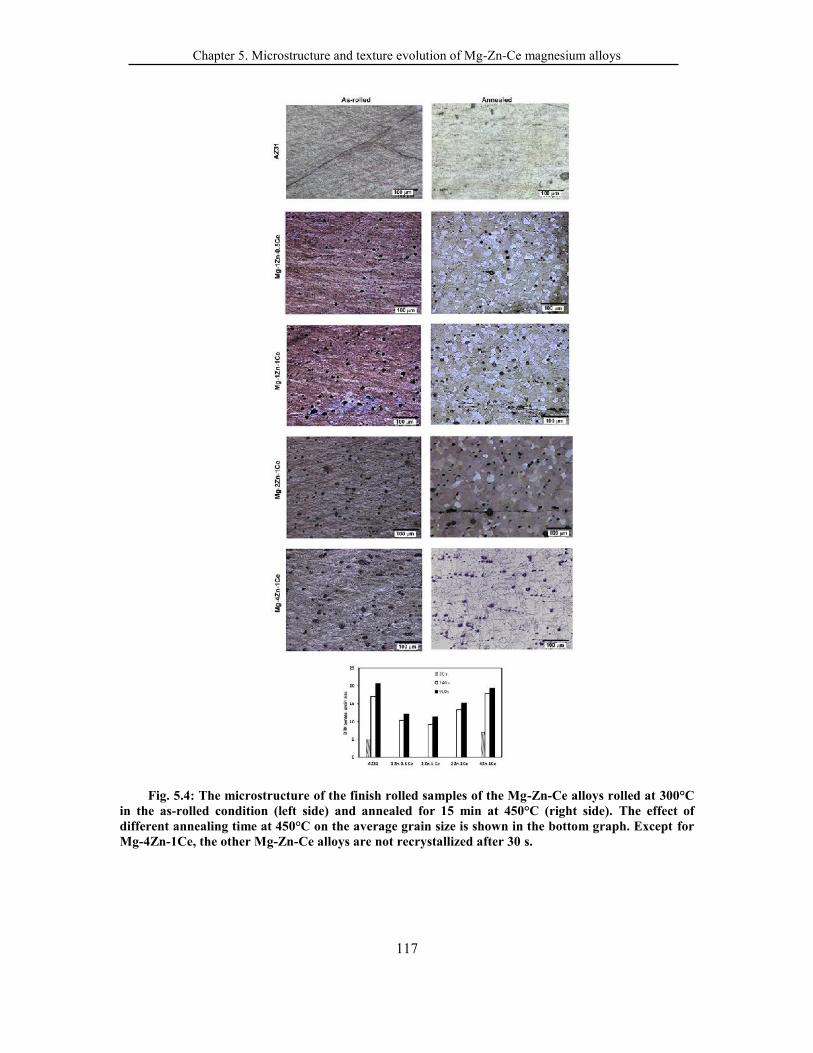
Chapter 5. Microstructure and texture evolution of Mg-Zn-Ce magnesium alloys
117
Fig. 5.4: The microstructure of the finish rolled samples of the Mg-Zn-Ce alloys rolled at 300°Cin the as-rolled condition (left side) and annealed for 15 min at 450°C (right side). The effect ofdifferent annealing time at 450°C on the average grain size is shown in the bottom graph. Except forMg-4Zn-1Ce, the other Mg-Zn-Ce alloys are not recrystallized after 30 s.
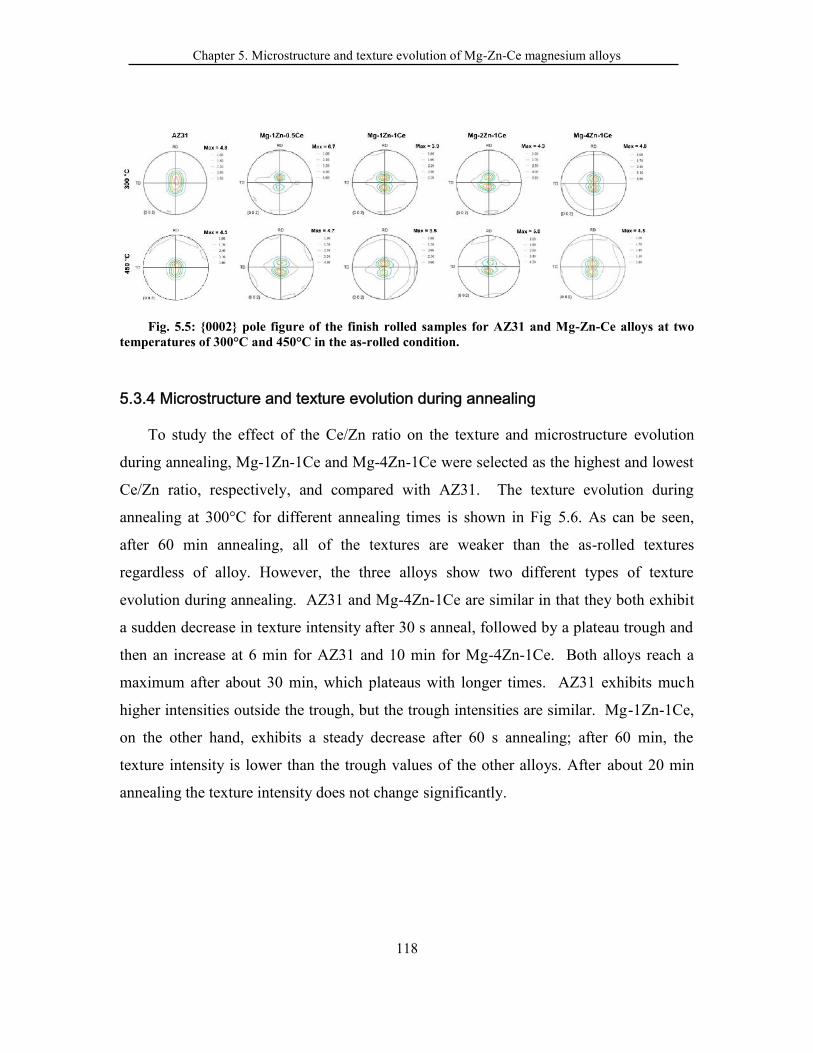
Chapter 5. Microstructure and texture evolution of Mg-Zn-Ce magnesium alloys
118
Fig. 5.5: {0002} pole figure of the finish rolled samples for AZ31 and Mg-Zn-Ce alloys at twotemperatures of 300°C and 450°C in the as-rolled condition.
5.3.4 Microstructure and texture evolution during annealing
To study the effect of the Ce/Zn ratio on the texture and microstructure evolution
during annealing, Mg-1Zn-1Ce and Mg-4Zn-1Ce were selected as the highest and lowest
Ce/Zn ratio, respectively, and compared with AZ31. The texture evolution during
annealing at 300°C for different annealing times is shown in Fig 5.6. As can be seen,
after 60 min annealing, all of the textures are weaker than the as-rolled textures
regardless of alloy. However, the three alloys show two different types of texture
evolution during annealing. AZ31 and Mg-4Zn-1Ce are similar in that they both exhibit
a sudden decrease in texture intensity after 30 s anneal, followed by a plateau trough and
then an increase at 6 min for AZ31 and 10 min for Mg-4Zn-1Ce. Both alloys reach a
maximum after about 30 min, which plateaus with longer times. AZ31 exhibits much
higher intensities outside the trough, but the trough intensities are similar. Mg-1Zn-1Ce,
on the other hand, exhibits a steady decrease after 60 s annealing; after 60 min, the
texture intensity is lower than the trough values of the other alloys. After about 20 min
annealing the texture intensity does not change significantly.
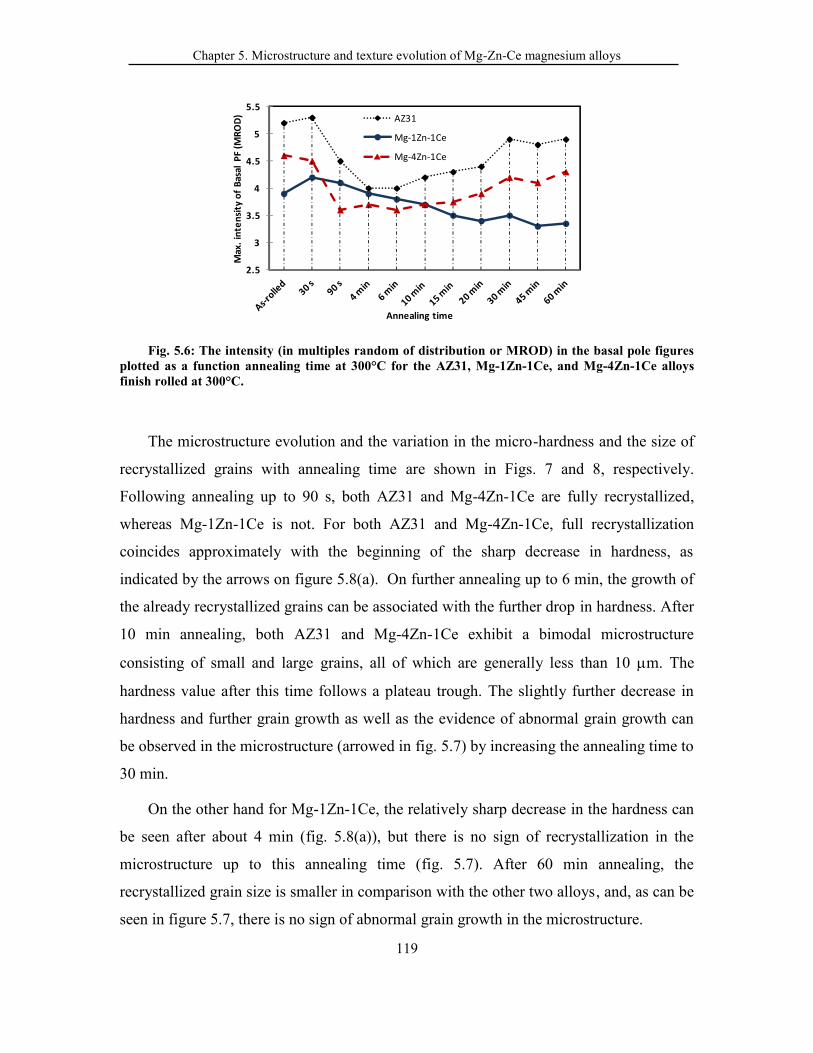
Chapter 5. Microstructure and texture evolution of Mg-Zn-Ce magnesium alloys
119
Fig. 5.6: The intensity (in multiples random of distribution or MROD) in the basal pole figuresplotted as a function annealing time at 300°C for the AZ31, Mg-1Zn-1Ce, and Mg-4Zn-1Ce alloysfinish rolled at 300°C.
The microstructure evolution and the variation in the micro-hardness and the size of
recrystallized grains with annealing time are shown in Figs. 7 and 8, respectively.
Following annealing up to 90 s, both AZ31 and Mg-4Zn-1Ce are fully recrystallized,
whereas Mg-1Zn-1Ce is not. For both AZ31 and Mg-4Zn-1Ce, full recrystallization
coincides approximately with the beginning of the sharp decrease in hardness, as
indicated by the arrows on figure 5.8(a). On further annealing up to 6 min, the growth of
the already recrystallized grains can be associated with the further drop in hardness. After
10 min annealing, both AZ31 and Mg-4Zn-1Ce exhibit a bimodal microstructure
consisting of small and large grains, all of which are generally less than 10 m. The
hardness value after this time follows a plateau trough. The slightly further decrease in
hardness and further grain growth as well as the evidence of abnormal grain growth can
be observed in the microstructure (arrowed in fig. 5.7) by increasing the annealing time to
30 min.
On the other hand for Mg-1Zn-1Ce, the relatively sharp decrease in the hardness can
be seen after about 4 min (fig. 5.8(a)), but there is no sign of recrystallization in the
microstructure up to this annealing time (fig. 5.7). After 60 min annealing, the
recrystallized grain size is smaller in comparison with the other two alloys, and, as can be
seen in figure 5.7, there is no sign of abnormal grain growth in the microstructure.
2.5
3
3.5
4
4.5
5
5.5
Max
. int
ensi
ty o
f Ba
sal
PF (M
ROD
)
Annealing time
AZ31
Mg-1Zn-1Ce
Mg-4Zn-1Ce
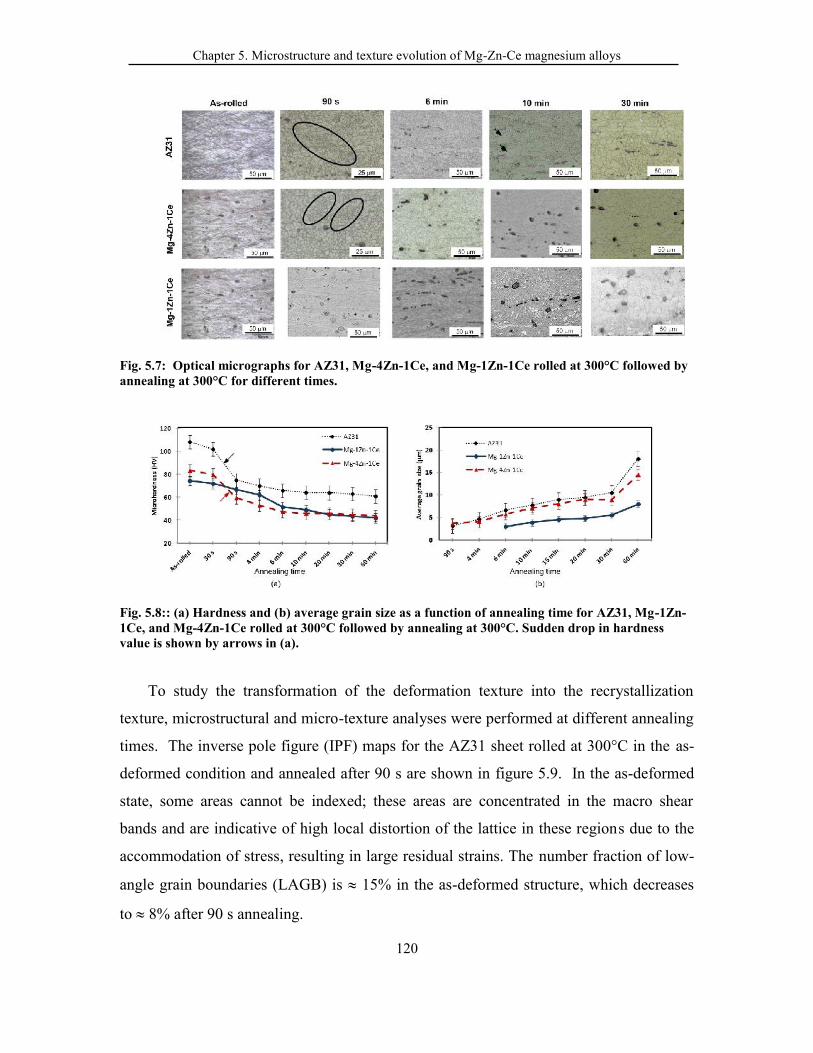
Chapter 5. Microstructure and texture evolution of Mg-Zn-Ce magnesium alloys
120
Fig. 5.7: Optical micrographs for AZ31, Mg-4Zn-1Ce, and Mg-1Zn-1Ce rolled at 300°C followed byannealing at 300°C for different times.
Fig. 5.8:: (a) Hardness and (b) average grain size as a function of annealing time for AZ31, Mg-1Zn-1Ce, and Mg-4Zn-1Ce rolled at 300°C followed by annealing at 300°C. Sudden drop in hardnessvalue is shown by arrows in (a).
To study the transformation of the deformation texture into the recrystallization
texture, microstructural and micro-texture analyses were performed at different annealing
times. The inverse pole figure (IPF) maps for the AZ31 sheet rolled at 300°C in the as-
deformed condition and annealed after 90 s are shown in figure 5.9. In the as-deformed
state, some areas cannot be indexed; these areas are concentrated in the macro shear
bands and are indicative of high local distortion of the lattice in these regions due to the
accommodation of stress, resulting in large residual strains. The number fraction of low-
angle grain boundaries (LAGB) is 15% in the as-deformed structure, which decreases
to 8% after 90 s annealing.
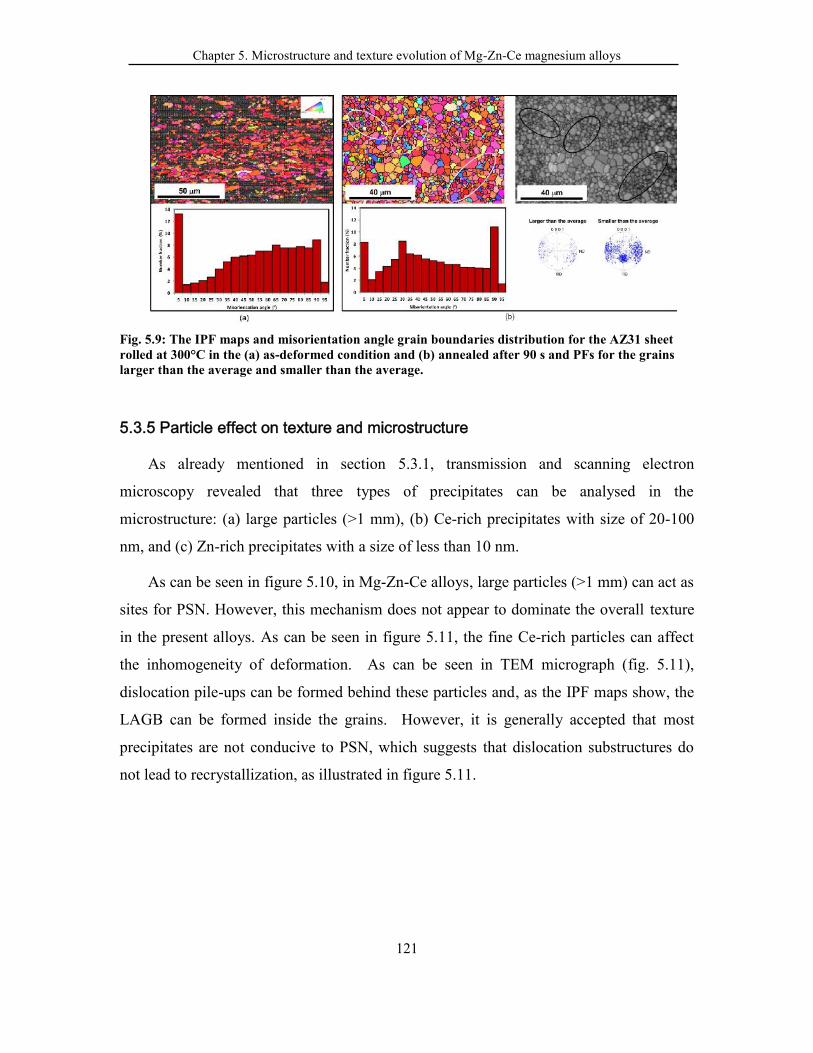
Chapter 5. Microstructure and texture evolution of Mg-Zn-Ce magnesium alloys
121
Fig. 5.9: The IPF maps and misorientation angle grain boundaries distribution for the AZ31 sheetrolled at 300°C in the (a) as-deformed condition and (b) annealed after 90 s and PFs for the grainslarger than the average and smaller than the average.
5.3.5 Particle effect on texture and microstructure
As already mentioned in section 5.3.1, transmission and scanning electron
microscopy revealed that three types of precipitates can be analysed in the
microstructure: (a) large particles (>1 mm), (b) Ce-rich precipitates with size of 20-100
nm, and (c) Zn-rich precipitates with a size of less than 10 nm.
As can be seen in figure 5.10, in Mg-Zn-Ce alloys, large particles (>1 mm) can act as
sites for PSN. However, this mechanism does not appear to dominate the overall texture
in the present alloys. As can be seen in figure 5.11, the fine Ce-rich particles can affect
the inhomogeneity of deformation. As can be seen in TEM micrograph (fig. 5.11),
dislocation pile-ups can be formed behind these particles and, as the IPF maps show, the
LAGB can be formed inside the grains. However, it is generally accepted that most
precipitates are not conducive to PSN, which suggests that dislocation substructures do
not lead to recrystallization, as illustrated in figure 5.11.
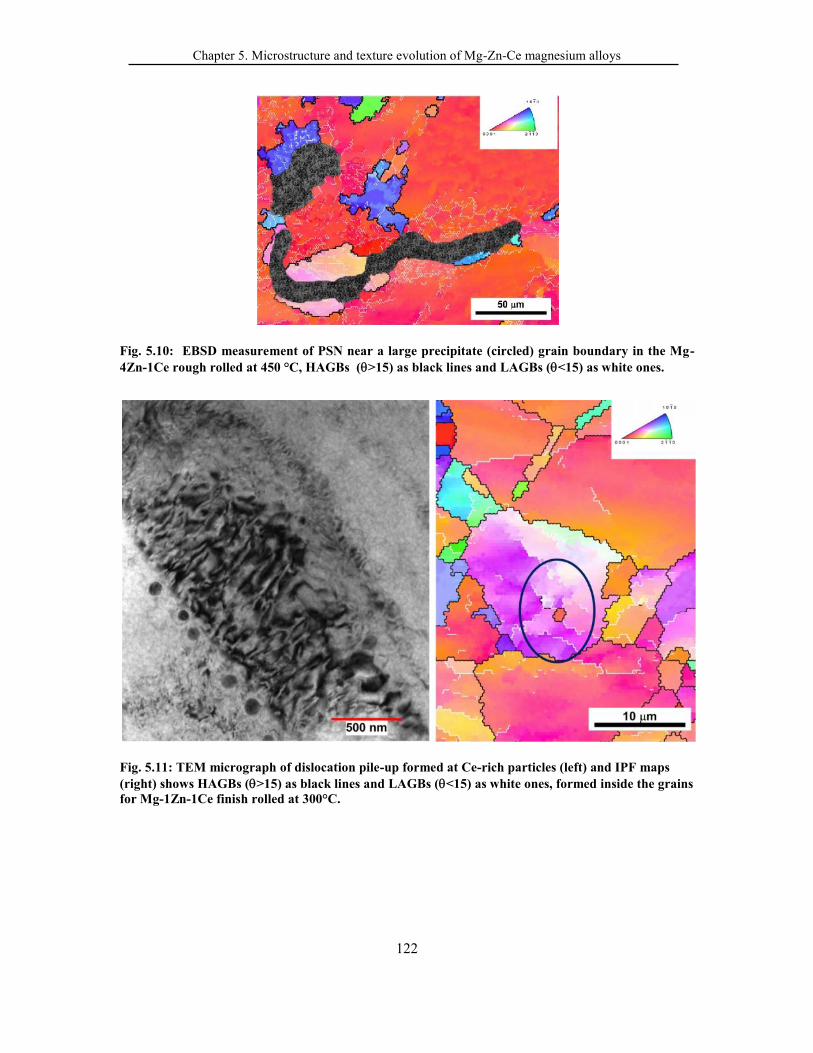
Chapter 5. Microstructure and texture evolution of Mg-Zn-Ce magnesium alloys
122
Fig. 5.10: EBSD measurement of PSN near a large precipitate (circled) grain boundary in the Mg-4Zn-1Ce rough rolled at 450 °C, HAGBs (>15) as black lines and LAGBs (<15) as white ones.
Fig. 5.11: TEM micrograph of dislocation pile-up formed at Ce-rich particles (left) and IPF maps(right) shows HAGBs (>15) as black lines and LAGBs (<15) as white ones, formed inside the grainsfor Mg-1Zn-1Ce finish rolled at 300°C.
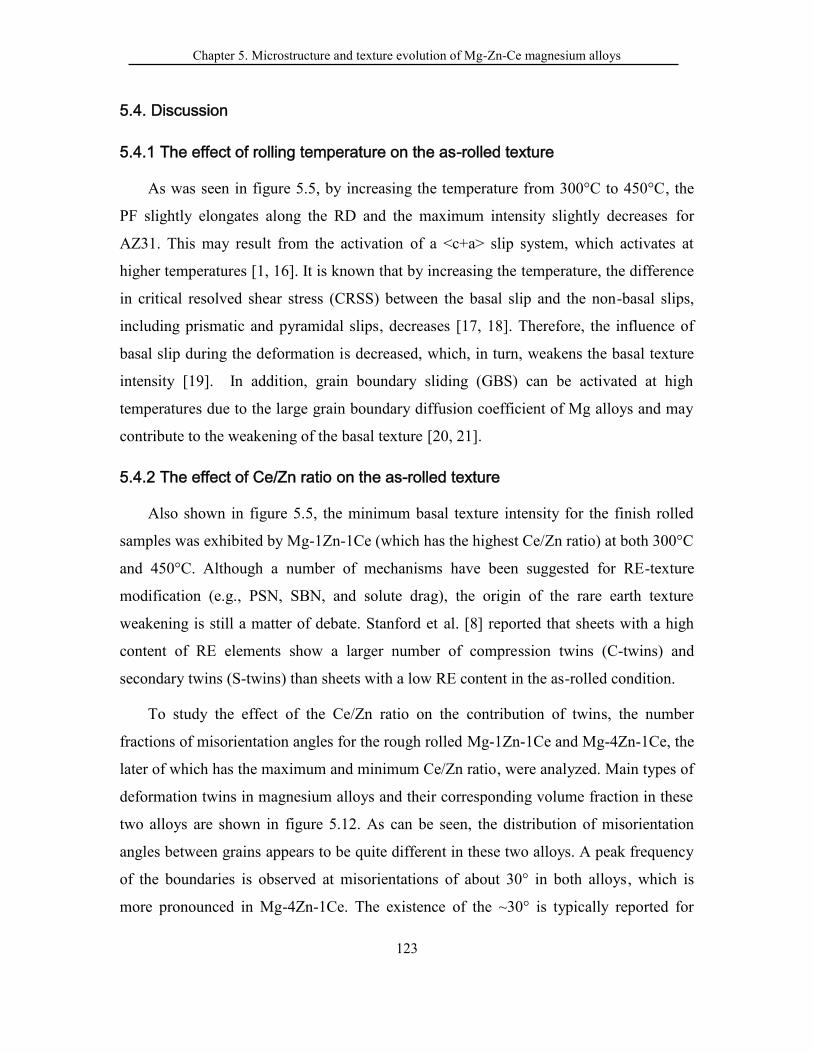
Chapter 5. Microstructure and texture evolution of Mg-Zn-Ce magnesium alloys
123
5.4. Discussion
5.4.1 The effect of rolling temperature on the as-rolled texture
As was seen in figure 5.5, by increasing the temperature from 300°C to 450°C, the
PF slightly elongates along the RD and the maximum intensity slightly decreases for
AZ31. This may result from the activation of a <c+a> slip system, which activates at
higher temperatures [1, 16]. It is known that by increasing the temperature, the difference
in critical resolved shear stress (CRSS) between the basal slip and the non-basal slips,
including prismatic and pyramidal slips, decreases [17, 18]. Therefore, the influence of
basal slip during the deformation is decreased, which, in turn, weakens the basal texture
intensity [19]. In addition, grain boundary sliding (GBS) can be activated at high
temperatures due to the large grain boundary diffusion coefficient of Mg alloys and may
contribute to the weakening of the basal texture [20, 21].
5.4.2 The effect of Ce/Zn ratio on the as-rolled texture
Also shown in figure 5.5, the minimum basal texture intensity for the finish rolled
samples was exhibited by Mg-1Zn-1Ce (which has the highest Ce/Zn ratio) at both 300°C
and 450°C. Although a number of mechanisms have been suggested for RE-texture
modification (e.g., PSN, SBN, and solute drag), the origin of the rare earth texture
weakening is still a matter of debate. Stanford et al. [8] reported that sheets with a high
content of RE elements show a larger number of compression twins (C-twins) and
secondary twins (S-twins) than sheets with a low RE content in the as-rolled condition.
To study the effect of the Ce/Zn ratio on the contribution of twins, the number
fractions of misorientation angles for the rough rolled Mg-1Zn-1Ce and Mg-4Zn-1Ce, the
later of which has the maximum and minimum Ce/Zn ratio, were analyzed. Main types of
deformation twins in magnesium alloys and their corresponding volume fraction in these
two alloys are shown in figure 5.12. As can be seen, the distribution of misorientation
angles between grains appears to be quite different in these two alloys. A peak frequency
of the boundaries is observed at misorientations of about 30° in both alloys, which is
more pronounced in Mg-4Zn-1Ce. The existence of the ~30° is typically reported for
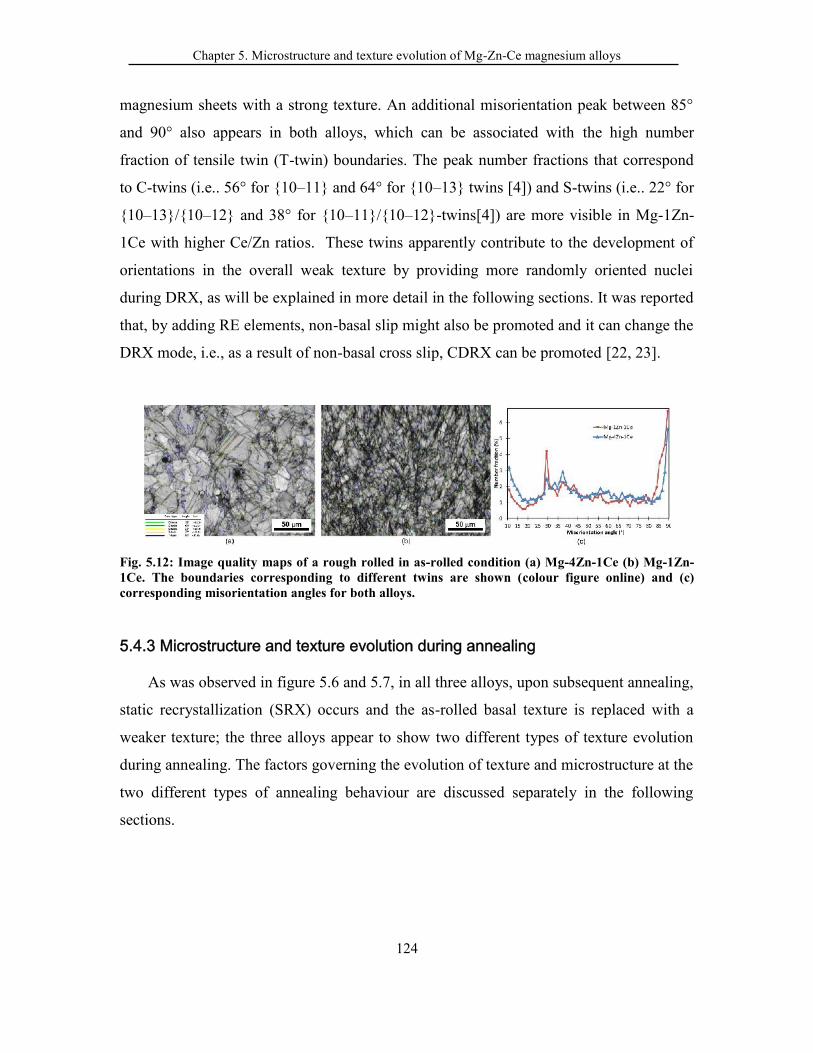
Chapter 5. Microstructure and texture evolution of Mg-Zn-Ce magnesium alloys
124
magnesium sheets with a strong texture. An additional misorientation peak between 85°
and 90° also appears in both alloys, which can be associated with the high number
fraction of tensile twin (T-twin) boundaries. The peak number fractions that correspond
to C-twins (i.e.. 56° for {10–11} and 64° for {10–13} twins [4]) and S-twins (i.e.. 22° for
{10–13}/{10–12} and 38° for {10–11}/{10–12}-twins[4]) are more visible in Mg-1Zn-
1Ce with higher Ce/Zn ratios. These twins apparently contribute to the development of
orientations in the overall weak texture by providing more randomly oriented nuclei
during DRX, as will be explained in more detail in the following sections. It was reported
that, by adding RE elements, non-basal slip might also be promoted and it can change the
DRX mode, i.e., as a result of non-basal cross slip, CDRX can be promoted [22, 23].
Fig. 5.12: Image quality maps of a rough rolled in as-rolled condition (a) Mg-4Zn-1Ce (b) Mg-1Zn-1Ce. The boundaries corresponding to different twins are shown (colour figure online) and (c)corresponding misorientation angles for both alloys.
5.4.3 Microstructure and texture evolution during annealing
As was observed in figure 5.6 and 5.7, in all three alloys, upon subsequent annealing,
static recrystallization (SRX) occurs and the as-rolled basal texture is replaced with a
weaker texture; the three alloys appear to show two different types of texture evolution
during annealing. The factors governing the evolution of texture and microstructure at the
two different types of annealing behaviour are discussed separately in the following
sections.

Chapter 5. Microstructure and texture evolution of Mg-Zn-Ce magnesium alloys
125
5.4.3.1 Texture evolution of AZ31 and Mg-4Zn-1Ce during annealing
In the case of AZ31 deformed at 300°C with reduction 60% in a single pass, there
were few signs of DRX after rolling, as detected by EBSD (fig. 5.9 (a)). The deformed
microstructure was completely replaced by SRXed grains after 90 s annealing at 300°C,
corresponding to a considerable decrease in hardness (figs. 5.7, 8, and 9). The fraction of
low angle grain boundaries (LAGB) decreases correspondingly, indicating recovery
and/or the beginning of SRX. At this stage, as was seen in fig. 5.6, the maximum
intensity also decreases from 5.3 to 4.5 multiples random of distribution (MROD).
Therefore, it seems that a decrease in texture intensity after 90 s annealing time in the
AZ31 corresponds to recovery or the beginning of SRX.
As was seen in fig. 5.9, the new SRX grains started forming at bands. Sandlobes et
al. [15] reported that such shear bands contain a high volume fraction of compression and
secondary twins. As the misorientation angle distribution shows in fig. 5.13, two peaks
in the ranges of 35-40o and 60-65o can be observed, indicated an increase in the volume
fraction of C-twins and S-twins, respectively.
The orientation changes associated with twin recrystallization are not yet well
understood. In the previous work of the authors [18], the misorientation of new
recrystallized grains on S-twins was investigated with respect to the primary twin hosts in
partially recrystallized twins. It was concluded that the high frequency of 77°
misorientation illustrated that the orientations of the recrystallized grains are closer to
secondary (tension twin with 86° misorientation), rather than of the primary, C-twins.
Therefore, the orientation of recrystallized grains has a much wider distribution than that
of the initial basal parent. For this reason, it seems that rapid recrystallization on twins
could be one of the reasons for the texture weakening during the first 90 s of annealing
for both AZ31 and Mg-4Zn-1Ce.
After the initial sudden drop for both alloys, the maximum basal intensity reached a
plateau trough. From microhardness measurement (fig. 5.8(a)), it seems that the SRX was
completed after 4 min, after which it does not change significantly. By further annealing,
the SRX grain size increases in the normal way up to about 10 min for both alloys. After
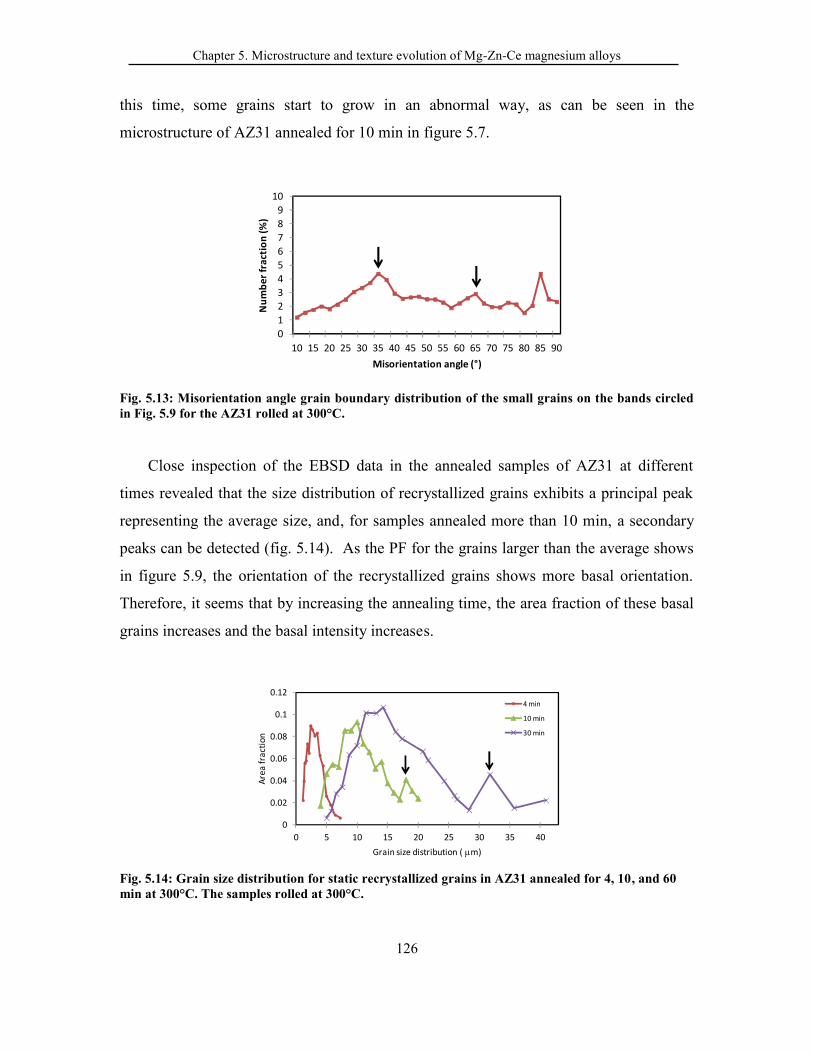
Chapter 5. Microstructure and texture evolution of Mg-Zn-Ce magnesium alloys
126
this time, some grains start to grow in an abnormal way, as can be seen in the
microstructure of AZ31 annealed for 10 min in figure 5.7.
Fig. 5.13: Misorientation angle grain boundary distribution of the small grains on the bands circledin Fig. 5.9 for the AZ31 rolled at 300°C.
Close inspection of the EBSD data in the annealed samples of AZ31 at different
times revealed that the size distribution of recrystallized grains exhibits a principal peak
representing the average size, and, for samples annealed more than 10 min, a secondary
peaks can be detected (fig. 5.14). As the PF for the grains larger than the average shows
in figure 5.9, the orientation of the recrystallized grains shows more basal orientation.
Therefore, it seems that by increasing the annealing time, the area fraction of these basal
grains increases and the basal intensity increases.
Fig. 5.14: Grain size distribution for static recrystallized grains in AZ31 annealed for 4, 10, and 60min at 300°C. The samples rolled at 300°C.
0123456789
10
10 15 20 25 30 35 40 45 50 55 60 65 70 75 80 85 90
Num
ber f
ract
ion
(%)
Misorientation angle (°)
0
0.02
0.04
0.06
0.08
0.1
0.12
0 5 10 15 20 25 30 35 40
Area
frac
tion
Grain size distribution ( m)
4 min
10 min
30 min
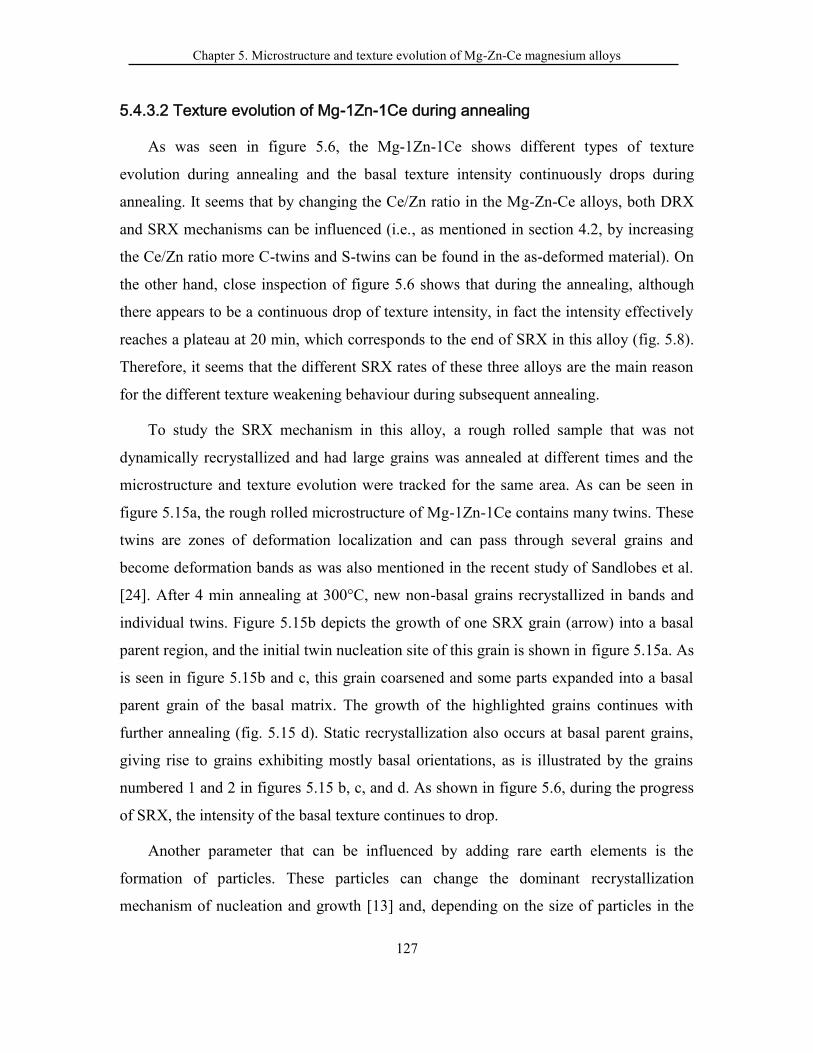
Chapter 5. Microstructure and texture evolution of Mg-Zn-Ce magnesium alloys
127
5.4.3.2 Texture evolution of Mg-1Zn-1Ce during annealing
As was seen in figure 5.6, the Mg-1Zn-1Ce shows different types of texture
evolution during annealing and the basal texture intensity continuously drops during
annealing. It seems that by changing the Ce/Zn ratio in the Mg-Zn-Ce alloys, both DRX
and SRX mechanisms can be influenced (i.e., as mentioned in section 4.2, by increasing
the Ce/Zn ratio more C-twins and S-twins can be found in the as-deformed material). On
the other hand, close inspection of figure 5.6 shows that during the annealing, although
there appears to be a continuous drop of texture intensity, in fact the intensity effectively
reaches a plateau at 20 min, which corresponds to the end of SRX in this alloy (fig. 5.8).
Therefore, it seems that the different SRX rates of these three alloys are the main reason
for the different texture weakening behaviour during subsequent annealing.
To study the SRX mechanism in this alloy, a rough rolled sample that was not
dynamically recrystallized and had large grains was annealed at different times and the
microstructure and texture evolution were tracked for the same area. As can be seen in
figure 5.15a, the rough rolled microstructure of Mg-1Zn-1Ce contains many twins. These
twins are zones of deformation localization and can pass through several grains and
become deformation bands as was also mentioned in the recent study of Sandlobes et al.
[24]. After 4 min annealing at 300°C, new non-basal grains recrystallized in bands and
individual twins. Figure 5.15b depicts the growth of one SRX grain (arrow) into a basal
parent region, and the initial twin nucleation site of this grain is shown in figure 5.15a. As
is seen in figure 5.15b and c, this grain coarsened and some parts expanded into a basal
parent grain of the basal matrix. The growth of the highlighted grains continues with
further annealing (fig. 5.15 d). Static recrystallization also occurs at basal parent grains,
giving rise to grains exhibiting mostly basal orientations, as is illustrated by the grains
numbered 1 and 2 in figures 5.15 b, c, and d. As shown in figure 5.6, during the progress
of SRX, the intensity of the basal texture continues to drop.
Another parameter that can be influenced by adding rare earth elements is the
formation of particles. These particles can change the dominant recrystallization
mechanism of nucleation and growth [13] and, depending on the size of particles in the
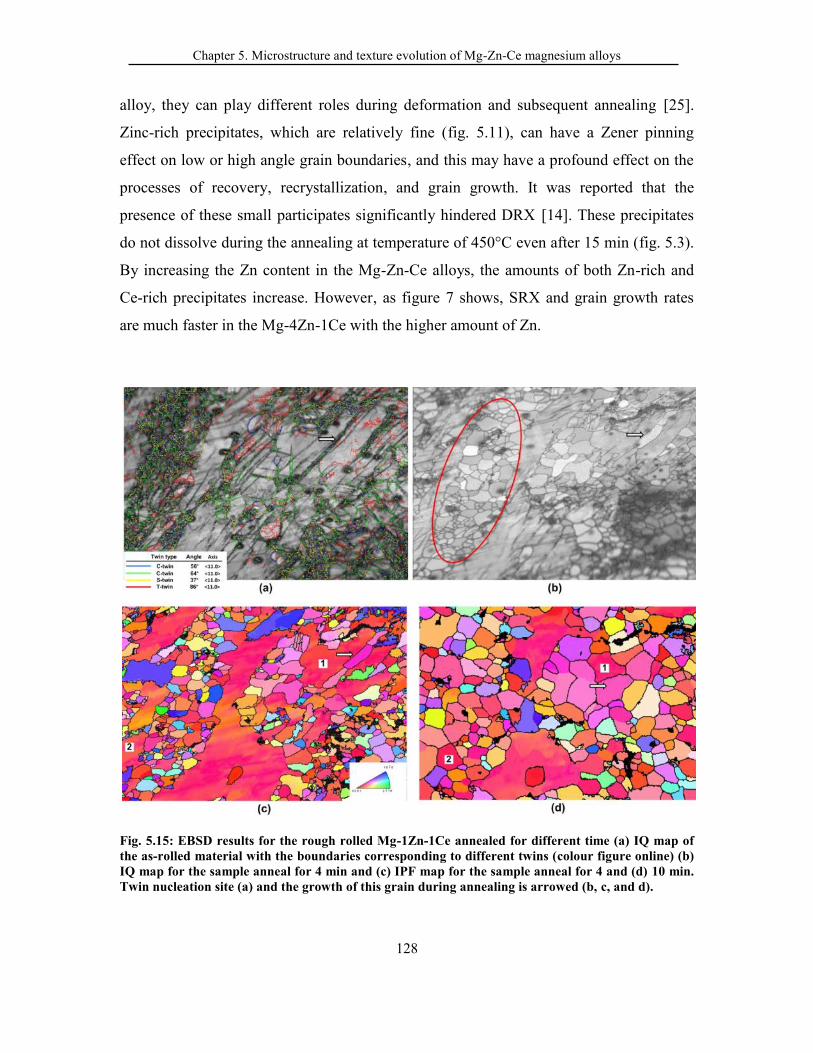
Chapter 5. Microstructure and texture evolution of Mg-Zn-Ce magnesium alloys
128
alloy, they can play different roles during deformation and subsequent annealing [25].
Zinc-rich precipitates, which are relatively fine (fig. 5.11), can have a Zener pinning
effect on low or high angle grain boundaries, and this may have a profound effect on the
processes of recovery, recrystallization, and grain growth. It was reported that the
presence of these small participates significantly hindered DRX [14]. These precipitates
do not dissolve during the annealing at temperature of 450°C even after 15 min (fig. 5.3).
By increasing the Zn content in the Mg-Zn-Ce alloys, the amounts of both Zn-rich and
Ce-rich precipitates increase. However, as figure 7 shows, SRX and grain growth rates
are much faster in the Mg-4Zn-1Ce with the higher amount of Zn.
Fig. 5.15: EBSD results for the rough rolled Mg-1Zn-1Ce annealed for different time (a) IQ map ofthe as-rolled material with the boundaries corresponding to different twins (colour figure online) (b)IQ map for the sample anneal for 4 min and (c) IPF map for the sample anneal for 4 and (d) 10 min.Twin nucleation site (a) and the growth of this grain during annealing is arrowed (b, c, and d).
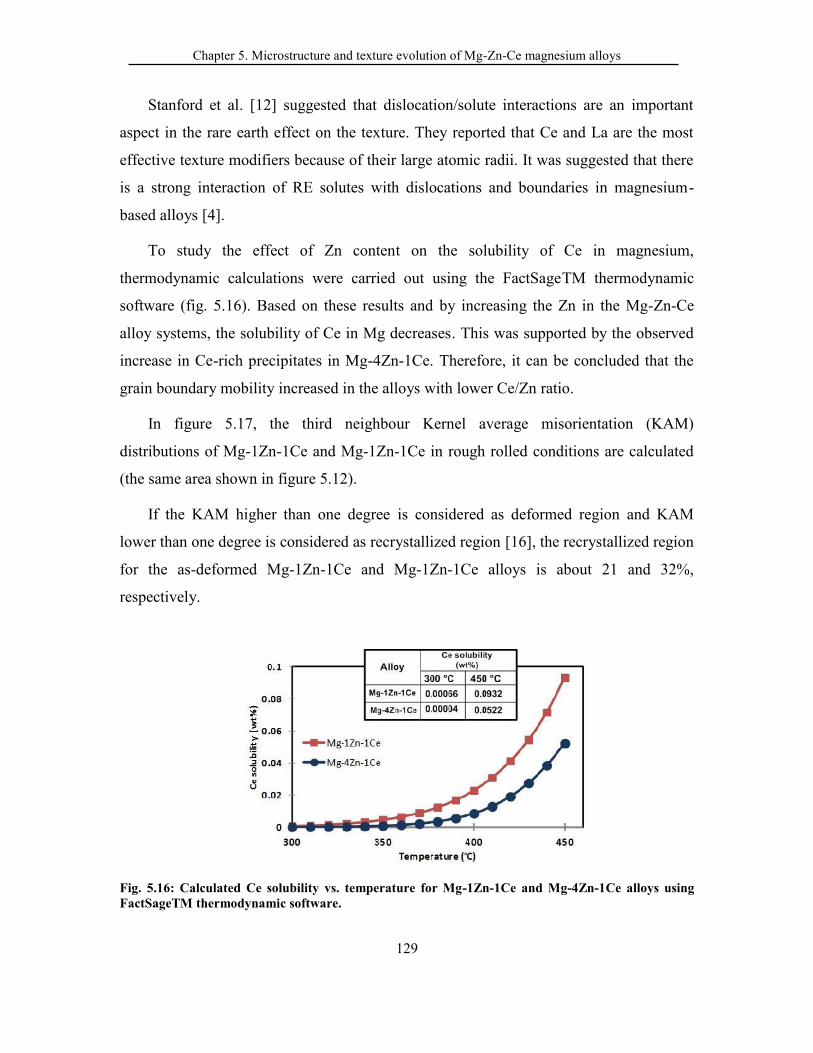
Chapter 5. Microstructure and texture evolution of Mg-Zn-Ce magnesium alloys
129
Stanford et al. [12] suggested that dislocation/solute interactions are an important
aspect in the rare earth effect on the texture. They reported that Ce and La are the most
effective texture modifiers because of their large atomic radii. It was suggested that there
is a strong interaction of RE solutes with dislocations and boundaries in magnesium-
based alloys [4].
To study the effect of Zn content on the solubility of Ce in magnesium,
thermodynamic calculations were carried out using the FactSageTM thermodynamic
software (fig. 5.16). Based on these results and by increasing the Zn in the Mg-Zn-Ce
alloy systems, the solubility of Ce in Mg decreases. This was supported by the observed
increase in Ce-rich precipitates in Mg-4Zn-1Ce. Therefore, it can be concluded that the
grain boundary mobility increased in the alloys with lower Ce/Zn ratio.
In figure 5.17, the third neighbour Kernel average misorientation (KAM)
distributions of Mg-1Zn-1Ce and Mg-1Zn-1Ce in rough rolled conditions are calculated
(the same area shown in figure 5.12).
If the KAM higher than one degree is considered as deformed region and KAM
lower than one degree is considered as recrystallized region [16], the recrystallized region
for the as-deformed Mg-1Zn-1Ce and Mg-1Zn-1Ce alloys is about 21 and 32%,
respectively.
Fig. 5.16: Calculated Ce solubility vs. temperature for Mg-1Zn-1Ce and Mg-4Zn-1Ce alloys usingFactSageTM thermodynamic software.
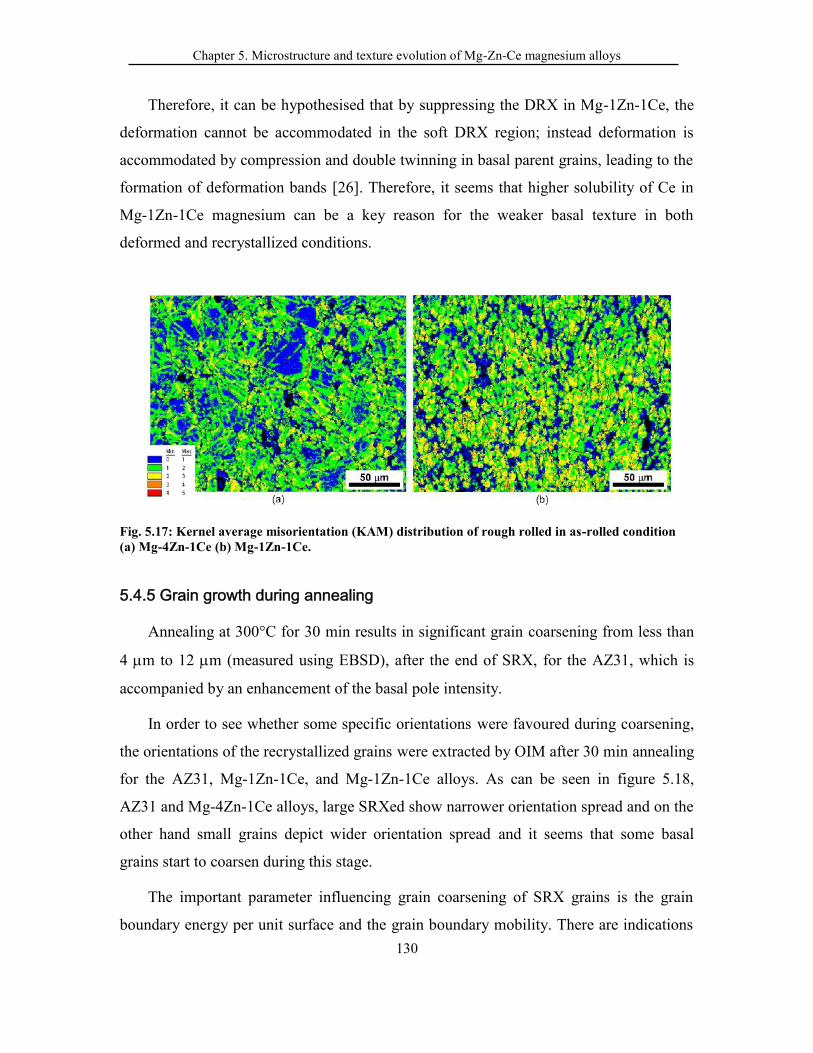
Chapter 5. Microstructure and texture evolution of Mg-Zn-Ce magnesium alloys
130
Therefore, it can be hypothesised that by suppressing the DRX in Mg-1Zn-1Ce, the
deformation cannot be accommodated in the soft DRX region; instead deformation is
accommodated by compression and double twinning in basal parent grains, leading to the
formation of deformation bands [26]. Therefore, it seems that higher solubility of Ce in
Mg-1Zn-1Ce magnesium can be a key reason for the weaker basal texture in both
deformed and recrystallized conditions.
Fig. 5.17: Kernel average misorientation (KAM) distribution of rough rolled in as-rolled condition(a) Mg-4Zn-1Ce (b) Mg-1Zn-1Ce.
5.4.5 Grain growth during annealing
Annealing at 300°C for 30 min results in significant grain coarsening from less than
4 m to 12 m (measured using EBSD), after the end of SRX, for the AZ31, which is
accompanied by an enhancement of the basal pole intensity.
In order to see whether some specific orientations were favoured during coarsening,
the orientations of the recrystallized grains were extracted by OIM after 30 min annealing
for the AZ31, Mg-1Zn-1Ce, and Mg-1Zn-1Ce alloys. As can be seen in figure 5.18,
AZ31 and Mg-4Zn-1Ce alloys, large SRXed show narrower orientation spread and on the
other hand small grains depict wider orientation spread and it seems that some basal
grains start to coarsen during this stage.
The important parameter influencing grain coarsening of SRX grains is the grain
boundary energy per unit surface and the grain boundary mobility. There are indications
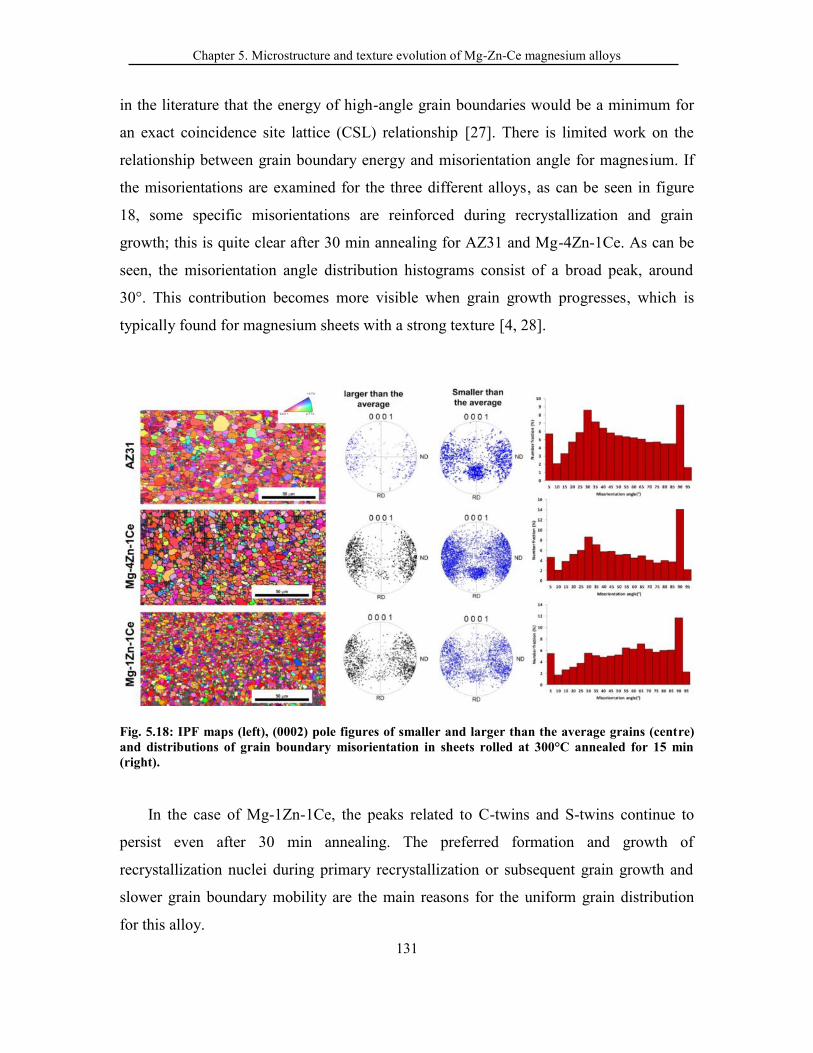
Chapter 5. Microstructure and texture evolution of Mg-Zn-Ce magnesium alloys
131
in the literature that the energy of high-angle grain boundaries would be a minimum for
an exact coincidence site lattice (CSL) relationship [27]. There is limited work on the
relationship between grain boundary energy and misorientation angle for magnesium. If
the misorientations are examined for the three different alloys, as can be seen in figure
18, some specific misorientations are reinforced during recrystallization and grain
growth; this is quite clear after 30 min annealing for AZ31 and Mg-4Zn-1Ce. As can be
seen, the misorientation angle distribution histograms consist of a broad peak, around
30°. This contribution becomes more visible when grain growth progresses, which is
typically found for magnesium sheets with a strong texture [4, 28].
Fig. 5.18: IPF maps (left), (0002) pole figures of smaller and larger than the average grains (centre)and distributions of grain boundary misorientation in sheets rolled at 300°C annealed for 15 min(right).
In the case of Mg-1Zn-1Ce, the peaks related to C-twins and S-twins continue to
persist even after 30 min annealing. The preferred formation and growth of
recrystallization nuclei during primary recrystallization or subsequent grain growth and
slower grain boundary mobility are the main reasons for the uniform grain distribution
for this alloy.
Chapter 5. Microstructure and texture evolution of Mg-Zn-Ce magnesium alloys
132
5.5. Conclusions
Microstructure and texture development in four Mg-Zn-Ce alloys and Mg-3Al-1Zn
were studied following rolling and subsequent isothermal annealing. The main results are
summarized as follows:
1- The addition of Ce weakens the basal texture in both the as-hot rolled and
annealed conditions. This appears to be related to an increase in deformation
twins during hot rolling, which is due to the presence of Ce in solid solution.
2- Increasing Zn decreases Ce in solid solution. Hence, the alloy with the
higher Ce/Zn ratio exhibit weaker basal textures.
3- The maximum intensity of basal pole figures decreases as static
recrystallization progresses for all the alloys. This probably corresponds to the
formation of SRX grains with wider orientation spread at twins and deformation
bands.
4- The basal texture intensifies after the end of SRX because of abnormal
grain coarsening of some grains with orientations close to basal.
5.6 References
[1] S.R. Agnew, M.H. Yoo, C.N. Tomé, Acta Materialia, 49 (2001) 4277-4289.[2] L.W.F. Mackenzie, M. Pekguleryuz, Materials Science and Engineering: A, 480 (2008) 189-197.[3] A. Styczynski, C. Hartig, J. Bohlen, D. Letzig, Scripta Materialia, 50 (2004) 943-947.[4] K. Hantzsche, J. Bohlen, J. Wendt, K.U. Kainer, S.B. Yi, D. Letzig, Scripta Materialia, 63 (2010) 725-730.[5] J. Bohlen, M.R. Nürnberg, J.W. Senn, D. Letzig, S.R. Agnew, Acta Materialia, 55 (2007) 2101-2112.[6] R. Cottam, J. Robson, G. Lorimer, B. Davis, Materials Science and Engineering: A, 485 (2008) 375-382.[7] L.W.F. Mackenzie, M.O. Pekguleryuz, Scripta Materialia, 59 (2008) 665-668.[8] N. Stanford, Materials Science and Engineering: A, 527 (2010) 2669-2677.[9] H. Yan, S.W. Xu, R.S. Chen, S. Kamado, T. Honma, E.H. Han, Scripta Materialia, 64 (2011) 141-144.[10] E.A. Ball, P.B. Prangnell, Scripta Metallurgica et Materiala, 31 (1994) 111-116.[11] L.W.F. Mackenzie, G.W. Lorimer, F.J. Humphreys, T. Wilks, 2004, pp. 477-482.[12] N. Stanford, M.R. Barnett, Materials Science and Engineering: A, 496 (2008) 399-408.[13] T. Al-Samman, X. Li, Materials Science and Engineering A, 528 (2011) 3809-3822.[14] Y.B. Chun, J. Geng, N. Stanford, C.H.J. Davies, J.F. Nie, M.R. Barnett, Materials Science andEngineering: A, 528 (2011) 3653-3658.[15] A.S.f. Testing, M. Philadelphia, (2003).[16] H. Li, E. Hsu, J. Szpunar, H. Utsunomiya, T. Sakai, Journal of Materials Science, 43 (2008) 7148-7156.[17] S.R. Agnew, O. Duygulu, International Journal of Plasticity, 21 (2005) 1161-1193.
Chapter 5. Microstructure and texture evolution of Mg-Zn-Ce magnesium alloys
133
[18] M. Sanjari, S.A. Farzadfar, I.H. Jung, E. Essadiqi, S. Yue, Materials Science and Technology, (2011).[19] S.H. Kim, Y.M. Seo, C.D. Yim, B.S. You, 2005, pp. 530-535.[20] H.L. Kim, Y.W. Chang, Metals and Materials International, 17 (2011) 563-568.[21] X. Huang, K. Suzuki, N. Saito, Scripta Materialia, 60 (2009) 651-654.[22] J. Hadorn, K. Hantzsche, S. Yi, J. Bohlen, D. Letzig, J. Wollmershauser, S. Agnew, Metallurgical andMaterials Transactions A, 43 (2012) 1347-1362.[23] M. Suzuki, H. Sato, K. Maruyama, H. Oikawa, Materials Science and Engineering: A, 252 (1998) 248-255.[24] S. Sandlöbes, S. Zaefferer, I. Schestakow, S. Yi, R. Gonzalez-Martinez, Acta Materialia, 59 (2011)429-439.[25] F.J. Humphreys, M. Hatherly, Recrystallization and related annealing phenomena, Pergamon, 2004.[26] S.A. Farzadfar, M. Sanjari, I.H. Jung, E. Essadiqi, S. Yue, Materials Science and Engineering: A, 528(2011) 6742-6753.[27] J.T. Chou, K.I. Ikeda, H. Nakashima, Nippon Kinzoku Gakkaishi/Journal of the Japan Institute ofMetals, 69 (2005) 303-307.[28] A. Ostapovets, P. Šedá, A. Jäger, P. Lejček, Scripta Materialia, 64 (2011) 470-473.

Chapter 5. Microstructure and texture evolution of Mg-Zn-Ce magnesium alloys
134
Chapter 6. Promotion of texture weakening in magnesium
135
Chapter 6
Promotion of texture weakening in magnesium by
alloying and thermomechanical processing
As the results showed in Chapter 5, rare earths appear to be beneficial in terms of
weakening and in Chapter 4 the effect of high speed rolling on AZ31 also lead to texture
weakening. Therefore in this chapter, the response of the rare earth added alloys to high
speed rolling is investigated and the mechanisms during high speed rolling are studied.

Chapter 6. Promotion of texture weakening in magnesium
136
6.1 The effect of Alloying on texture weakening
* This section has been submitted to: M. Sanjari , A. Farzadfar, H. Utsunomiya, E. Essadiqi, R.
Petrov, L. Kestens, S.Yue, Promotion of texture weakening in magnesium by: I. Alloying, submitted to J
of Material Science
The recrystallization and texture evolution of four Mg-Zn-Ce sheets with a warm
rolled microstructure obtained through two stages that can be characterised as rough
rolling and finish rolling was investigated at different stages of post-rolling annealing. On
annealing, the same regions of the microstructure, located by hardness indentations, were
examined and tracked by EBSD. Furthermore, intragranular misorientation axes (IGMA)
analysis was used to investigate the associated deformation mechanisms in the as-
deformed material. By combining these two methods, the development of the
recrystallization microstructure was investigated and important aspects, such as
preferential nucleation sites, correlation between activated deformation mechanism, and
initial orientation of the recrystallized grains, were studied. The results show that the Mg-
1Zn-1Ce alloy, which had the highest Ce/Zn ratio, showed the weakest as-rolled texture
and the most homogenous distribution of shear banding/twinning. The IGMA analysis
also shows that in Mg-1Zn-1Ce other types of dislocations rather than basal <a> are
activated; in particular, prismatic <a> type is activated during deformation. Therefore, the
weakening of recrystallization texture during rolling resulting from the addition of RE
elements is linked with a change in dynamic recrystallization (DRX) behaviour. Since the
Mg-1Zn-1Ce alloy corresponds to the highest level of Ce in solid solution, the observed
texture weakening is possibly due to decreasing grain boundary mobility as a result of
solute partitioning of RE elements to dislocations and grain boundaries.
Chapter 6. Promotion of texture weakening in magnesium
137
6.1.1 Introduction
The application of magnesium and magnesium alloys in the automotive industry
can reduce vehicle weight, as a result of which fuel consumption can be reduced [1, 2].
Sheet Mg is one way to increase the usage of Mg [2, 3]. One of the major obstacles of its
use is that a preferred crystallographic orientation develops in wrought alloys [4-6],
which substantially limits the subsequent formability, especially of flat-rolled sheets [4,
7-9]. Thus, magnesium sheet formability can be improved significantly if the strong
texture can be modified [10-14]. It has been found that the addition of rare earth (RE)
elements, such as yttrium, cerium or neodymium, significantly weakens the rolling or
extrusion texture of Mg alloys [15-21]. The texture weakening mechanism has been
associated with different mechanisms, such as particle stimulated nucleation (PSN) [22,
23], deformation and shear band containing twins [16] or retardation of DRX [24].
Although a large amount of work has been carried out on dynamic recrystallization
(DRX) in both rare earth and conventional wrought Mg alloys [25-28], comparatively
little work has been done on static recrystallization (SRX) during annealing after
deformation [11, 29, 30]. In the recent work of Sanjari et al. [30] on Mg-Zn-Ce alloys and
AZ31, it was found that, as recrystallization progresses, the texture was weakened during
recrystallization in all of the alloys, although this was followed by the development of a
basal texture during subsequent grain coarsening of AZ31 and Mg-4Zn-1Ce. It is
concluded that the differences between the Ce bearing alloys studied previously is related
to Zn. Increasing the Zn content decreases the solubility of Ce, which reduces the grain
boundary mobility as pinning is more effective by Ce in solid solution as compared to
pinning caused by particles. In another work of the present authors [29], the
microstructure and texture evolution of Mg–2.9Y and Mg–2.9Zn alloys were investigated
after rolling and subsequent isothermal annealing. A continuous texture weakening is
observed with the progress of SRX in both alloys [29]. It was concluded that texture
weakening can be achieved in Mg alloys when DRX does not occur and SRX is
performed by annealing, even in the absence of yttrium. Huang et al. [11] also
investigated SRX and grain growth behaviour of Mg-3Al-1Zn alloy (AZ31) sheets
asymmetrically rolled followed by conventional warm rolling. They found that the basal
Chapter 6. Promotion of texture weakening in magnesium
138
texture was considerably weakened because of the formation of new grains with a wider
orientation distribution relative to the initial basal orientation.
Recrystallization on shear bands has also been reported to result in a wider
orientation distribution [9, 29, 30]. Yi et al. [31] investigated the formation of new grains
at the intersections of two double twins. They reported that the orientation of new grains
can be associated with a rotation around the c-axis with respect to the matrix grains and
this causes a persistence of the initial basal texture. On the other hand, it was reported
that recrystallization and particularly grain growth intensifies the basal texture and, in
some cases, a double peak on the basal pole figure was replaced by a single peak during
extensive annealing [5, 7, 29, 30, 32]. Therefore, both nucleation and subsequent growth
were identified as being significant for the development of the recrystallized texture [33].
Although shear bands, twins, grain boundaries, and triple junctions were found to be
nucleation sites in magnesium alloys [20, 34, 35]. The preferred sites for the formation of
the nuclei and the orientation relationships between nuclei and parent grains or twins are
still unclear. Therefore, the first goal of this work is to determine the characteristics of
recrystallization, the important aspects being preferential nucleation sites, correlation
between activated deformation mechanisms, and initial orientation on the recrystallized
grains. This will be achieved by EBSD observations in the same regions of the
microstructure during annealing, as located by microhardness indents. To investigate the
activated deformation mechanism, in-grain misorientation axis (IGMA) analyses were
performed using EBSD data on the deformed area (cf. infra).
6.1.2 Experimental procedure
6.1.2.1 Rolling experiments
Four alloys of the Mg-Zn-Ce system were cast into ingots of 70 mm x 110 mm x
500 mm and machined into plates of 70 mm x 110 mm x 6 mm thickness. The chemical
compositions of the Mg-Zn-Ce alloys are reported in Chapter 5. The rolling experiment
was conducted in two stages: rough rolling and finish rolling. The purpose of rough
rolling was to decrease the grain size from about 1 mm to about 130 µm in preparation
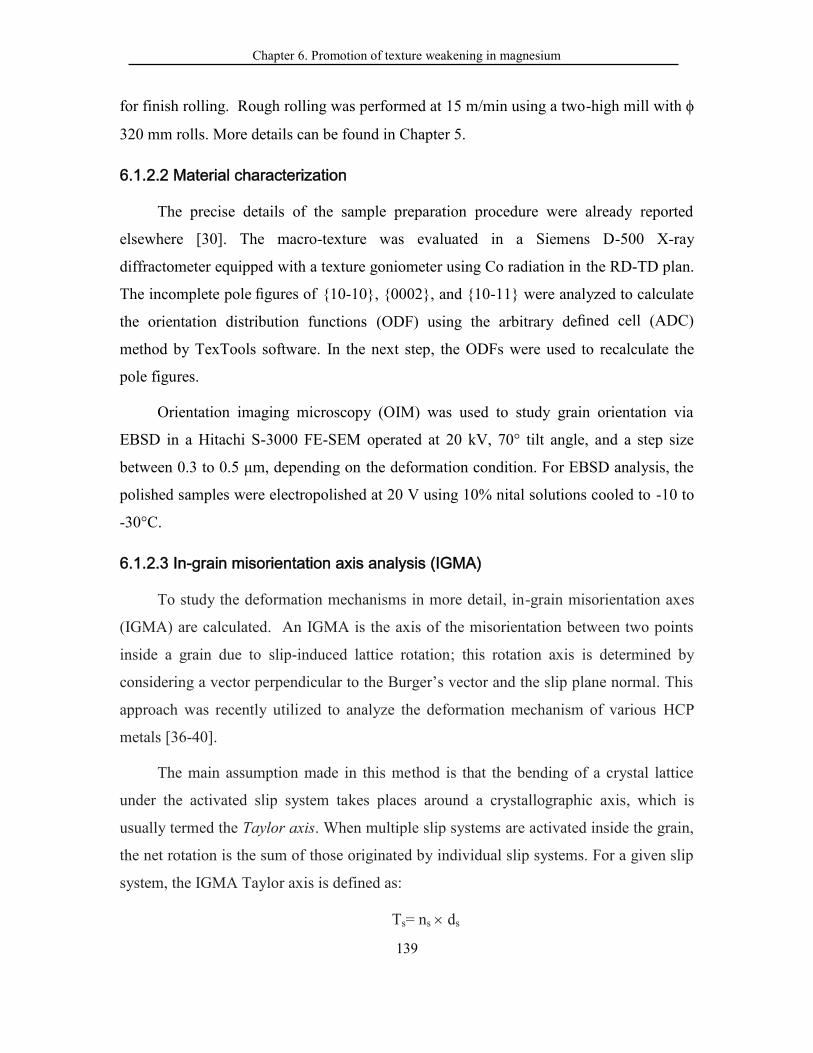
Chapter 6. Promotion of texture weakening in magnesium
139
for finish rolling. Rough rolling was performed at 15 m/min using a two-high mill with
320 mm rolls. More details can be found in Chapter 5.
6.1.2.2 Material characterization
The precise details of the sample preparation procedure were already reported
elsewhere [30]. The macro-texture was evaluated in a Siemens D-500 X-ray
diffractometer equipped with a texture goniometer using Co radiation in the RD-TD plan.
The incomplete pole figures of {10-10}, {0002}, and {10-11} were analyzed to calculate
the orientation distribution functions (ODF) using the arbitrary defined cell (ADC)
method by TexTools software. In the next step, the ODFs were used to recalculate the
pole figures.
Orientation imaging microscopy (OIM) was used to study grain orientation via
EBSD in a Hitachi S-3000 FE-SEM operated at 20 kV, 70° tilt angle, and a step size
between 0.3 to 0.5 μm, depending on the deformation condition. For EBSD analysis, the
polished samples were electropolished at 20 V using 10% nital solutions cooled to -10 to
-30°C.
6.1.2.3 In-grain misorientation axis analysis (IGMA)
To study the deformation mechanisms in more detail, in-grain misorientation axes
(IGMA) are calculated. An IGMA is the axis of the misorientation between two points
inside a grain due to slip-induced lattice rotation; this rotation axis is determined by
considering a vector perpendicular to the Burger’s vector and the slip plane normal. This
approach was recently utilized to analyze the deformation mechanism of various HCP
metals [36-40].
The main assumption made in this method is that the bending of a crystal lattice
under the activated slip system takes places around a crystallographic axis, which is
usually termed the Taylor axis. When multiple slip systems are activated inside the grain,
the net rotation is the sum of those originated by individual slip systems. For a given slip
system, the IGMA Taylor axis is defined as:
Ts= ns ds
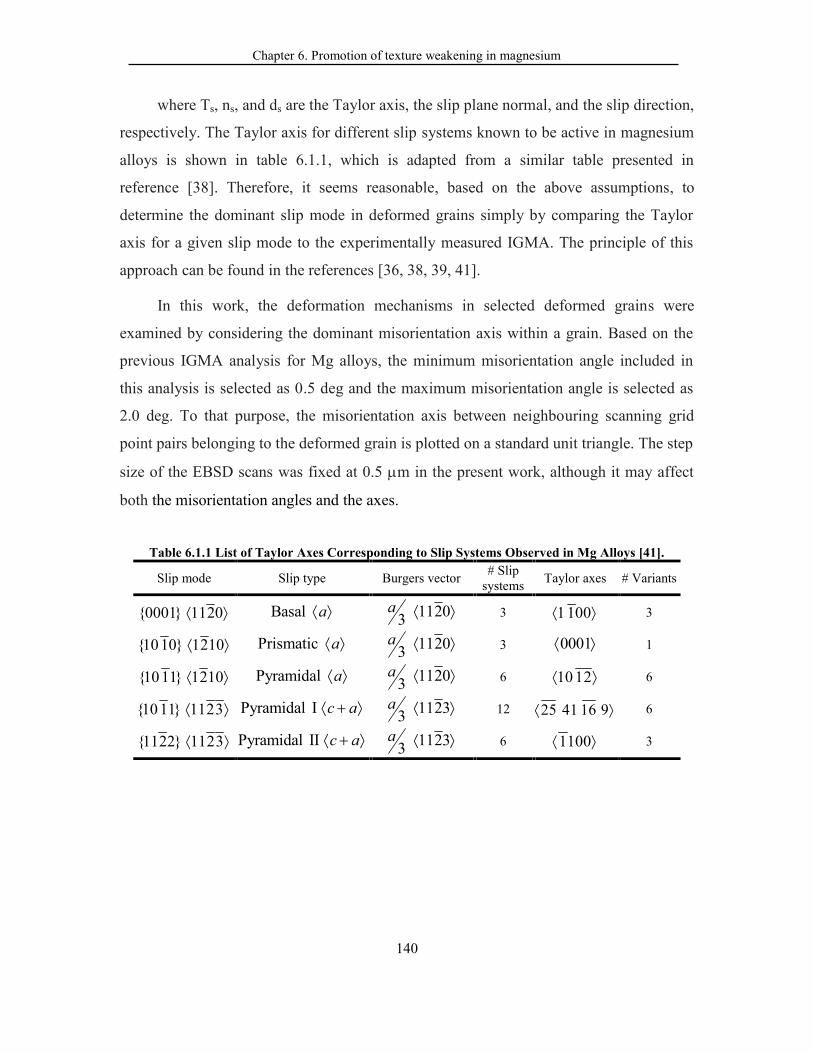
Chapter 6. Promotion of texture weakening in magnesium
140
where Ts, ns, and ds are the Taylor axis, the slip plane normal, and the slip direction,
respectively. The Taylor axis for different slip systems known to be active in magnesium
alloys is shown in table 6.1.1, which is adapted from a similar table presented in
reference [38]. Therefore, it seems reasonable, based on the above assumptions, to
determine the dominant slip mode in deformed grains simply by comparing the Taylor
axis for a given slip mode to the experimentally measured IGMA. The principle of this
approach can be found in the references [36, 38, 39, 41].
In this work, the deformation mechanisms in selected deformed grains were
examined by considering the dominant misorientation axis within a grain. Based on the
previous IGMA analysis for Mg alloys, the minimum misorientation angle included in
this analysis is selected as 0.5 deg and the maximum misorientation angle is selected as
2.0 deg. To that purpose, the misorientation axis between neighbouring scanning grid
point pairs belonging to the deformed grain is plotted on a standard unit triangle. The step
size of the EBSD scans was fixed at 0.5 m in the present work, although it may affect
both the misorientation angles and the axes.
Table 6.1.1 List of Taylor Axes Corresponding to Slip Systems Observed in Mg Alloys [41].
Slip mode Slip type Burgers vector # Slipsystems Taylor axes # Variants
{0001} 1120 Basal a 11203a 3 1 100 3
{10 10} 1210 Prismatic a 11203a 3 0001 1
{10 11} 1210 Pyramidal a 11203a 6 10 12 6
{10 11} 1123 Pyramidal I c a 11233a 12 25 41 16 9 6
{1122} 1123 Pyramidal II c a 11233a 6 1100 3
Chapter 6. Promotion of texture weakening in magnesium
141
6.1.3. Results
6.1.3.1 Microstructure of rough rolled sheets
The initial as-cast and homogenised microstructure for Mg-4Zn-1Ce with a grain
size between 300 to 1000 m is shown in figure 6.1.1 (a) and is typical of all of the other
alloys. As can be seen in figure 6.1.1, the initial very large as-cast grains are replaced
with much finer microstructure during the three pass rough rolling for alloys. In the case
of AZ31, the microstructure is nearly fully replaced with much finer equiaxed grains,
although elongated grains and also grains containing twins can still be found in the
microstructure. The majority of grain refinement is due to DRX during rolling and static
recrystallization (SRX) during reheating between passes. On the other hand, for the Mg-
Zn-Ce rough rolled sheet, characteristics of a deformation microstructure, including
extensive twinning and deformed grains, are observed, although some details are changed
from alloy to alloy. The Mg-1Zn-0.5Ce and Mg-1Zn- 1Ce alloys contain more twinned
and deformed grains in the microstructure, and shear banding due to flow localization can
be detected especially in Mg-1Zn- 1Ce, as shown by arrows in figures 6.1.1 (c) and (d).
In the highlighted region in figure 6.1.1(c), some grains are almost completely occupied
by twins and there are some DRX grains nucleated on the twins or intersection of the
twins and original grain boundaries. When comparing all of the Ce bearing alloys, the
ones with 1 wt% Zn appear to be less recrystallized than the alloys with higher Zn levels,
and the microstructures have macro shear bands. The average recrystallized grain size is
12 m and 27 m in Mg-2Zn-1Ce and Mg-4Zn-1Ce, respectively. As highlighted in
figure 6.1.1(e), some twins pass through several grains and become deformation bands.
As a general conclusion, it appears that the development of the recrystallized
microstructure is faster in Mg-2Zn-1Ce and Mg-4Zn-1Ce.
6.1.3.2 Texture and microstructure analysis of rough rolled sheets
EBSD measurements were performed on the Mg-1Zn-1Ce and Mg-4Zn-1Ce, which
have the highest and lowest Ce/Zn ratio, respectively. To quantify the recrystallized
amount, the kernel average misorientation (KAM) within a grain was constructed by
calculating the average misorientation of each measurement point up to its third adjacent
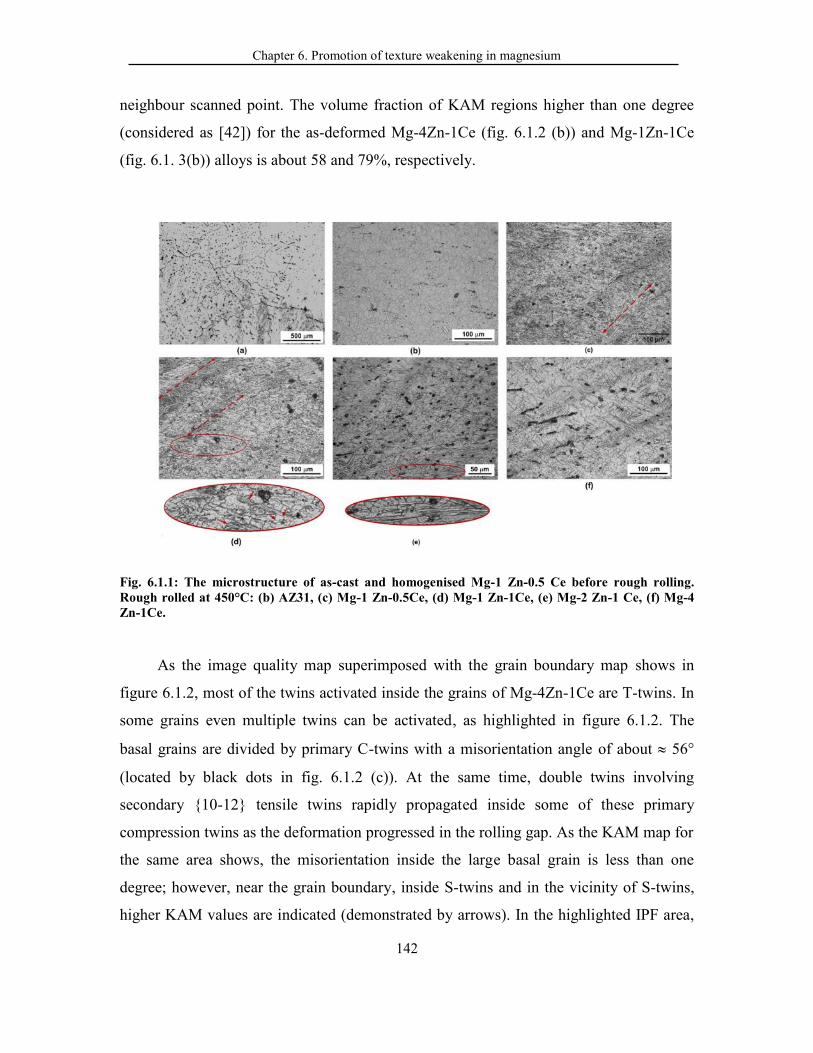
Chapter 6. Promotion of texture weakening in magnesium
142
neighbour scanned point. The volume fraction of KAM regions higher than one degree
(considered as [42]) for the as-deformed Mg-4Zn-1Ce (fig. 6.1.2 (b)) and Mg-1Zn-1Ce
(fig. 6.1. 3(b)) alloys is about 58 and 79%, respectively.
Fig. 6.1.1: The microstructure of as-cast and homogenised Mg-1 Zn-0.5 Ce before rough rolling.Rough rolled at 450°C: (b) AZ31, (c) Mg-1 Zn-0.5Ce, (d) Mg-1 Zn-1Ce, (e) Mg-2 Zn-1 Ce, (f) Mg-4Zn-1Ce.
As the image quality map superimposed with the grain boundary map shows in
figure 6.1.2, most of the twins activated inside the grains of Mg-4Zn-1Ce are T-twins. In
some grains even multiple twins can be activated, as highlighted in figure 6.1.2. The
basal grains are divided by primary C-twins with a misorientation angle of about 56°
(located by black dots in fig. 6.1.2 (c)). At the same time, double twins involving
secondary {10-12} tensile twins rapidly propagated inside some of these primary
compression twins as the deformation progressed in the rolling gap. As the KAM map for
the same area shows, the misorientation inside the large basal grain is less than one
degree; however, near the grain boundary, inside S-twins and in the vicinity of S-twins,
higher KAM values are indicated (demonstrated by arrows). In the highlighted IPF area,

Chapter 6. Promotion of texture weakening in magnesium
143
the formation of low-angle boundaries inside the S-twin and near the grain boundaries
can clearly be detected. These LAGB can be formed because the S- and C-twins are
favourably oriented for basal slip. In addition, the twin boundary will produce
incompatibilities within the parent grain, generating further plastic deformation inside the
twin and on the other side of parent grain and producing more dislocations [43, 44]. As
was reported, the stress concentration and the operation of cross-slip in S-twins can result
in the development of continuous DRXed grain structure inside the S-twins [45].
Fig. 6.1.2: (a) Image quality and KAM map of rough rolled Mg-4Zn-1Ce. (b) Kernel averagemisorientation (KAM) distribution of the S-twins and parent grain regions are highlighted. (c) TheIPF map of the magnified region shows the formation of C-twins and S-twins inside the basal parentgrains. (d) As can be seen, the twins have higher KAM value than the parent grains.
As the EBSD results show in figure 6.1.3(c), in the as-deformed Mg-1Zn-1Ce
samples, several twin activities can be observed in the microstructure and the number of
deformed grains is higher. As the highlighted region shows in this figure, in some areas
multiple parallel twins have been activated, i.e., along the highlighted line, R, there are 10

Chapter 6. Promotion of texture weakening in magnesium
144
twins (9 compression and 1 secondary) activated in a length of about 65 m. Such
twinned regions can occupy several grains.
Fig. 6.1.3: (a) Image quality and (b) KAM map of rough rolled Mg-1Zn-1Ce alloy. (c) The IPF map
of the magnified region shows the formation multiple of C-twin and S-twin in the highlighted area.
(d) The related misorientation angle distribution indicates the types of activated twins.
6.1.3.3 Determination of activated slip system in rough rolled material using
IGMA analysis
To study the effect of alloying and also of crystallographic orientation on the two
selected Mg-Zn-Ce alloys, IGMA data were calculated for each composition. The main
idea here is to study the effect of alloying content by IGMA analysis in a specific range
of crystallographic orientations.

Chapter 6. Promotion of texture weakening in magnesium
145
In figure 6.1.4, the upper EBSD maps show the entire EBSD scanned regions for
each alloy, from which some grain subsets were selected for IGMA analysis. In the next
rows, for the selected grains within a specific range of crystallographic orientations, the
IGMA distributions are plotted. In addition to the vertices of the irreducible stereographic
triangle, the location of <10-12> has also been shown for consideration of the pyramidal
<a> slip systems, whose Taylor axes correspond to these directions [46]. The selected
grains are shown by IPF map and the orientations of the selected grains are shown on the
{0002} pole figures. Four different orientation groups are considered in figure 6.1.4 to
investigate the effect of orientation and alloying simultaneously.
The first orientation groups consist of grains with hard orientation (i.e., grains with
c-axes near ND, <0001> // ND). In the case of Mg-4Zn-1Ce, the distribution exhibits a
preference for IGMA close to <huv0>. This type of distribution can be interpreted as the
result of coactivation of slip variants related to basal <a> slip and/or the second-order
pyramidal <c +a> slip, which the Taylor axes in both cases are <huvt0>-type IGMA
distribution [38]. Chun and Davies [38] reported that <uvt0> axes between <10-10> and
<11-20> can be described by the activation of basal dislocations with different Burgers
vectors of the same types (i.e., parallel to a1, a2, and a3) [38]. Grains with such
orientations have low Schmid factors for prismatic <a> slip, but are oriented favourably
for pyramidal <c +a>, which is the slip mode with the highest CRSS [4]. Therefore, it is
unlikely to be the main deformation mechanism. Another possibility is that the imposed
strain can be accommodated by C-twinning (which is reported have a minimal
contribution to the development of IGMA [38]). Therefore, it seems that for Mg-4Zn-1Ce
co-activation of different types of slip modes, including basal <a> and pyramidal <c +a>,
can result in the development of this type of distribution [40].
For Mg-1Zn-1Ce, the misorientation axis tends to have a concentration close to
[0001] or < 1012 >. The <0001>-type IGMA distribution shows that the lattice of a
given grain was rotated mainly about the <0001> axis of the crystal. As described by
Chun et al. [38] and indicated in table 6.1.1, this observation demonstrates that this
IGMA distribution is developed by the dominant activation of prismatic <a> slip.
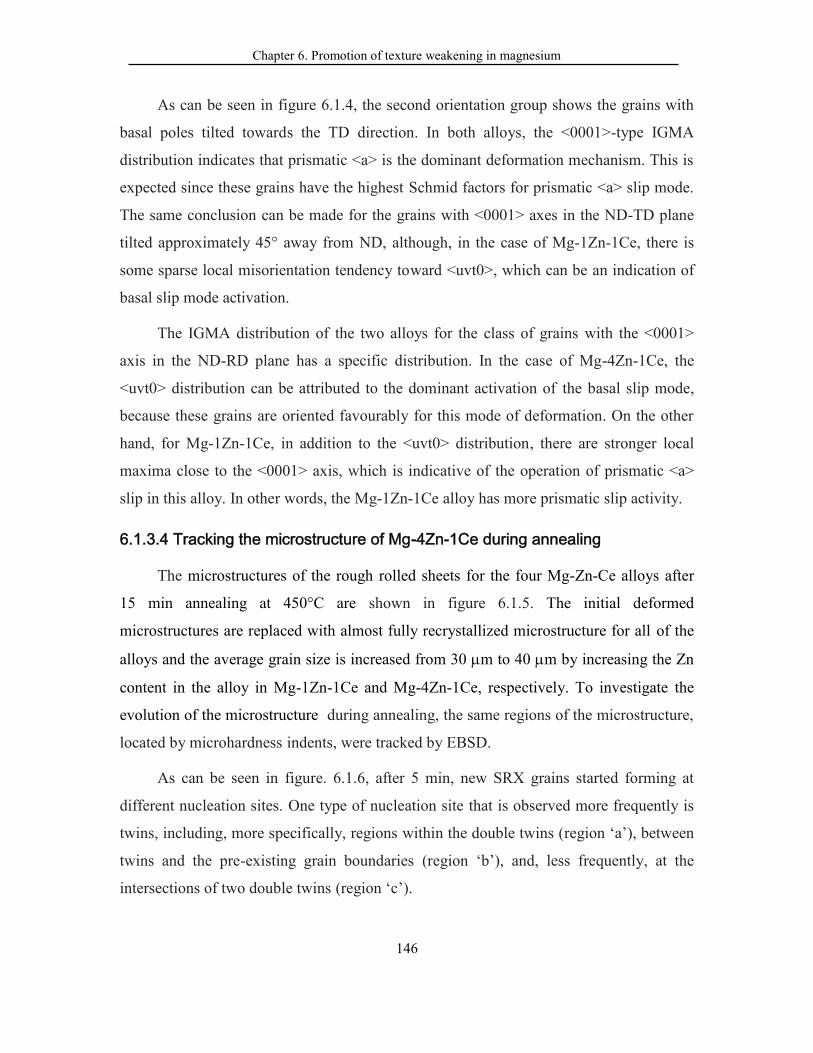
Chapter 6. Promotion of texture weakening in magnesium
146
As can be seen in figure 6.1.4, the second orientation group shows the grains with
basal poles tilted towards the TD direction. In both alloys, the <0001>-type IGMA
distribution indicates that prismatic <a> is the dominant deformation mechanism. This is
expected since these grains have the highest Schmid factors for prismatic <a> slip mode.
The same conclusion can be made for the grains with <0001> axes in the ND-TD plane
tilted approximately 45° away from ND, although, in the case of Mg-1Zn-1Ce, there is
some sparse local misorientation tendency toward <uvt0>, which can be an indication of
basal slip mode activation.
The IGMA distribution of the two alloys for the class of grains with the <0001>
axis in the ND-RD plane has a specific distribution. In the case of Mg-4Zn-1Ce, the
<uvt0> distribution can be attributed to the dominant activation of the basal slip mode,
because these grains are oriented favourably for this mode of deformation. On the other
hand, for Mg-1Zn-1Ce, in addition to the <uvt0> distribution, there are stronger local
maxima close to the <0001> axis, which is indicative of the operation of prismatic <a>
slip in this alloy. In other words, the Mg-1Zn-1Ce alloy has more prismatic slip activity.
6.1.3.4 Tracking the microstructure of Mg-4Zn-1Ce during annealing
The microstructures of the rough rolled sheets for the four Mg-Zn-Ce alloys after
15 min annealing at 450°C are shown in figure 6.1.5. The initial deformed
microstructures are replaced with almost fully recrystallized microstructure for all of the
alloys and the average grain size is increased from 30 m to 40 m by increasing the Zn
content in the alloy in Mg-1Zn-1Ce and Mg-4Zn-1Ce, respectively. To investigate the
evolution of the microstructure during annealing, the same regions of the microstructure,
located by microhardness indents, were tracked by EBSD.
As can be seen in figure. 6.1.6, after 5 min, new SRX grains started forming at
different nucleation sites. One type of nucleation site that is observed more frequently is
twins, including, more specifically, regions within the double twins (region ‘a’), between
twins and the pre-existing grain boundaries (region ‘b’), and, less frequently, at the
intersections of two double twins (region ‘c’).
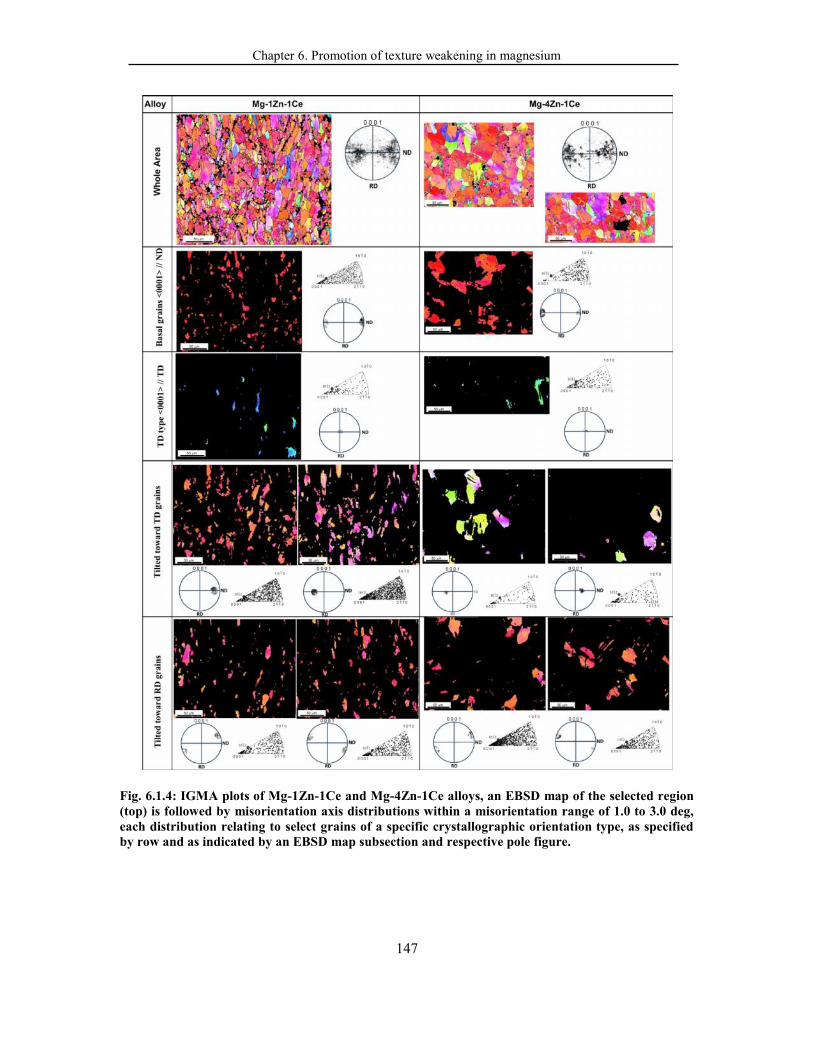
Chapter 6. Promotion of texture weakening in magnesium
147
Fig. 6.1.4: IGMA plots of Mg-1Zn-1Ce and Mg-4Zn-1Ce alloys, an EBSD map of the selected region(top) is followed by misorientation axis distributions within a misorientation range of 1.0 to 3.0 deg,each distribution relating to select grains of a specific crystallographic orientation type, as specifiedby row and as indicated by an EBSD map subsection and respective pole figure.
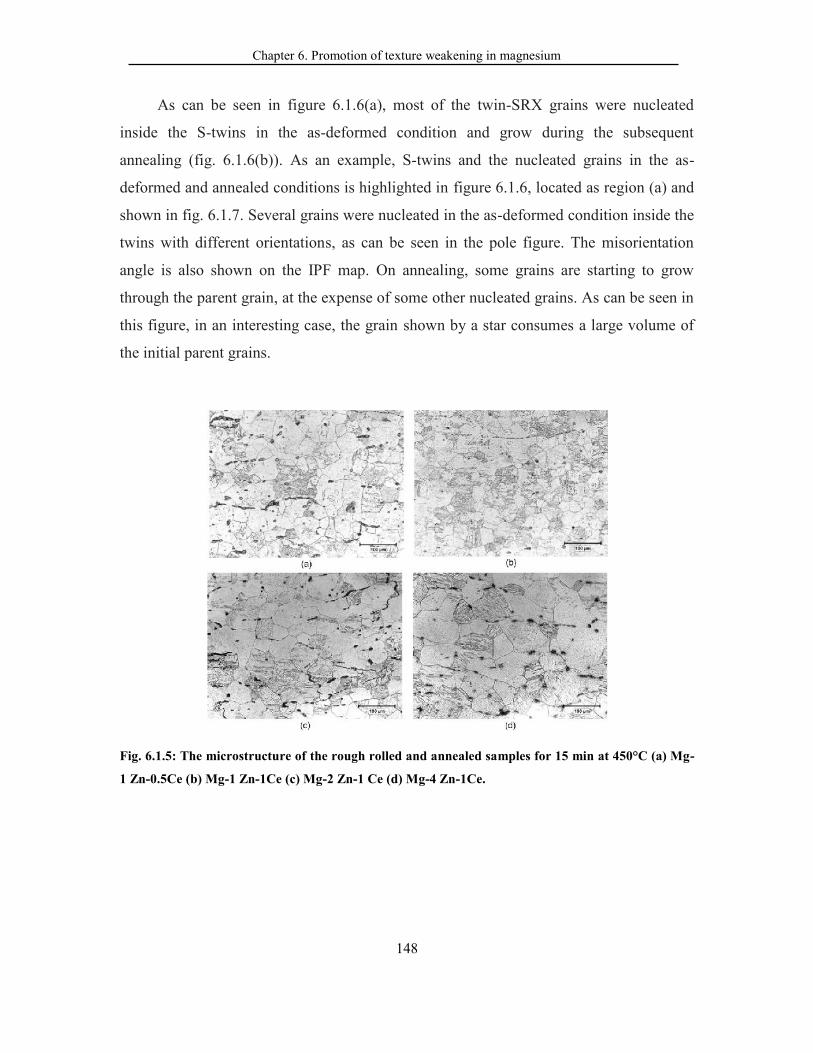
Chapter 6. Promotion of texture weakening in magnesium
148
As can be seen in figure 6.1.6(a), most of the twin-SRX grains were nucleated
inside the S-twins in the as-deformed condition and grow during the subsequent
annealing (fig. 6.1.6(b)). As an example, S-twins and the nucleated grains in the as-
deformed and annealed conditions is highlighted in figure 6.1.6, located as region (a) and
shown in fig. 6.1.7. Several grains were nucleated in the as-deformed condition inside the
twins with different orientations, as can be seen in the pole figure. The misorientation
angle is also shown on the IPF map. On annealing, some grains are starting to grow
through the parent grain, at the expense of some other nucleated grains. As can be seen in
this figure, in an interesting case, the grain shown by a star consumes a large volume of
the initial parent grains.
Fig. 6.1.5: The microstructure of the rough rolled and annealed samples for 15 min at 450°C (a) Mg-
1 Zn-0.5Ce (b) Mg-1 Zn-1Ce (c) Mg-2 Zn-1 Ce (d) Mg-4 Zn-1Ce.
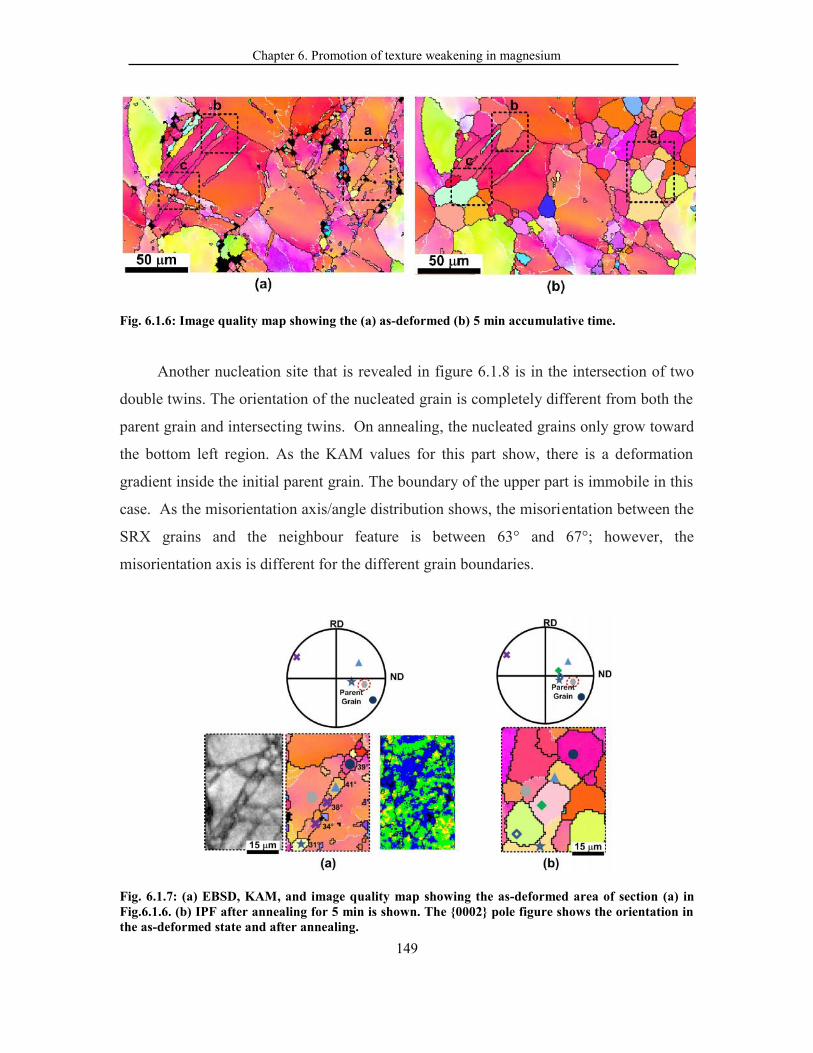
Chapter 6. Promotion of texture weakening in magnesium
149
Fig. 6.1.6: Image quality map showing the (a) as-deformed (b) 5 min accumulative time.
Another nucleation site that is revealed in figure 6.1.8 is in the intersection of two
double twins. The orientation of the nucleated grain is completely different from both the
parent grain and intersecting twins. On annealing, the nucleated grains only grow toward
the bottom left region. As the KAM values for this part show, there is a deformation
gradient inside the initial parent grain. The boundary of the upper part is immobile in this
case. As the misorientation axis/angle distribution shows, the misorientation between the
SRX grains and the neighbour feature is between 63° and 67°; however, the
misorientation axis is different for the different grain boundaries.
Fig. 6.1.7: (a) EBSD, KAM, and image quality map showing the as-deformed area of section (a) inFig.6.1.6. (b) IPF after annealing for 5 min is shown. The {0002} pole figure shows the orientation inthe as-deformed state and after annealing.
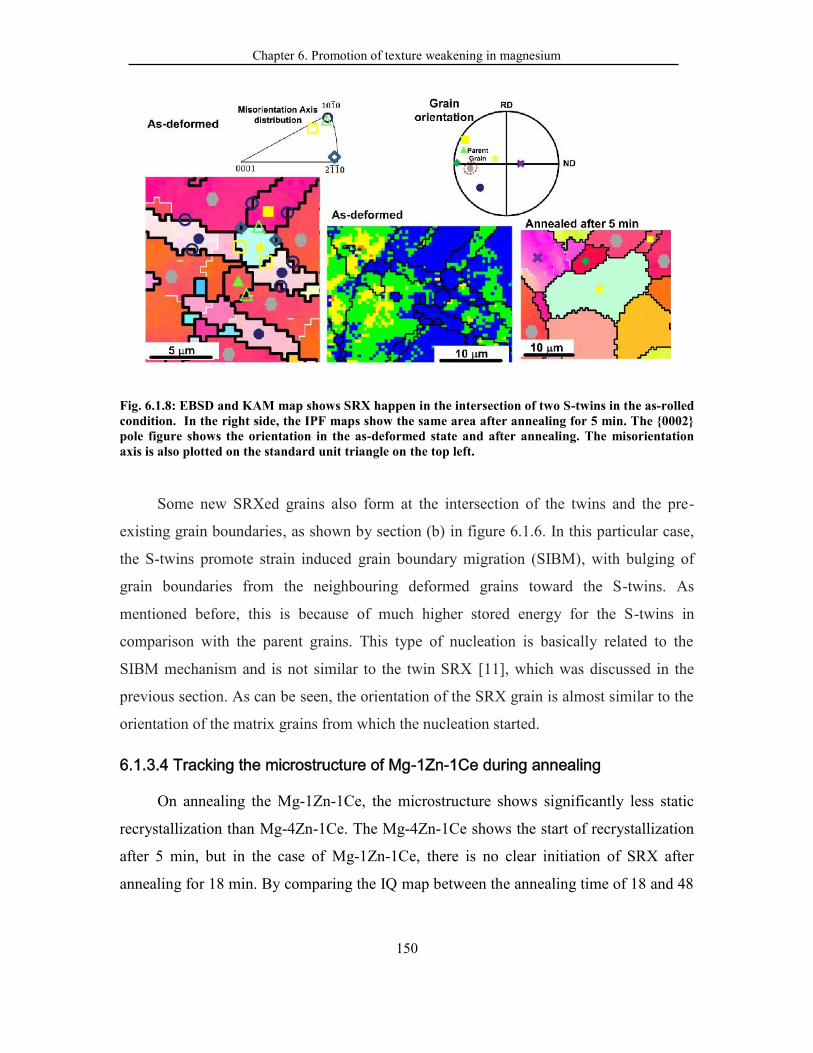
Chapter 6. Promotion of texture weakening in magnesium
150
Fig. 6.1.8: EBSD and KAM map shows SRX happen in the intersection of two S-twins in the as-rolledcondition. In the right side, the IPF maps show the same area after annealing for 5 min. The {0002}pole figure shows the orientation in the as-deformed state and after annealing. The misorientationaxis is also plotted on the standard unit triangle on the top left.
Some new SRXed grains also form at the intersection of the twins and the pre-
existing grain boundaries, as shown by section (b) in figure 6.1.6. In this particular case,
the S-twins promote strain induced grain boundary migration (SIBM), with bulging of
grain boundaries from the neighbouring deformed grains toward the S-twins. As
mentioned before, this is because of much higher stored energy for the S-twins in
comparison with the parent grains. This type of nucleation is basically related to the
SIBM mechanism and is not similar to the twin SRX [11], which was discussed in the
previous section. As can be seen, the orientation of the SRX grain is almost similar to the
orientation of the matrix grains from which the nucleation started.
6.1.3.4 Tracking the microstructure of Mg-1Zn-1Ce during annealing
On annealing the Mg-1Zn-1Ce, the microstructure shows significantly less static
recrystallization than Mg-4Zn-1Ce. The Mg-4Zn-1Ce shows the start of recrystallization
after 5 min, but in the case of Mg-1Zn-1Ce, there is no clear initiation of SRX after
annealing for 18 min. By comparing the IQ map between the annealing time of 18 and 48
Chapter 6. Promotion of texture weakening in magnesium
151
min in figure 6.1.9, it can be seen that after annealing the non-index area decreased and
the image quality increased, which is a result of recrystallization.
As the IPF maps in figure 6.1.10 show, the fraction of low-angle grain boundaries
increases during annealing from 9 to 18 mins. In the case of the region shown in this
figure, the number of LAGB increases from 2754 to 3239. However, there is no clear
sign of new SRX grains.
As shown by tracking the same microstructural region, it is most likely that the
areas of recrystallized grain are associated with the heavily deformed material. As shown
in figure 6.1.11, some SRX are formed on the twins. Some SRX grains already formed at
twins grow toward the parents grains (shown by the diagonal), while some nucleated
grains are still limited to the interior of the parent twin (shown by filled circle in fig.
6.1.11), which has a completely different orientation than their parent twins.
Moreover, as can be seen in figure 6.1.12, some parallel twins, which formed the
local shear bands, were also observed at other grains, and these twins, with boundaries of
about 38°, were identified as S-twins. It is worth noting that strains adjacent to these S-
twins can be accommodated by forming dislocations. As can be seen in the as-deformed
microstructure the twins are connected by low-angle boundaries. After annealing, some
grains inside the S-twins, or intersection of twins and grain boundary (as demonstrated by
the lozenge (◊)), are formed and also low-angle boundaries in the annealed samples
decrease. Some SRX grains form inside the initial basal parent grains with wider
distribution.
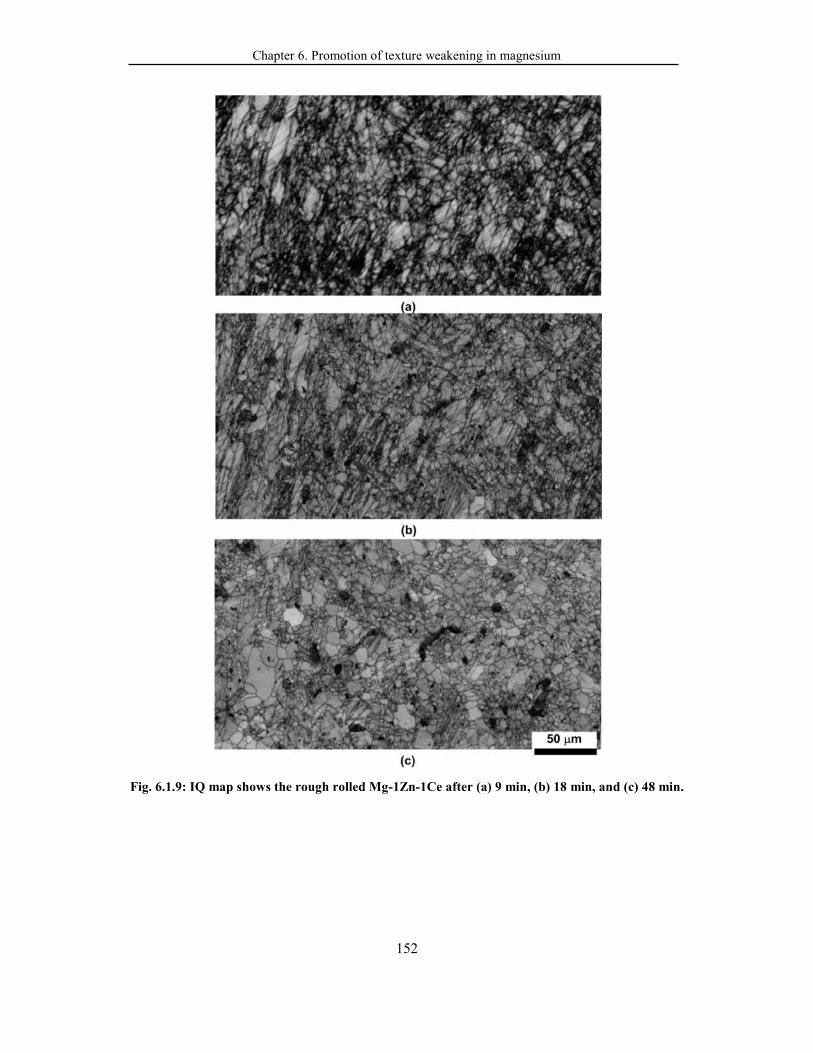
Chapter 6. Promotion of texture weakening in magnesium
152
Fig. 6.1.9: IQ map shows the rough rolled Mg-1Zn-1Ce after (a) 9 min, (b) 18 min, and (c) 48 min.
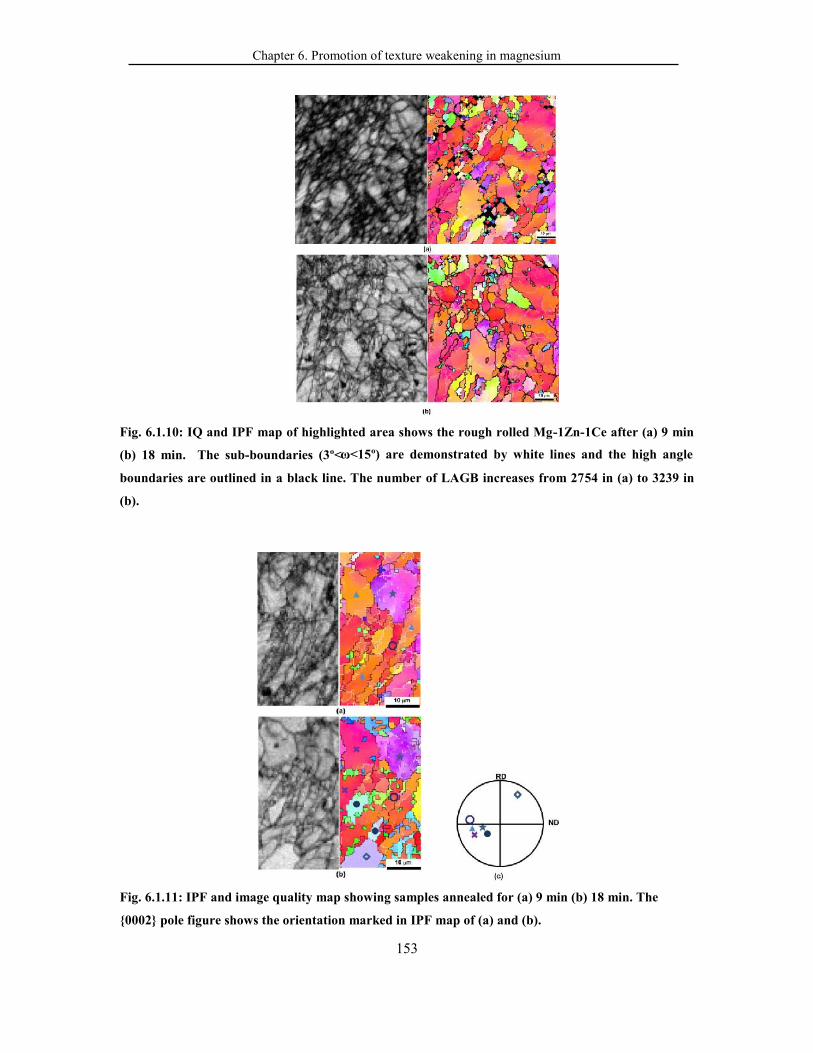
Chapter 6. Promotion of texture weakening in magnesium
153
Fig. 6.1.10: IQ and IPF map of highlighted area shows the rough rolled Mg-1Zn-1Ce after (a) 9 min
(b) 18 min. The sub-boundaries (3º<ω<15º) are demonstrated by white lines and the high angle
boundaries are outlined in a black line. The number of LAGB increases from 2754 in (a) to 3239 in
(b).
Fig. 6.1.11: IPF and image quality map showing samples annealed for (a) 9 min (b) 18 min. The
{0002} pole figure shows the orientation marked in IPF map of (a) and (b).
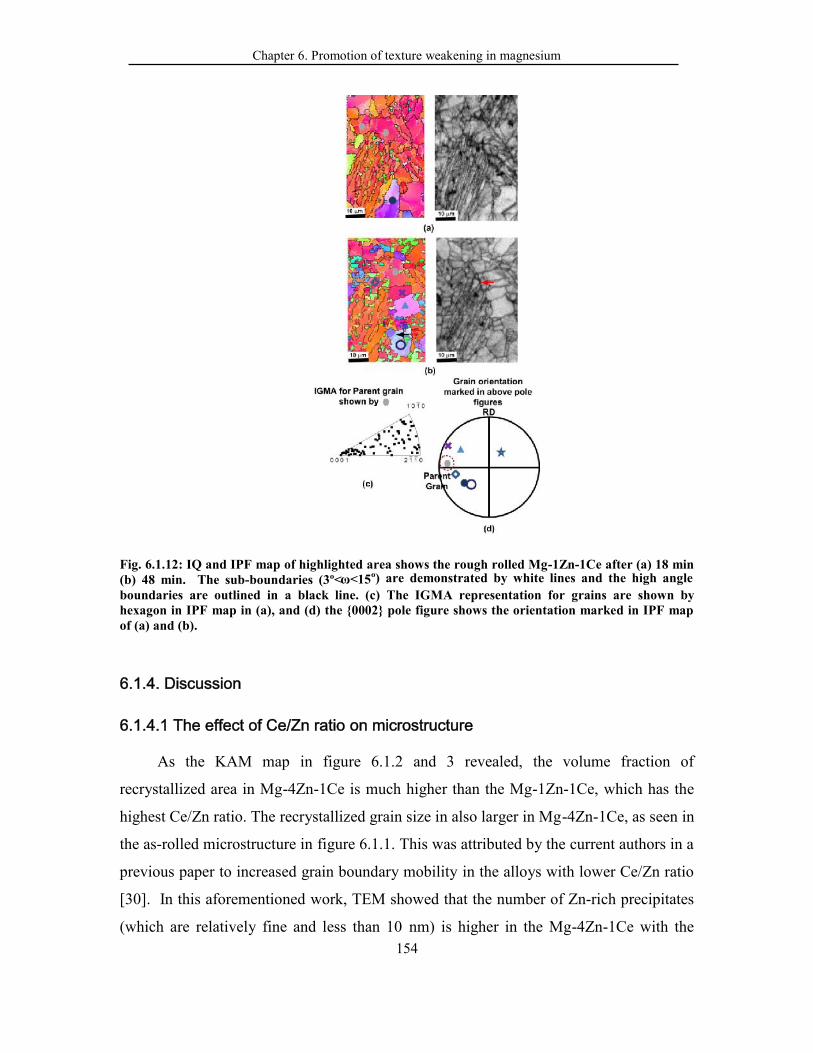
Chapter 6. Promotion of texture weakening in magnesium
154
Fig. 6.1.12: IQ and IPF map of highlighted area shows the rough rolled Mg-1Zn-1Ce after (a) 18 min(b) 48 min. The sub-boundaries (3º<ω<15º) are demonstrated by white lines and the high angleboundaries are outlined in a black line. (c) The IGMA representation for grains are shown byhexagon in IPF map in (a), and (d) the {0002} pole figure shows the orientation marked in IPF mapof (a) and (b).
6.1.4. Discussion
6.1.4.1 The effect of Ce/Zn ratio on microstructure
As the KAM map in figure 6.1.2 and 3 revealed, the volume fraction of
recrystallized area in Mg-4Zn-1Ce is much higher than the Mg-1Zn-1Ce, which has the
highest Ce/Zn ratio. The recrystallized grain size in also larger in Mg-4Zn-1Ce, as seen in
the as-rolled microstructure in figure 6.1.1. This was attributed by the current authors in a
previous paper to increased grain boundary mobility in the alloys with lower Ce/Zn ratio
[30]. In this aforementioned work, TEM showed that the number of Zn-rich precipitates
(which are relatively fine and less than 10 nm) is higher in the Mg-4Zn-1Ce with the
Chapter 6. Promotion of texture weakening in magnesium
155
lowest Ce/Zn ratio. These small particles can have a Zener pinning effect on low and high
angle grain boundaries [33]. On the other hand, the thermodynamic calculations carried
out using FactSageTM thermodynamic software showed that by increasing the Zn in the
Mg-Zn-Ce alloy systems the solubility of Ce in Mg decreases. Therefore, in the current
alloys, it can be concluded that the preferential segregation of Ce solute atoms to grain
boundaries is the main reason for decreasing the grain boundary mobility with increasing
Ce/Zn ratio. Grain boundary solute segregation has been reported in several Mg-RE
containing alloys [8, 29, 41, 46]. Hadorn et al. [46] mentioned that among the different
aspects of solute drag, two important properties are key to increasing the tendency
towards segregation: (i) lowering the interaction energy of the solute atom with respect to
the host atom and (b) increasing the atomic size difference between solute and host. In
the current alloying systems, Ce has large atomic radii, whereas Zn are smaller than
magnesium, although both of them are reported to have segregation in the boundaries
[46, 47]. Mishra et al. [47] also reported Ce segregation in some of the grain boundaries
in Mg-Ce alloys using a electron probe map. Therefore, the higher solute segregation in
grain boundaries can explain the retardation of recrystallization kinetics in Mg-1Zn-1Ce
alloys observed in the as-rolled (fig. 6.1.2 and 3) and annealed (fig. 6.1.5) microstructure.
6.1.4.2 Effect of alloying on the activated deformation mechanism
An important deformation mechanism is that of twins. It has been suggested that
by suppressing DRX in Mg-1Zn-1Ce, deformation cannot be accommodated in the soft
DRX region and, instead, deformation is accommodated by C- and S-twinning in the
basal parent grains, which can subsequently lead to the formation of shear bands [21].
Based on the model of Sandlobes et al. [34], increasing the activation of C- and S-twins
can lead to the formation of more local shear bands.
With regard to slip systems, the IGMA distribution for the Ce containing alloys
show different distributions for some of the orientation groups (fig. 6.1.4). The first
orientation group consists of grains with c-axes near ND; a change in alloy from Mg-
4Zn-1Ce to Mg-1Zn-1Ce leads to a shift of the misorientation axis distribution from
<uvt0> to [0001]. Since, increasing the Zn content increases Ce in solid solution, this
Chapter 6. Promotion of texture weakening in magnesium
156
suggests that Ce in solid solution promotes the activation of prismatic <a> slip systems at
the expense of basal slip. In this case, the concentration of the misorientation axis
distribution along or near the <uvt0> directions is sparser in Mg-4Zn-1Ce and the IGMA
distributions are most concentrated in <uvtw> regions (between [0001] and <uvt0>).
Chun et al. [38] reported even in the case of the activation of different variants of
prismatic <a> slips in the deformed grains, the <0001>-type IGMA distribution would
be preserved, since the three variants of the slip mode have the same Taylor axis, i.e.,
<0001>. However, the orientation of these grains is not favourable for prismatic <a>
and, as discussed earlier, is more favourable for pyramidal and C-twins. A slightly shifted
maximum peak to < 1012 > can be considered as a sign of activation of pyramidal <a>
slip systems. Therefore, it seems reasonable to hypothesise that different IGMA
distribution in Mg-1Zn-1Ce is the result of the co-activation of various slip modes,
including more prismatic and pyramidal <a> slip modes and probably less basal <a> slip
modes.
In the case of grains tilted from ND toward RD, there is some distinguishable
distribution between the two alloys. In the case of Mg-1Zn-1Ce, in addition to the <uvt0>
distribution, there is a significant local maxima close to the [0001] axis, which is
indicative of the operation of prismatic <a>. In summary, in Mg-1Zn-1Ce, more
deformation mechanisms, especially prismatic <a>, are activated during deformation.
The literature also reports that the scattering of the component close to TD could
potentially be seen as an indication of higher activity of prismatic <a>-slip during rolling
[8]. Akhtar and Teghtsoonian [48-50] indicated that, at low temperatures, solute
elements decrease the CRSS of prismatic slip and resulted in ease of prismatic slip
activation. They performed the same experiment at higher temperatures, and they found
the CRSS for prismatic slip increases at low solute concentrations followed by a decrease
at higher solute levels [49]. Handorn et al. [40] suggested that in Mg-Y alloys, more
activation of prismatic slip has more effect on changing the recovery/recrystallization
mechanisms rather than changing the deformation texture by altering the dominant
deformation mechanism. For instance, they suggest that the <a>-type dislocations (i.e.,
basal and prismatic) can cross-slip onto non-basal planes more easily, altering the
Chapter 6. Promotion of texture weakening in magnesium
157
restoration mechanisms and inducing a more homogenous microstructure. In the case of
the current Ce containing alloys, although the thermodynamic calculations in the previous
work of the author shows a very small solubility of Ce, Stanford et al. [24] reported that
among the different RE addition, Ce and La are the most effective texture modifiers
because of their large atomic radii and their strong interaction with dislocations and
boundaries in magnesium-based alloys [15]. The study of dynamic strain ageing (DSA)
in Mg-Ce alloys also provides an additional indication that Ce interacts with dislocations
[51]. Therefore, it can be concluded that the higher solubility of Ce in Mg-1Zn-1Ce has
two major effects: (i) decreasing the grain boundary boundary mobility and consequently
retarding the recrystallization; (ii) changing the recrystallization mode by easing
resistance to some other deformation mechanism rather than basal slip, which was found
to be prismatic by using IGMA analysis.
It is worth noting that Handorn et al. [46] also suggested that the prismatic slip may
be controlling mechanism for the activation of C-twinning (based on Jonas et al. [52])
and for that reason it can be the reason that RE-containing alloys exhibit more local shear
bands instead of intense shear banding in conventional Mg alloys [20].
4.1.4.3 Static restoration mechanism during annealing
The three main aspects that can influence the characteristics of SRX in the current
alloys are: (i) the different initial nucleation sites - mainly the different volume fractions
of twinning and twinning type; (ii) the stored energy of deformation due to different DRX
kinetics; and (iii) grain boundary mobility due to solutes. The effect of these three aspects
will be explained in more detail in the following sections:
(i) Nucleation sites
Static recrystallization will initiate at inhomogeneities in the deformed
microstructure, which can be related to microstructural features such as second phase
particles [22, 23], and/or in the vicinity of prior twins [35, 53] grain boundaries [35, 53],
such as shear or deformation bands [11, 30].
As was shown in figure 6.1.6 (a) and 7(a), in the as-rolled condition of Mg-4Zn-
1Ce, recrystallization in the twins and/or their vicinity can lead to orientations that differ
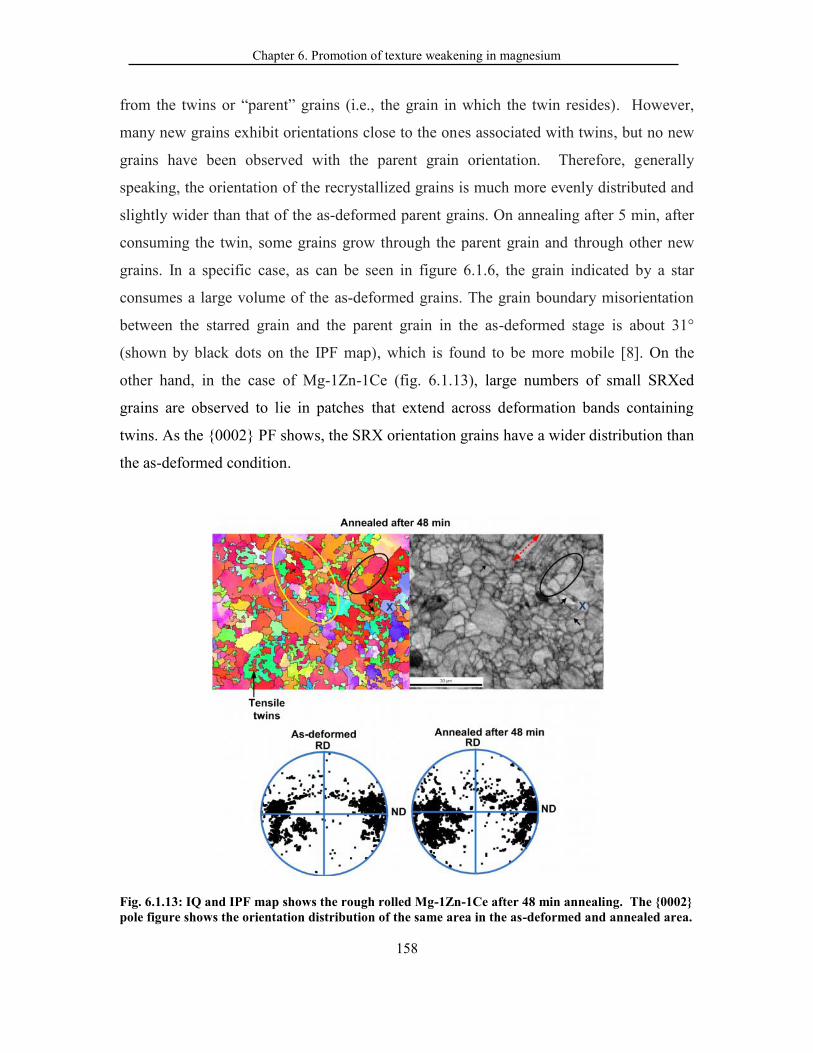
Chapter 6. Promotion of texture weakening in magnesium
158
from the twins or “parent” grains (i.e., the grain in which the twin resides). However,
many new grains exhibit orientations close to the ones associated with twins, but no new
grains have been observed with the parent grain orientation. Therefore, generally
speaking, the orientation of the recrystallized grains is much more evenly distributed and
slightly wider than that of the as-deformed parent grains. On annealing after 5 min, after
consuming the twin, some grains grow through the parent grain and through other new
grains. In a specific case, as can be seen in figure 6.1.6, the grain indicated by a star
consumes a large volume of the as-deformed grains. The grain boundary misorientation
between the starred grain and the parent grain in the as-deformed stage is about 31°
(shown by black dots on the IPF map), which is found to be more mobile [8]. On the
other hand, in the case of Mg-1Zn-1Ce (fig. 6.1.13), large numbers of small SRXed
grains are observed to lie in patches that extend across deformation bands containing
twins. As the {0002} PF shows, the SRX orientation grains have a wider distribution than
the as-deformed condition.
Fig. 6.1.13: IQ and IPF map shows the rough rolled Mg-1Zn-1Ce after 48 min annealing. The {0002}pole figure shows the orientation distribution of the same area in the as-deformed and annealed area.
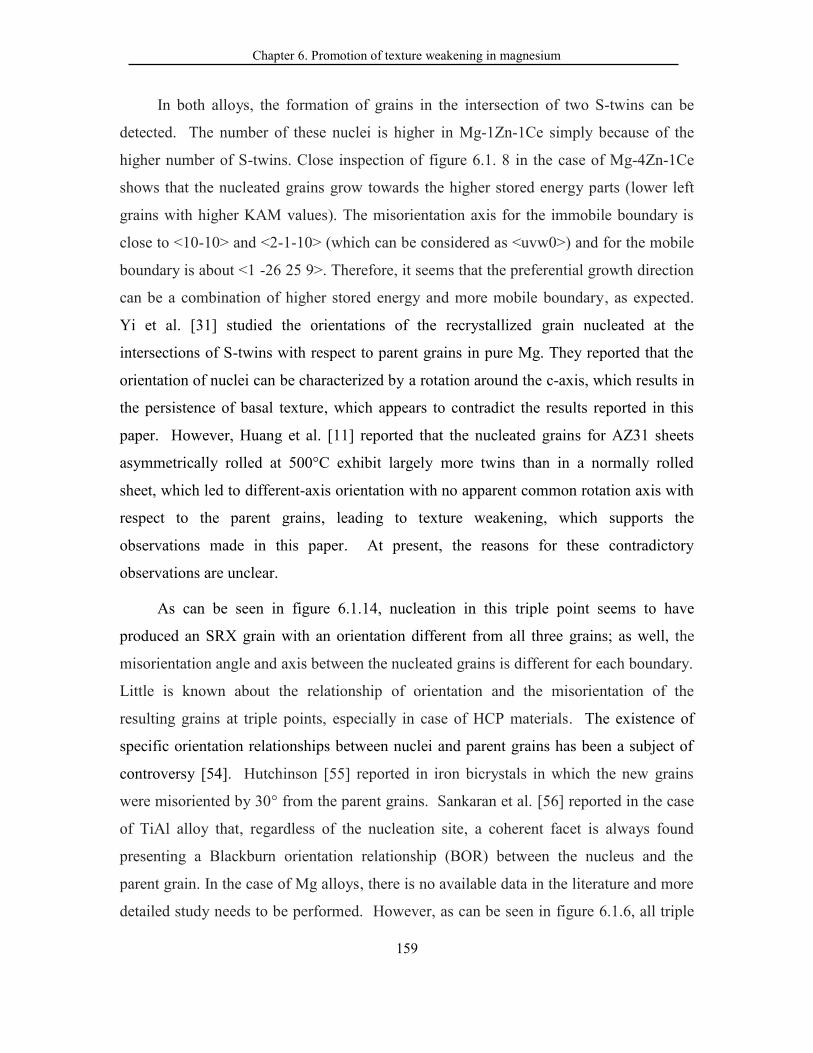
Chapter 6. Promotion of texture weakening in magnesium
159
In both alloys, the formation of grains in the intersection of two S-twins can be
detected. The number of these nuclei is higher in Mg-1Zn-1Ce simply because of the
higher number of S-twins. Close inspection of figure 6.1. 8 in the case of Mg-4Zn-1Ce
shows that the nucleated grains grow towards the higher stored energy parts (lower left
grains with higher KAM values). The misorientation axis for the immobile boundary is
close to <10-10> and <2-1-10> (which can be considered as <uvw0>) and for the mobile
boundary is about <1 -26 25 9>. Therefore, it seems that the preferential growth direction
can be a combination of higher stored energy and more mobile boundary, as expected.
Yi et al. [31] studied the orientations of the recrystallized grain nucleated at the
intersections of S-twins with respect to parent grains in pure Mg. They reported that the
orientation of nuclei can be characterized by a rotation around the c-axis, which results in
the persistence of basal texture, which appears to contradict the results reported in this
paper. However, Huang et al. [11] reported that the nucleated grains for AZ31 sheets
asymmetrically rolled at 500°C exhibit largely more twins than in a normally rolled
sheet, which led to different-axis orientation with no apparent common rotation axis with
respect to the parent grains, leading to texture weakening, which supports the
observations made in this paper. At present, the reasons for these contradictory
observations are unclear.
As can be seen in figure 6.1.14, nucleation in this triple point seems to have
produced an SRX grain with an orientation different from all three grains; as well, the
misorientation angle and axis between the nucleated grains is different for each boundary.
Little is known about the relationship of orientation and the misorientation of the
resulting grains at triple points, especially in case of HCP materials. The existence of
specific orientation relationships between nuclei and parent grains has been a subject of
controversy [54]. Hutchinson [55] reported in iron bicrystals in which the new grains
were misoriented by 30° from the parent grains. Sankaran et al. [56] reported in the case
of TiAl alloy that, regardless of the nucleation site, a coherent facet is always found
presenting a Blackburn orientation relationship (BOR) between the nucleus and the
parent grain. In the case of Mg alloys, there is no available data in the literature and more
detailed study needs to be performed. However, as can be seen in figure 6.1.6, all triple
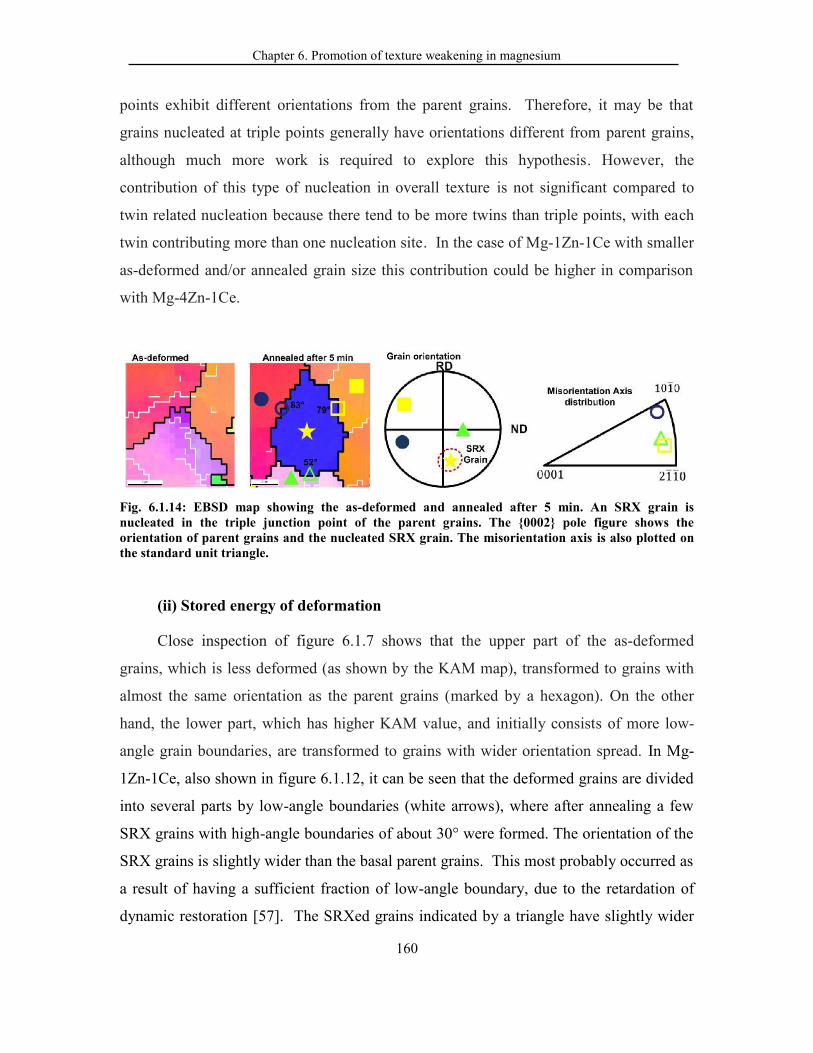
Chapter 6. Promotion of texture weakening in magnesium
160
points exhibit different orientations from the parent grains. Therefore, it may be that
grains nucleated at triple points generally have orientations different from parent grains,
although much more work is required to explore this hypothesis. However, the
contribution of this type of nucleation in overall texture is not significant compared to
twin related nucleation because there tend to be more twins than triple points, with each
twin contributing more than one nucleation site. In the case of Mg-1Zn-1Ce with smaller
as-deformed and/or annealed grain size this contribution could be higher in comparison
with Mg-4Zn-1Ce.
Fig. 6.1.14: EBSD map showing the as-deformed and annealed after 5 min. An SRX grain isnucleated in the triple junction point of the parent grains. The {0002} pole figure shows theorientation of parent grains and the nucleated SRX grain. The misorientation axis is also plotted onthe standard unit triangle.
(ii) Stored energy of deformation
Close inspection of figure 6.1.7 shows that the upper part of the as-deformed
grains, which is less deformed (as shown by the KAM map), transformed to grains with
almost the same orientation as the parent grains (marked by a hexagon). On the other
hand, the lower part, which has higher KAM value, and initially consists of more low-
angle grain boundaries, are transformed to grains with wider orientation spread. In Mg-
1Zn-1Ce, also shown in figure 6.1.12, it can be seen that the deformed grains are divided
into several parts by low-angle boundaries (white arrows), where after annealing a few
SRX grains with high-angle boundaries of about 30° were formed. The orientation of the
SRX grains is slightly wider than the basal parent grains. This most probably occurred as
a result of having a sufficient fraction of low-angle boundary, due to the retardation of
dynamic restoration [57]. The SRXed grains indicated by a triangle have slightly wider

Chapter 6. Promotion of texture weakening in magnesium
161
distributions, most probably as a result of higher ingrain misorientation and subsequent
higher volume fraction of LAGB and their rotation during SRX. Nucleation as a result of
a misorientation gradient inside individual grains also can be observed in this area (in the
grains marked by a hollow circle and arrow). The same mechanism can be observed in
figure 6.1.15. As can be seen, an orientation gradient is also present in this region in
deformed grains and this misorientation gradient is demonstrated using misorientation
angle distribution vs distance inside the grains. The orientation gradient can result in
subgrains and, on further annealing, lead to the formation of high angle grain boundaries.
As the IGMA distribution shows for these grains, the activation of more prismatic <a>
dislocation can facilitate dislocation climb and/or cross-glide, which is necessary for
dislocations to rearrange themselves into cell and subgrain boundaries [26, 58]. As the
IPF maps show, a total annealing time of 5 min resulted in the formation high angle grain
boundaries. The orientation of new grains is different from the initial parent grains and
consumes the initial grains completely.
Therefore, it seems that increasing stored energy can lead to an increasing
orientation gradient in an individual grain, subsequently increasing the geometrically
necessary dislocations or forming low-angle grain boundaries [33]. This can result in
forming new grains with wider orientation distribution.
(iii) Grain boundary mobility
In the Mg-1Zn-1Ce alloy, due to higher solid solution of Ce, the grain boundary
mobility is lower compared to Mg-4Zn-1Ce. In the Mg-1Zn-1Ce alloy, some SRX
grains grow very slowly and most of them are limited inside the twin region, as can be
seen in figure 6.1.11. Even some grains nucleated in the intersection of the S-twins and
grain boundaries by the bulge mechanism (which is found to be unfavourable in terms of
texture weakening, as was shown fig. 6.1.6 (b)) are likely to grow much slower through
the parent twins in comparison to Mg-4Zn-1Ce.
Therefore, it seems that RE element segregation to grain boundary and dislocation
inhibition of dynamic restoration can lead to the formation of a wider range of orientation
during static restoration processes. This can be mainly as a result of twin related SRX or
Chapter 6. Promotion of texture weakening in magnesium
162
the formation of nuclei with more widely distributed orientations as a result of higher
concentration of non-basal dislocations.
Fig. 6.1.15: This misorientation gradient is demonstrated using misorientation angle distribution vsdistance inside the grains in the Mg-4Zn-1Ce alloy.
6.1.5. Conclusion
Microstructure and texture development in four Mg-Zn-Ce alloys and Mg-3Al-1Zn
were studied following rough rolling, high speed large draught rolling, and subsequent
isothermal annealing. The main results are summarized as follows:
1- The preferential segregation of Ce solute atoms to grain boundaries is the
main reason for decreasing the grain boundary mobility by increasing the Ce/Zn
ratio.
2- Lower grain boundary mobility as a result of solute segregation in grain
boundaries leads to the retardation of recrystallization kinetics in Mg-1Zn-1Ce.
3- Larger numbers of C- and S-twins during deformation lead to the formation
of more local shear bands and more homogenous deformation.
4- IGMA analysis shows that in Mg-1Zn-1Ce more deformation mechanisms,
especially more prismatic <a>, can be activated during the deformation.
5- The recrystallization mode is changed by easing the resistance to deformation
mechanism other than basal slip, leading to weaker basal texture in the as-rolled
condition.

Chapter 6. Promotion of texture weakening in magnesium
163
6- A wider range of orientatiosn formed during static restoration processes in
Mg-1Zn-1Ce. This is mainly due to twin related SRX or the formation of nuclei with
more widely distributed orientations resulting from a higher concentration of non-
basal dislocations.
6.1.6 References
[1] M. Shamsi, M. Sanjari, A.Z. Hanzaki, Materials Science and Technology, 25 (2009) 1039-1045.[2] H.B. M. Avedesian, ASM specialty handbook. Magnesium and magnesium alloys. , ASM International,Materials Park, Ohio, 2000.[3] R. Kawalla, M. Oswald, C. Schmidt, M. Ullmann, H.P. Vogt, N.D. Cuong, Metalurgija, 47 (2008) 195-198.[4] S.R. Agnew, M.H. Yoo, C.N. Tomé, Acta Materialia, 49 (2001) 4277-4289.[5] L.W.F. Mackenzie, M. Pekguleryuz, Materials Science and Engineering: A, 480 (2008) 189-197.[6] A. Styczynski, C. Hartig, J. Bohlen, D. Letzig, Scripta Materialia, 50 (2004) 943-947.[7] S. Abdessameud, D. Bradai, Canadian Metallurgical Quarterly, 48 (2009) 433-442.[8] T. Al-Samman, X. Li, Materials Science and Engineering A, 528 (2011) 3809-3822.[9] M.R. Barnett, M.D. Nave, C.J. Bettles, Materials Science and Engineering A, 386 (2004) 205-211.[10] X. Huang, K. Suzuki, N. Saito, Scripta Materialia, 60 (2009) 651-654.[11] X. Huang, K. Suzuki, Y. Chino, Journal of Alloys and Compounds, 509 (2011) 4854-4860.[12] X. Gong, S.B. Kang, S. Li, J.H. Cho, Materials & Design, 30 (2009) 3345-3350.[13] Y. Chino, M. Mabuchi, Scripta Materialia, 60 (2009) 447-450.[14] H. Watanabe, M. Fukusumi, Materials Science and Engineering: A, 477 (2008) 153-161.[15] K. Hantzsche, J. Bohlen, J. Wendt, K.U. Kainer, S.B. Yi, D. Letzig, Scripta Materialia, 63 (2010) 725-730.[16] J. Bohlen, M.R. Nürnberg, J.W. Senn, D. Letzig, S.R. Agnew, Acta Materialia, 55 (2007) 2101-2112.[17] R. Cottam, J. Robson, G. Lorimer, B. Davis, Materials Science and Engineering: A, 485 (2008) 375-382.[18] L.W.F. Mackenzie, M.O. Pekguleryuz, Scripta Materialia, 59 (2008) 665-668.[19] N. Stanford, Materials Science and Engineering: A, 527 (2010) 2669-2677.[20] H. Yan, S.W. Xu, R.S. Chen, S. Kamado, T. Honma, E.H. Han, Scripta Materialia, 64 (2011) 141-144.[21] S.A. Farzadfar, M. Sanjari, I.H. Jung, E. Essadiqi, S. Yue, Materials Science and Engineering: A, 528(2011) 6742-6753.[22] E.A. Ball, P.B. Prangnell, Scripta Metallurgica et Materiala, 31 (1994) 111-116.[23] L.W.F. Mackenzie, G.W. Lorimer, F.J. Humphreys, T. Wilks, 2004, pp. 477-482.[24] N. Stanford, M.R. Barnett, Materials Science and Engineering: A, 496 (2008) 399-408.[25] T. Al-Samman, G. Gottstein, Materials Science and Engineering A, 490 (2008) 411-420.[26] S.E. Ion, F.J. Humphreys, S.H. White, Acta Metallurgica, 30 (1982) 1909-1919.[27] J.C. Tan, M.J. Tan, Materials Science and Engineering A, 339 (2003) 124-132.[28] S.Q. Zhu, H.G. Yan, J.H. Chen, Y.Z. Wu, J.Z. Liu, J. Tian, Scripta Materialia, 63 (2010) 985-988.[29] S.A. Farzadfar, E. Martin, M. Sanjari, E. Essadiqi, S. Yue, Journal of Materials Science, 47 (2012)5488-5500.[30] M. Sanjari, S.F. Farzadfar, T. Sakai, H. Utsunomiya, E. Essadiqi, I.H. Jung, S. Yue, Materials Scienceand Engineering A, 561 (2012) 191-202.[31] S. Yi, I. Schestakow, S. Zaefferer, Materials Science and Engineering: A, 516 (2009) 58-64.[32] M. Sanjari, S.A. Farzadfar, H. Utsunomiya, T. Sakai, E. Essadiqi, S. Yue, Materials Science andTechnology (United Kingdom), 28 (2012) 928-933.[33] F.J. Humphreys, M. Hatherly, Recrystallization and related annealing phenomena, Pergamon, 2004.
Chapter 6. Promotion of texture weakening in magnesium
164
[34] S. Sandlöbes, S. Zaefferer, I. Schestakow, S. Yi, R. Gonzalez-Martinez, Acta Materialia, 59 (2011)429-439.[35] M. Sanjari, S.A. Farzadfar, I.H. Jung, E. Essadiqi, S. Yue, Materials Science and Technology, (2011).[36] W. Taylor, A. Moore, Journal of Nuclear Materials, 13 (1964) 23-27.[37] R.P. Mulay, S.R. Agnew, Acta Materialia, 60 (2012) 1784-1794.[38] Y.B. Chun, C.H.J. Davies, Metallurgical and Materials Transactions A: Physical Metallurgy andMaterials Science, 42 (2011) 4113-4125.[39] Y.B. Chun, M. Battaini, C.H.J. Davies, S.K. Hwang, Metallurgical and Materials Transactions A:Physical Metallurgy and Materials Science, 41 (2010) 3473-3487.[40] J.P. Hadorn, K. Hantzsche, S. Yi, J. Bohlen, D. Letzig, S.R. Agnew, Metallurgical and MaterialsTransactions A: Physical Metallurgy and Materials Science, 43 (2012) 1363-1375.[41] Y.B. Chun, J. Geng, N. Stanford, C.H.J. Davies, J.F. Nie, M.R. Barnett, Materials Science andEngineering: A, 528 (2011) 3653-3658.[42] H. Li, E. Hsu, J. Szpunar, H. Utsunomiya, T. Sakai, Journal of Materials Science, 43 (2008) 7148-7156.[43] S. Mahajan, Acta Metallurgica, 21 (1973) 255-260.[44] É. Martin, L. Capolungo, L. Jiang, J.J. Jonas, Acta Materialia, 58 (2010) 3970-3983.[45] S.W. Xu, S. Kamado, N. Matsumoto, T. Honma, Y. Kojima, Materials Science and Engineering: A,527 (2009) 52-60.[46] J. Hadorn, K. Hantzsche, S. Yi, J. Bohlen, D. Letzig, J. Wollmershauser, S. Agnew, Metallurgical andMaterials Transactions A, 43 (2012) 1347-1362.[47] R.K. Mishra, A.K. Gupta, P.R. Rao, A.K. Sachdev, A.M. Kumar, A.A. Luo, Scripta Materialia, 59(2008) 562-565.[48] A. Akhtar, E. Teghtsoonian, Phil Mag, 25 (1972) 897-916.[49] A. Akhtar, E. Teghtsoonian, Acta Metallurgica, 17 (1969) 1351-1356.[50] A. Akhtar, E. Teghtsoonian, Acta Metallurgica, 17 (1969) 1339-1349.[51] L. Jiang, J.J. Jonas, R. Mishra, Materials Science and Engineering A, 528 (2011) 6596-6605.[52] J.J. Jonas, S. Mu, T. Al-Samman, G. Gottstein, L. Jiang, Ė. Martin, Acta Materialia, 59 (2011) 2046-2056.[53] E. Martin, L. Jiang, S. Godet, J.J. Jonas, International Journal of Materials Research, 100 (2009) 576-583.[54] C. Yanar, J.M.K. Wiezorek, V. Radmilovic, W.A. Soffa, Metallurgical and Materials Transactions A:Physical Metallurgy and Materials Science, 33 (2002) 2413-2423.[55] W.B. Hutchinson, Acta Metallurgica, 37 (1989) 1047-1056.[56] A. Sankaran, E. Bouzy, M. Humbert, A. Hazotte, Acta Materialia, 57 (2009) 1230-1242.[57] F.J. Humphreys, J.W. Martin, Acta Metallurgica, 15 (1967) 1087-1088.[58] S.H. White, M.R. Drury, S.E. Ion, F.J. Humphreys, Physics of the Earth and Planetary Interiors, 40(1985) 201-207.
Chapter 6. Promotion of texture weakening in magnesium
165
6.2 The effect of thermomechanical processing on texture
weakening
* This section has been submitted to: M. Sanjari , A. Farzadfar, H. Utsunomiya, E. Essadiqi, R.
Petrov, L. Kestens, S.Yue, Promotion of texture weakening in magnesium by: II. Thermomechanical
processing, Materials Science and Engineering A.
In part 6.1 of this two companion set, the effect of increasing Ce in solid solution on
the recrystallization and texture evolution of four Mg-Zn-Ce sheets was investigated in
the as-deformed and annealed state. In the present paper, the effect of rolling speed on the
microstructure and texture development of these alloys is evaluated.
The effect of rolling speed on the recrystallization and texture evolution of four Mg-
Zn-Ce sheets was investigated at as-deformed and different stages of annealing. The
deformation microstructure was obtained through two stages that can be characterised as
rough rolling and finish rolling. To study the effect of finish rolling temperature, one
rolling pass with a 65% reduction in thickness was performed at 300C and 450C and at
rolling speeds of 15 and 1000 m/min. The results showed that by increasing the rolling
speed, more secondary and compression twins were activated, which leads to the
formation of more numerous local shear bands and a more uniform microstructure. The
rotational dynamic recrystallization mechanism, in conjunction with the conventional
DRX mechanism, is responsible for this texture weakening during high speed rolling
(HSR). Annealing secondary twins and their vicinity were observed to be the preferential
sites for nucleation, and it seems that recrystallization on secondary twins contributes to
basal texture weakening. Therefore, an increasing number of such twins increase the
texture weakening. In this way, the combination of these RE additions and HSR resulted
in a weaker deformed and annealed texture.
Chapter 6. Promotion of texture weakening in magnesium
166
6.2.1. Introduction
Magnesium alloys are difficult to work at low temperatures (<200°C) due to the HCP
structure and relatively high critical resolved shear stresses of non-basal slip systems [1-
3]. Therefore, the production of flat products by rolling is generally performed by hot or
warm rolling. In such a process, the thickness is reduced with many rolling passes of
small reductions, accompanied by intermediate annealing, in order to suppress edge
cracks or fracture of the material and to maintain the pass-to-pass workability [3-5].
Consequently, flat products (i.e., sheet and plate) are very expensive, which is one of the
reasons why magnesium is not currently in widespread use [2, 4].
However, there is some evidence, in the recent work of the current authors, that high
speed rolling (HSR) of AZ31 softens the as-rolled texture, which facilitates the
manufacturing of components from the sheet [6-9]. The following additional advantages
of HSR were observed for AZ31 [6-9]:
- HSR of AZ31 can be successfully completed at temperatures around
200C with more than a 25% reduction in one single pass, the temperature at
which cracking takes place at conventional rolling speeds [6, 7].
- The sheet obtained by high-speed rolling exhibits a fine-grained
microstructure with an average grain size of 2 to 3 m and with good mechanical
properties [7-9].
In previous work of the authors [10], it was suggested that the splitting of the basal
splitting texture can possibly be attributed to the increased activity of <c+a> slip and to
compression and secondary twinning. It seems that more compression twin (C-twin) and
secondary twin (S-twin) activation leads to the formation of local shear bands and,
therefore, a more homogeneous distribution of the deformation strain in the zone [10].
As mentioned above, the addition of rare earths appears to be beneficial in terms of
weakening the texture of as-rolled sheet. Therefore, the goal of this study is to investigate
the effect of HSR on the formability, microstructure, and texture of the Mg-Zn-Ce alloys
and compare the results with AZ31.
Chapter 6. Promotion of texture weakening in magnesium
167
6.2.2 Experimental procedure
6.2.2.1 Rolling experiments
The same four alloys of the Mg-Zn-Ce system described in part 1 were prepared for
the rolling experiments. The rolling experiments were conducted in two stages: rough
rolling and finish rolling. The purpose of rough rolling was to decrease the grain size
from about 1 mm to about 130 µm in preparation for high speed rolling. Rough rolling
was performed at 15 m/min using a low-speed, two-high, mill with 320 mm rolls. The
plates were rolled in three consecutive passes of 12 to 15% reduction per pass at 450°C, as
a result of which the thickness reduced from 6 mm to 3 mm. The samples were reheated
for 10 min between each pass to keep the rolling temperature constant. After cooling in
air to room temperature the rough rolled samples were annealed at 450°C for 15 min to
fully recrystallize the material. For the finish rolling, LSR and HSR was performed in a
single pass operation with a reduction in thickness of about 60% at two temperatures,
300°C and 450°C, at rolling speeds of 15 and 1000 m/min, respectively. LSR was
performed on the same mill as rough rolling. HSR was performed in a two-high
laboratory HSR mill with 530 mm rolls was used to perform. Prior to finish rolling, the
specimens were reheated for 10 m at the corresponding rolling temperature. Details of
the experiments and the high speed rolling machines can be found in previous work [7].
6.2.2.2 Material characterization
The samples were cut in RD-ND planes, mounted, and ground to 1200 grit and then
polished with alcohol based 3 and 1 micron diamond suspensions for microstructural
examination by optical microscopy. The samples were etched with an acetic-picral
solution (10 mL acetic acid + 4.2 g picric acid + 10 mL water + 70 mL ethanol (99.5
pct)). The macro-texture was evaluated in a Siemens D-500 X-ray diffractometer
equipped with a texture goniometer using Co radiation in TD-RD plan. The incomplete
pole figures of {10-10}, {0002}, and {10-11} were analyzed to calculate orientation
distribution functions (ODF) using the arbitrary defined cell (ADC) method by TexTools
software. In the next step, the ODFs were used to recalculate the pole figures.
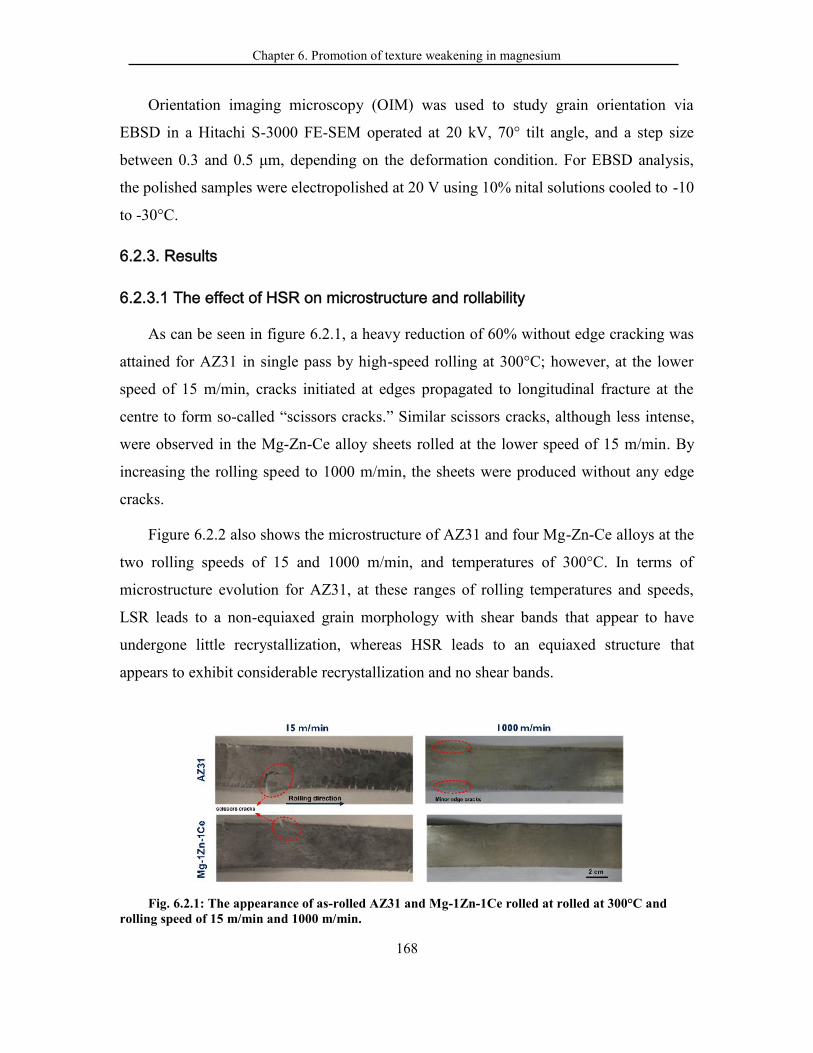
Chapter 6. Promotion of texture weakening in magnesium
168
Orientation imaging microscopy (OIM) was used to study grain orientation via
EBSD in a Hitachi S-3000 FE-SEM operated at 20 kV, 70° tilt angle, and a step size
between 0.3 and 0.5 μm, depending on the deformation condition. For EBSD analysis,
the polished samples were electropolished at 20 V using 10% nital solutions cooled to -10
to -30°C.
6.2.3. Results
6.2.3.1 The effect of HSR on microstructure and rollability
As can be seen in figure 6.2.1, a heavy reduction of 60% without edge cracking was
attained for AZ31 in single pass by high-speed rolling at 300°C; however, at the lower
speed of 15 m/min, cracks initiated at edges propagated to longitudinal fracture at the
centre to form so-called “scissors cracks.” Similar scissors cracks, although less intense,
were observed in the Mg-Zn-Ce alloy sheets rolled at the lower speed of 15 m/min. By
increasing the rolling speed to 1000 m/min, the sheets were produced without any edge
cracks.
Figure 6.2.2 also shows the microstructure of AZ31 and four Mg-Zn-Ce alloys at the
two rolling speeds of 15 and 1000 m/min, and temperatures of 300°C. In terms of
microstructure evolution for AZ31, at these ranges of rolling temperatures and speeds,
LSR leads to a non-equiaxed grain morphology with shear bands that appear to have
undergone little recrystallization, whereas HSR leads to an equiaxed structure that
appears to exhibit considerable recrystallization and no shear bands.
Fig. 6.2.1: The appearance of as-rolled AZ31 and Mg-1Zn-1Ce rolled at rolled at 300°C androlling speed of 15 m/min and 1000 m/min.
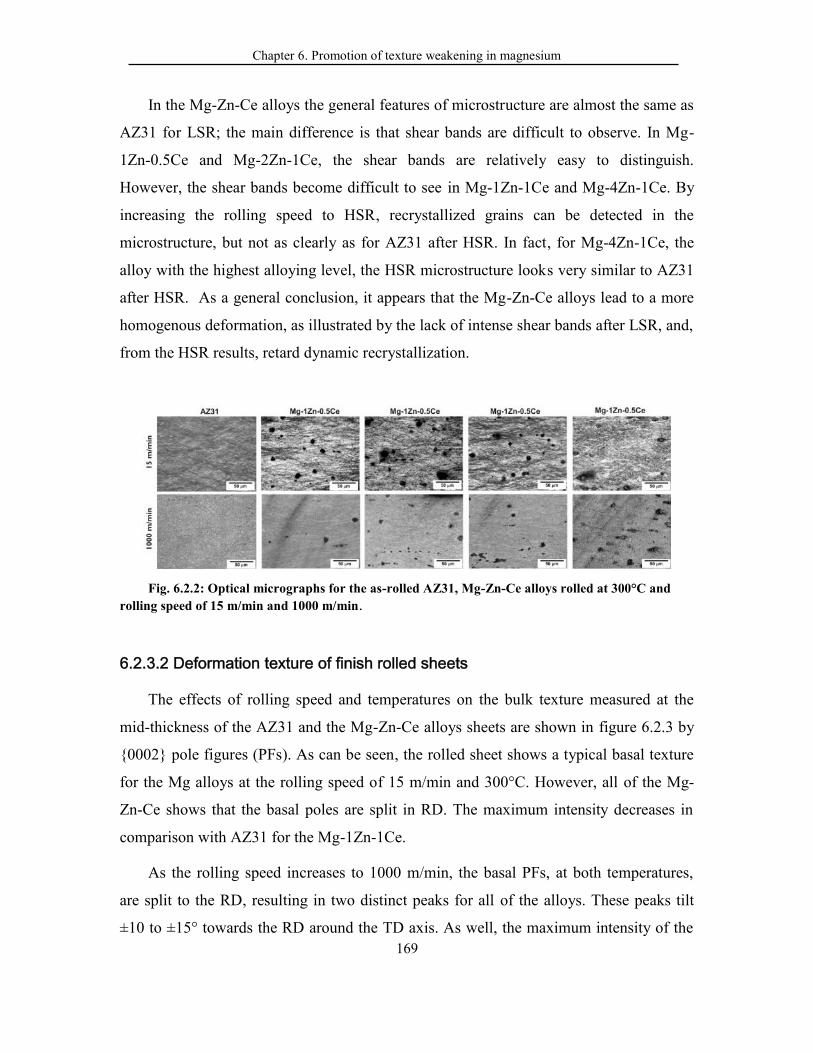
Chapter 6. Promotion of texture weakening in magnesium
169
In the Mg-Zn-Ce alloys the general features of microstructure are almost the same as
AZ31 for LSR; the main difference is that shear bands are difficult to observe. In Mg-
1Zn-0.5Ce and Mg-2Zn-1Ce, the shear bands are relatively easy to distinguish.
However, the shear bands become difficult to see in Mg-1Zn-1Ce and Mg-4Zn-1Ce. By
increasing the rolling speed to HSR, recrystallized grains can be detected in the
microstructure, but not as clearly as for AZ31 after HSR. In fact, for Mg-4Zn-1Ce, the
alloy with the highest alloying level, the HSR microstructure looks very similar to AZ31
after HSR. As a general conclusion, it appears that the Mg-Zn-Ce alloys lead to a more
homogenous deformation, as illustrated by the lack of intense shear bands after LSR, and,
from the HSR results, retard dynamic recrystallization.
Fig. 6.2.2: Optical micrographs for the as-rolled AZ31, Mg-Zn-Ce alloys rolled at 300°C androlling speed of 15 m/min and 1000 m/min.
6.2.3.2 Deformation texture of finish rolled sheets
The effects of rolling speed and temperatures on the bulk texture measured at the
mid-thickness of the AZ31 and the Mg-Zn-Ce alloys sheets are shown in figure 6.2.3 by
{0002} pole figures (PFs). As can be seen, the rolled sheet shows a typical basal texture
for the Mg alloys at the rolling speed of 15 m/min and 300°C. However, all of the Mg-
Zn-Ce shows that the basal poles are split in RD. The maximum intensity decreases in
comparison with AZ31 for the Mg-1Zn-1Ce.
As the rolling speed increases to 1000 m/min, the basal PFs, at both temperatures,
are split to the RD, resulting in two distinct peaks for all of the alloys. These peaks tilt
±10 to ±15° towards the RD around the TD axis. As well, the maximum intensity of the
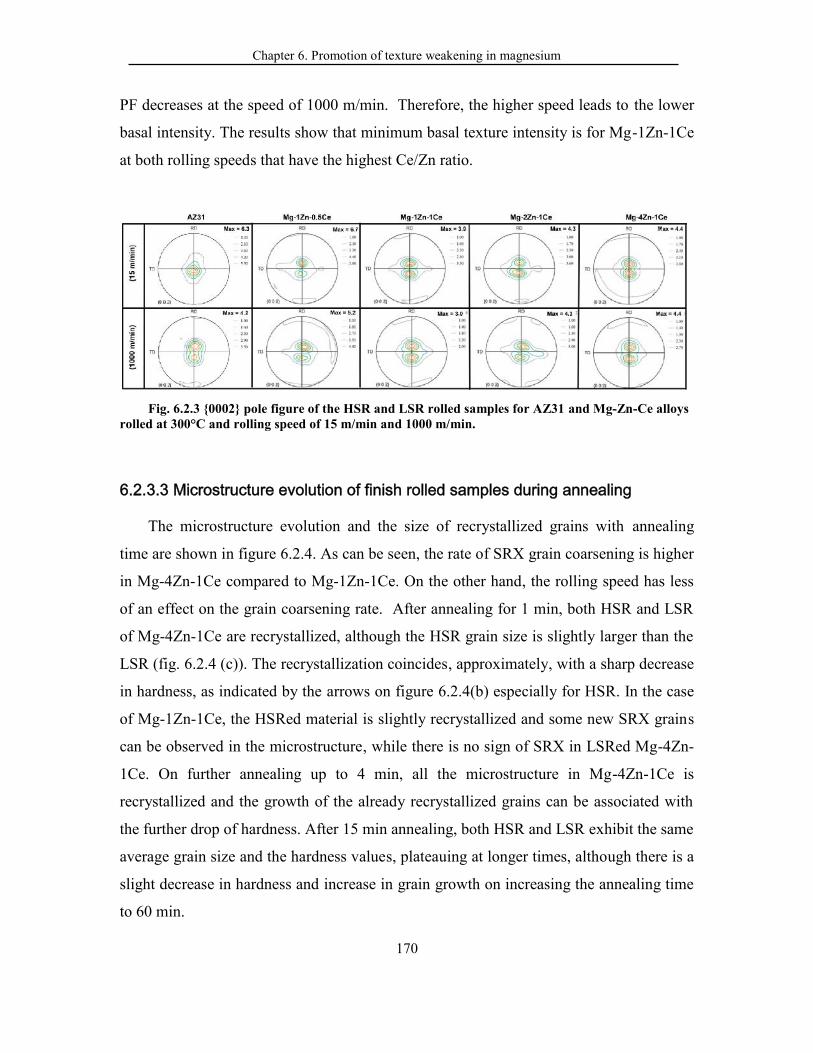
Chapter 6. Promotion of texture weakening in magnesium
170
PF decreases at the speed of 1000 m/min. Therefore, the higher speed leads to the lower
basal intensity. The results show that minimum basal texture intensity is for Mg-1Zn-1Ce
at both rolling speeds that have the highest Ce/Zn ratio.
Fig. 6.2.3 {0002} pole figure of the HSR and LSR rolled samples for AZ31 and Mg-Zn-Ce alloysrolled at 300°C and rolling speed of 15 m/min and 1000 m/min.
6.2.3.3 Microstructure evolution of finish rolled samples during annealing
The microstructure evolution and the size of recrystallized grains with annealing
time are shown in figure 6.2.4. As can be seen, the rate of SRX grain coarsening is higher
in Mg-4Zn-1Ce compared to Mg-1Zn-1Ce. On the other hand, the rolling speed has less
of an effect on the grain coarsening rate. After annealing for 1 min, both HSR and LSR
of Mg-4Zn-1Ce are recrystallized, although the HSR grain size is slightly larger than the
LSR (fig. 6.2.4 (c)). The recrystallization coincides, approximately, with a sharp decrease
in hardness, as indicated by the arrows on figure 6.2.4(b) especially for HSR. In the case
of Mg-1Zn-1Ce, the HSRed material is slightly recrystallized and some new SRX grains
can be observed in the microstructure, while there is no sign of SRX in LSRed Mg-4Zn-
1Ce. On further annealing up to 4 min, all the microstructure in Mg-4Zn-1Ce is
recrystallized and the growth of the already recrystallized grains can be associated with
the further drop of hardness. After 15 min annealing, both HSR and LSR exhibit the same
average grain size and the hardness values, plateauing at longer times, although there is a
slight decrease in hardness and increase in grain growth on increasing the annealing time
to 60 min.
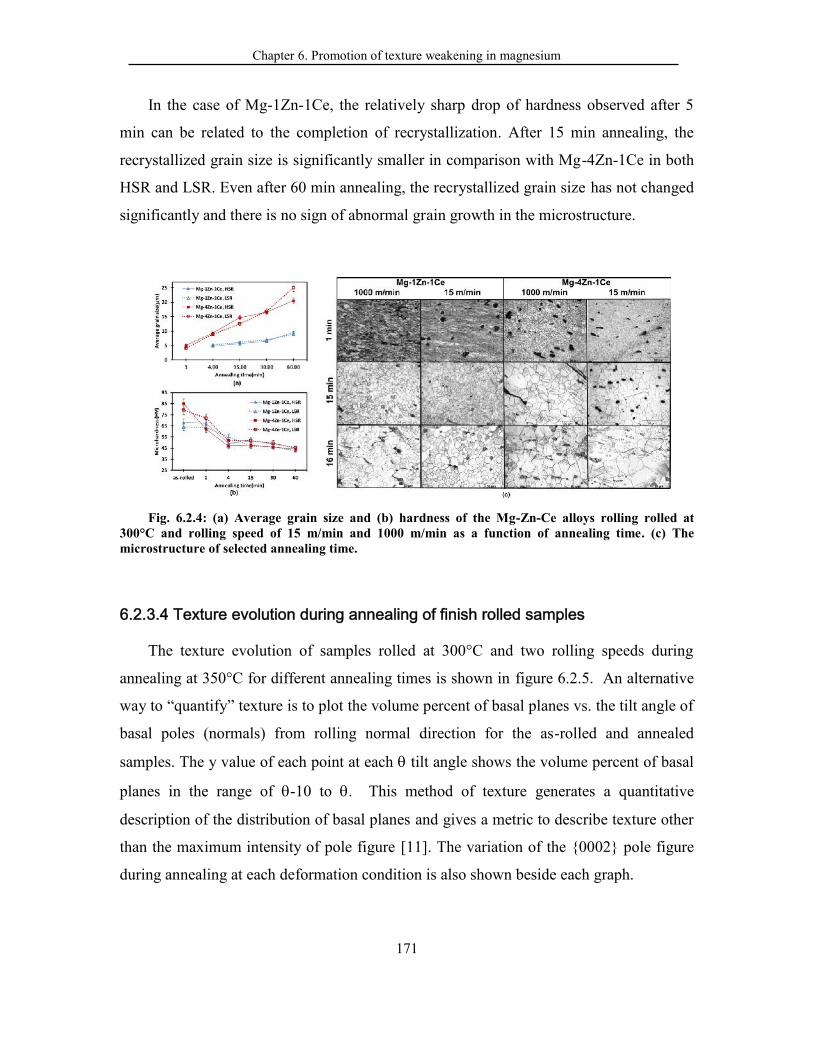
Chapter 6. Promotion of texture weakening in magnesium
171
In the case of Mg-1Zn-1Ce, the relatively sharp drop of hardness observed after 5
min can be related to the completion of recrystallization. After 15 min annealing, the
recrystallized grain size is significantly smaller in comparison with Mg-4Zn-1Ce in both
HSR and LSR. Even after 60 min annealing, the recrystallized grain size has not changed
significantly and there is no sign of abnormal grain growth in the microstructure.
Fig. 6.2.4: (a) Average grain size and (b) hardness of the Mg-Zn-Ce alloys rolling rolled at300°C and rolling speed of 15 m/min and 1000 m/min as a function of annealing time. (c) Themicrostructure of selected annealing time.
6.2.3.4 Texture evolution during annealing of finish rolled samples
The texture evolution of samples rolled at 300°C and two rolling speeds during
annealing at 350°C for different annealing times is shown in figure 6.2.5. An alternative
way to “quantify” texture is to plot the volume percent of basal planes vs. the tilt angle of
basal poles (normals) from rolling normal direction for the as-rolled and annealed
samples. The y value of each point at each tilt angle shows the volume percent of basal
planes in the range of -10 to . This method of texture generates a quantitative
description of the distribution of basal planes and gives a metric to describe texture other
than the maximum intensity of pole figure [11]. The variation of the {0002} pole figure
during annealing at each deformation condition is also shown beside each graph.
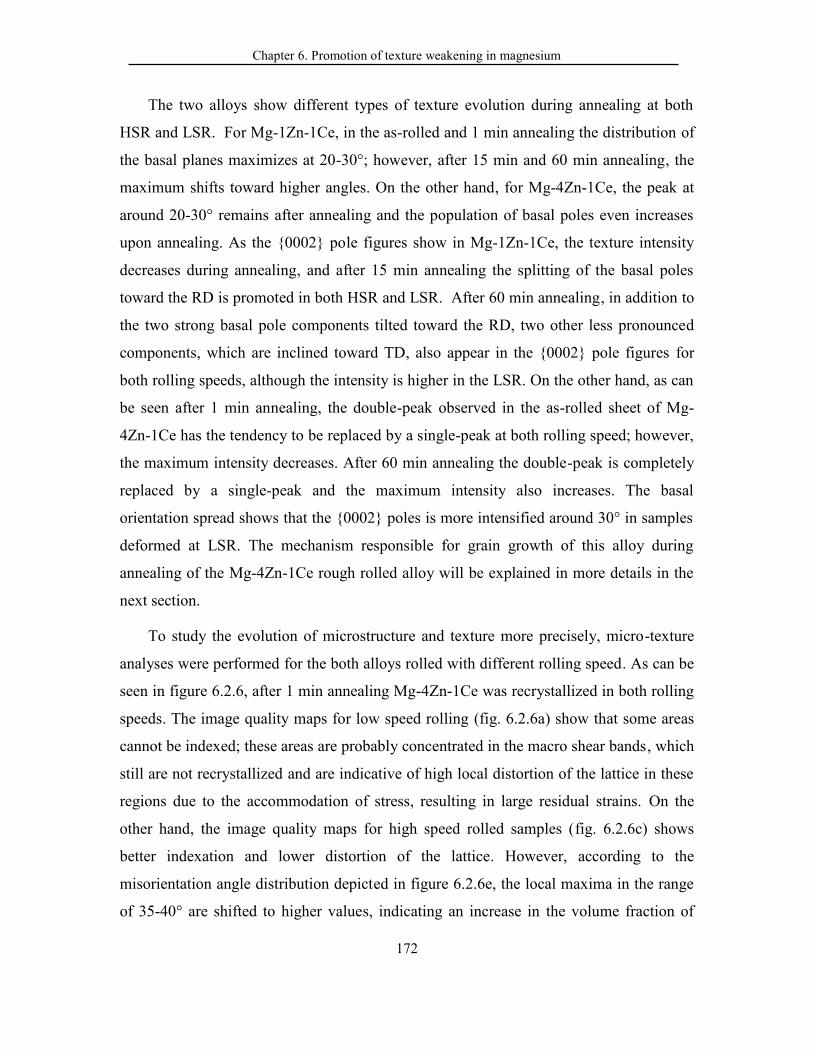
Chapter 6. Promotion of texture weakening in magnesium
172
The two alloys show different types of texture evolution during annealing at both
HSR and LSR. For Mg-1Zn-1Ce, in the as-rolled and 1 min annealing the distribution of
the basal planes maximizes at 20-30°; however, after 15 min and 60 min annealing, the
maximum shifts toward higher angles. On the other hand, for Mg-4Zn-1Ce, the peak at
around 20-30° remains after annealing and the population of basal poles even increases
upon annealing. As the {0002} pole figures show in Mg-1Zn-1Ce, the texture intensity
decreases during annealing, and after 15 min annealing the splitting of the basal poles
toward the RD is promoted in both HSR and LSR. After 60 min annealing, in addition to
the two strong basal pole components tilted toward the RD, two other less pronounced
components, which are inclined toward TD, also appear in the {0002} pole figures for
both rolling speeds, although the intensity is higher in the LSR. On the other hand, as can
be seen after 1 min annealing, the double-peak observed in the as-rolled sheet of Mg-
4Zn-1Ce has the tendency to be replaced by a single-peak at both rolling speed; however,
the maximum intensity decreases. After 60 min annealing the double-peak is completely
replaced by a single-peak and the maximum intensity also increases. The basal
orientation spread shows that the {0002} poles is more intensified around 30° in samples
deformed at LSR. The mechanism responsible for grain growth of this alloy during
annealing of the Mg-4Zn-1Ce rough rolled alloy will be explained in more details in the
next section.
To study the evolution of microstructure and texture more precisely, micro-texture
analyses were performed for the both alloys rolled with different rolling speed. As can be
seen in figure 6.2.6, after 1 min annealing Mg-4Zn-1Ce was recrystallized in both rolling
speeds. The image quality maps for low speed rolling (fig. 6.2.6a) show that some areas
cannot be indexed; these areas are probably concentrated in the macro shear bands, which
still are not recrystallized and are indicative of high local distortion of the lattice in these
regions due to the accommodation of stress, resulting in large residual strains. On the
other hand, the image quality maps for high speed rolled samples (fig. 6.2.6c) shows
better indexation and lower distortion of the lattice. However, according to the
misorientation angle distribution depicted in figure 6.2.6e, the local maxima in the range
of 35-40° are shifted to higher values, indicating an increase in the volume fraction of
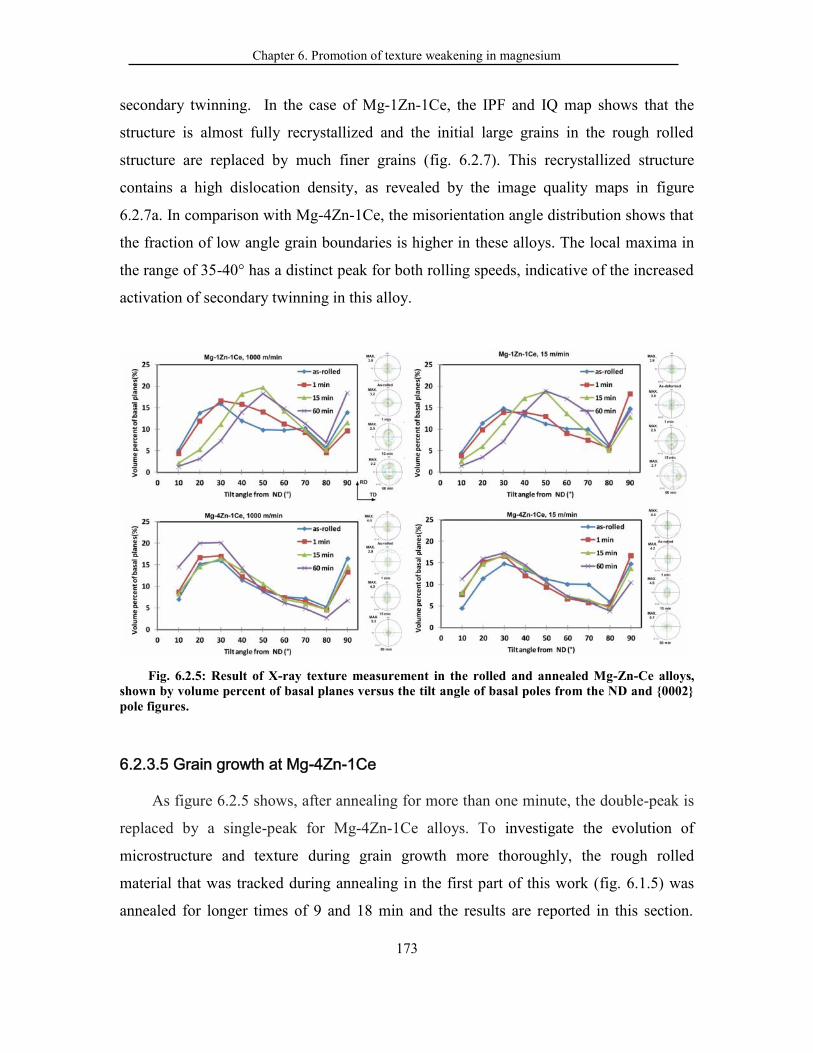
Chapter 6. Promotion of texture weakening in magnesium
173
secondary twinning. In the case of Mg-1Zn-1Ce, the IPF and IQ map shows that the
structure is almost fully recrystallized and the initial large grains in the rough rolled
structure are replaced by much finer grains (fig. 6.2.7). This recrystallized structure
contains a high dislocation density, as revealed by the image quality maps in figure
6.2.7a. In comparison with Mg-4Zn-1Ce, the misorientation angle distribution shows that
the fraction of low angle grain boundaries is higher in these alloys. The local maxima in
the range of 35-40° has a distinct peak for both rolling speeds, indicative of the increased
activation of secondary twinning in this alloy.
Fig. 6.2.5: Result of X-ray texture measurement in the rolled and annealed Mg-Zn-Ce alloys,shown by volume percent of basal planes versus the tilt angle of basal poles from the ND and {0002}pole figures.
6.2.3.5 Grain growth at Mg-4Zn-1Ce
As figure 6.2.5 shows, after annealing for more than one minute, the double-peak is
replaced by a single-peak for Mg-4Zn-1Ce alloys. To investigate the evolution of
microstructure and texture during grain growth more thoroughly, the rough rolled
material that was tracked during annealing in the first part of this work (fig. 6.1.5) was
annealed for longer times of 9 and 18 min and the results are reported in this section.
Chapter 6. Promotion of texture weakening in magnesium
174
When increasing the annealing time to 9 min, recrystallization progresses by the growth
of a number of twin SRX grains to consume the parent grains, as well as formation and
growth of new grains mainly in the parent grains, as shown in figure 6.2.8 (a). As can be
seen in the grain size distribution graph, there are some very large grains ( 45 m),
which, as illustrated in the IPF map by stars, seem to be not completely restored as
LAGB can still be detected inside them. Most of these grains are off-basal grains, as
shown in the pole figure, although some grains, such as grain ‘A,’ can be categorized as
large basal parents grains. In this case, some grains are recrystallized inside the S-twin;
however, the nuclei are limited to the interior of the twins and does not grow through the
parent grains. Another peak in the grain distribution graph that is notable is around 25-27
micron. The orientation of these grains is illustrated by a cross in the pole figures. As can
be seen, most of these grains have orientations close to basal. It seems that most of these
new grains mainly form inside the initial parent grains, which are not consumed by the
other nucleated grains. The formation of these grains is reported in the previous work of
some of the authors [12, 13]. A peak that is not clearly distinguishable occurs at around
20 µm. The grains belonging to these peaks have wider distributions. As illustrated by
circles in the IPF map, as least some of these grains belong to the grains nucleated inside
the S-twins or in the intersection of S-twin/grain boundary, and they still preserve their
initial shape of the twins.
Upon subsequent annealing for 18 min, the recrystallization is complete as the KAM
maps shows in figure 6.2.8 (b). The average grain size increased from 10 to 20 m. Some
peaks other than the main peak can still be observed in the grain size distribution graph.
A peak around 47 m with the two main orientation categories is illustrated by stars in
the pole figure and IPF maps. Some of the grains have basal orientations slightly tilted
toward the RD. The second group is TD grains reoriented toward the ND. The
orientations of these grains are almost similar to the orientation of very large grains in the
microstructure of the 9 min annealed samples (fig. 6.2.8 (a)). Another peak can be
detected around 37 m, in which the c-axis of grains aligns close to the normal direction
(shown with a cross in IPF map and pole figure in figure 6.2.8 (b)). These grains most
probably correlate to the basal parent grains, which create a peak around 25 m in the
Chapter 6. Promotion of texture weakening in magnesium
175
sample annealed for 5 min. The next peak can also be correlated to the S-twin grains
discussed earlier, although the peaks shifted from 20 to 30 m. The orientation of these
grains has a wider distribution in comparison to the former peaks, and large numbers of
grains with off-basal orientation can be found in this group. Another peak that is less
pronounced is also observed in the histogram. The orientation of this group of grains also
has wider distribution than the larger grains mentioned earlier.
Fig. 6.2.6: (a) Image quality map of the LSR sheets at 300°C in the as-deformed condition ofMg-4Zn-1C, (b) IPF for the same region. (c) Image quality map of the LSR sheets at 300°C afterannealing for 90 s (d IPF for the same region, (e) misorientation angle distribution.

Chapter 6. Promotion of texture weakening in magnesium
176
Fig. 6.2.7: (a) Image quality map of the LSR sheets at 300°C in the as-deformed condition ofMg-1Zn-1C, (b) IPF for the same region. (c) Image quality map of the LSR sheets at 300°C afterannealing for 90 s (d) IPF for the same region, (e) misorientation angle distribution.
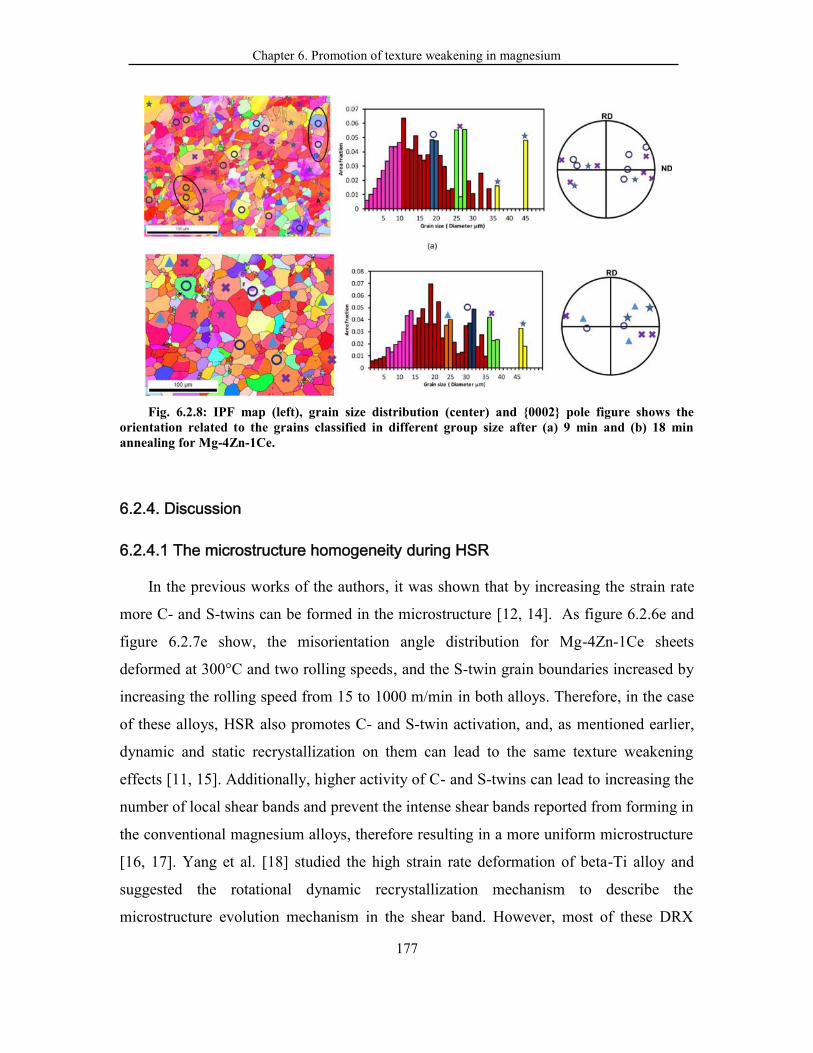
Chapter 6. Promotion of texture weakening in magnesium
177
Fig. 6.2.8: IPF map (left), grain size distribution (center) and {0002} pole figure shows theorientation related to the grains classified in different group size after (a) 9 min and (b) 18 minannealing for Mg-4Zn-1Ce.
6.2.4. Discussion
6.2.4.1 The microstructure homogeneity during HSR
In the previous works of the authors, it was shown that by increasing the strain rate
more C- and S-twins can be formed in the microstructure [12, 14]. As figure 6.2.6e and
figure 6.2.7e show, the misorientation angle distribution for Mg-4Zn-1Ce sheets
deformed at 300°C and two rolling speeds, and the S-twin grain boundaries increased by
increasing the rolling speed from 15 to 1000 m/min in both alloys. Therefore, in the case
of these alloys, HSR also promotes C- and S-twin activation, and, as mentioned earlier,
dynamic and static recrystallization on them can lead to the same texture weakening
effects [11, 15]. Additionally, higher activity of C- and S-twins can lead to increasing the
number of local shear bands and prevent the intense shear bands reported from forming in
the conventional magnesium alloys, therefore resulting in a more uniform microstructure
[16, 17]. Yang et al. [18] studied the high strain rate deformation of beta-Ti alloy and
suggested the rotational dynamic recrystallization mechanism to describe the
microstructure evolution mechanism in the shear band. However, most of these DRX
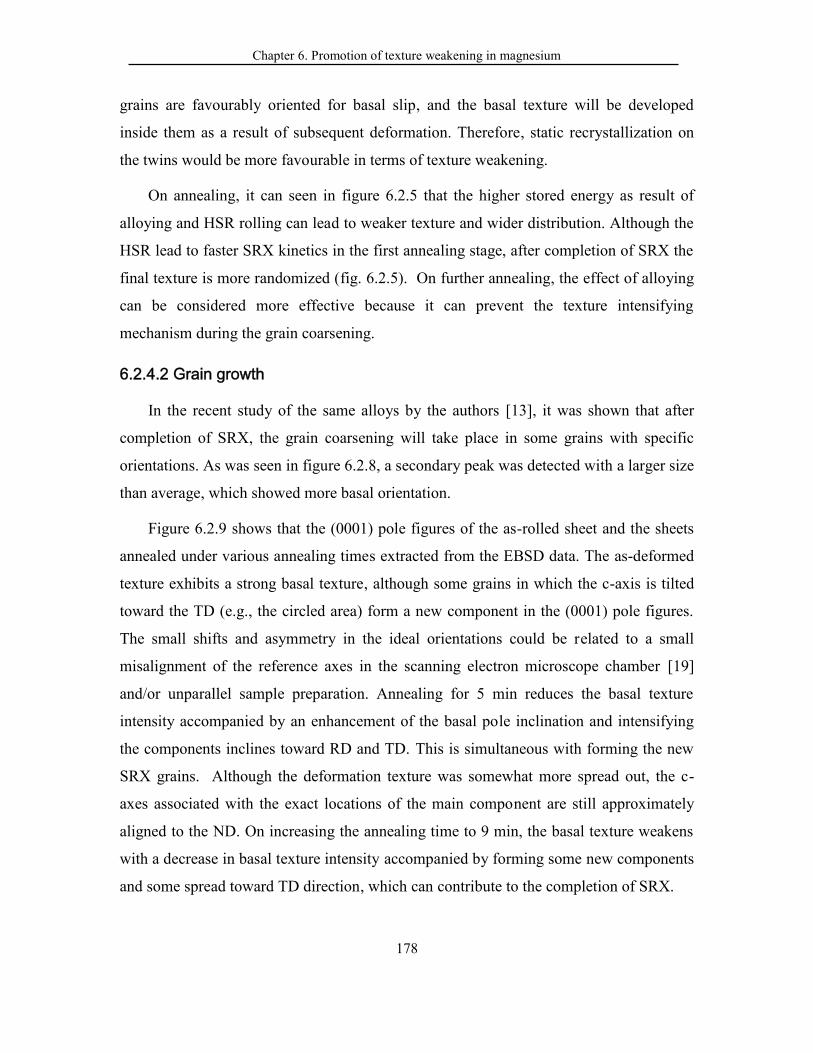
Chapter 6. Promotion of texture weakening in magnesium
178
grains are favourably oriented for basal slip, and the basal texture will be developed
inside them as a result of subsequent deformation. Therefore, static recrystallization on
the twins would be more favourable in terms of texture weakening.
On annealing, it can seen in figure 6.2.5 that the higher stored energy as result of
alloying and HSR rolling can lead to weaker texture and wider distribution. Although the
HSR lead to faster SRX kinetics in the first annealing stage, after completion of SRX the
final texture is more randomized (fig. 6.2.5). On further annealing, the effect of alloying
can be considered more effective because it can prevent the texture intensifying
mechanism during the grain coarsening.
6.2.4.2 Grain growth
In the recent study of the same alloys by the authors [13], it was shown that after
completion of SRX, the grain coarsening will take place in some grains with specific
orientations. As was seen in figure 6.2.8, a secondary peak was detected with a larger size
than average, which showed more basal orientation.
Figure 6.2.9 shows that the (0001) pole figures of the as-rolled sheet and the sheets
annealed under various annealing times extracted from the EBSD data. The as-deformed
texture exhibits a strong basal texture, although some grains in which the c-axis is tilted
toward the TD (e.g., the circled area) form a new component in the (0001) pole figures.
The small shifts and asymmetry in the ideal orientations could be related to a small
misalignment of the reference axes in the scanning electron microscope chamber [19]
and/or unparallel sample preparation. Annealing for 5 min reduces the basal texture
intensity accompanied by an enhancement of the basal pole inclination and intensifying
the components inclines toward RD and TD. This is simultaneous with forming the new
SRX grains. Although the deformation texture was somewhat more spread out, the c-
axes associated with the exact locations of the main component are still approximately
aligned to the ND. On increasing the annealing time to 9 min, the basal texture weakens
with a decrease in basal texture intensity accompanied by forming some new components
and some spread toward TD direction, which can contribute to the completion of SRX.
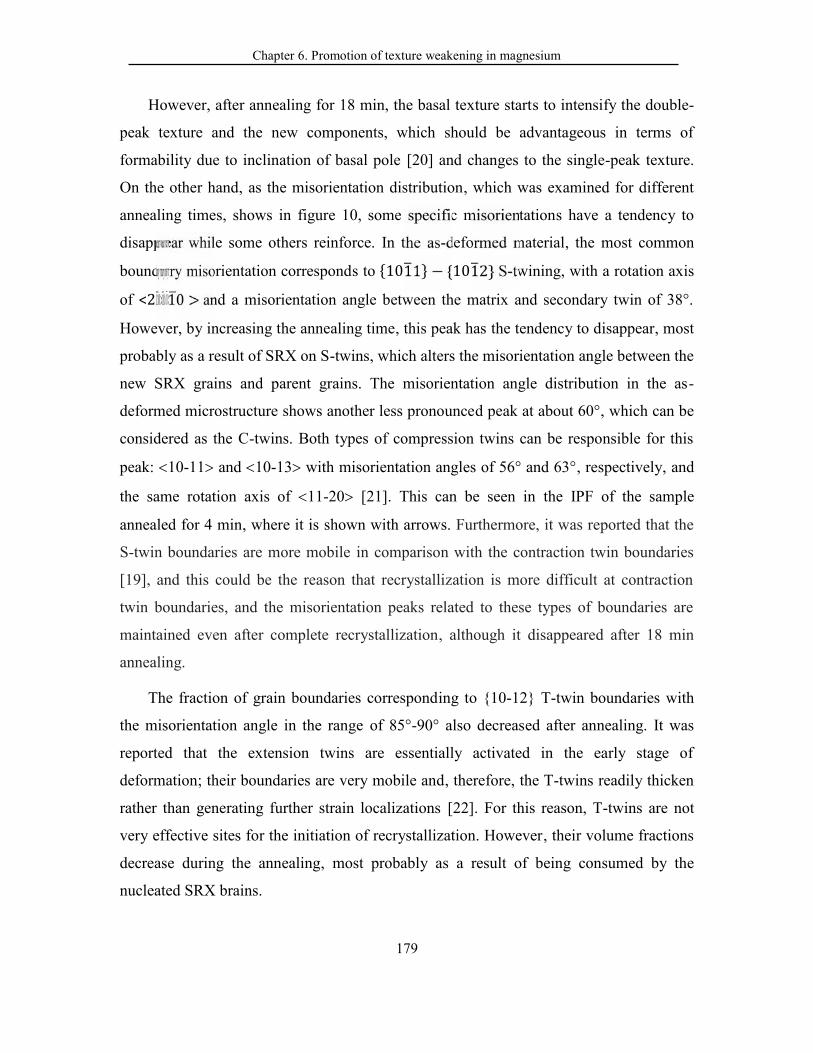
Chapter 6. Promotion of texture weakening in magnesium
179
However, after annealing for 18 min, the basal texture starts to intensify the double-
peak texture and the new components, which should be advantageous in terms of
formability due to inclination of basal pole [20] and changes to the single-peak texture.
On the other hand, as the misorientation distribution, which was examined for different
annealing times, shows in figure 10, some specific misorientations have a tendency to
disappear while some others reinforce. In the as-deformed material, the most common
boundary misorientation corresponds to {1011} − {1012} S-twining, with a rotation axis
of <2110 > and a misorientation angle between the matrix and secondary twin of 38°.
However, by increasing the annealing time, this peak has the tendency to disappear, most
probably as a result of SRX on S-twins, which alters the misorientation angle between the
new SRX grains and parent grains. The misorientation angle distribution in the as-
deformed microstructure shows another less pronounced peak at about 60°, which can be
considered as the C-twins. Both types of compression twins can be responsible for this
peak: 10-11 and 10-13 with misorientation angles of 56° and 63°, respectively, and
the same rotation axis of 11-20 [21]. This can be seen in the IPF of the sample
annealed for 4 min, where it is shown with arrows. Furthermore, it was reported that the
S-twin boundaries are more mobile in comparison with the contraction twin boundaries
[19], and this could be the reason that recrystallization is more difficult at contraction
twin boundaries, and the misorientation peaks related to these types of boundaries are
maintained even after complete recrystallization, although it disappeared after 18 min
annealing.
The fraction of grain boundaries corresponding to {10-12} T-twin boundaries with
the misorientation angle in the range of 85°-90° also decreased after annealing. It was
reported that the extension twins are essentially activated in the early stage of
deformation; their boundaries are very mobile and, therefore, the T-twins readily thicken
rather than generating further strain localizations [22]. For this reason, T-twins are not
very effective sites for the initiation of recrystallization. However, their volume fractions
decrease during the annealing, most probably as a result of being consumed by the
nucleated SRX brains.
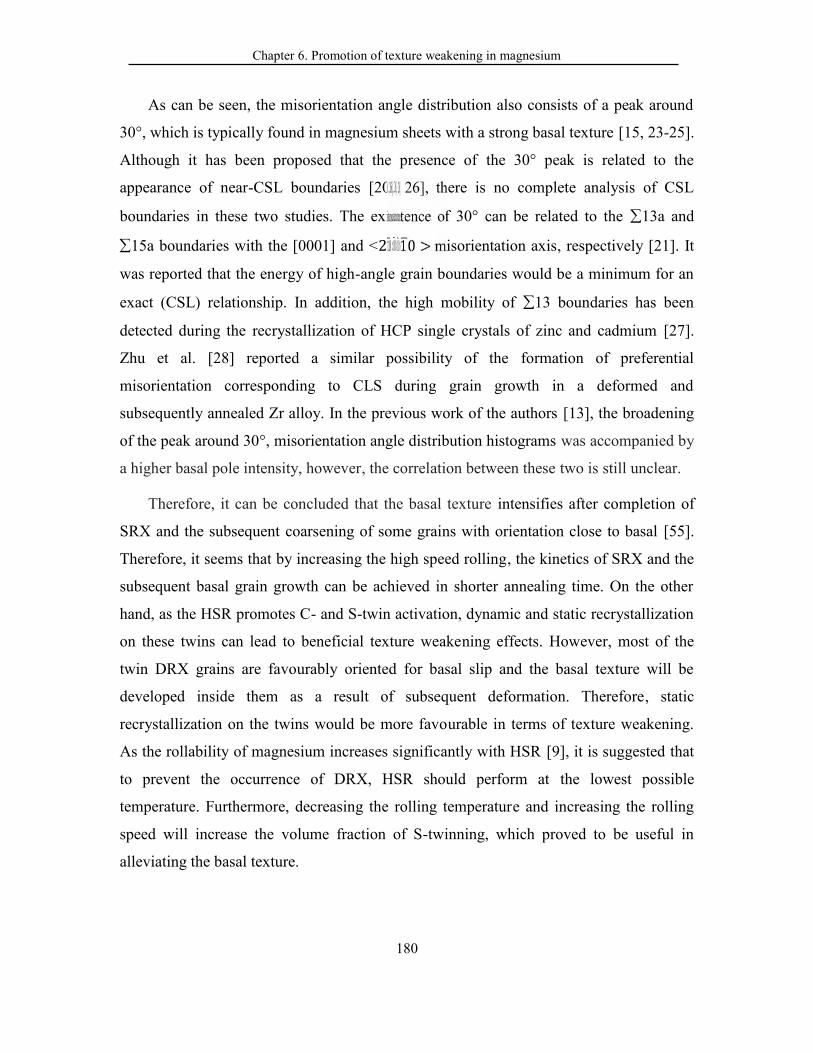
Chapter 6. Promotion of texture weakening in magnesium
180
As can be seen, the misorientation angle distribution also consists of a peak around
30°, which is typically found in magnesium sheets with a strong basal texture [15, 23-25].
Although it has been proposed that the presence of the 30° peak is related to the
appearance of near-CSL boundaries [20, 26], there is no complete analysis of CSL
boundaries in these two studies. The existence of 30° can be related to the 13a and
15a boundaries with the [0001] and <2110 > misorientation axis, respectively [21]. It
was reported that the energy of high-angle grain boundaries would be a minimum for an
exact (CSL) relationship. In addition, the high mobility of 13 boundaries has been
detected during the recrystallization of HCP single crystals of zinc and cadmium [27].
Zhu et al. [28] reported a similar possibility of the formation of preferential
misorientation corresponding to CLS during grain growth in a deformed and
subsequently annealed Zr alloy. In the previous work of the authors [13], the broadening
of the peak around 30°, misorientation angle distribution histograms was accompanied by
a higher basal pole intensity, however, the correlation between these two is still unclear.
Therefore, it can be concluded that the basal texture intensifies after completion of
SRX and the subsequent coarsening of some grains with orientation close to basal [55].
Therefore, it seems that by increasing the high speed rolling, the kinetics of SRX and the
subsequent basal grain growth can be achieved in shorter annealing time. On the other
hand, as the HSR promotes C- and S-twin activation, dynamic and static recrystallization
on these twins can lead to beneficial texture weakening effects. However, most of the
twin DRX grains are favourably oriented for basal slip and the basal texture will be
developed inside them as a result of subsequent deformation. Therefore, static
recrystallization on the twins would be more favourable in terms of texture weakening.
As the rollability of magnesium increases significantly with HSR [9], it is suggested that
to prevent the occurrence of DRX, HSR should perform at the lowest possible
temperature. Furthermore, decreasing the rolling temperature and increasing the rolling
speed will increase the volume fraction of S-twinning, which proved to be useful in
alleviating the basal texture.
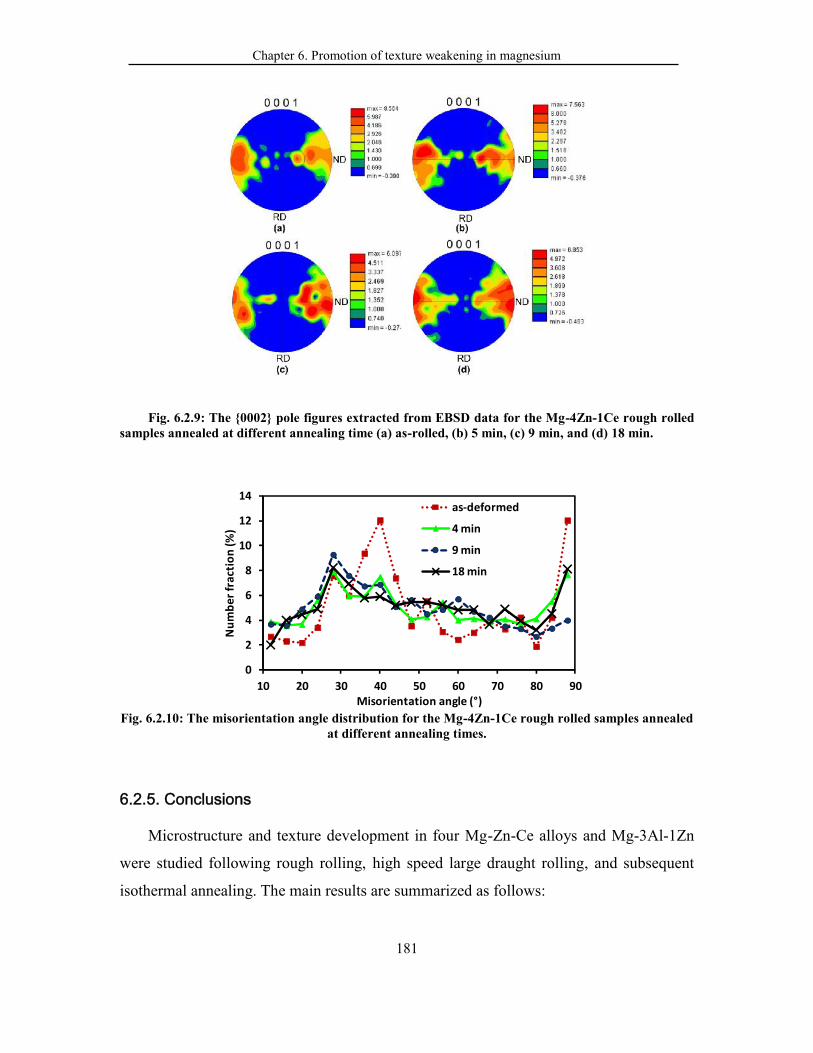
Chapter 6. Promotion of texture weakening in magnesium
181
Fig. 6.2.9: The {0002} pole figures extracted from EBSD data for the Mg-4Zn-1Ce rough rolledsamples annealed at different annealing time (a) as-rolled, (b) 5 min, (c) 9 min, and (d) 18 min.
Fig. 6.2.10: The misorientation angle distribution for the Mg-4Zn-1Ce rough rolled samples annealedat different annealing times.
6.2.5. Conclusions
Microstructure and texture development in four Mg-Zn-Ce alloys and Mg-3Al-1Zn
were studied following rough rolling, high speed large draught rolling, and subsequent
isothermal annealing. The main results are summarized as follows:
0
2
4
6
8
10
12
14
10 20 30 40 50 60 70 80 90
Num
ber f
ract
ion
(%)
Misorientation angle (°)
as-deformed
4 min
9 min
18 min
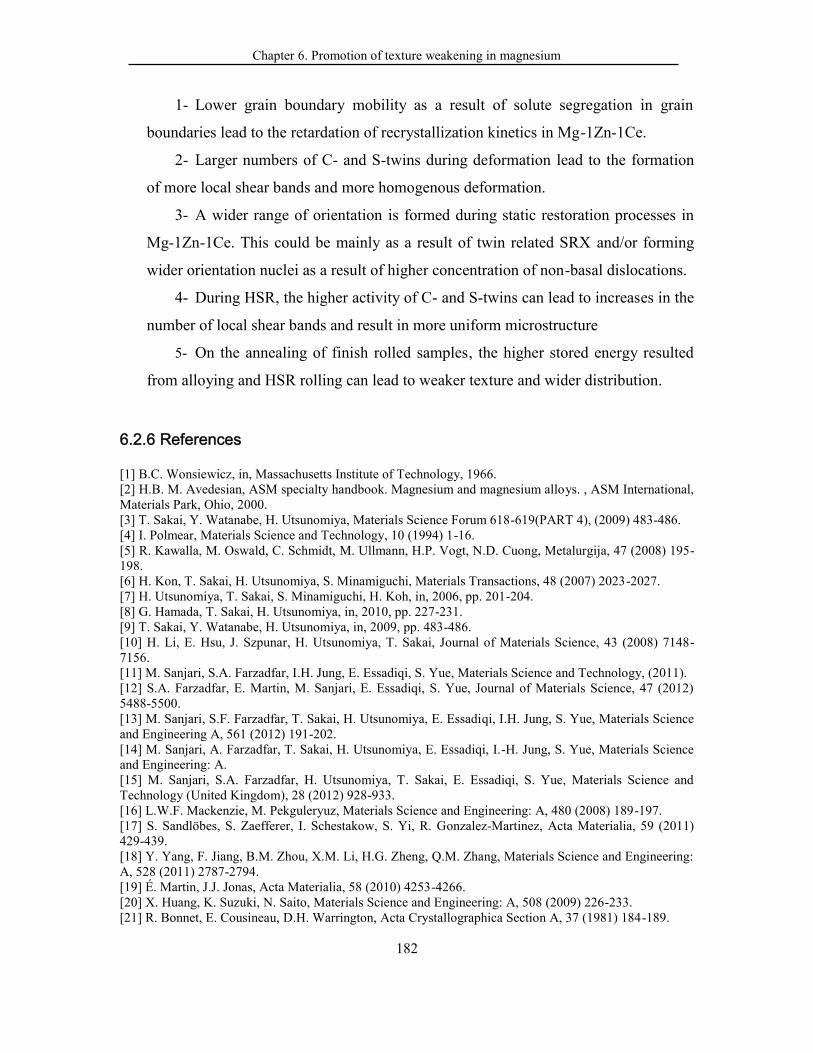
Chapter 6. Promotion of texture weakening in magnesium
182
1- Lower grain boundary mobility as a result of solute segregation in grain
boundaries lead to the retardation of recrystallization kinetics in Mg-1Zn-1Ce.
2- Larger numbers of C- and S-twins during deformation lead to the formation
of more local shear bands and more homogenous deformation.
3- A wider range of orientation is formed during static restoration processes in
Mg-1Zn-1Ce. This could be mainly as a result of twin related SRX and/or forming
wider orientation nuclei as a result of higher concentration of non-basal dislocations.
4- During HSR, the higher activity of C- and S-twins can lead to increases in the
number of local shear bands and result in more uniform microstructure
5- On the annealing of finish rolled samples, the higher stored energy resulted
from alloying and HSR rolling can lead to weaker texture and wider distribution.
6.2.6 References
[1] B.C. Wonsiewicz, in, Massachusetts Institute of Technology, 1966.[2] H.B. M. Avedesian, ASM specialty handbook. Magnesium and magnesium alloys. , ASM International,Materials Park, Ohio, 2000.[3] T. Sakai, Y. Watanabe, H. Utsunomiya, Materials Science Forum 618-619(PART 4), (2009) 483-486.[4] I. Polmear, Materials Science and Technology, 10 (1994) 1-16.[5] R. Kawalla, M. Oswald, C. Schmidt, M. Ullmann, H.P. Vogt, N.D. Cuong, Metalurgija, 47 (2008) 195-198.[6] H. Kon, T. Sakai, H. Utsunomiya, S. Minamiguchi, Materials Transactions, 48 (2007) 2023-2027.[7] H. Utsunomiya, T. Sakai, S. Minamiguchi, H. Koh, in, 2006, pp. 201-204.[8] G. Hamada, T. Sakai, H. Utsunomiya, in, 2010, pp. 227-231.[9] T. Sakai, Y. Watanabe, H. Utsunomiya, in, 2009, pp. 483-486.[10] H. Li, E. Hsu, J. Szpunar, H. Utsunomiya, T. Sakai, Journal of Materials Science, 43 (2008) 7148-7156.[11] M. Sanjari, S.A. Farzadfar, I.H. Jung, E. Essadiqi, S. Yue, Materials Science and Technology, (2011).[12] S.A. Farzadfar, E. Martin, M. Sanjari, E. Essadiqi, S. Yue, Journal of Materials Science, 47 (2012)5488-5500.[13] M. Sanjari, S.F. Farzadfar, T. Sakai, H. Utsunomiya, E. Essadiqi, I.H. Jung, S. Yue, Materials Scienceand Engineering A, 561 (2012) 191-202.[14] M. Sanjari, A. Farzadfar, T. Sakai, H. Utsunomiya, E. Essadiqi, I.-H. Jung, S. Yue, Materials Scienceand Engineering: A.[15] M. Sanjari, S.A. Farzadfar, H. Utsunomiya, T. Sakai, E. Essadiqi, S. Yue, Materials Science andTechnology (United Kingdom), 28 (2012) 928-933.[16] L.W.F. Mackenzie, M. Pekguleryuz, Materials Science and Engineering: A, 480 (2008) 189-197.[17] S. Sandlöbes, S. Zaefferer, I. Schestakow, S. Yi, R. Gonzalez-Martinez, Acta Materialia, 59 (2011)429-439.[18] Y. Yang, F. Jiang, B.M. Zhou, X.M. Li, H.G. Zheng, Q.M. Zhang, Materials Science and Engineering:A, 528 (2011) 2787-2794.[19] É. Martin, J.J. Jonas, Acta Materialia, 58 (2010) 4253-4266.[20] X. Huang, K. Suzuki, N. Saito, Materials Science and Engineering: A, 508 (2009) 226-233.[21] R. Bonnet, E. Cousineau, D.H. Warrington, Acta Crystallographica Section A, 37 (1981) 184-189.
Chapter 6. Promotion of texture weakening in magnesium
183
[22] L. Jiang, J.J. Jonas, R.K. Mishra, A.A. Luo, A.K. Sachdev, S. Godet, Acta Materialia, 55 (2007) 3899-3910.[23] M.R. Barnett, M.D. Nave, C.J. Bettles, Materials Science and Engineering A, 386 (2004) 205-211.[24] S. Biswas, S. Singh Dhinwal, S. Suwas, Acta Materialia, 58 (2010) 3247-3261.[25] K. Hantzsche, J. Bohlen, J. Wendt, K.U. Kainer, S.B. Yi, D. Letzig, Scripta Materialia, 63 (2010) 725-730.[26] L. Jin, D. Lin, D. Mao, X. Zeng, W. Ding, Journal of Alloys and Compounds, 426 (2006) 148-154.[27] G. Ibe, K. Lucke, Recrystallization, grain growth, and textures: American Society for Metals, MetalsPark, OH, October 16 and 17, pp. 434–45., American Society for Metals, 1966.[28] K.Y. Zhu, B. Bacroix, T. Chauveau, D. Chaubet, O. Castelnau, Metallurgical and MaterialsTransactions A: Physical Metallurgy and Materials Science, 40 (2009) 2423-2434.
Chapter 7. Conclusion
184
Chapter 7
Conclusions
Microstructure and texture development during a wide range of strain rates during
uniaxial compression tests and high speed large draught rolling of as-cast AZ31B and
four Mg-Zn-Ce alloys was investigated. To achieve this, a split Hopkinson pressure bar
(SHPB) equipped with a radiation furnace was used to attain a strain rate of 1200s-1 in the
temperature range of 25 to 350°C and the result was compared with low strain rate (0.01
s-1) behaviour. As well, high speed rolling at 1000 m/min was employed to successfully
roll AZ31 alloy in one pass with 71% reduction at 200°C. The recrystallization and
texture evolution of AZ31 and four Mg-Zn-Ce sheets with a warm rolled microstructure
obtained through two stages that can be characterised as rough rolling and finish rolling
was investigated at different stages of post-rolling annealing. The results showed that by
increasing the rolling speed, more secondary and compression twins were activated,
which leads to the formation of more numerous local shear bands and a more uniform
microstructure. Annealing secondary twins and their vicinity were observed to be the
preferential sites for nucleation, and it seems that recrystallization on secondary twins
contributes to basal texture weakening. Therefore, an increasing number of such twins
increase the texture weakening. On the other hand in the case of Mg-Zn-Ce alloys, the
recrystallization mode is changed by easing the resistance to deformation mechanism
other than basal slip, leading to weaker basal texture in the as-rolled condition. In this
way, the combination of these RE additions and HSR resulted in a weaker deformed and
annealed texture. The main results are summarized as follows:
1. At higher strain rates (≥10 s-1), twins form, and since DRX occurs at twins
frequently, this explains why DRX is more extensive at higher strain rates. This
also results in a more homogeneous microstructure.
Chapter 7. Conclusion
185
2. At the early stages of deformation, T-twins are formed and, with further
compressive strain, many C-twins are formed and, subsequently, double twinning
rapidly occurred in these twins. On increasing the strain rate, the formation of
twins and subsequent twin-induced DRX intensified the basal texture in the
deformed sample.
3. Grain boundary misorientation distribution analysis shows that coincident site
lattice boundaries related to contraction twins and secondary twins are more
numerous in the samples deformed at high strain rates.
4. By progressing the strain for both rolling and compression at 200°C, basal pole
splitting was observed, indicating the activation of more contraction and
secondary twins compared to low strain rate deformation.
5. Metadynamic restoration is very fast at a strain rate of 1200s-1, indicating that
immediate quenching may have been insufficient to freeze the microstructure
after deformation. The same conclusion is valid for HSR, since at only 12 mm
(i.e., about 1 ms) from the roll exit, the deformed microstructure is replaced by
fine equiaxed grains as a result of combined metadynamic and static
recrystallization.
6. By increasing the S-twins, more texture weakening can be achieved. In the case of
high speed rolling, this can be achieved by decreasing the rolling temperature and
increasing the rolling speed.
7. In Mg-Zn-Ce alloys, the preferential segregation of Ce solute atoms to grain
boundaries is the main reason for decreasing the grain boundary mobility by
increasing the Ce/Zn ratio. Lower grain boundary mobility leads to the retardation
of recrystallization kinetics.
8. IGMA analysis shows that in Mg-1Zn-1Ce, more deformation mechanisms,
especially more prismatic <a> slip, can be activated during the deformation. The
recrystallization mode changed by easing the resistance to deformation
mechanisms other than basal slip, leading to a weaker basal texture in the as-
rolled condition.

Chapter 7. Conclusion
186
9. A wider range of orientations is formed during static restoration processes in Mg-
1Zn-1Ce. This is mainly due to twin related SRX or the formation of nuclei with
more widely distributed orientations resulting from a higher concentration of non-
basal dislocations.

Chapter 8. Contributions to Original Knowledge
187
Chapter 8
Contributions to Original Knowledge
1- An understanding of the high strain rate (1000 s-1) behaviour of AZ31 flow
behaviour, microstructure, and texture evolution was gained by compression with
Hopkinson bar testing.
2- The twin-induced DRX fraction was also investigated at a constant temperature
and different strain rates and the contribution of continuous dynamic
recrystallization (CDRX) was evaluated.
3- The flow behaviour of AZ31 over a wide range of strain rates (0.01 to 1000 s-1)
was fitted to two types of constitutive equations: (i) power law and (ii) hyperbolic
sine. Average activation energies were also calculated for the peak and steady-
state strains, respectively.
4- The above-mentioned Hopkinson bar testing was used to analyze the
microstructure and texture evolution during the high speed rolling (HSR) of as-
cast AZ31B alloy. A grain boundary misorientation analysis was performed to
study the type of coincident site lattice (CSL) boundaries formed during HSR
rolling and uniaxial compression testing.
5- The samples compressed at very high strain rate uniaxial compression testing
were annealed. The contributions of different types of twins on the texture
evolution was analysed by means of EBSD.
6- The effects of precipitates and solutes were investigated in the Mg-Zn-Ce alloys
systems by changing the Ce and Zn contents in the alloy. It was identified that, by
Chapter 8. Contributions to Original Knowledge
188
increasing Zn, Ce in solid solution decreases and the alloy with the highest Ce/Zn
ratio exhibited the weakest basal texture.
7- On annealing, the same regions of the microstructure, located by hardness
indentations, were examined and tracked by EBSD. Furthermore, intragranular
misorientation axis (IGMA) analysis was used to investigate the associated
deformation mechanisms in the as-deformed material. For the first time, by
combining these two methods, the development of the recrystallization
microstructure was investigated and important aspects, such as preferential
nucleation sites, correlation between activated deformation mechanisms, and
initial orientation of the recrystallized grains, were studied.
8- It was identified that the observed texture weakening is possibly due to decreasing
grain boundary mobility as a result of the solute partitioning of RE elements to
dislocations and grain boundaries.
9- By using IGMA analysis, it was shown that by increasing the Ce level in solid
solution, types of dislocations other than basal <a> are activated; in particular, the
prismatic <a> type is activated during deformation. It was concluded that the
weakening of the recrystallization texture during rolling resulting from the
addition of RE elements is linked with a change in the dynamic recrystallization
(DRX) behaviour.
10- It was suggested that splitting of the basal texture could possibly be attributed to
the increased activity of <c+a> slip and to compression and secondary twinning.
11- To investigate the deformation mechanism during high speed rolling, the mill was
suddenly stopped during rolling and the sheet was withdrawn from the roll gap
and the microstructure and texture evolution were observed. For the first time, the
mechanisms responsible for the much higher rollability and the grain refinement
after HSR were investigated.
12- It was shown that during HSR, the higher activities of C- and S-twins can lead to
increases in the number of local shear bands and result in a more uniform

Chapter 8. Contributions to Original Knowledge
189
microstructure. It was also suggested that the double-peak and weaker basal
texture obtained after HSR can be attributed to the activation of compression and
double twins.
Chapter 9. Future work
190
Chapter 9
Future Work
1- Because of the positive results achieved in terms of rollability, microstructure,
and texture weakening for AZ31, high speed rolling experiments are suggested for
other potential rare earth Mg alloys. It might be possible to maximize the volume
fraction of compression and double twins during deformation, which is found to
be preferable in terms of texture weakening.
2- Twin roll casting is thought to be a cost effective process that integrates the
casting and hot rolling into a single step. Therefore, it is suggested to investigate
the effects of rolling process parameters (i.e., rolling speed and reduction per
pass) on the microstructure and texture of AZ31 twin rolled cast sheet. The
minimum temperature and rolling speed, which are most interesting in terms of
production cost, can be determined.
3- Since the “high speed” rolling (HSR) of AZ31 can be successfully performed at
the temperature at which cracking takes place at typical rolling speeds, it is
suggested to examine the annealing behaviour of “promising” alloys at the lowest
possible temperatures without the occurrence of DRX. In this way, the volume
fraction of compression and double twins increases during deformation, and the
static recrystallization grains at these sites generate a weaker texture.


![Internal strain and texture evolution during deformation twinning …library.nmlindia.org/FullText/MSEA3990511.pdf · situ examinations are even more recent [16]. Magnesium is especially](https://static.fdocuments.net/doc/165x107/5f782f7b94cb87410e1c3c5f/internal-strain-and-texture-evolution-during-deformation-twinning-situ-examinations.jpg)