Strain hardening and heterogeneous deformation during...
10
Strain hardening and heterogeneous deformation during twinning in Hadfield steel C. Efstathiou a, * , H. Sehitoglu b, * a Cornell University, Mechanical and Aerospace Engineering, 188 Rhodes Hall, Ithaca, NY 14853, USA b University of Illinois, Department of Mechanical Science and Engineering, 1206 W. Green St., Urbana, IL 61801, USA Received 21 July 2009; received in revised form 21 October 2009; accepted 28 October 2009 Available online 5 December 2009 Abstract We identify the role of deformation twinning and twin–twin intersections on the strain hardening behavior of Hadfield steel single crystals using strain field measurements. In situ and ex situ strain field measurements resolved at micrometer length scales are obtained using digital image correlation. Ex situ measurements reveal that macroscopic twin-bands, which are composed of a mixture of fine twin- lamella and matrix material, generate approximately 30% axial strain. This measurement is comparable to strain predictions based on twinning crystallography. In situ measurements reveal that primary and secondary twins may nucleate simultaneously, but the primary twin-system remains predominantly active with increased deformation. The intersection of primary and secondary twin-systems was directly linked to an increase in the strain hardening response. Ó 2009 Acta Materialia Inc. Published by Elsevier Ltd. All rights reserved. Keywords: Manganese steel; Secondary twinning; Digital image correlation (DIC); Low stacking fault energy; Fcc alloy 1. Introduction Hadfield steel is an austenitic manganese steel that pos- sesses high wear resistance, high toughness and high strain hardening rate in polycrystalline form. These properties have made it successful in industrial applications that include impact hammers, crusher jaws, grinding mill liners, crawler treads for tractors, and railroad crossings. The high strain hardening rate of Hadfield steel is one of its most important properties, and it has warranted many investiga- tions over the past 40 years [1–14]. The deformation mech- anisms responsible for the high strain hardening rate include interactions between interstitial carbon atoms and dislocations [1,6], interactions between dislocations and twins [2–5,7,8], and interactions between twinning systems [14]. In polycrystals, it is difficult to experimentally isolate the contribution of each deformation mechanism because generally all three are active, and because of grain bound- ary effects [1–3,6]. To circumvent these complexities, exper- iments are typically conducted on single crystals. In addition to utilizing single crystals, in situ optical investiga- tions have proven valuable for identifying the dominant deformation mechanisms [5,8]. From these previous inves- tigations and others, twinning is established as the primary deformation mechanism at the onset, and at early stages of deformation for tensile loading of h111i oriented Hadfield steel single crystals [5,7,8,14]. We focus on these crystals to provide a more detailed description of the deformation evolution (both spatially and temporally). Optical observations indicate that twins form in a local- ized manner in Hadfield steel [5] single crystals. To date, however, no local strain field measurements have been made to directly link particular deformation features in the micro- structure to the strain hardening behavior of Hadfield steel. Since the strain hardening behavior is the rate of change of the stress with respect to strain, it is most appropriately stud- ied in situ. To fulfill these experimental requirements, we 1359-6454/$36.00 Ó 2009 Acta Materialia Inc. Published by Elsevier Ltd. All rights reserved. doi:10.1016/j.actamat.2009.10.054 * Corresponding authors. Tel.: +1 516 884 5778 (C. Efstathiou), tel.: +1 217 333 4112; fax: +1 217 244 6534 (H. Sehitoglu). E-mail addresses: [email protected] (C. Efstathiou), [email protected] (H. Sehitoglu). www.elsevier.com/locate/actamat Available online at www.sciencedirect.com Acta Materialia 58 (2010) 1479–1488
Transcript of Strain hardening and heterogeneous deformation during...

Available online at www.sciencedirect.com
www.elsevier.com/locate/actamat
Acta Materialia 58 (2010) 1479–1488
Strain hardening and heterogeneous deformationduring twinning in Hadfield steel
C. Efstathiou a,*, H. Sehitoglu b,*
a Cornell University, Mechanical and Aerospace Engineering, 188 Rhodes Hall, Ithaca, NY 14853, USAb University of Illinois, Department of Mechanical Science and Engineering, 1206 W. Green St., Urbana, IL 61801, USA
Received 21 July 2009; received in revised form 21 October 2009; accepted 28 October 2009Available online 5 December 2009
Abstract
We identify the role of deformation twinning and twin–twin intersections on the strain hardening behavior of Hadfield steel singlecrystals using strain field measurements. In situ and ex situ strain field measurements resolved at micrometer length scales are obtainedusing digital image correlation. Ex situ measurements reveal that macroscopic twin-bands, which are composed of a mixture of fine twin-lamella and matrix material, generate approximately 30% axial strain. This measurement is comparable to strain predictions based ontwinning crystallography. In situ measurements reveal that primary and secondary twins may nucleate simultaneously, but the primarytwin-system remains predominantly active with increased deformation. The intersection of primary and secondary twin-systems wasdirectly linked to an increase in the strain hardening response.� 2009 Acta Materialia Inc. Published by Elsevier Ltd. All rights reserved.
Keywords: Manganese steel; Secondary twinning; Digital image correlation (DIC); Low stacking fault energy; Fcc alloy
1. Introduction
Hadfield steel is an austenitic manganese steel that pos-sesses high wear resistance, high toughness and high strainhardening rate in polycrystalline form. These propertieshave made it successful in industrial applications thatinclude impact hammers, crusher jaws, grinding mill liners,crawler treads for tractors, and railroad crossings. The highstrain hardening rate of Hadfield steel is one of its mostimportant properties, and it has warranted many investiga-tions over the past 40 years [1–14]. The deformation mech-anisms responsible for the high strain hardening rateinclude interactions between interstitial carbon atoms anddislocations [1,6], interactions between dislocations andtwins [2–5,7,8], and interactions between twinning systems[14]. In polycrystals, it is difficult to experimentally isolate
1359-6454/$36.00 � 2009 Acta Materialia Inc. Published by Elsevier Ltd. All
doi:10.1016/j.actamat.2009.10.054
* Corresponding authors. Tel.: +1 516 884 5778 (C. Efstathiou), tel.: +1217 333 4112; fax: +1 217 244 6534 (H. Sehitoglu).
E-mail addresses: [email protected] (C. Efstathiou),[email protected] (H. Sehitoglu).
the contribution of each deformation mechanism becausegenerally all three are active, and because of grain bound-ary effects [1–3,6]. To circumvent these complexities, exper-iments are typically conducted on single crystals. Inaddition to utilizing single crystals, in situ optical investiga-tions have proven valuable for identifying the dominantdeformation mechanisms [5,8]. From these previous inves-tigations and others, twinning is established as the primarydeformation mechanism at the onset, and at early stages ofdeformation for tensile loading of h111i oriented Hadfieldsteel single crystals [5,7,8,14]. We focus on these crystals toprovide a more detailed description of the deformationevolution (both spatially and temporally).
Optical observations indicate that twins form in a local-ized manner in Hadfield steel [5] single crystals. To date,however, no local strain field measurements have been madeto directly link particular deformation features in the micro-structure to the strain hardening behavior of Hadfield steel.Since the strain hardening behavior is the rate of change ofthe stress with respect to strain, it is most appropriately stud-ied in situ. To fulfill these experimental requirements, we
rights reserved.

1480 C. Efstathiou, H. Sehitoglu / Acta Materialia 58 (2010) 1479–1488
utilize in situ digital image correlation (DIC). The purpose ofthe current study is to illustrate how particular twins andtwin–twin intersections influence the strain hardeningresponse by measuring the axial local strain fields.
Although no previous investigations have incorporatedin situ strain field measurements, researchers have con-ducted in situ optical microscopy, and post-deformationelectron microscopy studies. Early work on Cu single crys-tals showed that activation of primary twinning alonewould reduce the work hardening rate, but when primarytwins interacted with secondary twins, the hardening rateincreased [15]. More recently, Chumlyakov et al. [14] andKaraman et al. [7] have noted that the strain hardening ratecan be nearly 0 GPa when one twin-system is present, andcan reach up to 7 GPa when multiple twin-systems arepresent in h111i oriented Hadfield steel single crystals.
The strain hardening contribution of twins has generallybeen considered from a macroscopic viewpoint as micro-structural refinement similar to the Hall–Petch effect[8,16]. Similar to grain boundaries, twin-boundaries subdi-vide the microstructure and are obstacles to dislocationmotion [16–18]. Dislocations in the matrix can interactwith twins and result in glide that may not be favorably ori-ented with respect to the loading direction. In addition, fewdislocation sources can operate in twins since they are verythin [8,18,19]. In Hadfield steel single crystals, twins appearoptically as macroscopically uniform regions. However,these regions are in fact non-uniform, and contain a mix-ture of alternating regions of twin-lamella and matrixmaterial often separated by 100–200 nm. Since twins formin a spatially heterogeneous manner, we utilize DIC toobtain strain field measurements at length scales between13 and 145 lm. Although we do not resolve the axial strainwithin individual twin-lamella, we measure the axial straingenerated by twin-bands and intersecting twin-bands whichare a mixture of twin-lamella and matrix material. In thisway we elucidate the contribution of deformation twinningto the macroscopic stress–strain behavior, and describe thedegree of strain heterogeneity during deformation.
2. Background
Hadfield steel has a face-centered cubic (fcc) crystalstructure and a low stacking fault energy (SFE)(23 mJ m�2) [3]. The major alloying components inHadfield steel are approximately 10–14 wt.% Mn and1–1.4 wt.% C. In Hadfield steel, manganese lowers theSFE [20]. SFE describes the energy of the interfacebetween a perfect (ABCABC) stacking sequence and afaulted (ABABAB) stacking sequence of a crystal. Stack-ing faults readily form in fcc crystals between Shockleypartial dislocations because the energy associated withtwo partial dislocations is less than a perfect dislocation.The measure of SFE is important because it governs thedistance between partial dislocations. This distance affectsmechanisms such as cross-slip which allow dislocations tobypass obstacles. The formation of stacking faults are pre-
cursors to twin formation as previously noted in Refs.[21,22].
The mobility of dislocations also dictates the deforma-tion mode (i.e. slip or twinning), which inevitably altersthe macroscopic mechanical behavior, and material prop-erties such as yield strength, creep resistance, age hardeningand strain hardening behavior. At the atomic level, slip andtwinning are shear-dominated mechanisms that crystalsexploit to accommodate deformation. Crystal planessheared by slip are localized, whereas crystal planes shearedby twining involve a homogeneous shear between crystalplanes. Slip rotates the crystal lattice gradually, whereastwinning rotates the lattice abruptly. Both mechanismsleave the crystal structure and lattice parameters unaltered,but depending on the crystal structure, twinning mayrequire a “shuffle” to accomplish this [23–25]. Althoughsome aspects of twinning are distinctly different from slipas mentioned above, dislocation structures are often incor-porated in theories of twin nucleation and growth.
Twin growth theories have been developed by Christian[26] and Cottrell and Bilby [27]. Christian proposed thepropagation of twin faults by dislocation reflection at thecrystal surface or grain boundaries. The theory proposedby Cottrell and Bilby is fundamentally different since itrequires a dislocation to dissociate into partial dislocations.Venables modified this theory for fcc metals (called “thepole mechanism”) by assuming that the dislocation dissoci-ates into a glissile Shockley and a sessile Frank partial [28].The sessile partial is the anchored “pole” and the glissiletwin-dislocation revolves about this “pole” dislocation.Each revolution of the twin-dislocation generates twinnedmaterial [29]. A more recent theory proposed by Mahajanand Chin [30] suggests that three-layer twins are the twinnucleus, and these are composed of sessile and glissilegroups of dislocations. The twin nucleation theories brieflymentioned above involve motion of partial dislocationswhich are driven by shear stress.
Partial dislocations as well as perfect dislocations gener-ally obey a resolved shear stress law, and therefore Schmidfactors can be determined for slip and twinning. The Sch-mid factor for twinning is taken as the Schmid factor forthe leading partial dislocation. Since the Schmid factor forthe leading partial dislocation is different under uniaxialtension and compression, twinning in fcc crystals is asym-metric. That is, twinning in fcc materials occurs by shearon the {111} plane in the ½11�2� direction but not in the½�1�1 2� direction [22]. This is distinctly different from themotion of perfect dislocations which can occur on a{111} plane in either the ½�110� or ½1�10� direction. Table 1shows the Schmid factors under tension and compression,and the number of active systems for slip and twinning.Note that three twinning systems have the same Schmid fac-tor for h111i oriented crystals under tension. We also notethat the h11 1i orientation is more conducive to twinning intension (0.31) compared to compression (0.16).
Competition between slip and twinning is dependent onthe resolved shear stresses. The resolved shear stresses in

Table 1Maximum Schmid factors for slip, twinning, and the leading and trailing Shockley partial dislocations. The number of systems which have equivalentSchmid factors is represented by the superscript. These values were taken from Ref. [7].
Tensile Compressive
Slip Twin Trail Lead Slip Twin Trail Lead
h111i 0.286 0.313 0.16 0.31 0.286 0.166 0.31 0.16h001i 0.418 0.238 0.47 0.23 0.418 0.474 0.23 0.47h123i 0.461 0.471 0.34 0.47 0.461 0.341 0.47 0.34
C. Efstathiou, H. Sehitoglu / Acta Materialia 58 (2010) 1479–1488 1481
single crystals are a function of the crystal orientation andthe applied stress-state. Since the crystal orientation maybe altered during deformation, the resolved shear stressesare influenced by the degree of deformation. This isreferred to as geometric hardening, and in fcc materials,for example, this is a result of a slip plane and directionrotating toward the tensile axis during deformation. Thiseffect becomes significant at strains greater than approxi-mately 10% during slip deformation, whereas it is immedi-ately significant for twinning. Note that the rotation of theslip direction differs for slip and twinning since the slipdirections differ for a perfect and partial dislocation whenconsidering one active system. Additionally, the extent ofdeformation may introduce multiple slip and multiple twin-ning in certain orientations as is implied by the number ofactive systems in Table 1. This can lead to an unusualstrain hardening response with complicated interactionsof deformation mechanisms and complex microstructuralevolution [7,8].
3. Materials and methods
Hadfield steel single crystals with a composition ofFe–12.3Mn–1.3C (wt.%) were grown using the Bridgmantechnique in a helium atmosphere. The single crystals weresubjected to a homogenizing treatment at 1100 �C for 24 hin inert gas atmosphere. Specimens were electrodischargedmachined to a dog-bone shape with nominal dimensions of10� 3� 1:5 mm3 in the gage section. Specimens were thensolution treated at 1100 �C for 1 h, and water quenched.
Uniaxial tensile testing was conducted at room temper-ature on a servohydraulic load frame. Specimens wereloaded in position control which resulted in macroscopicstrain rates of the order of 10�4.
In situ macroscopic imaging was used to investigate thedeformation evolution. Images of the specimen surfacewere captured with an IMI model IMB-202FT CCD cam-era ð1600� 1200 pixels2Þ. A Navitar optical lens was usedfor in situ observations, which generated a resolution of2:5 lm pixel�1. DIC was performed on images obtainedin situ to determine the evolution of the local strain fieldduring deformation. In addition to in situ DIC, ex situDIC was performed on images obtained after deformationusing an Olympus optical microscope. The ex situ DICmeasurements were used to establish the axial twinningstrain magnitude. For these measurements, an optical mag-
nification of 25� was used, which generated a resolution of174 nm pixel�1.
We utilized a two-dimensional DIC technique to mea-sure the axial and the transverse in-plane displacementcomponents. Two-dimensional tensorial strain field calcu-lations were made from measurements of the in-plane dis-placement components. All strain fields presented in thispaper are the spatial distribution of the axial strain compo-nent of the two-dimensional strain tensor.
The DIC technique measures displacement fields bytracking a random speckle pattern on the specimen surface[31]. Speckle patterns were applied to the surface of pol-ished specimens using an Iwata Micron B airbrush. To per-form DIC, a region of interest is selected in the referenceimage and is then divided into small square regions calledsubsets. In order to find the location of a deformed subsetand its shape change, optimization techniques areemployed in which values of displacement and linear dis-placement gradients of a subset are obtained. The resultingdisplacement field is then differentiated to obtain the strainfield according to a central difference scheme.
Usually, the first image (before any applied load) is cho-sen as the reference image, and all others are comparedagainst this one. Thus each correlation, and each strainfield, represents the total strain. This is how the local strainfields were produced for studying the evolution of deforma-tion twinning, and the axial twin strain magnitude.
On the other hand, to study the evolution of the strainhardening rate, a slightly different approach was used.Since the strain hardening rate is the rate of change ofstress with respect to strain, an incremental approach wastaken. To identify the “currently” deforming regions inthe strain field, and to link these features to the hardeningbehavior, we segmented the nominal stress–strain curveinto three regions. The first and the last image of each seg-ment are correlated. By using this approach, the activelydeforming regions during each deformation segment areillustrated, and thus particular deformation features canbe linked to the change in macroscopic stress.
Commercially available software (Vic2d) from Corre-lated Solutions was used to perform the image correlationand the strain field calculations. The average macroscopicor “nominal” strains are calculated as the mean of theentire strain field. Further details on the application ofDIC can be found in Ref. [31] and a general backgroundon DIC is given in Ref. [32].
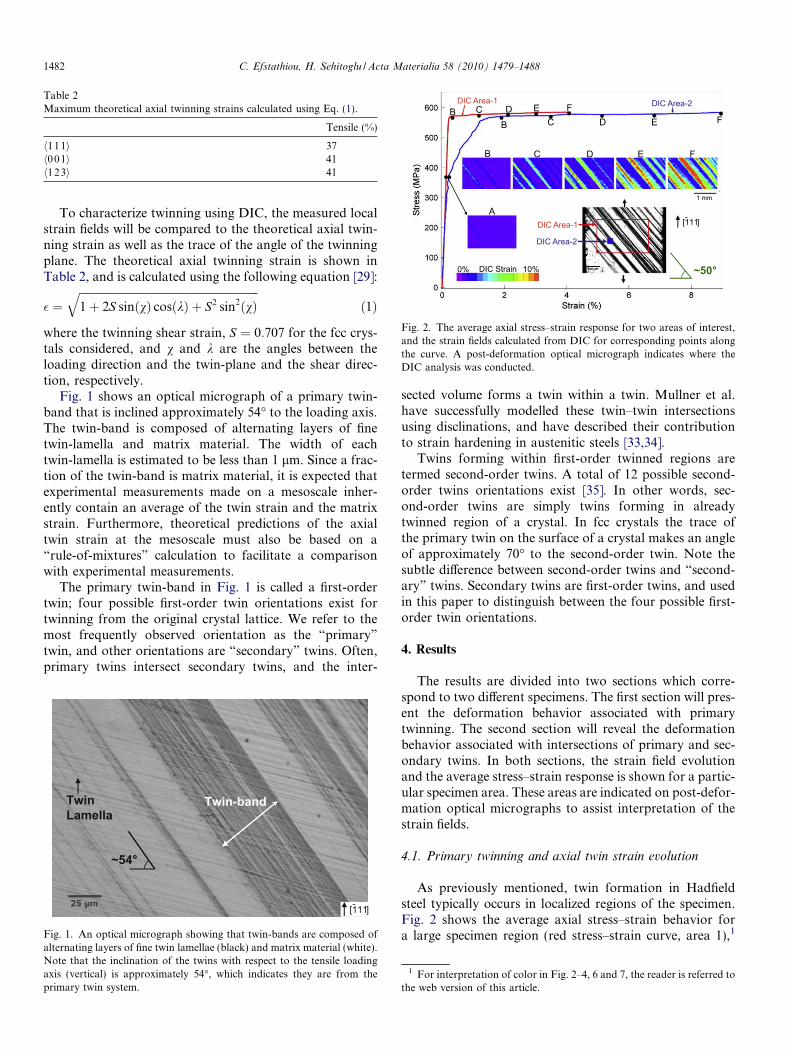
Table 2Maximum theoretical axial twinning strains calculated using Eq. (1).
Tensile (%)
h111i 37h001i 41h123i 41
1 mm
DIC Area-1 DIC Area-2B C D E F
B C D E F
B C D E F
DIC Area-1
DIC Area-2
10%DIC Strain0%
A
~50°
[111]-
Fig. 2. The average axial stress–strain response for two areas of interest,and the strain fields calculated from DIC for corresponding points alongthe curve. A post-deformation optical micrograph indicates where theDIC analysis was conducted.
1482 C. Efstathiou, H. Sehitoglu / Acta Materialia 58 (2010) 1479–1488
To characterize twinning using DIC, the measured localstrain fields will be compared to the theoretical axial twin-ning strain as well as the trace of the angle of the twinningplane. The theoretical axial twinning strain is shown inTable 2, and is calculated using the following equation [29]:
� ¼ffiffiffiffiffiffiffiffiffiffiffiffiffiffiffiffiffiffiffiffiffiffiffiffiffiffiffiffiffiffiffiffiffiffiffiffiffiffiffiffiffiffiffiffiffiffiffiffiffiffiffiffiffiffiffiffiffiffiffiffiffiffiffiffiffi1þ 2S sinðvÞ cosðkÞ þ S2 sin2ðvÞ
qð1Þ
where the twinning shear strain, S ¼ 0:707 for the fcc crys-tals considered, and v and k are the angles between theloading direction and the twin-plane and the shear direc-tion, respectively.
Fig. 1 shows an optical micrograph of a primary twin-band that is inclined approximately 54� to the loading axis.The twin-band is composed of alternating layers of finetwin-lamella and matrix material. The width of eachtwin-lamella is estimated to be less than 1 lm. Since a frac-tion of the twin-band is matrix material, it is expected thatexperimental measurements made on a mesoscale inher-ently contain an average of the twin strain and the matrixstrain. Furthermore, theoretical predictions of the axialtwin strain at the mesoscale must also be based on a“rule-of-mixtures” calculation to facilitate a comparisonwith experimental measurements.
The primary twin-band in Fig. 1 is called a first-ordertwin; four possible first-order twin orientations exist fortwinning from the original crystal lattice. We refer to themost frequently observed orientation as the “primary”
twin, and other orientations are “secondary” twins. Often,primary twins intersect secondary twins, and the inter-
Twin Lamella
Twin-band
~54°
[111]-
Fig. 1. An optical micrograph showing that twin-bands are composed ofalternating layers of fine twin lamellae (black) and matrix material (white).Note that the inclination of the twins with respect to the tensile loadingaxis (vertical) is approximately 54�, which indicates they are from theprimary twin system.
sected volume forms a twin within a twin. Mullner et al.have successfully modelled these twin–twin intersectionsusing disclinations, and have described their contributionto strain hardening in austenitic steels [33,34].
Twins forming within first-order twinned regions aretermed second-order twins. A total of 12 possible second-order twins orientations exist [35]. In other words, sec-ond-order twins are simply twins forming in alreadytwinned region of a crystal. In fcc crystals the trace ofthe primary twin on the surface of a crystal makes an angleof approximately 70� to the second-order twin. Note thesubtle difference between second-order twins and “second-ary” twins. Secondary twins are first-order twins, and usedin this paper to distinguish between the four possible first-order twin orientations.
4. Results
The results are divided into two sections which corre-spond to two different specimens. The first section will pres-ent the deformation behavior associated with primarytwinning. The second section will reveal the deformationbehavior associated with intersections of primary and sec-ondary twins. In both sections, the strain field evolutionand the average stress–strain response is shown for a partic-ular specimen area. These areas are indicated on post-defor-mation optical micrographs to assist interpretation of thestrain fields.
4.1. Primary twinning and axial twin strain evolution
As previously mentioned, twin formation in Hadfieldsteel typically occurs in localized regions of the specimen.Fig. 2 shows the average axial stress–strain behavior fora large specimen region (red stress–strain curve, area 1),1
1 For interpretation of color in Fig. 2–4, 6 and 7, the reader is referred tothe web version of this article.

0%
10%
145 X 145 mSUBSET SIZE
500 mF
13 X 13 mSUBSET SIZE
0%
30%
Fig. 3. Comparison of low-magnification and high-magnification axial strain fields for the region outlined by the black dashed box. Note that the higher-magnification results show numerous twin-bands with significantly higher strains. Each result has a different strain color scale bar. Recall that the low-magnification strain field (F) indicates the final state of the specimen after the loading shown in Fig. 2.
C. Efstathiou, H. Sehitoglu / Acta Materialia 58 (2010) 1479–1488 1483
and for a smaller specimen region (blue curve, area 2). Thecorresponding areas are shown on the post-deformationmicrograph of the specimen surface. The micrograph ofthe specimen surface shows alternating regions of matrix(white) and twin-band (black) material. Note that area 1represents a region that appears to have approximatelyequal amounts of matrix and twin-band material, whereasarea 2 represents a region that appears to encompass onlyone twin-band by the end of the loading. The twin-bands inthis specimen are primary twins since they are inclinedapproximately 54� to the loading direction. The apparenttwin nucleation stress, determined by the yield point inthe stress–strain curve, is approximately 580 MPa for area1, and 350 MPa for area 2. The average strain at the com-pletion of the experiment is approximately 4% for area 1,and approximately 9% for area 2. These considerable dif-ferences in twin nucleation stress and axial twin strain areelaborated below with reference to the strain fieldmeasurements.
The strain fields labeled A–F were obtained in area 1(this region includes area 2), and each strain field corre-sponds to an average strain indicated by a black circularmarker on the stress–strain curve. At early stages of thedeformation, shown by strain field A, a narrow blue regionrepresenting a twin-band appears faintly in the strain field.Since this twin-band constitutes only a small fraction of thearea, the average stress–strain response does not deviatefrom linearity (red curve). In contrast, since the twin-bandconstitutes a large fraction of area 2, the average stress–
strain response deviates from linearity at approximately350 MPa. As the nominal deformation increases (markerB), the stress–strain curve for area 1 indicates a yield pointat approximately 580 MPa. It is apparent that consider-ation of the measurement length scale and location isimportant for the detection of the onset of twinning.
With increased deformation (markers C–F), additionaltwin-bands appear in the area, while others accumulatestrain (shown by the green and red narrow bands). At theend of the loading, the maximum strain in any twin-bandregion is approximately 10%. The maximum strain is con-siderably smaller than that predicted by Eq. (1), and shownin Table 2 for loading along the h11 1i orientation. Thesmaller measured twin strain at this optical magnificationis primarily a consequence of the measurement length scale.This effect is shown in the subsequent figure which com-pares the results obtained at low optical magnification withthe results obtained at higher optical magnification.
Fig. 3 shows the strain field obtained at low magnifica-tion (from point F in Fig. 2), and at high magnification.The comparison is made in the region outlined by thedashed black box. In this region the low-magnificationresults appear to be “smoothed-out” compared to thehigh-magnification results. For example, in the left halfof the dashed box, the low-magnification results showtwo fairly uniform regions (a blue region and a small greenregion), whereas the high-magnification results show sevenseparate twin-bands. In the right half of the outlined box,the high magnification results show a twin-band with

1 mm
30%
0%Primary
Micrograph Schematic
Secondary
[111]-
Fig. 4. The nominal stress–strain response, and the axial strain fieldscalculated from DIC at selected points along the curve. A post-deformation optical micrograph of the specimen surface with a whitebox indicates where the DIC strain fields are reported. Three twin-systemsare identified, and for the purposes of clarity they are represented in theschematic as primary and secondary.
1484 C. Efstathiou, H. Sehitoglu / Acta Materialia 58 (2010) 1479–1488
strains of up to 30%. Note that the high-magnificationstrain field indicates small strains (less than 1%) surround-ing twinned regions, which suggests that nearly no macro-scopic slip deformation accompanies the twin formation.
The measured strain within the twin-band of the high-magnification results in Fig. 3 is approximately 30%, butaxial strain predictions based on twinning crystallography(see Table 2) suggest they should be as large as 37%. Thesmaller measured twin strain is a consequence of an incom-plete twinned volume fraction within the twin-band regionas opposed to strain-averaging effects. Thus, an estimate ofthe fraction of twinned material within the twin-band ismade by dividing the measured strain by the theoreticalstrain 30
37¼ 0:8
� �. This suggests approximately 80% of the
twin-band is twinned material, and 20% is undeformedmatrix material. The subset size is included in this figureto show that the twin-band is larger than the subset size,and therefore strain-averaging effects in the twin-bandregion from surrounding matrix material are minimized.This also supports the estimate that the twinned volumefraction is less than 100%. Although for this region thetwin-band is larger than the subset size, other specimenareas have nucleated only individual twin-lamella, whichare a small fraction of the subset size. In these regions,the maximum strains are influenced by strain averagingand this is why several of these twin-band regions (shownas blue bands) indicate only approximately 8% strain.
4.2. Twin–twin Intersections and strain hardening behavior
Fig. 4 shows the stress–strain curve and the local strainfields obtained for the specimen with intersecting twins.Note that the average stress–strain response shows signifi-cant strain hardening as compared to that shown in Fig. 2.A post-deformation optical micrograph is also shown inthe figure for comparison. In this specimen, wide twin-bands form which are ultimately larger than the subset size,and so the maximum measured strains of approximately30% within these regions approach theoretical strains.Close inspection of the strain fields show that the straininterfaces are not sharp, and significant strain (8%) hasaccumulated between the primary twin-bands, which isdue to the formation of secondary twins.
To illustrate the microscopic details of the regionsbetween the primary twin-bands, high-magnification post-deformation optical micrographs are shown in Fig. 5.Fig. 5a and b show intersecting twins, and Fig. 5c showsnon-intersecting twins which exist but to a much lesserextent. The intersected region of two twins can form a sec-ond-order twin. A second-order twin is a twin that hasformed within an already twinned region of a crystal asdescribed in Ref. [35]. Although these micrographs arepost-deformation, in situ DIC captured the strain fieldsassociated with the interaction of these twins.
To identify how specific twin–twin intersections influ-ence the overall strain hardening behavior, we conductedimage correlation over segments of the entire loading his-
tory as explained in Section 3. By doing this we are ableto identify the “currently” deforming regions and thus wecan deduce the interactions which contribute to the strainhardening behavior. Furthermore, by using DIC we areable to consider the length scale affect on the upper andlower estimates of the strain hardening behavior.
Fig. 6 shows the strain field corresponding to three seg-ments of the loading history for the sample which displayedintersecting twins. The strain fields represent the totalstrain accumulated during each segment. The segments ofthe loading history are shown by the three correspondinghorizontal arrows which represent approximately 1% aver-age strain. Also shown is the hardening rate for the speci-men which exhibited intersecting twins (blue curve) andfor the specimen which did not exhibit twin–twin intersec-tions (red curve). We emphasize again that by segmentingthe loading history, the strain resulting from the intersect-ing twins during segment 1 does not to contribute to themeasured strain field in segment 2. The strain field duringsegment 1 indicated multiple twin-systems activatedaccompanied by a relatively high strain hardening rate(1.2 GPa). At a later stage of deformation shown by seg-ment 2, the strain field indicated only one operative twin-system and a low strain hardening rate (0.3 GPa). In fact,the strain hardening rate reached a minimum value whichwas comparable to the sample which did not display inter-secting twins (red curve). During segment 3, the strain fieldagain indicated multiple operative twin-systems accompa-nied by a relatively high strain hardening rate (1.2 GPa).An important point to note is the region in the strain fieldidentified by the white arrow. In this region, the strain fieldevolution shows that twin–twin intersections at early stagesof deformation (segment 1) do not inhibit twin formationat later stages of deformation (segment 3). Furthermore,note that significant spatial heterogeneity is apparent dur-ing the evolution.

Intersecting Twins
Non-Intersecting Twins
Low Mag. Overview
[111]-
(a) 5x
SOT
Intersecting Twins
~70°
[111]-
(b) 50x
Non-Intersecting Twins
[111]-
(c) 50x
Fig. 5. Optical micrographs showing the intersection of twin-bands aftermoderate applied deformation (less than 10% strain). (a) Low-magnifica-tion overview shows all three twin-systems (one primary and twosecondary) have activated. Some regions show intersecting twins, whereasothers show non-intersecting twins. (b) A high-magnification detail of atwin–twin intersection which has formed a second-order twin (SOT). (c) Ahigh-magnification detail of a non-intersecting twin.
1.0 mm
2 31
2
1 3
Fig. 6. Evolution of the strain hardening rate for increasing applieddeformation for the specimen with twin intersections (blue curve), andwithout twin intersections (red curve). The three strain fields representthe accumulated deformation during each “segment” bracketed by theblack arrows for the specimen which exhibited twin–twin intersections.The strain fields thus qualitatively compare periods of twin–twinintersection activity (segments 1 and 3), and a period with very littleactivity (segment 2). Note that the strain hardening rate is higher whentwin–twin intersections are present. The dotted red line represents themaximum strain hardening rate found in a 200 lm2 region (red dottedbox), and the dotted black line represents the minimum strainhardening value obtained in a 200 lm2 region at the center primarytwin-band (black dotted box). The strain fields are scaled 0–5% to showthe details. A white arrow points to a particular twin–twin intersectionwhich is shown in Fig. 7
C. Efstathiou, H. Sehitoglu / Acta Materialia 58 (2010) 1479–1488 1485
To show the extent of the spatial heterogeneity, twodashed lines have been included in Fig. 6. The dotted redline represents the maximum strain hardening rate ofapproximately 3 GPa in a 200� 200 lm2 sample regionwithin the red box, and the dotted black line representsthe minimum strain hardening value of approximately0.3 GPa in a 200� 200 lm2 sample region within the blackbox. This shows that the strain hardening rate can differspatially by up to an order of magnitude. It is expected thatwith increased applied deformation, the magnitude of thespatial heterogeneity could become larger since someactively deforming regions eventually become saturatedand no strain further accumulates in these regions.
Post-deformation optical micrographs of the regionwith twin–twin intersections are shown in Fig. 7. Theupper left micrograph in this figure shows a low-magni-fication overview of the twin–twin intersections, and ared box which encompasses the particular twin–twinintersection which was previously pointed out by thewhite arrow in Fig. 6. This particular region is encom-passed by the red box, and it is shown at successivelyhigher magnification to illustrate the secondary twin,and the second-order twins. The intersection involvesan abrupt change of the orientation (approximately70�) of the primary twin, which is consistent with theo-retical predictions. Apparently, this twin–twin intersec-tion did not completely inhibit growth of a primarytwins since the evolution of the strain-field measurements

SecondaryTwin
Growing PrimaryTwin-Band
[111]- [111]-
[111]-[ ]
SecondOrder Twins Inside a SecondaryTwin
Fig. 7. Shows an overview of the specimen surface with a small red box outlining the twin–twin intersection, and increasingly higher-magnification imagesshowing the second-order twins.
2 This is estimated by mapping the strains to equivalent twin fractionssimilar to the prediction of the maximum twinned fraction estimates.Mapping strains to equivalent twinned fractions is a first approximationsince slip deformation is considered to be very small.
1486 C. Efstathiou, H. Sehitoglu / Acta Materialia 58 (2010) 1479–1488
indicated accumulated strain within the primary twin-band at a later stage (segment 3 in Fig. 6).
5. Discussion
The strain field measurements show the evolution of theaxial strain component during deformation twinning. Anoticeable characteristic of deformation twinning in Had-field steel is the formation of narrow bands with relativelylarge local strain. For example, the average strain within atwin-band can be approximately 30% whereas in the sur-rounding matrix regions the strain may be only 0.5% (seeFig. 3). This suggests that only small amounts of slip defor-mation in the surrounding matrix material accompany theformation of twins at initial stages of deformation. Sincetwinning dominates from early stages of plastic deforma-tion, it is reasonable to conclude that the twinned volumefraction increases linearly with deformation only at earlystages of deformation. At later stages of deformation, mul-tiple twin-systems become more active, and the degree oftwin–twin intersections increases. Increased twin–twinintersections can lead to increased slip deformation, as wellas twin dissolution from detwinning reactions [36]. Withthese additional operative mechanisms at later stages ofdeformation, the resulting twin volume fraction evolutionmay no longer increase linearly. A comparison of measuredand theoretical axial twinning strain within twin-bandsgives an estimate of the twinned fraction as approximately80%. This is the maximum twinned fraction at mesoscopic(300 lm) length scales. Of course, if the measurementlength scale is decreased to the length scale of an individualtwin-lamella, the volume fraction approaches 100%. Con-
sidering area 1 in Fig. 2, an estimate of the twinned fractionis 21% at 4% nominal strain.2 Previously published modelpredictions for macroscopic specimen regions indicateapproximately 21% twinned fraction by approximately6.5% macroscopic strain, which is in general agreementwith the current experimental estimates [7].
The spatial distribution of twin-bands was dependent onthe applied deformation. Twin-bands nucleate several hun-dred micrometers apart and accumulate strain according tothe order in which they formed. This suggests that regionscontaining existing twins act as nucleation sites for subse-quent twins. This has been described before as Luders-typetwin propagation [5]. Although the majority of the twinnucleation occurs near twin-bands, individual twin-lamel-lae are observed within the microstructure. Theseindividual twin-lamellae have probably formed at stress-concentrations from microstructural heterogeneities.Apparently these isolated individual twin-lamellae are notas effective nucleation sites as larger twin-band regions;however, these twin-lamella regions are expected to growat later stages of deformation.
The strain field measurements are particularly useful inunderstanding heterogeneous deformations which wouldbe difficult to explain using conventional extensometermeasurements. For example, consider the single twin-bandwhich was nucleated at the onset of the yielding behaviorat a significantly lower macroscopic stress (350 MPa) in

C. Efstathiou, H. Sehitoglu / Acta Materialia 58 (2010) 1479–1488 1487
Fig. 2. This particular twin-band must have nucleatedfrom a stress concentration along the edge of the samplesurface. We speculate this because the stress level increasedto 580 MPa and remained constant with further deforma-tion while under position control. It is obvious that if anextensometer was used to determine the twin nucleationstress it would be highly dependent on its placement alongthe specimen gauge length, and dependent on which sur-face it was attached to.
The utility of DIC is further exemplified in the analysisof twin–twin intersections. An outstanding result of thestrain field measurements was that the presence of a sec-ondary twin does not eliminate growth of the primarytwin-band; however, it provides additional resistance totwin nucleation. The twin–twin intersections generated adefinite increase the strain hardening rate from 0.2 to1.2 GPa. Karaman et al. [8] reported a value of approxi-mately 1.75 GPa for a specimen with 20% applied plasticstrain. Note that just like the estimate of twin-fraction,the estimate of the strain hardening rate depends on themeasurement length scale. It was shown that at particularregions with significant amounts of twin–twin intersections,with average local strains near 20%, hardening rates as highas 3 GPa were measured.
The formation of second-order twins in twin–twin inter-sected regions does not appear to eliminate growth of theprimary twin-band. However, they do appear to increasethe strain hardening rate. Second-order twin formationsin austenitic steels were modelled by Mullner et al. [33]using disclinations. They showed that second-order twinsare energetically favorable, and that the second-order twinsincreased the work hardening rate. This is consistent withwhat we observe. Interestingly, they also suggest that sec-ond-order twins require the presence of stress or strain con-centrations. Since we observed the simultaneous nucleationof multiple twin-systems at relatively small applied defor-mations, which is not typical, we speculate that stress con-centrations in the microstructure or at the specimen edgescould have promoted the nucleation of multiple twin-sys-tems and hence the twin–twin intersections. It is expectedthat with increased deformation, twin–twin intersectionsand second-order twin generation would increase, and dis-location–twin interactions would additionally contribute tothe strain hardening rate.
6. Summary and concluding remarks
In situ strain field measurements were shown to be par-ticularly useful for describing the evolution of twin-bandformation, and twin–twin intersections. Using strain fieldmeasurements at high optical magnification, a quantitativemeasure of the axial twinning strain was obtained. A max-imum twinning strain of approximately 30% was measuredin some twin-band regions. These measurements were com-parable to theoretical predictions for the twinning of ah111i oriented Hadfield steel single crystal under tension.
The comparison of measurements to theoretical predictionssuggested that 80% of the twin-band region was twinned.
We conclude that twin–twin intersections do not com-pletely inhibit growth of the primary twin-system; however,a definite increase in the strain hardening response is attrib-uted to the intersections. Additionally, the measurementlength scale was shown to influence the strain magnitude,and thus estimates of strain hardening rate can spatiallyvary by up to an order of magnitude.
Acknowledgements
We thank the reviewer for useful comments on the man-uscript. The work was supported by the National ScienceFoundation Division of Materials Research DMR-0803270 and partially by the National Science FoundationDivision of Civil, Mechanical and Manufacturing Innova-tion CMMI-0926813.
References
[1] Raghavan AS, Sastri KS, Marcinkowski MJ. Nature of work-hardening behavior in Hadfield’s manganese steel. Trans Metall SocAIME 1969;245:1569–75.
[2] Dastur YN, Leslie WC. Mechanism of work hardening in Hadfieldmanganese steel. Metall Trans 1981;12A:749–59.
[3] Adler PH, Olson GB, Owen WS. Strain hardening of Hadfieldmanganese steel. Metall Trans 1986;17A:1725–37.
[4] Shtremel MA, Kovalenko IA. On the work hardening mechanism ofHadfield steel. Phys Metals Metall 1987;63:158–66.
[5] Karaman I, Sehitoglu H, Gall KA, Chumlyakov YI. On thedeformation mechanisms in single crystal Hadfield manganese steels.Scripta Mater 1998;38:1009–15.
[6] Owen W, Grujicic M. Strain aging of austenitic Hadfield manganesesteel. Acta Mater 1998;47(1):111–26.
[7] Karaman I, Sehitoglu H, Gall KA, Chumlyakov YI, Maier HJ.Deformation of single crystal Hadfield steel by twinning and slip.Acta Mater 2000;48:1345–59.
[8] Karaman I, Sehitoglu H, Beaudoin AJ, Chumlyakov YI, Maier HJ,Tome CN. Modelling the deformation behavior of Hadfield steelsingle and polycrystals due to twinning and slip. Acta Mater2000;48:2031–47.
[9] Karaman I, Sehitoglu H, Chumlyakov Y, Maier H, Kirkeva I.Extrinsic stacking faults and twinning in Hadfield manganese steelsingle crystals. Scripta Mater 2001;44(2):337–43.
[10] Canadinc D, Sehitoglu H, Maier H, Chumlyakov Y. Strain hardeningbehavior of aluminum alloyed Hadfield steel single crystals. ActaMater 2005;53(6):1831–42.
[11] Chumlyakov YI, Kireeva IV, Zaharova EG, Luzginova NV, Sehito-glu H, Karaman IK. Strain hardening and fracture of austenitic steelsingle crystals with high concentration of interstitial atoms. Russ PhysJ 2002;45:274–84.
[12] Zaharova EG, Kireeva IV, Chumlyakov YI, Efimenko SP, SehitogluH, Karaman IK. Deformation mechanisms and strain hardening ofHadfield-steel single crystals alloyed with aluminum. Doklady Phys2002;47:515–7.
[13] Canadinc D, Karaman I, Sehitoglu H, Chumlyakov YI, Maier HJ.The role of nitrogen on the deformation response of Hadfield steelsingle crystals. Metall Mater Trans 2003;34A:1821–31.
[14] Chumlyakov YI, Kireeva IV, Sehitoglu H, Litvinova EI, ZaharovaEG, Luzginova NV. High-strength single crystals of austeniticstainless steels with nitrogen content: mechanisms of deformationand fracture. Mater Sci Forum 1999;318–320:395–400.

1488 C. Efstathiou, H. Sehitoglu / Acta Materialia 58 (2010) 1479–1488
[15] Mori T, Fujita H. Twinning deformation in single crystals of Cu-8at.% Al alloy. Trans Jpn Inst Met 1977;18(1):17–24.
[16] Remy L. Twin-slip interaction in fcc crystals. Acta Metall1977;25(6):711–4.
[17] Mahajan S, Chin G. The interaction of twins with existing substruc-ture and twins in cobalt–iron alloys. Acta Metall 1974;22(9):1113–9.
[18] Remy L. The interaction between slip and twinning systems and theinfluence of twinning on the mechanical behaviour of fcc metals andalloys. Metall Trans A 1981;12(3):387–408.
[19] Venables JA. Deformation twinning. New York: Gordon and BreachScience Publishers; 1964.
[20] Schramm RE, Reed RP. Stacking fault energies of seven commer-cially austenitic stainless steels. Metall Trans 1975;6:1345–51.
[21] Hirth J, Lothe J. Theory of dislocations. 2nd ed. Malabar, FL: KriegerPubl. Co.; 1992.
[22] Kibey S, Liu J, Johnson D, Sehitoglu H. Energy pathways anddirectionality in deformation twinning. Appl Phys Lett2007;91(18):181916-1-3.
[23] Barrett CS. Cold working of metals. Cleveland: American Society ofMetals; 1949.
[24] Cahn RW. Plastic deformation of alpha-uranium; twinning and slip.Acta Metall 1953;1:49–52.
[25] Rosenbaum HS. Deformation twinning. London: Gordon andBreach Science Publishers; 1964.
[26] Christian JW. Theory of transformation in pure cobalt. Proc Roy SocA 1951;206:51–64.
[27] Cottrell AH, Bilby BA. A mechanism for the growth of deformationtwins in crystals. Phil Mag 1951;42:573–81.
[28] Venables JA. Deformation twinning in face-centered cubic metals.Phil Mag 1961;6:379–96.
[29] Hall EO. Twinning and diffusionless transformations in metals. Lon-don: Butterworth Scientific Publications; 1954.
[30] Mahajan S, Chin G. Formation of deformation twins in f.c.c. crystals.Acta Metall 1973;21(10):1353–63.
[31] Chu T, Ranson WF, Sutton MA, Peters WH. Applications of digital-image-correlation techniques to experimental mechanics. Exp Mech1985;25:232–44.
[32] Dally JW, Riley WF. Experimental stress analysis. 4th ed. Knox-ville: College House Enterprises, LLC; 2005.
[33] Mullner P, Solenthaler C, Speidel M. Second order twinning inaustenitic steel. Acta Metall Mater 1994;42(5):1727–32.
[34] Mullner P. Between microscopic and mesoscopic descriptions oftwin–twin interaction. Z. f. Metallkunde 2006;97:205–16.
[35] Dunn CG. Standards for identifying complex twin relationships incubic crystals. Trans Am Inst Mining Metall Eng 1945;161:90–7.
[36] Li A, Chumlyakov Y, Korotaev A. Influence of the fine structure oftwins on strain hardening as a result of repeated twinning. FizikaMetallov i Metallovedenie 1988;65(4):809–15.