Heterogeneous Deformation and Spall of an Extruded ... · Heterogeneous Deformation and Spall of an...
46
Heterogeneous Deformation and Spall of an Extruded Tungsten Alloy: Plate Impact Experiments and Crystal Plasticity Modeling by T. J. Vogler and J. D. Clayton ARL-RP-206 April 2008 A reprint from the Journal of the Mechanics and Physics of Solids, vol. 56, pp. 297–335, 2008. Approved for public release; distribution is unlimited.
Transcript of Heterogeneous Deformation and Spall of an Extruded ... · Heterogeneous Deformation and Spall of an...

Heterogeneous Deformation and Spall of an Extruded
Tungsten Alloy: Plate Impact Experiments and Crystal Plasticity Modeling
by T. J. Vogler and J. D. Clayton
ARL-RP-206 April 2008
A reprint from the Journal of the Mechanics and Physics of Solids, vol. 56, pp. 297–335, 2008.
Approved for public release; distribution is unlimited.

NOTICES
Disclaimers The findings in this report are not to be construed as an official Department of the Army position unless so designated by other authorized documents. Citation of manufacturer’s or trade names does not constitute an official endorsement or approval of the use thereof. Destroy this report when it is no longer needed. Do not return it to the originator.

Army Research Laboratory Aberdeen Proving Ground, MD 21005-5069
ARL-RP-206 April 2008
Heterogeneous Deformation and Spall of an Extruded Tungsten Alloy: Plate Impact Experiments and
Crystal Plasticity Modeling
T. J. Vogler Sandia National Laboratories
J. D. Clayton
Weapons and Materials Research Directorate, ARL
A reprint from the Journal of the Mechanics and Physics of Solids, vol. 56, pp. 297–335, 2008.
Approved for public release; distribution is unlimited.

REPORT DOCUMENTATION PAGE Form Approved OMB No. 0704-0188
Public reporting burden for this collection of information is estimated to average 1 hour per response, including the time for reviewing instructions, searching existing data sources, gathering and maintaining the data needed, and completing and reviewing the collection information. Send comments regarding this burden estimate or any other aspect of this collection of information, including suggestions for reducing the burden, to Department of Defense, Washington Headquarters Services, Directorate for Information Operations and Reports (0704-0188), 1215 Jefferson Davis Highway, Suite 1204, Arlington, VA 22202-4302. Respondents should be aware that notwithstanding any other provision of law, no person shall be subject to any penalty for failing to comply with a collection of information if it does not display a currently valid OMB control number. PLEASE DO NOT RETURN YOUR FORM TO THE ABOVE ADDRESS. 1. REPORT DATE (DD-MM-YYYY)
April 2008 2. REPORT TYPE
Reprint 3. DATES COVERED (From - To)
October 2005–October 2007 5a. CONTRACT NUMBER
5b. GRANT NUMBER
4. TITLE AND SUBTITLE
Heterogeneous Deformation and Spall of an Extruded Tungsten Alloy: Plate Impact Experiments and Crystal Plasticity Modeling
5c. PROGRAM ELEMENT NUMBER
5d. PROJECT NUMBER
WHPR01B 5e. TASK NUMBER
6. AUTHOR(S)
T. J. Vogler* and J. D. Clayton
5f. WORK UNIT NUMBER
7. PERFORMING ORGANIZATION NAME(S) AND ADDRESS(ES)
U.S. Army Research Laboratory ATTN: AMSRD-ARL-WM-TD Aberdeen Proving Ground, MD 21005-5069
8. PERFORMING ORGANIZATION REPORT NUMBER
ARL-RP-206
10. SPONSOR/MONITOR'S ACRONYM(S)
9. SPONSORING/MONITORING AGENCY NAME(S) AND ADDRESS(ES)
11. SPONSOR/MONITOR'S REPORT NUMBER(S)
12. DISTRIBUTION/AVAILABILITY STATEMENT
Approved for public release; distribution is unlimited. 13. SUPPLEMENTARY NOTES
A reprint from the Journal of the Mechanics and Physics of Solids, vol. 56, pp. 297–335, 2008. *Sandia National Laboratories, Albuquerque, NM 87185-1181
14. ABSTRACT
The role of microstructure in the dynamic deformation and fracture of a dual phase, polycrystalline tungsten alloy under high-rate impact loading is investigated via experiments and modeling. The material studied consists of pure tungsten crystals embedded in a ductile binder alloy comprised of tungsten, nickel, and iron. The tungsten crystals are elongated in a preferred direction of extrusion during processing. Plate impact tests were conducted on samples oriented either perpendicular or parallel to the extrusion direction. Spatially resolved interferometric data from these tests were used to extract wave propagation behavior and spall strength dependent upon position in the sample microstructure. Finite element simulations of impact and spall in digitally reproduced microstructural geometries were conducted in parallel with the experiments. Finite deformation crystal plasticity theory describes the behavior of the pure tungsten and binder phases, and a stress- and temperature-based cohesive zone model captures fracture at grain and phase boundaries in the microstructure. In results from both experiments and modeling, the grain orientations affect the free-surface velocity profile and spall behavior. Some aspects of distributions of free-surface velocity and spall strength among different microstructure configurations are qualitatively similar between experimental and numerical results, while others are not as a result of differing scales of resolution and modeling assumptions. Following a comparison of experimental and numerical results for different microstructures, intergranular fracture is identified as an important mechanism underlying the spall event. 15. SUBJECT TERMS
microstructures, tungsten, crystal plasticity, fracture, spall, plate impact, finite elements, probability and statistics
16. SECURITY CLASSIFICATION OF: 19a. NAME OF RESPONSIBLE PERSON J. D. Clayton
a. REPORT UNCLASSIFIED
b. ABSTRACT UNCLASSIFIED
c. THIS PAGE UNCLASSIFIED
17. LIMITATION OF ABSTRACT
UL
18. NUMBER OF PAGES
46 19b. TELEPHONE NUMBER (Include area code)
410-278-6146 Standard Form 298 (Rev. 8/98) Prescribed by ANSI Std. Z39.18

ARTICLE IN PRESS
0022-5096/$ - se
doi:10.1016/j.jm
�CorrespondE-mail addr
Journal of the Mechanics and Physics of Solids 56 (2008) 297–335
www.elsevier.com/locate/jmps
Heterogeneous deformation and spall of an extruded tungstenalloy: plate impact experiments and crystal plasticity modeling
T.J. Voglera,�, J.D. Claytonb
aSolid Dynamics and Energetic Materials Department, Sandia National Laboratories, Albuquerque, NM 87185-1181, USAbImpact Physics Branch, US Army Research Laboratory, Aberdeen Proving Ground, MD 21005-5069, USA
Received 5 February 2007; received in revised form 1 June 2007; accepted 4 June 2007
Abstract
The role of microstructure in the dynamic deformation and fracture of a dual phase, polycrystalline tungsten alloy under
high-rate impact loading is investigated via experiments and modeling. The material studied consists of pure tungsten
crystals embedded in a ductile binder alloy comprised of tungsten, nickel, and iron. The tungsten crystals are elongated in a
preferred direction of extrusion during processing. Plate impact tests were conducted on samples oriented either
perpendicular or parallel to the extrusion direction. Spatially resolved interferometric data from these tests were used to
extract wave propagation behavior and spall strength dependent upon position in the sample microstructure. Finite
element simulations of impact and spall in digitally reproduced microstructural geometries were conducted in parallel with
the experiments. Finite deformation crystal plasticity theory describes the behavior of the pure tungsten and binder phases,
and a stress- and temperature-based cohesive zone model captures fracture at grain and phase boundaries in the
microstructure. In results from both experiments and modeling, the grain orientations affect the free-surface velocity
profile and spall behavior. Some aspects of distributions of free-surface velocity and spall strength among different
microstructure configurations are qualitatively similar between experimental and numerical results, while others are not as
a result of differing scales of resolution and modeling assumptions. Following a comparison of experimental and numerical
results for different microstructures, intergranular fracture is identified as an important mechanism underlying the spall
event.
r 2007 Elsevier Ltd. All rights reserved.
Keywords: Microstructures; Crystal plasticity; Plate impact; Finite elements; Probability and statistics
1. Introduction
The response of solid materials to impact or shock loading conditions is of interest for a variety ofapplications, including structural crashworthiness, ballistic events, and explosive–structure interactions. Oftensuch materials are heterogeneous when considered at the microscale; examples include polycrystalline metalsand ceramics or composite systems. Here we use the terms microscale and mesoscale somewhatinterchangeably, as both are encountered in the literature to describe the physics and mechanics of
e front matter r 2007 Elsevier Ltd. All rights reserved.
ps.2007.06.013
ing author. Tel.: +1505 845 0742; fax: +1 505 845 7685.
ess: [email protected] (T.J. Vogler).

ARTICLE IN PRESST.J. Vogler, J.D. Clayton / J. Mech. Phys. Solids 56 (2008) 297–335298
deformation at the scale of material features such as individual grains or particles, which can occur over10�7–10�2m. For most metals and ceramics, the mesoscale is identified with the grain size, typically on theorder of 10�6–10�4m. The microstructure has been experimentally observed to affect shock wave propagationand material failure in various solids in a number of instances (cf. Asay and Barker, 1974; Asay andChhabildas, 2003; Brannon et al., 1983; Mescheryakov, 2003). Even so, the mesoscale remains difficult toprobe experimentally in shock experiments due to the short time scales involved for stress waves to traverseindividual grains. Early modeling efforts (e.g., Meyers and Carvalho, 1976) pointed toward heterogeneousshock propagation phenomena controlled by the mesoscale, but only recently has it been possible tocomputationally address realistic microstructures, with dimensions of several hundred microns, with advancedcrystal mechanics-based constitutive models for nonlinear elastic–plastic behavior at the grain scale.
1.1. Background: experimental methods
Velocity interferometry has long been an important tool in shock physics research with the velocityinterferometer system for any reflector (VISAR) (Barker, 2000) system and Fabry–Perot (McMillan et al.,1988) velocimeter being the most widely used. Bloomquist and Sheffield (1983) developed the opticallyrecording velocity interferometer system (ORVIS) in which the photodetectors of a VISAR system arereplaced by a streak camera. Their objective, though, was improved temporal resolution, and they did notconsider spatially resolved phenomena. Baumung et al. (1996) made improvements to the system to allow useof a more modest laser and to allow many measurements across the width of the line. The current system,which we will refer to as the line-VISAR, is an improved version of that of Baumung et al. and is described inTrott et al. (2001). Additional references relating to efforts towards spatially resolved velocity measurementsin dynamic experiments can also be found therein. The length of the line imaged by the system can be variedfrom less than a millimeter to tens of millimeters by changing the optics. The line-VISAR represents asignificant advance over other diagnostics because it can be used to study spatially varying phenomena,whether they arise due to multidimensional effects or material heterogeneity.
The line-VISAR has been utilized in the study of a variety of physical phenomena at the mesoscale for anumber of different classes of materials. Phenomena studied include: dynamic loading of well-ordered systemssuch as lattices of tin spheres (Baer and Trott, 2004) and preformed ceramic lattices (Trott et al., 2007b);yielding, spall, and void growth in tantalum (Chhabildas et al., 2002; Furnish et al., 2006); collapse of holes incopper samples (Furnish et al., 2004); and compaction of granular sugar (Furnish et al., 2006). The line-VISAR has also been used to probe the shock response of materials such as fused silica, foam, glass-reinforcedpolyester (Trott et al., 2000), boron carbide (Vogler et al., 2004), and HMX (Baer and Trott, 2005).
Although the line-VISAR has been used as a diagnostic for several different types of experiments, in generalit has been used to assess phenomena qualitatively rather than quantitatively. However, in a few instances line-VISAR data have been analyzed directly to determine void growth (Chhabildas et al., 2002) and spatialvariability of the Hugoniot elastic limit (HEL) and spall strength (Furnish et al., 2006).
1.2. Background: modeling techniques
Crystal plasticity models capturing anisotropy arising from individual slip system activity have been used todescribe deformation of metallic materials for some time (see, e.g., Asaro, 1983; Kocks et al., 1998).Historically, most crystal plasticity implementations have focused on the quasi-static loading regime, thoughmodels have been applied in the intermediate strain rate regime to address dynamic phenomena such as thoseoccurring in Hopkinson bar experiments (Nemat-Nasser et al., 1998), Taylor impact experiments (Schoenfeld,1998), explosive forming of polycrystalline tantalum liners (Schoenfeld, 1998), and ballistic impact of titaniumarmor plates (Schoenfeld and Kad, 2002).
Recently, the crystal plasticity approach with resolution of individual grains by many finite elements hasbeen applied to model the very high-rate (shock) loading regime (Becker, 2004; Clayton, 2005b). Simulationsin this regime are often more computationally intensive than for quasi-static loading because the formerrequire large domains due to the lack of a representative volume element (RVE) in the direction of shockpropagation and the refined meshes needed to resolve stress waves, shock fronts, and material instabilities.

ARTICLE IN PRESST.J. Vogler, J.D. Clayton / J. Mech. Phys. Solids 56 (2008) 297–335 299
Small time steps are also necessary to capture details of the shock wave processes, irrespective of the choice ofnumerical integration scheme. In particular, Becker’s (2004) simulations of polycrystalline tantalumdemonstrated heterogeneities of stress and deformation at the grain scale, and shock fronts whose roughnessdecreased significantly as the applied stress rose from 10 to 100GPa. Becker also pointed out the presence ofnon-uniformities in the free-surface velocity that would complicate interferometric velocity measurements inanalogous plate impact experiments. It is precisely these variations that are the focus of the currentinvestigation.
Spall fracture and wave propagation in polycrystalline ceramics have been studied numerically withcohesive finite elements addressing fracture at grain boundaries (Espinosa and Zavattieri, 2003a, b). In thatparticular study, in which the bulk behavior was dictated by isothermal, anisotropic linear elasticity, localfracture behavior and heterogeneous wave propagation were observed. Comprehensive parametric studieswith variable cohesive properties and mesh densities were the focus of the investigation, and although thesimulations mimicked plate impact tests, direct comparisons with experimental data were not reported.
An alternative to the finite element method (FEM) that has recently been employed to resolve the shockdeformation of polycrystalline metals at the mesoscale is the discrete-element method (DEM) (Case andHorie, 2007; Yano and Horie, 1999, 2002). Simulations using this technique have, to date, been 2D andutilized very simple means to account for grain-to-grain variations in behavior, specifically orientation-dependent HELs, elastic wave speeds, and plastic wave speeds. Nonetheless, DEM models have displayed arich set of physically realistic behaviors including a non-uniform shock front, lateral motion near the shock,and vortices in material motion.
In most of the cases cited above, few comparisons were made between simulation results and experimentaldata on behavior at the mesoscale, in large part because of a lack of available experimental data in that spatialregime. In a few cases, line-VISAR results have been compared to numerical simulations of the dynamicloading of granular sugar packings (Trott et al., 2007a) and ordered packings of tin spheres (Baer and Trott,2004). These have been large-scale 3D numerical simulations conducted with Eulerian hydrocodes, as opposedto Lagrangian FEM or DEM. Furthermore, these simulations have focused on the effects engendered byvariations in spatial distributions of spherical or cubic particles in regular or random arrays, in the context ofrelatively simple isotropic elastic or elastic–plastic constitutive theories for the deviatoric response. In theseinstances, comparison between the simulations and experimental results have generally focused on comparingthe average response or homogenized material properties.
1.3. Background: tungsten alloys
Tungsten heavy alloys (WHA) such as the one studied here have been studied extensively, primarily aspotential materials for kinetic energy (KE) projectiles (Magness, 1994). Mechanical properties and physicalphenomena at high strain rates have been obtained or observed using Hopkinson bar techniques (Ramesh andCoates, 1992; Weerasooriya and Beaulieu, 1993), normal plate impact (Bless and Chau, 2006; Dandekarand Weisgerber, 1999; Millett et al., 1999; Zurek and Gray, 1991), explosive loading (Baoping et al., 1994),and oblique flyer-plate impact (Zhou and Clifton, 1997). In most of these, the bulk mechanical properties ofthe homogenized multiphase material (e.g., stress–strain curves, Hugoniot data, and spall strengths) were ofprimary interest, though some effects of local behavior dominated by microstructure, such as fracture surfacesor shear localization initiation sites, have been reported and described.
The role of microstructure on dynamic mechanical properties of tungsten alloys has also been investigatedvia constitutive modeling and numerical simulation. Zhou and co-workers used an isotropic elastic-viscoplastic constitutive model with realistic grain structures to capture shear localization in oblique impact(pressure–shear conditions) (Zhou et al., 1994) and high-rate nominally uniform shear deformation (Zhou,1998). Effective properties of tungsten alloys depending on microstructural parameters (e.g., volume fraction,size, and distribution of pure tungsten grains) were also determined numerically (Love and Batra, 2005).
The above modeling studies incorporated isotropic constitutive models for pure tungsten, a body-centeredcubic (BCC) material whose single crystals are virtually elastically isotropic at low pressures (Hirth and Lothe,1982) yet are known to exhibit significant anisotropy with regards to plastic flow (Argon and Maloof, 1966;Subhash et al., 1994). To address the effects of crystallographic orientation and dislocation accumulation on
ARTICLE IN PRESST.J. Vogler, J.D. Clayton / J. Mech. Phys. Solids 56 (2008) 297–335300
the thermomechanical response of tungsten alloys, crystal plasticity-based constitutive models have recentlybeen formulated and implemented by one of the authors. Tensile deformation and fracture of realisticallyrendered (Clayton, 2005a) and homogenized (Clayton, 2006a) microstructures of dual phase tungsten alloyshave been studied, respectively, with cohesive zone and anisotropic continuum damage mechanics theories.Clayton (2005b) performed 2D simulations of high-rate, uniaxial strain compression and spall fracture of atwo-phase tungsten heavy alloy. It was found that grain shapes and orientations had a significant effect on thenature of propagating stress waves, while spall was influenced by both of these aspects as well as by the localinterfacial properties used in the model. Statistical variations of free-surface velocity were also found to varywith crystal orientation, texture, and temperature dependence of properties controlling grain boundaryfracture (Clayton, 2006b).
1.4. Objectives and scope
In this paper, new results are presented for planar impact experiments on WHA in conjunction with newresults from simulations obtained using the crystal plasticity-cohesive fracture modeling methods developedby Clayton (2005b). The line-VISAR utilized in the experiments provides spatially- and temporally resolveddata on material deformation. It also provides statistical information regarding the local spall strength of thematerial. Aspects of the material response not reported in previous modeling of impact (Clayton, 2005b,2006b) are studied through experiments and simulations here, including different impact velocities andvariations in orientations of extruded grain structures (i.e., elongated grains oriented perpendicular or parallelto the compression wave).
Although comparison between experiments and simulations is not straightforward at present due tocompeting limitations on the spatial resolution of the experimental system and the absolute size of thecomputational domain, it is possible to compare trends observed in experimental results with thosefrom the simulations such as the effect of microstructural orientation on average spall strength. Changes infree-surface velocities and corresponding statistics of the response with increasing impact velocity orchanges in sample orientation can be compared between model and experiment. For example, changes invariance of free-surface velocity with changes in grain orientation may or may not be reflected by either theexperiments or the simulations. Furthermore, the capability for the simulations to detect features of theexperimental results, such as characteristic spikes in velocity dispersion through the shock front (cf. Case andHorie, 2007), provides an important means to assess the validity of the simulations. In this way, experimentsenable validation and possible improvement of crystal elasticity and plasticity models for high-rateapplications, and simulations offer explanations and insight into macroscopic and mesoscopic aspects ofmaterial behavior—either observed or predicted—that are difficult to resolve or deduce through experimentsalone. This work represents a crucial first step toward developing meaningful ways to compare the two sets ofresults.
Cartesian coordinates are used, with summation implied over repeated indices. Vector and tensor quantitiesare represented with boldface type, while scalars and individual components of vectors and tensors are writtenin italics. Juxtaposition implies summation over two repeated adjacent indices (e.g., ABð Þ
ba ¼ AacB
cb). The dot(scalar) product of vectors is represented by the symbol ‘‘d’’ (e.g., adb ¼ aaba). The colon denotes contractionover repeated pairs of indices (e.g., A : B ¼ tr ATB
� �¼ AabBab and C : A ¼ CabcdAcd ). The symbol ‘‘�’’
represents the tensor (outer) product (e.g., a� bð Þab¼ aabb). Superposed �1, T, and ‘‘d’’ denote inverse,
transpose, and material time derivative operations, respectively. Additional notation is explained as it appears.
2. Experimental approach
2.1. Material
The tungsten alloy studied consists of grains of relatively brittle pure tungsten (BCC) in a relatively soft andductile face-centered cubic (FCC) matrix composed of nickel (50% by weight), iron (25%), and tungsten(25%). The alloy nominally consists of 90% tungsten grains and 10% matrix alloy, yielding an overallmass composition of 93W–5Ni–2Fe. The composite is fabricated through isostatic pressing and sintering

ARTICLE IN PRESST.J. Vogler, J.D. Clayton / J. Mech. Phys. Solids 56 (2008) 297–335 301
of a mixture of W, Ni, and Fe powders. The alloy is then annealed to remove absorbed hydrogen and may bequenched, swaged, or pre-twisted to enhance its dynamic properties. Typical grain sizes are 10–30 mm for theW crystals and 200–500 mm for the matrix phase, implying that each matrix grain contains several W grains.The average density of the material was found to be 17.7770.07 g/cm3.
As a result of the swaging process, the W grains are elongated in the direction of the axis of the KE rod fromwhich material was obtained. As a means to assess the effect of the microstructure on shock wave propagationand spall failure, thin plates with two orientations were tested. The first, shown as a disk Fig. 1(a) and referred
Fig. 1. (a) Schematic of sample orientations relative to penetrator axis and anisotropic WHA microstructure. W grains colored by lattice
orientation from EBSD scans; (b) Inverse pole figures for W grains and matrix material for the two sample orientations.
ARTICLE IN PRESST.J. Vogler, J.D. Clayton / J. Mech. Phys. Solids 56 (2008) 297–335302
to as the axial orientation, aligns the sample normal with the axis of the rod, giving elongatedW grains through the sample thickness as shown in the electron backscatter diffraction (EBSD)image in the upper left. The second, shown as a thin square sample in Fig. 1(a) and referred to as thetransverse orientation, has a sample normal that is perpendicular to the axis of the rod. For thesesamples, two edges show equiaxed grains as shown in the upper right EBSD image, while the othertwo edges and the sample faces reveal the elongated grains of the upper left EBSD image. The line-VISARwas thus oriented with respect to the grains as illustrated in Fig. 1(a) in order to account for in-planeanisotropy of the sample. Inverse pole figures of the W grains (BCC) and binder phase (FCC) areshown in Fig. 1(b), with the distribution of crystallographic directions plotted with respect to thespecimen normal, denoted by [0 0 1], of the image for each orientation shown in Fig. 1(a). The relatively mildtextures are indicative of axial extension, drawing, or extrusion operations (Kocks et al., 1998):a preference for /1 1 0S (i.e., /1 0 1S) orientations for the BCC grains in the transverse microstructure,and a preference for /1 1 1S and /1 0 0S orientations for the FCC grains in the transverse microstructure.Despite the orientation dependence of the composite microstructure, the homogenized material isessentially elastically isotropic at the macroscale with longitudinal and shear wave speeds of 5.19 and2.83 km/s, respectively. Note that pure tungsten is an unusual cubic material in that its single crystalsare elastically isotropic at low pressures (Hirth and Lothe, 1982), though deviations from elasticisotropy and phase transformations occur at very high pressures (Ruoff et al., 1998). Hence, any deviationsfrom elastic isotropy in the WHA are caused by finite deformations or the presence and distribution of thepresumably anisotropic binder phase, as well as local lattice imperfections such as grain, twin, or subgrainboundaries.
2.2. Plate impact experiments
Five plate impact experiments were performed. A compressed gas gun was used to launch a 1.5mmthick WHA impactor into a 3.0mm thick WHA target at velocities of approximately 250, 350, and 450m/s.Two samples were in the axial orientation and the other three were transversely oriented. All impactorshad axial orientation. Details for the five experiments are given in Table 1, and a schematic of theexperimental set-up is shown in Fig. 2. The WHA impactor was mounted on a TPX (polymethylpentene)layer to give a nearly complete unloading, and that in turn was mounted on the front of an aluminumprojectile. Projectile velocities were measured to better than 0.5% by means of three shorting pinsof different heights, and tilts were determined through four pins distributed around the circumferenceof the sample. In all cases except experiment WHA-5 the tilt was less than 0.5mrad. In experimentWHA-5, it appeared that there was separation of the WHA impactor from the projectile sometime prior toimpact since the tilt pins indicated only a small tilt but the line-VISAR streaks indicated significant tilt;also, the impactor may not have been entirely planar, perhaps due to bowing. The back surface of the targetwas diamond turned and then diffused with glass beads to facilitate good reflectance for the line-VISARsystem used to monitor the velocity. Following the experiment, debris was collected for metallographicanalysis, which will be reported separately in the future. It should be noted that no special precautionswere taken to ensure ‘‘soft’’ recovery of the sample since it will inevitably strike the reflecting mirror of theline-VISAR.
Table 1
Details of plate impact experiments
Expt. Sample orient. Impactor/target thickness (mm) VI (km/s) HEL (GPa) Usp (km/s) sh (GPa) rh (g/cm3)
WHA-1 Axial 1.54/3.07 0.249 2.54 4.20 �9.63 18.27
WHA-2 Axial 1.54/3.06 0.345 2.40 4.27 �13.35 18.48
WHA-3 Transverse 1.47/2.96 0.246 0.83 4.20 �9.31 18.30
WHA-4 Transverse 1.48/2.95 0.347 4.09 4.10 �13.16 18.53
WHA-5 Transverse 1.48/2.95 0.426 2.86 4.06 �15.81 18.73

ARTICLE IN PRESS
TPXpr
ojec
tile
WHA
velocity and tilt pins
line-VISARillumination
Fig. 2. Set-up for plate impact experiments.
T.J. Vogler, J.D. Clayton / J. Mech. Phys. Solids 56 (2008) 297–335 303
3. Modeling approach
Essential features of the constitutive models for tungsten and binder phases are given here, followed by abrief description of the cohesive fracture model used for describing failure along internal material interfaces.Descriptions of the numerical simulations are then provided. The reader is referred to Clayton (2005a, b) forfurther details, including values of parameters.
3.1. Crystal plasticity theory
A finite deformation, rate-dependent crystal plasticity model is used to capture the thermomechanicalbehavior of the tungsten crystals and W–Ni–Fe binder phase. The same model framework, albeit withdifferent parameters, is used for each material.
Denoted by x ¼ xðX; tÞ is a smooth time-dependent motion, where x and X are spatial and referencecoordinates, respectively. The local deformation gradient f is decomposed as
f �@x
@X¼ fefhfp, (1)
where fe, fh, and fp denote the kinematics of elasticity and rigid-body rotation, stress-free thermal expansion orcontraction, and the cumulative contribution of moving crystal defects. The plastic velocity gradient in theintermediate configuration is defined as
lp� _f
pfp�1 ¼
Xn
a¼1
_gðaÞsðaÞ0 �mðaÞ0 , (2)
with _gðaÞ the shearing rate on slip system a, and n the number of potentially active slip systems, each with slipdirection s and slip plane normal m.
Local balance laws in the spatial configuration are
_rþ r tr lð Þ ¼ 0; divrþ rb ¼ r €x; r ¼ rT; r_eþ div q ¼ trðrlÞ, (3)
with r, l, r, b, e, and q denoting the current mass density, spatial velocity gradient, Cauchy stress tensor, bodyforce vector per unit mass, internal energy per unit mass, and heat flux vector per unit current area,respectively. The local entropy inequality is written as
r_ZX� div q=y� �
, (4)

ARTICLE IN PRESST.J. Vogler, J.D. Clayton / J. Mech. Phys. Solids 56 (2008) 297–335304
with _Z the time rate of entropy production per unit mass, y the absolute temperature, and div the spatialdivergence. The Helmholtz free energy per unit mass is of the functional form
c ¼ c ee; y; xð Þ, (5)
where the intermediate configuration elastic strain 2ee ¼ feTfe � 1. The symbol x denotes a dimensionlessscalar internal variable representing stored micro-elastic energy associated with crystal defects. FromEqs. (2)–(5), one may deduce the following constitutive relationships:
se ¼ ~r@eec, (6)
Z ¼ aTtrðrÞ=r� @yc, (7)
Xn
a¼1
tðaÞ _gðaÞ � r @xc� �
_xXqdrxy
y, (8)
where aT is the coefficient of isotropic thermal expansion, the elastic second Piola–Kirchhoffstress seð Þab � jef e�1a
a sabfe�1bb with je � ~r=r ¼ det fe; and the resolved shear stress tðaÞ � r : ðsðaÞ �mðaÞÞ.
The spatial gradient is written as rx: Isotropic heat conduction in the spatial frame is dictated by Fourier’slaw:
q ¼ �krxy, (9)
with kðx; yÞ the spatial thermal conductivity. Defining the specific heat capacity c � @ye, the local energybalance can be written as
rc_y|{z}temperature change
¼Xn
a¼1
tðaÞ _gðaÞ|fflfflfflfflfflffl{zfflfflfflfflfflffl}plastic dissipation
� r @xc� �
� y @yxc� �� �
_x|fflfflfflfflfflfflfflfflfflfflfflfflfflfflfflfflfflffl{zfflfflfflfflfflfflfflfflfflfflfflfflfflfflfflfflfflffl}energy of lattice defects
þ ry@yeec: _ee|fflfflfflfflfflfflffl{zfflfflfflfflfflfflffl}thermoelastic coupling
þ div krxyð Þ|fflfflfflfflfflffl{zfflfflfflfflfflffl}heat conduction
. (10)
The subsequent discussion pertains specifically to the cubic metallic materials (i.e., phases of tungsten alloy)of interest. A free energy potential per unit intermediate configuration volume is specified as
~rc ¼ K0 yð ÞW2=2� K1W3=3þ m yð Þee
0
: ee0
þ km yð Þx2=2þ z yð Þ, (11)
where W � tr eeð Þ measures the elastic volume change, K0, K1, and m are elastic stiffness coefficients and k is adimensionless scalar. The deviatoric elastic strain tensor is defined by ee
0
� ee � W=3� �
1, and z yð Þ accounts forthe purely thermal energy.
The time rate of plastic deformation within each phase of the bulk material follows from
_gðaÞ ¼ _g0 ~tðaÞ=gðaÞ
� �hsgn ~tðaÞ� �
. (12)
Above, _g0 and h are material parameters, gðaÞ is the slip or shearing resistance, ~tðaÞ � jetðaÞ, and sgn xð Þ ¼ x= xj j,with sgn 0ð Þ ¼ 1. Thermal softening at high temperatures is incorporated via
gðaÞ ¼ gðaÞ0 y=y0� �r
, (13)
with gðaÞ0 the flow resistance at reference temperature y0 and r a dimensionless constant. The following
relationship is assumed between hardening and internal variable x ¼ bffiffiffiffiffiffirTp
:
1
n
Xn
a¼1
gðaÞ0 � gðaÞy
� �¼ amðy0Þx, (14)
with gðaÞy an initial yield stress, b the magnitude of the Burgers vector in the reference lattice, and rT the totaldislocation line length per unit intermediate configuration volume. The scalar a accounts for dislocationinteractions, while both lattice friction stress and effects of initial dislocation density are incorporatedin the initial yield stress gðaÞy . Evolution of slip resistance at reference temperature y0 is dictated by

ARTICLE IN PRESST.J. Vogler, J.D. Clayton / J. Mech. Phys. Solids 56 (2008) 297–335 305
a hardening-minus-dynamic-recovery relation:
_gðaÞ0 ¼ AXn
b¼1
qab _gðbÞ�� ��� Bg
ðaÞ0
Xn
b¼1
_gðbÞ�� ��; qa
b ¼ dab þ qð1� dabÞ, (15)
where q is the latent hardening ratio in the interaction matrix qab. Specifically for pure W grains, slip occurs in
the 1 1 1h i directions on any of the 1 1 0f g and 1 1 2f g families of planes, meaning the number of potentiallyactive slip systems is n ¼ 24. In the W–Ni–Fe binder phase, the number of potentially active slip systems isn ¼ 12. Dislocations are assumed to glide in 1 1 0h i directions on 1 1 1f g planes for this FCC metal.
3.2. Interfacial fracture model
In the model exercised here, fractures may occur along W–W grain boundaries and W–matrix boundaries inthe two-phase alloy. Intragranular cleavage and separation at matrix–matrix grain boundaries are notrepresented.
Fracture surfaces initiate at interfaces when the traction resolved on the potential initiation site exceeds theintrinsic temperature-dependent strength of the interface:
s ¼ s0 þ s1 y� y0ð Þ; t ¼ t0 þ t1 y� y0ð Þ, (16)
where s and t are the resolved normal traction and shear traction on the interfacial surface, per unit referencearea, and s0 and t0 are material parameters. Linearly temperature-dependent initiation strengths—capturingductile–brittle transitions, for example—are captured by nonzero values of s1 and t1, and mixed-modeinitiation criteria are specified by the ratio s0=t0 .
Degraded material at cohesive interfaces, subsequently following fracture initiation, supports local stressesdecaying with separation distance as follows:
s ¼ s0 þ s1 y� y0ð Þð Þ 1�dndc
ðloadingÞ;
s ¼ s0 þ s1 y� y0ð Þð Þ 1�dn1dc
dndn1
; ðunloadingÞ; ð17Þ
t ¼ t0 þ t1 y� y0ð Þð Þ 1�dtj jdc
1�
dnh idc
sgn dtð Þ ðloadingÞ;
t ¼ t0 þ t1 y� y0ð Þð Þ 1�dt1j jdc
1�
dnh idc
dtdt1j j
ðunloadingÞ; ð18Þ
with dn and dt the normal and tangential crack openings, dn1 and dt1 the maximum values of dn and dt achievedover the deformation history, and dc a material parameter describing the separation distance beyond which thecohesive interface no longer supports loading. The Macaulay bracket is defined by the operation 2 xh i ¼
xþ xj j . Interface properties used in the simulations, including fracture energies at y ¼ y0 for pure normal (gn)and pure tangential separation (gs) are listed in Table 2. As discussed in Clayton (2005b), the choice of
Table 2
Properties for interfacial fracture
Parameter Value
s0 (GPa) 2.0
s1 (GPa/K) 0.01
t0 (GPa) 4.0
t1 (GPa/K) 0.01
dc (mm) 1.0
gn (kJ/m2) 1.0
gs (kJ/m2) 2.0

ARTICLE IN PRESST.J. Vogler, J.D. Clayton / J. Mech. Phys. Solids 56 (2008) 297–335306
relatively large mode II toughness, t0=s0 ¼ 2, prevented shear failure from occurring during propagation ofthe compressive pulse. Note that in what follows, the same fracture model and parameters are used to modelintergranular fracture along W–W boundaries and interphase fracture at W-binder interfaces.
3.3. Numerical simulations
Constitutive models presented for bulk and interfacial responses, respectively, were implemented within anexplicit Lagrangian finite element solver (Clayton, 2005b; Johnson et al., 2001). Two-dimensional calculationswere conducted, with microstructures for meshing obtained from cross-sectional samples of a KE rod of theWHA material as shown in Fig. 1(a). Fields-of-view from three different microstructures were considered, asshown in Fig. 3, each a square window of size L ¼ 150 mm. The microstructure exhibiting nearly equiaxedgrains is labeled transverse-1, whereas those with elongated grains are labeled axial and transverse-2,respectively. Note from the left image in Fig. 1(a) that the line-VISAR system is oriented perpendicular to themajor axis of the ellipsoidal grains in microstructure axial. Microstructure transverse-2 was obtained byrotating the axial microstructure 901 clockwise. Realistic lattice orientations depending upon spatial locationwere obtained from EBSD measurements performed on the samples and were used as initial conditions in thesimulations. It is expected that there would be some variation in microstructures reconstructed from EBSDmeasurements of other regions of the sample of material, but a comprehensive treatment of such variation isnot considered in the current work. However, the initial lattice orientations used in the numerical simulationswere representative subsets of those shown in Fig. 1(b); i.e., inverse pole figures for lattice orientations used inthe simulations (not shown) appeared very similar to those in Fig. 1(b). Small gradients in initial latticeorientations within grains, evident in Fig. 1(a), were captured; i.e., grains were not initially homogeneous. Themeshes of triangular elements conform to the microstructure and are selectively refined in the vicinity of grainand phase boundaries to better resolve fracture surfaces.
In Fig. 3 and henceforth, in-plane spatial coordinates will be denoted by the conventional notation x ¼ x1
and y ¼ x2. Analyses were plane strain in the x–y plane, representing columnar polycrystals extended infinitelyin the out-of-plane direction. Out-of-plane elastic and plastic deformations were permitted so long as the totaldeformation field remained planar. The lower and upper edges of the domain are denoted by referencecoordinates Y ¼ X 2 ¼ 0 and Y ¼ X 2 ¼ L, respectively. Left and right edges are denoted by X ¼ X 1 ¼ 0 andX ¼ X 1 ¼ L, respectively. Velocity initial and boundary conditions were prescribed as
_xjX¼0 ¼
0:5V I t=10�9 s� �
for 0ptp10�9 s;
0:5V I for 10�9 spt � 10�8 s;
0:5V I 1:1� 10�8 s� �
� t� �
=10�9 s� �
for 10�9 sptp10�8 s;
0 for tX 1:1� 10�8 s� �
:
8>>>>><>>>>>:
(19)
Above, VI is the impact velocity. The factor 0.5 arises since in the corresponding experiments, the particlevelocity of the shocked material is half of the impact velocity due to symmetry between the impactor and
Fig. 3. Finite element meshes used in simulations.

ARTICLE IN PRESS
Table 3
Numerical simulations
Simulation Orientation VI (m/s)
WHA-I Axial 350
WHA-II Transverse-1 350
WHA-III Transverse-2 250
WHA-IV Transverse-2 350
WHA-V Transverse-1 450
T.J. Vogler, J.D. Clayton / J. Mech. Phys. Solids 56 (2008) 297–335 307
target materials. Note, however, that velocity boundary conditions (19) are not completely analogous to thoseof the two-body plate impact experiment, as will be apparent later upon examination of the local stress fieldsand free-surface velocities, for example. Conditions (19) result in a rightward-moving compressive pulse ofapproximate duration 9 ns. Additionally, boundaries along Y ¼ 0 and Y ¼ L were free of shear stress but fixedin the y-direction, providing uniaxial conditions for in-plane strains, i.e.:
tx ¼ sxyny ¼ 0
_y ¼ 0along
Y ¼ 0;
Y ¼ L:
(20)
Note that in plate impact experiment the macroscopic state of strain is uniaxial (i.e., no out-of-planedeformation), but local heterogeneities may induce out-of-plane deformations at the mesoscale. In thesimulations, the right boundary was traction free, i.e., sabnb ¼ 0 alongX ¼ L for tX0, mimicking the freesurface at which the line-VISAR measurements are made. Null heat flux conditions were enforced along theexternal boundaries, with a uniform initial temperature y0 ¼ 300K. Note that the present set of boundaryconditions does satisfy periodicity in the y-direction, i.e., y Y ¼ 0ð Þ ¼ yðY ¼ LÞ ¼ 0.
Results from five spall simulations are discussed in Section 5. These are labeled with Roman numerals inTable 3 to distinguish them from the corresponding experiments labeled by number in Table 1. Parametersused in each simulation, specifically orientation of microstructure (Fig. 3) and impact velocity of Eq. (19), areshown in Table 3. Note that orientations axial and transverse-1 correspond to 2D projections of those grainorientations investigated in the experiments. Note also that numbers and numerals in Tables 1 and 3,respectively, differ in some cases with regards to microstructures and impact velocities for experiments 1–5 andsimulations I–V. Some caution must be used when comparing results of 2D simulations with 3D experiments.For example, the in-plane microstructures used in experiments 3 and 4 (transverse-1), and simulations III andIV (transverse-2), differ visibly. However, effects of microstructure on spall fracture could be consideredsimilar among these experiments and simulations, since all present relatively large grain boundary areas perunit volume perpendicular to the x-direction. This is in contrast to experiments 1 and 2 (Axial) andsimulations I, II, and V (axial or transverse-1), which present relatively less grain boundary area per unitvolume oriented nearly perpendicular to the loading direction.
4. Experimental results
The output of the line-VISAR was recorded on a Hadland Imacon 792 streak camera (experiments WHA-1and 2) or a Hamamatsu H7700 streak camera (experiments WHA-3, 4, and 5). An example streak record isshown in Fig. 4. The vertical axis corresponds to position across the sample, while the horizontal axis is time t.Analyses were conducted as detailed previously (Trott et al., 2001) to yield velocity measurements at eachbright line of the streak as well as three others equally spaced between the bright lines. In some cases, smallamounts of data from the edge of the streak were discarded due to decreased image contrast or excessive noise.The result was a large set of free-surface velocities, up ¼ _xjX¼L, parameterized by time and position y acrossthe sample. Small time corrections were made in the results to account for impactor tilt. This correction wasdone based upon a few contours of constant velocity in the middle of the initial shock wave. A time shift thatwas linear with position was performed so that these contours could be associated with constant arrival times.

ARTICLE IN PRESS
0
1
2
3
0
2000
4000
60000
0.1
0.2
0.3
0.4
up (
km
/s)
t (μs)y (μm)
Fig. 5. Free-surface velocity history for experiment WHA-2.
Fig. 4. Streak camera record from line-VISAR for experiment WHA-2.
T.J. Vogler, J.D. Clayton / J. Mech. Phys. Solids 56 (2008) 297–335308
The spatial resolution of the line-VISAR system as configured in these experiments was approximately 70 mm,meaning that the local free-surface velocities were recorded in 70 mm-spaced intervals in the y-direction.
4.1. Spatially resolved velocity measurements for experiment WHA-2
The results of one experiment, WHA-2, are examined here in detail and viewed in a variety of ways. Later,the results from all experiments will be analyzed and compared. The free surface velocity for test WHA-2 isplotted as a surface in y–t space in Fig. 5. While it is difficult to see features of the initial shock in this view, theinitial flat top for the shocked state and the subsequent spall pullback signature are readily apparent. One canalso clearly see variations in velocity along the y-direction.
By spatially averaging the measurements along the free edge at each time instant, an average particlevelocity up can be found as
up ¼1
L
Z_xjx¼L dy, (21)
as shown in Fig. 6. In previous investigations of sugar (Trott et al., 2001, 2007a) and HMX (Trott et al., 2002),this average has been shown to have the same shock arrival and rise time as a conventional point VISAR

ARTICLE IN PRESS
0 1 2 30
0.1
0.2
0.3
0.4u
p (t)
10*S(up(y,t))u
p (
km
/s)
t (μs)
Fig. 6. Free-surface velocity history for experiment WHA-2: spatial average (black), spatial variation (red), and standard deviation
(blue, magnified10� ).
T.J. Vogler, J.D. Clayton / J. Mech. Phys. Solids 56 (2008) 297–335 309
measurement, but significant variations between the two measurements were found after the shock arrival.Since it is difficult to correlate impact time to the VISAR measurement, the time of the records is adjusted sothat the base of the average curve arrives at the measured ultrasonic sound speed of the material. Therefore, inFig. 5 and subsequent plots, t ¼ 0 corresponds to the instant of impact. From the average velocity history, it ispossible to see the ramping elastic foot in front of the main shock wave consistent with previous VISARmeasurements on WHA (Bless and Chau, 2006; Dandekar and Weisgerber, 1999). The elastic ramp is followedby a plastic (bulk) wave that also has a finite rise time. The bulk wave is followed by a region over which theparticle velocity is relatively constant. At about 1.2 ms after impact, the particle velocity decreases as unloadingwaves arrive from the back of the impactor. Eventually, the interaction of unloading waves leads to tensilefailure of the sample (spall), which appears as the increase in particle velocity as the fractured materialaccelerates relative to the remainder of the sample. Spall will be discussed in detail in Section 4.3. Theremainder of the velocity record consists of wave reverberations within the spalled material with a period ofslightly less than 1 ms.
The variation in particle velocity is illustrated in two ways in Fig. 6. First, the range of data obtained isshown as the colored (red) band above and below the average value. In general, the width of this band isnearly constant, though it is nearly invisible in the first shock. Second, the standard deviation of the velocities,S(up(y,t)), for a given time (scaled by a factor of 10 for clarity) is shown in blue. The velocity distributions foreach time are relatively normal in character, though for 20–40% of the data after the initial arrival of the wavea normal distribution does not describe the data well as the null hypothesis can be rejected at the 95%confidence level based on the w2 test. For this experiment, the standard deviations are nearly invariant withrespect to time except at the initial shock front. There, relatively small differences in the arrival time of thewave can result in fairly large deviations from the average. This behavior is quite similar to that seen inexperiments on sugar (Trott et al., 2007a) except the peak to plateau ratio is 4–5 for sugar and 2–2.5 in thisexperiment. The variations in particle velocity prior to arrival of the main shock provide an indication of thenoise inherent in the line-VISAR. The baseline variation is 10–20% of the steady-state variation.
Temporal variations in the arrival of the initial shock wave can be seen more readily by viewing velocitycontours in the y–t plane as shown in Fig. 7. The contours are clearly variable across the width of thespecimen, with the variation being largest for low (0.05 km/s) and high (0.30 km/s) velocity contours.Variability at the low velocity is likely due to local differences in matrix concentration or crystallographicorientation of the grains. The variation at the higher velocity is only larger in the region of y ¼ 0–1000 mm. Forcontours between these extremes, the spatial variation is comparable. In general, these variations have periods
ARTICLE IN PRESS
0
2000
4000
6000
0.6 0.7 0.8
y (
μm)
t (μs)
0.0
5
0.1
5
0.2
5
0.3
0
0.2
0
0.1
0 up (km/s)
Fig. 7. Contours of constant free-surface velocity of shock front in y– t plane for experiment WHA-2.
0
1
2
3
0
2000
4000
6000
0
20
40
60
δup (
m/s
)
t (μs)y (μm)
Fig. 8. Perturbations of free-surface velocity for experiment WHA-2.
T.J. Vogler, J.D. Clayton / J. Mech. Phys. Solids 56 (2008) 297–335310
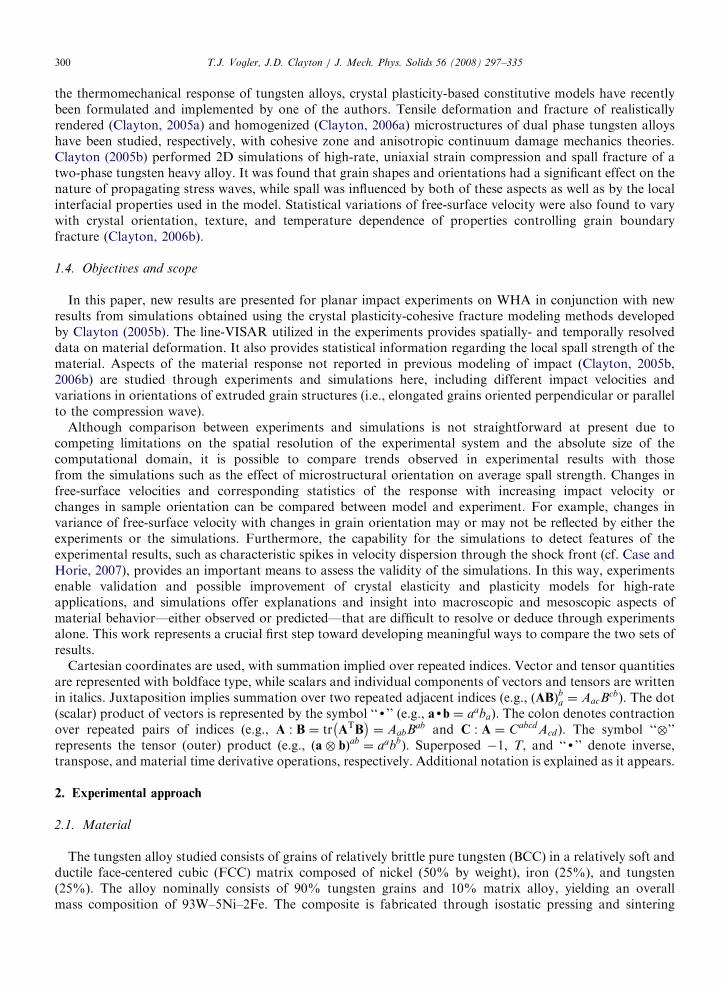
on the order of 1mm, significantly larger than the sizes of individual grains. Thus, the variations are thoughtto be caused by variations in elastic and plastic properties of ensembles of grains for some depth below the freesurface at which measurements are made.
By subtracting the spatially averaged velocity of Fig. 6 from the local velocities in Fig. 5, i.e.,
dupðy; tÞ ¼ upðy; tÞ � upðtÞ, (22)
we obtain the spatially resolved velocity deviations (dup) shown in Fig. 8. Significant peaks and valleys exist,especially near the arrival of the first shock, but dominant spatial and temporal scales in the velocity deviationsare absent, in contrast to those previously observed in shock-loaded boron carbide (Vogler et al., 2004).
4.2. Effect of impact velocity and sample orientation
Effects of impact velocity and sample orientation can be deduced from the spatially averaged free-surfacevelocities shown in Fig. 9. As the impact velocity increases, the rise time for the main (bulk) shock wave

ARTICLE IN PRESS
0
0.1
0.2
0.3
0.4
0.5
0 1 2 3
t (μs)
5.19 km/s (ultrasonic)
Hugoniot Elastic Limit
Δufs
Axial
Transverse
Imp
act
Ve
locity (
m/s
)
250
350
450
up (
km
/s)
Fig. 9. Spatially averaged free-surface velocity histories for all experiments.
0
10
20
30
0 1 32
t (µs)
VI = 350 m/s
Axial
Transverse
S(u
p)
(m/s
)
VI = 250 m/s
Fig. 10. Standard deviation in free-surface velocities for experiments WHA 1-4.
T.J. Vogler, J.D. Clayton / J. Mech. Phys. Solids 56 (2008) 297–335 311
decreases as expected, but the transversely oriented samples have longer rise times than axially oriented ones.The edges of the plateau velocity region are more rounded for the transverse samples, and, although notvisible in this figure, the elastic foot is more spread out for the transverse samples. The pullback associatedwith spall is somewhat smaller for the transverse experiments, as is ringing in the spalled plate.
The standard deviations of velocity versus time for experiments 1–4 are compared in Fig. 10. As seenpreviously in Fig. 6 for WHA-2, a significant peak in the velocity dispersion occurs at the shock front.This peak is about 25m/s for impacts at 350m/s versus about 15m/s for 250m/s impacts, with somewhathigher peaks for the transverse samples. After the peak, a plateau in dispersion exists until about 1.2 ms,with the value of the plateau of the 250m/s experiments about half that of the 350m/s experiments.This time (1.2–1.3 ms) corresponds to the decrease in particle velocity associated with unloading(the pullback signature). The dispersion of the experiments with 250m/s impact velocity then increases to

ARTICLE IN PRESS
0
2000
4000
6000
0 0.05 0.1
Axial
Transverse
VI = 350 m/s
VI = 250 m/sy (
μm)
t-arbitrary (μs)
Fig. 11. Contours of constant free surface velocity (VI/2) of shock front in y– t plane for experiments WHA 1-4.
T.J. Vogler, J.D. Clayton / J. Mech. Phys. Solids 56 (2008) 297–335312
about 10m/s, while the dispersion levels in experiments of 350m/s impact velocity remain constant or increaseonly slightly.
As was the case for WHA-2 (Fig. 8), contours of the velocity at the shock front are non-uniform forexperiments 1–4 as shown in Fig. 11. The contours shown are of constant free-surface velocities equal to halfthe impact velocity (i.e., 125m/s and 175m/s). The fluctuations in the contours decrease for the higher impactvelocity (350m/s), consistent with the decreasing rise times that occur for the spatially averaged responses. Infact, the local variations in the front contribute significantly to the rise time for the averaged response. Thefluctuations are also higher and the contours more jagged for transverse than for the axial experiments at thesame impact velocity. Standard deviations, St, for the temporal positions of the contours are 6.0, 3.8, 10.1, and5.9 ns for WHA-1 to WHA-4, respectively. For both sample orientations, the ratio of St for experiments at350m/s to those at 250m/s is approximately 0.6, suggesting a scaling that is invariant to orientation.Approximately, the same ratio is found when comparing St for axial and transverse samples.
4.3. Hugoniot results
The macroscopic deformations of the WHA samples were determined from the average free-surface velocityhistories using the Rankine–Hugoniot jump conditions for conservation of mass and momentum across asteady wave, though the steadiness of the waves has not been verified experimentally. Because the shock waveseparates into elastic and plastic components, it must be analyzed in two steps as described, e.g., in Vogleret al. (2004). In all cases, impact was assumed to be symmetric so that the particle velocity of the shockedmaterial is half of the impact velocity. This assumption is acceptable since the macroscopic mechanicalresponses of the longitudinal impactors and transverse samples are roughly equivalent. The Cauchy stress(s ¼ s11)�volumetric strain (� ¼ r0=r� 1) behavior for the current experiments, along with that fromDandekar and Weisgerber (1999), are shown in Fig. 12 and listed in Table 1. The current results agree with theearlier results except for experiment WHA-5, which is probably due to the aforementioned difficulties withthat experiment affecting the accuracy of that measurement. For the other impact velocities, the macroscopicresponses of the transverse samples were slightly more compliant than their longitudinally orientedcounterparts, possibly a result of anisotropic work hardening during processing or grain elongation in thelongitudinal direction. The HEL deduced from the average free-surfaces velocities for the five currentexperiments varies widely. This is largely due to the spread out nature of the elastic wave and lack of a distinctbreak associated with yielding. Indeed, after consulting individual velocity records from a given experiment, awide range of waveforms was observed. This variability may be due to fluctuations in phase composition or

ARTICLE IN PRESS
-20
-10
0
-0.06-0.04-0.020
current results
Dandekar & Weisgerber, 1999
σ (G
Pa
)
ε
Fig. 12. Overall compressive stress-engineering strain response showing elastic limit (HEL) and Hugoniot states for current experiments
and from Dandekar and Weisgerber (1999).
T.J. Vogler, J.D. Clayton / J. Mech. Phys. Solids 56 (2008) 297–335 313
grain orientations among vicinities where local measurements were made. The average of the value of the HELfor all five experiments is 2.5GPa, with most of the values close to that. This is in reasonably good agreementwith the value of 2.76GPa obtained previously for a similar material (Dandekar and Weisgerber, 1999).
Recall from Fig. 1(b) that the microstructures exhibited a slight preference for alignment of /1 1 0S axes inthe W grains in the direction of extrusion, i.e., along the x-axis in the axial samples and along the z-axis(out-of-plane) in the transverse samples. Zhou (1993) found that cross rolling increased the flow stress ofWHA under high pressure–shear loading (at nominal shear strain rates on the order of 103 s�1), thoughcrystallographic textures were not discussed explicitly in that investigation. Subhash et al. (1994) found thatpure polycrystalline W samples with preferred /1 1 0S orientations tended to be somewhat more compliantunder high-rate compressive loading (at strain rates up to the order of 104 s�1) than those with preferred/1 0 0S orientations. In the present work, on the other hand, a slight decrease in compliance of the axialoriented samples (i.e., higher value of sh in Table 1) containing a preference for /1 1 0S texture was found.The role of crystallographic texture on the flow stress of the FCC binder phase has not, to the authors’knowledge, been investigated experimentally. However, as will later be demonstrated in the simulations, muchof the plastic deformation occurring during impact loading appears to be accommodated by the more ductilebinder phase, and hence the inelastic behavior of the binder may strongly influence the overall response of thecomposite.
4.4. Statistics of spall strength
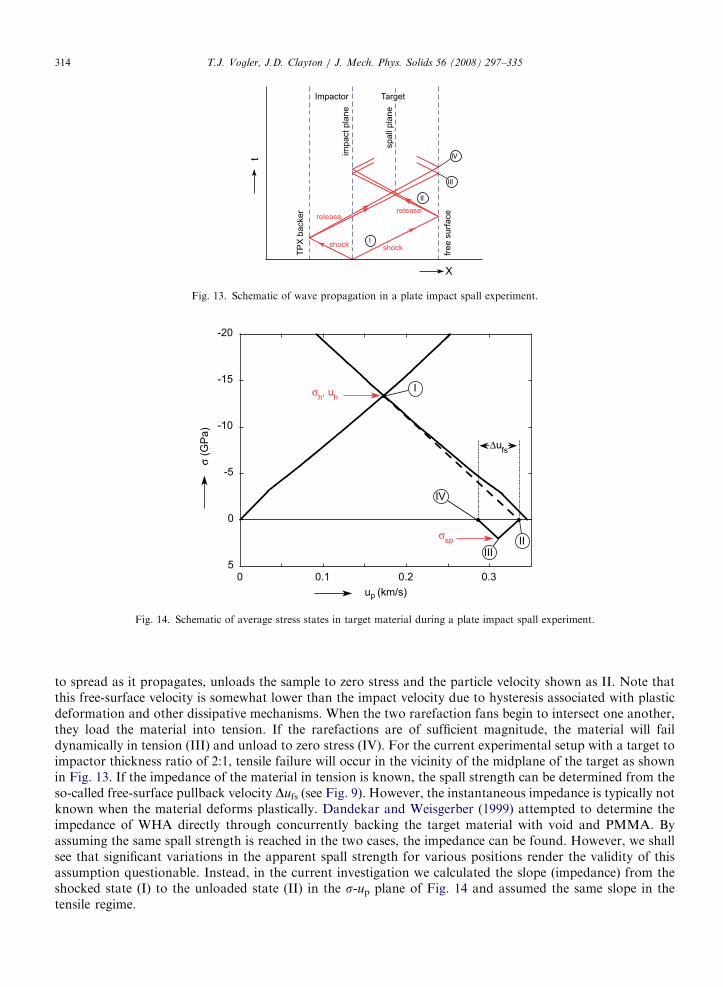
Dynamic tensile failure in uniaxial strain loading, typically referred to as spall or spallation, frequentlyoccurs in impact events, including the current plate impact experiments. A thorough discussion of spallphenomena can be found in Antoun et al. (2003). The spall strength of a similar variety of WHA to thatcurrently studied has been measured to be 1.7–2.0GPa (Dandekar and Weisgerber, 1999). In a typical spallexperiment, impact sends a shock wave (or elastic and plastic waves, depending upon stress level) throughboth the target and impactor. Propagation of these and subsequent waves is shown schematically in Fig. 13,and the states of the material in the stress–particle velocity plane are shown in Fig. 14. The initial shockedstate, defined by stress and particle velocity sh and uh ¼ 0.5VI, is labeled as I in this figure. When thecompression waves reach the back of the target, a stress-free surface, and the back of the impactor, which hasa low-impedance material against it, most or all of the wave reflects as an unloading wave. This unloadingwave from the free surface at the back of the target, also referred to as a rarefaction fan because of its tendency
ARTICLE IN PRESS
t
Impactor Target
TP
X b
acker
free s
urf
ace
impact pla
ne
spall
pla
ne
releaserelease
shock shock
X
Fig. 13. Schematic of wave propagation in a plate impact spall experiment.
-20
-15
-10
-5
0
50 0.1 0.2 0.3
sp
ufs
h, u
hI
IV
IIIII
σ (G
Pa)
up (km/s)
Fig. 14. Schematic of average stress states in target material during a plate impact spall experiment.
T.J. Vogler, J.D. Clayton / J. Mech. Phys. Solids 56 (2008) 297–335314
to spread as it propagates, unloads the sample to zero stress and the particle velocity shown as II. Note thatthis free-surface velocity is somewhat lower than the impact velocity due to hysteresis associated with plasticdeformation and other dissipative mechanisms. When the two rarefaction fans begin to intersect one another,they load the material into tension. If the rarefactions are of sufficient magnitude, the material will faildynamically in tension (III) and unload to zero stress (IV). For the current experimental setup with a target toimpactor thickness ratio of 2:1, tensile failure will occur in the vicinity of the midplane of the target as shownin Fig. 13. If the impedance of the material in tension is known, the spall strength can be determined from theso-called free-surface pullback velocity Dufs (see Fig. 9). However, the instantaneous impedance is typically notknown when the material deforms plastically. Dandekar and Weisgerber (1999) attempted to determine theimpedance of WHA directly through concurrently backing the target material with void and PMMA. Byassuming the same spall strength is reached in the two cases, the impedance can be found. However, we shallsee that significant variations in the apparent spall strength for various positions render the validity of thisassumption questionable. Instead, in the current investigation we calculated the slope (impedance) from theshocked state (I) to the unloaded state (II) in the s-up plane of Fig. 14 and assumed the same slope in thetensile regime.

ARTICLE IN PRESST.J. Vogler, J.D. Clayton / J. Mech. Phys. Solids 56 (2008) 297–335 315
The results for experiment WHA-2 are first examined in detail, and then differences between this test andthe other experiments are considered. The average peak particle velocity u1, the pullback velocity u2, and theirdifference Dufs are shown versus position y in Fig. 15. Clearly, the pullback velocity varies considerably withposition in the sample. Utilizing the unloading slope, Ut, as described above, the local spall strength can becalculated as
ssp ¼ r0U tDufs=2. (23)
The impedance r0Ut assumed for this experiment of 82 Gg/m2 s is higher than the range of 64–76Gg/m2 sfound by Dandekar and Weisgerber (1999) but lower than the value of 92 Gg/m2s one would use if an elasticwave were assumed. The probability distribution of these spall strengths is shown in Fig. 16. The average
0
0.1
0.2
0.3
0.4
0 2000 4000 6000
y (μm)
u1
u2
uFS
up (
km
/s)
Fig. 15. Spatially resolved peak particle velocity (u1-blue), pullback velocity (u2-red), and their difference (Dufs-black) for experiment
WHA-2.
0 1 2 30.0
0.5
1.0
average
Weibull fit
experimental data
Pro
ba
bili
ty
σsp (GPa)
Fig. 16. Probability distribution of spall strength and Weibull fit for experiment WHA-2.

ARTICLE IN PRESS
Table 4
Statistical parameters for experimental spall strengths
Expt. Ut (km/s) ssp up� �
(GPa) Normal distribution Weibull distribution
ssp (GPa) S(ssp) (Gpa) s0 (GPa) b
WHA-1 4.34 1.62 1.85 0.31 1.98 6.92
WHA-2 4.62 2.01 2.13 0.37 2.29 6.13
WHA-3 4.48 1.55 1.66 0.32 1.79 6.00
WHA-4 4.70 1.55 1.70 0.33 1.84 4.99
WHA-5 4.36 1.59 1.98 0.61 2.20 3.46
T.J. Vogler, J.D. Clayton / J. Mech. Phys. Solids 56 (2008) 297–335316
value of spall strength for this experiment is ssp ¼ 2.13GPa, somewhat larger than the spall strengthsspðupÞ ¼ 2.01GPa inferred from the spatially averaged particle velocity. The averaging of particle velocitiestends to smooth out local particle fluctuations so that u2 is higher and u1 is lower in the spatially averaged case.The standard deviation of the spall strengths for this experiment, S(ssp), is 0.37GPa. Such a large value mayexplain why significant variations are sometimes seen in spall experiments on the same material (Baopinget al., 1994; Bless and Chau, 2006; Dandekar and Weisgerber, 1999). As it is customary to represent reliabilityand strength of mechanical parts with Weibull distributions (Weibull, 1951), a Weibull fit to the spall data,performed using the maximum likelihood method (Bury, 1975), is also shown in Fig. 16. We note, though, thatthere is no statistical support for choosing a Weibull distribution over a normal distribution for this data. Thefirst Weibull parameter, s0, is close to the average, while the modulus, b, is 6.13. Weibull moduli of 5.5 forflexure and 6.9 for tension of sintered tungsten have been reported elsewhere (Margetson and Sherwood,1979). Recall that the lower the Weibull modulus b the greater the scatter in the data.
We note that Eq. (23) follows from the assumption of planar deformation in the sample, but this is clearlynot the case as illustrated in Figs. 7 and 11. Waves propagating through intact material develop non-uniformities due to the heterogeneous microstructure and material anisotropy, and the failure process itselfwill introduce additional deviations from planar behavior as failure occurs at different times and depths fordifferent positions in the tensile-loaded region. Since all materials with microstructure are expected to displaynon-planar shock waves and even single crystals will probably experience local differences in failure strengthdue to intragranular defects, all spall experiments are expected to have some degree of non-planarity.Nevertheless, spall strengths are inevitably calculated using Eq. (23) or some variant on it (Antoun et al., 2003;Baoping et al., 1994; Dandekar and Weisgerber, 1999), almost always with no knowledge or consideration ofnon-planarity. Thus, caution should be used in relating pullback velocities to the spall strength of the material,not only for the current investigation but for all spall experiments. Decoupling the effects on the distributionsdue to the two sources (initial microstructure and induced failure) is difficult, but some insight can be gainedfrom the current experiments and simulations.
Spall parameters obtained from all experiments are given in Table 4. The average spall strengths ssp fortransversely oriented samples (WHA-3 and 4, grains elongated perpendicular to the loading axis) are generally10–20% lower than for the axially oriented samples (WHA-1 and 2, grains elongated parallel to the loadingaxis) at the same impact velocity. A possible explanation for this effect, upon consideration of themicrostructure and numerical results, will be given later in Section 6. The standard deviation and Weibullmodulus, though, are about the same at 0.31–0.37GPa and 5–7, respectively, for all experiments exceptWHA-5, which exhibits more spatial variability. For reasons explained above, the spall strength from theaverage particle velocity, sspðupÞ, is always lower than the average spall strength ssp.
5. Numerical results
Recall that boundary conditions listed in Eq. (19) result in a compressive stress wave moving from left toright in the microstructure, i.e., the positive X-direction. This wave reflects off the free surface at X ¼ L ataround t ¼ 37 ns, producing a release wave and leading to initiation of spall at around t ¼ 40 ns.

ARTICLE IN PRESS
Fig. 17. Field variables for simulation WHA-III at t ¼ 40 ns (�initiation of spall): (a) pressure; (b) elastic energy density; (c) cumulative
plastic strain; and (d) dislocation density.
T.J. Vogler, J.D. Clayton / J. Mech. Phys. Solids 56 (2008) 297–335 317
5.1. Field variables and damage
Contour plots of Cauchy pressure p (mean stress), elastic energy density ce, cumulative plastic strain ep, anddislocation density rT are shown in Figs. 17 and 18 for simulations WHA-III and IV, respectively. Thesevariables are defined by
p ¼ �tr rð Þ=3, (24)
ce¼ K0 yð ÞW2=2� K1W
3=3þ m yð Þee0
: ee0
(25)
�p ¼
Z ffiffiffiffiffiffiffiffiffiffiffiffiffiffiffiffiffiffiffiffiffiffiffi2=3� �
dp: dpq
dt; dp ¼ sym lpð Þ, (26)
rT ¼ amðy0Þbnð Þ�1Xn
a¼1
gðaÞ0 � gðaÞy
� �" #2. (27)
ARTICLE IN PRESS
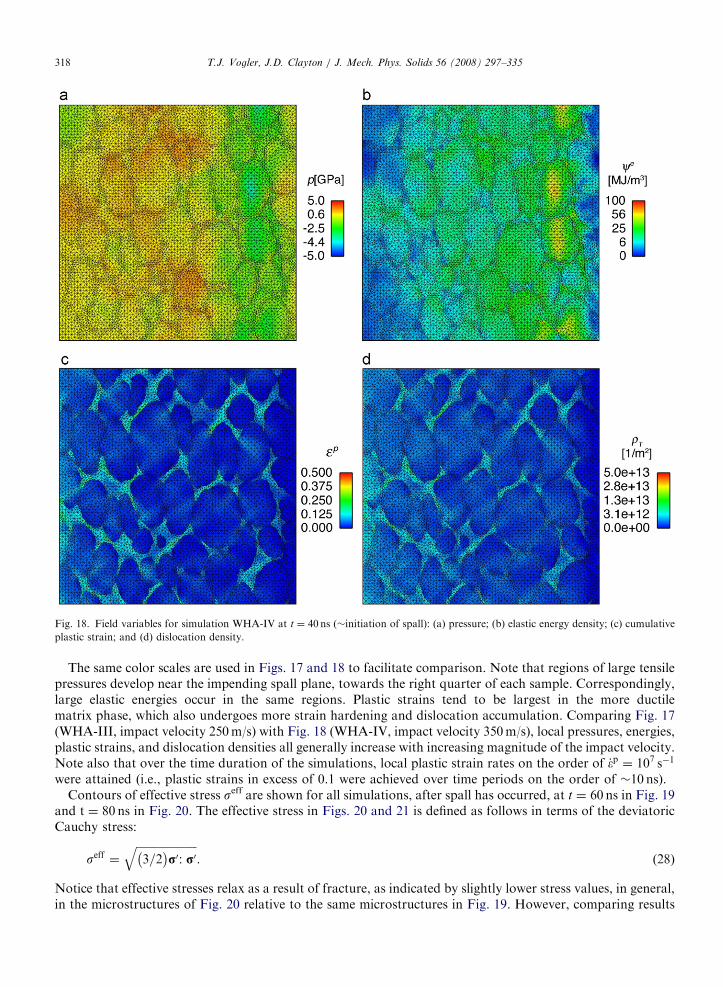
Fig. 18. Field variables for simulation WHA-IV at t ¼ 40 ns (�initiation of spall): (a) pressure; (b) elastic energy density; (c) cumulative
plastic strain; and (d) dislocation density.
T.J. Vogler, J.D. Clayton / J. Mech. Phys. Solids 56 (2008) 297–335318
The same color scales are used in Figs. 17 and 18 to facilitate comparison. Note that regions of large tensilepressures develop near the impending spall plane, towards the right quarter of each sample. Correspondingly,large elastic energies occur in the same regions. Plastic strains tend to be largest in the more ductilematrix phase, which also undergoes more strain hardening and dislocation accumulation. Comparing Fig. 17(WHA-III, impact velocity 250m/s) with Fig. 18 (WHA-IV, impact velocity 350m/s), local pressures, energies,plastic strains, and dislocation densities all generally increase with increasing magnitude of the impact velocity.Note also that over the time duration of the simulations, local plastic strain rates on the order of _�p ¼ 107 s�1
were attained (i.e., plastic strains in excess of 0.1 were achieved over time periods on the order of �10 ns).Contours of effective stress seff are shown for all simulations, after spall has occurred, at t ¼ 60 ns in Fig. 19
and t ¼ 80 ns in Fig. 20. The effective stress in Figs. 20 and 21 is defined as follows in terms of the deviatoricCauchy stress:
seff ¼ffiffiffiffiffiffiffiffiffiffiffiffiffiffiffiffiffiffiffiffiffiffi3=2� �
r0: r0q
. (28)
Notice that effective stresses relax as a result of fracture, as indicated by slightly lower stress values, in general,in the microstructures of Fig. 20 relative to the same microstructures in Fig. 19. However, comparing results

ARTICLE IN PRESS
Fig. 19. Effective stress near spall planes at t ¼ 60 ns from simulations: (a) WHA-I; (b) WHA-II; (c) WHA-III; (d) WHA-IV; and
(e) WHA-V.
T.J. Vogler, J.D. Clayton / J. Mech. Phys. Solids 56 (2008) 297–335 319
for the same microstructures conducted at different impact velocities, spall fracture tends to be more completeand more severe with increasing impact velocity, with larger local element distortion and generally larger crackopening displacements. For example, fracture is more severe in simulation WHA-V (450m/s) than WHA-II(350m/s), and is more severe in WHA IV (350m/s) compared to WHA-III (250m/s). Note that fracture occursmost readily for simulations of the transverse-2 microstructure, WHA-III and IV, with apparently the largestnumber of available grain boundary facets per unit area oriented nearly perpendicular to the wavepropagation direction. Also, notice that the spall fracture planes do not cut cleanly across the material, butrather ligaments of highly stretched material hold the sample together where insufficient grain boundary facets(i.e., cohesive finite elements in the numerical context) exist to propagate cracks across the domain.Presumably, in an actual material, cleavage fracture (absent in the present model) would facilitate completespall fracture of the sample. While the stress levels seen here are far below the ideal tensile strength (�30GPa)of a perfect tungsten lattice (Roundy et al., 2001), microscopic flaws within the W grains or along their edgesmay enable cleavage under the present loading conditions, particularly along 1 0 0f g and 1 1 0f g planes knownto be preferred orientations for grain cleavage (Gumbsch et al., 1998). Such flaws may be created duringprocessing or the initial shock loading of the material.
Two quantitative indicators of the degree of damage induced in the sample by micro-cracking are specifiedas follows:
G ¼X
j
l
ffiffiffiffiffiffiffiffiffiffiffiffiffiffiffid2n þ d2t
q jð Þ
; O ¼ A�1X
k
lð Þ kð Þ, (29)
where summation for G is invoked over j micro-crack segments of length l, with crack opening displacement
d ¼ffiffiffiffiffiffiffiffiffiffiffiffiffiffiffid2n þ d2t
q. For O, summation is invoked over k micro-cracks satisfying the fully opened criteria dXdc, and
A ¼ L2 is the area of the simulation domain. For purely normal separation, G is the 2-D analog of the totalvolume of free or void space in the sample produced during spall, and O is the scalar crack density (i.e., cracklength per unit area). As indicated by the value of G in Fig. 21(a), significant damage evolution commencesaround t ¼ 40 ns in all simulations. Damage accumulates at the slowest rates in simulations I and II, as can bededuced from visual inspection of Figs. 19 and 20. The largest crack opening displacements occur insimulations IV (elongated grains oriented perpendicular to loading at intermediate velocity of 350m/s) and V(equiaxed grains with highest impact velocity of 450m/s). As shown in Fig. 21(b), numerous cracks do not

ARTICLE IN PRESS
Fig. 20. Effective stress near spall planes at t ¼ 80 ns from simulations: (a) WHA-I; (b) WHA-II; (c) WHA-III; (d) WHA-IV; and
(e) WHA-V.
T.J. Vogler, J.D. Clayton / J. Mech. Phys. Solids 56 (2008) 297–335320
reach a fully opened state, dXdc, in the simulations until around t ¼ 50 ns. Also evident from Fig. 21(b), thelargest crack densities accumulate in simulations of microstructure Transverse-2, cases WHA-III and IV.Some crack closure occurs in simulation WHA-II, for example, as evidenced by fluctuations (in particular,small local reductions) in O with increasing simulation time.
5.2. Wave propagation and free-surface velocities
As was done for the experiments, free-surface velocity statistics are first investigated here in detail forone simulation (WHA-IV), then in general for all simulations. The free-surface velocity history, up y; tð Þ forWHA-IV is shown in Fig. 22. Note that the peak local free-surface velocity only reaches 311 m/s at t ¼ 36 ns,even though the impact velocity VI of Eq. (19) was 350m/s. This phenomenon is attributed to attenuation ofthe initial loading wave by the fixed boundary condition in (19) for t410 ns and energy dissipation frominelastic deformation during wave propagation. If the impact velocity were held fixed at 350m/s over the fullduration of the simulation, eventually the free surface would attain a rigid-body velocity of 350m/s once wavereflections were to subside. Spatial fluctuations in up with spacing on the order of the grain size, 10–30 mm, oreven smaller, are apparent in Fig. 22 and in the plot of the velocity perturbation dup y; tð Þ in Fig. 23. Significantfluctuations initiate at around 37 ns, when the maximum velocity is achieved at the free surface, and reachtheir largest magnitude around 45 ns (post spall). Contours of free surface-velocity in the y– t plane are shownin Fig. 24, analogous to the plot of experimental data in Fig. 7. Heterogeneities in the wave shapes on theorder of the grain size are apparent in the initial elastic wave (50m/s) and for low velocity contours(100–200m/s). Heterogeneity increases drastically as a result of heterogeneous plastic deformation at latertimes, i.e., for t434 ns.
Spatially averaged free-surface velocity histories, up, are shown in Fig. 25. Generally, the higher the impactvelocity is, the higher the peak velocity or maximum value of up is over the duration of the simulation, asexpected. Differences between average particle velocity curves corresponding to the same impact velocity aredue to differences induced by the microstructure. For example, localization and heterogeneous plastic strainlead to different peak velocities among simulations II and IV, while final velocities at t ¼ 80 ns differ due todifferent spall behavior. Note that nonzero free-surface velocities at late times are a result of the motion of theejected, separated, or spalled material. Standard deviations, SðupÞ in free-surface velocity are depicted inFig. 26. For a given microstructure, the higher the impact velocity, the greater the dispersion or variancein particle velocity. For example, compare WHA-III (generally lower S, impact velocity of 250m/s) with

ARTICLE IN PRESS
0
0.004
0.008
0.012
20 40 60 80
t (ns)
II
IV
III
V
I
0
400
800
1200
20 40 60 80
t (ns)
I
II
IV
III
V
Γ (μ
m2)
Ω (μ
m-1
)
Fig. 21. Cumulative damage from micro-cracking: (a) summed product of crack length and opening displacement and (b) density of fully
opened cracks (dXdc).
T.J. Vogler, J.D. Clayton / J. Mech. Phys. Solids 56 (2008) 297–335 321
WHA-IV (higher S, 350m/s), or WHA-II (lower S, 350m/s) with WHA-V (higher S, 450m/s). This result isexpected considering the character of the spall planes shown in Figs. 19 and 20. At a fixed velocity of 350 m/s,simulations with microstructure transverse-1 (WHA-II) tended to exhibit the smallest SðupÞ, perhaps becauseits nearly equiaxed grains produced the least spatial variation in response. Shown in Fig. 27 are contours ofconstant free-surface velocities for all simulations, analogous to the experimental data in Fig. 11. Here, tracesof constant velocity V I=2 are shown: 125m/s for WHA-III, 175m/s for WHA-I, II, and IV, and 225 m/s forWHA-V. Note that simulations WHA-II and V display the most uniform wave shape (both with equiaxedmicrostructure transverse-1), with a few fluctuations on the order of the grain diameter for y480 nm.Simulations WHA-III and IV (microstructure transverse-2) display some variations on the order of the graindiameter, as well as some smaller fluctuations. Finally, simulation WHA-I shows grain-scale fluctuations inthe interior of the sample, 30oyo120 mm, with significant attenuation of the wave near the lateral boundariesat y ¼ 0 and y ¼ L. The drop in particle velocity along the transverse boundaries for simulation WHA-I inFig. 27 (see also Fig. 28a) could be attributed to a combination of factors, including those arising from

ARTICLE IN PRESS
0
50
100
150
25 30 35 40
t (ns)
0.0
5
0.1
5
0.2
5
0.3
0
0.2
0
0.1
0
0.2
5
y (
μm)
up (km/s)
Fig. 24. Contours of constant free-surface velocity of shock front in y– t plane from simulation WHA–IV.
020
4060
80
0
50
100
150
0
50
100
–50
–100
δup (
km
/s)
y (μm)t (n
s)
Fig. 23. Perturbations of free-surface velocity from simulation WHA-IV.
020
4060
80
0
50
100
1500
0.1
0.2
0.3
0.4
up (
km
/s)
y (μm)t (ns)
Fig. 22. Free-surface velocity history from simulation WHA-IV.
T.J. Vogler, J.D. Clayton / J. Mech. Phys. Solids 56 (2008) 297–335322

ARTICLE IN PRESS
0
0.1
0.2
0.3
0.4
20 40 60 80
t (ns)
up (
km
/s)
Fig. 25. Spatially averaged free-surface velocity histories for all simulations.
0
20
40
20 40 60 80
t (ns)
I
II
IV
III
V
S(u
p)
(m/s
)
Fig. 26. Standard deviation in free-surface velocities from simulations.
T.J. Vogler, J.D. Clayton / J. Mech. Phys. Solids 56 (2008) 297–335 323
inherent statistical variations in material properties related to phase distributions and lattice orientations.Significant localized plastic deformation and heating were also observed along these boundaries, which affectthe stiffness and wave propagation characteristics of the material in these regions. Standard deviations, St, fortemporal positions of the contours are 0.79, 0.18, 0.33, 0.21, and 0.14 ns for simulations WHA-I to V.The deviation for WHA-I is excessive due to the drop in velocity at the boundary. As with the experiments,the deviation of the contour decreases with impact velocity so that the ratio between St for 350m/simpact (WHA-IV) and that at 250m/s (WHA-III) is 0.65, very close to the experimental value of around 0.6.The ratio for 450 (WHA-V) and 350m/s is somewhat higher at 0.78, but a comparison with experimentalresults is not possible because of the problems with experiment WHA-5. The orientation of the mesh clearlyaffects the roughness of the contour as the ratio for transverse-1 (WHA-II) and transverse-2 (WHA-IV)simulations is 0.86. Finally, if we estimate St for the central region of WHA-I, we find a value of about 0.15 ns,which would give a ratio of 0.71 for the axial and transverse-2 orientations, close to the value seen

ARTICLE IN PRESS
0
50
100
150
0 5 10
t-arbitrary (ns)
I II IVIII V
y (
μm)
Fig. 27. Contours of constant free-surface velocity (VI/2) of shock front in y– t plane for simulations WHA I–V.
T.J. Vogler, J.D. Clayton / J. Mech. Phys. Solids 56 (2008) 297–335324
experimentally. Thus, the trends for non-uniformity in simulated waves across their fronts agree with thoseseen experimentally.
Shown in Figs. 28 and 29 are contours of particle velocity magnitude up�� �� and effective stress seff for
simulations WHA-I (Fig. 28) and IV (Fig. 29), at t ¼ 20ns, when the impact wave has traversed roughly 23of the
sample. Particle velocity vectors are also shown, superimposed on the contours of up�� �� and scaled in length by
magnitude of local velocity. Vortices in material motion, with characteristic lengths on the order of the grainsize, are apparent in the wake of the elastic–plastic stress wave. These vortices do not appear to occurpreferentially within particular grains or a particular phase of the alloy, however. Heterogeneities in the wavefront induced by the microstructure are also obvious. Comparing Figs. 28(a) and 29(a), the reduction in particlevelocity near the lateral edges y ¼ 0 and y ¼ L is apparent in the former (WHA-I). From the stress contours, Wgrains tend to support relatively larger effective stresses than the more ductile binder phase. Comparing Figs. 17and 18 with 28 and 29, note that momentum conservation requires that the pressure be more uniform than theeffective deviatoric stress; i.e., for the boundary conditions applied here, W grains tend to support largerdeviatoric stresses than the binder does, but pressures are not preferentially higher in either phase.
5.3. Statistics of free-surface velocity and trends in fracture
Because the wave mechanics for the problem domain and boundary conditions of Eq. (19) do not correspondto those of a macroscopic plate impact test, the free-surface velocity profiles differ (compare Figs. 9 and 25, forexample), and Eq. (23) does not apply for the simulations. However, the velocity decrement Dufs ¼ umax
p � uminp ;
where umaxp is the peak particle velocity and umin
p is the minimum velocity over the post-peak time interval40nsptp80ns, may provide some insight into fracture mechanisms and a means of comparison with trends inexperimental spall data. Note that the larger the value of umin
p , the greater the residual velocity of the spalledmaterial. Likewise, the larger the value of umax
p , the greater the force of the tensile release wave resisted by thematerial. Statistics regarding the decrement in free-surface velocity for the simulations are shown in Table 5;both Gaussian and two-parameter Weibull fits were computed. Analogous to the experimental spall statistics inTable 4, in all simulations the velocity decrements computed from the average velocity, DufsðupÞ, are lower thanthe averages Dufs, as differences among local maxima and minima in free-surface velocities over the time historyare smoothed out by averaging in the former. Simulations WHA-III and IV exhibit the lowest relative velocitydecrements, which can be further explained by Figs. 19 and 20: relatively more continuously linked fracture sitesare available for this microstructure with grains elongated perpendicular to the loading/unloading directionof wave propagation. From observation of the instantaneous and cumulative damage mechanisms evident in
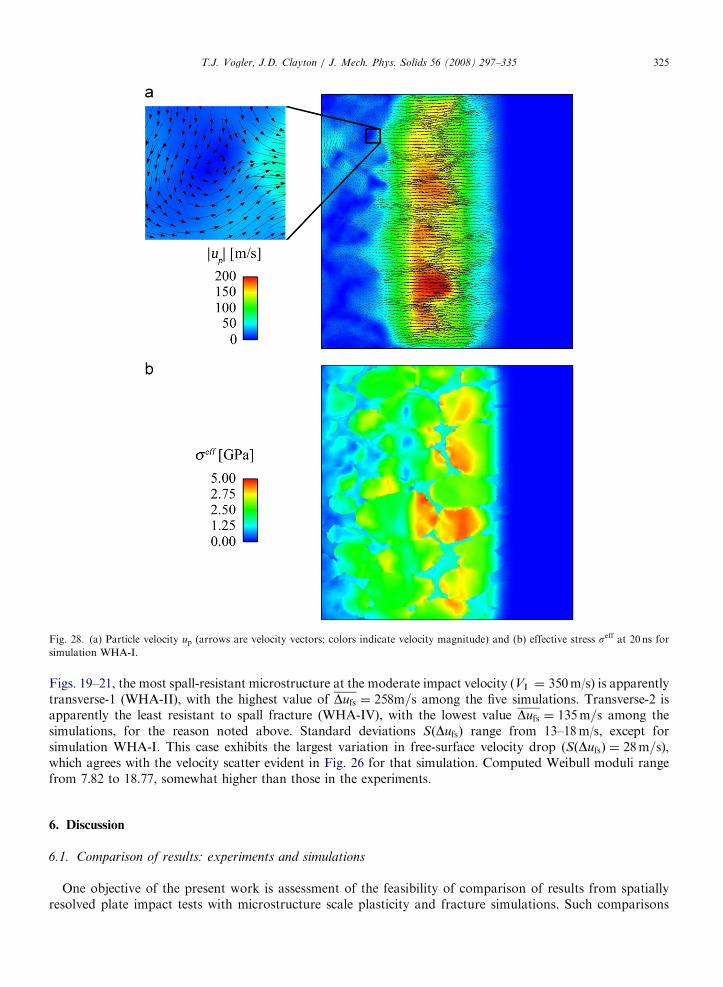
ARTICLE IN PRESS
Fig. 28. (a) Particle velocity up (arrows are velocity vectors; colors indicate velocity magnitude) and (b) effective stress seff at 20 ns forsimulation WHA-I.
T.J. Vogler, J.D. Clayton / J. Mech. Phys. Solids 56 (2008) 297–335 325
Figs. 19–21, the most spall-resistant microstructure at the moderate impact velocity (VI ¼ 350m/s) is apparentlytransverse-1 (WHA-II), with the highest value of Dufs ¼ 258m=s among the five simulations. Transverse-2 isapparently the least resistant to spall fracture (WHA-IV), with the lowest value Dufs ¼ 135m=s among thesimulations, for the reason noted above. Standard deviations SðDufsÞ range from 13–18m/s, except forsimulation WHA-I. This case exhibits the largest variation in free-surface velocity drop (SðDufsÞ ¼ 28m=s),which agrees with the velocity scatter evident in Fig. 26 for that simulation. Computed Weibull moduli rangefrom 7.82 to 18.77, somewhat higher than those in the experiments.
6. Discussion
6.1. Comparison of results: experiments and simulations
One objective of the present work is assessment of the feasibility of comparison of results from spatiallyresolved plate impact tests with microstructure scale plasticity and fracture simulations. Such comparisons

ARTICLE IN PRESS
Fig. 29. (a) Particle velocity up (arrows are velocity vectors; colors indicate velocity magnitude) and (b) effective stress seff at 20 ns forsimulation WHA-IV.
Table 5
Statistical parameters for surface velocity decrements from simulations
Expt. Dufs up� �
(km/s) Normal distribution Weibull distribution
Dufs (km/s) S Dufsð Þ (km/s) Dufs;0 (km/s) b
WHA-I 0.171 0.180 0.028 0.190 8.74
WHA-II 0.249 0.258 0.016 0.265 18.77
WHA-III 0.125 0.141 0.013 0.147 11.28
WHA-IV 0.115 0.135 0.018 0.143 7.82
WHA-VI 0.231 0.241 0.016 0.249 14.89
T.J. Vogler, J.D. Clayton / J. Mech. Phys. Solids 56 (2008) 297–335326
permit one to understand phenomena in a way not available through experiments or modeling alone andsuggest means of potential improvement in the existing techniques. Some of the key findings of the currentstudy relevant to this are as follows.

ARTICLE IN PRESST.J. Vogler, J.D. Clayton / J. Mech. Phys. Solids 56 (2008) 297–335 327
Regarding free-surface velocity profiles:
�
Spatial fluctuations on the order of several or tens of grains (�0.5mm) are observed in free surface velocityprofiles collected from the experiments (Figs. 7, 8, and 11). � Spatial fluctuations on the order of the grain size (�10–30 mm) are apparent in many of the free surfacevelocity profiles collected from the simulations (Figs. 22–24 and 27).
� Standard deviations in spatially resolved free surface velocity, SðupÞ are typically on the order of 10 m/s forexperiments (Fig. 10), and 10-30 m/s for simulations (Fig. 26).
� A significant spike is seen in the standard deviation of the free surface velocity at the time of arrival of theinitial shock in the experiments, but no such spike is evident the simulations.
� Following the initial spike, the standard deviation remains relatively constant in the experiments, thoughmost experiments show a moderate change when the particle velocity increases (the pullback signature).Some simulations show a similar behavior, but others decrease or increase noticeably, though the time scaleof the simulations is significantly shorter than that of the experiments.
Regarding spall fracture:
�
The experimental results indicate that the transverse orientation exhibits the lowest spall strength, asreported in Table 4. The magnitudes of differences in spall strengths for samples with differentmicrostructures were inconsistent, however. The difference in average strengths ssp between WHA-1 and 3is 0.07GPa (both tests at 250m/s impact velocity), whereas the difference is 0.46GPa between WHA-2 andWHA-4 (both at 350m/s). Similar trends apply for the Weibull parameter s0. � The computations indicate that the transverse-2 microstructure exhibits the lowest spall strength, as can beascertained from consideration of the damage mechanisms evident in Figs. 19–21 and the lowest value offree-surface velocity decrement listed in Table 5.
� Experimentally, higher velocity impacts yield a somewhat higher spall strength, ssp, for both orientations.In contrast, the simulations exhibit a tendency to fracture more extensively when the impact velocity isincreased.
� In experiments and modeling, no relationships between microstructure, impact velocity, and standarddeviations of spall strength or free-surface velocity drop are readily apparent (Tables 4 and 5).
� Values of Weibull modulus b are significantly higher among the free-surface velocity decrement from thesimulations (Table 5, ranging from 7.8 to 18.8) than the spall strengths from experiments (Table 4, rangingfrom 3.5 to 6.9).
Differences in free-surface velocity profiles arise naturally as a result of differing scales of resolution in theexperiments and models. From the above observations, the simulations reflect local heterogeneity of wavepropagation induced by the differences in deformations among individual grains and the softer matrix phasesurrounding them, whereas the experiments detect gradients in microstructure properties among aggregates ofgrains, reflected in the free-surface velocity data.
The spatial resolution of the experiments is established by the capabilities of the line-VISAR instrument.The resolution along the line can be varied, but optical instrumentation limits its minimum to around15–20 mm. However, even if the nominal resolution is 15 mm, each measurement encompasses the response ofabout 60 mm of material because of the procedure used for data collection and analysis. Decreasing theresolution along the line also results in a reduction in the amount of material that is being monitored by theinstrument. Depending upon the dominant length scales for material behavior, monitoring a smaller amountof material may cause important behaviors to be missed. It may also affect the reliability of statisticsassociated with material failure.
The spatial resolution of the simulations is established by the finite element discretization. The approachhere has been to use the finest FE mesh permissible within computing constraints. The elements used here areof small enough size, with typical elements on the order of 1 mm in dimension in the vicinity of grainboundaries, to resolve critical cohesive zone lengths and compute, with precision, the average materialresponse (e.g., homogenized stress–strain behavior) as discussed in Clayton (2005a, b). However, minute

ARTICLE IN PRESST.J. Vogler, J.D. Clayton / J. Mech. Phys. Solids 56 (2008) 297–335328
aspects of fracture and the local material response are inevitably sensitive to mesh construction and thecorresponding degree of resolution of microstructure features. For example, the finer the mesh, the greater thepotential for a more faithful representation of the actual microstructure in the numerical reconstruction,including initial lattice orientation gradients within grains and facets of potential fracture along grainand phase boundaries. More refined grids than those used presently were prohibitively expensive from acomputational standpoint, but they would enable the possibility of detection of even smaller fluctuations infree-surface velocities. Such finer grids were deemed unnecessary, since the elements used at present were smallenough to detect features an order of magnitude smaller than the size of individual grains, and the grain sizeappeared to be the dominant feature or characteristic length reflected in the results of the simulations. To thisend, averages and standard deviations of spall strength were also computed using only every other free-surfacenode at X ¼ L, and variations in these values were negligible with those presented in Table 5, computed usingall free-surface nodes. Furthermore, the element sizes used here are of comparable or smaller magnitudes thanthose used by others in similar investigations (Becker, 2004; Love and Batra, 2005; Zhou et al., 1994).
Substantial variability among the results from simulations is expected among different reconstructions ofthe material (i.e., microstructures reproduced from different regions of the material) of the present dimensions,on the order of 50W grains. Variability is also present in physical experiments, even properties averaged overmacroscopic dimensions. For example, differences in spall strengths exist among realizations in the presentwork and among the results of Dandekar and Weisgerber (1999). For materials undergoing catastrophicfailure (i.e., crack propagation, interaction, and percolation) as occurs in spall events, a sample of largeenough dimensions to act faithfully as an RVE (cf. Hill, 1963) does not exist. In other words, even for a sampleof very large dimensions, variations in spall strength are expected; e.g., witness the non-negligible variations inmeasured spall strength (on the order of 10–15%) among macroscopic samples of the same nominalcomposition tested by Dandekar and Weisgerber (1999). This implies that an RVE must be significantly largerthan even these plate impact samples of dimensions on the order of mm, and that failure may be controlled bya few critical, minute intrinsic flaws in the material. This does not mean the present analyses are of no scientificvalue, but rather indicates that all samples of the material should not behave in the same way with regards tofailure/fracture. Collection of definitive statistics on variability among samples of material with similar, butnot identical, microstructures (e.g., samples of material of the same global orientation cut from differentlocations in the KE rod) would presumably require many more experiments and simulations. However, apotential benefit of the line-VISAR technique is that variability in material properties such as spall strengthdue to mesostructural heterogeneity can be quantified in fewer experiments than required by a conventionalpoint-VISAR.
In the modeling, simple hardening-minus-dynamic-recovery relationship is used (Eq. (15)) for the evolutionof the slip system hardness variable g
ðaÞ0 (Horstemeyer et al., 1999). The partitioning of g
ðaÞ0 into a constant term
gðaÞy consisting of the effects of initial defects and lattice friction stress (Qiu et al., 2001) and an evolvinghardening term is a construct used purely to illustrate the accumulation of dislocations with strain anddelineate the effects of these defects versus those initially present, via (14). The present formulation for plasticslip kinetics invokes a thermal softening relationship (13) that scales the total hardness g
ðaÞ0 , the sum of initial
and cumulative effects, with temperature, following the viscoplastic models of Lee et al. (1999) and Kloppet al. (1985). No physical basis is attached to the reference strain rate _g0, treated here as an arbitrary constant,following Hutchinson (1976). The present approach was found to adequately address the rate- andtemperature-dependent stress–strain behavior for both phases over the range of loading rates for which themodels were calibrated, from quasi-static to those achievable via Hopkinson bar, the latter on the order of104 s�1 (Clayton, 2005a). However, refinements to the present formulation are possible that would perhapsprovide a more realistic description of the physics of thermally activated dislocation motion. For example,rather than scaling all slip resistance mechanisms uniformly via a thermal softening relation such as Eq. (13),one could enable the hardening and recovery terms A and B in (15) to more realistically depend ontemperature in an independent manner, e.g., A / exp A1=y
� �following (Bammann et al., 1993), where A1 is a
constant related to the activation energy. Likewise, the friction stress and initial dislocation densitycontributions to gðaÞy may not scale in the same way with temperature as imposed by the present model.Additionally, as remarked in Balasubramanian and Anand (2002), the reference shearing rate could beassigned a physical meaning following a Boltzmann relation of the form _g0 / exp Q=kBy
� �, with Q the

ARTICLE IN PRESST.J. Vogler, J.D. Clayton / J. Mech. Phys. Solids 56 (2008) 297–335 329
activation energy and kB Boltzmann’s constant. While the hardening-minus-recovery format (15) does lead toa saturation in flow stress at sufficient strain levels, a relation with the saturation value of flow stress basedexplicitly on temperature and strain rate (Kocks et al., 1975) may be more meaningful for describingdislocation kinetics under conditions explored numerically here. With increasing model refinement, however,additional experiments or assumptions will be necessary in order to calibrate all parameters uniquely.
During the present simulations, a range of inelastic strain rates was observed, with maximum rates on theorder of 107 s�1 attained at some time instants during propagation of plastic waves. The largest strains andstrain rates were concentrated in the binder phase. The plasticity models were calibrated (Clayton, 2005a) tostatic and dynamic data up to the 104 s�1 range (the latter obtained via Hopkinson bar testing in compressionand shear), thus encompassing only partially the rates achieved during the impact simulations. A similarapproach was followed by Becker (2004), who extrapolated the available data at intermediate strain rates tomodel the shock response of polycrystalline tantalum using crystal plasticity theory. Macroscopic viscoplasticmodels are also typically extrapolated to address very high strain rates within shear bands (Batra and Wilson,1998) and early stages of pressure–shear experiments (Zhou et al., 1994), for which model calibration data atvery high strain rates in excess of 106 s�1 is unavailable. The difficulty arises from the unavailability of physicalexperiments supplying homogeneous stress–strain behavior at such high rates. In fact, one initial objective ofthe present investigation was suggestion of improvements in plasticity models at high rates since these strainrates are thought to occur in the plate impact tests, albeit in an inhomogeneous manner. However, such aneffort was found overly difficult due to differences in scales of resolution inhibiting comparisons of model andexperiment, as discussed above, and uncertainty over which of many model features should be adjusted inorder to match the output from the line-VISAR. It is conceivable that in the near future, molecular dynamics(Horstemeyer et al., 2001; Moriarty et al., 2002) simulations may provide insight into the response at such highrates, since such methods are well-suited to very short time scales and very large strain rates.
The pressure–shear impact data of Zhou and coworkers (Zhou, 1993; Zhou and Clifton, 1997; Zhou et al.,1994), who observed nominal shear strain rates in excess of 105 s�1 under large compressive stress, offers thepotential for some improvement in the present plasticity model and choice of parameters. Zhou et al. (1994)calibrated an isotropic viscoplastic model to this data and found close agreement between model predictionsand experimental shear stress–strain curves during later stages of the test (t4100 ns), when wavereverberations had decayed and the specimen experienced a nearly uniform state of shear stress. However,Zhou et al. (1994) noted that discrepancies arose between experiment and model predictions at early stages ofthe impact event, attributed in their paper to inadequacy of the constitutive model at the high initial shearingrates as well as possible experimental difficulties. It is precisely this regime of elastic–plastic wave propagation(to100 ns) that is of interest in the present simulations, albeit for normal as opposed to inclined impactconditions. The present crystal plasticity model could conceivably be calibrated to the pressure–shear impactdata of Zhou (1993) on pure W and the matrix alloy to better address the response of these materials at ratesup to 2� 105 s�1. Calibration to such data would presumably require consideration of the crystal structure(thin films, several grains thick) and texture, following the approach of Duprey and Clifton (2000), forexample, who modeled with distinct finite elements and crystal plasticity theory, individual grains of tantalumunder pressure–shear impact. Such a rigorous approach may be contrasted to the much simpler Taylor-typeapproximation typically used to calibrate such models to uniaxial and Hopkinson bar data. It is thought thatspecimen preparation may affect the properties, since Zhou (1993) demonstrated a dependence of the dynamicflow stress of WHA on the cross rolling process used to fabricate the pressure–shear samples. It is also possiblethat the large compressive pressure pulse may affect the lattice structure and induce defects, thereby affectingthe flow stress measured at later times during the experiment. Such effects would implicitly be included in theparameters determined from calibration to the shear stress-strain data provided by the test. Perhaps the bestapproach to calibrate the plasticity models over the full range of strain rates attained during plate impacttesting would be to conduct independent experiments and calibration simulations of specimens of singlephase composition (i.e., pure W or pure matrix), uniform initial texture, and with the same spatial dimensionsand impact speeds used for both experiments and simulations. However, some uncertainty would stillexist in the response of the matrix phase, which in the WHA resides in thin layers between W grains and as aresult may exhibit different properties than the pure matrix alloy whose typical grain size tends to exceed thatof the W grains.

ARTICLE IN PRESST.J. Vogler, J.D. Clayton / J. Mech. Phys. Solids 56 (2008) 297–335330
Millett et al. (2007) performed plate impact tests on pure polycrystalline W and compared the observedbehavior with WHA reported from several sources. The HEL values of pure W and WHA materials werefound to be similar. In pure W, a mechanism of brittle micro-cracking induced by the compressive pulse wassuggested, following an observation of progressively reduced shear strength behind the shock front.
Finally, a discrepancy between experiments and simulations exists due to the 2D nature of the simulations.Real materials have complex modes of deformation and failure, particularly with regards to evolution offracture surfaces that cannot be faithfully captured by 2D simulations. Future increases in computing powerwill make comparably detailed numerical studies of plasticity and fracture at the grain level feasible in threedimensions.
6.2. Material behavior
Mescheryakov and coworkers (Mescheryakov, 2003; Mescheryakov et al., 2004) developed a multiscaledescriptive framework for describing effects of micro- or meso-structures on wave propagation in solids underimpact loading. In their framework, dispersions of particle velocities are analyzed at three scales of increasingcharacteristic length: mesolevel-1, mesolevel-2, and macroscale. Instability under shock compression ischaracterized by exhaustion of dissipative mechanisms and attainment of a maximum value of dispersion atthe finest length scale, mesolevel-1. Subsequently, dispersion at mesolevel-2 increases as regions of localizedshear or damage interact at a larger length scale, culminating in final failure or percolation of the sample (e.g.,macroscopic spall failure). In this framework, the simulations indicate dispersion at the grain scale,corresponding to Mescheryakov’s mesolevel-1, while the experiments are indicative of dispersion at a largerlength scale not measurable in the simulations, mesolevel-2.
Case and Horie (2007) recently used a DEM to model impact and shock wave propagation inpolycrystalline copper at the mesostructure scale, with a level of resolution comparable to that used in thepresent work, though these authors did not attempt to model spall fracture explicitly. Case and Horie (2007)found that the particle velocity dispersion (i.e., standard deviation S(up)) at the shock front depends upon theimpact stress, in agreement with the trends from the current experiments and simulations. Also, in anotherDEM study of copper, Yano and Horie (1999) noted vortices in material flow in the wake of the shock pulse,similar in scale and appearance to those presented here in Figs. 28 and 29. In that work, non-uniform tensilestresses were observed where waves interact, indicating that a spall strength distribution can be obtained evenwith constant material strength. Such is also the case in the present study, where a distribution of spallstrengths was found for a heterogeneous crystalline material with uniform cohesive strength. Finally, Case andHorie (2007) noted peaks in the particle velocity dispersion of about twice the magnitude of that found atlater, steady-state times in the impact events. Such spikes were observed in the experiments, as shown inFig. 10, but were absent in our numerical results, Fig. 26. According to Mescheryakov and Astroshenko(1992), such a peak should occur at the midway point of the plastic wave rise, when effects of mesoscopicrotations of material manifest most strongly. The reason for the absence of such a peak in the numericalresults is not obvious at present. One possibility is that the kinetic equations for plasticity, with strain-ratedependent hardening in Eqs. (12)–(15), cause some smoothing of the plastic wave, as different plasticitykinetics were used in the study of Case and Horie (2007).
Though mild crystallographic textures indicative of extrusion along the axial direction existed, specificeffects of lattice orientation could not be delineated among particular experiments or simulations. Only slightdifferences in average compliance among experiments with different initial microstructures were observed(Table 1), and neither experiments nor simulations clarified whether such differences were attributed to initiallattice orientation, grain morphology (i.e., elongated versus equiaxed grains with respect to loading axis),spatial distribution of the binder phase, or other factors. Similar ambiguity exists as to how individual aspectsof the microstructure, including textures and grain shapes, may affect wave arrival times and pull-backvelocities. One may speculate that fewer distinct lattice orientations along the axial direction among the Wgrains may reduce the dispersion in free-surface velocity profiles in axial samples relative to transversesamples, since the contours of constant free-surface velocity are more jagged in transverse samples than axialsamples in Fig. 11. This effect could be attributed to fewer distinct orientations in axial samples that tendslightly towards a /1 1 0S texture, or fewer W grains across the thickness of the sample since the grains are

ARTICLE IN PRESST.J. Vogler, J.D. Clayton / J. Mech. Phys. Solids 56 (2008) 297–335 331
elongated in the axial direction. However, in contrast, simulations of the microstructure transverse-1 exhibitedthe fewest fluctuations in free-surface velocity (Figs. 26 and 27). One may just as easily speculate that the largernumber of (equiaxed as opposed to elongated) grains through the thickness of the transversely orientedsamples may smooth out the fluctuations induced by individual crystals of various initial orientations. Clearly,more extensive investigations, in which sample-to-sample variations in microstructure are restricted to texturealone, are needed to fully elucidate possible effects of lattice orientation on the response of WHA.
As remarked above, the transverse microstructure exhibits the lowest average spall strength in theexperiments. Note that this microstructure presents a relatively large area per unit volume of grain boundarysurfaces perpendicular to the loading direction, in contrast to the axial orientation, whose grains are elongatedalong the axis of impact (Fig. 1(a)). Since the weakest link in the material is expected to control initiation offailure, the transverse orientation should have average spall strengths that are lower than those of the axialorientation. For example, failure of a typically larger grain boundary facet elongated perpendicular to theloading direction would present a larger starter crack for eventual catastrophic fracture than would failure of atypically smaller grain boundary facet in a microstructure with equiaxed or shortened grains alignedperpendicular to the loading direction. In the simulations, the transverse-2 microstructure possesses the loweststrength. The reason for this is clear from grain and phase boundary arrangements and examining the fracturesites in the simulations of Figs. 19 and 20. Since the primary fracture criterion in the simulations followsfrom the maximum resolved normal stress acting on grain or phase boundaries (Eqs. (16) and (17) and s0 ofTable 2), those microstructures presenting the greatest number of contiguous fracture sites orientedperpendicular to the impact direction tend to fail most readily. Note that simulations II and V, with thetransverse-1 microstructure, exhibit the highest apparent resistance to spall fracture. Transversely orientedsamples include both transverse-1 and transverse-2 orientations, depending upon how one views the sample.In the simulations, these microstructures are not equivalent, however. Even though both may havecomparable grain boundary area per unit volume, microstructure transverse-2 exhibits more grain boundaryfacets oriented most nearly parallel to the loading axis. Correspondingly, the lower average value offree surface velocity decrement (WHA IV, Table 5) seems to reflect a tendency for damage accumulationevident in Fig. 21.
The experiments indicate that higher velocity impacts produce a higher spall strength, ssp. This suggests thatthe regions where failure occurs (e.g., W-matrix interfaces and W–W grain boundaries) are preconditioned toa more durable state by the initial compressive pulse. Such behavior has been observed previously in otherbrittle materials (Dandekar, 2004). Physically, this phenomenon could correspond to closure of microvoids orelimination of deleterious effects of other defects caused by impurities at the boundaries. On the other hand,the simulations predict somewhat lower spall strength when the impact velocity is increased, despite theincrease in fracture toughness with temperature provided by Eq. (16). The correct behavior could be reflectedin future simulations by incorporating cohesive traction laws dependent upon the stress history of the localmaterial.
It is suggested here that initiation of spall fracture may be controlled by grain and phase boundaries, inagreement with experimental observations of (Weerasooriya, 2003). However, crack propagation andmacroscopic spall behavior are thought to also require substantial grain cleavage: once a sufficiently large, amicro-crack initiated along grain/phase boundaries will then propagate fully across the specimen, irrespectiveof the underlying microstructure. Post mortem inspection of fully fractured (i.e., spalled) specimens wouldthen likely indicate both intergranular and cleavage mechanisms (Bless and Chau, 2006). The simulations(Figs. 19 and 20) also demonstrate that for complete fracture to occur, cleavage must take place, sinceinsufficient fracture sites for purely intergranular fracture likely exist to allow for crack propagation across asample of dimensions of several hundred microns or larger. This assertion was also made in Clayton (2005a) inthe context of dynamic tensile loading. Grain and phase boundaries should also exhibit a distribution ofstrengths; for example, Weerasooriya et al. (1994) suggested that W–W boundaries are intrinsically weakerthan W-matrix boundaries. Clayton (2005a) investigated the effect of variable ratios of grain and phaseboundary strengths on uniaxial tensile failure. The role of such variable grain boundary strengths on spallfracture statistics remains to be investigated in future modeling work. Based on the current results, it isapparent that the variability in spall statistics observed experimentally is due both to the heterogeneous localstrengths and flaw distributions and to the multiphase polycrystalline microstructure of the material.

ARTICLE IN PRESST.J. Vogler, J.D. Clayton / J. Mech. Phys. Solids 56 (2008) 297–335332
6.3. Future work
In the future, multiple realizations of the same experiments (i.e., same impact velocity and sampleorientation) should be conducted to quantify sample-to-sample variability in wave propagation and spallproperties. Analogously, additional simulations should be performed with microstructures of similar globalcharacteristics (e.g., equiaxed vs. extruded grains) but different local characteristics (e.g., individual grainshapes and orientations). Such simulations would provide additional support for the hypothesized dependenceof spall strength on orientation, for example.
7. Conclusions
A combined experimental–computational study, accounting for the effects of microstructure on wavepropagation and spall fracture, was conducted on a tungsten heavy alloy subjected to normal plate impactloading. In the experiments, a line-VISAR system enabled the resolution of particle velocity profiles at thescale of tens of microns. In the simulations, crystal plasticity theory coupled with a cohesive zone model forintergranular and interphase fracture enabled the resolution of local thermomechanical response of thematerial at the micron scale.
The large volume of experimental data collected, and corresponding analysis of this data, provide a detaileddescription of the material’s high-rate behavior and mechanical properties. Specifically, for WHAmicrostructures of different microstructure orientations, the following information was obtained: spatiallyresolved free-surface velocity profiles, HELs, spall strengths, and spall statistics. While the bulk HEL valuesand average spall strengths obtained here are comparable with results obtained from previous point-VISARexperiments (Dandekar and Weisgerber, 1999), the detailed statistical aspects of wave propagation andfracture have heretofore been unavailable. Such statistics may support future macroscopic modeling ofdynamic deformation and failure of the WHA material. For example, the Weibull modulus may be used toprovide initial conditions for simulations employing spatially variable failure properties (Brannon et al., 2007;Goto et al., 2007; Schraml et al., 2005; Zhou and Molinari, 2004).
From the simulations, local behavior not accessible in the experiments was observed. Plastic strainaccumulation and dislocation activity tended to be greatest in the more ductile matrix phase of the WHAmaterial, whereas larger effective deviatoric stresses were supported by the W grains. Heterogeneous impactwave propagation and vortices in material motion behind the plastic wave were found to occur at the scale ofindividual grains. Local fracture morphologies were also observed, with details of micro-cracking dependentupon initial microstructure and impact velocity. Effects of microstructure orientation and impact velocity onaspects of spall fracture described here have not, to our knowledge, been quantified in previous modelingstudies of WHA. In the simulations, differences in spall behavior arise strictly as a result of the dual phasegranular microstructure, since a uniform value was used for the strength of the cohesive zone elements. Onelikely reason that the velocity statistics in the simulations differ from those observed in the experiments is thatthe local variations associated with spall strength in the experiments may be attributed to microstructuralheterogeneities not resolved by the model (e.g., defects or flaws within grains) and to the presence of grain andphase boundary strength distributions.
In both experiments and simulations, similar effects of microstructure on overall fracture resistance wereobserved. Grain boundaries seemed to dominate fracture initiation in either case, with microstructurespresenting the most area per unit volume perpendicular to loading direction exhibiting the least strength.Differing scales of resolution between model (fine resolution, but limited to small sample sizes) and experiment(larger sample, but less refined resolution) partially inhibited direct comparison of results. For example,variations in free surface velocity profiles on the order of grain size were observed in the simulations, whilevariations on the order of multiple grains were observed in the experiments. Despite the different scalesinvolved, though, the dispersion of the initial shocks was found to scale in nearly the same way with velocityand orientation for experiments and simulations.
The present study has suggested methods for improved concurrent experimental and modeling efforts in thefuture. In the experiments, a still unresolved issue is the effect of sample thickness on heterogeneous wavepropagation. For example, the post-spall wave profiles include not only the effects of the heterogeneous

ARTICLE IN PRESST.J. Vogler, J.D. Clayton / J. Mech. Phys. Solids 56 (2008) 297–335 333
fracture pattern, but also the effects of wave propagation through undamaged but heterogeneous materialbetween the spall plane and the free surface. More refined techniques enabling in situ study of the wavepropagation and spall behavior on the scale of individual grains or even smaller (e.g. micron scale) would alsobe instructive. The present simulations permit correlation of local fracture behavior and microstructure effectsto the simulated free-surface velocity profiles. Incorporation of grain cleavage models for this particular alloy,and improvements in computational methods for dynamic crystal plasticity and cohesive fracture to addressmuch larger sample sizes, with dimensions on the order of millimeters and at time scales on the order ofmicroseconds, would enable more useful, direct comparison with plate impact experiments of the samedimensions.
Acknowledgments
The authors would like to thank Wayne Trott, Jaime Castaneda, and the STAR team for performingthe line-VISAR experiments. We would also like to thank Tony Rollett of Carnegie-Mellon Universityfor the EBSD results as well as Todd Bjerke and William Edmanson (both of ARL) for obtaining the materialspecimens. Work at Sandia was supported through the Joint DoD/DOE Munitions Technology DevelopmentProgram. Sandia is a multiprogram laboratory operated by Sandia Corporation, a Lockheed MartinCompany, for the United States Department of Energy’s National Nuclear Security Administration underContract DE-AC04-94AL85000. J.D.C. acknowledges support from the US Army Research Laboratory(ARL).
References
Antoun, T.H., Seaman, L., Curran, D.R., Kanel, G.I., Razorenov, S.V., Utkin, A.V., 2003. Spall Fracture. Springer-Verlag, New York.
Argon, A.S., Maloof, S.R., 1966. Plastic deformation of tungsten crystals at low temperatures. Acta Metall. 14, 1449–1462.
Asaro, R.J., 1983. Crystal plasticity. J. Appl. Mech. 50, 921–934.
Asay, J.R., Barker, L.M., 1974. Interferometric measurement of shock-induced internal particle velocity and spatial variations of particle
velocity. J. Appl. Phys. 45, 2540–2546.
Asay, J.R., Chhabildas, L.C., 2003. Paradigms and challenges in shock wave research. In: Horie, Y., Davison, L., Thadhani, N.N. (Eds.),
High-pressure Shock Compression of Solids VI: Old Paradigms and New Challenges. Springer, New York, pp. 57–119.
Baer, M.R., Trott, W.M., 2004. Mesoscale studies of shock loaded tin sphere lattices. In: Furnish, M.D., Gupta, Y.M., Forbes, J.W.
(Eds.), Shock Compression of Condensed Matter. American Institute of Physics, New York, pp. 517–520.
Baer, M.R., Trott, W.M., 2005. Theoretical and experimental mesoscale studies of impact-loaded granular explosive and simulant
materials. In: Proceedings of the 12th International Symposium on Detonation. Office of Naval Research, 333-05-2, pp. 939–948.
Balasubramanian, S., Anand, L., 2002. Plasticity of initially textured hexagonal polycrystals at high homologous temperatures:
application to titanium. Acta Mater. 50, 133–148.
Bammann, D.J., Chiesa, M.L., Horstemeyer, M.F., Weingarten, L.I., 1993. Failure in ductile metals using finite element methods.
In: Jones, N., Weirzbicki, T. (Eds.), Structural Crashworthiness and Failure. Elsevier, New York, pp. 1–53.
Baoping, Z., Chao, Y., Yingming, X., Chunlan, J., 1994. Responsive behaviour of 93wt% tungsten alloy under intense shock loading. In:
Zhemin, Z., Quinming, T. (Eds.), Proceedings of the IUTAM Symposium on Impact Dynamics. Peking University Press, pp. 283–297.
Barker, L.M., 2000. The development of the VISAR, and its use in shock compression science. In: Furnish, M.D., Chhabildas, L.C.,
Hixson, R.S. (Eds.), Shock Compression of Condensed Matter. American Institute of Physics, New York, pp. 11–17.
Batra, R.C., Wilson, N.M., 1998. Adiabatic shear bands in plane strain deformations of a WHA. Int.J. Plasticity 14, 43–60.
Baumung, K., Singer, J., Razorenov, S.V., Utkin, A.V., 1996. Hydrodynamic proton beam-target interaction experiments using an
improved line-imaging velocimeter. In: Schmidt, S.C., Tao, W.C. (Eds.), Shock Compression of Condensed Matter. American Institute
of Physics, New York, pp. 1015–1018.
Becker, R., 2004. Effects of crystal plasticity on materials loaded at high pressures and strain rates. Int. J. Plasticity 20, 1983–2006.
Bless, S., Chau, R., 2006. Tensile failure of tungsten rods. In: Furnish, M.D., Elert, M., Russell, T.P., White, C.T. (Eds.), Shock
Compression of Condensed Matter. American Institute of Physics, New York, pp. 603–606.
Bloomquist, D.D., Sheffield, S.A., 1983. Optically recording interferometer for velocity measurements with subnanosecond resolution.
J. Appl, Phys. 54, 1717–1722.
Brannon, P.J., Konrad, C.H., Morris, R.W., Jones, E.D., Asay, J.R., 1983. Studies of the spectral and spatial characteristics of shock-
induced luminescence from X-cut quartz. J. Appl. Phys. 54, 6381–6474.
Brannon, R.M., Strack, O.E., Lee, M.Y., 2007. Spatial statistics of material strength to address mesh dependency of conventional damage
models. Part I: theory and experiments, in preparation.
Bury, K.V., 1975. Statistical Models in Applied Science. Wiley, New York (Chapter 12).
Case, S., Horie, Y., 2007. Discrete element simulation of shock wave propagation in polycrystals. J. Mech. Phys. of Solids 55, 589–614.

ARTICLE IN PRESST.J. Vogler, J.D. Clayton / J. Mech. Phys. Solids 56 (2008) 297–335334
Chhabildas, L.C., Trott, W.M., Reinhart, W.D., Cogar, J.R., Mann, G.A., 2002. Incipient spall studies in tantalum–microstructural
effects. In: Furnish, M.D., Thadhani, N.N., Horie, Y. (Eds.), Shock Compression of Condensed Matter. American Institute of Physics,
New York, pp. 483–486.
Clayton, J.D., 2005a. Dynamic plasticity and fracture in high density polycrystals: constitutive modeling and numerical simulation.
J. Mech. Phys. Solids 53, 261–301.
Clayton, J.D., 2005b. Modeling dynamic plasticity and spall fracture in high density polycrystalline alloys. Int. J. Solids Structures 42,
4613–4640.
Clayton, J.D., 2006a. Continuum multiscale modeling of finite deformation plasticity and anisotropic damage in polycrystals. Theor.
Appl. Fract. Mech. 45, 163–185.
Clayton, J.D., 2006b. Plasticity and spall in high density polycrystals: modeling and simulation. In: Furnish, M.D., Elert, M., Russell,
T.P., White, C.T. (Eds.), Shock Compression of Condensed Matter. American Institute of Physics, New York, pp. 311–314.
Dandekar, D.P., 2004. Spall strength of silicon carbide under normal and simultaneous compression-shear shock wave loading. Int. J.
Appl. Ceram. Technol. 1, 261–268.
Dandekar, D.P., Weisgerber, W.J., 1999. Shock response of a heavy tungsten alloy. Int. J. Plasticity 15, 1291–1309.
Duprey, R.C., Clifton, R.J., 2000. Pressure–shear response of thin tantalum films. In: Furnish, M.D., Chhabildas, L.C., Hixson,
R.S. (Eds.), Shock Compression of Condensed Matter. AIP Press, New York, pp. 447–450.
Espinosa, H.D., Zavattieri, P.D., 2003a. A grain level model for the study of failure initiation and evolution in polycrystalline brittle
materials. Part I: theory and numerical implementation. Mech. Mater. 35, 333–364.
Espinosa, H.D., Zavattieri, P.D., 2003b. A grain level model for the study of failure initiation and evolution in polycrystalline brittle
materials. Part II: numerical examples. Mech. Mater. 35, 365–394.
Furnish, M.D., Trott, W.M., Mason, J., Podsednik, J., Reinhart, W.D., Hall, C.A., 2004. Assessing mesoscale material response via high-
resolution line-imaging VISAR. In: Furnish, M.D., Gupta, Y.M., Forbes, J.W. (Eds.), Shock Compression of Condensed Matter.
American Institute of Physics, New York, pp. 1159–1162.
Furnish, M.D., Reinhart, W.D., Trott, W.M., Chhabildas, L.C., Vogler, T.J., 2006. Variability in dynamic properties of tantalum: spall,
Hugoniot elastic limit, and attenuation. In: Furnish, M.D., Elert, M., Russell, T.P., White, C.T. (Eds.), Shock Compression of
Condensed Matter. American Institute of Physics, New York, pp. 615–618.
Goto, D.M., Orzechowski, T., Becker, R., 2007. Personal communication.
Gumbsch, P., Riedle, J., Hartmaier, A., Fischmeister, H.F., 1998. Controlling factors for brittle-to-ductile transition in tungsten single
crystals. Science 282, 1293–1295.
Hill, R., 1963. Elastic properties of reinforced solids: some theoretical principles. J. Mech. Phys. Solids 11, 357–372.
Hirth, J.P., Lothe, J., 1982. Theory of Dislocations. Krieger, Malabar, FL.
Horstemeyer, M.F., McDowell, D.L., McGinty, R.D., 1999. Design of experiments for constitutive model selection: application to
polycrystal elastoviscoplasticity. Modelling Simulation Mat. Sci. Eng. 7, 253–273.
Horstemeyer, M.F., Baskes, M.I., Plimpton, S.J., 2001. Computational nanoscale plasticity simulations using embedded atom potentials.
Theor. Appl. Fract. Mech. 37, 49–98.
Hutchinson, J.W., 1976. Bounds and self-consistent estimates for creep in polycrystalline materials. Proc. R. Soc. London A 348, 101–127.
Johnson, G.R., Stryk, R.A., Beissel, S.R., 2001. User instructions for the 2001 version of the EPIC code. Alliant Techsystems, Hopkins,
MN. (Distribution authorized to US government agencies and their contractors only.)
Klopp, R.W., Clifton, R.J., Shawki, T.G., 1985. Pressure–shear impact and the dynamic viscoplastic response of metals. Mech. Mater. 4,
375–385.
Kocks, U.F., Argon, A.S., Ashby, M.F., 1975. Thermodynamics and kinetics of slip. Prog. Mater. Sci. 19, 1–281.
Kocks, U.F., Tome, C.N., Wenk, H.-R., 1998. Texture and Anisotropy: Preferred Orientations in Polycrystals and their Effect on Material
Properties. Cambridge University Press, Cambridge, UK.
Lee, Y.J., Subhash, G., Ravichandran, G., 1999. Constitutive modeling of body-centered-cubic (BCC) polycrystals. Int. J. Plasticity 15,
625–645.
Love, B.M., Batra, R.C., 2005. Determination of effective thermomechanical parameters of a mixture of two elastothermoviscoplastic
constituents. Int. J. Plasticity 22, 1026–1061.
Magness, L.S., 1994. High strain rate deformation behaviors of kinetic energy penetrator materials during ballistic impact. Mech. Mat. 17,
147–154.
Margetson, J., Sherwood, P.J., 1979. Statistical analysis of the brittle fracture of sintered tungsten. J. Mat. Sci. 14, 2575–2580.
McMillan, C.F., Goosman, D.R., Parker, N.L., Steinmetz, L.L., Chau, H.H., Huen, T., Whipkey, R.K., Perry, S.J., 1988. Velocimetry of
fast surfaces using Fabry–Perot interferometry. Rev. Sci. Instrum. 59, 1–20.
Mescheryakov, Y.I., 2003. Meso-macro energy exchange in shock deformed and fractured solids. In: Horie, Y., Davison, L., Thadhani,
N.N. (Eds.), High-Pressure Shock Compression of Solids VI: Old Paradigms and New Challenges. Springer, New York, pp. 169–213.
Mescheryakov, Y.I., Atroshenko, S.A., 1992. Multiscale rotations in dynamically deformed solids. Int. J. Solids Struct. 29, 2761–2778.
Mescheryakov, Y.I., Divakov, A.K., N.I., Z., 2004. Shock-induced structural transitions and dynamic strength of solids. Int. J. Solids
Struct. 41, 2349–2362.
Meyers, M.A., Carvalho, M.S., 1976. Shock-front irregularities in polycrystalline metals. Mater. Sci Eng 24, 131–135.
Millett, J.C.F., Bourne, N.K., Rosenberg, Z., Field, J.E., 1999. Shear strength measurements in a tungsten alloy during shock loading.
J. Appl. Phys. 86, 6707–6709.
Millett, J.C.F., Gray, G.T., Bourne, N.K., 2007. Measurement of the shear strength of pure tungsten during one-dimensional shock
loading. J. Appl. Phys. 101, 033520.

ARTICLE IN PRESST.J. Vogler, J.D. Clayton / J. Mech. Phys. Solids 56 (2008) 297–335 335
Moriarty, J.A., Belak, J.F., Rudd, R.E., Soderlind, P., Streitz, F.H., Yang, L.H., 2002. Quantum-based atomistic simulation of materials
properties in transition metals. J. Phys. Condens. Matter 14, 2825–2857.
Nemat-Nasser, S., Okinaka, T., Ni, L., 1998. A physically-based constitutive model for BCC crystals with application to polycrystalline
tantalum. J. Mech. Phys. Solids 46, 1009–1038.
Qiu, X., Huang, Y., Nix, W.D., Hwang, K.C., Gao, H., 2001. Effect of intrinsic lattice resistance in strain gradient plasticity. Acta Mater.
49, 3949–3958.
Ramesh, K.T., Coates, R.S., 1992. Microstructural influences on the dynamic response of tungsten heavy alloys. Metall. Trans. 23A,
2625–2630.
Roundy, D., Krenn, C.R., Cohen, M.L., Morris, J.W., 2001. The ideal strength of tungsten. Philos. Mag. A–Phys. Condens. Matter.
Struct. Defects Mech. Prop. 81, 1725–1747.
Ruoff, A.L., Rodriguez, C.O., Christensen, N.E., 1998. Elastic moduli of tungsten to 15 Mbar, phase transition to 6.5Mbar, and rheology
to 6Mbar. Phys. Rev. B 58, 2998–3002.
Schoenfeld, S.E., 1998. Dynamic behavior of polycrystalline tantalum. Int. J. Plasticity 14, 871–890.
Schoenfeld, S.E., Kad, B.K., 2002. Texture effects on shear response in Ti–6Al–4V plates. Int. J. Plasticity 18, 461–486.
Schraml, S.J., Meyer, H.W., Kleponis, D.S., Kimsey, K.D., 2005. Simulating the formation and evolution of behind armor debris fields.
In: Proceedings 2005 DoD High Performance Computing Users Group Conference.
Subhash, G., Lee, Y.J., Ravichandran, G., 1994. Plastic deformation of CVD textured tungsten–I. Constitutive response. Acta Metall.
Mater. 42, 319–330.
Trott, W.M., Knudson, M.D., Chhabildas, L.C., Asay, J.R., 2000. Measurements of spatially resolved velocity variations in shock
compressed heterogeneous materials using a line-imaging velocity interferometer. In: Furnish, M.D., Chhabildas, L.C., Hixson, R.S.
(Eds.), Shock Compression of Condensed Matter. American Institute of Physics, New York, pp. 993–998.
Trott, W.M., Castaneda, J.N., O’Hare, J.J., Knudson, M.D., Chhabildas, L.C., Baer, M.R., Asay, J.R., 2001. Examination of the
mesoscopic scale response of shock compressed heterogeneous materials using a line-imaging velocity interferometer.
In: Staudhammer, K.P., Murr, L.E., Meyers, M.A. (Eds.), Fundamental Issues and Applications of Shock-Wave and High-Strain-
Rate Phenomena. Elsevier, Amsterdam, pp. 647–654.
Trott, W.M., Chhabildas, L.C., Baer, M.R., Castaneda, J.N., 2002. Investigation of dispersive waves in low-density sugar and HMX using
line-imaging velocity interferometry. In: Furnish, M.D., Thadhani, N.N., Horie, Y. (Eds.), Shock Compression of Condensed Matter.
American Institute of Physics, New York, pp. 845–848.
Trott, W.M., Baer, M.R., Castaneda, J.N., Chhabildas, L.C., Asay, J.R., 2007a. Investigation of the mesoscopic scale response of low-
density pressings of granular sugar under impact. J. Appl. Phys. 101, 024917.
Trott, W.M., Baer, M.R., Castaneda, J.N., Tappan, A.S., Stuecker, J.N., Cesarano, J., 2007b. Shock-induced reaction in a nitromethane-
impregnated geometrically regular sample configuration. In: Proceedings of the 13th International Detonation Symposium, in press.
Vogler, T.J., Reinhart, W.D., Chhabildas, L.C., 2004. Dynamic behavior of boron carbide. J. Appl. Phys. 95, 4173–4183.
Weerasooriya, T., 2003. Deformation and failure behavior of a tungsten heavy alloy under tensile loading at different strain rates.
In: Proceedings of the SEM Annual Conference on Experimental Mechanics.
Weerasooriya, T., Beaulieu, P.A., 1993. Effects of strain rate on the deformation and failure behavior of 93W–5Ni–2Fe under shear
loading. Mater. Science and Engineering A 172, 71–78.
Weerasooriya, T., Moy, P., Dowding, R., 1994. Effect of W-W contiguity on the high shear strain rate behavior of 93W–5Ni–2Fe tungsten
heavy alloy. In: Bose, A., Dowding, R. (Eds.), Proceedings of the Second International Conference on Tungsten and Refractory
Metals. Metal Powder Industries, pp. 401–409.
Weibull, W., 1951. A statistical distribution function of wide applicability. J. Appl. Mech. 18, 293–297.
Yano, K., Horie, Y., 1999. Discrete-element modeling of shock compression of polycrystalline copper. Phys. Rev. B 59, 13672–13680.
Yano, K., Horie, Y., 2002. Mesomechanics of the a–b transition in iron. Int J Plasticity 18, 1427–1446.
Zhou, F., Molinari, J.-F., 2004. Stochastic fracture of ceramics under dynamic tensile loading. Int. J. Solids Struct. 41, 6573–6596.
Zhou, M., 1993. Dynamic shear localization in a tungsten heavy alloy and ductile rupture in a spheroidized 1045 steel. Ph.D. Thesis,
Division of Engineering, Brown University, Providence, RI.
Zhou, M., 1998. Growth of shear bands in composite microstructures. Int. J. Plasticity 14, 733–754.
Zhou, M., Clifton, R.J., 1997. Dynamic constitutive and failure behavior of a two-phase tungsten composite. J. Appl. Mech. 64, 487–494.
Zhou, M., Clifton, R.J., Needleman, A., 1994. Finite element simulations of shear localization in plate impact. J. Mech. Phys. Solids 42,
423–458.
Zurek, A.K., Gray, G.T., 1991. Dynamic strength and strain rate effects on fracture behavior of tungsten and tungsten alloys. J. Phys. IV
C 3, 631–637.

NO. OF COPIES ORGANIZATION
1 DEFENSE TECHNICAL (PDF INFORMATION CTR ONLY) DTIC OCA 8725 JOHN J KINGMAN RD STE 0944 FORT BELVOIR VA 22060-6218 1 US ARMY RSRCH DEV & ENGRG CMD SYSTEMS OF SYSTEMS INTEGRATION AMSRD SS T 6000 6TH ST STE 100 FORT BELVOIR VA 22060-5608 1 DIRECTOR US ARMY RESEARCH LAB IMNE ALC IMS 2800 POWDER MILL RD ADELPHI MD 20783-1197 1 DIRECTOR US ARMY RESEARCH LAB AMSRD ARL CI OK TL 2800 POWDER MILL RD ADELPHI MD 20783-1197 1 DIRECTOR US ARMY RESEARCH LAB AMSRD ARL CI OK T 2800 POWDER MILL RD ADELPHI MD 20783-1197
ABERDEEN PROVING GROUND 1 DIR USARL AMSRD ARL CI OK TP (BLDG 4600)

NO. OF COPIES ORGANIZATION
ABERDEEN PROVING GROUND 31 DIR USARL AMSRD ARL WM J MCCAULEY T WRIGHT AMSRD ARL WM MD B CHEESEMAN C-F YEN G GAZONAS AMSRD ARL WM TA T JONES S SCHOENFELD AMSRD ARL WM TC R COATES M FERMEN-COKER S SEGLETES AMSRD ARL WM TD S BILYK T BJERKE D CASEM J CLAYTON (10 CPS) D DANDEKAR M GREENFIELD Y HUANG B LOVE M RAFTENBERG E RAPACKI M SCHEIDLER T WEERASOORIYA

INTENTIONALLY LEFT BLANK.