The role of twinning deformation on the hardening response...
14
The role of twinning deformation on the hardening response of polycrystalline magnesium from discrete dislocation dynamics simulations Haidong Fan, a,b,⇑ Sylvie Aubry, c Athanasios Arsenlis c and Jaafar A. El-Awady a a Department of Mechanical Engineering, Johns Hopkins University, Baltimore, MD 21218, USA b Department of Mechanics, Sichuan University, Chengdu, Sichuan 610065, China c Materials Science Division, Lawrence Livermore National Laboratory, Livermore, CA 94551-0808, USA Received 30 January 2015; revised 20 March 2015; accepted 24 March 2015 Abstract—The deformation of micro-twinned polycrystalline magnesium (Mg) was studied using three-dimensional discrete dislocation dynamics (DDD). A systematic interaction model between dislocations and f10 12g tension twin boundaries (TBs) was proposed and introduced into the DDD framework. In addition, a nominal grain boundary (GB) model based on experimental results was also introduced to mimic the GB’s barrier effect. The current simulations show that tension TBs act as strong obstacles to gliding dislocations, and contribute significantly to the overall hard- ening response, while twin growth results in a softening effect. Therefore, the Mg concave stress–strain curve can be explained in terms of the com- petition between TB induced hardening and twin growth induced softening. At low strain levels, twin growth induced softening dominates and a decreasing hardening rate is observed in Stage-I. In Stage-II, the TB induced hardening dominates, which leads to an increasing hardening rate. Ó 2015 Acta Materialia Inc. Published by Elsevier Ltd. All rights reserved. Keywords: Discrete dislocation dynamics; Dislocations; Twinning; Magnesium; Hardening 1. Introduction With the increasing demand to reduce carbon dioxide emission, many efforts are directed toward reducing the structural weight of fossil fuel powered vehicles to increase their fuel efficiency. As the lightest structural metal (one- third lighter than aluminum), magnesium (Mg) and its alloys have been attracting a lot of attention in recent years for their potential use in automotive, aerospace and defense applications [1]. However, at present, the wide use of Mg alloys as a structural material is still challenging due to their poor room temperature formability. Owing to its hexagonal closed packed (hcp) lattice structure and low crystal symmetry, Mg cannot maintain sufficient indepen- dent slip modes to accommodate arbitrary deformation in polycrystalline materials at room temperature. Consequently, in addition to dislocations, twinning plays an important role in their plastic deformation. Therefore, it is vital to grasp a full understanding of the combined effects of dislocations, twinning, and their mutual interactions to address their role on the overall mechanical behavior of hcp materials [2]. Due to deformation twinning, the deformation of Mg and its alloys displays characteristics that are different than those commonly observed in face centered cubic (fcc) and body centered cubic (bcc) crystals. One common character- istic is that the true stress–strain curves of both single crys- tals [3,4] and polycrystalline [4,5] Mg display a concave shape. In addition, the stress–strain curve can be character- ized by three distinct stages. In Stage-I a decreasing harden- ing rate is observed, followed by Stage-II with an increasing hardening rate, and finally a decreasing hardening rate in Stage-III [4,5]. Stage-I is generally associated with twin- ning-mediated plasticity in the form of twin nucleation and growth, leading to a decreasing hardening rate [6–8]. On the other hand, the progressive decrease in the work hardening rate in Stage-III is a result of post-saturation in the twin volume fraction leading to predominant disloca- tion-mediated plasticity [6,9]. In Stage-II, both dislocation slip and twinning are active and interact; however, the underlying mechanisms associated with the increasing hardening rate are still debated. Jiang et al. [6] examined the microstructure evolution during AZ31 deformation, and observed that in Stage-II intersections between primary and secondary f10 12g ten- sion twins result in significant grain refinement and subse- quently an increasing hardening rate. On the contrary, Wang et al. [10] reported that the barrier effect of tension twin boundaries (TBs) weakens as twins coalesce during Stage-II, which undermines the suggested contribution from grain refinement. In addition, they suggested that the increasing hardening rate can be attributed to texture induced hardening. This is a result of the tension twin hard http://dx.doi.org/10.1016/j.actamat.2015.03.039 1359-6462/Ó 2015 Acta Materialia Inc. Published by Elsevier Ltd. All rights reserved. ⇑ Corresponding author at: Department of Mechanical Engineering, Johns Hopkins University, Baltimore, MD 21218, USA; e-mail addresses: [email protected]; [email protected] Available online at www.sciencedirect.com ScienceDirect Acta Materialia 92 (2015) 126–139 www.elsevier.com/locate/actamat
Transcript of The role of twinning deformation on the hardening response...

Available online at www.sciencedirect.com
ScienceDirectActa Materialia 92 (2015) 126–139
www.elsevier.com/locate/actamat
The role of twinning deformation on the hardening responseof polycrystalline magnesium from discrete dislocation dynamics simulations
Haidong Fan,a,b,⇑ Sylvie Aubry,c Athanasios Arsenlisc and Jaafar A. El-Awadya
aDepartment of Mechanical Engineering, Johns Hopkins University, Baltimore, MD 21218, USAbDepartment of Mechanics, Sichuan University, Chengdu, Sichuan 610065, China
cMaterials Science Division, Lawrence Livermore National Laboratory, Livermore, CA 94551-0808, USA
Received 30 January 2015; revised 20 March 2015; accepted 24 March 2015
Abstract—The deformation of micro-twinned polycrystalline magnesium (Mg) was studied using three-dimensional discrete dislocation dynamics(DDD). A systematic interaction model between dislocations and f10�12g tension twin boundaries (TBs) was proposed and introduced into theDDD framework. In addition, a nominal grain boundary (GB) model based on experimental results was also introduced to mimic the GB’s barriereffect. The current simulations show that tension TBs act as strong obstacles to gliding dislocations, and contribute significantly to the overall hard-ening response, while twin growth results in a softening effect. Therefore, the Mg concave stress–strain curve can be explained in terms of the com-petition between TB induced hardening and twin growth induced softening. At low strain levels, twin growth induced softening dominates and adecreasing hardening rate is observed in Stage-I. In Stage-II, the TB induced hardening dominates, which leads to an increasing hardening rate.� 2015 Acta Materialia Inc. Published by Elsevier Ltd. All rights reserved.
Keywords: Discrete dislocation dynamics; Dislocations; Twinning; Magnesium; Hardening
1. Introduction
With the increasing demand to reduce carbon dioxideemission, many efforts are directed toward reducing thestructural weight of fossil fuel powered vehicles to increasetheir fuel efficiency. As the lightest structural metal (one-third lighter than aluminum), magnesium (Mg) and itsalloys have been attracting a lot of attention in recent yearsfor their potential use in automotive, aerospace and defenseapplications [1]. However, at present, the wide use of Mgalloys as a structural material is still challenging due totheir poor room temperature formability. Owing to itshexagonal closed packed (hcp) lattice structure and lowcrystal symmetry, Mg cannot maintain sufficient indepen-dent slip modes to accommodate arbitrary deformation inpolycrystalline materials at room temperature.Consequently, in addition to dislocations, twinning playsan important role in their plastic deformation. Therefore,it is vital to grasp a full understanding of the combinedeffects of dislocations, twinning, and their mutualinteractions to address their role on the overall mechanicalbehavior of hcp materials [2].
Due to deformation twinning, the deformation of Mgand its alloys displays characteristics that are different than
http://dx.doi.org/10.1016/j.actamat.2015.03.0391359-6462/� 2015 Acta Materialia Inc. Published by Elsevier Ltd. All rights
⇑Corresponding author at: Department of Mechanical Engineering,Johns Hopkins University, Baltimore, MD 21218, USA; e-mailaddresses: [email protected]; [email protected]
those commonly observed in face centered cubic (fcc) andbody centered cubic (bcc) crystals. One common character-istic is that the true stress–strain curves of both single crys-tals [3,4] and polycrystalline [4,5] Mg display a concaveshape. In addition, the stress–strain curve can be character-ized by three distinct stages. In Stage-I a decreasing harden-ing rate is observed, followed by Stage-II with an increasinghardening rate, and finally a decreasing hardening rate inStage-III [4,5]. Stage-I is generally associated with twin-ning-mediated plasticity in the form of twin nucleationand growth, leading to a decreasing hardening rate [6–8].On the other hand, the progressive decrease in the workhardening rate in Stage-III is a result of post-saturationin the twin volume fraction leading to predominant disloca-tion-mediated plasticity [6,9]. In Stage-II, both dislocationslip and twinning are active and interact; however, theunderlying mechanisms associated with the increasinghardening rate are still debated.
Jiang et al. [6] examined the microstructure evolutionduring AZ31 deformation, and observed that in Stage-IIintersections between primary and secondary f10�12g ten-sion twins result in significant grain refinement and subse-quently an increasing hardening rate. On the contrary,Wang et al. [10] reported that the barrier effect of tensiontwin boundaries (TBs) weakens as twins coalesce duringStage-II, which undermines the suggested contributionfrom grain refinement. In addition, they suggested thatthe increasing hardening rate can be attributed to textureinduced hardening. This is a result of the tension twin hard
reserved.

H. Fan et al. / Acta Materialia 92 (2015) 126–139 127
orientation, since its c-axis is nearly parallel to the loadingaxis. Knezevic et al. [7] showed that tension twins consumethe entire grain before the end of Stage-II, and all the afore-mentioned twinning mechanisms cannot explain the peakstrain hardening rate at the end of Stage-II. Instead, theysuggested that this peak strain hardening rate may beattributed to the nucleation of compression twins in thetension twinned grains. Barnett et al. [5] observed the for-mation of low angle boundaries arising from the glissile-to-sessile transition of dislocations induced by twinningshear [11,12], which can also act as a source of hardening.Finally, de-twinning as a result of strong interactionsbetween dislocations and twins was also suggested to con-tribute to the observed increasing strain hardening rate inStage-II [13]. These conflicting proposed mechanisms indi-cate that there is no clear consonance yet regarding themechanisms responsible for the increasing strain hardeningrate in Stage-II.
In the past two decades, several computational methodshave been developed to characterize dislocation-mediatedplasticity. Of those, discrete dislocation dynamics (DDD)is one of the most efficient methods to capture disloca-tion-mediated plasticity at the micro scale. To date, severaltwo-dimensional [14,15] and three-dimensional [16–19]DDD methods were proposed and used widely to studycrystal size effects (e.g. [20–22]), grain size effects (e.g.[23–25]) and intermittency behavior (e.g. [26]). While mostprevious DDD studies have focused on fcc and bcc crystals,more recently several studies have been performed on hcpcrystals. In particular DDD simulations of hcp materialshave focused on dislocation junction formation andstrength [27,28], orientation influence on the grain sizeeffects [25], micro/nano-pillar plasticity [29,30], elastic ani-sotropy [31], and the role of plastic anisotropy on micro-cracking [32]. It should be noted that in these studies defor-mation twinning was not considered. Nevertheless, twin-ning plays an important and sometimes dominant role inthe mechanical behavior of both single crystalline and poly-crystalline Mg. As a result, DDD simulations not account-ing for twinning may lead to inaccurate predictions of themechanical behavior of hcp materials. This also indicatesthe importance and urgency of developing a dislocation–TB interaction model within the framework of DDD toaccount for deformation twinning.
As aforementioned, the deformation of Mg and itsalloys is of great interest due to their numerous potentialapplications in industry. However, the mechanisms associ-ated with their hardening response, mainly in Stage-II, arenot well characterized. In order to address this, we proposea systematic interaction model between dislocations andf10�12g TBs, and integrate this model into 3D-DDD sim-ulations. A simple grain boundary (GB) model, whichagrees with experimental results, is also implemented.Using this complex DDD framework, the deformation ofmicro-twinned polycrystalline Mg is investigated.Specifically these simulations identify the influences ofgrain orientation, GBs, TBs and twin volume fraction onthe deformation of Mg polycrystals.
2. Computational methods
In the following simulations, a cubic simulation cell isemployed to model a representative grain in a bulk mate-rial, as shown schematically in Fig. 1(a), where periodic
boundary conditions (PBCs) are imposed along all threedirections. A twin lamella having a thickness lt is intro-duced at the center of the grain with size lg. Thus, the twinvolume fraction is given by ft = lt/lg. Here, only f10�12gtension twins are considered, as shown by the relative ori-entations of the grain and twin in Fig. 1(a). It has beenshown experimentally that the number of twins per grainis proportional to the square of grain size, and the probabil-ity of having more than one twin per grain decreases con-siderably for grains having diameters less than 40 lm [33].Thus, given the grain sizes modeled here, the current pro-posed simulation cell can be considered as a representativetwinned grain in a bulk Mg polycrystal with grain sizebelow 40 lm.
In Mg polycrystals, strain hardening can be attributed tothree microstructural features: dislocations, GBs and TBs.In order to investigate their individual contributions, threeadditional simplified cubic simulation cells are considered,as shown in Fig. 1. In one case, only dislocations areaccounted for in a single crystal cubic simulation cell withPBCs along all three directions. In another case, the con-tribution of GBs is accounted for in a polycrystal sim-ulation cell in the absence of TBs. In this case, the sixsurfaces of the simulation cell are considered as representa-tive GBs with PBCs along all three directions. Finally, theeffect of TBs is accounted for in a twinned crystal sim-ulation cell in the absence of GBs. Here, a twin lamella isinserted in the middle of the simulation cell and PBCs areemployed along all three directions. It should be noted thatthese simulation cells are idealized, since twinning is typi-cally observed experimentally in bulk single crystals andpolycrystals. Nevertheless, these simulations can providenew insights into the individual contributions of disloca-tions, GBs and TBs on the hardening response of Mg.
In metals, screw dislocation cross-slip is an importantmechanism for strain hardening [34] and creep behavior[35]. Therefore, a general cross-slip mechanism is utilizedin the current simulations. Cross-slip of a screw dislocationis possible when more than one slip system share the sameBurgers vector [36]. In particular hai dislocations can cross-slip between basal, prismatic and pyramidal I planes, hcidislocations between prismatic slip planes, and hc + aidislocations between prismatic, pyramidal I and pyramidalII planes. Further details about the cross-slip mechanismused here can be found elsewhere [36].
In fully tension-twinned grains, compressive loadingparallel to the c-axis, or tensile loading perpendicular tothe c-axis, would promote compression twinning [7].These compression twins appear always in a thin bandshape with low volume fraction [7]. To model this effect,in a small number of simulations we also introduce a nomi-nal compressive twin with a volume fraction of 0.05 in thecenter of the fully twinned grain. These compression TBsare assumed to be impenetrable to dislocations.
All current simulations were conducted using the 3D-DDD simulation code, ParaDiS [16]. All possible disloca-tion Burgers vectors and slip planes in hcp crystals, whichare listed in Table 1, were accounted for in these sim-ulations. It should be noted that according to the hcp latticestructure, slip of hai dislocations and dislocations withBurgers vector bt (i.e. twinning dislocations) on thef10�12g twinning planes are also possible. Thus, thesedislocations are accounted for in the current simulationsas well. The experimentally measured Peierls stresses fordislocations on the basal (0.52 MPa [37]), prismatic

x
y
z
Twin lamella
TB
GB
lt
lg
Grain (matrix)
( ) TB
a1
a2
a3
cc
a1
a2
a3
MatrixTwin
x
y
z
y
z
GB TB
y
z
(b) Single crystal (no GBs or TBs)
(c) Polycrystal(no TBs)
(d) Twinned crystal(no GBs)
(a) twinned polycrystal
Fig. 1. Schematic of the four simulation cells, showing twin boundaries, grain boundaries, and orientations. (a) Twinned polycrystal with both GBsand TBs; (b) single crystal without GBs or TBs; (c) polycrystal without TBs; and (d) twinned crystal without GBs.
128 H. Fan et al. / Acta Materialia 92 (2015) 126–139
(39.2 MPa [38]), and pyramidal planes (105 MPa [39]) wereintroduced into the code. These values are also in goodagreement with recent molecular dynamics (MD) cal-culations [40–43]. Basic Mg parameters used in the currentsimulations include: shear modulus, G = 17 GPa; Poissonratio, v = 0.29; magnitude of hai dislocation Burgers
vector, b = 0.325 nm; axial ratio, c/a = 1.6236; and massdensity, q = 1738 kg m�3.
While most DDD simulations typically adopt a lineardislocation mobility law, recent MD simulations suggestthat the dislocation mobility in Mg is nonlinear [41]. Atlow stress levels the dislocation velocity was shown to

Table 1. Slip systems introduced in the current DDD framework. The underlined four symbols indicate the slip systems of initial dislocations in thesimulation cell.
Slip planes Burgers vectors
hai h11�20i hci h0001i hc + ai h11�23i bt k½01�11�*
Basal – {0001} �Prismatic – f10�10g � � �Pyramidal I – f10�11g � �Pyramidal II – f11�22g �Twinning plane – f10�12g � �
* k ¼ jðc=aÞ2�3jðc=aÞ2þ3
2= .
H. Fan et al. / Acta Materialia 92 (2015) 126–139 129
increase linearly with the applied stress, and at higher stresslevels the velocity also increases linearly but with a muchsmaller slope. Thus, in the current simulations we employan MD fitted bi-linear relationship. The drag coefficientsand transition velocities for the stress–velocity curve arelisted in Table A1 in Appendix A. The upper limit to thedislocation velocity was set to be the shear wave velocity,ffiffiffiffiffiffiffiffiffi
G=pp
. Furthermore, as a first approximation, the disloca-tion mobility and Peierls stress on the twinning plane wereset equal to those on the pyramidal plane, since their pre-cise values have not been reported in literature yet.
Uniaxial strain-controlled loading (compressive or ten-sile) with a constant strain rate of _e ¼ 5000 s�1 was imposedin the current simulations. Due to the configuration sym-metry along the x and z axes with respect to the twinlamella, the loading axis is confined within the yz plane.As a result, four representative loading directions denotedby y, z, yz and y�z, are considered. Loadings along the yand z directions are realized by imposing a constant strainrate _ey ¼ _e and _ez ¼ _e in the y and z directions, respectively.The yz loading is along a direction 45� from either the y or zaxis, and is achieved by imposing the strain rate tensor:
_e ¼ _e
�v 0 0
0 ð1� vÞ=2 ð1þ vÞ=2
0 ð1þ vÞ=2 ð1� vÞ=2
264
375 ð1Þ
Similarly, the y�z loading is along a direction 45� from they axis and 135� from the z axis, and is achieved by imposingthe strain rate tensor:
_e ¼ _e
�v 0 0
0 ð1� vÞ=2 �ð1þ vÞ=2
0 �ð1þ vÞ=2 ð1� vÞ=2
264
375 ð2Þ
Initially, Frank–Read (FR) dislocation sources wererandomly distributed within the simulation cell (in boththe matrix and the twinned region). The initial dislocationsource density in all simulations was qsrc = 5 � 1012 m�2,and the FR source length was lsrc = 0.26 lm. Whiledislocation slip on various slip planes is possible in hcpcrystals as listed in Table 1, hai dislocations on basal,prismatic and pyramidal I planes as well as hc + aidislocations on pyramidal II planes play a predominantrole in dislocation mediated plasticity of Mg [44,45].Therefore, in the current simulations all dislocationsources were initially assigned to these four slip planeswith equal numbers, which also agree with previous stud-ies [25,46,47]. To account for possible statistical variationsdue to the random distribution of the dislocation sources,each simulation was repeated three times with differentinitial distributions.
2.1. Dislocation–twin boundary interaction model
To accurately model dislocation–TB interactions inDDD we first derive a set of physically based rules for theseinteractions from experimental observations and/or MDsimulations. Price [48] first studied these interactions inZinc and showed that an ha1i dislocation, which intersectsthe TB in a screw character, can transmit through the TBwithout any remnants on the TB. On the other hand,ha2iand ha3i dislocations in the matrix can only be transmittedmutually through the TB by forming a hci dislocation in thetwinned crystal while leaving two twinning dislocations onthe TB. Yoo and Wei [49] subsequently developed a set ofdislocation–TB interaction scenarios for hai and hc + aidislocations based on geometric considerations of the hcpcrystal structure. Electron microscope observations haveshown good agreement with the Yoo and Wei model [49–52]. Furthermore, Yoo [53] performed a detailed analysisand proposed twenty six distinct types of interactionsbetween three dislocation families and four most commontwin boundaries in hcp crystals. In addition to these experi-mental observations, recent MD simulations showed thatthe dislocation–TB interactions are dependent on the load-ing direction. In particular, it was shown that ha1i disloca-tions on the basal plane in the matrix can be transmitted tothe basal plane in the twin, the prismatic plane in the twin,or the prismatic plane in the matrix depending on the direc-tion of the applied load [54,55]. In addition, no residual ortwinning dislocations were left on the TB, which agrees wellwith experimental observations. However, ha2i and ha3idislocations were observed to introduce a twinning disloca-tion in the form of TB steps after absorption by the TB[56,57]. The subsequent motion of these twinning disloca-tions leads to TB migration, which agrees with the twingrowth mechanism by twinning dislocations [56].
In the current model, two rules are specified to identifythe reaction outcomes of a dislocation–TB interaction, interms of twinning dislocations on the TB as well asBurgers vectors and slip planes of the transmitted disloca-tions in the twin. In particular, these rules are based on(a) geometric constraints, and (b) maximum powerdissipation.
The geometric rule predicts the resulting dislocationsand twinning dislocations. Accordingly, the systematicinteraction scenarios of Yoo [53] between different disloca-tions (i.e. hai, hci and hc + ai) and the f10�12g TB wereintroduced into the DDD framework. It should be notedthat in Yoo’s model some peculiar dislocation reactionswere proposed. In particular, hc + ai and hci incidentdislocations were proposed to be transmitted as disloca-tions with Burgers vectors ½5�72�3�=6 and ½�1100�, respec-tively. However, these high lattice index dislocations

Fig. 2. Engineering stress–strain responses for different misorientationangles. Experimental result from [59] is also shown for comparison.
130 H. Fan et al. / Acta Materialia 92 (2015) 126–139
would not be stable because of their high Peierls stressesand core energies, and should be decomposed into morecommon dislocations having Burgers vectors with low lat-tice indexes. Our MD simulations (not presented here)show that a ½�1100� dislocation decomposes into two haidislocations such that ½�1100� ! ½�12�10�=3þ ½�2110�=3 ¼ha2i � ha1i. Furthermore, simple geometric calculationsshow that ½5�72�3�=6 can be decomposed into 1.5 hai and0.5 hc + ai dislocations (i.e. ½5�72�3�=6! ½1�210�=2þ½2�1�1�3�=6 ¼ 1:5hai þ 0:5hcþ ai). Thus, in the current sim-ulations, these low lattice index dislocations are definedinstead.
The general dislocation decomposition proposed here islisted in Table A2 in Appendix A, in which all the possibleincident dislocations from all slip planes are considered. Allthe resulting dislocation Burgers vectors and slip planeshave low lattice index. The resulting slip planes were chosento be tilt planes with respect to the incident plane. Thus, if atilt plane does not exist, the dislocation is not allowed topenetrate (i.e. twisted boundaries are impenetrable). Thisgeometric rule is analogous to that used for dislocation–GB interaction in DDD simulations of fcc polycrystals[14,23,26].
While for most incident dislocations this geometric ruleis sufficient to identify the transmitted dislocation planes,this is not the case for incident ha1i dislocations, whichintersect the TB in a screw configuration. In this case, sixpotential tilt planes in the twin exist. Serra et.al [54] showedfrom MD simulations that depending on the direction ofthe applied load a matrix ha1i dislocation on a basal planecan be transmitted to the twin basal plane, twin prismaticplane, or reflected back into the matrix on a prismaticplane. In these simple pure shear stress simulations, theresulting slip plane with the largest resolved shear stresswas typically the one with the highest dislocation mobility.However, in the current DDD simulations, the stress field isalways complex. In addition, since the Peierls stresses andmobility laws are strongly dependent on the slip systemunder consideration, thus, the plane with largest resolvedshear stress does not necessarily produce the highestdislocation mobility. To account for all these factors, themost favorable plane is chosen to be the one that wouldresult in the largest power dissipation [16]:
P ¼X
FjV j ð3Þ
where Fj and Vj are the force and velocity of the jth trans-mitted dislocation.
It should be noted that in the current simulations, plas-ticity associated with TB migration or twin growth will notbe accounted for due to the complexities of tracking anevolving boundary within the framework of DDD.
2.2. Dislocation–grain boundary interaction model
For the representative grain model with PBCs in allthree directions, shown in Fig. 1, the orientation of eachgrain in the bulk is identical, which corresponds to a strongbasal texture in polycrystalline Mg. However, the misori-entation between the a-axes in neighboring grains is notaccounted for here. Nevertheless, in the current sim-ulations, the GB is introduced as an artificial interface/bar-rier to dislocation motion. As dislocations approach theGB they will be trapped. As a result, subsequent disloca-tions are piled up at the GB, leading to increasing the shear
stress on the leading dislocation. Once this shear stressexceeds the GB strength, the leading dislocation can betransmitted into neighboring grains. This approximationwas successfully adopted by DDD simulations of polycrys-talline materials [25,58]. The GB transmission strength islargely governed by the misorientation angle, hmis, whichcan be approximated as sGB ¼ 2G sin2ð0:5hmisÞ [14,23,26].The effect of the misorientation angle on the stress–strainresponse from our DDD simulations in the absence oftwinning is shown in Fig. 2. In these simulations the grainsize was lg = 0.81 lm, and a compressive loading along they-axis was imposed, which produces a predominant basalslip deformation. An experimental stress–strain curve of a0.8 lm grained Mg alloy under a similar loading condition[59] is also shown. It is clear that a misorientation angle ofhmis = 15� (i.e. GB strength sGB ¼ 580 MPa) agrees well, interms of the yield strength, with this experimental result,and thus in all subsequent simulations this GB strength ischosen.
3. Results and discussions
3.1. Hardening response of single crystals, polycrystals andtwinned crystals
Here, the three simplified simulation cells shown inFig. 1(b–d) are employed to study the individual con-tributions of dislocations (i.e. single crystals), GBs (i.e.polycrystals with no twins) and TBs (i.e. twinned crystals)on the hardening response of Mg. All the simulation cellshave an edge-length lg = 1.3 lm, and in the simulations oftwinned crystals the twin thickness is lt = 0.5lg. Fig. 3 showsthe stress–strain responses under different loading ori-entations from the three simulation cells. Fig. 4 shows thecontours of the effective plastic strain at the end of eachsimulation, from which the slip traces can be identified. Itis observed that the responses of single crystals loadedalong the y and z directions (black curves in Fig. 3) areidentical. These two loading directions make angles

Fig. 3. Engineering stress–strain responses of single crystals, polycrys-tals and twinned crystals under different loading directions. Simulationcell dimensions are lg = 1.3 lm, and lt = 0.65 lm.
H. Fan et al. / Acta Materialia 92 (2015) 126–139 131
46.85� and 43.15�, respectively, with respect to the basalplane leading to predominant basal slip, as shown inFig. 4(a), since the Schmid factor on these planes is maxi-mum. The low yield stresses for these two loading ori-entations are mainly governed by the low Peierls stressand high dislocation mobility on the basal plane. On theother hand, loadings along the yz and y�z directions leadto higher yield points. The yz direction is almost perpen-dicular to the c-axis, and plasticity is mediated by prismatichai dislocation slip (see Fig. 4(b)). Furthermore, the y�zloading is 1.85� away from the c-axis, which leads to pre-dominant hc + ai slip on pyramidal II planes (seeFig. 4(c)). As expected, the yield stress for loading alongthe y�z direction is the highest since pyramidal slip is thehardest slip mode. It is also observed from Fig. 3 thatregardless of the loading directions, all single crystalsresults exhibit weak strain hardening response in theabsence of GBs or TBs up to 1% strain for this selectedsmall periodic simulation cell.
Fig. 3 also shows the predicted stress–strain responses ofpolycrystals loaded in four different orientations (redcurves). These simulations show that GBs lead to a signifi-cant rise in the crystal strength as compared to single crys-tal simulations. In particular, the yield strength increases by208% for y and z loadings (basal slip), by 70% for yz load-ing (prismatic slip), and by 19% for y�z loading (pyramidalslip), which are directly linked to the GB’s barrier effect.From the contour maps in Fig. 4(d–f) the deformationmodes are observed to be similar to those from single crys-tal simulations. In addition, higher strain hardening ratesare observed in all simulations with GBs (i.e. the mean val-ues from three realizations with different initial dislocationdistributions are 15.5 GPa for basal, 8.2 GPa for prismaticand 5.4 GPa for pyramidal slips). The orientation depen-dence of the hardening rate is a result of the anisotropyin slip modes and Peierls stresses in Mg. Since basal slipis a single slip orientation (Fig. 4(d)), many dislocations pileup at the GBs, which lead to a strong back stress and a highstrain hardening rate. For the prismatic and pyramidalslip orientations (Fig. 4(e–f)), plasticity is mediated by
multi-slip, resulting in fewer dislocation pileups and lowerstrain hardening rates at the same strain levels.
Finally, the twinned crystals responses are shown byblue curves in Fig. 3. A twin lamella of thickness lt = lg/2is introduced at the center of the simulation cell. For thesesimulations, only two unique loading directions exist. The yand z loading directions share the same stress–strainresponse and deformation modes in the matrix and twinnedregions, while yz and y�z loading directions share anotherone. The hardening rates for the y and yz loading directionsare 20.4 GPa and 26.6 GPa, respectively, for deformationup to 0.8% strain. These rates are significantly higher thanthose observed from the polycrystal simulations. Fig. 4(g)shows the contours of the effective plastic strain for loadingalong the y direction. Dislocation slip is predominant onbasal planes in both the matrix and the twin. Some sliptraces are observed to be fully blocked in the twin ormatrix, which is consistent with the high hardening rateobserved in Fig. 3. On the other hand, some traces are con-nected across the TB, forming a long zigzag trace frombasal planes in the matrix to basal planes in the twin.These observations are in qualitative agreement withexperimental observations [49,50]. Furthermore, Fig. 4(h)shows a different deformation response during loadingalong the yz direction. Plasticity here is confined in thematrix since the twin is in a much harder orientation (pyr-amidal slip) as compared to the softer orientation of thematrix (prismatic slip).
In order to identify the effects of TBs on the hardeningrate, the dislocation configurations from the twinned crys-tal simulations in both loading directions are shown inFig. 5. For simulations with loading along the y direction,it is observed that many parallel dislocations pile up againstthe TB as shown in Fig. 5(a) by straight dislocations (red inthe matrix and green in the twin). In this case, all the piledup dislocations in the matrix and twin are basal ha2i andha3i dislocations, since the Schmid factor for ha1i disloca-tion is zero. According to the dislocation–TB interactionmodel shown in Table A2, these dislocations should decom-pose as follows
ha2i or ha3i ! 0:5hcþ ai þ bt ð4ÞThus, when the first dislocation (incident dislocation bi)
arrives at the TB, it decomposes into one half hc + aidislocation (a sessile residual dislocation br on the TB)and a twinning dislocation (bt), as shown in Fig. 5(a1).This decomposition is similar to that reported by MD sim-ulations [55–57] and predicted experimentally [49,50].While the Schmid factor on the TB is zero, the twinningdislocation is observed to glide away on the TB, as shownin Fig. 5(a2), due to the repulsive force between the residualdislocation and twinning dislocation. This residual disloca-tion also has a repulsive interaction with subsequent inci-dent dislocations, which contributes to the dislocationspileup near the TB (see Fig. 5(a2)). With the increasingapplied stress and number of pileup dislocations, the shearstress acting on the new leading incident dislocation in thepileup increases remarkably, and overcomes the repulsiveinteraction with the residual dislocation on the TB. Thus,the new incident dislocation would reach the TB and thendecompose into another one half hc + ai dislocation anda twinning dislocation. Therefore, an integrated hc + aidislocation can subsequently be emitted into the twinnedcrystal from the TB, as shown in Fig. 5(a3). This is

Fig. 4. Contours of effective plastic strain for: single crystals with loading in the (a) y, (b) yz, (c) y�z directions; polycrystals with loading in the (d) y,(e) yz, (f) y�z directions; and twinned crystals with loading in the (g) y, (h) yz directions. In (g) and (h), the image is a quad-duplicate of the originalcontour.
132 H. Fan et al. / Acta Materialia 92 (2015) 126–139
consistent with experimental observations [50,51]. As fur-ther dislocations reach the TB, the same decompositionprocesses would repeat. Finally, it should be noted thatwhile dislocation transmission across the TB is observedin the current simulations, it occurs only at high local stresslevels due to heavy dislocation pileups, as shown inFig. 5(a4). This is one possible reason for the strong barriereffect of the TB based on the current proposed dislocation–TB interaction model.
On the other hand, during loading along the yz direc-tion two dense dislocation networks are observed on the
TBs (see Fig. 5(b)). Fig. 5(b1) shows that the network con-sists of two intersecting sets of parallel straight disloca-tions, and a group of curved dislocations. As statedpreviously, during loading along the yz direction, plasticityis accommodated by prismatic slip in the matrix.According to Eq. (4), the straight dislocations are halfhc + ai residual dislocations, resulting from the incidentprismatic hai dislocations. The angle between the intersect-ing sets is 45.7�, which is the angle between the intersectionlines of two prismatic planes on the TB. Furthermore, thecurved dislocations are twinning dislocations, which glide

Fig. 5. Dislocation configurations in twinned crystals loaded in the (a) y and (b) yz directions. The inserts (a1) through (a4) and (b1) showdislocation–TB interaction details.
H. Fan et al. / Acta Materialia 92 (2015) 126–139 133
on the TB, since the Schmid factor is nonzero for thisorientation.
As shown in Fig. 4(g), loading along the y direction is asingle slip orientation since plasticity is accommodated bybasal slip only. Thus, plasticity is confined to distinct planesand many dislocation pileups would be expected at the TBs(see Fig. 5(a)). On the other hand, loading along the yzdirection leads to multi-slip deformation on prismaticplanes. Subsequently, the contour of effective plastic strainin the matrix is uniform, as seen in Fig. 4(h), and fewdislocation pileups are expected at the TBs (Fig. 5(b)) forthe same strain level. It should be noted that prismatic slipduring yz loading induces a higher hardening rate thanbasal slip during y loading, which seems contradictory tothe hardening in Mg polycrystals as previously discussed.In fact, this is a result of the hard orientation (pyramidalslip) of the twin with respect to the yz loading axis, in whichalmost no plastic deformation is observed (Fig. 4(h)).Furthermore, in the yz loading the Schmid factor on theTB plane is high, leading to the glide of many twinning
dislocations. This would subsequently contribute greatlyto TB motion and twin growth [56,57], in agreement withexperiments oriented for compressive loading perpendicu-lar to the c-axis [6,8].
The current DDD simulations provide direct evidenceof the three popular hardening mechanisms that are usu-ally attributed to twinning in Mg and its alloys: (a)Hall–Petch induced hardening due to grain refinementby the evolving twins [9,60,61]; (b) Basinski mechanism:glissile-to-sessile transformation of dislocations due tothe twinning shear [11,12]; and (c) texture hardeninginduced by the hard orientation in the twins [10,12].Fig. 5(a) and (b) shows many sessile residual disloca-tions remain on the TB, which agrees well with theBasinski mechanism. The TBs also act as strong obsta-cles to dislocation motion, inducing grain refinementhardening. In addition, the absence of plasticity in thetwinned region (see Fig. 4(h)) clearly demonstrates thehardening induced by the lattice orientation of thetwins.

Fig. 6. Engineering stress–strain responses of twinned polycrystalshaving different twin volume fractions under (a) yz compressive and (b)y�z tensile loadings.
134 H. Fan et al. / Acta Materialia 92 (2015) 126–139
3.2. Hardening response of twinned polycrystals
To identify the collective contribution of dislocations,GBs and TBs on the hardening response of Mg, in this sub-section the deformation of twinned polycrystals is investi-gated. In the following simulations the grain size is keptconstant at lg = 1.3 lm and the twin size, lt, is varied toaddress the effect of twin volume fraction. Tension twin-ning has been reported experimentally to be facilitated bycompression perpendicular to the c-axis, or tension parallelto the c-axis [6,8]. These correspond to the yz compressiveloading and y�z tensile loading, respectively.
The engineering stress–strain responses for different twinvolume fractions (ft = lt/lg) under yz compressive loadingare shown in Fig. 6(a). The case of ft = 0.0 correspondsto a polycrystal prior to twinning, while ft = 1.0 corre-sponds to a fully twinned polycrystal. It is clear that theyield stress increases with increasing twin volume fraction,until it reaches a maximum at ft = 0.7. The inset in Fig. 6(a)shows that dislocation activity in the matrix contributesmostly to the overall plastic deformation for ft < 0.7.Subsequently, an increasing twin volume fraction resultsin reducing the matrix volume, which in turn results inincreasing the yield stress of the crystal. Furthermore, thecase of ft = 1.0 indicates that the yield stress for the twinorientation is about 350 MPa. Thus, for a volume fractionft > 0.5, once the yield stress exceeds 350 MPa, dislocationslip in the twin begins to contribute to the overall plasticdeformation. For ft > 0.7, the overall plastic deformationis mainly accommodated by dislocation slip in the twin,since fewer dislocation sources would be present in thesmaller matrix region. Therefore, the yield stress decreaseswith further increase in the twin volume fraction.
In a fully twinned grain (i.e. ft = 1.0), the c-axis is closeto the yz compressive loading direction, which is an ori-entation that would promote compression twinning.Knezevic et al. [7] observed compression twins and doubletwins in such oriented grains. These compression twinsalways appear in a thin band shape having a low volumefraction, and it was suggested that this contributes to thepeak hardening rate in Stage-II [7]. To model this, here,we introduced a nominal compressive twin with a volumefraction of 0.05 in the center of the fully twinned grain.In the current simulations these compression TBs areassumed to be impenetrable to dislocations. To keep thenotation consistent, this case is denoted by ft = 1.05.Fig. 6(a) shows that the volume fraction of ft = 1.05 resultsin the highest yield stress, which supports the potential con-tribution of compression twins on hardening in Mg poly-crystals after tension twin saturation.
The stress–strain responses as a function of tension twinvolume fraction under y�z tensile loading are plotted inFig. 6(b). The yield stress displays a different character thanthat of yz compressive loading. The yield stress is observedto increase with increasing twin volume fraction up toft = 0.2. Subsequently, for a volume fraction 0.2 6 ft 6 1.0,the yield stress continuously decreases. This can beexplained as follows. Under y�z tensile loading, the matrixc-axis is close to the loading direction, thus, the matrix isoriented for a hard deformation mode (i.e. pyramidal sliporientation). For ft 6 0.2, the plastic deformation is mainlymediated by dislocations activity in the matrix. Thus, as thetwin volume fraction increases the matrix volumedecreases, leading to an increasing yield stress. For
ft > 0.2, the plastic deformation is gradually dominatedby dislocation slip in the twin, which is in a soft orientation(i.e. prismatic slip orientation), as shown by the inset inFig. 6(b). As a result, the yield stress decreases with increas-ing twin volume fraction.
It should be noted that the initial dislocation densities inall simulations of different twin volume fractions shown inFig. 6 are the same. However, in real Mg crystals, the twinvolume fraction increases with increasing strain, and itmight be expected that subsequently the dislocation densitywould also increase. These increases in the dislocation den-sity are not accounted for in the current study due to com-putational difficulties associated with the increasingnumber of degrees of freedom with increasing dislocationdensity.
Fig. 7 shows the hardening rate due to dislocation slip,hS, as a function of twin volume fraction for the two load-ing directions. These rates are computed from a linear fit ofthe stress–strain curves in Fig. 6 above a plastic strain ofep = �0.05%. It is observed that the dislocation slipinduced hardening rate during yz loading increases with

H. Fan et al. / Acta Materialia 92 (2015) 126–139 135
increasing twinning volume fraction for ft 6 0.3, thendecreases for 0.3 6 ft 6 1.0, as shown in Fig. 7(a).Subsequently, the hardening rate increases again with theintroduction of a compression twin with 0.05 volume frac-tion in the fully twinned grain (i.e. ft = 1.05). On the otherhand, the dislocation slip induced hardening rate during y�ztensile loading from the current DDD simulations is shownin Fig. 7(b). Similar trends to the yz compressive loadingare observed, with hS increasing for ft 6 0.4, then decreas-ing for 0.4 6 ft 6 1.0. Furthermore, for the case of fullytwinned grains with compressive twinning at a volume frac-tion of 0.05 (i.e. ft = 1.05), the dislocation slip inducedhardening rate is observed to subsequently increase, whichagrees well with experimental predictions [7].
It should be noted that only dislocation-mediated plas-ticity is accounted for in the current DDD simulations.Under actual experimental conditions, plastic deformationis mediated by both dislocation slip and twin growth (TG),with twin growth playing a major role especially at lowstrain levels. Thus, the contribution from twinning plastic-ity must be taken into account. Accordingly, the overallhardening rate, h, can be decomposed into a contribution
Fig. 7. Slip induced hardening rate hS as a function of twin volumefraction under (a) yz compressive and (b) y�z tensile loadings.
induced by dislocation slip and a contribution induced bytwin growth such that:
h ¼ drde ¼
d E e�epslip�ep
twin
� �� �de
¼ E �d Eep
slip
� �de
0@
1Aþ � d Eep
twinð Þde
� �¼ hs þ hTG
ð5Þ
Here, hTG is the hardening rate induced by twin growthonly, and can be computed from the twin volume fraction[8] such that
hTG ¼ �d Eep
twin
� �de
¼ �E �mctwin
dft
deð6Þ
where �m and ctwin are the average Schmid factor of the twinvariants and characteristic twinning shear, respectively. Forf10�12g tension twins in Mg and its alloys, ctwin = 0.13,while �m ¼ 0:437, and 0.499 for yz compressive loadingand for y�z tensile loading, respectively [8].
For comparison with experiments, the dislocation slipinduced hardening rates, hS, as measured from AZ31 poly-crystals experiments under yz compressive, and y�z tensileloadings [8] are also shown in Fig. 7. It is observed thatthe shape of the dislocation slip induced hardening rate,hS, from DDD simulations is in qualitative agreement withthe experimental measurements, indicating that the DDDsimulations are capable of capturing the main deformationmechanisms in Mg polycrystals. However, the experimentalcurves show higher hardening rates than the current DDDsimulations. This difference can be attributed to two mainreasons: (1) the experiments are performed on AZ31 poly-crystals having a high density of second phase particles[29], while the simulations are performed on pure Mg poly-crystals; (2) the initial dislocation density in the simulationsis always fixed at qsrc = 5 � 1012 m�2 for all modeled twinvolume fractions, while in the experiments the dislocationdensity is expected to continuously increase with increasingtwin volume fraction or applied strain. These differencesbetween the simulation conditions and the experiments sug-gest that the dislocation-mediated hardening rate as mea-sured experimentally will be higher than those predictedfrom the current DDD simulations.
In order to compute the twin growth induced hardeningrate hTG through Eq. (6), the twin volume fraction reportedexperimentally from six different groups [6–8,62–65] forthese two loading paths is plotted in Fig. 8 as a functionof the applied strain. It is important to note that the twinvolume fraction as a function of strain has been reportedin literature to be independent of grain sizes [66], whichagrees well with Fig. 8 for grain sizes 10–107 lm.Through this, the twin growth induced hardening rate,hTG, can be numerically computed from Eq. (6) based onthe results shown in Fig. 8.
Finally, Fig. 9 shows the dislocation slip induced hard-ening rate, hS, as predicted from DDD, the twin growthinduced hardening rate, hTG, as predicted from Fig. 8,and the overall hardening rate, h = hS + hTG, for the twosimulated loading paths. For the yz compressive loading,the experimentally measured hTG is always negative andcontinuously increases with increasing twin volume frac-tion, as shown in Fig. 9(a). Furthermore, two stages canbe identified from the overall hardening rate h: (a) decreas-ing hardening rate for twin volume fraction ft 6 0.1; and (b)

Fig. 8. Experimentally reported tension twin volume fraction in AZ31with different grain sizes as a function of strain in two different loadingpaths. The best polynomial fitting curves, f t ¼ �42:0e2 þ 13:6e� 0:083for yz compressive loading (perpendicular to c-axis), andf t ¼ �1650:6e3 þ 303:4e2 � 4:9eþ 0:00817 for y�z tensile loading (par-allel to c-axis), are also shown.
Fig. 9. Hardening rate as a function of twin volume fraction for (a) yz
compressive loading and (b) y�z tensile loading.
136 H. Fan et al. / Acta Materialia 92 (2015) 126–139
increasing hardening rate for ft > 0.1. These two stagesmimic the experimentally reported Stage-I and Stage-II[6–8,64]. In addition, for ft = 1.05 (i.e. compression twinsin fully twinned grains), the highest hardening rate isachieved. This indicates that compression twins in the fullytension-twinned grains can be attributed to the peak hard-ening rate in Stage II, which agrees well with experimentalresults [7]. It should be noted that the total hardening rateis mainly negative, because the dislocation slip induced hS
computed in current DDD simulations is lower than thatmeasured in experiments, as clearly shown in Fig. 7.
As previously mentioned, there are at least three sourcescontributing to strain hardening in Mg polycrystals, includ-ing dislocation forest hardening, GBs induced hardening,and TBs induced hardening, which all contribute to hS. InSection 3.1, the dislocation forest hardening effect for singlecrystals was observed to be weak (see Fig. 3). Furthermore,GBs do produce considerable hardening, however, this con-tribution does not change with increasing twin volume frac-tion. Therefore, the variations in hS as a function of twinvolume fraction are largely induced by the TBs, also con-veying TBs produce a hardening effect on the overallresponse. On the other hand, the experimentally measuredtwin growth induced hardening rate, hTG, is always nega-tive, as shown in Fig. 9(a), indicating twin growth producesa softening effect in the presence of dislocation slip. As aresult, the two stages in the overall hardening rate, h, canbe explained by the competition between TB induced hard-ening and twin growth induced softening. In Stage-I, thetwin growth induced softening dominates, so a decreasingoverall hardening rate is seen. In Stage-II, both the TBinduced hardening and twin growth induced softeningdecline, but the latter declines more rapidly, leading to adecreasing overall hardening rate.
On the other hand, Fig. 9(b) shows the hardening ratesduring y�z tensile loading, in which identical phenomenon tothe yz compressive loading is observed. The overall harden-ing rate h displays two distinct stages, which are similar to
yz compressive loading and experimental observations[8,64]. Again, the case of fully twinned grains with compres-sive twinning at a volume fraction of 0.05 (i.e. ft = 1.05)yields the peak hardening rate in Stage II, in good agree-ment with experimental observations [7]. These two stagescan also be interpreted based on the competition betweenTB induced hardening and twin growth induced softening.
4. Conclusions
In this work, a systematic interaction model betweendislocations and f10�12g TBs was proposed. In this modelall the possible incident dislocations were taken intoaccount. In order to mimic the GB strengthening, a nomi-nal GB model agreeing with experimental results was pro-posed. Both the TB and GB models were introduced intothe DDD framework to study the mechanical behavior ofa representative twinned Mg grain. It was shown thatTBs are strong obstacles to dislocation glide, and play adominant role in the hardening response. On the otherhand, the plastic deformation induced by twin growth pro-duces a softening effect. Therefore, a competition exists
H. Fan et al. / Acta Materialia 92 (2015) 126–139 137
between TB induced hardening and twin growth inducedsoftening. This competition results in the concave stress–strain curve. At low strain levels, the twin growth inducedsoftening dominates, leading to a decreasing hardening ratein Stage-I. In Stage-II, the hardening effect dominates,which leads to an increasing hardening rate.
Acknowledgements
This research was sponsored by the Army ResearchLaboratory (#W911NF-12-2-0022). The views and conclusions
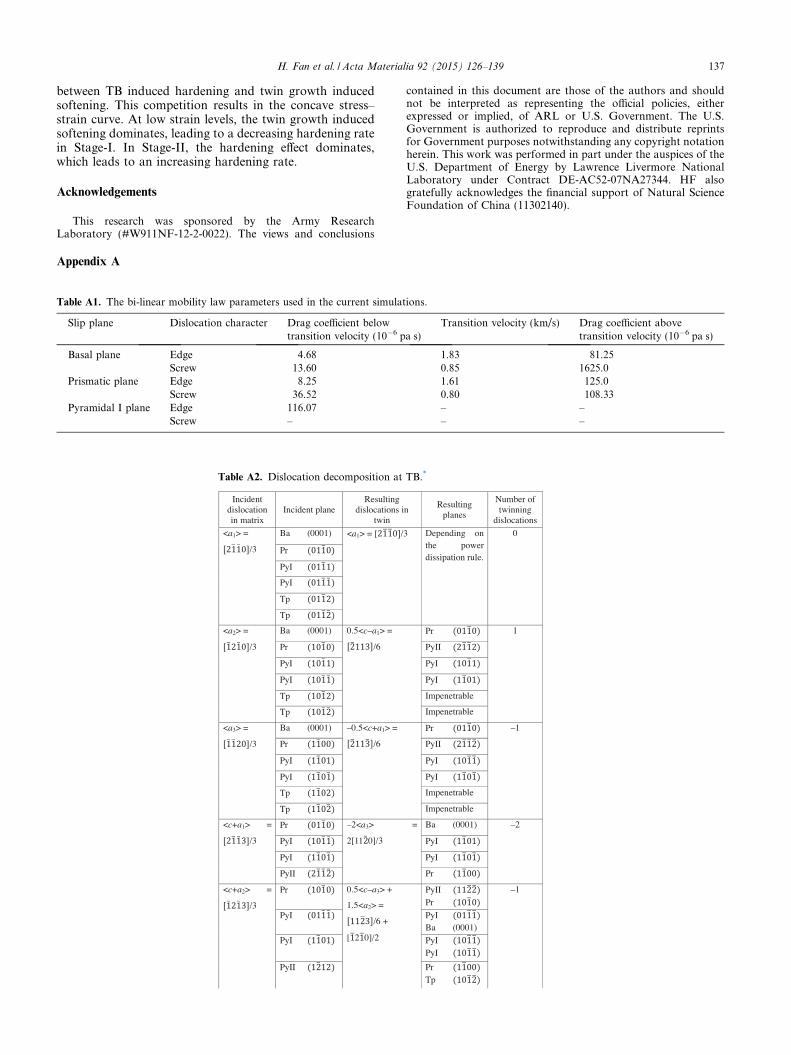
Table A2. Dislocation decomposition at
Table A1. The bi-linear mobility law parameters used in the current simulat
Slip plane Dislocation character Drag coefficient belowtransition velocity (10�6 p
Basal plane Edge 4.68Screw 13.60
Prismatic plane Edge 8.25Screw 36.52
Pyramidal I plane Edge 116.07Screw –
Appendix A
contained in this document are those of the authors and shouldnot be interpreted as representing the official policies, eitherexpressed or implied, of ARL or U.S. Government. The U.S.Government is authorized to reproduce and distribute reprintsfor Government purposes notwithstanding any copyright notationherein. This work was performed in part under the auspices of theU.S. Department of Energy by Lawrence Livermore NationalLaboratory under Contract DE-AC52-07NA27344. HF alsogratefully acknowledges the financial support of Natural ScienceFoundation of China (11302140).
TB.*
ions.
a s)Transition velocity (km/s) Drag coefficient above
transition velocity (10�6 pa s)
1.83 81.250.85 1625.01.61 125.00.80 108.33– –– –

* Ba = basal plane, Pr = prismatic plane, PyI = pyramidal I plane,PyII = pyramidal II plane, Tp = twinning plane.
138 H. Fan et al. / Acta Materialia 92 (2015) 126–139
References
[1] A.A. Luo, J. Magnesium Alloy 1 (2013) 2.[2] J.W. Christian, S. Mahajan, Prog. Mater. Sci. 39 (1995) 1.[3] K.E. Prasad, K. Rajesh, U. Ramamurty, Acta Mater. 65
(2014) 316.[4] E.W. Kelley, W.F. Hosford, Technical Report, 1967.[5] M.R. Barnett, Z. Keshavarz, A.G. Beer, D. Atwell, Acta
Mater. 52 (2004) 5093.[6] L. Jiang, J.J. Jonas, A.A. Luo, A.K. Sachdev, S. Godet,
Mater. Sci. Eng. A 445–446 (2007) 302.[7] M. Knezevic, A. Levinson, R. Harris, R.K. Mishra, R.D.
Doherty, S.R. Kalidindi, Acta Mater. 58 (2010) 6230.[8] S.-G. Hong, S.H. Park, C.S. Lee, Acta Mater. 58 (2010) 5873.[9] A.A. Salem, S.R. Kalidindi, R.D. Doherty, Acta Mater. 51
(2003) 4225.[10] B. Wang, R. Xin, G. Huang, Q. Liu, Mater. Sci. Eng. A 534
(2012) 588.[11] Z.S. Basinski, M.S. Szczerba, M. Niewczas, J.D. Embury, S.J.
Basinski, Rev. Metall. 94 (1997) 1037.[12] A.A. Salem, S.R. Kalidindi, R.D. Doherty, S.L. Semiatin,
Metall. Mater. Trans. A 37 (2006) 259.[13] D. Sarker, D.L. Chen, Scr. Mater. 67 (2012) 165.[14] H. Fan, Z. Li, M. Huang, X. Zhang, Int. J. Solids Struct. 48
(2011) 1754.[15] E. Van der Giessen, A. Needleman, Model. Simul. Mater. Sci.
Eng. 3 (1995) 689.[16] A. Arsenlis, W. Cai, M. Tang, M. Rhee, T. Oppelstrup, G.
Hommes, T.G. Pierce, V.V. Bulatov, Model. Simul. Mater.Sci. Eng. 15 (2007) 553.
[17] H.M. Zbib, M. Rhee, J.P. Hirth, Int. J. Mech. Sci. 40 (1998)113.
[18] L.P. Kubin, G. Canova, M. Condat, B. Devincre, V. Pontikis,Y. Brechet, Solid State Phenom. 23 and 24 (1992) 455.
[19] J.A. El-Awady, S. Bulent Biner, N.M. Ghoniem, J. Mech.Phys. Solids 56 (2008) 2019.
[20] H. Fan, Z. Li, M. Huang, Scr. Mater. 67 (2012) 225.[21] C. Ouyang, Z. Li, M. Huang, H. Fan, Int. J. Solids Struct. 47
(2010) 3103.[22] J.A. El-Awady, Nat. Commun. 6 (2015).[23] Z. Li, C. Hou, M. Huang, C. Ouyang, Comput. Mater. Sci. 46
(2009) 1124.[24] M. Huang, Z. Li, J. Tong, Int. J. Plast. 61 (2014) 112.[25] H. Fan, S. Aubry, A. Arsenlis, J.A. El-Awady, Scr. Mater. 97
(2015) 25.[26] H. Fan, Z. Li, M. Huang, Scr. Mater. 66 (2012) 813.[27] C.C. Wu, P.W. Chung, S. Aubry, L.B. Munday, A. Arsenlis,
Acta Mater. 61 (2013) 3422.[28] G. Monnet, B. Devincre, L.P. Kubin, Acta Mater. 52 (2004)
4317.[29] Z.H. Aitken, H. Fan, J.A. El-Awady, J.R. Greer, J. Mech.
Phys. Solids 76 (2015) 208.[30] G.S. Kim, Ph.D. thesis, University of Grenoble, 2011.[31] L. Capolungo, I.J. Beyerlein, Z.Q. Wang, Model. Simul.
Mater. Sci. Eng. 18 (2010) 085002.[32] S. Olarnrithinun, S.S. Chakravarthy, W.A. Curtin, J. Mech.
Phys. Solids 61 (2013) 1391.[33] M.R. Barnett, Scr. Mater. 59 (2008) 696.[34] A.M. Hussein, S.I. Rao, M.D. Uchic, D.M. Dimiduk, J.A. El-
Awady, Acta Mater. 85 (2015) 180.

H. Fan et al. / Acta Materialia 92 (2015) 126–139 139
[35] J. Chevy, F. Louchet, P. Duval, M. Fivel, Philos. Mag. Lett.92 (2012) 262.
[36] S. Aubry, V.V. Bulatov, M. Rhee, G. Hommes, A. Arsenlis,Model. Simul. Mater. Sci. Eng. (submitted for publication(2015)).
[37] H. Conrad, W.D. Robertson, Trans. Met. Soc. AIME 209(1957) 503.
[38] R.E. Reed-Hill, W.D. Robertson, Acta Metall. 5 (1957) 717.[39] A. Staroselsky, L. Anand, Int. J. Plast. 19 (2003) 1843.[40] Y. Tang, J.A. El-Awady, Mater. Sci. Eng. A 618 (2014) 424.[41] S. Groh, E.B. Marin, M.F. Horstemeyer, D.J. Bammann,
Model. Simul. Mater. Sci. Eng. 17 (2009) 075009.[42] J.A. Yasi, T. Nogaret, D.R. Trinkle, Y. Qi, L.G. Hector Jr.,
W.A. Curtin, Model. Simul. Mater. Sci. Eng. 17 (2009)055012.
[43] H. Fan, J.A. El-Awady, Q. Wang, J. Nucl. Mater. 458 (2015)176.
[44] Y. Tang, J.A. El-Awady, Acta Mater. 71 (2014) 319.[45] S.R. Agnew, O. Duygulu, Int. J. Plast. 21 (2005) 1161.[46] J. Zhang, S.P. Joshi, J. Mech. Phys. Solids 60 (2012) 945.[47] J. Zhang, K.T. Ramesh, S.P. Joshi, Model. Simul. Mater. Sci.
Eng. 22 (2014) 075003.[48] P.B. Price, Proc. R. Soc. Lond. A Mater. 260 (1961) 251.[49] M.H. Yoo, C-T. Wei, Philos. Mag. 14 (1966) 573.[50] D.I. Tomsett, M. Bevis, Philos. Mag. 19 (1969) 129.
[51] J.I. Dickson, C. Robin, Mater. Sci. Eng. 11 (1973) 299.[52] S. Lay, G. Nouet, Philos. Mag. A 70 (1994) 1027.[53] M.H. Yoo, Trans. Met. Soc. AIME 245 (1969) 1841.[54] A. Serra, D.J. Bacon, Acta Metall. 43 (1995) 4465.[55] M. Yuasa, K. Masunaga, M. Mabuchi, Y. Chino, Philos.
Mag. 94 (2013) 285.[56] A. Serra, D.J. Bacon, Philos. Mag. A 73 (1996) 333.[57] J. Wang, I.J. Beyerlein, C.N. Tome, Int. J. Plast. 56 (2014)
156.[58] C. Zhou, R. LeSar, Int. J. Plast. 30–31 (2011) 185.[59] B. Li, S. Joshi, K. Azevedo, E. Ma, K.T. Ramesh, R.B.
Figueiredo, T.G. Langdon, Mater. Sci. Eng. A 517 (2009) 24.[60] S. Asgari, E. El-Danaf, S. Kalidindi, R. Doherty, Metall.
Mater. Trans. A 28 (1997) 1781.[61] Y. Xin, M. Wang, Z. Zeng, M. Nie, Q. Liu, Scr. Mater. 66
(2012) 25.[62] H.J. Yang, S.M. Yin, C.X. Huang, Z.F. Zhang, S.D. Wu,
S.X. Li, Y.D. Liu, Adv. Eng. Mater. 10 (2008) 955.[63] C. Lou, X. Zhang, G. Duan, J. Tu, Q. Liu, J. Mater. Sci.
Technol. 30 (2014) 41.[64] J.H. Park, H.L. Kim, J.E. Jung, Y.W. Chang, Met. Mater.
Int. 19 (2013) 389.[65] A.J. Levinson, Ph.D. thesis, 2012.[66] A. Ghaderi, M.R. Barnett, Acta Mater. 59 (2011) 7824.


![Nature%20of%20 matter[1]](https://static.fdocuments.net/doc/165x107/55c09605bb61eb275a8b477f/nature20of20-matter1-55c224035f17f.jpg)