Stereotype Threat, Self-Affirmation, and Women's ...
40
San Jose State University San Jose State University SJSU ScholarWorks SJSU ScholarWorks Master's Theses Master's Theses and Graduate Research Fall 2014 Stereotype Threat, Self-Affirmation, and Women's Statistics Stereotype Threat, Self-Affirmation, and Women's Statistics Performance Performance Blanca Tapia San Jose State University Follow this and additional works at: https://scholarworks.sjsu.edu/etd_theses Recommended Citation Recommended Citation Tapia, Blanca, "Stereotype Threat, Self-Affirmation, and Women's Statistics Performance" (2014). Master's Theses. 4517. DOI: https://doi.org/10.31979/etd.fd5x-3fah https://scholarworks.sjsu.edu/etd_theses/4517 This Thesis is brought to you for free and open access by the Master's Theses and Graduate Research at SJSU ScholarWorks. It has been accepted for inclusion in Master's Theses by an authorized administrator of SJSU ScholarWorks. For more information, please contact [email protected].
Transcript of Stereotype Threat, Self-Affirmation, and Women's ...
San Jose State University San Jose State University
SJSU ScholarWorks SJSU ScholarWorks
Master's Theses Master's Theses and Graduate Research
Fall 2014
Stereotype Threat, Self-Affirmation, and Women's Statistics Stereotype Threat, Self-Affirmation, and Women's Statistics
Performance Performance
Blanca Tapia San Jose State University
Follow this and additional works at: https://scholarworks.sjsu.edu/etd_theses
Recommended Citation Recommended Citation Tapia, Blanca, "Stereotype Threat, Self-Affirmation, and Women's Statistics Performance" (2014). Master's Theses. 4517. DOI: https://doi.org/10.31979/etd.fd5x-3fah https://scholarworks.sjsu.edu/etd_theses/4517
This Thesis is brought to you for free and open access by the Master's Theses and Graduate Research at SJSU ScholarWorks. It has been accepted for inclusion in Master's Theses by an authorized administrator of SJSU ScholarWorks. For more information, please contact [email protected].

STEREOTYPE THREAT, SELF-AFFIRMATION, AND WOMEN’S
STATISTICS PEFORMANCE
A Thesis
Presented to
The Faculty of the Department of Psychology
San José State University
In Partial Fulfillment
of the Requirements for the Degree
Master of Arts
by
Blanca Tapia
December 2014

© 2014
Blanca Tapia
ALL RIGHTS RESERVED

The Designated Thesis Committee Approves the Thesis Titled
STEREOTYPE THREAT, SELF-AFFIRMATION, AND WOMEN’S
STATISTICS PEFORMANCE
by
Blanca Tapia
APPROVED FOR THE DEPARTMENT OF PSYCHOLOGY
SAN JOSE STATE UNIVERSITY
December 2014
Dr. Clifton Oyamot Department of Psychology
Dr. Arlene Asuncion Department of Psychology
Dr. Ron Rogers Department of Psychology

ABSTRACT
STEREOTYPE THREAT, SELF-AFFIRMATION, AND WOMEN’S
STATISTICS PEFORMANCE
by Blanca Tapia
Stereotype threat (fear of confirming a negative group stereotype that in turn can inhibit
academic performance) has been implicated in the gender gap observed in the field of
mathematics. Even though stereotype threat depresses women’s performance, there has
been much research reporting various interventions that ameliorate its negative effects.
The current study investigated stereotype threat specifically in statistics—an unexplored
area in the research literature —and the alleviating effects of self-affirmation.
Participants in three conditions (control, stereotype threat, stereotype threat + affirmation)
completed a statistics test. In both stereotype threat conditions participants were given a
verbal prime to induce stereotype threat, but only the stereotype threat + affirmation
condition was given the affirmation task. The predictions that stereotype threat would
depress women’s statistics performance and that self-affirmation would minimize
stereotype threat were not supported. How a performance expectation relates to a
successful stereotype threat prime was discussed as are study limitations and directions
for future research.
Keywords: stereotype threat, statistics, women, self-affirmation, performance
expectations
v
ACKNOWLEDGEMENTS
I thank Dr. Valerie Hoffman, Dr. Joanna Fanos, Dr. Mary Still, Dr. Jeffrey
Danese and Dr. Sylvie Pelaprat for their assistance with participant recruitment. I thank
Dr. Clifton Oyamot for his guidance.

vi
TABLE OF CONTENTS
SECTION PAGE
INTRODUCTION…..…………………………………………………………… 1
METHOD………………………………………………………………………… 9
Research Participants …………………………………………………… 9
Materials……………………………………………………………........ 11
Procedure…………………………………………………………………. 11
RESULTS………………………………………………………………………… 15
DISCUSSION……………………………………………………………………… 21
REFERENCES……………………………………………………………………. 26
APPENDICES……………………………………………………………………. 29
Appendix A. Statistics Exam ……………………………………………. 29

vii
LIST OF TABLES
TABLE PAGE
1. Demographic Characteristic …………………………………………. 9
2. Reason and Number of Participants Dropped from Original Sample…. 11
3. Means and Standard Deviations for Stats Grade, Level of Stats Identification, and Time-lapse Since the Completion of Stats by Condition…….…………………………………………………….……. 16 4. Means and Standard Deviations for Statistics Exam Performance ……. 17 5. Means, Standard Deviations and Paired-samples t-test Results for Self- Expectations and Other Expectations…………………………………… 19 6. Means, Standard Deviations, and Paired-samples t-test Results for Self-expected Score and Actual Performance Score………………………………….. 20 7. Means and Standard Deviations for Participants’ Performance Expectations as a Function of Condition………………………………………………….. 21

viii
LIST OF FIGURES
FIGURE PAGE
1. Mean percentage of items answered correct by condition ……………….. 18

1
INTRODUCTION
There is an underrepresentation of women in the field of mathematics (National
Science Foundation [NSF], 2013). Even though women earn 45% of undergraduate
degrees in mathematics they make up only 17% of university faculty in mathematics
(National Science Foundation [NSF], 2008b). Math anxiety is most often reported by
girls and is assumed to play a role in the observed gender gap (Wigfield & Meece, 1988).
Anxiety and gender disparities are not only observed in the general subject of
mathematics, but also more specifically in statistics (Carlson, 2000; Loftsgaarden &
Watkins, 1998; Onwuegbuzie, 1995). Onwuegbuzie (1995) reported that high statistics
anxiety is partially responsible for the underperformance of women completing a
statistics test under time pressure. In addition, across the United States, tenured female
professors make up only 4.9% of the total faculty at universities teaching statistics
courses at the Ph.D. level (Loftsgaarden & Watkins, 1998). The International Statistics
Institute (ISI) is an international scientific association with the goal of promoting
collaborative work among prominent statisticians. The ISI has a total of 2,009 members,
but only 192 of them are women (Carlson, 2000).
Even though some, like Harvard’s former president, Larry Summers, argue that
men innately have greater quantitative skills, others argue that social environmental
factors have led to the underrepresentation of women in the math and statistics domains.
The stereotype threat phenomenon emerged as a factor that would help explain the
gender gap in quantitative fields, like mathematics and statistics. Stereotype threat is fear
of confirming a negative group stereotype that in turn can inhibit academic performance

2
(Steele & Aronson, 1995). Even though stereotype threat is well known for its
detrimental effects on women’s math performance (Spencer, Steele, & Quinn, 1999), it
has not been linked specifically to women’s statistics performance. The current
investigation was primarily concerned with determining whether women’s performance
in statistics could be affected by stereotype threat. If so, could self-affirmation be an
effective stereotype threat reduction strategy? This study was a replication of Martens,
Johns, Greenberg, and Schimel’s (2006) Study 1, with three exceptions: (1) I specifically
assessed statistics (rather than math) performance, (2) I made the stereotype threat prime
explicit (rather than subtle) and (3) I tested only women.
Stereotype threat research originally focused on race-based stereotypes and
academic disparities. Specifically, Steele and Aronson (1995) investigated stereotype
threat in relation to the stereotype that Blacks have inferior intellectual abilities compared
to Whites. Stereotype threat theory suggests that activating this stereotype in Blacks
should produce stereotype threat and thus hinder performance. Steele and Aronson told
their participants that they would complete a test that measured their intellectual abilities,
activating the stereotype mentioned above, and therefore inducing stereotype threat.
Steele and Aronson then provided evidence of the underperformance of Blacks,
compared to Whites, on items from the Graduate Record Exam (GRE) verbal test when
the test was presented as diagnostic of intellectual ability, rather than non-diagnostic.
There were similar performance deficits among Blacks even when the task was not
framed as diagnostic of ability but instead participants were asked to report their race
prior to beginning the test. It appears to be that by simply stating their race, Black

3
participants activated negative intellect-related group stereotypes, which in turn
hampered academic performance.
The stereotype threat phenomenon has not only been found present with race-
based stereotypes but also with gender-based stereotypes relating to math performance.
Spencer, Steele, and Quinn (1999) were among the first of many to investigate the
relationship between stereotype threat and gender-math stereotypes. In Study 1 the
researchers found that compared to men, women highly qualified in math
underperformed on a difficult math test even though no explicit threat had been imposed.
The underperformance of women occurred with difficult, but not easy math tests. In
Study 2 the researchers found that when women were explicitly told that the math test
they would complete had not shown gender differences in performance, their
performance improved and was equal to that of men. However, when women were told
that gender differences had been found they underperformed. Study 3 replicated the
findings of Study 2 and examined possible mediators to help explain the stereotype
threat-performance relationship. Even though it was difficult to clearly identify a
mediator, it was suggested that evaluation apprehension (an individual’s concern about
how others view him or her) and anxiety influenced the performance of women.
Numerous studies have supported Spencer et al.’s (1999) finding that priming
women with stereotype threat leads to their underperformance in math (Ford, Ferguson,
Brooks, & Hagadone, 2004; Inzlicht & Ben-Zeev, 2000; Johns, Schmader, & Martens,
2005; Martens, Johns, Greenberg, & Schimel, 2006; McIntyre, Paulson, & Lord, 2003;
Murphy, Steele, & Gross, 2007; Rosenthal & Crisp, 2006; Rosenthal, Crisp, & Suen,

4
2007; Taylor, Lord, McIntyre, & Paulson, 2011). Even though research documenting
stereotype threat and women’s math underperformance is well established, no studies
have specifically explored whether stereotype threat leads to women’s underperformance
in statistics. Given that statistics involves quantitative skills and provokes anxiety
(Onwuegbuzie, 1995), as does math (Wigfield & Meece, 1988), it is reasonable to believe
that women can experience stereotype threat in statistics. In addition, statistics is a
required course for psychology majors and according to GradPsych (2011), a publication
of the American Psychological Association, women vastly outnumber men in most
psychology PhD programs; however, women hold fewer tenure-track faculty positions in
psychology compared to men (NSF, 2008b). Therefore, the primary goal of this
investigation was to test whether stereotype threat could hinder women’s performance on
statistics tests.
Interventions
Given the detrimental consequences of stereotype threat, researchers have been
actively searching for methods through which to eliminate stereotype threat. There has
been research investigating indirect ways that help reduce stereotype threat. For
example, some studies have focused on the benefits of individual differences such as
having a sense of humor (Ford et al., 2004) or having an effective coping style (Matheson
& Cole, 2004). Other studies have examined how certain settings have reduced
stereotype threat. For example, having present non-stereotypical office objects (Cheryan,
Plaut, Davies, & Steele, 2009), testing in same-sex environments (Inzlicht & Ben-Zeev,

5
2000), or knowing one’s ethnicity is well represented (Purdie-Vaughns, Steele, Davies, &
Ditlmann, 2008).
More importantly, researchers have investigated a variety of specific and direct
interventions that have proven successful in reducing the stereotype threat effects on
performance. Approaching a threatening task as a challenge (e.g., a learning experience)
improved performance (Alter, Aronson, Darley, Rodriguez, & Ruble, 2010; Stout &
Dasgupta, 2013) as did focusing on intergroup similarities (e.g., characteristics;
Rosenthal & Crisp, 2006). In addition, knowledge of successful role models has been
another form of combating stereotype threat. McIntyre, Paulson, and Lord (2003)
reported that women who read the biographies of successful women performed better on
a math test compared to women in the control condition. Marx, Ko, and Friedman (2009)
found that African Americans performed better on a verbal test at times when Barack
Obama’s success was most salient. Taylor, Lord, McIntyre, and Paulson (2011) found
that reading Hillary Clinton’s biography improved math performance, but only for
women who believed Clinton deserved her success. Furthermore, Aronson, Fried, and
Good (2002) found that African Americans trained to view intelligence as malleable,
rather than fixed, reported higher enjoyment and value of academics, and they had higher
end of semester grades compared to participants in the control condition. Directly
informing participants about stereotype threat, prior to taking a math test, has also shown
to improve math performance (Johns et al., 2005).

6
Self-Affirmation
Self-affirmation techniques are another form of reducing the negative effects of
stereotype threat (Martens et al., 2006). Even though the interventions discussed above
are effective, they are not always as practical as the self-affirmation intervention. In
addition, most other interventions directly refute the stereotype presented; however, self-
affirmation is more directed towards one’s psychological response to the threat. How one
responds to a threat as opposed to simply discounting the threat may prove to be a more
significant coping strategy. Self-affirmation theory posits that we are motivated to
protect ourselves when threatened and that affirming a non-threatened part of our self can
protect our self-concept (Sherman & Cohen, 2006). The key of self-affirmation is to
focus on positive aspects of the self-concept that are unrelated to the immediate situation.
There are different methods by which to affirm the self, for example, writing about
important values (Creswell, Dutcher, Klein, Harris, & Levine, 2013; Martens et al.,
2006), or receiving positive individual feedback (Derks, Scheepers, Van Laar, &
Ellemers, 2011). Self-affirmation has been used to combat chronic stress (Creswell et al.,
2013) and stereotype threat (Derks et al., 2011; Martens et al., 2006).
Creswell, Dutcher, Klein, Harris, and Levine (2013) illustrated the alleviating
effects of self-affirming on a stereotype threat component: stress. After collecting self-
report data on stress levels from their participants, the participants were randomly
assigned to a self-affirmation or control condition. Participants in the self-affirmation
condition wrote about their most important value, whereas participants in the control
condition wrote about their least important value. After the writing exercise, the

7
participants completed the Remote Associates Task (RAT), which is a measure of
problem-solving and creativity. The results revealed that self-affirming improved
problem-solving performance in individuals reporting chronic stress. Self-affirmation
does not only reduce stress, but it also improves cardiac activity when threatened.
Derks, Scheepers, Van Laar, and Ellemers (2011) examined self- and group-
affirmation coping strategies to improve negative cardiovascular activity that resulted
from stereotype threat. The women in this study were primed with the stereotype that
women have poor car-parking abilities, and were then required to perform a car parking
task. The results indicated that for women highly identified with their group, the group-
affirmation coping strategy (i.e., focusing on positive group characteristics) was most
effective. This was demonstrated by the individual’s cardiac activity indicating
challenge, rather than threat, during the car parking task. For women who did not
identify as highly with their group, the self-affirmation coping strategy (i.e., focusing on
positive self-characteristics) was most effective as indicated by their cardiovascular
patterns. Derks and colleagues are not the only researchers that have found the positive
effects of self-affirmation.
Similar to Derks et al. (2011), Martens et al. (2006) also investigated whether
self-affirmation was an effective way to minimize stereotype threat, however, in contrast
to Derks et al., Martens et al. measured math performance. In Study 1, participants were
randomly assigned to a control, stereotype threat, or stereotype threat + affirmation
condition. All participants were told that they would work on “reasoning problems.”
The stereotype threat and stereotype threat + affirmation participants were also told that
8
these problems would directly measure their math intelligence, and that their abilities and
limitations would be evaluated. The participants were then given a “preliminary form.”
This form instructed participants to list 11 “characteristics and values” in order of
importance. The participants in the stereotype threat + affirmation condition were then
instructed to write about their number one value listed. They had to write about why this
value was important to them, and to give an example of when this value had been
particularly important to them. The participants in the other two conditions were
instructed to write about their ninth most important value and to describe why this value
could be important to others, and to generate an example of when the value could have
been important to another person. All participants then completed a math test. The
results revealed that the stereotype-threatened women who self-affirmed outperformed
women in the stereotype threat condition. In Study 2, the researchers found similar
results. After informing participants that women have inferior spatial rotation abilities
compared to men, they were given a spatial rotation task. Martens et al. found that the
women given the self-affirmation writing task (as in Study 1) prior to the spatial rotation
task performed better, compared to the stereotype threat only condition.
Present Study
In the present study I tested whether (a) the women-math stereotype threat
phenomenon extended to statistics test performance, and (b) whether a self-affirmation
strategy could inhibit the effects of math-women stereotype threat. I hypothesized that
(a) women primed with stereotype threat would have score lower on a statistics test than

9
women not primed with stereotype threat, and (b) self-affirming women primed with
stereotype threat would perform as well as women not primed with stereotype threat.
Method
Participants
The participants were 74 female psychology students from a writing workshop at
San José State University who were assigned to one of three conditions: control,
stereotype threat, or stereotype threat + affirmation. The participants varied in age and
ethnicity (see Table 1).
Table 1 Demographic Characteristics (n = 52) Demographic Characteristic n Percent Age
18-24 43 82.7 25-34 4 7.7 35-44 0 0 45 and over 1 1.9 Missing 4 7.7
Ethnicity
White 9 17.3 Hispanic/Latino 16 30.8 Black/African American 3 5.8 Asian/Pacific Islander 12 23.1 Other 1 1.9 Two or more selected 8 15.4 Missing 3 5.8
Stats Grade
A+ 4 7.7 A 9 17.3 A- 4 7.7 B+ 9 17.3 B 7 13.5 B- 4 7.7

10
C+ 5 9.6 C 7 13.5 C- 1 1.9 D+ or below 1 1.9 Have not taken stats 1 1.9
Of this total sample, a subset (n = 52) were retained in the data analysis based on
a series of inclusion criteria. The inclusion criteria required participants to identify with
statistics (identification ≥ 4), successfully answer the manipulation question, and
successfully affirm if in the affirmation condition (see Table 2). I selected participants
who identified with statistics, as indicated by a score of 4 or higher on a 7-point Likert
scale ([1] strongly disagree to [7] strongly agree, with [4] neutral as the midpoint) when
responding to the following question, ‘‘It is important to me that I am good at statistics”
(Krendl, Richeson, Kelley, & Heatherton, 2008). According to previous research (Krendl
et al., 2008) scoring a 4 or higher on this question would imply that an individual
identifies with statistics, which is a prerequisite to the stereotype threat experience. That
is, when individuals do not identify with the subject under investigation it is not possible
to prime with stereotype threat. In addition, participants needed to have completed
elementary statistics with a passing grade. Psychology Writing Workshop students were
ideal because passing elementary statistics is a prerequisite for writing workshops.
Requiring participants to have passed elementary statistics helps to further support the
assumption that our participants identified with statistics and improved our confidence
that they were competent to successfully complete the statistics test administered.

11
Table 2 Reason and Number of Participants Dropped from Original Sample (n = 74) Reason n
Did not identify with statistics 10 Missing statistics identification 2 Failed manipulation check 5 Missing manipulation check 7 Failed to affirm 1
Materials
The statistics exam that was used in the current study has been a long-used
assessment instrument in the Psychology department at San José State University.
Typically, upon completion of elementary statistics, students are administered this exam.
The statistics exam is a general education assessment designed to assess the degree to
which a predetermined learning outcome is being met (Learning Outcome 7: Focus on
applications of mathematical concepts to statistical inference). The exam included 10
items with four answer choices and only one choice being correct in a multiple choice
format.
Procedure
A large part of the procedure was replicated from the Martens et al.’s (2006)
Study 1, with three exceptions: (1) I specifically assessed statistics (rather than math)
performance, (2) made the stereotype threat prime explicit (rather than subtle) and (3) I
used only women.
The writing workshop student participants were recruited through their writing
workshop instructors and completed the study during their regularly scheduled class in
mixed-sex groups, ranging approximately from three to 25. A mixed-sex environment

12
was deemed to be appropriate for this study because previous research has found sex
composition to affect women’s math performance (Inzlicht & Ben-Zeev, 2000). Inzlicht
and Ben-Zeev (2000) found that as the number of women increased so did their math
performance, and as the number of men increased women’s math performance decreased.
Therefore, I opted for a mixed-sex environment to obtain the most fair and unbiased
environment possible. In addition, Martens et al. (2006) along with other classic studies
(Johns et al., 2005; McIntyre et al., 2003; Spencer et al., 1999) tested in mixed-sex
groups and mixed-sex groups simulate real-world testing environments.
Each class as a whole was assigned to one of the three conditions (control,
stereotype threat, or stereotype threat + affirmation). Assigning classes to conditions was
necessary due to time-constraints and the nature of the manipulation, which was a verbal
prime. Assigning the participants to the different conditions within the same classroom,
and trying to give different verbal instructions would have been time consuming and may
have given away the manipulation. Upon arrival, the participants were first given a
consent form and were informed of their rights and responsibilities. After signing the
consent form, the participants indicated the extent to which statistics was important to
them (described above).
The participants in the control condition were told that they would be “working
on some reasoning problems” that were being tested for future studies, and that the
study’s purpose was to obtain “people’s impressions of the problems.” Participants were
also asked to “make a strong and genuine effort” while they were taking the test.

13
In contrast, the participants in the stereotype threat and stereotype threat +
affirmation conditions were told that they would complete some reasoning problems and
that the test was a “direct measure of their statistics intelligence,” that the study was
primarily interested in “statistics and reasoning abilities,” and that “As you may know
there has been some controversy about whether there are gender differences in statistics
ability. Previous research has sometimes shown gender differences and sometimes
shown no gender differences. Sometimes men do better than women, sometimes they
don’t. Yet little of this research has been carried out with women and men in
psychology. You were selected for this experiment because you are psychology majors’’
(Spencer et al., 1999). The participants in the stereotype threat conditions were also
asked to “make a strong and genuine effort” so that I could assess “abilities and
limitations.”
The participants in the stereotype threat + affirmation condition then continued on
to a form that served as the self-affirmation writing exercise. This self-affirmation
writing task was replicated from the Martens et al. (2006) study described above. The
exercise instructed students to list their 11 most important “characteristics and values,”
with 1 being their most important, and 11 being their least important. The pre-
determined list included items like humor, social skills and relations with friends/family.
Then they were asked to write about why their number 1 item was most important to
them, and to give an example of a specific time when this item had been especially
important.

14
Similarly, the participants in the control and stereotype threat conditions were also
given this form, however, they wrote about their ninth characteristic by describing why
this characteristic may have been important to another person and to provide an example
of when that characteristic could have been important to the other person. Prior to
beginning the statistics test, the participants were given a measure of performance
expectations in which they were asked to predict the score they expected to get out of
100, and the score they expected other participants to get out of 100 (Rosenthal et al.,
2007).
All participants were then allowed to begin the statistics test and were given 7 min
to complete the test. Not only has previous research used this similar time frame
(Rosenthal & Crisp, 2006; Rosenthal et al., 2007), but in addition I wanted this time
frame to help intensify the stereotype threat experience. The front cover of the test
provided basic instructions as the allotted time to complete the test, and stated that I
would assess the number of items answered correctly and therefore that they should
attempt to answer as many problems as possible. For the participants in the stereotype
threat conditions the cover page displayed “Statistical Examination” and the participants
were required to indicate their gender prior to beginning the test, another technique found
to prime stereotype threat (Steele & Aronson, 1995). After the test was completed, the
participants completed a general questions form, which included a manipulation check.
The general questions form asked for participants’ elementary statistics final grade, how
long ago they completed elementary statistics, Scholastic Aptitude Test (SAT) or
American College Testing (ACT) quantitative score, ethnicity, age, and gender (if not

15
already stated). The manipulation check question asked participants to restate what the
experimenter mentioned about gender differences in statistics. Finally, the participants
were debriefed and thanked for their participation.
Results
A critical aspect of this study was to successfully prime participants with
stereotype threat. All 29 participants who were given the prime successfully answered
the manipulation check question. Seven out of these 29 participants reported hearing
about stereotype threat and were able to accurately describe it.
Because random assignment was done at the class- rather than individual-level, it
was important to confirm that the participants in the three different conditions were
equivalent on variables that may have been relevant to statistics performance. I
conducted several one-way analyses of variance (ANOVA). There was not a significant
difference between groups in obtained elementary statistics grade (F (2, 49) = .14, p =
.87), level of statistics identification (F (2, 49) = .12, p = .89), or in time-lapse since the
completion of elementary statistics (F (2, 47) = 1.37, p = .27). On average the
participants obtained a B letter grade in elementary statistics, “somewhat agreed” with
the statistics identification question (‘‘It is important to me that I am good at statistics”),
and had taken elementary statistics about one to two years ago (see Table 3).
16
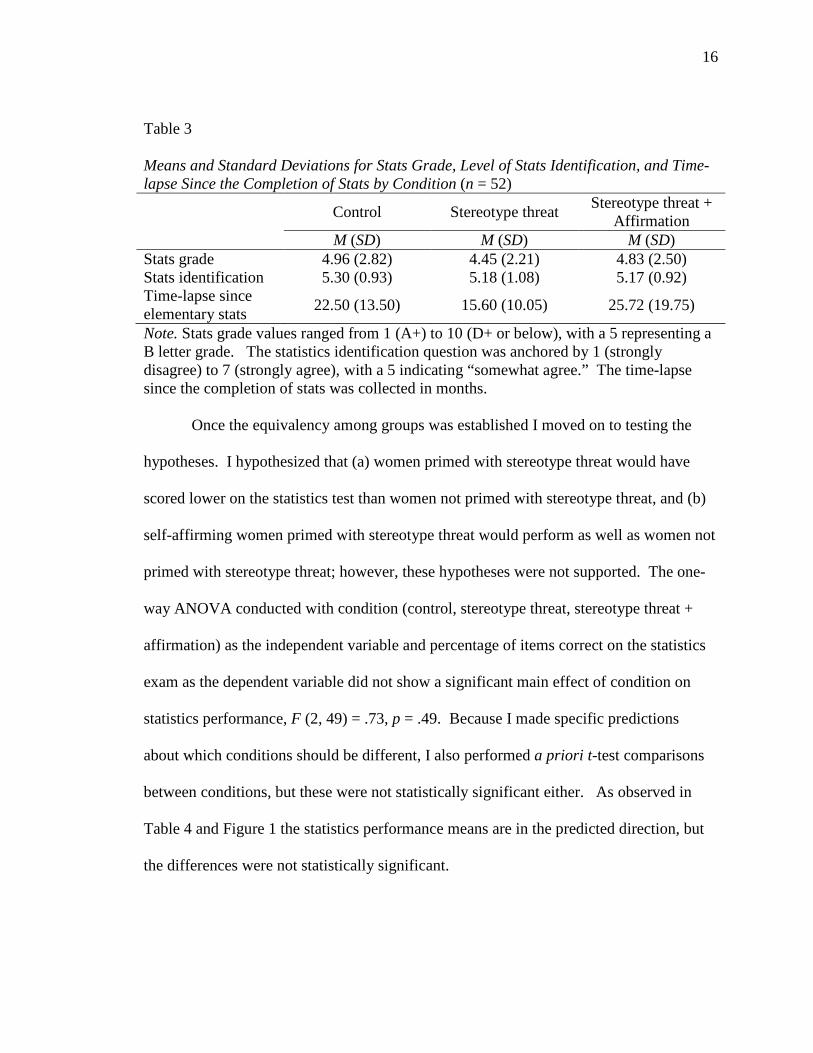
Table 3 Means and Standard Deviations for Stats Grade, Level of Stats Identification, and Time-lapse Since the Completion of Stats by Condition (n = 52)
Control Stereotype threat Stereotype threat +
Affirmation M (SD) M (SD) M (SD)
Stats grade 4.96 (2.82) 4.45 (2.21) 4.83 (2.50) Stats identification 5.30 (0.93) 5.18 (1.08) 5.17 (0.92) Time-lapse since elementary stats
22.50 (13.50) 15.60 (10.05) 25.72 (19.75)
Note. Stats grade values ranged from 1 (A+) to 10 (D+ or below), with a 5 representing a B letter grade. The statistics identification question was anchored by 1 (strongly disagree) to 7 (strongly agree), with a 5 indicating “somewhat agree.” The time-lapse since the completion of stats was collected in months. Once the equivalency among groups was established I moved on to testing the
hypotheses. I hypothesized that (a) women primed with stereotype threat would have
scored lower on the statistics test than women not primed with stereotype threat, and (b)
self-affirming women primed with stereotype threat would perform as well as women not
primed with stereotype threat; however, these hypotheses were not supported. The one-
way ANOVA conducted with condition (control, stereotype threat, stereotype threat +
affirmation) as the independent variable and percentage of items correct on the statistics
exam as the dependent variable did not show a significant main effect of condition on
statistics performance, F (2, 49) = .73, p = .49. Because I made specific predictions
about which conditions should be different, I also performed a priori t-test comparisons
between conditions, but these were not statistically significant either. As observed in
Table 4 and Figure 1 the statistics performance means are in the predicted direction, but
the differences were not statistically significant.

17
Although the differences are in the predicted direction, relatively small sample
sizes may have reduced the power of the analysis enough that they did not reach
statistical significance. I followed up on this possibility in two ways. First, to increase
the sample size I conducted a similar set of analysis but with a less rigorous inclusion
criteria, allowing participants regardless of statistics identification into the sample (n =
69). However, even though the trends became more pronounced they did not reach
statistical significance. Second, I assessed “practical significance” by calculating
Cohen’s d effect sizes. The effect sizes revealed that the control vs. stereotype threat
groups had a medium-small effect size (d = .44). The control vs. stereotype threat +
affirmation groups had a small effect size (d = .26), and the stereotype threat vs.
stereotype threat + affirmation groups also had a small effect size (d = .20). For 80
percent power the analysis suggested a total of 159 participants.
Table 4 Means and Standard Deviations for Statistics Exam Performance (n = 52)
Condition n M SD Control 23 54.78 19.04 Stereotype Threat 11 46.36 22.92 Stereotype Threat + Affirmation
18 50.00 19.10

18
Figure 1. Mean percentage of items answered correct by condition (n = 52).
Stereotype Threat Prime and Performance Expectations
I also examined how the presence or absence of stereotype threat may have
affected participants’ performance expectations. First, participants most often expected
others to perform better than them, as found through a series of paired-sample t-tests (See
Table 5). This was true in the control condition and stereotype threat + affirmation
condition. However, in the stereotype threat condition there was not a significant
difference between expected score for self and other. If stereotype threat was
successfully activated, I would have expected that particularly in the stereotype threat
condition there would have been a large difference between expected score for self vs.
expected score for others. In theory, primed participants should have expected to
perform much worse compared to other participants, given the threatening state they were
42
44
46
48
50
52
54
56
Per
form
ance
Control Stereotype Threat (ST)
ST + Aff

19
assumed to be in. Because this difference was not found in the one condition it was most
expected, it leads to questioning whether the stereotype threat manipulation had the
intended effect.
Table 5
Means, Standard Deviations and Paired-samples t-test Results for Self-Expectations and Other-Expectations
Self exp Other exp 95% CI of the difference
Condition M (SD) M (SD) t df p
Control (n = 21)
67.81 (14.50)
73.90 (10.82)
-12.02, -0.17 -2.15* 20 .04
Stereotype threat
(n = 11) 71.82
(15.21) 76.82 (9.29)
-12.95, 2.95 -1.40 10 .19
Stereotype threat + Aff
(n = 18) 67.06
(13.18) 76.22 (8.36)
-16.06, -2.28 -2.81* 17 .01
* p < .05.
To continue exploring whether the stereotype threat prime was successful or not, I
investigated how the participants’ expected performance scores compared to their actual
scores. A series of paired-sample t-tests revealed that across all conditions the
participants expected to perform better than they actually performed (see Table 6). In
contrast, what has been observed with stereotype threat primed participants is that their
expected performance score matched more closely to their actual score, both scores
typically being low (Rosenthal et al., 2007). This suggests that participants have lowered
their performance expectations because stereotype threat was successfully activated.

20
Table 6
Means, Standard Deviations, and Paired-samples t-test Results for Self-expected Score and Actual Performance Score
Expected
Score
Actual Score 95% CI of the
difference
Condition M (SD) M (SD) t df p
Control (n = 23)
67.78 (14.80)
54.78 (19.04)
1.62, 24.38 2.37* 22 .03
Stereotype threat
(n = 11) 71.82
(15.21) 46.36
(22.92) 9.38, 41.53 3.53* 10 <.005
Stereotype threat + Aff
(n = 18) 67.06
(13.18) 50
(19.10) 5.53, 28.58 3.12* 17 <.006
* p < .05.
Moreover, I was curious to learn whether participant performance expectations
differed between groups. The performance expectations did not differ between groups.
A one-way ANOVA demonstrated that there was not a significant difference between
groups F (2, 49) = .41, p = .66 (see Table 7). Because only the participants in the
stereotype threat condition were assumed to be in a negatively altered state, it is
surprising that their performance expectations were just as high as the expectations of the
other participants. These results along with those mentioned above strongly suggest that
the stereotype threat prime did not have its intended effect.

21
Table 7 Means and Standard Deviations for Participants’ Performance Expectations as a Function of Condition (n = 52)
Condition n M SD Control 23 67.78 14.80 Stereotype Threat 11 71.82 15.21 Stereotype Threat + Affirmation
18 67.06 3.18
Finally, I was interested in comparing the performance of the current study’s
participants with former elementary statistics students. Boyajian (2011) analyzed data
from San José State University students for the statistics exam used in the current study.
The data were collected from the Spring 2008 through Spring 2010 and included 413
participants. Participants from the previous data set performed somewhat better (M =
60.83, SD = 10.80) than the participants in the current study (M = 51.35, SD = 19.81).
This difference is understandable given that there had been some time interval between
students’ completion of elementary statistics and participating in this study.
Discussion The hypotheses that (a) women primed with stereotype threat would have score
lower on the statistics test than women not primed with stereotype threat, and (b) self-
affirming women primed with stereotype threat would perform as well as women not
primed with stereotype threat were not supported. Even though previous investigators
have found support for these hypotheses (Martens et al., 2006) it is possible that there
were design and data collection limitations that made it difficult to detect significant
differences in the results. Because this is a well-established area of research, it is
possible that a Type II error was encountered. Importantly, the trends detected were

22
promising and future work that can address this study’s limitations may find support for
its hypotheses.
The small sample size is a significant limitation. Having a small sample size is a
concern because it reduces one’s ability to statistically detect a difference even when
there is a real underlying difference. I made two attempts to address this limitation.
First, I used less rigorous inclusion criteria to allow for the sample size to increase.
Increasing the sample size did not lead to statistically significant results; however, the
trends became more pronounced in the predicted direction. Second, I calculated effect
sizes among groups. The effect sizes were in the medium-small range. Future work
should strongly consider replicating this study with a much larger sample size as this
could potentially increase both power and effect sizes.
The inability to have successfully primed the participants with stereotype threat is
another significant limitation. Seven participants were familiar with stereotype threat and
this may have affected their performance (e.g., demand characteristics). Moreover,
Rosenthal, Crisp, and Suen (2007) found not only that stereotype threat inhibits
performance, but also that performance expectations mediate the stereotype threat-
performance relationship (Rosenthal et al., 2007). That is, typically stereotype threat
reduces performance expectations, which in turn inhibit performance. The current
findings do not support what Rosenthal et al. found. The participants in the stereotype
threat condition expected to perform similar to others (as opposed to lowering their
expectations) and they inaccurately overestimated their performance (as opposed to
accurately expecting to underperform). This may suggest that stereotype threat was

23
never activated and that is why the participants’ expectations were never lowered. Even
though there was a manipulation check question implemented and I attempted to make
the stereotype threat prime explicit it may not have been sufficient. It is difficult to be
certain that stereotype threat was induced. Future studies should review the various ways
by which to prime participants and determine what methods are most effective and with
what type of participants. It is not possible to prime participants that do not identify with
statistics (Krendl et al., 2008) therefore, how much stereotype threat is activated could
vary. It could be that stereotype threat is more activated with the participants who
“highly” identify with statistics and not quite as activated with the participants that only
“somewhat” identify with statistics. Future studies can have stricter inclusion criteria,
including only the participants that “highly” identify with statistics if it is true that
stereotype threat activation can vary.
Previous research has shown that women’s concern of being evaluated by others
(evaluation apprehension; Spencer et al., 1999) helps explain stereotype threat. It is
unclear whether this occurred in this study particularly because the performance
expectations findings suggest that the participants were not under stereotype threat,
however, future studies should consider examining this mediator. Future studies should
also consider assessing level of gender identification. It is possible that women vary in
levels of gender identification or that perhaps identify more strongly with other variables
like race, or roles. Level of gender identification can influence the stereotype threat
experience. For example, low gender identification perhaps makes an individual less
susceptible to gender-based stereotype threat.

24
For pragmatic reasons, true random assignment was not used. Time-constraints
and the verbal prime used made it difficult to randomly assign the participants to different
conditions within the same classroom. Because classes as a whole were assigned to
conditions, it is possible that preexisting differences among participants remained. To
address this concern, I conducted an analysis comparing groups based on obtained
elementary statistics grade, level of statistics identification, and time-lapse since the
completion of elementary statistics. This analysis did not detect any statistically
significant differences between groups. However, note that the absence of true random
assignment reduces experimental control. In addition, the students were not informed
with much anticipation that they would have the opportunity to participate in this study or
that they would be completing a timed stats exam. Overall, increasing the sample size,
successfully priming with stereotype threat, and using random assignment would increase
the chances of detecting a significant impact of stereotype threat on statistics
performance, if such a phenomenon exists.
The gender gap in mathematics remains present (NSF, 2013). Future research
needs to focus not only on alleviating stereotype threat but also in preventing it. Parents
and primary educators should consider implementing regular exercises that can help
eliminate negative stereotypes when they are still forming. Also, it would be beneficial
to identify children who may be most vulnerable to stereotype threat to effectively
intervene. More research is also needed with non-college-student populations. It is
unclear at what age or education level people begin to experience stereotype threat. It is
unfortunate and of great concern that women are opting out of fields like mathematics

25
and statistics. I am hopeful that stereotype threat research will help eliminate the
educational barriers women continue to face.

26
References
Alter, A. L., Aronson, J., Darley, J. M., Rodriguez, C., & Ruble, D. N. (2010). Rising to the threat: Reducing stereotype threat by reframing the threat as a challenge. Journal of Experimental Social Psychology, 46(1), 166-171 doi:10.1016/ j.jesp. 2009.09.014 Aronson, J., Fried, C. B., & Good, C. (2002). Reducing the effects of stereotype threat on African American college students by shaping theories of intelligence. Journal of Experimental Social Psychology, 38(2), 113-125. doi:10.1006/jesp.2001.1491 Boyajian, J. (2011). Exploring an introductory statistics general education assessment using classical test theory and item response theory. Unpublished manuscript. Carlson, B. (2000) Women in the statistics profession: A status report. International Statistical Review, 68(3), 339-352. doi: 10.1111/j.1751-5823.2000.tb00335.x Cheryan, S., Plaut, V. C., Davies, P. G., & Steele, C. M. (2009). Ambient belonging: How stereotypical cues impact gender participation in computer science. Journal of Personality and Social Psychology, 97(6), 1045-1060. doi:10.1037/a0016239 Creswell, J. D., Dutcher, J. M., Klein, W. M. P., Harris, P. R., & Levine, J. M. (2013). Self-affirmation improves problem-solving under stress. PLoS ONE 8(5): e62593. doi:10.1371/journal.pone.0062593 Derks, B., Scheepers, D., Van Laar, C., & Ellemers, N. (2011). The threat vs. challenge of car parking for women: How self- and group affirmation affect cardiovascular responses. Journal of Experimental Social Psychology, 47, 178-183. doi:10.1016 /j.jesp.2010.08.016 Ford, T. E., Ferguson, M. A., Brooks, J. L., & Hagadone, K. M. (2004). Coping sense of humor reduces effects of stereotype threat on women's math performance. Personality and Social Psychology Bulletin, 30(5), 643-653. doi:10.1177/014616 7203262851 Inzlicht, M., & Ben-Zeev, T. (2000). A threatening intellectual environment: Why females are susceptible to experiencing problem-solving deficits in the presence of males. Psychological Science, 11(5), 365-371. doi:10.1111/1467-9280.00272 Johns, M., Schmader, T., & Martens, A. (2005). Knowing is half the battle: Teaching stereotype threat as a means of improving women's math performance. Psychological Science, 16(3), 175-179. doi:10.1111/j.0956-7976. 2005.00799.x

27
Krendl, A. C., Richeson, J. A., Kelley, W. M., & Heatherton, T. F. (2008). The negative consequences of threat: An fMRI investigation of the neural mechanisms underlying women’s underperformance in math. Psychological Science, 19, 168- 175. Loftsgaarden, D. O. & Watkins, A. E. (1998). Statistics teaching in colleges and universities: Courses, instructors, and degrees in fall 1995. The American Statistician, 52 (4), 308-314. Martens, A., Johns, M., Greenberg, J., & Schimel, J. (2006). Combating stereotype threat: The effect of self-affirmation on women's intellectual performance. Journal of Experimental Social Psychology, 42(2), 236-243. doi:10.1016/j.jesp.2005.04.010 Marx, D. M., Ko, S., & Friedman, R. A. (2009). The “Obama effect”: How a salient role model reduces race-based performance differences. Journal of Experimental Social Psychology, 45(4), 953-956. doi:10.1016/j.jesp.2009.03.012 Matheson, K., & Cole, B. (2004). Coping with a threatened group identity: Psychological and neuroendocrine responses. Journal of Experimental Social Psychology, 40(6), 777-786. doi:10.1016/j.jesp.2004.04.002 McIntyre, R. B., Paulson, R. M., & Lord, C. G. (2003). Alleviating women's mathematics stereotype threat through salience of group achievements. Journal of Experimental Social Psychology, 39(1), 83-90. doi:10.1016/S0022-1031(02) 00513-9 Murphy, M. C., Steele, C. M. & Gross, J. J. (2007). Signaling threat: How situational cues affect women in math, science, and engineering settings. Psychological Science, 18(10), 879-885. doi:10.1111/j.1467-9280.2007.01995.x National Science Foundation. (2008b). Thirty-three years of women in S&E faculty positions (NSF InfoBrief No. 08-308). Retrieved from http://www.nsf.gov/statistics/infbrief/nsf08308/nsf08308.pdf National Science Foundation. (2013). Women, minorities, and persons with disabilities in science and engineering: 2013 (NSF InfoBrief No. 00-327). Retrieved from http://www.nsf.gov/statistics/wmpd/2013/pdf/nsf13304_full.pdf Onwuegbuzie, A. (1995). Statistics test anxiety and female students. Psychology of Women Quarterly, 19(3), 413-418. doi: 10.1111/j.1471-6402.1995.tb00083.x Purdie-Vaughns, V., Steele, C. M., Davies, P. G., Ditlmann, R., & Crosby, J. (2008). Social identity contingencies: How diversity cues signal threat or safety for African Americans in mainstream institutions. Journal of Personality and Social
28
Psychology, 94(4), 615-630. doi:10.1037/0022-3514.94.4.615 Rosenthal, H. S., & Crisp, R. J. (2006). Reducing Stereotype Threat by Blurring Intergroup Boundaries. Personality and Social Psychology Bulletin, 32(4), 501- 511. doi:10.1177/0146167205281009 Rosenthal, H. S., Crisp, R. J., & Suen, M. (2007). Improving performance expectancies in stereotypic domains: Task relevance and the reduction of stereotype threat. European Journal of Social Psychology, 37(3), 586-597. doi:10.1002/ejsp.379 Sherman, D. K., & Cohen, G. L. (2006). The psychology of self-defense: Self-affirmation theory. In M. P. Zanna (Ed.), Advances in experimental social psychology, Vol 38 (pp. 183-242). San Diego, CA US: Elsevier Academic Press. doi:10.1016/ S00 65-2601(06)38004-5 Spencer, S. J., Steele, C. M., & Quinn, D. M. (1999). Stereotype threat and women's math performance. Journal of Experimental Social Psychology, 35(1), 4-28.doi:10.100 6/jesp.1998.1373 Steele, C. M., & Aronson, J. (1995). Stereotype threat and the intellectual test performance of African Americans. Journal of Personality and Social Psychology, 69(5), 797-811. doi:10.1037/0022-3514.69.5.797 Stout, J. G., & Dasgupta, N. (2013). Mastering one’s destiny: Mastery goals promote challenge and success despite social identity threat. Personality and Social Psychology Bulletin, 39(6), 748-762. doi: 10.1177/0146167213481067 Taylor, C. A., Lord, C. G., McIntyre, R. B., & Paulson, R. M. (2011). The Hillary Clinton effect: When the same role model inspires or fails to inspire improved performance under stereotype threat. Group Processes & Intergroup Relations, 14(4), 447-459. doi:10.1177/1368430210382680 Wigfield, A. & Meece, J. L. (1988). Math anxiety in elementary and secondary school students. Journal of Educational Psychology, 80(2), 210-216. doi: 10.1037/0022- 0663.80.2.210 Willyard, C. (2011, January) Men: A growing minority? GradPsych, 40-44. Retrieved from http://www.apa.org/gradpsych/2011/01/cover-men.aspx

29
Appendix A
Statistics Examination
1. A researcher measured the number of classes taken by 10 students in her statistics course. The students provided the following data: 3, 4, 4, 5, 5, 6, 4, 2, 1, 6. Compute the mean for these data.
a. 4 b. 40 c. 5 d. 0.25
2. A pharmaceutical company investigated a drug to treat pain associated with
arthritis. The company examined differences in effectiveness for males versus females. Males reported higher pain scores (M = 18) than did females (M = 15). An independent-samples t test (α = .05) resulted in an obtained value of t(8) = 1.08, p = 31. What conclusion can the drug company make?
a. Reject the null hypothesis and conclude that the drug affects men and women differently
b. Fail to reject the null and conclude there is not enough evidence to say that the drug affects men and women differently.
c. Fail to reject the null and conclude that the drug affects men and women differently
d. Reject the null and conclude there is not enough evidence to say that the drug affects men and women differently
3. A researcher found that the number of days of school missed per semester by
college students was normally distributed with a mean of 4.00 and standard deviation of 1.00. What conclusion can you draw from these data?
a. No students missed fewer than 3 days of school per semester. b. All students missed at least one day of school per semester. c. Very few students missed between 3 and 5 days of school per semester. d. Most students missed between 3 and 5 days of school per semester.
4. Sarah has to choose between four graduate programs. She wants to choose the
program that will likely provide her with the highest starting salary after graduation. She obtains information on the starting salaries of recent graduates from each program. Here are the data (in thousands of dollars): Program A: 44, 45, 50, 55, 75, 77, 102 Program B: 42, 46, 55, 58, 61, 65, 72 Program C: 38, 40, 57, 61, 62, 101, 105 Program D: 25, 35, 45, 67, 69, 70, 72 Based on the median starting salary of recent graduates, which program should Sarah choose?

30
a. Program A b. Program B c. Program C d. Program D
5. A sample of scores has a mean of 50 and standard deviation of 12. If you subtract
5 points from every score in the sample, the standard deviation will then be equal to:
a. 7 b. 45 c. 12 d. 144
6. Compute the value of the sums of squares (SS) for the following data: 1, 1, 1, 3 Use either of these two formulas: (1) SS = ΣX2 – (ΣX)2/N or (2) Σ(X- Mean)2
a. 3 b. 6 c. 12 d. 35
7. The following scatterplot depicts the relationship between number of hours exercised per week (X) and cholesterol level (Y). What conclusion can you draw from this graph?
a. The more hours exercised, the higher the cholesterol level b. The more hours exercised, the lower the cholesterol level c. There is no relationship between hours of exercise and cholesterol level d. There is a positive relationship between hours of exercise and cholesterol
level
8. The distribution of leaves falling from trees in the month of November is positively skewed. This means that:
a. most leaves fall early in the month, with a few falling later in the month b. most leaves fall late in the month, with a few falling earlier in the month
0.00 3.00 6.00 9.00 12.00
Exercise
0.00
70.00
140.00
210.00
280.00
Chole
ster
ol �
�
�
�
�
�
�
�
�
��
�
�
�
�
�
�

31
c. most leaves fall in the middle of the month, with a few falling earlier and a few falling later
d. roughly the name number of leaves fall throughout the month
9. A random sample of 10 technology executives revealed that their highest degrees earned were: M.S., M.B.A., Ph.D., Ph.D., M.S., M.S., M.B.A., Ph.D., Ph.D., Ph.D. Which degree is the most frequent (i.e., what is the mode for this distribution)?
a. M.S. b. M.B.A. c. Ph.D. d. You cannot compute the mode for these data
10. Two candidates are running for office. A recent political poll of a random sample of 1000 voters indicated that 45% would vote for Candidate A and 42% would vote for Candidate B. If the margin of error is ± 3%, what is the correct conclusion regarding the two candidates’ standings in the polls?
a. Candidate A is definitely in the lead b. Candidate B is definitely in the lead c. On election day the percentages will be equal to those reported in the poll d. Based on the sample data we cannot state who is in the lead
Original: Nancy Da Silva, PhD Revised 12/2012: Sean Laraway, PhD and Mike Abrams, PhD