STATUS OF LHC EXPERIMENTS - hepd.pnpi.spb.ruhepd.pnpi.spb.ru/hepd/articles/LHC_4.pdf · PNPI...
43
STATUS OF LHC EXPERIMENTS
Transcript of STATUS OF LHC EXPERIMENTS - hepd.pnpi.spb.ruhepd.pnpi.spb.ru/hepd/articles/LHC_4.pdf · PNPI...

STATUS OF LHC EXPERIMENTS

24
PNPI PARTICIPATION IN LHC EXPERIMENTS The outstanding discoveries in the experimental and theoretical physics of elementary particles resulted in formulation of the Standard Model that provides now a self-consistent picture of the elementary particles world and describes with remarkable precision practically all observed experimental facts. These achievements were closely related with the progress in the accelerator technology. In particular, very important contributions to development and validation of the Standard Model were made by recent experiments at the e+e− -collider LEP (90 GeV + 90 GeV) at CERN and at the pp -collider Tevatron (1 TeV + 1 TeV) at FNAL. Note that PNPI took an active part in the L3 experiment at LEP, and it participates now in the D0 experiment at Tevatron. In the tremendously successful Standard Model one important link is still missing. The spontaneously broken SU(2) × SU(1) gauge symmetry introduced by this model leads to existence of a scalar Higgs field. The observation of the predicted Higgs Boson is at present the most fundamental task in the high energy physics. Recent fits within the Standard Model to all available electroweak data combined with the measured top quark mass predict the Higgs Boson mass to be in the range 100−500 GeV with the most probable value around 130 GeV. The on-going Tevatron experiments D0 and CDF with the upgraded luminosity of 5×1032 cm−2 s−1 have some chance to discover the Higgs Boson if its mass is below 120 GeV. More extensive search (studies) of the Higgs Boson will be the primary goal for the Large Hadron Collider (LHC) at CERN. The energy of the colliding proton beams will be 7 TeV + 7 TeV, and the luminosity will reach 1034 cm−2 s−1. With these parameters, LHC will have high discovery potential for the Higgs Boson in the whole predicted mass region. It is generally accepted that the Standard Model is not yet a complete theory, and some “new physics” should appear at the energy scale of several TeV. A possible extension of the Standard Model is Supersymmetry that allows unification of the three coupling of the gauge interactions at the very high energy scale. Superpartners for all the presently observed particles are expected at the TeV mass scale. At the LHC, the search for the Superparticles could be carried out over the entire theoretically plausible mass range. The other research areas covered by LHC, where the “new physics” could appear, are searches for new heavy gauge bosons ( Z’,…), the compositeness of the leptons and quarks, the extra-dimensions. Also, LHC offers rich possibilities to extend studies of the “classical” subjects, such as physics of the top-quark, gluon density at very low x-values, diffraction processes, total cross sections behavior at the highest energies. Study of the CP violation in decays of B mesons is also one of the major goals at LHC. The LHC colliding beams will be an incomparable in intensity source of Bd and Bs mesons as well as B-baryons. This could allow to study CP violation in many decay channels, thus providing a stringent test of the Standard Model. Also, study of rare B-decays, forbidden in the Standard Model, offers a way to search for the “new physics” beyond the Standard Model. In addition to running as a proton-proton collider, LHC will be used to collide heavy ions at the center-of-mass energy of 5.5 TeV per nucleon. The collision energy densities will be well above the predicted threshold for formation of the quark-gluon plasma. The search for the new state of matter will be among the important physics goals at LHC. LHC will be constructed in the existing 27 km tunnel (former LEP tunnel). There will be four intersection points where four detectors (ATLAS, CMS, ALICE, and LHCb) will be located, designed to explore the full discovery potential of LHC. Among these detectors, ATLAC and CMS are general purpose detectors aimed at search for the Higgs Bosons and the “new physics” using the colliding beams at the highest achievable luminosity. The LHCb detector will be specialized on studies of the B-physics emphasizing powerful particle identification, while ALICE is designed for investigation of the heavy nuclei collisions with the goal to detect signatures of the quark-gluon plasma. These experiments will play the leading role in the world’s fundamental research program in the forthcoming decades, and they may have a decisive impact on the future of the particle physics. The LHC experiments should be ready for running by mid of 2008.

25
Since 1997, PNPI participates in construction of the ATLAS, CMS, ALICE, and LHCb detectors with important contributions to each of these projects. In particular, PNPI shared responsibilities for design and construction of some major parts of the detectors, such as the Endcap Muon system for CMS, the Muon systems for LHCb and ALICE, the Transition Radiation Tracker for ATLAS. This work was conducted under general Agreement between CERN and the Government of Russian Federation on participation in construction of the LHC. The Government of RF provided the financial support for these activities. The unprecedented for our institute large amount of experimental equipment to be produced at PNPI for the LHC projects required organization at PNPI of several production sites equipped with unique tooling and measuring devices. The work was carried out in close cooperation with Western groups following the strategy: most of the materials are provided by the collaborations, while the assembling and testing of the created equipment is performed at PNPI. More than 100 PNPI specialists were involved in this tremendous work during nearly 10 years. Finally, by the end of 2006, this work was successfully completed. Strictly according to the production schedule, all the equipment was produced, tested and delivered to CERN for installation in the experimental setups. All collaborations pointed out the high quality of the equipment produced at PNPI. The next step is installation and commissioning of the LHC detectors. The PNPI specialists play important roles in this work. The presented below reports describe in some details the work done at PNPI for preparations of the LHC experiments.

26
CMS EXPERIMENT
A.A. Vorobyov, D.M. Seliverstov, Yu.M. Ivanov, V.L. Golovtsov, V.S. Kozlov, N.F. Bondar, A.S. Denisov, A.G. Golyash, Yu.I. Gusev, V.I. Lazarev, V.D. Lebedev, P.M. Levchenko, G.V. Makarenkov, E.M. Orischin, A.A. Petrunin, A.I. Shchetkovsky, L.A. Schipunov, V.A. Sknar, V.V. Sulimov, V.I.Tarakanov, I.I. Tkatch, L.N. Uvarov, S.A. Vavilov, G.N. Velichko, S.S. Volkov, An.A. Vorobyov, V.I. Yatsura, G.F. Zhmakin
1. Introduction
The Compact Muon Solenoid (CMS) is a general-purpose detector designed to study physics of proton- proton collisions at center-of-mass energy of 14 TeV at full LHC luminosity up to L = 1034 cm−2 s−1. The primary goals of the CMS experiment will be the Top-quark physics, search for the Standard Model Higgs bosons, as well as search for physics beyond the Standard Model (super-symmetric particles, new heavy gauge bosons, extra-dimensions …). The design of the CMS detector emphasizes the importance of precise momentum measurements of muons, electrons, and photons, resulting in excellent mass resolution needed for discovery of the new particles. Figure 1 shows general view of the CMS detector. The basic elements of this detector are: • Superconducting solenoid • Return iron yoke • Inner tracker • Crystal electromagnetic calorimeter • Hadron calorimeter • Muon system • Very forward calorimeter
Fig. 1. General view of the CMS detector

27
2. Muon System of the CMS detector The Muon System has three functions: muon identification, muon momentum measurements, and muon trigger with well defined pt threshold from a few GeV/c to 100 GeV/c in the rapidity range up to η = 2.1. The momentum resolution δpt/pt in the stand-alone mode is around 10% at pt = 10 GeV/c and around 30% at pt = 1 TeV/c. The global momentum resolution after matching with the Central Tracker is about 1.5% at pt = 10 GeV/c and about 15% at pt = 1 TeV/c. The Muon System is embedded inside the magnet return yoke. It consists of two parts − Barrel and Endcaps. The main PNPI responsibility in the CMS project is participation in design, construction and operation of the Endcap Muon System. This work was carried out since 1994 in close cooperation with the teams from Fermilab, from University of Florida, and from some other US Universities. In fact, development of a muon system for collider detectors began at PNPI already in 1991, when construction of the proton-proton Super Collider SSC for the energy of 20 TeV + 20 TeV was started in the USA. At that time, PNPI together with Brookhaven National Laboratory proposed the Muon System for the GEM detector, which was one of the two collider detectors to be constructed at SSC. This system was based on application of multiwire Cathode Strip Chambers (CSCs). During preparation of this project, several CSC prototypes have been constructed and tested. Also, various gas mixtures were investigated, and one of them (Ar/CO2/CF4) was recommended. It was demonstrated that such system can provide the required spatial and time resolution, and it can generate the stand-alone muon trigger. At the beginning of 1993, this project was considered by the GEM collaboration together with two other competitive projects. As the result, our CSC based project was selected for the whole GEM Muon System. Unfortunately, construction of the SSC was stopped by the USA Congress in October 1993. After that decision, several US teams organized new collaboration which proposed in February 1994 to build the Endcap Muon System for the CMS detector, similar to that designed for the GEM detector. PNPI became a member of this collaboration. The CMS Endcap Muon System (EMU) consists of two symmetric parts (forward and backward). Each of these parts contains four Muon Stations (ME1 to ME4). The Muon Stations are composed of muon chambers placed between the iron discs of the magnet return yoke. Each of these discs has 14 meters in diameter. The station ME1 has three rings of muon chambers (ME1/1, ME1/2, ME1/3). The stations ME2 and ME3 are composed of two rings of the chambers (ME2,3/1 and ME2,3/2), while the station ME4 has only one ring of the chambers (ME4/1), the construction of the ring ME4/2 being staged due to financial limitations. The total area covered by the muon chambers is about 1000 m2. The muon chambers [1−4] are specially designed six-plane CSCs of trapezoidal shape as shown in Fig. 2. Cathode planes are formed by honeycomb panels with copper clad FR4 skins. Strips run radially in the endcap geometry and provide the φ-coordinate of muon hits with an accuracy of ~100 µm. Wires are stretched across the strips and, for readout purposes, are grouped in bunches from 5 to 16. They provide the radial coordinate of the muon hits with a few cm precision. In total, the EMU system comprises 540 muon chambers which contain about 2.5 million wires grouped into 210,816 anode channels. Also, there are 273,024 cathode channels.
Fig. 2. Sketch view and some parameters of a CSC

28
3. Assembling of EMU muon chambers at PNPI The design of the muon chambers and development of technology for the chamber production were performed with active participation of the PNPI team. The assembling and testing of the chambers was distributed between several laboratories. PNPI was responsible for assembling and tests of all muon chambers for the regions ME2/1, ME3/1, and ME4/1. In total, 120 muon chambers (40 chambers of each type) were to be produced at PNPI. Each chamber contains six sensitive planes. So, in fact, we had to build 720 one-plane chambers with total area of more than 1400 m2 and with total number of the anode wires about half a million. To accomplish this task, a special facility (muon chamber factory) was prepared at PNPI. This facility occupied about 500 m2 area, including some clean rooms. It was equipped with special tooling developed jointly by PNPI and US_CMS specialists. In particular, this equipment included a wire-winding machine, a wire pitch and tension measuring machine, special gluing tables, assembling tables, a setup for cleaning the anode wires with ionized nitrogen gas, a gas leak test stand, a γ-rays test stand, a cosmic rays test stand, and some other tooling. This equipment allowed to organize the chamber assembling under well controlled conditions with the necessary production rate of one six-plane chamber per week. The developed chamber assembling technology was approved by the EMU collaboration after the Production Readiness Review which was held at PNPI in June 2001. The mass production of the muon chambers at PNPI was started in October 2001. The US_CMS collaboration provided prefabricated parts of the muon chambers (honeycomb panels, anode and cathode bars, etc.) and most of the materials needed for assembling the chambers. The metallic chamber frames were produced at PNPI. The assembling procedure was controlled at each step: flatness of the honeycomb panels, height of the gas gaps, wire tension, wire pitch, gas tightness. The assembled chambers were trained under high voltage with simultaneous measurement of the dark current. It was required that the dark current should not exceed 100 nA in each plane at the nominal high voltage HV = 3.6 kV. In case of problems, the chambers could be disassembled for additional cleaning. The gas gain uniformity was controlled on the γ-rays test stand by measuring current induced by a collimated γ-source movable over the chamber surface (Fig. 3). The variations of the gas gain should not exceed ± 50%. All details of the assembling procedure for each chamber together with the results of the control measurements were collected in special folders (Fig. 4) which will accompany the chamber in its further life. Also, this information was placed in a special data base reachable for the EMU collaboration via Internet.
The on-chamber electronics was installed on the chambers which passed the above mentioned tests (Fig. 5). After that, the chambers were tested on the cosmic rays tests stand (Fig. 6).
Fig. 4. Muon chamber ready for installation of the on-chamber electronics Fig. 3. Muon chamber on the γ-rays test stand

29
The on-chamber electronics included anode and cathode FE boards and also logical boards ALCT and CLCT which allowed on-line reconstruction of the tracks using hits from the six layers of the chamber. The final test program included 36 various tests with pulse generator and with cosmic muons. Figure 7 shows one of the cosmic rays events detected by the muon chamber. The measured amplitudes of the signals in the cathode strips in all six layers are shown by red bars, while the blue bars represent the hits in the anode wire groups. After final tests, the chambers were stored in a special room for one month training under nominal high voltage. Then the chambers were prepared for transportation to CERN − see Figs. 8−9. By the end of 2006, all 120 muon chambers produced at PNPI were safely delivered to CERN.
Fig. 8. The PNPI team in front of the last muon Fig. 9. The track with twenty muon chambers chambers ready for transportation to CERN prepared to move for CERN
Fig 5. Installation of the on-chamber electronics Fig. 6. Final tests of the muon chambers on the cosmic ray test stand
Fig. 7. Display of a cosmic ray event

30
4. Testing of EMU muon chambers at CERN and installation in the CMS detector
All muon chambers produced at PNPI, FNAL (USA), and IHEP (China) were transported to CERN where they have been tested again on a special test stand, following the same test program as in the production centers. The PNPI team played the leading role in these tests. In total, about 500 chambers have been tested. All chambers showed very good performance: high detection efficiency with a large HV plateau, low noise. During these tests, some minor problems in the electronics have been detected and fixed. Some of the muon chambers were tested on the γ-radiation facility GIF at CERN to study their aging properties. It was demonstrated that the chamber performance is not deteriorated noticeably up to the integrated radiation dose corresponding
about 30 years operation of the EMU system. Figure 10 illustrates attendance of the EMU test stand by high-level visitors. The assembling of the CMS detector was performed in two stages. First, all the subsystems were installed in the on-surface hall. Figure 11 shows how one of the muon chambers is lifted by a special transporting system for installation on the iron disc of the magnet return yoke. One can see also the chambers already fixed at the disc. All the infrastructure and electronics are installed at the same time. This allowed to perform some tests of the EMU system already in this phase of installation. In particular, important tests were carried out in 2006 with cosmic rays using a part of the assembled EMU system comprising muon chambers in all muon stations. In the second phase of installation, the separate pieces of the CMS detector are lowered down in the underground hall for the final assembling. Figure 12 demonstrates the process of lowering of one of the iron discs with the muon chambers and all related infrastructure. Note that the weight of the disc exceeds 1000 tons. The PNPI team takes an active part in installation of the EMU system. The full installation of the CMS detector should be finished at the beginning of 2008.
Fig. 11. Installation of a muon chamber on Fig. 12. The lowering down of one iron disc the iron disc of the magnet return yoke with muon chambers in the underground hall
Fig. 10. High-level visitors at the EMU test stand. CERN General Director R. Aymar, Minister of Science and
Education of the Russian Federation A. Fursenko and others

31
5. Multi-channel high voltage supplier for the EMU system The EMU system comprises 468 six-plane muon chambers. In addition, the HV line in each layer is divided in several sections (5 sections in chambers ME2,3/2 and 3 sections in all other chambers). So in total there are more than 9000 sections with independent HV lines. This increases essentially the redundancy of the system as, in case of problems, only one section will be switched off that should not deteriorate noticeably performance of the whole EMU system. Such design dictated development of a special multi-channel HV system which could satisfy the requirements of the CMS experiment. This problem was solved by joint efforts of specialists from PNPI and University of Florida. The block diagram of a quarter of the designed HV system is presented in Fig. 13, the stand for tests of EMU high voltage system at PNPI is shown in Fig. 14. The high voltage from the Primary HV power supplier is distributed for about 2400 HV lines with independent regulation of the voltage in each line. Also, the current in each line is under control with a possibility to switch off any line by burning off a fuse, if necessary. The HV distribution is done in two stages. First, it is distributed by nine Master Boards into 72 HV lines with HV regulation from 0 to 4 kV. These lines go via ~100 meter long cables to 72 Remote Distribution Boards. Each such board has 30 or 36 outputs going directly to the muon chambers. The Board 30 feeds one big chamber ME2,3/2, the Board 36 feeds two smaller chambers. The Remote Distribution boards can regulate the voltage in each output channel by 1 kV down from HVmax .The maximal current in each channel of the HV system is 100 µA.
The HV system is controlled by computors via the Host Cards (not shown in Fig. 13). Each Host Card controles up to 16 Distribution or Master boards. An important requirement is radiation hardness of the Remote Distribution boards as they are placed close to the muon chambers. The tests of the designed boards with gamma and neutron radiation showed that they can operate without problems in the expected radiation environment. The production of the designed HV system was accomplished by the PNPI-UF collaboration. By mid of 2006, all modules for the 9000-channel HV system (plus spare modules for 2500 HV channels) were produced, tested, and delivered to CERN for installation.
Fig. 14. Tests of EMU high voltage system at PNPI
Fig. 13. Block diagram of a quarter of EMU HV system
32
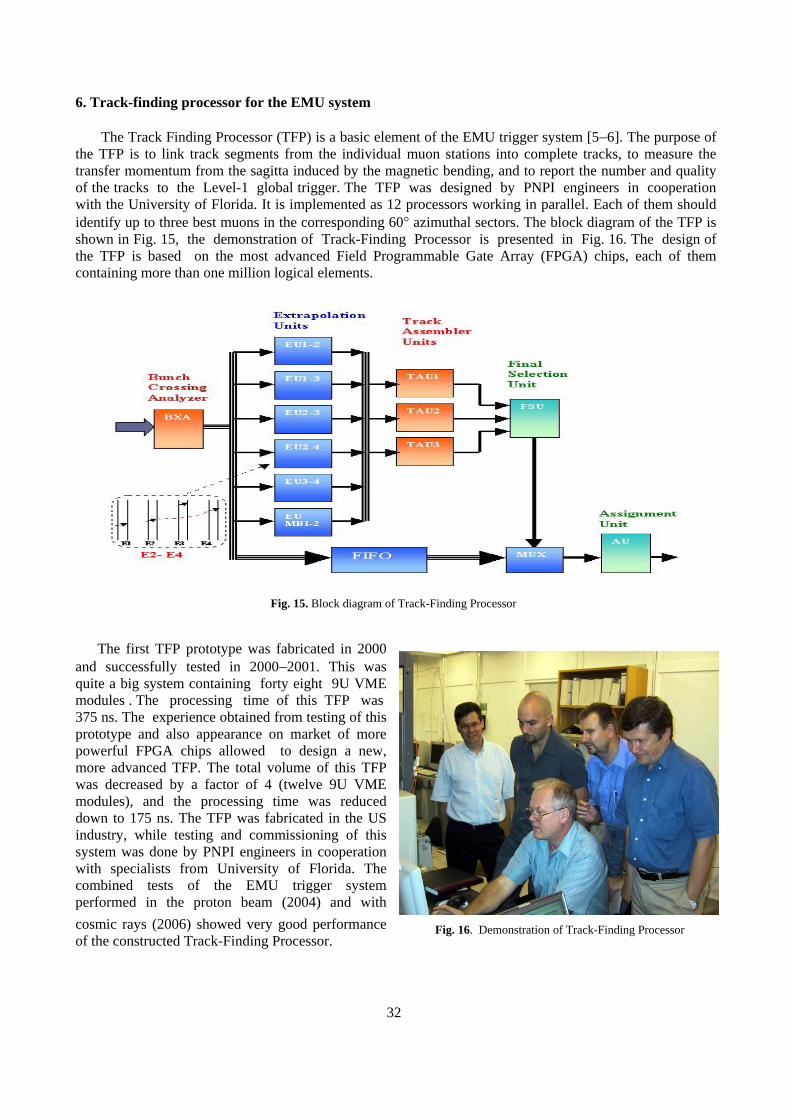
6. Track-finding processor for the EMU system The Track Finding Processor (TFP) is a basic element of the EMU trigger system [5−6]. The purpose of the TFP is to link track segments from the individual muon stations into complete tracks, to measure the transfer momentum from the sagitta induced by the magnetic bending, and to report the number and quality of the tracks to the Level-1 global trigger. The TFP was designed by PNPI engineers in cooperation with the University of Florida. It is implemented as 12 processors working in parallel. Each of them should identify up to three best muons in the corresponding 60° azimuthal sectors. The block diagram of the TFP is shown in Fig. 15, the demonstration of Track-Finding Processor is presented in Fig. 16. The design of the TFP is based on the most advanced Field Programmable Gate Array (FPGA) chips, each of them containing more than one million logical elements.
The first TFP prototype was fabricated in 2000 and successfully tested in 2000−2001. This was quite a big system containing forty eight 9U VME modules . The processing time of this TFP was 375 ns. The experience obtained from testing of this prototype and also appearance on market of more powerful FPGA chips allowed to design a new, more advanced TFP. The total volume of this TFP was decreased by a factor of 4 (twelve 9U VME modules), and the processing time was reduced down to 175 ns. The TFP was fabricated in the US industry, while testing and commissioning of this system was done by PNPI engineers in cooperation with specialists from University of Florida. The combined tests of the EMU trigger system performed in the proton beam (2004) and with cosmic rays (2006) showed very good performance of the constructed Track-Finding Processor.
Fig. 16. Demonstration of Track-Finding Processor
Fig. 15. Block diagram of Track-Finding Processor

33
7. Anode front-end electronics
The PNPI engineers in cooperation with Carnegie-Mellon University designed the anode front-end electronics for the EMU muon chambers [7]. For this purpose two integrated circuit chips were designed. One of them (CMP16 − see Fig. 17) included 16-channel amplifier-shaper-discriminator. The other one (DEL16) provided a programmable delay line for each channel which allows time alignment of the signals with a delay step of 2 ns. On the basis of the CMP16 chip, a 16-channel Anode FE (AD16) board was designed. The designed board passed through various reliability and radiation tests. The fabrication of the CMP16 and DEL16 chips, as well as the AD16 boards was carried out in the US industry. The tests of the produced chips (22,000 chips) and boards (12,000 boards) were performed by the PNPI specialists. These tests showed that the major part of the produced electronics was of good quality. By the end of 2002 all the boards were tested and provided for installation onto the muon chambers. 8. Alignment of the muon chambers in the EMU system The 468 EMU muon chambers are fixed on the magnet return discs covering the area of 1000 m2. Their geometry position in the CMS absolute coordinate system should be known with 100 micron precision in the azimuthal plane and with 1mm precision in the Z-direction. This task becomes even more complicated because of significant deformation of the iron discs in the magnetic field. Therefore, permanent control for positions of the muon chambers is needed. For these purposes, a complicated system was developed comprising several hundreds of position-sensitive detectors irradiated by the laser beams. This work was done by engineers from the Wisonsin University with active participation of PNPI specialists [8]. The global tests of this alignment system were carried out in 2006 with the half of the EMU system assembled in the on-surface hall. These tests showed very satisfactory results. The second half of the EMU system will be equipped with alignment devices in 2007. 9. Photodetectors for CMS Endcap Electromagnetic Calorimeter The CMS Electromagnetic Calorimeter (ECAL) is based on lead tungsten crystals (PbWO4). These crystals offer excellent energy resolution due to high density (8.28 g/cm3), a small Moliere radius (2.0 cm), and a short radiation length (0.89 cm). Also, they provide a quite fast (∼10 ns) output signal, and they can operate in high radiation environment. ECAL consists of the Barrel part (|η| < 1.48) and two Endcaps (1.48< |η| < 3.0) with 61200 and 21528 crystals, respectively. The total volume of the crystals amounts to 8.14 m3 (67.4 tons) in the Barrel and 3.04 m3 (25.2 tons) in the Endcaps. The light from the crystals should be detected with radiation hard photodetectors, especially in the Endcaps where the radiation level is much higher than in the Barrel. After extensive studies, the preference was given to the Silicon Avalanche Photodetectors (APD) in the Barrel and to the more radiation hard Vacuum Phototriods (VPT) in the Endcaps. PNPI in cooperation with the Research Institute Electron (RIE, St.-Petersburg) carried out studies of various kinds of VPTs produced at RIE [9−10]. These studies resulted in construction of a VPT (FEU-188) which could satisfy the requirements of the CMS experiment. This VPT has a flat geometry with a photocathode (25.5 mm in diameter) followed by a mesh and by a solid dynode. The VPT provides the required gain of 10−12, and (what is most important) this gain does not decrease in the presence of magnetic field up to B = 4 T. Another advantage of the developed VPT is low sensitivity to variations of the anode voltage.
Fig, 17. CMP16 (Bondar’s chip) layout

34
As a first step, a sample of 500 VPTs was produced at RIE. The gamma radiation tests of these VPTs showed that the gain degrades only by ~7% after the radiation doze of 20 kGy (the doze expected for 10
LHC years). Also, VPTs were tested with a real ECAL prototype showing very good performance. Based on these results, the CMS collaboration decided to equip the ECAL Endcaps with the FEU-188 and has signed a contract with RIE for production of 16000 VPTs. The production of the VPTs was completed by mid of 2006, and they were delivered to CERN. The new tests demonstrated high quality of the produced VPTs. As the result, the CMS collaboration has taken decision to reward the Research Institute Electron by a special CMS Gold Medal 2007 for outstanding contribution of the
industry to construction of the CMS detector – see Fig. 18. References 1. D. Acosta, …, N. Bondar, …, O. Kiselev, …, O. Prokofiev, V. Razmyslovich, …, V. Sedov, …, S. Sobolev, V. Soulimov, …, N. Terentiev, A. Vorobyov et al., Nucl. Instr. Meth. A 453, 182 (2000). 2. D. Acosta, …, N. Bondar, …, G. Gavrilov, …, Yu. Ivanov, …, P. Levchenko, …, O. Prokofiev, V. Razmyslovich, …, L. Shchipunov, V. Sedov, I. Smirnov, …, S. Sobolev, V. Soulimov, V. Suvorov, N. Terentiev, …, S. Vavilov, …, A. Vorobyov et al., Nucl. Instr. Meth. A 494, 504 (2002). 3. O. Prokofiev, …, N. Bondar, …, Yu. Ivanov, ..., G. Gavrilov, ..., A. Krivshich, E. Kuznetsova, ..., P. Levchenko, ..., V. Razmyslovich, ..., L. Shchipunov, I. Smirnov, V. Suvorov, ..., N. Terentiev, ..., S. Vavilov, ..., A. Vorobyov et al., Nucl. Instr. Meth. A 515, 226 (2003). 4. D.V. Balin and G.N. Velichko, “Performance simulation of the cathode strip chambers for CMS endcap muon system”, CERN-CMS-NOTE-2005-014, April 2005. 30p. 5. D. Acosta, …, A. Atamanchuk, V. Golovtsov, V. Sedov, B. Razmyslovich et al., Nucl. Instr. Meth. A 496, 64 (2003). 6. D. Acosta, …, V. Golovtsov, M. Kan, L. Uvarov et al., talk presented at the Conference on Computing in High Energy and Nuclear Physics CHEP2003 (La Jolla, USA, 24 − 28 March 2003). 7. F. Ferguson, N. Bondar, A. Golyash, V. Sedov, N. Terentiev and I. Vorobiov, Nucl. Instr. Meth. A 539, 386 (2005). 8. M. Hohlmann, …, O. Prokofiev, V. Sknar et al., in Proceedings of the Nuclear Medical Imaging Conference (San Diego, USA, 29 October − 4 November 2006), p. 489. 9. Yu. Blinnikov, Yu. Gusev, …, F. Moroz,, …, D. Seliverstov et al., Nucl. Instr. Meth. A 504, 228 (2003). 10. Yu.I. Gusev, A.I. Kovalev, L.A. Levchenko, F.V. Moroz, D.M. Seliverstov, V.Yu. Trautman, D.O. Yakorev et al., Nucl. Instr. Meth. A 535, 511 (2004).
Fig. 18. The CMS Gold Medal-2007 to Research Institute “Electron” for outstanding contribution to construction of the CMS detector

35
TRANSITION RADIATION TRACKER FOR ATLAS PROJECT O.L. Fedin, E.G. Danilevich, A.E. Khristachev, L.G. Kudin, S.N. Kovalenko, V.P. Maleev, A.V. Nadtochy, S.K. Patrichev, Yu.F. Ryabov, D.M. Seliverstov, V.A. Schegelsky, E.M. Spiridenkov, A.Yu. Zalite 1. Introduction PNPI is participating in the ATLAS project in creation of the Transition Radiation Tracker (TRT). TRT is one of the three sub-systems of the Inner Detector of the ATLAS experiment [1]. Besides TRT, the ATLAS Inner Detector includes the Pixel Detector and the Semi-Conductor Tracker (Fig. 1). TRT is designed to operate in a 2T solenoidal magnetic field at the design LHC luminosity (1034 cm−2s−1). TRT provides a combination of continues tracking, based on individual drift-tubes (straws), and of electron identification based on registration of the transition radiation (TR) photons which are produced in the radiators foils interleaved between the straw layers. The TRT geometry provides registration of the charged particles with pt>0.5 GeV/c and with pseudo-rapidity |η|<2.1. TRT contributes to the accuracy of the momentum measurement in the Inner Detector by providing at all luminosities precise measurements in the R-ϕ plane. The accuracy of this R-ϕ measurement, expressed as an average over all drift-time measurements in the straws, is required to be close to 30 μm statistically and not worse than 50 μm if one includes systematic uncertainties. It means that the accuracy of one straw measurement should be about 180 μm. TRT contributes to the electron identification together with the ATLAS liquid argon electromagnetic calorimeter. Electron identification at LHC is much more difficult than at existing hadron colliders, and it has been demonstrated that the TR-signature is needed to identify a clean sample of inclusive electrons in the pt-range between 20 and 40 GeV/c. The TR-signature is crucial for extraction of the signals from decay processes with huge combinatorial background of charged-particles pairs and also for identification of soft electrons in b-quark jets.
2. Straw design and basic properties The operating conditions in the ATLAS experiment at LHC demand stringent requirements on the straw properties [2]. All choices of materials, the straw design, the active gas and the operating point were made to ensure safe and efficient operation in the high radiation environment. A large tube diameter would assure a high hit efficiency but it would not be able to collect all electrons in the short bunch crossing time of 25 ns. The straw diameter was chosen to be 4 mm as a reasonable compromise between speed of response, number of ionization clusters, and mechanical and operational stability. The straw tube wall is made of 35 μm thick multilayer film which is produced on the base of 25 μm Kapton film. On one side of the Kapton film an aluminium layer of 0.2 μm thickness is deposited. The Al-layer provides good electrical conductivity. The aluminium layer is then protected against damage from cathode etching effects and from occasional discharges by a 5−6 μm thick graphite-polyimide layer containing 55% of carbon. The other side of the film
Fig. 1. ATLAS Transition Radiation Tracker

36
is coated with a 4−5 μm polyurethane layer acting as a heat-seal compound. The straw is manufactured by winding two 10 mm wide tapes on a precisely tooled rod at temperature of ~260°C. The Kapton film alone has poor mechanical properties. The straw would be affected by thermal and humidity variations. In order to improve the straw mechanical properties, they were reinforced along its length with four sets of thin carbon fibre bundles. The C-fibres were bounded to the tube outer surface at 90° with respect to each other, using a special machine (Straw Reinforcement Machine − SRM), which was designed at CERN. The SRM is a semi-automatic device. After a group of naked straws is loaded into the drum, the carbon fibre pass over a series of rollers, and an impregnation pot wets the fibres with epoxy resin ensuring uniform resin distribution and tension. A specialized workshop has been organized at PNPI for the straw reinforcement (Fig. 2). The PNPI SRM workshop has produced ~110,000 long reinforced straws (1650 mm length). Stringent quality control steps were implemented in the straw reinforcement process. They include fibre delamination tests and straw geometry measurements (straightness, inner and outer diameters and local deformations or defects). The production yield was 98% at the production rate of ~6000 straws per month. The anode wire for the TRT straws was chosen to be of golden-plate tungsten 30 μm in diameter. To achieve high registration efficiency of the TR photons, a xenon-based gas mixture is used. The xenon fraction of 70% marks the balance between transition radiation performance, operational stability and electron collection time. The optimal gas composition was found to be 70%Xe+27%CO2+3%O2. The TRT is typically operated at 1530 V, corresponding to a gas gain of 2.5×10⁴ for the chosen gas mixture [3]. The energy deposition in the straw is the sum of ionization losses of charged particles (~2 keV in average) and of the larger deposition due to TR photon absorption (>5 keV). At the LHC design luminosity, the straw counting rate is very high, about 12 MHz [4]. This counting rate comes from the ionizing particles, slow neutrons and low-energy photons. The heat dissipation is directly proportional to the straw counting rate and estimated to be 10−20 mW per straw at the LHC design luminosity. The temperature gradient along each straw should not exceed 10°C to keep straw operation stability and gas gain uniformity. To evacuate the dissipated heat, a flow of CO2 gas along the straw is used. The flow of CO2 also evacuates any xenon gas which could leak out of the straws and thereby reduce the transition radiation registration efficiency.
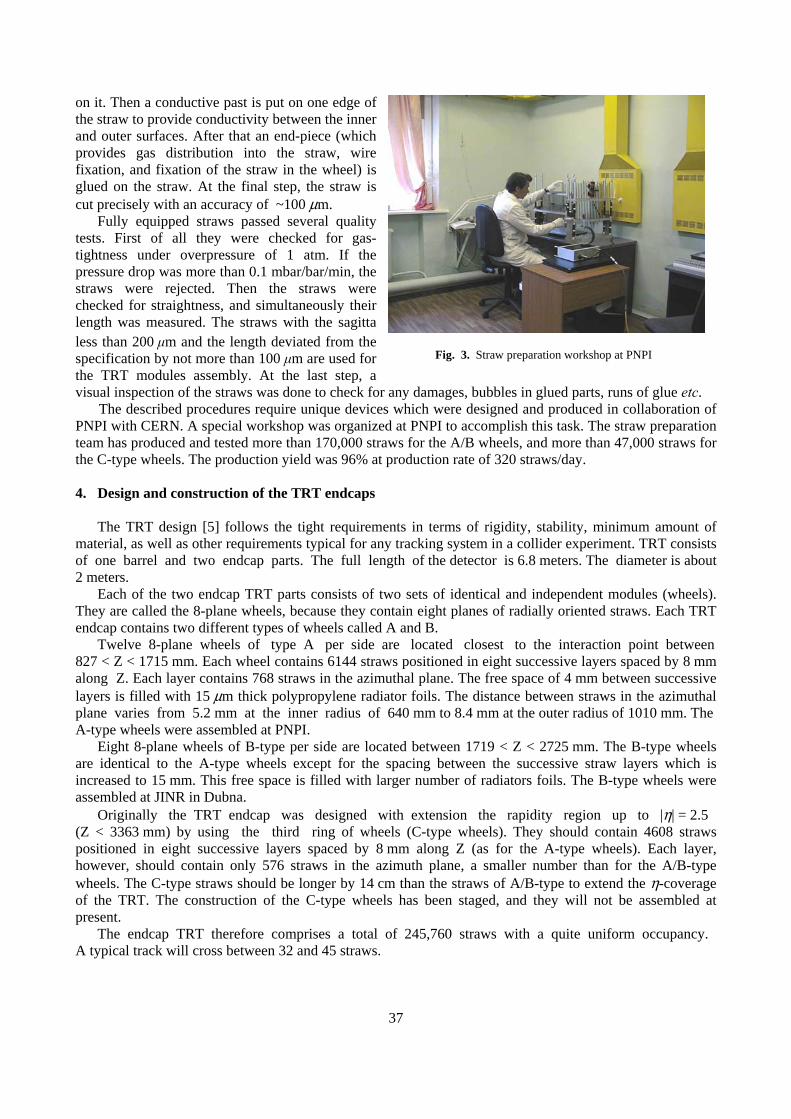
3. Straw preparation To use the straws for the TRT modules assembly, it should pass through several steps of the preparation procedure (a general view of the straw preparation workshop is shown in Fig. 3). Each of the reinforced straws is 1650 mm long, and at the first step they need to be cut into few short straws (four ~400 mm long straws for the A/B type modules, or three ~500 mm long straws for the C type modules). The straw pre-cutting is not precise and is chosen only for convenient work. The pre-cut straws pass through the test for the inner surface conductivity because high voltage distribution and signal propagation along the straw depend
Fig. 2. View of Straw Reinforcement Machine at PNPI
37
on it. Then a conductive past is put on one edge of the straw to provide conductivity between the inner and outer surfaces. After that an end-piece (which provides gas distribution into the straw, wire fixation, and fixation of the straw in the wheel) is glued on the straw. At the final step, the straw is cut precisely with an accuracy of ~100 μm. Fully equipped straws passed several quality tests. First of all they were checked for gas-tightness under overpressure of 1 atm. If the pressure drop was more than 0.1 mbar/bar/min, the straws were rejected. Then the straws were checked for straightness, and simultaneously their length was measured. The straws with the sagitta less than 200 μm and the length deviated from the specification by not more than 100 μm are used for the TRT modules assembly. At the last step, a visual inspection of the straws was done to check for any damages, bubbles in glued parts, runs of glue etc. The described procedures require unique devices which were designed and produced in collaboration of PNPI with CERN. A special workshop was organized at PNPI to accomplish this task. The straw preparation team has produced and tested more than 170,000 straws for the A/B wheels, and more than 47,000 straws for the C-type wheels. The production yield was 96% at production rate of 320 straws/day. 4. Design and construction of the TRT endcaps
The TRT design [5] follows the tight requirements in terms of rigidity, stability, minimum amount of material, as well as other requirements typical for any tracking system in a collider experiment. TRT consists of one barrel and two endcap parts. The full length of the detector is 6.8 meters. The diameter is about 2 meters. Each of the two endcap TRT parts consists of two sets of identical and independent modules (wheels). They are called the 8-plane wheels, because they contain eight planes of radially oriented straws. Each TRT endcap contains two different types of wheels called A and B. Twelve 8-plane wheels of type A per side are located closest to the interaction point between 827 < Z < 1715 mm. Each wheel contains 6144 straws positioned in eight successive layers spaced by 8 mm along Z. Each layer contains 768 straws in the azimuthal plane. The free space of 4 mm between successive layers is filled with 15 μm thick polypropylene radiator foils. The distance between straws in the azimuthal plane varies from 5.2 mm at the inner radius of 640 mm to 8.4 mm at the outer radius of 1010 mm. The A-type wheels were assembled at PNPI. Eight 8-plane wheels of B-type per side are located between 1719 < Z < 2725 mm. The B-type wheels are identical to the A-type wheels except for the spacing between the successive straw layers which is increased to 15 mm. This free space is filled with larger number of radiators foils. The B-type wheels were assembled at JINR in Dubna. Originally the TRT endcap was designed with extension the rapidity region up to |η| = 2.5 (Z < 3363 mm) by using the third ring of wheels (C-type wheels). They should contain 4608 straws positioned in eight successive layers spaced by 8 mm along Z (as for the A-type wheels). Each layer, however, should contain only 576 straws in the azimuth plane, a smaller number than for the A/B-type wheels. The C-type straws should be longer by 14 cm than the straws of A/B-type to extend the η-coverage of the TRT. The construction of the C-type wheels has been staged, and they will not be assembled at present. The endcap TRT therefore comprises a total of 245,760 straws with a quite uniform occupancy. A typical track will cross between 32 and 45 straws.
Fig. 3. Straw preparation workshop at PNPI

38
5. Wheel design and assembly
The 8-plane wheel is assembled from two back-to-back 4-plane wheels, which are the basic assembly unit for the detector. A 4-plane TRT module is assembled in the first stage. The straws are inserted and glued (Fig. 4) into precisely drilled holes in the inner and the outer C-fibre rings, which serve as support structures for the straws. To ensure optimal uniformity in the number of straws crossed by particles as a function of azimuth, each straw in a given layer is angularly displaced with respect to its neighbor in the previous layer by 3/8 of azimuthal spacing between straws in the same layer. The straws themselves are reinforced and are part of the mechanical structure of the module. The straw straightness is required to be remained better than 300 μm, because their operational stability strongly depends on the displacement of the anode wire from the tube axis. Each straw is therefore visually inspected after insertion and after gluing. The problematic straws were replaced. The assembled 4-plane mechanical structure (C-fibre rings and straws) passed through inspection and quality-control measurements (dimensions and gas tightness of the mechanical structure). Flex-rigid printed circuit boards (Wheel Electronic Board – WEB) are used to distribute high-voltage to the straw cathode and to readout signals from the anode wires. There are 32 separate WEBs per one wheel. The flex-rigid printed circuit board contains two flexible layers of the circuit made from polyamide film. Each flex circuit contains holes with inward-printing petals. The first layer of the flex circuit is used to provide a reliable high-voltage connection to the straw cathode. The high-voltage plastic plugs are inserted through the petals into the straw making contact with the inner straw walls. The signal connection is done in an analogous way using the second flexible layer and the custom-designed copper crimp-tubes inserted through the petals in the second layer. These copper crimp-tubes are used to fix the anode wires on the outer radius (Fig. 5). The other custom-designed copper crimp-tubes with isolation are used to fix the anode wires on the inner radius. The WEB transmits the signals to the front-end electronics boards through three connectors each corresponding to 32 channels.
A third C-fibre ring at the outer radius is glued to the rigid part of the WEB. On the opposite side of the rings fixed to the WEB, the glass-fibre boards are glued. They provide a sturdy box-like support. This box-like structure serves as an outer gas manifold for the 4-plane wheel. The inner gas manifold is made of reinforced polyamide material and glued to the inner C-fibre ring. The gas flows into one of the two 4-plane wheels, assembled together as an 8-plane wheel, through this outer gas manifold along the straws into the inner gas manifold and through eight plastic connecting elements into the second 4-plane wheel, where it traverses the straws in the opposite direction and is collected in its outer gas manifold.
Fig. 4. Assembly of TRT wheels at PNPI. Straw insertion and gluing into the carbon support rings
Fig. 5. Assembly of TRT wheels at PNPI. 4-plane wheel prepared for the wire stringing

39
The whole 8-plane wheel is covered with a thin metal-clad polyamide membrane on each side at the inner radius, which provides a signal-return path from the inner radius of the straws to the outer radius where the electronics ground is defined. The wheels are held together as a stack through a set of axial metallic tie-rods. A specialized workshop has been organized at PNPI for the wheels assembly. The wheels assembly process includes not only mechanical assembly but also components preparation and final and intermediate tests, resulting in establishment of a passport for each wheel. Each component used for wheels assembly, when received from a manufacturer or produced in-house, has to be checked for conformance and cleaned before use. Some of the components go through several stages of assembly before going into wheels (straws, flex-rigid printed-circuit boards, inner gas manifolds). The quality control is performed after each essential stage of assembly. The tight tolerance for the TRT, which is placed in-between the SCT and Liquid Argon calorimeter, is required to comply with the given dimensional envelopes. The critical dimensions of the endcap wheels (such as the inner and the outer radii, the thickness of the endcap wheels) are checked and compared to the specifications. In the gas leak test, the assembled 4-plane or 8-plane wheels are filled with 20 mbar over-pressured argon. The leak rate is evaluated by measuring the pressure drop in the closed detector gas volume over a sufficiently long period of 4−8 hours. After applying temperature and volume corrections, only a leak rate of smaller than 1 mbar/min/bar is accepted. The tension of the wires is measured during the stringing process itself and after completion of the module. This test is repeated also after reception of the modules at CERN. Control of the wire tension is necessary to avoid instabilities from the wires gravitational suffering and electrostatic sag. This required special attention since all wires in the TRT modules are crimped. All straws with less than 55 g wire tension, that is with tension loss greater than 5 g, were disconnected. A device based on the acoustic feed-back loop is used to accurately determine the wire tension. The wire is excited acoustically, and the characteristic frequency is measured by capacitance-oscillation sensing. The device was developed and produced at PNPI. Typically, one wire out of 3072 (one per 4-plane module) was neutralized because of the wire tension lower than the specification. High-voltage tests are carried out at three different steps during assembly to identify and repair problematic elements. A final high-voltage conditioning is performed, when two 4-plane wheels are assembled together in a 8-plane wheel. For the binary gas mixture 70%Ar and 30%CO2 used in this test, the high voltage is 1480 V. The voltage was applied to the wheel during several weeks. The current drawn should remain below 150 nA for groups of about 200 straws. The problematic wires out of specification were removed and restrung when ever possible during assembly of the modules. Part of them were neutralized (disconnected from the high-voltage group by unsoldering the protection resistor), since the design of the endcap does not permit restringing of the wires after assembly of the module. Basically, all tests were repeated after transportation of the modules to CERN, before the modules enter the stage of final assembly to the super-modules equipped with front-end electronics. 6. The wheels tests and acceptance criteria The most stringent requirement for accepting the assembled wheels [6] is the need for a stable and robust operation of the TRT detector over many years of running at the LHC. The aspired goal was to achieve a full detector with less than 1% of dead channels, although up to 3% are acceptable with respect to physics performance. Therefore all assembled TRT wheels are passed through various tests and the quality control procedures. The careful testing and analysis helped to detect non-obvious problems in the production cycle. All the module characteristics are recorded in the production data base. In the large scale project like the TRT, the modern database is needed not only for trivial follow up of the component stores, but also to document more complicated test results, and to provide possibilities to trace the reasons of the detector failure. Even after many years of running, information on the batch of components used, on the person names

40
involved into production and tests, environment conditions during the tests can be extracted from the TRT Data base. The verification of the straw straightness, or wire offset (eccentricity) with respect to its nominal position within the straw, is the most critical test of the full set of acceptance criteria. For a wire offset of more than 400 μm, the local increase of electric field substantially modifies the gas gain. Under such conditions, the rate of discharges and large-amplitude signals increases significantly, making the straw very unstable under standard LHC running conditions. Therefore such wires are disconnected from the high-voltage supply. The actual overall wire offset can arise from several sources, e.g. the mechanical positioning of the crimp tube
in the straw plastic end-pieces, bent or non-cylindrical straws, etc. The technical difficulty in direct determination of wire positions in 370,000 straws demands an indirect way to access eccentricity and other geometric deformations of the straws. The method is based on the measurements of the gas gain uniformity along the straw tube. The verification is performed by installing the 8-plane wheel under test in a vertical position in the automated setup (called Wheel Test Station) equipped with an array of 55Fe radioactive sources − see Fig. 6. The WTS is rather complicated setup, it includes all complexities starting from precise mechanics, sophisticated electronics, computing and data acquisition system, on-line and off-line programming up to a dedicated data base. PNPI provided main contributions to this project from design to construction of the WTS key elements. The 55Fe sources are mounted on arms placed at six different radii on a star-shaped support. Through an automatic rotation of the arms, the signal amplitude, obtained from the straws filled with a 70%Ar and 30%CO2 gas mixture, is read out at six points along the full length of each individual straw. For a perfectly straight straw with an anode wire exactly centered at the straw ends, the amplitude of the signal should be uniform along the full length of the straw. With the help of calibration curves, the wire eccentricity can be extracted from the change in the gas gain and from deterioration of the peak width. The calibration curves have been determined in experiments with controlled deformation of the straw tubes. The gas gain variation is defined by the difference of the largest and the smallest gain points. In addition, the shape of the measured peak provides an indication of the nature of the anomaly. After applying safety factors accounting for uncertainties, it was decided that straws with amplitude variations greater than 9% are subject to critical review and possibly to face disconnection. The results of all acceptance tests are stored in production database and summarized in so-called electronic endcap wheel passports. The wheels were assembled on time according to the plans of the TRT collaboration. Less than 1% of the channels were dead. After delivery to CERN, the wheels were tested again with the results reproducing well the measurements at PNPI. 7. Integration and commissioning During 2004−2006, stacking of all endcap wheels with their electronics into the TRT endcaps has been performed. The endcap services were connected to the detector after rotating the endcap stacks from their original horizontal position to the vertical position within a service support structure and the Faraday cage.
Fig. 6. View of the 8-plane wheel prepared for the tests on the WTS with radioactive source 55Fe

41
Before final installation in the ATLAS cavern in the beginning of 2007, the TRT has been fully characterized and qualified as an operational system separately and together with the silicon-strip detector (SCT). Common survey, mechanical and geometrical test, services test and system test have been done. The dedicated cosmic runs, stand-alone and combined with the SCT, have been performed. The major goal of the cosmic rays studies was to test combined operation of the SCT and the TRT (Fig. 7) and to check the inter-detector effects. To represent and analyse the readout data from the TRT detector, a program called Event Display was written by the PNPI team. PNPI physicists made principal contribution to the TRT detector description for the GEANT4 detector simulation. Currently, studies of the TRT performance for electron identification are in progress within the Physics e/gamma group. PNPI physicists participate also in the work of the Top-physics group and the Jet/EtMiss working group. References 1. T. Akesson , O. Fedin, A. Khristachev, L. Kudin, S. Kovalenko, V. Maleev, A. Nadtochy, S. Patrichev, Y. Ryabov, V. Schegelsky, D. Seliverstov, E. Spiridenkov, A. Zalite et al., IEEE Transactions, Nuclear Science 51, 994 (2004). 2. M. Cappeans, O. Fedin, A. Khristachev, L. Kudin, S. Kovalenko, V. Maleev, A. Nadtochy, S. Patrichev, Y. Ryabov, V. Schegelsky, D. Seliverstov, E. Spiridenkov, A. Zalite et al., IEEE Transactions, Nuclear Science 51, 960 (2004). 3. T. Akesson, O. Fedin, A. Khristachev, L. Kudin, S. Kovalenko, V. Maleev, A. Nadtochy, S. Patrichev, Y. Ryabov, V. Schegelsky, D. Seliverstov, E. Spiridenkov, A. Zalite et al., Nucl. Instr. Meth. A 522, 50 (2004). 4. T. Akesson, O. Fedin, A. Khristachev, L. Kudin, S. Kovalenko, V. Maleev, A. Nadtochy, S. Patrichev, Y. Ryabov, V. Schegelsky, D. Seliverstov, E. Spiridenkov, A. Zalite et al., Nucl. Instr. Meth. A 522, 25 (2004). 5. T. Akesson, O. Fedin, A. Khristachev, L. Kudin, S. Kovalenko, V. Maleev, A. Nadtochy, S. Patrichev, Y. Ryabov, V. Schegelsky, D. Seliverstov, E. Spiridenkov, A. Zalite et al., Nucl. Instr. Meth. A 522, 131 (2004). 6. P. Cwetanski, O. Fedin, A.Khristachev, L. Kudin, S. Kovalenko, V. Maleev, A. Nadtochy, S. Patrichev, Y. Ryabov, V. Schegelsky, D. Seliverstov, E.Spiridenkov, A. Zalite et al., IEEE Transactions, Nuclear Science 52, 2911 (2005).
Fig. 7. View of the TRT endcap during integration with the SCT endcap at CERN

42
LHCb EXPERIMENT A.A. Vorobyov, B.V. Bochin, N.F. Bondar, O.E. Fedorov, V.L. Golovtsov G.A. Gorodnitsky, S.A. Guets, A.P. Kaschuk, V.S. Kozlov, Z.G. Kudryashova, V.I. Lazarev, V.D. Lebedev, O.E. Maev, G.V. Makarenkov, P.V. Neustroev, N.R. Sagidova, E.M. Spiridenkov, N.M. Stepanova, V.I. Tarakanov, A.Yu. Tsaregorodtsev, S.S. Volkov, An.A. Vorobyov, A.A. Zhdanov 1. Introduction
The LHCb experiment is aimed at detailed studies of CP-violation effects in various decays of B mesons and also at search for rare B decays suppressed in the Standard Model. These studies should check the predictions of the Standard Model on a high precision level and, in this way, may reveal some presence of the “new physics” beyond the Standard Model. At present, the main information in this research area is coming from the e+e−-colliders (BABAR experiment at SLAC (USA) and BELLE experiment at KEK (Japan)). Also, some important results were obtained recently in the CDF and D0 experiments at Tevatron (1 TeV + 1 TeV pp -collider at FNAL (USA)). Compared to the e+e−-colliders, LHCb will be much more abundant source of B mesons. Moreover, a larger variety of b-mesons and b-baryons will be produced. As concerns the CDF and D0 experiments, they are general purpose experiments, not optimized for B-decay studies. The LHCb experiment, being a dedicated B-physics experiment, will have serious advantages (forward geometry, particle identification) over the Tevatron experiments. In the initial stage of formulation the physics program for LHC, there were three different proposals for dedicated studies of B physics. One of them (COBEX) proposed to use the pp-colliding beams, the other proposals considered two options of fixed target experiments. None of these proposals was accepted by the LHC Committee. Instead, it was recommended to the three collaborations to merge in one collaboration and to present a new proposal oriented on utilization of the pp-colliding beam. Following this recommendation, such collaboration (LHCb collaboration) was soon organized and started to work out the new project. The COBEX layout was considered as a starting point. The PNPI group, being a member of the COBEX collaboration, took an active part in development of the new project. In particular, the PNPI group suggested the most radical change in the COBEX layout: it was proposed to replace the COBEX magnetic system (a large quadrupole magnet followed by a small dipole magnet) by one large aperture dipole magnet. This proposal was based on simulation studies of the detector performance, including the background conditions. After hot discussions, this proposal was accepted by the collaboration. The Letter of Intent was presented in August 1995, and it was approved by the LHCC. Since then, the PNPI group focused the efforts on development of the LHCb Muon System. 2. LHCb detector The Technical Proposal (TP) of the LHCb experiment was approved in September 1998. The LHCb detector was designed as a single-arm spectrometer with a forward angular coverage from 10 mrad to 300 (250) mrad in the bending (unbending) plane. The choice of the detector geometry was motivated by the fact that at high energies both ( )b b -hadrons are predominantly produced in the same forward cone. The production rate of the bb -pairs being very high, the LHCb experiment plans to operate at reduced luminosity of 2 × 1032 cm−2s−1, still producing unprecedented amounts of the bb -pairs (1012 per year). This allows to study rare B-decay channels, under condition that these channels could be well separated from the background reactions. The strategy of the LHCb experiment was formulated as follows:
− powerful particle identification; − high precision vertex detector; − high momentum resolution for charged particles;
− efficient trigger for selected B-decay channels with b-tag; − selection of the bunches with only one interaction per bunch.
These features should make the LHCb detector a unique facility for future B-physics.

43
The LHCb detector comprises a large aperture magnet, a vertex locator, a tracking system, two RICH counters, an electromagnetic calorimeter with a preshower detector, a hadronic calorimeter, and a muon system. It occupies space of 20 meters along the beam direction. One important parameter of the detector is the amount of material traversed by the particles before they enter the calorimeter. This material deteriorates the detection capability of electrons and photons, increases the multiple scattering of the charged particles, and increases occupancies of the tracking stations. Unfortunately, after completion of the Technical Design Reports (TDRs) by the end of 2001, it was realized that the material budget of the LHCb detector is a factor of 1.5 higher than expected in the TP. On the other hand, it was understood that the amount of material can be reduced to the TP values by reoptimizing some of the detector systems without deterioration of its performance. Figure 1 shows the layout of the reoptimized LHCb detector. The basic layout remains unchanged from that of the TP. The main changes are in the number of tracking stations (4 stations instead of 11), in the number of stations in the vertex detector (21 instead of 25), in the thickness of the silicon sensors (220 μm instead of 300 μm), and in the number of detecting planes in the first muon station M1 (two planes instead of four). Also, there is some reduction of material in RICH1 (due to changing the mirror material) and in the beam pipe (due to replacing the Be-Al alloy by Be in the sections up to the calorimeters. The resulting material budget in front of RICH2 is now 20−30% of the radiation length X0 and 12% of the nuclear interaction length λI, compared to the TP values: 40% of X0 and 10% of λI. The design of the reoptimized LHCb detector was approved in 2003 [1].
3. PNPI participation in design and construction of the LHCb Muon System 3.1. LHCb Muon System. General layout and principle of operation The Muon System performs two functions: the muon identification and the Level-0 muon trigger. Also, it should provide matching of the selected muon trajectory to the Tracking System for precision measurement of the muon momentum. The principle of operation of the Muon System was formulated by the PNPI group in 1997 [2]. It was demonstrated that the Muon System can provide the muon trigger in a stand-alone mode using information only from the muon chambers. As it is described in the Muon TDR [3], the Muon System contains a longitudinally segmented shield to attenuate hadrons, photons, and electrons. The shield components comprise ECAL, HCAL, and four iron walls. The total weight of the iron shield is 1800 tons. Five muon stations, M1−M5, are located as shown in Fig. 1. Muon station M1 is positioned in front of ECAL Stations M2−M4 are embedded in the 40 cm space available between the iron walls, being mounted on movable platforms as illustrated in Fig. 2. The inner and outer acceptance (horizontal-vertical) of the Muon
Fig. 1. Reoptimized LHCb detector layout showing the Vertex Locator (VELO), the dipole magnet, the two RICH detectors, the four tracking stations TT and T1−T3, the Scintillating Pad Detector (SPD), Preshower (PS), Electromagnetic (ECAL) and Hadronic (HCAL) calorimeters, and the five muon stations M1−M5

44
System is 25 mrad × 15 mrad and 294 mrad × 250 mrad, respectively. The sensitive area of the muon stations varies from 42 m2 (M1) to 106 m2 (M5).
Fig. 2. Artist’s view of LHCb. The muon detectors in stations M2-M3 (red color) can slide sidewise the beam line to allow access. The figure shows the right-hand side detectors in maintenance position As it was proposed in Ref. [2], the muon track finding procedure starts with detecting a hit in station M3. Then hits in the other stations are searched in the “fields of interest” close to the line connecting the hit in M3 with the interaction point. Finally, the muon trajectory is reconstructed using the hits in M2 and M1, while the hits in the other stations serve to reduce the background. Thus found muon trajectory is traced back to the interaction point. The deviation of the projected trajectory from the interaction
point (impact parameter) is a measure of the muon transfer momentum pt. The muon trigger selects events with pt higher than a preset value (~ 1.5 GeV/c). The simulation shows that such trigger can provide ~ 40% registration efficiency for the B → μ events with suppression factor of ~100 for the minimum bias events. The described above M1/M2 pt cut exploits information from M1 station which is located in front of ECAL in most severe background conditions. However, in case of problems with M1, the muon trajectory could be determined using hits in M2 and M3. The performance of such M2/M3 pt cut is still satisfactory: ~30% B → μ efficiency with the same suppression factor for the minimum bias events. The described algorithm was implemented in Muon Trigger System which provides the Level-0 trigger signal in less than 3 μs time after the interaction. 3.2. Choice of the muon detector technology A serious problem in the Muon System is the high background. Our studies with GCALOR simulation program [4] showed that fluxes of charged particles in station M1 vary from 200 kHz/cm2 in the region close to the beam pipe to 10 kHz/cm2 in the outer region. The background in stations M2−M5 is lower by nearly two orders of magnitude, but still it is very high. To a great extent, the high background level determines the choice of the detector technology. The detector should be fast and radiation hard. The trigger algorithm requires the very high detection efficiency in each muon station. It should be 99% in a 20 ns window to determine reliably the correct bunch crossing. On the other hand, the space resolution of the muon detectors might be rather modest, coherent with the muon track diffusion due to Coulomb scattering in the iron shield. To satisfy these requirements, a 2D-pad structure has been chosen with the pad dimensions in each station scaled so that the pad configuration in M1−M5 is projective to the interaction point. Each station is divided into four regions, R1−R4, with different pad sizes. Several technologies have been considered for the muon station detectors. The PNPI group suggested to use specially designed fast operating wire chambers with anode and/or cathode readout. The other technologies were so-called Thin Gap Chambers (TGC) and Resistive Plate Chambers (RPC). After extensive R&D studies, the LHCb collaboration has chosen the wire chambers proposed by PNPI for the whole Muon System except a small but the most “hot” region R1 in station M1 where GEM detectors will be used. The proposed wire chambers have a rectangular geometry with the sensitive area S = H × L, where the chamber height H varies from 20 cm (M1, R1−R4) to 31 cm (M5, R1−R4) and the chamber length L from 24−37 cm (R1, M1−M5) to 96−150 cm (R4, M1−M5). An important feature of this design is identical chamber height for all regions within one station. This allows to use the “ladder structure” and to avoid complications in boundary areas between different regions. This structure is illustrated by Figs. 3, 4.

45
The wire chambers have symmetrical cells with the following geometry parameters:
• the anode-to-cathode distance − 2.50 mm , • the anode wire diameter − 30 μm, • the anode wire spacing − 2.0 mm.
The wire is wound along the short side of the chamber in the vertical (Y) direction. In the region R4, the wire length coincides with the required pad size in the Y-direction. Therefore, wire pads are used in these regions by grouping several wires in one readout circuit. For example, the wire pad size in the region M3R4 is 54 × 270 mm2. The other regions have cathode pads with the pad sizes reduced in both directions by the factors 2 (R3 region), 4 (R2 region), and 8 (R1 region). The pad size remains constant within each region. Each chamber in stations M2–M5 contains four sensitive gaps which are connected as two double-gap layers. Such multi-gap structure helps to satisfy the requirements of fast operation and high detection efficiency. Also, it should provide a sufficient redundancy of the Muon System designed for many-years operation of the LHCb experiment. Note, however, that the station M1 contains only one double-gap, due to space and material budget constraints for this region. 3.3. Study of muon chamber prototypes During the period 1998−2002, a series of muon chamber prototypes (10 prototypes in total) were constructed at PNPI and tested in a pion beam at CERN [5] − see Fig. 5. These R&D studies allowed to optimize the chamber geometry parameters, the gas mixture, and the front-end electronics parameters. Also, simulation studies of the muon chamber performance were carried out. Fig. 5. One of the muon chambers constructed at PNPI in the T11 test beam area at CERN. In total, 10 muon chamber prototypes have been constructed at PNPI and tested in the 3 GeV/c pion beam at CERN. The results of these tests were decisive for selection of the proposed detector technology for the LHCb Muon System
Fig. 4. XY-view of a quarter of station M2. Regions R4, R3, R2, and R1 are marked in blue, green, yellow and red, respectively
Fig. 3. Side view of the muon system in the YZ-plane

46
Various gas mixtures have been tested, and the mixture of Ar/CO2/CF4 (40:50:10) was recommended. This gas mixture provides high electron drift velocity (~100 μm/ns), increased stability again discharges, and good aging properties. Note that these studies were performed with 1.5 mm wire spacing in the chambers. The conclusions from these studies were as follows.
• One double-gap layer of the muon chamber can provide the required 99% detection efficiency in a 20 ns time window in the high voltage (HV) range from 3.15 kV to 3.35 kV, the efficiency being not so sensitive to staggering of the wire planes and to the incident angle of the muons.
With two double-gap layers, the 99% efficiency can be obtained starting from HV = 2.95 kV. • The gas gain was around 105 at HV = 3.15 kV. Its variation over the whole chamber area was
measured to be within ±20% (equivalent to ±30 V variation in HV). • The chambers could operate at high beam intensity. The tests with a 150 kHz beam did not show
deterioration of the detection efficiency. • The total cross talk probability in a double-gap layer was measured to be less than 10% at HV ≤ 3.2 kV, and it was dominated by the cross-talk to the neighbor pads.
These results demonstrated that the designed muon chambers can satisfy the requirements of the LHCb experiment with the redundancy which was considered even as excessive. That is why the collaboration decided to increase the wire spacing from 1.5 mm to 2.0 mm, thus reducing the cost and simplifying the assembling procedure. Further tests showed that the chamber performance was not deteriorated significantly. After that, the chamber technology was fixed, and the construction of the Muon System has been started. 3.4. Assembling of muon chambers at PNPI The LHCb Muon System contains 1380 muon chambers in total, 600 of them were to be assembled at PNPI. These are the four-gaps chambers with the wire pad readout for the region R4 in the stations M2, M3, and M4. They cover 75% of the total area of these stations (Fig. 4). The sensitive area of each chamber is 120 × 25 cm2 (M2R4), 130 × 27 cm2 (M3R4), 140 × 29 cm2 (M4R4). In total, they contain about 1500000 anode wires. According to the specifications, the gas gain should be uniform over the chamber area within ±30%. This is translated to the following constraints: the gap size of 5.0 ± 0.1 mm, the anode wire spacing of 2.0 ± 0.1 mm, the anode wire tension of 65 ± 5 g. The chambers have no frames. The chamber planes are glued together, so the chambers could not be opened after assembling. This requires a reliable assembling technology with control at at each step. Such technology has been developed at PNPI, and it was approved by the collaboration after the Production Readiness Review on January 30, 2004. Then chamber assembling was started in a specially prepared assembling facility (PNPI-1) − see Figs. 6, 7. From mid of 2005, the second facility (PNPI-2) − see Figs. 8, 9 − joined this activity. More than 40 PNPI specialists were involved in this project. A clean area (800 m2) was prepared for this work. Both facilities were equipped with special tooling: six bar-gluing tables, two automated wiring machines, an automated wire-soldering machine, two wire- spacing and wire-tension control machines, two γ-rays test stands, various test equipment. This tooling was designed and fabricated jointly by the PNPI and CERN teams.
Fig. 7. Automated wire soldering and wire pitch and tension measuring machines at PNPI-1
Fig. 6. Bar gluing tables at PNPI-1 facility

47
Unprecedented production rate has been reached: up to one chamber per working day in each facility. By the end of 2006, all 600 chambers have been assembled and tested. According to the tests, all chambers were well within the specification requirements.
All results from the tests are stored in the CERN Oracle Database Server accessible via Internet by any member of the LHCb collaboration − see Fig. 10.
Fig. 9. The PNPI-2 team in front of containers with the last muon chambers assembled at PNPI and prepared for the transportation to CERN on November 20, 2006. Fig. 10. Special Web-Application was developed in order to implement all test results into the CERN Oracle Database Server. The database contains full information on chamber tests at all stages from the beginning of construction till the installation into the LHCb Muon System 3.5. Testing of muon chambers at CERN and installation into LHCb Muon System By the end of 2006, all 600 muon chambers assembled and tested at PNPI were transported to CERN. At CERN, the tests were repeated (gas leak tests and HV tests). After that, the chambers were installed in a storage area and permanently flushed with dry nitrogen. Then the chambers were dressed with Faraday cages and with low voltage and high voltage lines, and were passed the final “pre-installation” tests on a special cosmic-rays test stand. Some chambers were also tested in the CERN high-flux gamma-rays facility GIF. All this work was done by the PNPI team. After the pre-installation tests, the chambers were sent to the LHCb pit for installation into the Muon System. The installation process required tremendous efforts from the PNPI team. This procedure included preparation of the gas lines, tracing the HV, LV, and readout cables, fixation of the chambers in their positions in the muon stations, alignment of the chambers, gas leak tests, and tests of the readout electronics. A team of 10 people from PNPI participated in this work from mid of 2006. The installation and commissioning of the muon chambers should by finished by the end of 2007, when the Muon System should be prepared for the pilot run of LHC. All the above mentioned stages of testing of muon chambers at CERN and their installation into LHCb Muon System are illustrated by Figs. 11−16.
Fig. 8. Automated wiring machine at PNPI-2 facility

48
Fig. 16. PNPI team participating in installation of the
LHCb Muon System Fig. 15. Installation of muon chambers into the LHCb Muon System.
Fig. 11. Muon chambers in containers after arrival at CERN Fig. 12. Muon chambers in storage area at CERN
Fig. 13. Preparing of muon chambers for final tests Fig. 14. Testing of muon chambers at cosmic-rays test stand

49
3.6. Design and construction of multi-channel high voltage system for LHCb Muon detector The LHCb Muon System contains 1380 muon chambers with about 5000 detecting layers. For better redundancy of the system, it would be important to have independent high voltage supply (up to 3 kV) for each layer. However, the cost of such multi-channel HV system available on market proved to be unacceptable for the LHCb collaboration. A much less expensive HV system for 11000 channels has been constructed recently by joined efforts of PNPI and Florida University for the CMS detector. The LHCb collaboration offered PNPI to build a similar HV system for most part of the LHCb Muon detector (for 4000 channels). Taking into account the critical situation in construction of the HV system for the LHCb Muon detector, PNPI agreed with this proposal, though this work was not in the initial PNPI responsibilities. As the first stage, it was decided to build a system for 2000 channels in 2007 with further extension up to 4000 channels. The designed HV system provides in each channel the voltage control with 1 V resolution and the current control with a resolution of 2 nA (for I < 1 μA) and 100 nA (for I > 1μA). The maximal current in one channel is 100 μA. During 2006, a 108-channel prototype of the HV system was constructed at PNPI and tested at CERN. Construction of the 2000-channel system is planned to be completed by the end of 2007. A block scheme of this HV system is presented in Fig. 17. Fig. 17. Block scheme of designed multi-channel HV system for the LHCb Muon detector. References 1. LHCb Reoptimized Detector Design and Performance Technical Design Report, CERN/LHCC 2003-30, LHCb TDR9, 9 September 2003. 2. M. Borkovsky, A. Tsaregorodtsev and A. Vorobyov, LHC-B 97-007 TRIG, 1997; M. Borkovsky, G. Gorti, B. Cox, A. Tsaregorodtsev, K. Nelsen and A. Vorobyov, LHC-B 98-002 TRIG/MUON, 1998. 3. LHCb Muon System. Technical Design Report, 28 May 2001. 4. N. Sagidova, A. Tsaregorodtsev and A. Vorobyov, LHC-B 97-009 EXPT; LHC-B 97-011 EXPT; LHC-B 97-012 EXPT; LHC-B 98-059 EXPT. 5. B. Bochin, S. Guets, V. Lazarev, N. Sagidova, E. Spiridenkov, An.Vorobiev and A.Vorobyov, LHCb 2000-003 MUON, 14 February 2000; LHCb 2000-102 MUON, 24 Octjber 2000; LHCb 2001-025 MUON, 28 March 2001; LHCb 2002-025 MUON, 19 April 2002.

50
PNPI IN ALICE
V.M. Samsonov, V.A. Evseev, V.V. Ivanov, A.V. Khanzadeev, E.L. Kryshen, N.M. Miftakhov, V.N. Nikulin, V.V. Polyakov, E.V. Roschin, V.I. Ryazanov, O.P. Tarasenkova, M.B. Zhalov 1. Introduction
The ALICE detector is designed to study heavy ion collisions at the energies of several TeV per nucleon by detecting hadrons, electrons, photons, and muons produced in these collisions. A special feature of such collisions is high multiplicity – up to several thousand particles per event per rapidity unit. This feature demands high granularity in the detector systems. The ALICE detector consists of a central (barrel) part embedded in a large solenoid magnet (L3 magnet) and a forward muon spectrometer (Fig. 1).
Fig. 1. The layout of the ALICE detector. The muon spectrometer arm is depicted on the right side of the figure
The barrel part comprises the Inner Tracking System (based on Si-detectors), the Time Projection Chamber, the Particle Identification System (consists of a time-of-flight detector, transition radiation detector and a ring imaging Cherenkov detector), and the Photon Spectrometer based on scintillating PbWO4 crystals. There are also several small forward detectors (not shown in Fig.1): ZDC (zero degree calorimeter), EMD (forward multiplicity detector), TO (collision timing detector), and VO (centrality and collision vertex detector). PNPI participates in design and construction of the muon spectrometer. This spectrometer consists of a large dipole magnet, absorbers, five tracking stations, the muon filter and trigger chambers. It is aimed to study the heavy quark resonances, i.e. J/ψ, ψ′, ϒ, ϒ′, ϒ″ identified by their decay into muon pairs. The estimated mass resolution is of the order of 100 MeV at 10 GeV, sufficient to distinguish the fine structure of the ϒ resonances. The physics interests of the PNPI team are concentrated on studies of the ultraperipheral collisions and polarization effects in production of the heavy quarkonia. We exploit the unique features of the muon spectrometer – high mass resolution and capabilities to produce various trigger signals. It has been demonstrated that minor modifications of the standard trigger algorithm may allow to obtain valuable information on gluon density behavior.

51
2. Tracking chambers for the Muon Spectrometer 2.1. Tracking chamber design In order to achieve the required mass resolution the tracking stations of the ALICE Dimuon arm should satisfy several main requirements:
• They must be thin enough in order to introduce negligible deterioration to the muon track (average X/X0 of the station is less than 3%),
• They should be able to operate in high hit density environment (up to 0.01 hits per cm2), and • To measure the track position with the precision of about 100 μm in bending plane and about 1 mm
in non-bending one. Moreover, the stations cover large sensitive area (up to 5×5 m2). The cathode pad chambers (CPC) were chosen for this purpose. Following suggestions of the PNPI group [1], the rear tracking stations (stations 3, 4 and 5) have a slat structure, i.e. they are composed of the overlapping rectangular CPC modules (also called as slats). The length of the modules varies from 80 cm to 240 cm with the constant height of 40 cm. Several CPC prototypes were constructed and tested, and the assembling technology was developed. The CPC body built of two carbon-fiber/honeycomb sandwiches with the PCB cathodes glued onto them. The cathode segmentation (length of the pads) varies with the behavior of the expected hit density. The signal wires (made of tungsten, diameter of 18 microns, without gold plating) are glued between the spacers made of Noryl. The materials were carefully chosen in order to minimize the detector ageing. The front-end electronics cards are plugged into connectors in the peripheral area of the slats. Special attention has been paid to perform permanent in-production quality control of the modules from the very beginning of the assembly till the final tests, to maintain the cathode planarity, uniformity of the anode-cathode distance, the stress of anode wires, to achieve the correct position of each pad. The special tooling has been developed at PNPI for this purpose. The assembly of 38 CPC modules (a quarter of the total number) has been accomplished at PNPI. For this task, a clean assembly area was prepared and equipped with specially developed tooling and with testing setups. 2.2. Tooling for production of the tracking chambers The PNPI team was responsible for design and construction of the tooling for production of the tracking chamber modules. The PCB trimming machine, the high voltage test bed, the β-source test bench and the devices to measure the wire tension were developed at PNPI and provided to all teams in the collaboration involved in production of the tracking chambers for stations 3-4-5 of the ALICE Muon spectrometer.
PCB trimming device
The high spatial resolution requires a precise (about ±40 microns) positioning of the cathode pads. In order to accomplish this task, the sides of the PCBs were trimmed and the fiduciary holes were punched. The typical linearity of the trim was ±15 microns, the trim line being positioned with respect to the pads within ±20 microns. The same precision was achieved in positioning of the fiduciary holes. This device (see Fig. 2, left) has been used to treat all the PCBs used in the tracking chambers for stations 3, 4, and 5. A simplified option of the device (Fig. 2, right) has been developed and produced at PNPI for our colleagues at Saha Institute (Kolkatta, India). In this case the chamber assembling technology did not require the fiduciary holes, the cathode pads are aligned using the high quality of the PCB edge trimming. The device has been successfully used in production of the chambers for the tracking station 2.

52
β-source test bench Special attention was paid to monitoring the gas gain uniformity. The variations of the gas gain reflect defects of planarity of the cathode planes, resulting in degradation of the chamber spatial resolution. We controlled the gas gain by measuring the current induced in the chambers by a β-source. The constructed test bench (Fig. 3) performs movement of the collimated β-source across the sensitive area with simultaneous measurement of the current. The observed irregularities of the 2-dimensional gas gain distribution do not exceed 30% with typical dispersion around 10% [2].
Fig. 3. β-source test bench and an example of gas gain homogeneity distribution in a tracking chamber
High voltage test bed
The High Voltage Test Bed (HVTB) was build to check the quality of assembled chamber wire planes [3]. The HVTB is a leak-proof box with a transparent cover (see Fig. 4). The cover has a translucent cathode grid and spacers attached to it. The HVTB is equipped with a pneumatic system which lifts up the wire plane and presses it to the cover spacers to reproduce the HV geometry close to that of the real slat chamber. The HVTB is filled with nitrogen − a spark-resistant gas. The applied HV induces corona discharge around the anode wires. The glow is brighter near locations with abnormally strong electric field, as motes, sharp burrs, loose wires etc. This makes the chamber defects visible. The small motes and burrs can be burnt out after 6−7 hours of the corona discharge. Such devices were shipped to all teams which produced chambers for tracking stations 3-4-5.
Fig. 2. The PCB trimmers developed for preparation of the slats for stations 3, 4, 5 (left) and for station 2 (right) at PNPI

53
Fig. 4. A view of the high voltage test bed Measurement of wire tension in tracking chambers The total number of wires in the tracking system is of the order of 100,000. All wires must be stressed; otherwise the system would be mechanically unstable due to electrostatic repulsion (so-called staggering effect). For the chosen wire parameters the minimal tension (staggering limit) is estimated to be 17 grams, while the wire elasticity limit is about 70 grams. The nominal wire tension was chosen to be 40 grams. In order to guarantee the quality of the wiring, it was foreseen that each individual wire tension should be measured during the chamber production. Two kinds of devices for measurements of the wire tension have been built. The first one (see Fig. 5) is designed for use during the chamber production and the other one to check the fully assembled chambers. Both devices use the relation between the wire tension and its resonance frequency. Capacitive sensors are used to catch the free wire oscillations, and the Fourier procedure is used to find the resonance frequency. The difference between the setups is the wire excitation method: while the in-production procedure uses electrostatic pulses, the assembled chambers are checked using the mechanical tap.
Fig. 5. The equipment for wire tension measurement and the wire tension distribution
measured for about 20,000 wires in the chambers produced at PNPI
Both devices can measure the wire tension with the tolerance of ±0.5 g within reasonable time (about 20 minutes per 80 wires) [4]. The results of the measurements with the first device are filled in the production database. The second device is used during the chamber commissioning and in periodical checks during the LHC shutdowns.

54
Beam tests results
The prototypes of the tracking chambers were tested at CERN using the pion beam at PS with the momentum of 7 GeV/c and the muon beam at SPS with the momentum of 120 GeV/c. An array of 10 silicon strip detectors (pitch of 50 microns) has been used to reconstruct the track parameters. The beam test data has been analyzed by several teams. The analyses gave consistent results: the spatial resolution had a narrow component with sigma of about 70 microns at PS and about 50 microns at SPS (the difference is caused by the multiple scattering) at the efficiency of 96% (inefficiency is caused by the distribution tails). The PNPI analysis [5] featured a readout/decoding subroutine, several new methods for the position reconstruction, wide-range parameterization of the realistic residual distribution (see Fig. 6), and parameterization of the resolution angular dependence.
Fig. 6. Parameterization of the residual distribution measured at PS, one can see narrow (~70 microns) and wide (~300 microns) components of the distribution 2.3. Assembling, tests and commissioning of the tracking chambers
To perform the slat production of the tracking chambers, a dedicated assembling site was organized at PNPI (Fig. 7). It includes a clean room (equipped with necessary tooling with a climate control) and several auxiliary rooms. The final assembling of the tracking stations took place at CERN; the PNPI representatives participated in this activity (see Fig. 8). During the chamber assembling, the slats were tested for gas tightness and high voltage, they were equipped with electronics; the electronics was burned and the readout has been tested. By mid of 2007 the Muon Spectrometer assembling is nearly completed, most of the chambers are equipped with electronics and installed in the ALICE cave. The time before the run will be devoted to the commissioning: final installation of the services, tests of the readout, etc.

55
Fig. 8. Tests of tracking chambers at CERN (left) and the assembled half of the tracking station (right) at CERN
3. Mechanical design of the setup
The PNPI team contributed to mechanical design of the muon spectrometer parts: the muon filter and the superstructure. The design includes a complete set of the engineering drawings and the finite element analysis (stress and buckling analysis, simulation of the earthquake). The design was adapted to the capabilities and features of Russian plants. Unfortunately the price tag proposed by Russian industry was too high, so the muon filter has been redesigned in order to build elsewhere. The design of the superstructure did not affected significant changes; it was built at CERN (Fig. 9).
(a) (b)
(c) (d) Fig. 7. A view of clean assembling room (a), gluing of the PCB to the composite sandwiches (b), wiring machine (d), and installation of the signal wires on a wire plane (c)

56
Fig. 9. Superstructure for support of the tracking and trigger chambers designed by the PNPI group
It has also been demonstrated that the requirements to the quality of the gaps between the elements of the muon filter could be rather loose [6]. The members of the PNPI team (Fig. 10) also participated in magnetic field mapping, geometry survey of the detectors and pulling of the cables (together with colleagues from JINR, Dubna).
Fig. 10. Geometrical survey (left) and cabling activity (right) at ALICE
4. Physics activities Heavy quarkonia photoproduction In their pioneering article [7], L. Frankfurt, M. Strikman and M. Zhalov demonstrated that the coherent photoproduction of heavy quarkonia in Pb-Pb collisions at LHC has considerable total cross section and is sensitive to the small-x behavior of the gluon density. We found that the Level-0 trigger in the muon spectrometer, with minor modifications, could be used to study the coherent quarkonia photoproduction (Fig. 11). The two cases were considered: when both muons are detected by the muon spectrometer, and also

57
when one muon hits the muon arm while another one is detected in the barrel. In the first case the standard muon trigger could be used with T0 and V0 decisions excluded. In the second case an additional pre-selection of the events of interest could be achieved including a veto from the Photon Spectrometer. Later, more sophisticated L0 triggers from the pixel Inner Tracking System and from the Time-of flight detectors could be implemented. The additional clean-up could be done at Level-1 analyzing the (ZDC) information. The off-line quarkonia pt analysis will make a final selection of the coherent events. The estimated counting rates are order of 20,000 events in both cases for J/ψ and few hundreds for the case of Upsilon per heavy ion running year [8].
Fig. 11. The theoretical predictions (left) and the AliRoot simulation of the coherent J/ψ photoproduction (right) in function of rapidity; the blue peak corresponds to the case when both muons are detected in the muon arm, the red peak corresponds to the case when one muon is detected in the muon arm, and another one is detected in the barrel
Heavy quarkonia polarization We considered the possibility of the J/ψ polarization measurements in the barrel part of ALICE [9]. The quarkonium polarization is an important test for understanding the quarkonium production mechanisms and heavy ion collision dynamics. The simulations were carried out within the AliRoot framework. An event generator has been developed; the 3D acceptance analysis (pt, y, cosθ) has been carried out. It has been demonstrated that the polarization parameter can be extracted in five pt bins, with the statistical uncertainties on the reconstructed parameter ranging from 0.02 to 0.13.
References 1. V. Nikulin, A. Vorobyov et al., ALICE internal note ALICE-INT/DIM-99-41. 2. V. Baublis, A. Khanzadeev, V. Nikulin et al., ALICE internal note ALICE-INT/DIM-2003-044. 3. A. Khanzadeev, V. Polyakov, E. Rostchin et al., ALICE internal note ALICE-INT/DIM-2004-003. 4. V. Ivanov, V. Nikulin, E. Rostchin, V. Samsonov and E. Vznuzdaev, “Wire tension measurements for ALICE muon arm slat chambers”, submitted as ALICE note. 5. A. Khanzadeev, V. Nikulin, V. Samsonov et al., ALICE internal note ALICE-INT/DIM-2003-048. 6. V. Nikulin et al., ALICE internal note ALICE-INT/DIM-2002-021 7. L. Frankfurt, M. Strikman and M. Zhalov, Phys. Lett., B 540, 220 (2002). 8. V. Nikulin and M. Zhalov, ALICE internal note ALICE-INT/DIM-2003-043. 9. E. Kryshen, PWG-3 Report, 18 April 2006.

58
STUDY OF CHANNELING AND VOLUME REFLECTION EFFECTS IN BENT CRYSTALS PNPI participants of the Russia-Italy-USA-CERN Collaboration: Yu.M. Ivanov, N.F. Bondar, Yu.A. Gavrikov, A.S. Denisov, A.V. Zhelamkov, V.G. Ivochkin, S.V. Kosyanenko, L.P. Lapina, A.A. Petrunin, V.V. Skorobogatov, V.M. Suvorov, A.I. Shchetkovsky 1. Introduction In the last years it has been shown that short bent silicon crystals can be used efficiently to extract beam particles out of the accelerators. This crystal extraction was applied to the main beam and also to the halo particles. The idea of crystal based collimation for the Large Hadron Collider (LHC) at CERN is to use bent crystals for deflecting the halo protons at 6σ from the central beam orbit onto a special absorber where they hit with large impact parameters. Due to large deflection angles and high impact parameters the halo protons can be efficiently removed using crystals from the LHC beams that should reduce background in detectors and avoid quenches of superconducting magnets at highest luminosities. Below we describe our recent studies of silicon properties and beam-crystal interactions performed at PNPI, IHEP, and CERN with the aim to develop high efficient crystal collimation system for the LHC.
2. Observation of elastic quasi-mosaicity effect in silicon
Multiple scattering of high energy charged particles in material restricts an efficiency of the crystals as
beam deflectors. Estimations show that optimal size of the bent silicon crystals in beam direction should lie in millimeter or sub-millimeter region with the bending angles of the atomic planes not exceeding one-two hundred microradians. We found that such requirements can be met using elastic quasi-mosaicity effect in bent silicon plates.
This effect is well-known in crystal-diffraction γ- and X-rays spectrometry after studies carried out by O.I. Sumbaev in 60-es. He showed that bending of quartz plate results in the curving of atomic planes coinciding with normal cross sections of the plate. It broadens the diffraction profiles of γ-lines as if the plate was the mosaic crystal. In 70-es, A.V. Tyunis, V.M. Samsonov and O.I. Sumbaev generalized the theory of the effect and predicted that some other materials (i.e. silicon) should reveal elastic quasi-mosaicity behavior.
We investigated with X-rays the properties of silicon plates cut under different angles with respect to the crystallographic axes and observed the elastic quasi-mosaicity effect for the (111) atomic planes [1]. The plate orientation respect to the crystallographic planes corresponding to the largest elastic quasi-mosaicity effect in silicon is shown in Fig. 1.
Fig. 1. Elastic quasi-mosaicity effect in bent silicon plate: the bending of the plate to a cylinder of radius ρ results in curving of the (111) crystallographic planes along thickness T. The radius ρ' characterizes the curvature induced by anticlastic forces
Fig. 2. Rocking curves before and after bending of the sample (FWHMs are 6″ and 24″, respectively)

59
Using double crystal X-rays diffractometer in the transmission mode we measured rocking curves of the sample with sizes 20(X) × 60(Y) × 0.43(Z) mm3 before and after bending. The measurement results are shown in Fig. 2, where both rocking curves are presented. The FWHM of the rocking curve for unbent plate is equal to 6″ and close to the width from two ideal crystals. After the bending of the sample to a radius of ρ = 92 cm in vertical plane, the rocking curve width and amplitude increase by a factor of 4. The width of the rocking curve directly characterizes a bending angle of the (111) atomic planes along plate thickness. It is equal to 24″ that means bending angle 120 μrad per 0.43 mm. Due to anticlastic forces a shape of the bent plate is similar to the “saddle” with a radius of ρ' = 410 cm in the horizontal plane.
The control experiment was made with another plate cut from the same ingot. This plate was identical to the studied above but differed in the cut angle in the (111) plane by 30°. After the bending of the control plate, its rocking curve practically did not change.
The measured bending angles of atomic planes in silicon were found to be in a good agreement with the updated theory predictions and close to values needed for crystal collimation. 3. Observation of volume reflection effect in bent silicon crystal with 70 GeV proton beam at IHEP
Using elastic quasi-mosaicity effect in silicon we prepared a series of bent crystals with sub-millimeter lengths along beam and studied them at the Institute for High Energy Physics (Protvino) with 70 GeV protons. In the experiment, besides channeling, we observed a volume reflection of protons in the bent crystal [2, 3], the new effect essential for development of crystal applications at accelerators predicted by A.M. Taratin and S.I. Vorobiev in 80-es. This phenomenon arises from the coherent interaction of proton with a bent atomic plane in the tangency point of the plane with the proton trajectory and results in a small angular deflection of the reflected particle opposite the atomic plane bending.
Fig. 3. Bending method of Si (111) planes (coinciding with vertical narrow face of crystal plate)
Silicon plate used in experiment had sizes 20(X) × 60(Y) × 0.72(Z) mm3 with channeling (111) planes parallel to the YZ plane. The plate was bent in the YZ plane using method of applied moments (Fig. 3) to a radius of 48 cm that induced a quasi-mosaic bending of the (111) planes in the XZ plane to a radius of 1.7 m with a full bending angle of ∼420 μrad. The saddle radius in the XZ plane was found to be about 3.2 m in the center of the crystal with increasing to the clamping areas.
The crystal was mounted on a turntable providing 4 mm overlapping with the proton beam in the X-direction (Fig. 4). Alignment of
the crystal was done using a reflection of laser beam from crystal faces to the marks related with proton beam. Channeling orientation of the crystal was found as an angular position with maximal coincidence rate between narrow scintillation counters S1 and S2 placed in and out of the primary beam, respectively. A large counter S3 was used as a primary beam monitor.
Fig. 4. Layout of the experiment. S1, S2, S3 − scintillation counters
p-beam
(111)
X
Y
Z

60
In the experiment we used a small-divergent (∼15 μrad), low intensity (∼105 s−1), external 70 GeV proton beam. The angular spreading of the beam induced by the multiple scattering in the crystal plate was 13.5 μrad. Both the divergence of the incident beam and the multiple scattering in the crystal were small with respect to the critical angle for channeling θc equal to 24 μrad in our case.
The profile of the beam transmitted through the oriented crystal was measured using emulsions of the R-100 type located 4.6 m and 5.9 m downstream. They were exposed to an integrated flux of about 5 particles/(μm)2 and displayed three slightly distinct curved lines A, B, and C. The lines were well visible in a wide background spot from primary beam having a semicircle shape due to cutting a beam by collimator. The measured profiles were similar in both emulsions, but separation of lines was largest in the most distant emulsion, which is shown in Fig. 5. For both emulsions we determined the relative positions and widths of the observed lines in the X-direction of the crystal mid-plane with a microscope (along the white dashed line in Fig. 5).
Fig. 5. Part of emulsion 2 with the profile of the proton beam. The white dashed line indicates the trace of the measurement with a microscope. The black dashed lines show X-readings, which correspond to the borders of the lines A, B, and C
Channeled beam
Reflected beam
6 5
4
3
2
1
C
B
A
dIdx
dIdx
dIdx
Z
X
4.6 m 1.3 m
Crystal
Emulsion 1 Emulsion 2
Primary beam
Primary beam
Fig. 6. Proton trajectories crossing the crystal and emulsions in the horizontal plane (top view). The incident beam is shown as parallel (distance between the effective ‘‘source’’ of the beam and the crystal is much larger than a saddle radius of the crystal) with a uniform intensity distribution along the X-direction. The dots within the crystal indicate the tangency points of the incident proton trajectories with the (111) atomic planes where the volume reflection takes place
An explanation of the beam intensity distribution observed in emulsions is given in Fig. 6 where proton
trajectories in the horizontal XZ-plane are shown. The crystal has curvature in this plane due to anticlastic forces so the (111) planes change orientation along the X-direction. In a small X-range, where incident protons are tangent to the (111) planes on the entry face, part of the protons transiting through this range are captured in the channeling along the (111) planes (rays between 5 and 6) producing a spot C. For points at larger X-coordinates, the conditions are adequate for volume reflection, since the trajectories of the incident protons are tangent to the atomic (111) planes somewhere inside the crystal (rays in between 1 and 3). Out of the X-ranges for the channeling and volume reflection, incident protons pass through the crystal and experience only multiple scattering (rays above ray 4 and below 2). In this case, there is an area depleted of protons in between the reflected and primary beams, denoted by B, and another area where primary and reflected protons mix, denoted by A.
Above or below the mid-plane, we have the same picture of the proton-crystal interactions, except that the vertical dependence of the anticlastic curvature produces a continuous shifting of the projected spots. As result, a joint pattern comprises three lines (two black lines A and C and one light line B) of the same slightly curved shape.
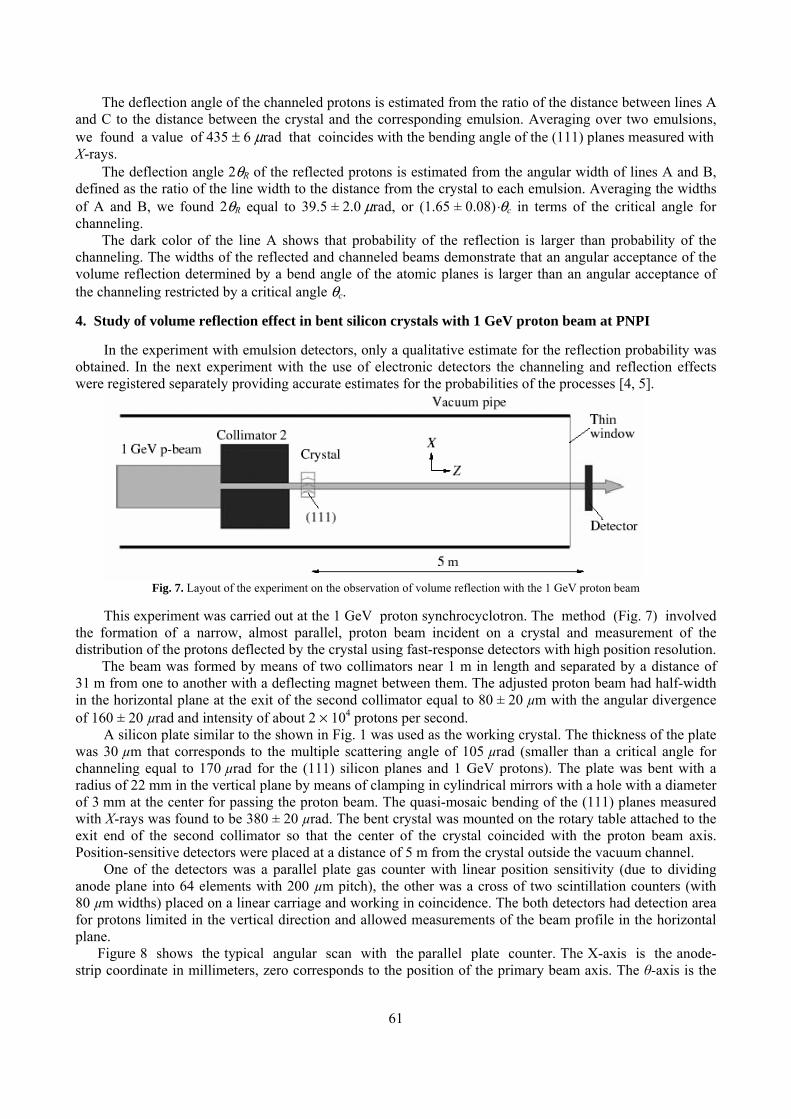
61
The deflection angle of the channeled protons is estimated from the ratio of the distance between lines A and C to the distance between the crystal and the corresponding emulsion. Averaging over two emulsions, we found a value of 435 ± 6 μrad that coincides with the bending angle of the (111) planes measured with X-rays.
The deflection angle 2θR of the reflected protons is estimated from the angular width of lines A and B, defined as the ratio of the line width to the distance from the crystal to each emulsion. Averaging the widths of A and B, we found 2θR equal to 39.5 ± 2.0 μrad, or (1.65 ± 0.08)⋅θc in terms of the critical angle for channeling.
The dark color of the line A shows that probability of the reflection is larger than probability of the channeling. The widths of the reflected and channeled beams demonstrate that an angular acceptance of the volume reflection determined by a bend angle of the atomic planes is larger than an angular acceptance of the channeling restricted by a critical angle θc.
4. Study of volume reflection effect in bent silicon crystals with 1 GeV proton beam at PNPI
In the experiment with emulsion detectors, only a qualitative estimate for the reflection probability was obtained. In the next experiment with the use of electronic detectors the channeling and reflection effects were registered separately providing accurate estimates for the probabilities of the processes [4, 5].
Fig. 7. Layout of the experiment on the observation of volume reflection with the 1 GeV proton beam
This experiment was carried out at the 1 GeV proton synchrocyclotron. The method (Fig. 7) involved
the formation of a narrow, almost parallel, proton beam incident on a crystal and measurement of the distribution of the protons deflected by the crystal using fast-response detectors with high position resolution.
The beam was formed by means of two collimators near 1 m in length and separated by a distance of 31 m from one to another with a deflecting magnet between them. The adjusted proton beam had half-width in the horizontal plane at the exit of the second collimator equal to 80 ± 20 µm with the angular divergence of 160 ± 20 µrad and intensity of about 2 × 10⁴ protons per second.
A silicon plate similar to the shown in Fig. 1 was used as the working crystal. The thickness of the plate was 30 µm that corresponds to the multiple scattering angle of 105 µrad (smaller than a critical angle for channeling equal to 170 µrad for the (111) silicon planes and 1 GeV protons). The plate was bent with a radius of 22 mm in the vertical plane by means of clamping in cylindrical mirrors with a hole with a diameter of 3 mm at the center for passing the proton beam. The quasi-mosaic bending of the (111) planes measured with X-rays was found to be 380 ± 20 µrad. The bent crystal was mounted on the rotary table attached to the exit end of the second collimator so that the center of the crystal coincided with the proton beam axis. Position-sensitive detectors were placed at a distance of 5 m from the crystal outside the vacuum channel.
One of the detectors was a parallel plate gas counter with linear position sensitivity (due to dividing anode plane into 64 elements with 200 µm pitch), the other was a cross of two scintillation counters (with 80 µm widths) placed on a linear carriage and working in coincidence. The both detectors had detection area for protons limited in the vertical direction and allowed measurements of the beam profile in the horizontal plane. Figure 8 shows the typical angular scan with the parallel plate counter. The X-axis is the anode-strip coordinate in millimeters, zero corresponds to the position of the primary beam axis. The θ-axis is the

62
crystal angle in microradians, zero corresponds to the tangency of the primary-beam axis with the (111) planes on the entrance face of the crystal. The color of a point corresponds to the number of protons, the color scale is shown on the right-hand side from the plot. Two effects are clearly seen in the plot, which cause particles to deviate oppositely with respect to the initial direction. The right and left spots are easily identified as the regions of the channeling effect and the volume reflection effect, respectively. The lower and upper spots correspond to the primary beam passing through the non-oriented crystal.
Fig. 8. Beam profile vs the angular position of the crystal as measured using the parallel plate position sensitive gas counter
Figures 9 and 10 show the profiles of the beam passed through the crystal in the angular positions corresponding to the centers of the channeling and volume reflection regions measured with the scintillation detector. The dashed line presents the beam profile corresponding to the non-oriented crystal.
From fitting of the peaks, the probability of the volume reflection equals to 0.71 ± 0.03 that is higher than probability of the channeling equal to 0.63 ± 0.03. The deflection angle of protons reflected inside the crystal is equal to 1.39 ± 0.04 in terms of the critical angle for channeling. The width of the reflected peak is equal to 1.76 ± 0.04 in the same units.
The protons that are not involved in channeling undergo volume reflection and are deflected by an angle of 1.01 ± 0.05 in terms of the critical angle for channeling, and the width of the reflected peak is equal to 1.94 ± 0.08 in the same units.
Fig. 9. Beam profile in the angular position of the crystal that corresponds to the maximum channeling as measured by means of the scintillation detector. The collection time at each point is equal to 10 s
Fig. 10. Beam profile in the angular position of the crystal that corresponds to the maximum volume reflection as measured by means of the scintillation detector. The collection time at each point is equal to 10 s

63
5. Study of volume reflection effect in bent silicon crystals with 400 GeV proton beam at CERN
The experiment [6] was carried out with a 400 GeV proton beam from the CERN Super Proton Synchrotron H8 external line, which had a low divergence and an intensity near 104 particles per second. An experimental layout is shown in Fig. 11. It consisted of a high precision goniometer (G), where the crystals under investigation were mounted, and of various detectors to track particles. They were positioned along the beam line in the vicinity of the crystal and in an experimental area at about 70 m downstream.
Fig. 11. Sketch of the H8-RD22 experimental setup. M1 and M2 are two bending magnets, part of the H8 beam transport line with no specific function for this experiment. See the text for more details
For the experiment, several quasi-mosaic and strip silicon crystals were prepared. In fact, the results of
the measurements with all these crystals turned out to be very similar. Below a result from one of the strip crystals is presented. This crystal had (110) channeling planes bent (due to anticlastic effect) at an angle of 162 μrad along its 3 mm length in the beam direction. The multiple scattering angle of 400 GeV protons in this crystal was equal to 5.3 μrad and small with respect to the critical angle equal to 10.6 μrad. The proton beam had a divergence of 8 ± 1 μrad, also smaller than the critical angle. The beam spot size was of about 1 mm close to the strip crystal thickness. The goniometer consisted of three high precision motion units, two linear and one angular. With the linear motions, the crystals were positioned with respect to the beam center with an accuracy of several micrometers. With angular scans, the crystals were aligned with respect to the beam axis with an accuracy of 1.5 μrad. Six scintillator counters were used to determine the beam transverse offset with respect to the crystal (S1−S2), to provide the basic trigger signal for silicon detectors (S3−S4), and to measure the beam
Fig. 12. Beam intensity recorded by the silicon microstrip detectors as a function of the horizontal deflection angle (X-axis) and the crystal orientation (Y-axis). Six regions can be distinguished: (1) and (6) non-channeling mode; (2) channeling; (3) dechanneling; (4) volume reflection; (5) volume capture. The wider angular acceptance of volume reflection compared to channeling is clearly visible in the figure
divergence and the beam profile (S5–S6). A scintillation hodoscope (H) and a position-sensitive gas chamber (GC) were operated in self-triggering mode for a fast prealignment of the crystal. High statistical runs were taken instead with a set of silicon microstrip detectors (SDn) of spatial resolution in the range 10–30 μm.
Figure 12 shows a summary plot of a scan performed with the crystal. A deflection angle of the channeled beam is equal to 165 ± 2 μrad in agreement with the value of the bending angle of the crystal. An efficiency of the channeling is about 55%. A deflection angle of the volume reflected beam is equal to 13.9 ± 0.2stat ± 1.5syst μrad, which is in agreement with the theory predictions. The volume reflection efficiency has been estimated to exceed 95%. This high efficiency is by far greater than the maximal theoretical single-pass efficiency for channeling.

64
6. Observation of double volume reflection of proton beam by a sequence of two bent crystals Using the beam and setup described in previous section we have carried out an experiment on double
volume reflection in two quasi-mosaic crystals [7]. Experimental layout is shown schematically in Fig. 13.
Fig. 13. Schematic top view of the experimental layout in the horizontal plane. QM1 and QM2 are two quasi-mosaic crystals installed on the rotational stage RS of the goniometer. The QM1 crystal is placed on the additional linear stage LS that allows to align QM1 with QM2. SD1, SD2, SD3 are silicon microstrip detectors, GC is a position-sensitive gas chamber. The lines represents the trajectories of the protons after the crystals, the unperturbed beam (lower dashed) crossing the crystals both in amorphous position, the beam reflected by the first crystal only (upper dashed), and the double-reflected beam (solid)
Two silicon plates QM1 and QM2 with the (111) atomic planes bent of ~70 μrad along the plate thickness of ~0.8 mm were installed on a goniometer. The (111) planes of QM1 plate were fan-shaped that made possible to align them with respect to the QM2 plate within the proton beam spot using the transverse linear motion of the QM1 support.
In Fig. 14 the angular scans performed before (a) and after (b) the fine relative alignment of the two crystals are shown. The channeling peaks for both QM2 and QM1 crystals are visible as the two isolated spots at negative values of the beam deflection angles in Fig. 14a. This scan was obtained before the alignment and, therefore, the two peaks appear at different angular positions of the goniometer.
Beam deflection angle , μ rad
0 - 2 0 - 4 0 - 6 0 - 8 0 - 10 0 2 0 4 0 6 0 - 1 20
(a)
Beam deflection angle , μ rad
0 - 2 0 - 4 0 - 6 0 - 8 0 - 10 0 2 0 4 0 6 0 - 1 20
(b)
Fig. 14. Angular scans performed before (a) and after (b) the fine alignment of the crystals. On the Y-axis the angular position of the goniometer is shown while on the X-axis the beam deflection angle of the particle measured with the GC detector is reported. The origin of the X-axis corresponds to the direction of the incident beam. The origin of the Y-axis corresponds to the angular position of the goniometer when the channeling effect in QM2 crystal is maximal. In (a) both channeling peaks due to QM1 and QM2 are visible. In (b) the two channeling peaks coincides at about the same goniometer angle and are followed by the double reflection. The color scale indicates the beam intensity at a given deflection angle for various angular positions of the goniometer
The mean deflection angles of the channeled protons are measured with the SD2 and SD3 detectors to be 68.6 ± 0.9 μrad and 78.1 ± 4.8 μrad for the QM2 and QM1 crystals, respectively: they are equal to the bending angles of the (111) atomic planes in the crystals. The region of the scan with the proton beam

65
deflected to the opposite direction with respect to the channeled protons is due to the volume reflection effect. The deflection angle and efficiency of a single reflection are found to be 11.70 ± 0.51 μrad and (98.27 ± 0.50)% for QM2 and 11.90 ± 0.59 μrad and (97.80 ± 0.64)% for QM1, respectively.
The volume reflection regions corresponding to the QM2 and QM1 crystals in Fig. 14a are partly superimposed resulting in the deflection of the proton beam at larger angles than in the case of a single reflection. The angle and efficiency of double reflection were accurately measured with finally aligned crystals, the result is shown in Fig. 14b.
Figure 15 shows the beam profiles for three different cases corresponding to amorphous scattering, single, or double reflections of protons in the crystals. The deflection angle of the double reflected beam is found to be equal to 23.23 ± 0.18stat ± 0.09syst μrad, that is twice larger than in the single reflection. The efficiency of the double reflection is equal to (96.73 ± 0.38stat ± 0.50syst)%.
0
100
200
300
400
500
600
700
800
900
-140 -120 -100 -80 -60 -40 -20 0 20 40 60
Beam deflection angle, μrad
Cou
nts
321
Fig. 15. The beam profiles corresponding to amorphous scattering of protons in both crystals (1), the reflection case in one of the crystal (2) and in both crystals – double reflection (3)
Thus, the experiment demonstrated a feasibility of multiple volume reflections in a sequence of short
bent crystals with high efficiency and with beam deflection angle proportional to the number of reflections. This result opens new ways to develop crystal optics for the manipulation of high-energy charged particle beams.
7. Conclusion
In conclusion, the volume reflection exhibits high performance compared to channeling in terms of efficiency and angular acceptance, sheds new insight into the physics of interaction of charged particles with crystals, and suggests new applications in the next generation of experiments in both accelerators and high-energy physics.
References 1. Yu.M. Ivanov, A.A. Petrunin and V.V. Skorobogatov, Pis’ma v ZhETF 81, 129 (2005) [JETP Lett. 81, 99 (2005)]. 2. Yu.M. Ivanov, A.A. Petrunin, V.V. Skorobogatov et al., Preprint PNPI-2649, Gatchina, 2005. 22 p. 3. Yu.M. Ivanov, A.A. Petrunin and V.V. Skorobogatov et al., Phys. Rev. Lett. 97, 144801 (2006). 4. Yu.M. Ivanov, N.F. Bondar, Yu.A. Gavrikov et al., Preprint PNPI-2687, Gatchina, 2006. 22 p. 5. Yu.M. Ivanov, N.F. Bondar, Yu.A. Gavrikov et al., Pis’ma v ZhETF 84, 445 (2006) [JETP Lett. 84, 372 (2006)]. 6. W. Scandale, D.A. Still , A. Carnera et al., Phys. Rev. Lett. 98, 154801 (2007). 7. W. Scandale, A. Carnera, G. Della Mea et al., submitted to Phys. Lett. B (2007).