STATUS OF FOOD and NUTRITION SECURITY IN FIJI
33
Status of Food and Nutrition Security in Fiji: Role of the University and Lessons Learnt Dr Jimaima Lako The University of the South Pacific CTA Cross-Learning Workshop and Writeshop: Informimg Food and Nutrition Policy and Practice; Strengthening the Agriculture – Nutrition Nexus and Improving Outcomes”, 21 st -25 th September, 2015; Dakar, Senegal
-
Upload
technical-centre-for-agricultural-and-rural-cooperation-acp-eu-cta -
Category
Food
-
view
1.320 -
download
0
Transcript of STATUS OF FOOD and NUTRITION SECURITY IN FIJI
Status of Food and Nutrition Security in Fiji: Role of the
University and Lessons Learnt
Dr Jimaima Lako The University of the South Pacific
CTA Cross-Learning Workshop and Writeshop: Informimg Food and Nutrition Policy and Practice; Strengthening the Agriculture – Nutrition Nexus and Improving Outcomes”,
21st -25th September, 2015; Dakar, Senegal
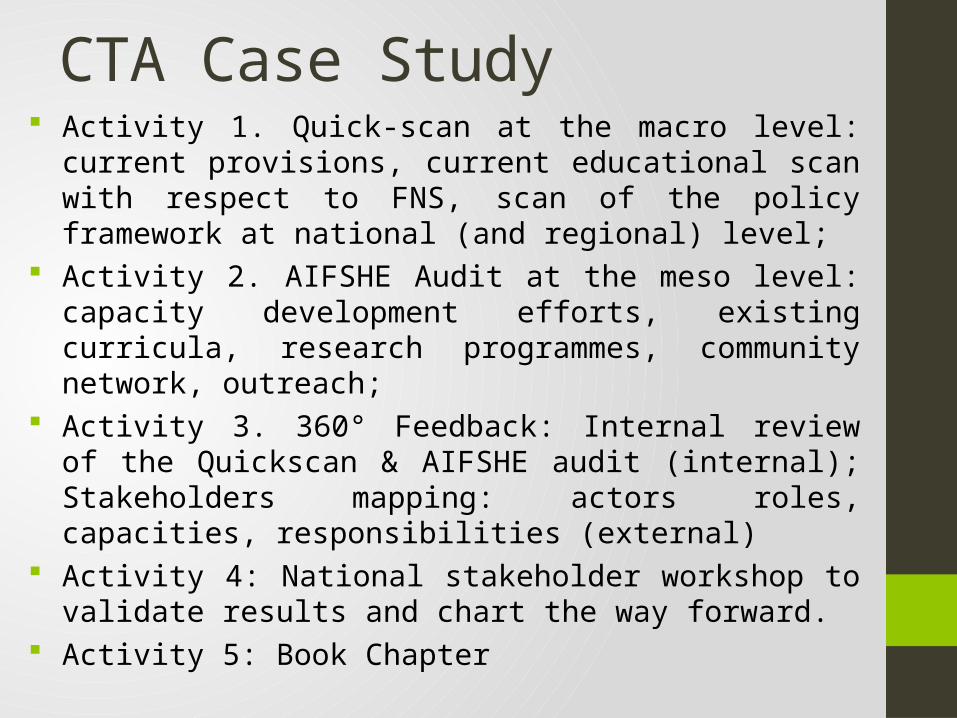
CTA Case Study Activity 1. Quick-scan at the macro level: current provisions,
current educational scan with respect to FNS, scan of the policy framework at national (and regional) level;
Activity 2. AIFSHE Audit at the meso level: capacity development efforts, existing curricula, research programmes, community network, outreach;
Activity 3. 360° Feedback: Internal review of the Quickscan & AIFSHE audit (internal); Stakeholders mapping: actors roles, capacities, responsibilities (external)
Activity 4: National stakeholder workshop to validate results and chart the way forward.
Activity 5: Book Chapter

Background• Population of ~ 837, 271; • Rural- 48%; Urban- 52%
(2011)• Fijians – 54%, Indians – 41%,
( others 5%• 0.7% external migration
• Growth rate ~0.7% (2014est)• Life expectancy – 68yrs
• Land mass – 18,270km2
• ~332 smaller islands• Viti Levu and Vanua Levu
occupy – 87% of land mass contain ~ 84% of population.
• GDP – 4,375.41USD (2013)• Frequent natural disaster e.g.
cyclones every year
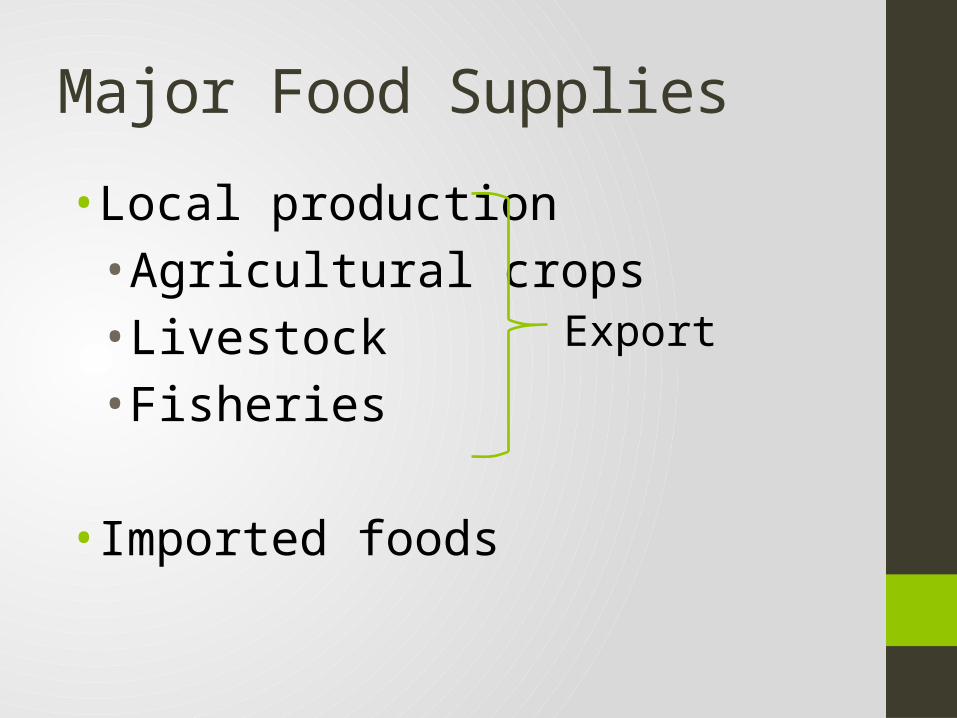
Major Food Supplies
• Local production•Agricultural crops• Livestock• Fisheries
• Imported foods
Export
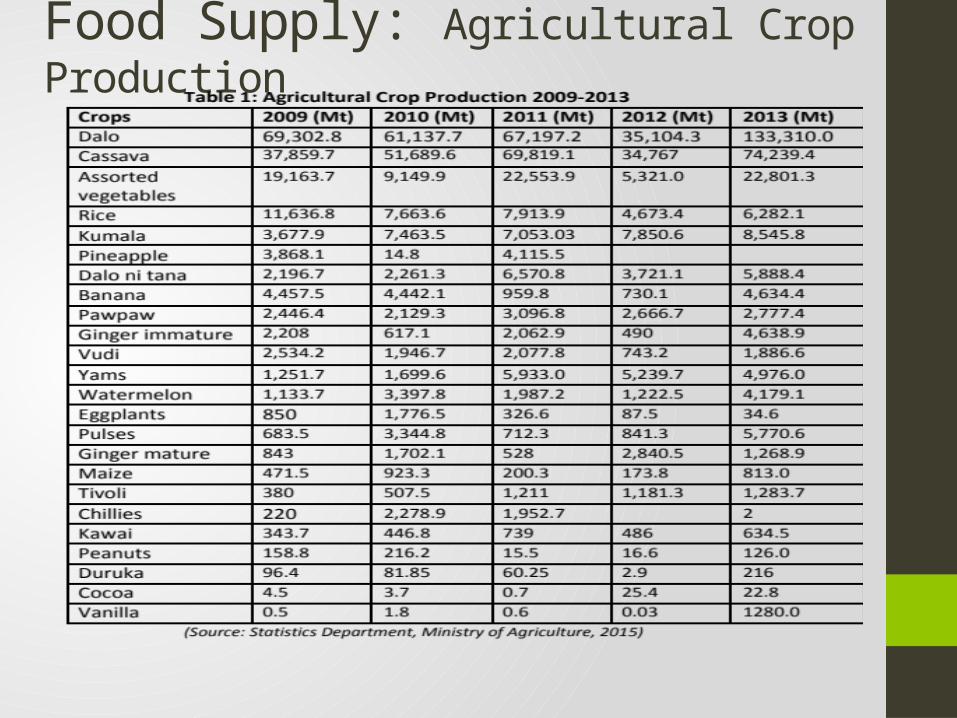
Food Supply: Agricultural Crop Production
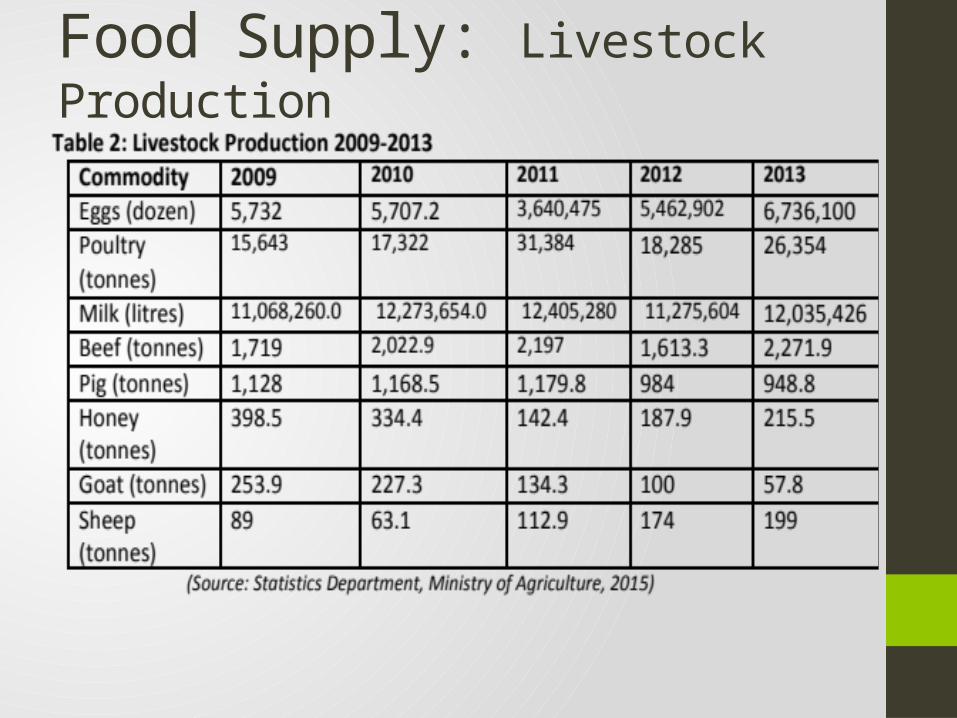
Food Supply: Livestock Production
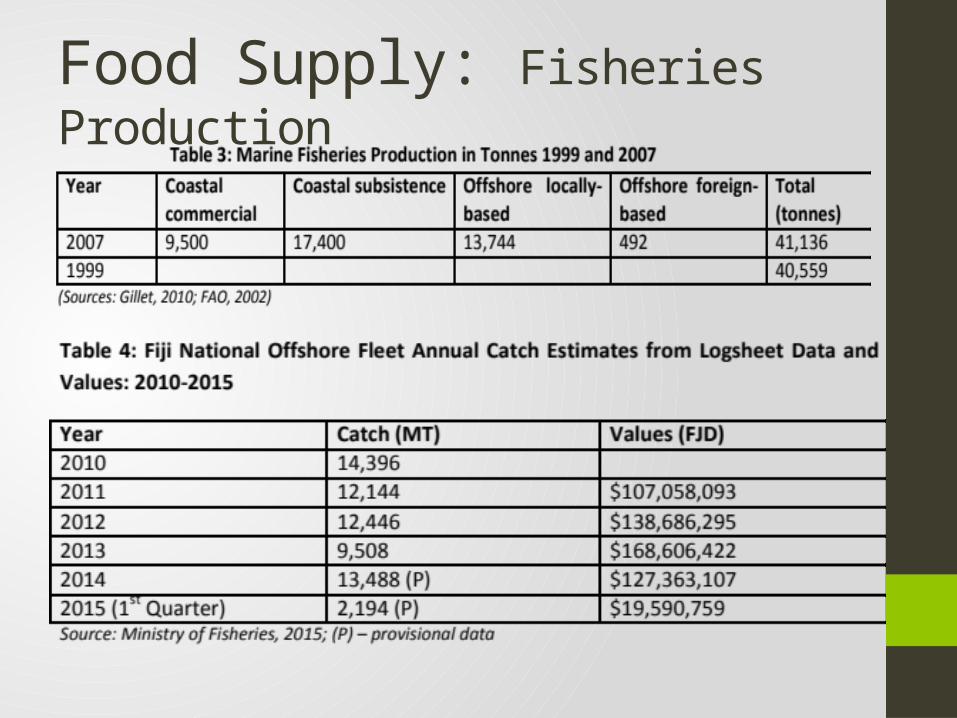
Food Supply: Fisheries Production
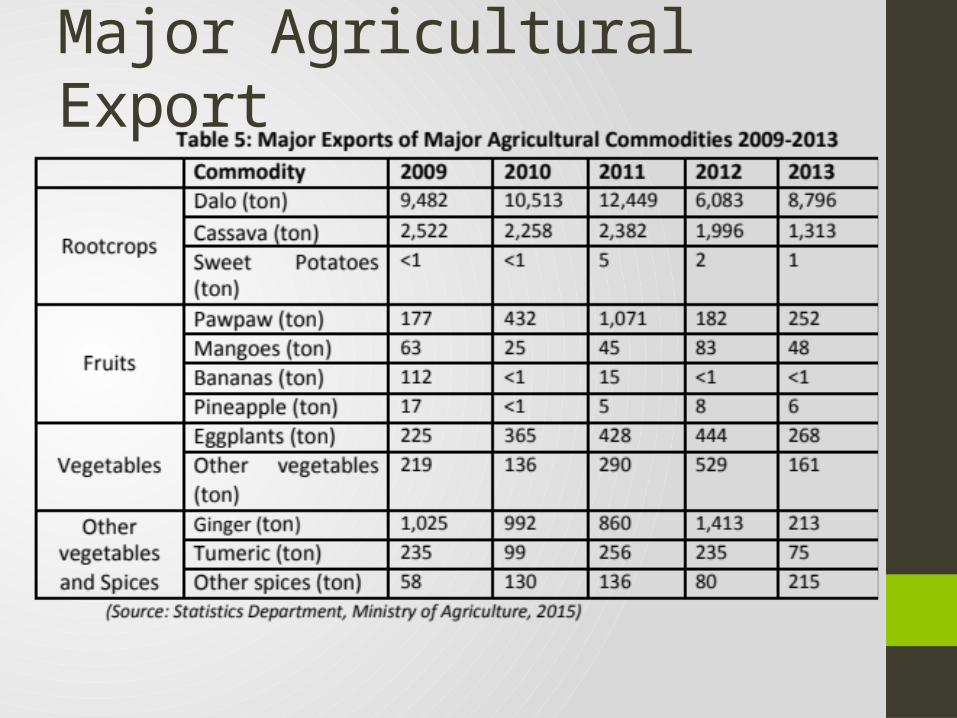
Major Agricultural Export
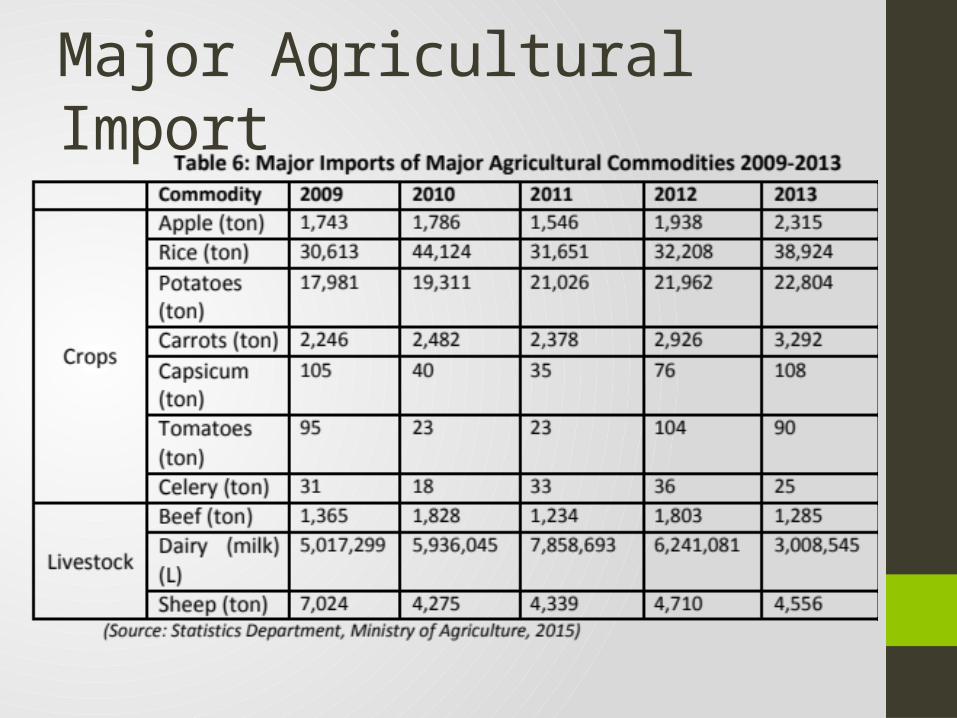
Major Agricultural Import
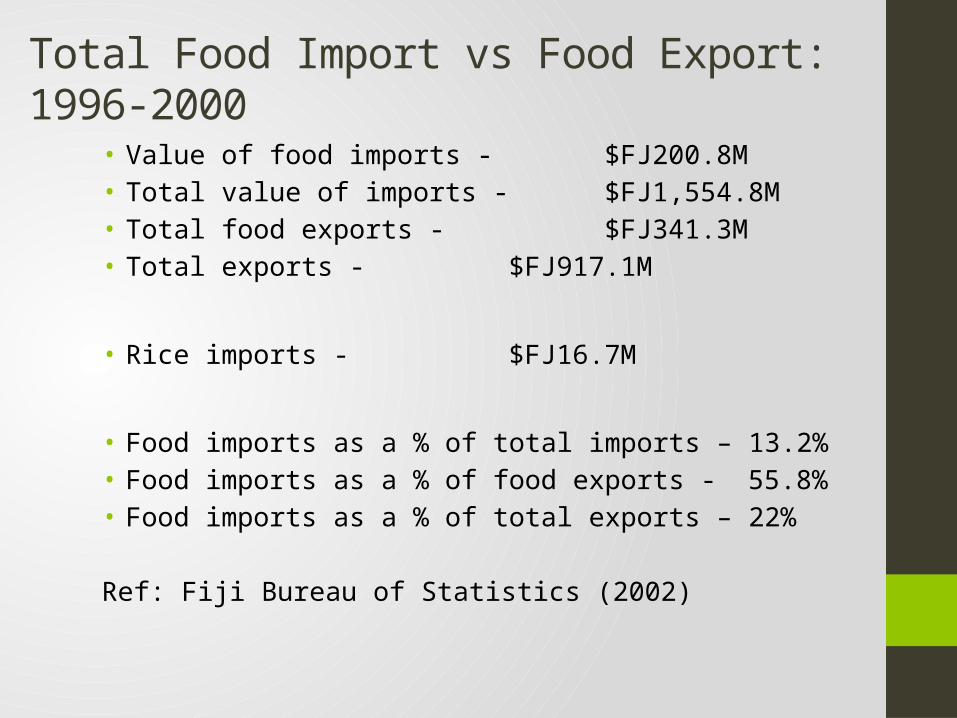
Total Food Import vs Food Export: 1996-2000
• Value of food imports - $FJ200.8M• Total value of imports - $FJ1,554.8M• Total food exports - $FJ341.3M• Total exports - $FJ917.1M
• Rice imports - $FJ16.7M
• Food imports as a % of total imports – 13.2%• Food imports as a % of food exports - 55.8%• Food imports as a % of total exports – 22%
Ref: Fiji Bureau of Statistics (2002)

Import Substitution• In order to reduce high importation of
food commodities and high food bills, the Govt embarked on import substitution projects by the Agricultural Ministry focusing on growing local foods and increase production to directly replace products that were imported such as;• rice, potatoes, carrots, tomatoes, beef
dairy, poultry and feed grains, etc
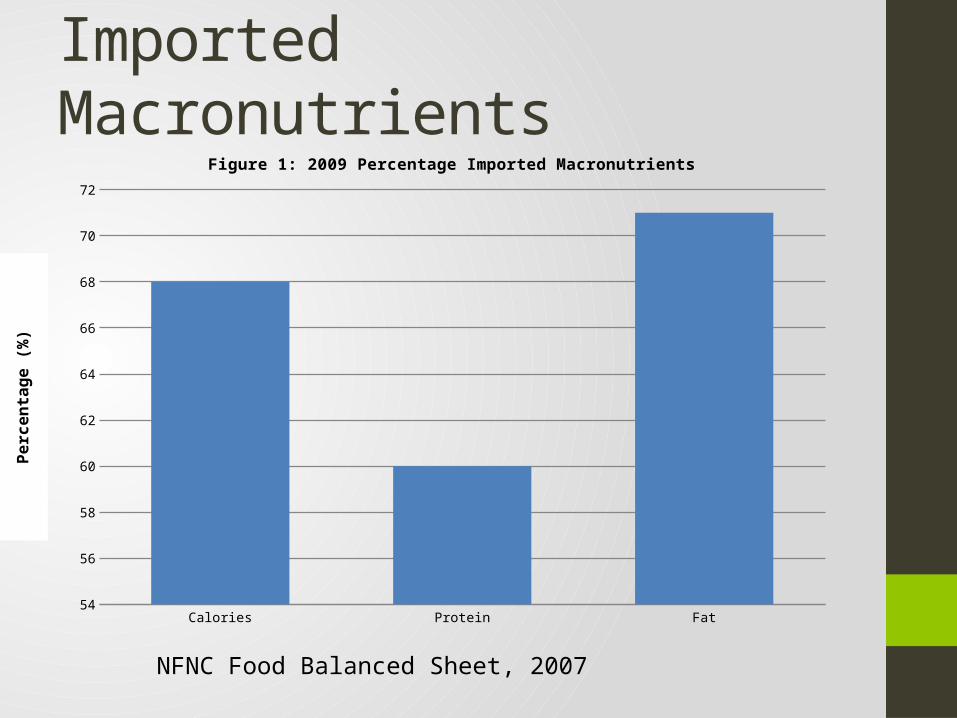
Imported Macronutrients
Calories Protein Fat54
56
58
60
62
64
66
68
70
72
Figure 1: 2009 Percentage Imported Macronutrients
Perc
enta
ge (%
)
NFNC Food Balanced Sheet, 2007
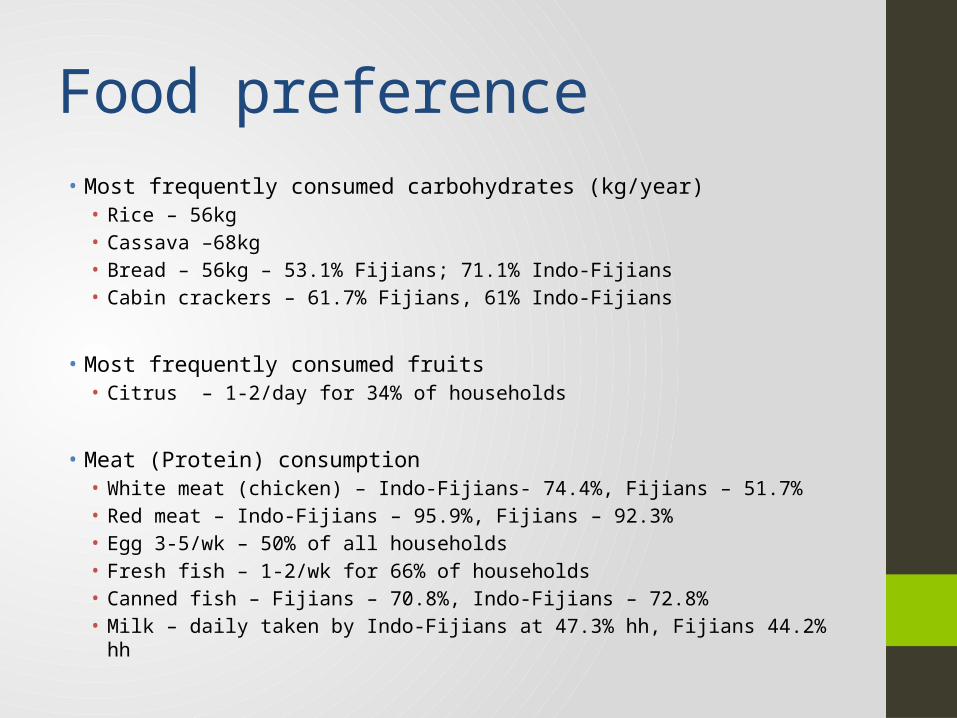
Food preference • Most frequently consumed carbohydrates (kg/year)• Rice – 56kg• Cassava –68kg• Bread – 56kg – 53.1% Fijians; 71.1% Indo-Fijians• Cabin crackers – 61.7% Fijians, 61% Indo-Fijians
• Most frequently consumed fruits • Citrus – 1-2/day for 34% of households
• Meat (Protein) consumption• White meat (chicken) – Indo-Fijians- 74.4%, Fijians – 51.7%• Red meat – Indo-Fijians – 95.9%, Fijians – 92.3%• Egg 3-5/wk – 50% of all households• Fresh fish – 1-2/wk for 66% of households• Canned fish – Fijians – 70.8%, Indo-Fijians – 72.8%• Milk – daily taken by Indo-Fijians at 47.3% hh, Fijians 44.2% hh
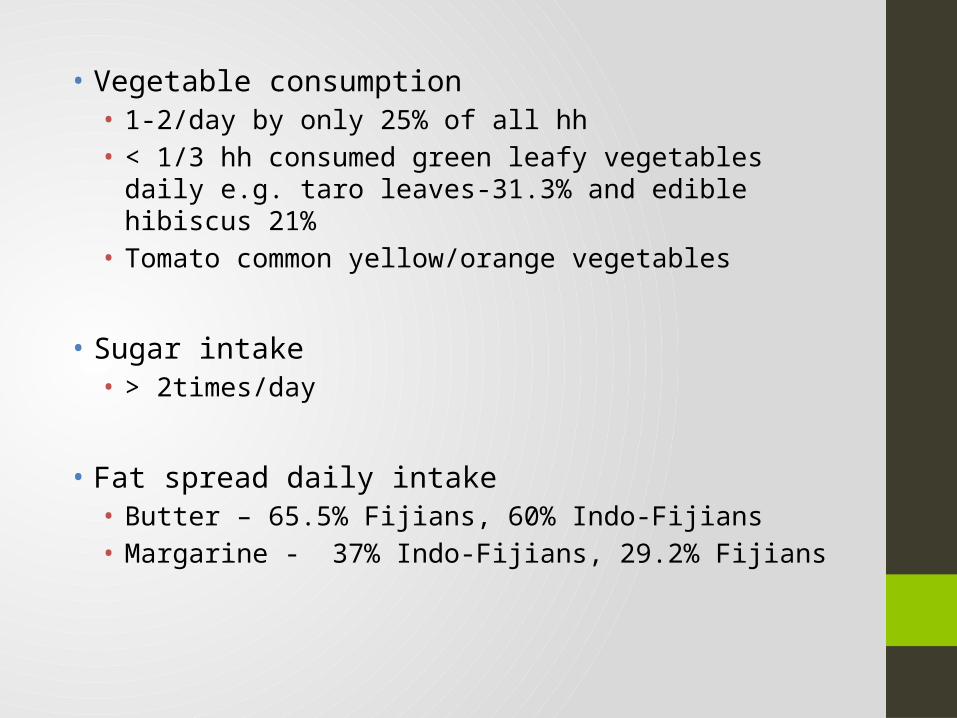
• Vegetable consumption• 1-2/day by only 25% of all hh• < 1/3 hh consumed green leafy vegetables daily e.g. taro leaves-
31.3% and edible hibiscus 21%• Tomato common yellow/orange vegetables
• Sugar intake • > 2times/day
• Fat spread daily intake • Butter – 65.5% Fijians, 60% Indo-Fijians• Margarine - 37% Indo-Fijians, 29.2% Fijians

Subsistence consumption• 78.9% hh consumed own cultivated crops in 2004 compared
to 84.6% in 1993
• Fijians obtained most rootcrops-61% from garden while 8.6% Indo-Fijians
• Indo-Fijians obtained most green leafy vegetables 63.5% from garden compared to 25.6% Fijians
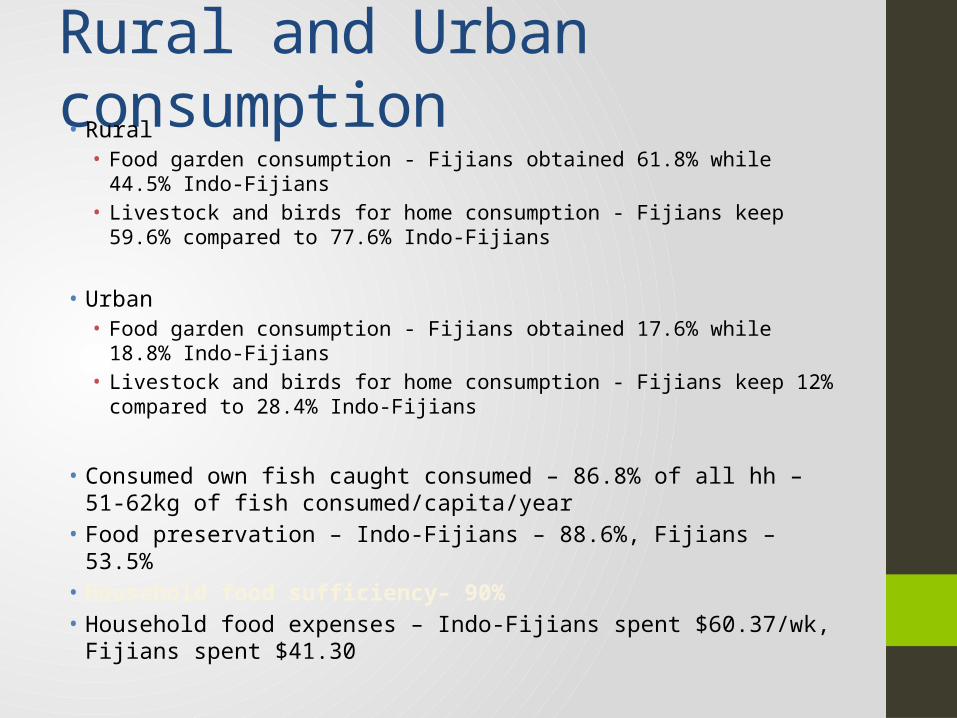
Rural and Urban consumption• Rural • Food garden consumption - Fijians obtained 61.8% while 44.5% Indo-Fijians • Livestock and birds for home consumption - Fijians keep 59.6% compared to
77.6% Indo-Fijians
• Urban • Food garden consumption - Fijians obtained 17.6% while 18.8% Indo-Fijians• Livestock and birds for home consumption - Fijians keep 12% compared to
28.4% Indo-Fijians
• Consumed own fish caught consumed – 86.8% of all hh – 51-62kg of fish consumed/capita/year
• Food preservation – Indo-Fijians – 88.6%, Fijians – 53.5%• Household food sufficiency– 90%• Household food expenses – Indo-Fijians spent $60.37/wk, Fijians spent
$41.30
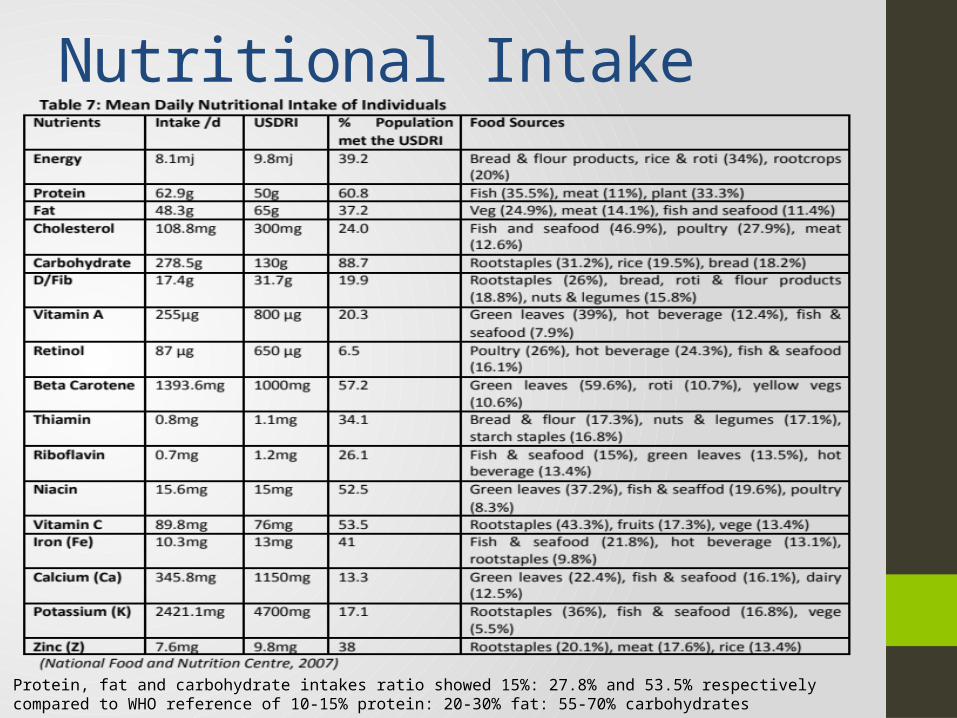
Nutritional Intake
Protein, fat and carbohydrate intakes ratio showed 15%: 27.8% and 53.5% respectively compared to WHO reference of 10-15% protein: 20-30% fat: 55-70% carbohydrates
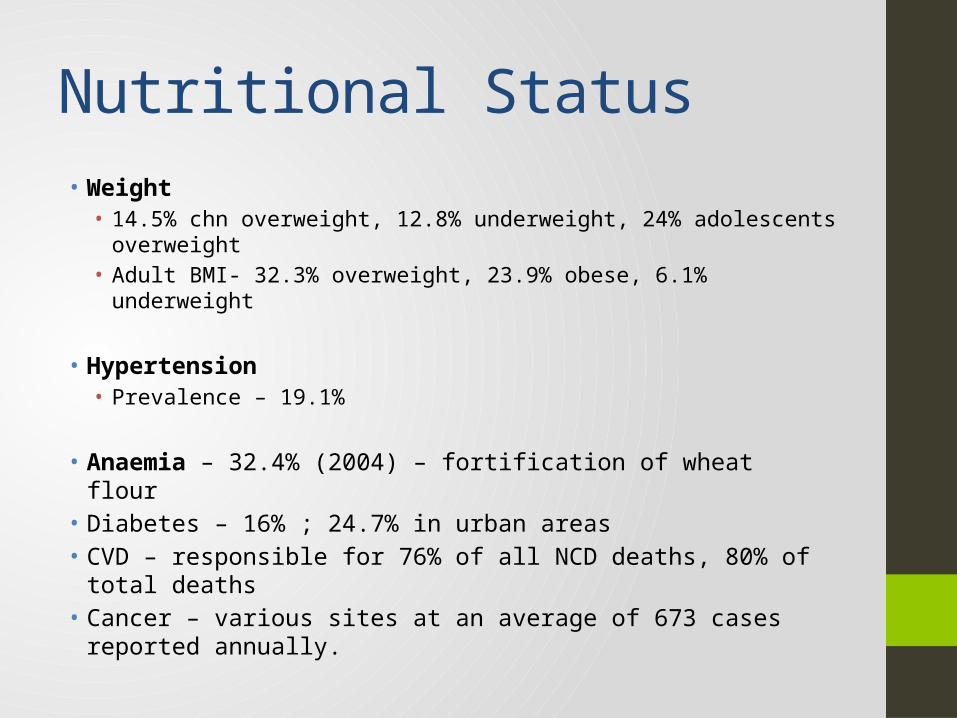
Nutritional Status• Weight• 14.5% chn overweight, 12.8% underweight, 24% adolescents
overweight• Adult BMI- 32.3% overweight, 23.9% obese, 6.1% underweight
• Hypertension• Prevalence – 19.1%
• Anaemia – 32.4% (2004) – fortification of wheat flour• Diabetes – 16% ; 24.7% in urban areas• CVD – responsible for 76% of all NCD deaths, 80% of total deaths• Cancer – various sites at an average of 673 cases reported
annually.

Food Secure Pacific Framework for Action on Food Security in the Pacific
Conceptual Model for Food Security in the Pacific
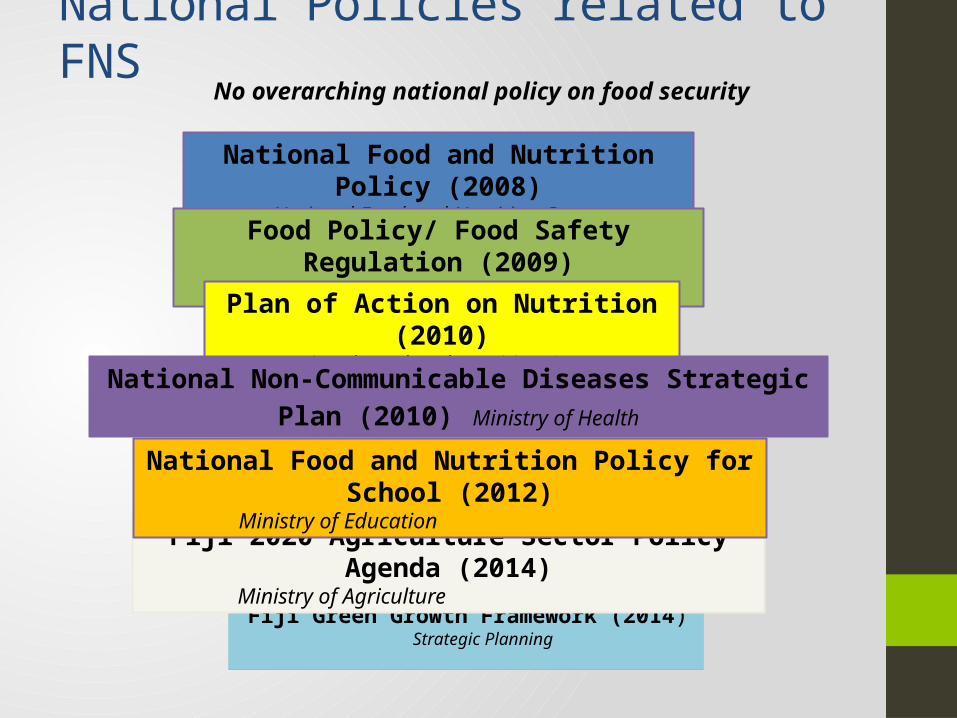
National Policies related to FNS
Fiji Green Growth Framework (2014)Strategic Planning
National Food and Nutrition Policy (2008)
National Food and Nutrition CentreFood Policy/ Food Safety Regulation (2009)
Food Unit, Ministry of HealthPlan of Action on Nutrition (2010)
National Food and Nutrition CentreNational Non-Communicable Diseases Strategic Plan (2010) Ministry of Health
Fiji 2020 Agriculture Sector Policy Agenda (2014)Ministry of Agriculture
National Food and Nutrition Policy for School (2012)
Ministry of Education
No overarching national policy on food security
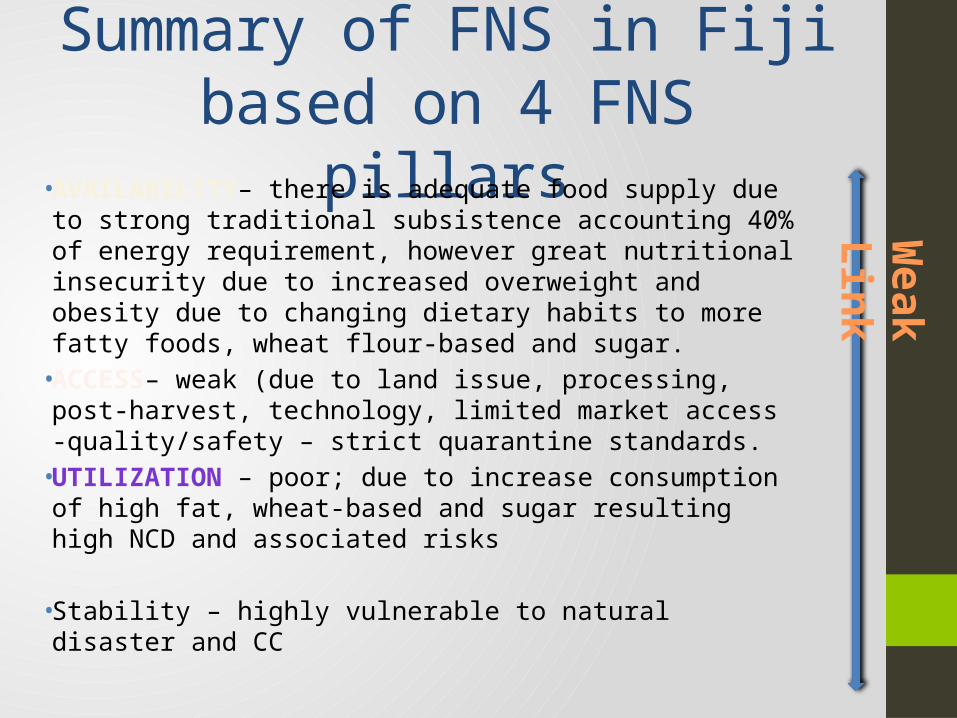
Summary of FNS in Fiji based on 4 FNS pillars
• AVAILABILITY– there is adequate food supply due to strong traditional subsistence accounting 40% of energy requirement, however great nutritional insecurity due to increased overweight and obesity due to changing dietary habits to more fatty foods, wheat flour-based and sugar. • ACCESS– weak (due to land issue, processing, post-harvest,
technology, limited market access -quality/safety – strict quarantine standards.• UTILIZATION – poor; due to increase consumption of high
fat, wheat-based and sugar resulting high NCD and associated risks
• Stability – highly vulnerable to natural disaster and CC
Weak Link
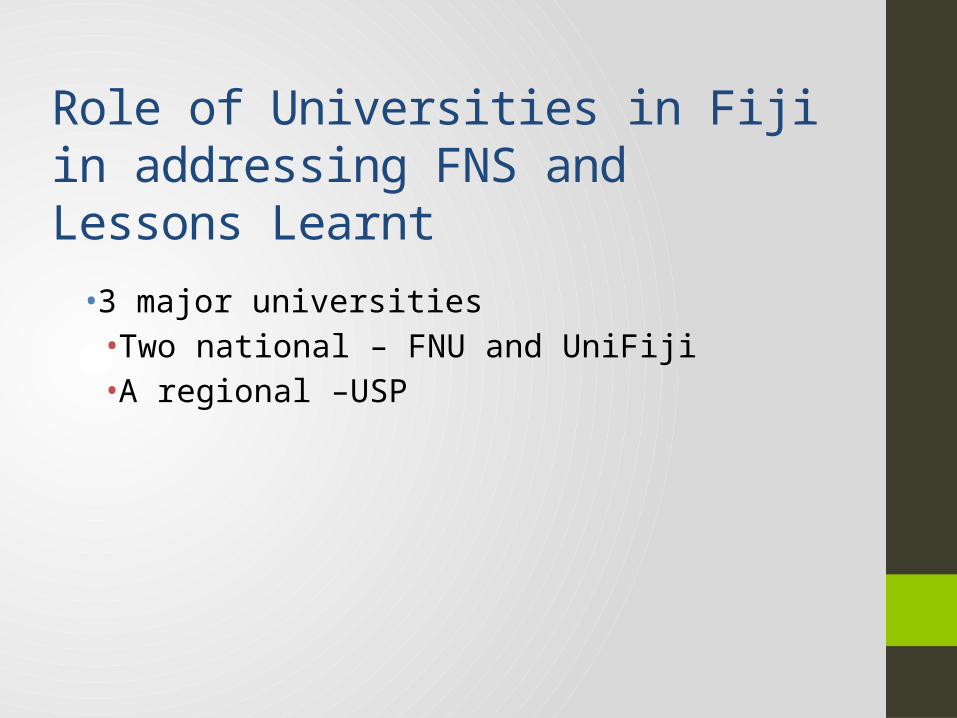
Role of Universities in Fiji in addressing FNS and Lessons Learnt
• 3 major universities• Two national – FNU and UniFiji• A regional –USP

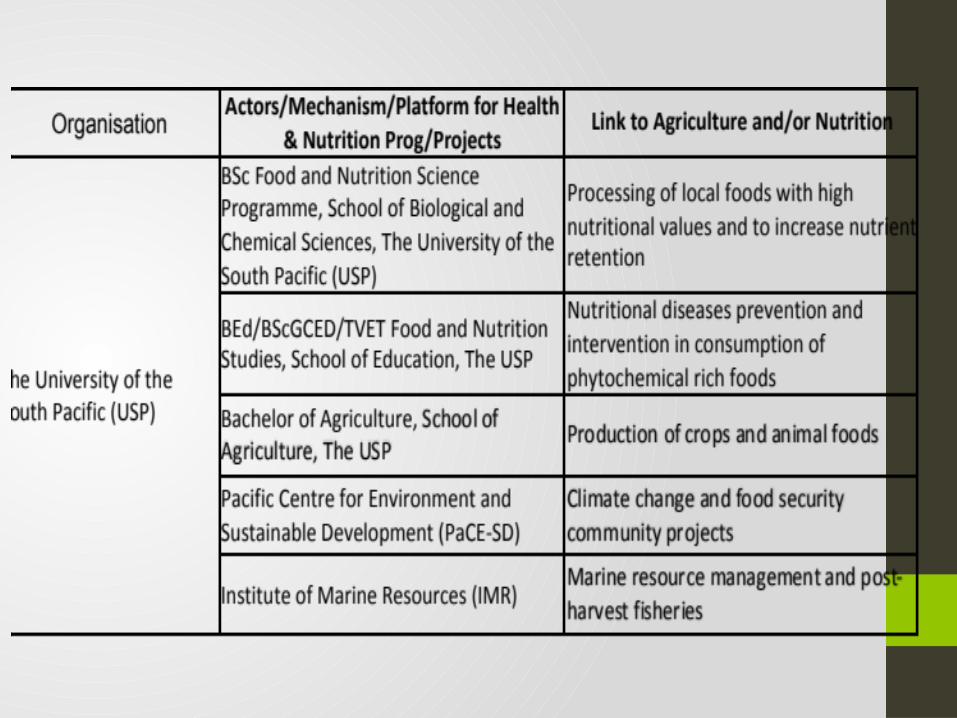
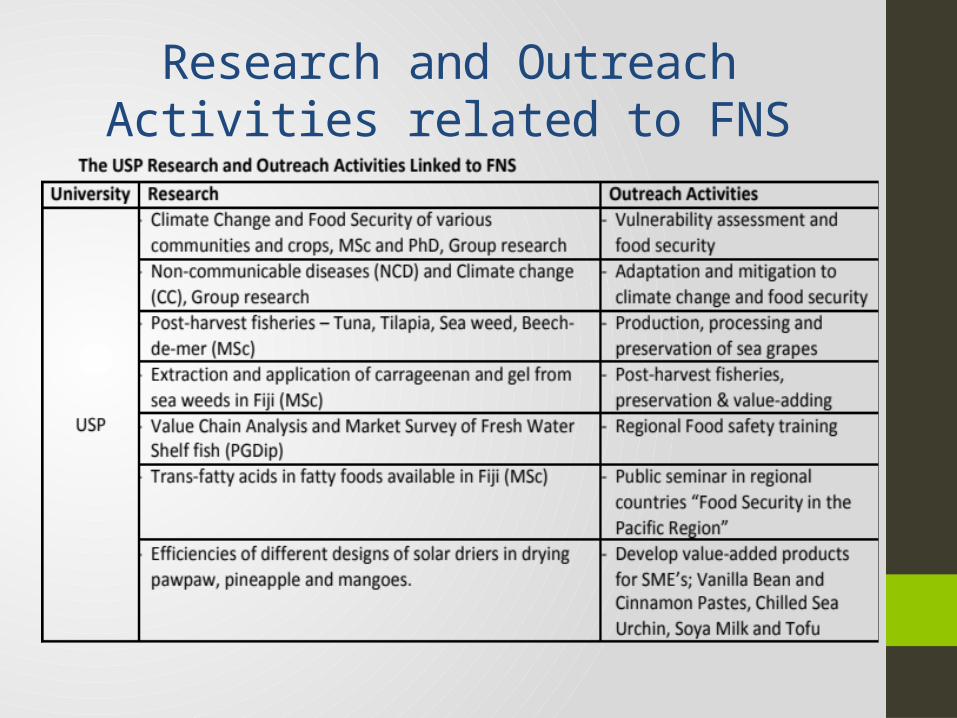
Research and Outreach Activities related to FNS

Lessons Learnt from Quick Scan
• Lots of policies with various approaches for FNS at regional and national level (Fiji), however limited alignment and a mismatch with what is happening at the three universities in the areas of teaching esp, research and outreach

OpportunityThere is a need for a systematic design and alignment in the curriculum and have compulsory (core) units from different disciplines to produce an integrated curriculum to address food security in all the 4 pillars.
The STAR (strategic total academic review) project did not address this deficiency in food security elements within the university.Instead SMT recommended removal of FNScience from science and in-coorporated with Agriculture prog
Microsoft Office User
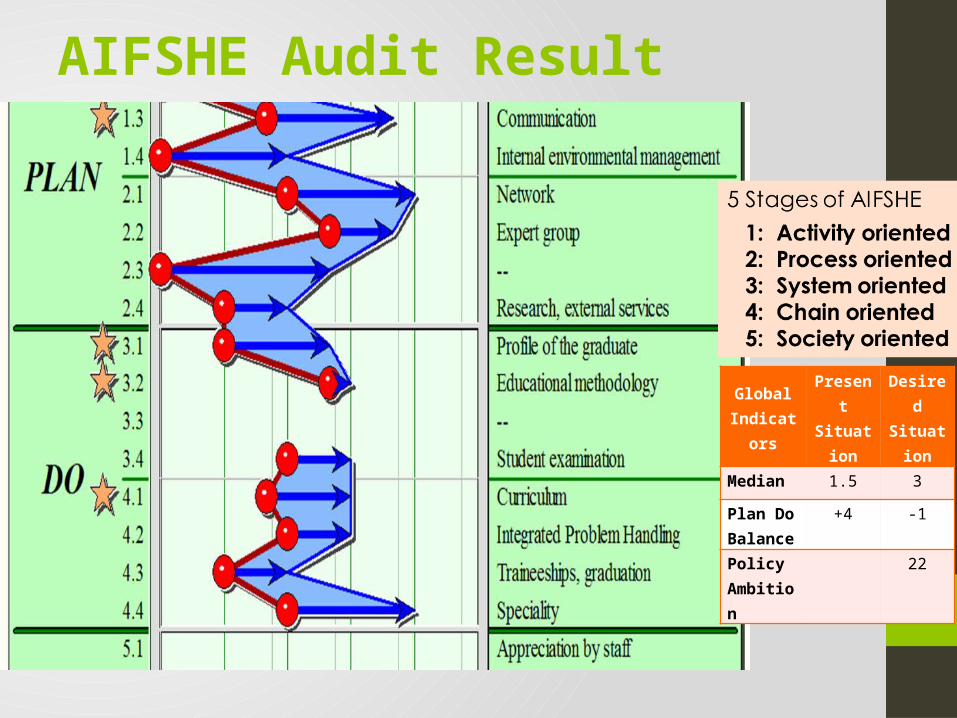
AIFSHE Audit Result
Global Indicators
Present Situatio
n
Desired Situatio
nMedian 1.5 3
Plan Do Balance
+4 -1
Policy Ambition
22
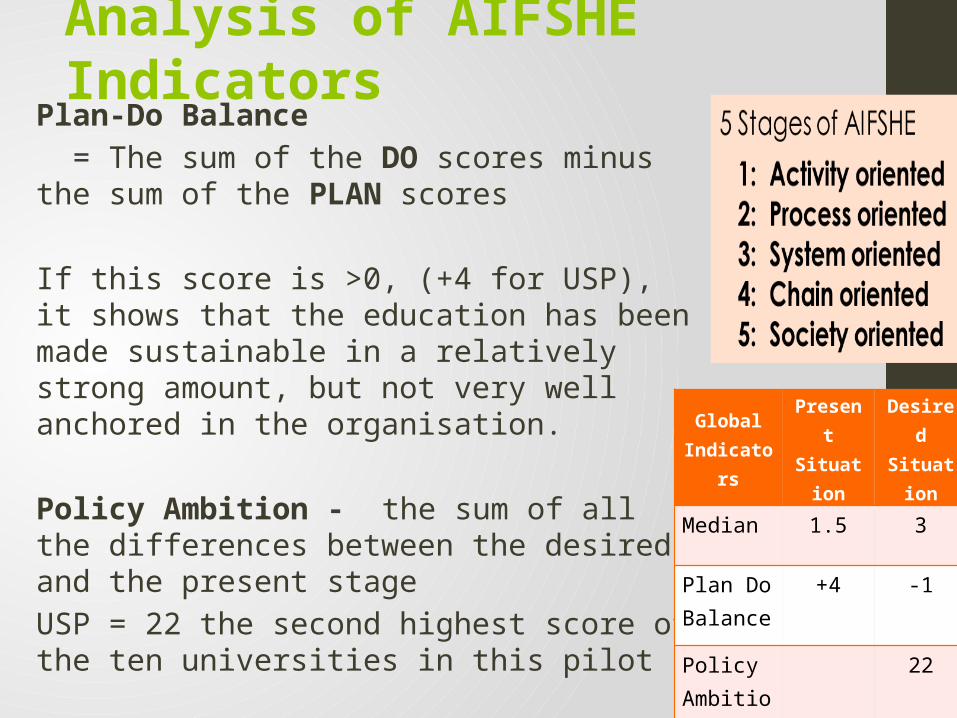
Plan-Do Balance = The sum of the DO scores minus the sum of the PLAN scores
If this score is >0, (+4 for USP), it shows that the education has been made sustainable in a relatively strong amount, but not very well anchored in the organisation.
Policy Ambition - the sum of all the differences between the desired and the present stageUSP = 22 the second highest score of the ten universities in this pilot
Analysis of AIFSHE Indicators
Global Indicators
Present Situation
Desired Situation
Median 1.5 3
Plan Do Balance
+4 -1
Policy Ambition
22

Major Lessons Learnt from AISHE AUDIT:
No policy on Food Security is explicitly defined, it’s only embedded in the “sustainable development” part of the
University’s vision. Thus
• Food security related areas (teaching, research and community outreach) at USP are too scattered and taught in assolation
• without proper alignment
• poor communication within departments
• no focal point/group to take the lead
• curriculum not aligned to address regional framework and national
policies (undergraduate)
• research and postgraduate difficult of poor undergraduate alignment
• Translations of learning outcomes and competencies for students are
limited

Lessons Learnt from National Workshops
Priority Areas
Current Expected Gaps
Curriculum Not addressing what the policy wants.
Address the needs of the policy (region).
Not aligned to meet the policy requirements.
Staffs
Facilities
Limited staffs More qualified staffs to teach specialized areas
Not enough qualified staffs in relevant areas
Scattered and limited.
More modern facilities to teach
Purchase and construct required facilities.
TeachingFood related teaching in different facilities
More cross communication among faculties
Isolated teaching
ResearchIndividual academic research
Conduct research relevant to the policy
No/limited consultations on priority areas.
National Seminar and Workshop: Current gaps in resources, curriculum, teaching and research to address priority and build
capacity.
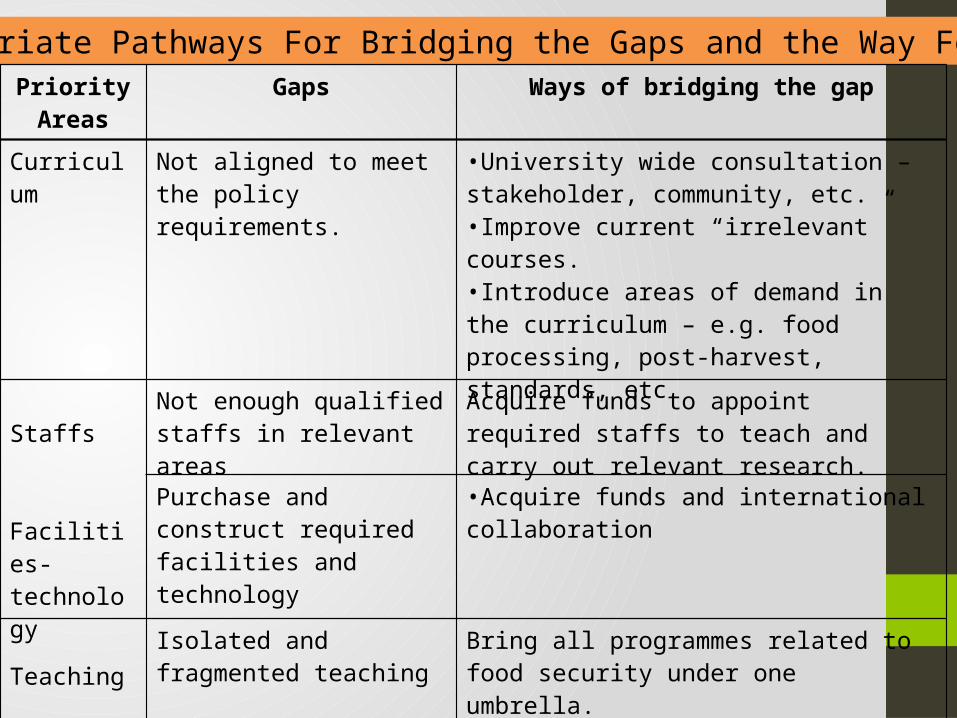
Appropriate Pathways For Bridging the Gaps and the Way ForwardPriority Areas
Gaps Ways of bridging the gap
Curriculum Not aligned to meet the policy requirements.
•University wide consultation – stakeholder, community, etc.•Improve current “irrelevant” courses.•Introduce areas of demand in the curriculum – e.g. food processing, post-harvest, standards, etc
Staffs
Facilities-technology
Not enough qualified staffs in relevant areas
Acquire funds to appoint required staffs to teach and carry out relevant research.
Purchase and construct required facilities and technology
•Acquire funds and international collaboration
Teaching
Isolated and fragmented teaching
Bring all programmes related to food security under one umbrella.
ResearchNo/limited consultations on priority areas.
Industrial/ Institution develop a range of relevant research areas and external services needed to address the priority areas.
Conclusion• There is some degree of food security observed in Fiji when
availability pillar is concerned due to adequate food supplies, however food insecurity also exists in relation to limited accessibility and utilization pillars of FNS which are reflected in the high importation and consumption of imported processed foods contributing to prevalence NCDs and associated risks.
• Higher education institutions play a pivotal role in ensuring that they provide relevant training needs that match the workforce required to improve FNS for its country.• through re-orientation of curriculum to match, align and address
policies and FNS gaps and the needs of the country.
• The three Universities in Fiji have a lot of opportunities to contribute to the improvement and realization of FNS in Fiji.