State Technology and Science Index - Milken Institute
59
State Technology and Science Index Enduring Lessons for the Intangible Economy by Ross DeVol and Anita Charuworn with Soojung Kim June 2008
Transcript of State Technology and Science Index - Milken Institute
State Technology
and Science Index
Enduring Lessons for the Intangible Economy
by Ross DeVol and Anita Charuwornwith Soojung Kim
June 2008
1250 Fourth StreetSanta Monica, CA 90401
Phone: 310.570.4600Fax: 310.570.4601E-mail: [email protected]

State Technology
and Science Index
Enduring Lessons for the Intangible Economy
June 2008
by Ross DeVol and Anita Charuwornwith Soojung Kim

Acknowledgments
This study was made possible in part through the generous support of Goodwin Procter. The views expressed in this report are solely those of the Milken Institute.
About the Milken Institute
The Milken Institute is an independent economic think tank whose mission is to improve the lives and economic conditions of diverse populations in the United States and around the world by helping business and public policy leaders identify and implement innovative ideas for creating broad-based prosperity. We put research to work with the goal of revitalizing regions and fi nding new ways to generate capital for people with original ideas.
By creating ways to spread the benefi ts of human, fi nancial, and social capital to as many people as possible—by democratizing capital—we hope to contribute to prosperity and freedom in all corners of the globe.
© 2008 Milken Institute

i
Milken InstituteState Technology and Science Index
Table of Contents
Executive Summary . . . . . . . . . . . . . . . . . . . . . . . . . . . . . . . . . . . . . . . . . . . . . . . . . . . . . . . . . . . . . . . . . . . . . . . 1
Introduction: Capitalizing on the Intangible Economy . . . . . . . . . . . . . . . . . . . . . . . . . . . . . . . . . . . . . . . 9
Outline of the Index . . . . . . . . . . . . . . . . . . . . . . . . . . . . . . . . . . . . . . . . . . . . . . . . . . . . . . . . . . . . . . . . . . . . . . 13
Research and Development Inputs
Background and Relevance . . . . . . . . . . . . . . . . . . . . . . . . . . . . . . . . . . . . . . . . . . . . . . . . . . . . . . . . 13
State Rankings . . . . . . . . . . . . . . . . . . . . . . . . . . . . . . . . . . . . . . . . . . . . . . . . . . . . . . . . . . . . . . . . . . . . 17
Risk Capital and Entrepreneurial Infrastructure
Background and Relevance . . . . . . . . . . . . . . . . . . . . . . . . . . . . . . . . . . . . . . . . . . . . . . . . . . . . . . . . 21
State Rankings . . . . . . . . . . . . . . . . . . . . . . . . . . . . . . . . . . . . . . . . . . . . . . . . . . . . . . . . . . . . . . . . . . . . 23
Human Capital Investment
Background and Relevance . . . . . . . . . . . . . . . . . . . . . . . . . . . . . . . . . . . . . . . . . . . . . . . . . . . . . . . . 27
State Rankings . . . . . . . . . . . . . . . . . . . . . . . . . . . . . . . . . . . . . . . . . . . . . . . . . . . . . . . . . . . . . . . . . . . . 30
Technology and Science Work Force
Background and Relevance . . . . . . . . . . . . . . . . . . . . . . . . . . . . . . . . . . . . . . . . . . . . . . . . . . . . . . . . 35
State Rankings . . . . . . . . . . . . . . . . . . . . . . . . . . . . . . . . . . . . . . . . . . . . . . . . . . . . . . . . . . . . . . . . . . . . 37
Technology Concentration and Dynamism
Background and Relevance . . . . . . . . . . . . . . . . . . . . . . . . . . . . . . . . . . . . . . . . . . . . . . . . . . . . . . . . 41
State Rankings . . . . . . . . . . . . . . . . . . . . . . . . . . . . . . . . . . . . . . . . . . . . . . . . . . . . . . . . . . . . . . . . . . . . 44
Overall Findings . . . . . . . . . . . . . . . . . . . . . . . . . . . . . . . . . . . . . . . . . . . . . . . . . . . . . . . . . . . . . . . . . . . . . . . . . 48
References . . . . . . . . . . . . . . . . . . . . . . . . . . . . . . . . . . . . . . . . . . . . . . . . . . . . . . . . . . . . . . . . . . . . . . . . . . . . . . 53
About the Authors . . . . . . . . . . . . . . . . . . . . . . . . . . . . . . . . . . . . . . . . . . . . . . . . . . . . . . . . . . . . . . . . . . . . . . . 57
1
Milken InstituteState Technology and Science Index
Executive Summary
The fi rst release of the State Technology and Science Index in 2002 spawned a growing recognition of the importance of intangibles in the economy. This updated 2008 edition builds upon the lessons learned and expands on the contributions of human capital formation and commercialization of intellectual property. We have examined a host of indicators to paint a comprehensive picture of how well states are performing in this highly competitive knowledge-based economy. Four years after releasing the previous State Technology and Science Index in 2004, we can evaluate how adept each state has been in dealing with the shifting nature of the intangible economy.
Massachusetts retains its 1st-place position in the 2008 • State Technology and Science Index with an overall score of 82.61. Its lead has diminished somewhat, but Massachusetts remains the gold standard for other states to consider when evaluating their own technology and science capabilities.
Closing in fast is 2nd-place Maryland, which moved up from 4th place in the 2004 index. Maryland ranks • 1st in the nation for Human Capital Investment and, unlike Massachusetts, places consistently in the top ten in all fi ve composite indices.
Colorado remains in 3rd place with an overall score of 78.32, less than two index points behind Maryland, • by posting consistent top-fi ve fi nishes in all of the composites.
California places 4th in the nation with an overall score of 74.62, slipping from its 2nd-place fi nish in 2004. • While it remains a national leader, the state shows signs of faltering.
Fifth-place Washington improves its overall ranking, moving up from 6th position, which it occupied in • the 2002 and 2004 editions of the index.
The rest of the top ten includes Virginia (6th), Connecticut (7th), Utah (8th), New Hampshire (9th, for an • improvement of three slots), and Rhode Island (10th).
North Dakota showed the strongest improvement, moving up fourteen positions. It was followed by • Hawaii (which rose by eleven positions), Alabama (up seven places), and Montana and South Dakota (which each improved by six positions).
The State Technology and Science Index takes inventory of the technology and science assets that can be leveraged to promote economic development in each state. It factors in 77 individual indicators that comprise fi ve equally weighted major composites. To achieve a score of 100 on any of the fi ve major composites, a state would have to rank fi rst in every one of the indicator components, a virtually impossible feat. Second place was assigned a score of 98, a 3rd-place ranking was assigned a score of 96, and so forth, all the way down to the 50th-place ranking, which garners a score of 2. The individual category scores are averaged (with the exception of industrial R&D spending, which received a higher weight) to derive each state’s score on a given composite index. Scores on all fi ve composites are then averaged together to calculate a state’s overall score. Each indicator is benchmarked to a relevant measure, such as population, Gross State Product, or number of establishments, in order to adjust for the absolute size of a state’s economy.

2
Milken InstituteState Technology and Science Index
Table 1. State Technology and Science Index
Overall rankings, 2008
StateRank 2008
Rank 2004
Rank change 2004 to 2008
Score 2008 State
Rank 2008
Rank 2004
Rank change 2004 to 2008
Score 2008
Massachusetts 1 1 0 82.61 Michigan 26 25 -1 52.27Maryland 2 4 2 80.04 Idaho 27 30 3 51.37Colorado 3 3 0 78.32 Hawaii 28 39 11 51.23California 4 2 -2 74.62 Alabama 29 36 7 49.99Washington 5 6 1 72.09 Missouri 30 31 1 49.62Virginia 6 5 -1 70.33 North Dakota 31 45 14 48.92Connecticut 7 10 3 70.18 Montana 32 38 6 48.15Utah 8 9 1 69.21 Indiana 33 29 -4 47.75New Hampshire 9 12 3 67.90 Nebraska 34 28 -6 47.52Rhode Island 10 11 1 66.69 Iowa 35 37 2 45.90Minnesota 11 8 -3 64.06 Ohio 36 24 -12 45.25New Jersey 12 7 -5 63.44 Florida 37 32 -5 43.76Pennsylvania 13 16 3 63.23 Oklahoma 38 35 -3 41.85Delaware 14 13 -1 62.30 Maine 39 33 -6 41.82New York 15 15 0 62.22 Tennessee 40 34 -6 40.32New Mexico 16 14 -2 61.86 South Dakota 41 47 6 39.64Arizona 17 17 0 61.34 South Carolina 42 44 2 39.12North Carolina 18 20 2 59.63 Wyoming 43 41 -2 38.38Vermont 19 22 3 58.78 Alaska 44 40 -4 37.68Texas 20 23 3 57.78 Nevada 45 43 -2 37.02Illinois 21 21 0 57.19 Louisiana 46 42 -4 35.58Wisconsin 22 27 5 57.12 Kentucky 47 48 1 34.67Oregon 23 19 -4 56.17 Arkansas 48 49 1 32.96Kansas 24 26 2 54.18 West Virginia 49 46 -3 30.49Georgia 25 18 -7 53.30 Mississippi 50 50 0 29.81
State average 53.71
We start our analysis by examining research and development, and innovation capacities—the new raw materials of technology-based economic development. The Research and Development Inputs Composite Index measures performance in this area by calculating the ability to attract various types of federal, industry, and academic funding. To be successful over the long haul, a state needs capable entrepreneurs and the risk capital to support the conversion of research into commercially viable technology products and services. Our Risk Capital
and Entrepreneurial Infrastructure Composite Index endeavors to capture these factors.
In a knowledge-based economy, human capital is vital to state prosperity. Today, concentrations of talent attract fi rms to states as opposed to industry agglomerations and fi rms being the principal attraction force for people. The third major composite, the Human Capital Investment Composite Index, attempts to measure the stock of human capital and the rate of investment (fl ow) between states by gauging the concentration and momentum of various science and engineering fi elds. A total of twenty indicators are included.
The technical and scientifi c work force of a state propels its technological sophistication, innovation, and economic growth—not only for technology fi rms, but for all fi rms where innovation is a key competitive advantage. Research spending may be the raw material of innovation, but without a qualifi ed technology and science work force, the conversion to a commercial application can’t take place. We have divided the Technology and Science Work
Force Composite Index into three distinct general fi elds: computer and information science, life and physical science, and engineering. In total, there are eighteen occupational categories (six in each of these fi elds).
The Technology Concentration and Dynamism Composite Index can be viewed as a measure of technology outcomes. By measuring technology growth we are able to assess the eff ectiveness of policy makers and other stakeholders in transforming each state’s assets into economic prosperity for its citizens.

3
Milken InstituteState Technology and Science Index
For the third edition in a row, Massachusetts claims the 1st-place position in the State Technology and Science Index. With an overall score of 82.61, Massachusetts has seen its lead shrink somewhat since the 2004 index. Contributing to this slight slip is an 11th-place fi nish in the Technology Concentration and Dynamism Composite Index (down from 3rd in 2004), a showing that was off set by 1st-place fi nishes in two other composite indices (Technology and Science Work Force and Research and Development Inputs). Nevertheless, Massachusetts continues to set the pace for other states in terms of technology and science capabilities.
The most dominant showing for Massachusetts comes in the Research and Development Inputs Composite Index, where it retains its 1st-place ranking with a score of 93.07. Most impressive, its score improved from an already-high level in 2004, marking the highest score recorded by any state on any of the fi ve composite measures. Matching its remarkable performance in the previous 2004 index, it ranks in the top fi ve in sixteen out of eighteen total R&D categories. Massachusetts is a hotbed of research; world-renowned research universities and cutting-edge fi rms fuel its economy. In another major index, its Technology and Science Work Force Composite score (91.06) refl ects a large and growing lead, with the state’s closest competitor trailing by more than four index points.
Closing in fast is 2nd-place Maryland, which moved up from 4th place in the 2004 index. Maryland ranks 1st in the nation for Human Capital Investment and, unlike Massachusetts, it places consistently in the top ten in all fi ve composite indices. Its substantial improvement since the 2004 index indicates that it will be a serious challenger in the future. Foreshadowing Maryland’s rise, the 2004 index predicted the state’s successful commercialization of its intangible assets, leveraged by its strengths in life sciences and communication technology. Maryland’s worst ranking in the 2004 composite indices, a 6th-place fi nish in Technology Concentration and Dynamism, improved to a 2nd-place fi nish in 2008. Alternative assistance, like the Sunny Day Fund, has attracted businesses into the state by providing a more stable creative work force, while new projects like Maryland’s Nanocenter have linked research facilities with industry know-how to promote cutting-edge product development.
Colorado remains in 3rd place with an overall score of 78.32, less than two index points behind Maryland, by posting consistent top-fi ve fi nishes in all of the composites. Its strongest areas are Technology and Science Work Force and Human Capital Investment, where the state ranks 2nd and 3rd, respectively. The state’s Offi ce of Economic Development and International Trade (OEDIT) has provided outreach in the form of technical as well as fi nancial assistance. Governor Bill Ritter recently unveiled a $3.5 million technology-based economic development (TBED) program that provides state grants to attract energy businesses. The state also continues to refi ne job-creation initiatives that give businesses incentives to create high-paying positions.
California places 4th in the nation with an overall score of 74.62, slipping from 2nd place in the 2004 index. While it remains a national leader, the state is faltering. Once only 5.5 points behind 1st-place Massachusetts in the 2004 index, it has fallen 8.0 points behind in the overall results in 2008, largely because it plummeted to 13th position in the Human Capital Investment Composite Index. But California still has a major advantage: the nation’s preeminent entrepreneurial ecosystem. The state scores 81.27 on the Risk Capital and Entrepreneurial Infrastructure Composite Index, landing squarely in 1st place. California clearly excels in venture capital investment in general and in the two cutting-edge fi elds of nanotechnology and clean technology, new indicators included in the index for the fi rst time this year. California entrepreneurs and venture capitalists provide the necessary social and fi nancial capital to turn research into inventions and innovations that lead to new fi rm formation. This environment is always capable of producing the next Intel, Sun Microsystems, Cisco, Amgen, Qualcomm, or Google.
Fifth-place Washington improves its overall ranking, moving up from the 6th-place position it held in the 2002 and 2004 editions of the index. Led by growing numbers of patents and small business incubators, Washington continues to foster viable research and business creativity. It is among the premier states for the concentration of technology and science workers, especially engineers and computer and IS experts. Boeing and Microsoft

4
Milken InstituteState Technology and Science Index
make important contributions to the state’s depth of technical talent. Only Massachusetts and California surpass Washington for venture capital placements as a percentage of Gross State Product.
Virginia, coming in 6th overall (a fall of one position since the 2004 index), records its best performance in the Technology Concentration and Dynamism Composite Index (where the state fi nishes 3rd). It achieves 2nd-place fi nishes in the components for percentage of high-tech establishment births and percentage of establishments in high-tech industries. Virginia, with a number of high-tech government contractors, ranks 5th in the Technology and Science Work Force Composite Index. The state has been actively seeking to bolster its future technical work force, enlisting the Virginia Biotechnology Association and the Virginia Manufacturing Association to lead a statewide eff ort to recruit, train, and certify skilled manufacturing technicians.
Connecticut, at 7th place, moved up from 10th place in the 2004 index. It is now running virtually neck and neck with Virginia. Connecticut scores particularly well in the Human Capital Investment Composite Index, notably in its high percentage of doctoral degrees relative to the population as well as improvements in its home computer and Internet access indicators. The state continues to demonstrate its readiness to embrace the elements of a creative economy. As Governor Jodi Rell noted in her 2008 State of the State address, “The creation of jobs is always one of our top priorities. And at a time like this … it’s more important than ever that we focus on economic development.” Recommendations for millions in capital funds to support nanotechnology and assist small businesses that “are responsible for creating the vast majority of new and replacement jobs” are likely to keep the state in good standing.1
Ranking 8th overall, Utah places 1st in Technology Concentration and Dynamism, a strong jump from its 7th-place showing in this composite index in 2004. Not only does Utah fi nish in the top ten in most of the individual Technology Concentration and Dynamism indicators, but it places 1st in net formation of high-tech establishments. Its overall score of 85.40 in this composite outpaces 2nd-place Maryland by fi ve index points. Utah has fostered a culture of entrepreneurship by opening a series of business incubators. The newest, a $10.7 million facility in Brigham City, provides start-up companies with subsidized rent, technical classes, conferences, and a host of business resources.
New Hampshire breaks into the top ten overall, moving up from 12th to 9th place. The state is boosted by its performance in the Research and Development Inputs Composite Index, where it places 5th. New Hampshire ranks 2nd in the nation for phase II Small Business Innovation Research awards per 10,000 business establishments and places in the top fi ve for academic R&D dollars per capita. New Hampshire’s enhanced prowess in the technology and science commercialization area is highlighted by its 5th-place fi nish in the percentage of establishments in high-tech industries.
Rhode Island rounds up the top ten, improving one position from 2004, with its best showing also coming in the Research and Development Composite Index (where it takes 6th place). Rhode Island’s highest rank is in competitive National Science Foundation proposal funding rate, where it places 1st, but it is also a top-fi ve fi nisher in many of the other indicators in the R&D composite.
When analyzing the overall results, North Dakota emerges with the most dramatic improvement, moving up an impressive fourteen positions from 45th in the 2002 and 2004 editions of State Technology and Science Index to take 31st place in 2008. The state jumped twenty-one places in the Research and Development Inputs Composite Index. Its meteoric rise was driven by advancements in STTR awards; R&D expenditures in biomedical, physical sciences, and engineering; and improvements in industry R&D. North Dakota’s strong momentum stems from the
1. http://www.ct.gov/governorrell/site/default.asp (Accessed May 16, 2008).

5
Milken InstituteState Technology and Science Index
state government’s commitment to develop “Centers of Excellence.” Unveiled in 2004, this plan earmarks a portion of the state budget to matching funds for universities and colleges that develop Centers of Excellence that foster regional development in science and technology.
North Dakota has also been addressing the issue of brain drain by off ering tuition reimbursements of up to $5,000 for students in technology and teaching fi elds who choose to work in-state after graduating from local universities. Another program, Operation: Intern, North Dakota’s Future at Work, seeks to match college students with local employers in order to cement relationships and prevent talent loss.
Hawaii also posted a remarkable rise, climbing eleven spots to rank 28th overall in the 2008 index. The state has focused on attracting small businesses, especially targeting clean energy and life sciences. While part of the strategy is geared toward cultivating strong science education at the pre-college level, the state has also established $5 million in R&D funding for small businesses in particular science and engineering fi elds to commercialize defense-related dual-use technology. Recent legislation also seeks to put Hawaii on the map as a leader in bioenergy and other energy-effi cient technologies.
Alabama has risen seven positions, from 36th in 2004 to 29th in 2008. The state’s best performance is in the indicator for the number of high-tech industries growing faster than the U.S. average. Montana and South Dakota have each improved by six positions in 2008. South Dakota places 1st in the nation for venture capital in clean technology while Montana shows gains in all types of R&D funding sources (academic, industry, and federal).
Turning our attention to the opposite end of the spectrum, Mississippi ranks 50th in the overall 2008 index with a score of only 29.81, marking the second time it has held this dubious distinction. In a move that might improve upon its poor showing (49th position) in Risk Capital and Entrepreneurial Infrastructure, Mississippi has rolled out funds (in House Bill 1724) administrated by the Mississippi Technology Alliance (MTA) to draw attention from venture capitalists. West Virginia slid from 46th place in the 2004 index to 49th place in 2008. In order to retain more of its talented human capital, the state has instituted Bucks for Brains, a research endowment that would help institutions like West Virginia University and Marshall University entice top-level researchers with equipment and laboratories. Arkansas climbed one spot up to 48th, with an improved performance in the Risk Capital and Entrepreneurial Infrastructure Composite Index (in which it rose from 42nd place in 2004 to 31st place in the 2008 release).
Kentucky has achieved a modest improvement of one spot to take 47th place overall in 2008, placing 2nd in the nation for growth in the number of companies receiving VC investment. Louisiana fell from 42nd place overall in 2004 to 46th, coming in last in the nation for technology concentration. Forty-fi fth-ranked Nevada is part of a coalition of seventeen states that will expand broadband access to rural counties under a $267 million USDA loan package. Alaska has fallen from 40th in the 2004 index down to 44th place overall in 2008. Wyoming takes the 43rd spot in 2008, falling two notches, while South Carolina is moving in the opposite direction, coming in at 42nd to improve by two positions. Rounding out the bottom ten at number 41 overall, South Dakota has announced plans to restructure its existing programs for supporting entrepreneurs by targeting not just new fi rms but also existing businesses.

6
Milken InstituteState Technology and Science Index
Figure 1. State Technology and Science Index Map
2008
Conclusions
Overall, the clear trend in the 2008 State Technology and Science Index is the concentration of state scores near the mean, which refl ects increased competition for funding and capital. The statistics reveal a shortened range, with lower variance between the best- and worst-performing states than in previous years. After the manufacturing and dot-com slowdowns early in this decade, states began to reassess which industries could create sustainable economic growth in a global marketplace. Some states hit by the slump have instituted new direction and policies. We are starting to see the culmination of the synergies they have created, and expect the competition between states to intensify as technology makes jobs ever more portable.
Increasingly, the main threats to any state’s position in the intangible economy emanate from abroad—particularly from China, India, Singapore, and other developing countries in Asia. The Scandinavian countries are also rivals in particular high-tech fi elds. The nation as a whole faces the possibility of losing human capital overseas. Many expatriates are returning to their native countries, drawn by expanded business opportunities at home.
A new challenge that must be addressed is the falloff in international graduate student enrollment at U.S. universities, especially in the physical and life sciences, computer sciences, and engineering. This was an unintended consequence of post-9/11 restrictions on student visas that were instituted in the name of national security. Other leading universities around the world are successfully competing for top talent, recognizing that this situation presents them with an opportunity to attract the most gifted students. The overseas brain drain will force states to more eff ectively utilize their existing assets and compete to draw both human and fi nancial capital from other states.
Top TenSecond TierThird TierBottom Ten

7
Milken InstituteState Technology and Science Index
This challenge becomes even more complex in the face of diminishing federal and private funds to help foster growing businesses. States that simply rely on historical advantages, such as pre-existing agglomerations of research and technology industries, are taking a huge gamble, since other countries and regions are making huge investments in technology and science. The competition is fi erce—and it will surely continue to intensify as the national economy enters a challenging period.

9
Milken InstituteState Technology and Science Index
Introduction: Capitalizing on the Intangible Economy
The Milken Institute’s fi rst release of the State Technology and Science Index in 2002 spawned a growing recognition of the importance of intangibles in the economy. This updated 2008 edition builds upon the lessons learned and expands on the contributions of human capital formation and commercialization.
This latest release brings into sharp focus a critical issue facing the United States: The nation as a whole is on the cusp of losing vast amounts of intellectual capital overseas, even as manufacturing jobs continue to dwindle. The overseas brain drain will force states to more eff ectively utilize their existing assets and increase the competition to draw both human and fi nancial capital from other states. This challenge becomes even more complex in the face of diminishing federal and private funds to help foster growing businesses.
Four years after the Milken Institute released the previous State Technology and Science Index in 2004, we can evaluate how changing priorities for spending and investment have altered the landscape. State scores reveal just how adept each region has been in dealing with the shifting nature of the intangible economy.
The fi rst state to stand out in terms of improvement is North Dakota. Rising fourteen spots since the last index to take 31st place, North Dakota has implemented some remarkable policy changes. Although the state’s overall population is shrinking, its urban centers have grown considerably.2 This retention has led to the state’s rapid rise in the index. North Dakota once routinely lost bright students to out-of-state universities, particularly in Colorado and on the West Coast, but because of rising educational costs in those areas, North Dakota has benefi ted by keeping more of its young talent. The state consistently scores in the top percentile for elementary and middle school math and science profi ciency (measured in the fourth and eighth grades). Although salaries for public teachers are relatively low, the state has implemented the most rapid acceleration of pay in the nation, with teachers’ salaries rising more than 22 percent from 2000 to 2005.3 The state has also found its niche outside education as well, capitalizing on its comparative advantage in agriculture.
North Dakota led the nation in Department of Energy program budgets in 2006 at $923,000.4 This investment has led to the development of biodiesel and other cellulosic technology, representing a fascinating new lead in the search for clean energy. In addition to investments in clean technology, the state has a bounty of cleaner coal and wind supply that could potentially be tapped more fully. In the future, North Dakota could provide nearly 36 percent of the electricity needs in the Lower 48 states through harnessing wind power alone.5 The state recently passed $1.6 billion in tax credits to fund clean coal projects as well as loan guarantees for industrial gasifi cation technology at lignite-burning facilities. This has encouraged many green fi rms (like Headwaters Incorporated) that specialize in integrated gasifi cation combined cycle (IGCC) to set up operations in the state.
Hawaii has also risen by double digits in the overall rankings. This gain has largely been realized by attracting human capital. The appeal of the state’s natural beauty and its relaxed lifestyle will only magnify in the near future as baby boomers, the most educated work force in U.S. history, enter semi-retirement and choose locations that combine an appealing lifestyle with the ability to stay in contact with high-tech work opportunities. In addition to luring a domestic human capital infl ow, Hawaii has been able to attract foreign human capital. The average
2. U.S. Department of Agriculture, Economic Research Service, “State Fact Sheets: North Dakota,” http://www.ers.usda.gov/Statefacts/ND.htm. (Accessed April 2, 2008).
3. “Science and Engineering Indicators–2008,” ed. National Science Board (National Science Foundation, 2008).
4. Ibid.
5. “Investing in North Dakota’s Energy Sector,” http://www.pomeroy.house.gov/index.asp?Type=B_BASIC&SEC=%7B3C8AA257-2D7D-4948-A0D2-25AFBE6779D3%7D. (Accessed February 2, 2008).
10
Milken InstituteState Technology and Science Index
educational attainment from immigrants settling in the state, an indicator of knowledge workers, is ranked the highest in the nation at 14.6 years of education.6 This is important because many foreign-born entrepreneurs are actively involved in high-tech start-ups and have the potential to draw foreign investment, bolstering state coff ers. In the 2008 index, this trend is represented by venture-capital investments in general as well as investments in clean technology and nanotechnology.
Hawaii’s ability to attract high-quality human capital and fi nancing has translated to a rapid rise of eleven spots in the overall rankings, to 28th place. The state scores particularly well in indicators for higher education like state appropriations rankings and advanced degree holders, as a percentage of the total population. This is due to Hawaii’s focus on raising R&D expenditures in the hard sciences and its legacy of attracting National Science Foundation funding for its innovative programs. These eff orts have naturally led to a concentration and development of high-tech industries within the state as compared to the nation as a whole.
When comparing performance in the 2004 and 2008 editions of the State Technology and Science Index, the most troubling picture emerges in Ohio, which tumbled twelve spots down to 36th place overall. The cause for this slippage is complex and extensive. Ohio has long been a hub of traditional manufacturing and industry, but as those jobs continue to disappear, a new approach is needed. By comparison, Michigan has also suff ered serious manufacturing losses due to job cuts by the “Big Three” automakers, but it has been buoyed by the presence of relatively more educated workers who were better able to transition to other jobs through retraining programs. Ohio will need to continue to shift its focus away from assembly-line work to the creation of high-skill, value-added niche products in order to successfully compete in new knowledge economy.
When examining results for Ohio and Michigan in particular, it is important to note that a change in the methodology used to compile the index has aff ected scoring for high-tech indicators. The Milken Institute has adopted its own 25 high-tech industries defi nition in place of the BLS’s more general 31 industries defi nition, which was used to calculate previous indices.7 Heavy manufacturing, such as automotive, is no longer represented; the focus is now on fi rms in communications and biotech.
Ohio also serves to illustrate the impact of the wider business environment on the ability to attract and nurture new high-tech fi rms. The battle over the state’s electricity regulation has proven to be a costly drag on the economy, as companies choose to base themselves in more friendly states. This uncertainty has deterred international investment at a moment when Ohioans need jobs. Without knowing how to plan for the future electricity costs of running plants in Ohio, companies such as Steel Development8 will turn to states with defi ned electricity rates—a large component of operating costs for most fi rms. Businesses are reluctant to base themselves in a state with instability if they are being courted by other locations off ering more attractive packages. This is just a symptom of the trying times Ohio has faced and one example of the actions needed to lift the state out of its downward spiral of job losses.9
However, there are glimmers of hope. Upcoming advanced technologies championed by Ohio’s Third Frontier Project are slowly coming to fruition. Established in 2002, the Third Frontier Project aims to speed Ohio’s transition to a research and innovation economy. One of its strategies is to connect companies and academics in order to create high-tech jobs and economic progress. One such collaboration is being realized in the polymer and
6. Robert D. Atkinson and Daniel K. Correa, “The 2007 State New Economy Index: Benchmarking Economic Transformation in the States,” http://www.nga.org/Files/pdf/0702INNOVATIONNEWECONOMY.PDF. (Accessed March 14, 2008).
7. “Technical Note: Defi ning High-Technology Industries,” http://www.nsf.gov/statistics/seind06/c8/c8.cfm?opt=9. (Accessed April 2, 2008).
8. Paul Wilson and Jim Siegel, “Steel Mill No Longer Considering Ohio,” Columbus Dispatch, February 22, 2008.
9. Jon Chavez, “Tackling Ohio’s Electric Rates,” Toledo Blade, June 17, 2007.
11
Milken InstituteState Technology and Science Index
advanced materials industry.10 Akron Polymer Systems Inc. (APS) is a success story involving teamwork between academia, government, and industry. Its proximity to academic institutions and a skilled manufacturing work force has enhanced APS’s ability to push products out quickly—a defi nite asset. This example showcases the type of collaboration that could potentially thrive in Ohio and lift the state’s prospects.
Overall, the clear trend in the most recent State Technology and Science Index is the concentration of state scores, which refl ects increased competition for funding and capital. The statistics reveal a shortened range, with lower variance between the best- and worst-performing states than in previous years. Mid-ranking states like North Dakota and Hawaii have begun to close in on the top performers. After the manufacturing and dot-com slowdowns early in this decade, states began to reassess which industries could create sustainable economic growth in a global marketplace. Some states hit by the slump have instituted new direction and policies. We are starting to see the culmination of the synergies they have created, and in the near future we expect to see competition between states intensify as technology makes jobs ever more portable.
Dynamic change is a hallmark of an intangible economy. Understanding the creative economy is not just about ramping up on human capital alone. States must also make a long-term commitment to cultivating creative drive, manufacturing know-how, and supporting infrastructure. Acquiring these traits will ultimately distinguish any given state from competing regions throughout the world. Transaction costs are relatively low in this new high-tech environment, so each state must capitalize on its comparative advantages in order to harness the potential of the intangible economy to the benefi t of its citizens.
California has not dealt with the changing environment quite as deftly when measured by short-term outcomes. In particular, the Golden State took a tumble in the technology concentration and dynamism component, which indicates the relative health of high-tech industries. Although the technology sector suff ered setbacks across the nation in the early part of this decade, California was particularly hard hit. This negative performance has been refl ected in many of the technology concentration measures: most dramatically in the state’s net formation of high-tech establishments as well as in the average yearly growth of high-tech fi rms. In both of these categories, California ranks in the bottom ten—the state’s fi rst appearance near the bottom of the standings.
In an eff ort to address faltering educational scores, Governor Schwarzenegger established a Strategic Growth Plan in 2006 to encourage human capital development. Improving K-12 education cultivates human capital in the long run, but talent also chooses jobs and location according to amenities such as the quality of public schools for their children—education has both direct and indirect eff ects on the state’s ability to attract scientists and engineers. The Strategic Growth Plan recognized the dynamic relationship between economic growth and infrastructure such as schools and housing; voters strongly endorsed this forward-looking strategy and approved $49.7 billion for the plan. But in 2008, with its economic woes deepening, California fi nds itself face-to-face with a serious budget defi cit and the prospect of major cuts in education. It remains to be seen whether the state can navigate this budget crisis without damaging its long-term goals for educating and training the knowledge workers of the future.
According to the governor’s 2008 State of the State address, California currently faces a shortfall of engineers that will reach 40,000 by 2014. The Career Technical Education (CTE) funding, part of the Strategic Growth Plan (SGP), would help to facilitate participation in the high-skill technical jobs that will drive California’s economy in the future. Proposed funding of $7.3 billion from Proposition 1D, approved by voters in November 2006, along
10. Reuters, “Ohio Leads the Way for Start-up Business Success in the Polymer Industry,” January 8, 2008.
12
Milken InstituteState Technology and Science Index
with SGP’s general-obligation bonds, would provide 39,000 new classrooms and renovate existing structures with state-of-the-art facilities for more than 1.5 million more students.11
One advantage enjoyed by California is that its state government is one of the largest potential purchasers of technology in the world, with an annual budget of several billion dollars. The eff ort to make state government more effi cient, accessible, and accountable through information technology is another driver that promotes local companies specializing in technology solutions. The ability of fi rms to give back directly to the regional economy in the form of Gross State Product (GSP) and employment is a strong selling point that gives California fi rms an edge over their out-of-state competitors.12
As noted in previous editions of the State Technology and Science Index, leading states are not immune to economic deterioration. Although intangibles like patents, copyrights, customer relationships, brand value, unique institutional designs, the value of future products and services, and structural capital (corporate culture, systems, and processes) are important, they are only part of the equation. In order to meet the new challenges, states must have the infrastructure to capitalize upon and commercialize these intangibles. That is the new reality in a landscape where the status quo quickly becomes outdated. States must stay on the cutting edge in order to stay in the game.
This conviction led the Milken Institute to create the State Technology and Science Index. It provides a benchmark for states to monitor their progress, off ering a set of interrelated but distinct measures and indicators that take inventory of the technology and science assets that defi ne intangible economies. Specifi cally, the index is composed of fi ve major and equally weighted composites: Research and Development Inputs, Risk Capital and Entrepreneurial Infrastructure, Human Capital Investment, Technology and Science Work Force, and Technology Concentration and Dynamism. These fi ve composites are comprised of 77 individual components, which are listed in full in the Appendix. Each of the components is measured on a relative basis to a relevant indicator (population, Gross State Product, number of establishments, number of businesses). The data is collected from a number of governmental agencies, foundations, and private sources, then compiled, calibrated, and analyzed by the Milken Institute.
It is imperative for states to view their competition beyond their immediate geographic borders, and understand that the playing fi eld is now global. Their ability to capitalize on intangible assets and use their comparative advantages to package and sell these assets is the key to thriving in a new era of intense global competition. States can access the measurements in this index to analyze their relative performance in an intangible economy.
Intangible economies are not infallible. Even in knowledge-based sectors, it is ultimately unsustainable to over-invest, misallocate resources, build excess capacity, and make poor strategic decisions. The technology sector’s slump in the wake of the dot-com bubble reminds us of this persistent fact of economic existence. Yet a periodic downturn in the technology sector by no means implies that the sector has declined in signifi cance. Indeed, the way in which national and state economies have become more tightly bound to variances in the tech industry underscores the rising importance of such knowledge-based sectors.
The marketplace has become truly global and hyper-competitive. In facing this new reality, each state must decide how to capitalize on its unique location, intellectual capital, and regional assets in order to sustain entrepreneurial activity in science and technology, the economic lifeblood of the future.
11. “The California Strategic Growth Plan: Governor’s Budget Summary 2008–2009,” http://www.ebudget.ca.gov/pdf/BudgetSummary/TheCaliforniaStrategicGrowthPlan.pdf.
12. Advancing the Business of Technology, www.aeanet.org. (Accessed March 27, 2008).
13
Milken InstituteState Technology and Science Index
Outline of the Index
In the pages that follow, we will rank states in fi ve composite indices: Research and Development Inputs, Risk Capital and Entrepreneurial Infrastructure, Human Capital Investment, Technology and Science Work Force, and Technology Concentration and Dynamism. These composites are based on multiple indicators, which are listed in full in the Appendix. Much of the analysis is based upon comparing and contrasting leading states to those lagging in concentrations of technology, science and related economic assets.
Even with the focus on top performers, however, all states can benefi t from the information generated by the index. For those states not specifi cally mentioned in the text, indicator data on all states is available for downloading from the Institute’s web site at www.milkeninstitute.org.
A companion report, California’s Position in Technology and Science: A Comparative Benchmarking Assessment, off ers a detailed analysis of California’s position relative to other states.
With this index, we look at the likelihood of future economic development and sustainability. While it is important to constantly innovate, should fi rms practice horizontal or vertical integration? Big fi rms may become unwieldy and stagnate under the weight of corporate bureaucracy; however, smaller fi rms may not have the capital to successfully commercialize a product nor to protect themselves from global competitors.
We start by examining the research and development capabilities that can be commercialized for future state and regional technology growth. The entrepreneurial capacity and risk capital infrastructure of states are the ingredients that determine the success rate of converting research into commercially viable technology services and products. Human capital is the most important intangible asset of a regional or state economy. The intensity of the technology and science work force indicates whether states have suffi cient depth of high-end technical talent on the ground. (“Intensity” is derived by fi nding the percent share of employment for a particular fi eld relative to total state employment; it refl ects whether potential human capital plus R&D and fi nancial capital is actually being transformed into a thriving economy.) Technology concentration and dynamism can be viewed as a measure of technology outcomes. By measuring technology growth, we are able to assess the eff ectiveness of policy makers and other stakeholders in transforming regional assets into regional prosperity.
Research and Development Inputs
Background and Relevance
For any state, the new raw materials of technology-based economic development are its research, development, and innovation capacities. The Research and Development Inputs Composite Index measures each state’s performance in this area by calculating multiple components, including the ability to attract various types of federal, industry, and academic funding.
Research and development (R&D) infrastructure is critical to building new industry clusters from breakthrough technologies or sustaining the vibrancy of existing industry clusters. A new cluster can be formed by importing fi rms that have commercialized technology elsewhere, but those regions in which basic research and development activities take place have distinct advantages in building clusters that “stick.”13
13. Malcolm Gladwell, The Tipping Point: How Little Things Can Make a Big Diff erence (Boston: Back Bay Books, 2000).
14
Milken InstituteState Technology and Science Index
Its ongoing support for high-quality research and development puts the United States in a unique position at present. U.S. research and development expenditures exceed the combined total of the remaining G-7 countries (Japan, Germany, France, the United Kingdom, Canada, and Italy). More important, however, the United States excels in converting its research prowess into economic value, achieving a high rate of commercialization success.14
Commercialization is one of the keys to understanding the intangible economy. The United States has successfully produced commercially viable products and services by empowering research universities, hospitals, and government entities with technology-transfer offi ces that promote innovation. The federal government has supported this technology transfer by allowing for cooperative agreements with private industry. Legislation in turn has been important in continuing that leadership into academic institutions. The Bayh-Dole Act further established a strong national technology-licensing infrastructure that drives universities to continue pursuing critical developments in high-tech fi elds.15 Many might argue that commercialization has driven the type of degrees now sought by students. Higher education has been more recently exposed to direct workplace involvement.16 Since 1980, more than 3,800 companies have formed out of university licenses. It is clear that entrepreneurship is widespread in the United States, as roughly 6 percent of all adults are involved in starting new fi rms.17
U.S. stature in R&D relies on the depth and breadth of the nation’s regional innovation infrastructure. Knowledge and discovery derived from basic research can be applied to innovation and converted into economic value more eff ectively at the same location where it was developed. Regional innovation capacity stems from the strength of the region’s basic innovation infrastructure, specifi c conditions supporting innovation in a cluster, and degrees of interaction between the two.18
Private research laboratories, federal research laboratories, and university-based research and development are all important drivers of economic development if properly channeled and harnessed. R&D investments and policies are an integral component of economic development in successful regions and states. In fact, recent empirical studies have pointed to the contribution of knowledge spillovers from higher education institutions to decisions on where to locate start-ups, especially for technology-intensive fi rms.19 All economic development activities benefi t from well-designed and executed programs to expand the research and development assets.20 Investments in R&D strengthen the research competencies in a region and attract further investments by the private and public sectors in a series of dynamic feedback loops.
Long-run economic growth is highly dependent on funding and performing R&D activities. Harvard University competitiveness guru Michael Porter states it bluntly: “In the long run, the eroding base for innovation is the real challenge and the abiding constraint on our standard of living.”21
14. “Science and Engineering Indicators–2002,” ed. National Science Board (National Science Foundation, 2002).
15. Ross DeVol et al., Mind to Market: A Global Analysis of University Biotechnology Transfer and Commercialization (Milken Institute, 2006).
16. Derek Bok, Universities in the Marketplace: The Commercialization of Higher Education (Princeton University Press, 2004), and Jerry G. Thursby and Marie C. Thursby, “Who Is Selling the Ivory Tower? Sources of Growth in University Licensing,” Management Science 48, no. 1 (2002).
17. Magnus Karlsson, “Commercialization of Research Results in the United States: An Overview of Federal and Academic Technology Transfer” (Swedish Institute for Growth Policy Studies [ITPS], 2004).
18. Michael Porter and Scott Stern, “The New Challenge to America’s Prosperity: Findings from the Innovation Index” (Council on Competitiveness, 1999).
19. Dirk Engel and Andreas Fier, “Does R&D-Infrastructure Attract High-Tech Start-Ups?,” ZEW Discussion Paper 00-30 (2000).
20. Stuart Rosenfeld, “A Governor’s Guide to Cluster-Based Economic Development” (National Governors Association, 2002).
21. Michael Porter, On Competition (Boston: Harvard Business Review Book Series, 1998).

15
Milken InstituteState Technology and Science Index
The biggest category of R&D expenditures is industry-performed research and development. Industry funds and conducts more R&D than all other sectors combined. Industry R&D expenditures rose briskly in the second half of the 1990s, reached 70 percent of all U.S.-funded R&D in 2000, and currently stand at close to 77 percent, according to NSF 2004 fi gures.22 In the manufacturing sector, funding growth was attributable to large increases in electronic and communications equipment, pharmaceuticals, and biotechnology. Other key developments were the rapid gains in non-manufacturing R&D. In 1982, the non-manufacturing sector accounted for less than 5 percent of industry R&D, but reached 36 percent by 2000. The largest shares were in professional, scientifi c, and technical services and the broad information category.
Places where fi rms reinvest a portion of their profi ts into their innovation pipelines will likely have sustained development. The value of industry R&D can be hidden in the incremental innovation of its products and services, but entirely new technologies can be spawned as well. Industry R&D activities tend to focus on short-term returns.23 Despite the widely acclaimed success of university-based R&D centers such as Silicon Valley and Raleigh-Durham, our research shows that location-based industry R&D deserves more credit than it is aff orded for sustained job and wealth creation, although the two are clearly interrelated.
Technology fi rms are continually monitoring the globe to fi nd attractive locations for their R&D activities. Corporate R&D is a global endeavor. Missing an important emerging R&D region may mean sacrifi cing market opportunity or losing competitive advantage to an international rival.24 For example, the fastest-growing segment of U.S. industrial R&D expenditures is foreign-based multinational corporations. Foreign multinationals have also attempted to gain access to U.S.-based R&D through mergers and acquisitions with innovative fi rms. Foreign M&A activity is a strategy being deployed to gain quick access to emerging technologies. This is an excellent indication that the United States is perceived to be a hotbed of innovation, but also suggests that our innovation capacities may be transferred to other nations. The transfer occurs not only when foreign fi rms acquire U.S. R&D assets. The direction of global outsourcing trends in recent years demonstrates that for all the strengths of America’s R&D, U.S. companies will not hesitate to place crucial research functions in other nations that off er suffi ciently attractive attributes.
Another key development in private-sector innovation is the shift to aspiring new fi rms as a source for R&D.25 Federal initiatives such as the Small Business Innovation Research (SBIR) program attempt to support private-sector R&D through a set-aside program earmarked for small fi rms with promising technology that has not yet been demonstrated to be commercially viable. These new fi rms have often had diffi culty accessing the capital that they need to demonstrate commercial potential, and SBIR is the federal government’s eff ort to fi ll this void. For a fi rm to qualify for an award, it must meet four criteria: it must be a for-profi t entity; it must be American-owned and independently operated; it must employ the principal researcher; and it must have no more than 500 employees. The ability to win these awards is one of the components refl ected in each state’s composite index score.
Federally funded R&D can be an important economic development asset. Through seemingly unintended regional development policies over the past fi fty years, the federal government has reinforced and enhanced the position of well-known technology clusters. These regions were often sited for strategic national security or political reasons. By placing defense-related federal research facilities in such places as Silicon Valley, where advanced
22. “Science and Engineering Indicators–2004,” ed. National Science Board (National Science Foundation, 2004).
23. Jacques Mairesse, “To Be or Not to Be Innovative: An Exercise in Measurement,” NBER Working Paper, no. 8644 (2001).
24. Roman Boutellier, Oliver Gassman, and Maximilian Von Zedtwiz, Managing Global Innovation (New York: Springer, 2000).
25. Zoltan Acs, Innovation and the Growth of Cities (Northhampton: Edward Elgar Publishing, 2002).

16
Milken InstituteState Technology and Science Index
semiconductors were designed and produced, the federal government helped certain areas prosper.26 Locations in which these labs spin out technology have benefi ted.
Federal support of R&D has diminished. The government’s R&D funding was heavily defense-related during the Cold War years. The federal share of total R&D peaked in the early 1960s at 65 percent and began a gradual descent, falling below 50 percent for the fi rst time in 1979. Today, the federal share is just above one-quarter total R&D funding. After adjusting for infl ation, absolute federal funding of R&D fell in the second half of the 1980s and has remained fl at ever since.
There have been some signifi cant changes in the distribution of federal R&D funds across research areas over the past decade. Federal funds have been shifted toward life sciences and away from the physical sciences and engineering. Basic and applied federal funding of life sciences rose from 40 to 45 percent of the total in the 1990s, while physical sciences and engineering fell from 38 to 32 percent. By 2007, according to the National Science Foundation, this disparity deepened, with life sciences rising above 50 percent of total federal obligations while physical sciences and engineering combined fell further, dipping below 28 percent.27 Supporters of government funding of life sciences are pleased, but many scientifi c groups are concerned about the potential long-term impacts of this change in allocations. The shift has important implications for states and regions attempting to attract more federal R&D funding.
Expenditures for university-based research and development may be funded by federal, state, and local government; industry; nonprofi ts; or the universities directly. Universities tend to support basic research that addresses long-term, fundamental knowledge and scientifi c discovery. The nation’s universities and colleges account for approximately half of basic research. Universities receive more than 60 percent of their total R&D funding from the federal government. The bulk of that funding is going into life sciences, as evidenced by the dramatic increase in university patenting in this promising fi eld.
The economic value of university research accrues over many years. However, university facilities, research staff , and knowledge contribute to a region’s research base and have a short-term payoff , too: they attract new business.28 Publicly fi nanced institutions are essential for sparking innovation. States with successful research universities have played an important role in attracting research-oriented companies. Increasingly, universities are conducting more applied research for the benefi t of specifi c corporate sponsors. Joint industry/academic research collaboration supports industry research objectives by granting fi rms access to cutting-edge innovation and establishing a network for hiring top graduates.
A region’s R&D assets are important, but the degree of interaction with other elements of the economy determines whether the results will be commercially viable. Location-based technological change depends upon user-producer relationships (inter-fi rm, inter-industry and consumer-producer); science-production relations; inter-fi rm relations in dynamic clusters; and fi rm-government-university relations. It is increasingly important that these relationships are nonhierarchical, and based on substance-dependent communication and action processes.29
26. Henry Rowen, “Serendipity of Strategy: How Technology Markets Came to Favor Silicon Valley,” in The Silicon Valley Edge (Stanford: Stanford University Press, 2000).
27. “Science and Engineering Indicators–2002” and “Science and Engineering Indicators–2008,” ed. National Science Board (National Science Foundation).
28. Robert Atkinson and Paul Gottlieb, “The Metropolitan New Economy Index” (Progressive Policy Institute, 2001).
29. Michael Storper, The Regional World: Territorial Development in a Global Economy (New York: The Guilford Press, 1977).

17
Milken InstituteState Technology and Science Index
Collaboration in research and development among corporate labs, corporate supplier networks, universities, and government labs is evolving into a new distributed, external platform system for innovation.30 Relationships between industry and universities have grown more extensive over the past two decades as federal sources of R&D funding are increasingly tied to attracting private-sector investments.
As an example, the Small Business Technology Transfer (STTR) program seeks to increase the participation of small businesses in federal R&D and to increase private-sector commercialization of technology from federal sources. Many newly chartered fi rms play an increasingly instrumental role in today’s rapid commercialization of technology innovations. Unencumbered by other core technology assets, small fi rms can bring new products and services to market quickly. The unique feature of the STTR program is its requirement that the small-business applicant organization must formally collaborate with a research institution in phase I and phase II. The ability to secure STTR awards is yet another component that informs each state’s overall composite index score.
Technology-transfer policies must be part of research facility charters. To fully leverage new technologies for commercial success, applied research programs need to be established between the government and university labs with the private sector. The culture at many university and government research facilities must also emphasize commercial applications beyond research for the sake of scientifi c discovery.31 States will reap economic rewards for encouraging and supporting scientists and other researchers to license their research to the private sector, become part-time consultants to private fi rms, and move to the private sector themselves to develop commercial applications.
State Rankings
In our Research and Development Inputs Composite Index, Massachusetts retains its 1st-place ranking as the top R&D state. Its overall composite score has slightly improved to 93.07. (To earn a perfect index score of 100, a state would have to place fi rst in each of the index’s eighteen components.) While California dipped to 3rd, the 2nd-place fi nisher was Maryland, displaying considerable heft with a score of 87.08, pulling itself well beyond California and closing in on Massachusetts. California’s composite score remains statistically unchanged at 80.12, down from 80.32 in 2004, but relatively speaking, Maryland outperformed the Golden State with high marks for improvement. Rounding out the top ten are Colorado, New Hampshire, Rhode Island, Connecticut, Washington, Virginia, and New Mexico.
30. Lewis Branscomb and Richard Florida, Investing in Innovation: Creating a Research and Innovation Policy That Works (Cambridge: The MIT Press, 1998).
31. Ross DeVol, Blueprint for a High-Tech Cluster: The Case of the Microsystems Industry in the Southwest (Milken Institute, 2000).

18
Milken InstituteState Technology and Science Index
Figure 2. Research and Development Inputs Composite Index
Top ten states, 2008
NMVAWACTRINHCOCAMDMA
95
90
85
80
75
70
65
Score
Source: Milken Institute.
Figure 2 depicts the top ten performers in the eighteen individual indicators that make up the overall Research and Development Inputs Composite Index. State rankings for each indicator are converted into numerical scores; the scores are then totaled and divided by the number of indicators to derive a composite index score.
R&D spending is classifi ed as coming from three general sources: the federal government, private industry, and academia. The index’s federal R&D expenditure measure captures the sum of all basic and applied research in projects that are federally supported and includes work pertaining to national defense, health, space research and technology, energy, and general science. The industry R&D measure totals all the money spent by corporations on basic and applied research, including those amounts spent by corporations on federally funded R&D centers. Industry R&D receives great weight in the composite index because of its large share of overall R&D. All research, basic and applied, performed by colleges and universities is funded by a combination of federal, industry, and academic sources.
The National Science Foundation (NSF) is an independent agency of the U.S. government that funds research and education in science and engineering through grants, contracts, and cooperative agreements. Its R&D expenditures on engineering are a key source of funding at doctorate-granting institutions for various basic and applied engineering programs. It also supports physical sciences, environmental sciences, math, computer sciences, and life sciences.
As we discussed earlier, the STTR awards are federally funded research awards granted to small businesses and nonprofi t research institutes. SBIR awards fund the often costly start-up and development stages as well as encouraging commercialization of the research fi ndings. The funding rates of competitive NSF project proposals for basic research are crucial for generating momentum at the formative stages of R&D in universities. Successfully competing for awards from all three of these government sources is refl ected in each state’s composite score.

19
Milken InstituteState Technology and Science Index
Figure 3. Research and Development Inputs Composite Index Map
2008
Top TenSecond TierThird TierBottom Ten
Massachusetts continues to dominate the Research and Development Inputs Composite Index in 2008, scoring high marks in virtually every indicator. Like its remarkable performance in the previous 2004 index, Massachusetts ranked in the top fi ve in sixteen out of eighteen total categories. California dropped one position in the composite index, due to Maryland’s stellar breakout performance. Maryland, ranked 4th in 2004, pulled away from the pack, passing California and Colorado and even beginning to close in on the top fi nisher, Massachusetts. Its remarkable climb up the rankings was substantial. In industry R&D it jumped from 28th to 13th place. In the average annual number of STTR awards, Maryland strengthened its position, climbing from 37th all the way to 6th position.
Colorado scores high in NSF funding and NSF researching funding indicators. New Hampshire’s jump in the rankings is based on improvements in industry R&D funding, increased R&D on physical sciences, and overall scores in STTR awards; these factors pushed the state from 8th place in 2004 to 5th place currently. Rhode Island’s highest rank was in competitive NSF proposal funding rate, where it placed fi rst, but it was also a top-fi ve fi nisher in many of the other indicators. Connecticut improved in all three types of R&D funding: academic, industry, and federal. Its most signifi cant jump is in industry R&D, where it seized the coveted 1st-place position, as industry R&D is by far the largest component out of the three listed. This is reinforced in Connecticut’s strong showings in R&D expenditures on both life sciences and biomedical fi elds. Washington’s strengths lie in competitive NSF proposal rates and industry R&D. Virginia excels in STTR awards and placed in the top fi ve for federal R&D and SBIR indicators. New Mexico placed 2nd in federal R&D and engineering R&D.

20
Milken InstituteState Technology and Science Index
Arkansas remains mired in last place in 2008 in the Research and Development Inputs Composite Index with an average score of only 18.45. Kentucky slipped four spots to 49th due to its faltering performance in STTR and NSF placements. South Dakota was dead last in expenditures on math and computer science, and second to last in physical science. Louisiana keeps its position at 47th, scoring best in agricultural sciences. Oklahoma placed 46th, down two notches from 2004. West Virginia ranked in the bottom ten in eight of the eighteen indicators. Florida also slipped from 2004; with a score of 27.75, it ranked 44th. South Carolina’s strength in sciences lies with engineering. Nevada, in 42nd place, ranks low in math, computer science, and life sciences, but it does place in the top ten for environmental sciences. Maine’s weakness, similar to Nevada’s, is in life sciences but it likewise excels in environmental sciences. Rounding out the bottom ten, Mississippi does manage to place 4th in agricultural sciences and 6th in federal R&D.
North Dakota recorded the biggest improvement in 2008, jumping twenty-one places. The state’s meteoric rise was driven by advancements in STTR awards; R&D expenditures in biomedical, physical sciences, and engineering; and improvements in industry R&D. Connecticut climbed six positions from 13th in 2004 to 7th in 2008. It made headway by improving its performance in STTR awards as well as improvements across the board in academic, federal, and industry R&D. Vermont, Montana, and Hawaii all tied for third-best improvement, increasing their rankings by fi ve places. Vermont rose to 15th in 2008, with a considerable improvement in academic and federal R&D. Montana rose to 25th, with large gains in NSF research funding and environmental sciences. Hawaii’s 23rd-place fi nish was made possible in part because of the stellar gains in expenditures on math and computer science; in this indicator, the state went from a bottom-ten to a top-ten fi nish.
Table 2. Research and Development Inputs Composite Index
State rankings, 2008
StateRank 2008
Rank 2004
Rank change 2004 to 2008
Score 2008 State
Rank 2008
Rank 2004
Rank change 2004 to 2008
Score 2008
Massachusetts 1 1 0 93.07 Illinois 26 21 -5 52.72Maryland 2 4 2 87.08 Alabama 27 29 2 52.00California 3 2 -1 80.12 Ohio 28 25 -3 50.71Colorado 4 3 -1 78.41 Texas 29 32 3 50.38New Hampshire 5 8 3 76.98 Indiana 30 33 3 44.78Rhode Island 6 6 0 72.44 Missouri 31 34 3 44.55Connecticut 7 13 6 72.39 Iowa 32 36 4 44.21Washington 8 7 -1 70.88 Alaska 33 27 -6 41.39Virginia 9 10 1 70.17 Georgia 34 26 -8 40.58New Mexico 10 5 -5 67.24 Kansas 35 35 0 40.44Pennsylvania 11 9 -2 67.08 Wyoming 36 39 3 39.69Delaware 12 14 2 63.85 Nebraska 37 23 -14 39.22Oregon 13 16 3 61.13 Idaho 38 31 -7 38.61Michigan 14 15 1 60.70 Tennessee 39 38 -1 37.20Vermont 15 20 5 59.73 Mississippi 40 43 3 34.32Arizona 16 12 -4 59.10 Maine 41 37 -4 32.86Utah 17 11 -6 58.80 Nevada 42 46 4 30.82North Carolina 18 22 4 58.55 South Carolina 43 42 -1 29.61North Dakota 19 40 21 57.32 Florida 44 41 -3 27.75New Jersey 20 18 -2 56.66 West Virginia 45 48 3 27.23New York 21 17 -4 56.62 Oklahoma 46 44 -2 26.12Wisconsin 22 24 2 54.95 Louisiana 47 47 0 25.61Hawaii 23 28 5 54.13 South Dakota 48 49 1 22.54Minnesota 24 19 -5 53.93 Kentucky 49 45 -4 20.12Montana 25 30 5 53.65 Arkansas 50 50 0 18.45
State average 51.14

21
Milken InstituteState Technology and Science Index
Risk Capital and Entrepreneurial Infrastructure
Background and Relevance
Entrepreneurial capacity and behavior are prime drivers of growth and job creation in the new intangible economy. Entrepreneurs see the economic potential of new technologies and apply them to business concept innovations. Author Gary Hamel describes business concept innovation as “the capacity to imagine dramatically diff erent business concepts or dramatically new ways of diff erentiating existing business concepts.”32
In an era of rapid change, entrepreneurial skills have a unique role to play because new enterprises, having no history and no personal stakes, are better positioned to harness emerging technology. But it requires more than the presence of idea-driven individuals and fi rms to make a region prosperous. “Good capitalism” is a blend of both “entrepreneurial” and “big-fi rm” capitalism providing the structural support to nurture and commercialize innovative products.33 The message is this: to be successful over the long haul, a state or region needs capable entrepreneurs and the risk capital infrastructure to support them. Perhaps more important, public policy offi cials must understand the role of entrepreneurial activities and build the social network infrastructure to nurture success.
Entrepreneurs contribute to economic growth both directly and through indirect channels.34 Beyond just working longer hours and creating new businesses, which directly impacts growth, entrepreneurs stimulate the region through various other methods. They increase productivity through technological change.35 These self-starters manipulate existing technology and services, which speeds up the learning curve. Their new products increase competition, persuading incumbents to innovate themselves or risk losing market share. The potential competition serves to drive down prices and bring about better products, with a positive impact on consumers.36
The ability to garner the required resources and overcome all impediments by seizing new business opportunities is what defi nes entrepreneurship. Entrepreneurs are willing to risk fi nancial uncertainty in order to create something from their ideas.
Entrepreneurs are essential because new ideas are best implemented in new fi rms. Existing businesses often fear “cannibalizing” their current sales and hesitate to introduce new products.37 Big, bureaucratic fi rms often do not even recognize the value of their own discoveries and how they could be applied. The story of U.S. innovation is full of examples of entrepreneurs adopting new technologies originally conceived but not fully pursued at established fi rms.
When Steve Jobs visited Xerox’s PARC facility and witnessed an early prototype of the graphic user interface (GUI), Xerox did not see how the technology could be applied. Later, Jobs founded Apple Computer, which used the GUI for its Macintosh personal computer. Similarly, Sun Microsystems, an outside start-up, created the computer workstation market even though IBM held the patents to the technology. The world’s leading pharmaceutical fi rms played virtually no role in the burgeoning fi eld of biotechnology. Big Pharma was forced to acquire biotechnology
32. Gary Hamel, Leading the Revolution (Boston: Harvard Business School Press, 2000).
33. William J. Baumol, Robert E. Litan, and Carl J. Schramm, Good Capitalism, Bad Capitalism, and the Economics of Growth and Prosperity (New Haven: Yale University Press, 2007).
34. Adriaan Johannes van Stel, “Entrepreneurship and Economic Growth: Some Empirical Studies” (EIM Business and Policy Research in Zoetermeer, 2005).
35. Zoltan Acs, “How Is Entrepreneurship Good for Economic Growth?,” Innovations: Technology, Governance, Globalization 1, no. 1 (2006).
36. Jean Tirole, The Theory of Industrial Organization (Cambridge, The MIT Press, 1988).
37. Chris Edwards, “Entrepreneurial Dynamism and the Success of U.S. High-Tech,” ed. Joint Economic Committee Staff Report (1999).

22
Milken InstituteState Technology and Science Index
fi rms because they didn’t pursue research in this area and develop their own expertise. Nevertheless, they knew of the scientifi c breakthroughs in the fi eld of microbiology and the commercial promise it off ered.
Inventions advance the store of human knowledge, but do not aff ect the local economic system until they are implemented as an innovation. Risk capital by itself will not turn new ideas into commercially viable products; that is the role of entrepreneurs. Innovation and economic impact occur when an entrepreneur garners the fi nancing, creates a business model, and transfers the invention into the private sector.38 Even MIT economist and best-selling author Lester Thurow altered his formerly pessimistic view on the relative decline of U.S. industry. Thurow now believes that “entrepreneurs are central to the process of creative destruction, since they are the individuals who bring the new technologies and the new concepts into active commercial use. They are the change agents of capitalism.”39
Job creation statistics bear out the importance of entrepreneurship in the U.S. economy. In the second half of the 1990s, businesses with fewer than 100 employees created 75 percent of all new jobs in the United States. Moreover, 15 percent of the fastest-growing new fi rms accounted for more than 90 percent of net new job creation.40
The explosion in the availability of capital to individual entrepreneurs has supported new fi rm formation and economic growth. In the old fi nancial order, only organizations and individuals with money were given access to borrowed funds for investment purposes. Consequently, more innovative entrepreneurs faced great diffi culty in obtaining early-stage funding.41 The increased availability of risk capital to technology start-ups is particularly powerful because their product or service is unproven and the market potential is diffi cult to ascertain. Most traditional banks do not want to accept intellectual property as collateral for a loan, although some have established venture capital divisions to enter this expanding capital market.
Effi cient capital markets promote economic development and facilitate wealth creation by channeling investments into productive enterprises. Broader access to capital and a wider distribution across the population improve ownership patterns that diff use its benefi ts and boost economic growth.42 Broadly diversifi ed fi nancial systems result in effi cient capital allocation to alternative investment opportunities. This process is highlighted by the increasing shift to market-based fi nancing, especially to an early-stage business investment market, and away from the traditional intermediated-fi nance model.
Many of these new fi rms require large amounts of external fi nancing for an extended period before they can tap traditional debt or equity markets. Private equity from pools of individual investors (angels) or highly specialized venture capital (VC) fi rms attempt to fi ll this void.
Angel investors are groups of loosely organized individuals who pool fi nancial resources to provide start-up or early-stage funds to fi rms. After either exhausting their own fi nancial resources or those from friends and family, entrepreneurs turn to angel investors. Angel investors fi ll smaller fi nancing needs than traditional venture capitalists provide. VC funds may prove incompatible with new fi rms for a number of reasons: the limited size of early-round investments, modest future anticipated needs, or a higher risk profi le associated with limited information on market potential for their product.
38. Claudio Michelacel, “Low Returns in R&D Due to Lack of Entrepreneurial Skills,” in Discussion Paper Series (Centre for Economic Policy Research, 2002).
39. Lester C. Thurow, Building Wealth: The New Rules for Individuals, Companies, and Nations in a Knowledge-Based Economy (New York: Harper Collins Publishers, 1999).
40. Chris Edwards, “Entrepreneurs Creating the New Economy,” ed. Joint Economic Committee Staff Report (2000).
41. Denis Gromb and Davis Schartstein, “Entrepreneurship in Equilibrium,” NBER Working Paper, no. 9001 (2002).
42. Glenn Yago, Thomas Hall, and Juan Montoya, Think Locally–Act Globally: Capital Market Restructuring and Sustainable Global Economic Growth (Milken Institute, 2000).

23
Milken InstituteState Technology and Science Index
When an angel-backed fi rm’s fi nancing needs expand beyond the capacity of the angel market, they approach venture capital fi rms. Contrary to public perception, VC fi rms rarely invest in start-ups, although some VC funds have been established solely to provide seed fi nancing. The majority of their investments are follow-on funding, often in business sectors where rapid growth is expected. Venture capitalists look for high rates of return over a fi ve-year period with an exit strategy of cashing out after a fi rm becomes publicly traded through an initial public off ering or a merger or acquisition by an established fi rm.43
Venture capital has a history of funding new technologies. These are the most risky investments, but can off er high returns. Venture capitalists backed fl edgling semiconductor fi rms, then personal computers, followed by the disk drive industry, biotechnology in the early 1990s (before the market crash in 1992), software in the mid-1990s, and dot-coms at the end of the last decade. Intel, Microsoft, Apple, Cisco, Genentech, and Amazon were all venture-backed fi rms.
Venture capitalists often place high importance on the passion of the entrepreneur and the talent of the senior management staff . The product or service is central to the issue of whether to fund a fi rm, but VCs also see commitment and talent as critical determinants. They evaluate such factors as market potential, ability to establish branding, and whether their space is defensible against imitators. Venture fi rms are able to take substantial risks because of the large upside of a small number of their investments. The net returns of VC funds are accumulated from a small minority of investments with the bulk of the returns coming from 10 percent of the fi rms.44
Venture capital placement is an important later-stage measure of commercialization activity for new technologies and business concept innovations. Venture capital funding represents a small share of the overall capital markets, but its true value cannot be measured in dollars. VCs assist in business plan development, become board members, lend management skills, suggest strategic partnerships and alliances, assist in expansion plans, and bring in key talent where it is needed. Venture capital activity is an excellent way to assess whether fi nanciers have confi dence in the new ideas and entrepreneurial infrastructure of a region.
A new conceptual framework for state and regional economic growth must be built that explicitly recognizes the role of entrepreneurship in the intangible economy. First, it is important to note that entrepreneurial activity is molded by a consistent set of factors, including training and support from the private and public sectors and the availability of early-stage fi nancing. The intensity of entrepreneurial activity is also a function of the extent to which individuals spot the opportunities and possess the motivation and skills to exploit them.45 The interaction between the recognition of opportunities and the capacity to pursue them determines the success of start-up eff orts, new fi rm birth, and job formation.
State Rankings
California’s score on the Risk Capital and Entrepreneurial Infrastructure (RCEI) Composite Index is 81.27, positioning the state squarely in 1st place. California overtook the 2004 leader, Massachusetts, which came in at 79.82. The remaining top ten states are Colorado (which scored 77.45), Washington (71.82), New York (69.82), Maryland (69.64), Pennsylvania (68.73), Georgia and North Carolina (tied at 67.27), and Arizona (66.91). California performed well in many categories, posting a top-ten fi nish in seven out of eleven indicators. The state clearly excels in VC
43. Martin Kenney and Richard Florida, Understanding Silicon Valley: The Anatomy of an Entrepreneurial Region (Stanford: Stanford University Press, 2000).
44. Tobias Moskowitz and Annette Vissing-Jorgenson, “The Returns to Entrepreneurial Investment. A Private Equity Premium Puzzle?,” NBER Working Paper, no. 8876 (2002).
45. Paul D. Reynolds and Michael Hay, “Global Entrepreneuriship Monitor: 1999 Executive Report” (Kauff man Center for Entrepreneurial Leadership at the Ewing Marion Kauff man Foundation, 1999).

24
Milken InstituteState Technology and Science Index
investment in general and in the two cutting-edge fi elds of nanotechnology and clean technology. The state’s weakness lies in developing business incubators. In ignoring this aspect of business development, California may be placing too much reliance on the established venture capital model. And although VC investment is high for the state in general, its growth is slow relative to other states.
Figure 4. Risk Capital and Entrepreneurial Infrastructure Composite Index
Top ten states, 2008
AZNCGAPAMDNYWACOMACA
82
80
78
76
74
72
70
68
66
Score
Source: Milken Institute.
Composed of eleven indicators, the RCEI Composite Index aims to measure each state’s entrepreneurial culture through the analysis of risk capital vehicles such as venture capital investment and IPO activity. It further seeks to gauge the eff ects of such vehicles in terms of business creation and patents activity.
The RCEI Composite Index is calculated by totaling scores (which are based on state rankings in each indicator) and dividing the total by the number of indicators. Several indicators on venture capital are included in order to capture its relative size and which states are witnessing rapid gains. A high growth rate in venture capital placements indicates that a state is achieving early success in building technology-based fi rms for future economic development and job creation, thus closing the gap with more advanced states. Growth in total venture capital funding and in the number of companies receiving VC investment captures this element.
We include the number of companies receiving venture capital investment per 10,000 fi rms and VC investment as a percentage of Gross State Product (GSP) to measure the fl ow and strength of each state’s venture capital activity relative to its total economy. Venture capital’s share of a state’s economy is important because of the strong relationship between higher venture capital investment activity and entrepreneurial success, job creation, wealth creation, and higher standards of living. The level numbers represent how the states rank in terms of size for each indicator. The growth indicators demonstrate the continued vitality of the indicators within each state. So both combine to give a more complete picture of how the states are performing.
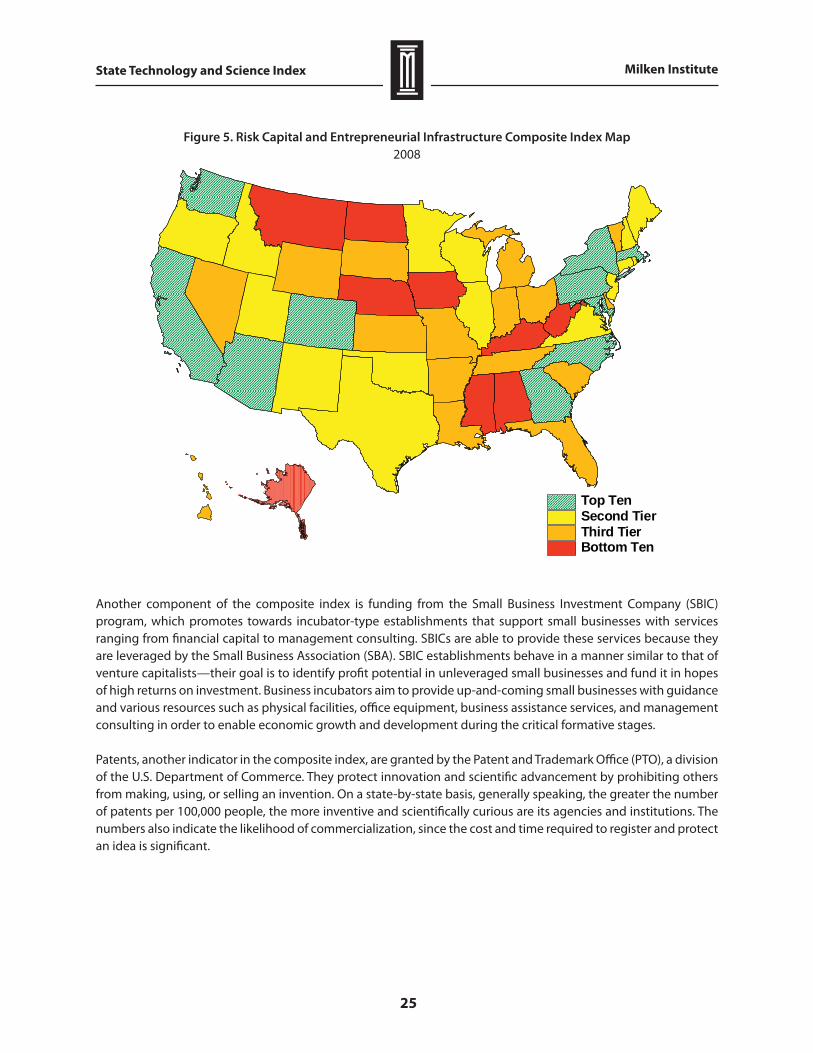
25
Milken InstituteState Technology and Science Index
Figure 5. Risk Capital and Entrepreneurial Infrastructure Composite Index Map
2008
Top TenSecond TierThird TierBottom Ten
Another component of the composite index is funding from the Small Business Investment Company (SBIC) program, which promotes towards incubator-type establishments that support small businesses with services ranging from fi nancial capital to management consulting. SBICs are able to provide these services because they are leveraged by the Small Business Association (SBA). SBIC establishments behave in a manner similar to that of venture capitalists—their goal is to identify profi t potential in unleveraged small businesses and fund it in hopes of high returns on investment. Business incubators aim to provide up-and-coming small businesses with guidance and various resources such as physical facilities, offi ce equipment, business assistance services, and management consulting in order to enable economic growth and development during the critical formative stages.
Patents, another indicator in the composite index, are granted by the Patent and Trademark Offi ce (PTO), a division of the U.S. Department of Commerce. They protect innovation and scientifi c advancement by prohibiting others from making, using, or selling an invention. On a state-by-state basis, generally speaking, the greater the number of patents per 100,000 people, the more inventive and scientifi cally curious are its agencies and institutions. The numbers also indicate the likelihood of commercialization, since the cost and time required to register and protect an idea is signifi cant.
26
Milken InstituteState Technology and Science Index
Business formation is important to a state’s local economy because it is an indicator of entrepreneurship, innovative spirit, and optimistic expectations. An initial public off ering (IPO) occurs when a company decides to sell shares of its common stock to the general public. Companies that go public are typically those that have established a proven track record by means of revenues or sales history, so IPO proceeds are another key indicator.
Two new additions to the RCEI Composite Index are investments in clean technology and nanotechnology. Clean tech is specifi cally designed to minimize negative ecological impacts and improve the productivity and responsible use of natural resources. It includes investments in renewable energy like wind turbines, solar panels, and waste-to-energy (WTE) enclosures as well as processes for improving traditional methods with new techniques (such as coal gasifi cation, or IGCC). Nanotechnology is cutting-edge research, an area where funding typically goes into states with the ability to draw from both traditional and non-traditional business capital.
California dominates the RCEI Composite Index, coming in almost 3 index points ahead of the previous leader, Massachusetts. California consistently scores well, placing in the top fi ve in six of the eleven individual categories. Its best fi nish is a tie for 2nd place in the number of companies receiving VC investment relative to business establishments, VC investment relative to GSP, and number of business starts relative to the population. The University of California system was again tops in patent grants to universities in 2005, followed closely by the California Institute of Technology.
Massachusetts placed 2nd overall, relinquishing the 1st-place spot due mainly to the number of business starts relative to the population. Its poor showing in this category and California’s overall outstanding performance allowed for the reversal in standing. Colorado moved into the top ten by improving in fi ve components. Washington placed 3rd in the amount of VC investment relative to Gross State Product (GSP). New York excelled in IPO proceeds relative to GSP as well as SBIC-disbursed funds relative to GSP.
Maryland’s 6th-place ranking, down one notch from 2004, is bolstered by its performance in two categories: number of companies receiving VC investment as well as the amount of VC investment relative to GSP. A new entry into the top ten is Pennsylvania. The state advanced from 21st place to 7th place due to strong improvements in total VC investment and total number of companies receiving VC investment growth, as well as the level of VC investment relative to GSP. Georgia’s strength is in new technology, as it scored in the top ten for nanotechnology. This year’s VC growth also contributed to its 8th-place tie with North Carolina. North Carolina’s programs to attract biotech start-up companies have resulted in top-ten placements in both clean technology and nanotechnology in this year’s index. Tenth-place Arizona is another state that recently broke into the top-ten rankings. Its performance in number of business starts and in IPO proceeds relative to GSP was remarkable, with an average movement of more than twenty-two positions.
At the other end of the spectrum, Alaska sits in last place with a score of 21.71. Mississippi remained in 49th place, ranking in the bottom ten on four of the eleven indicators. West Virginia is a new bottom-ten entry, sliding eighteen positions due to particularly low showings in patents and business starts, as well as number and growth of companies receiving VC investment. Iowa slipped two positions to 48th place with a score of 34.22. North Dakota advanced four positions to 46th place, improving in the number of business incubators as well as business starts. Montana’s best showing is in the number of its business starts relative to its population. Nebraska dropped nine positions to 44th place, although in terms of growth of companies receiving VC between 2005 and 2006, it placed in the top fi ve. Alabama and Kentucky also scored well in that category, with 3rd- and 2nd-place fi nishes, respectively.
Texas posted the biggest improvement in the RCEI Composite Index, rising seventeen positions to 12th place. Its biggest jump was in total VC investment growth. Hawaii was the second-largest gainer, moving up sixteen

27
Milken InstituteState Technology and Science Index
places. Overall Hawaii improved its ranking in seven of the nine original categories. Wisconsin posted a similar gain, with its biggest leap in companies receiving VC growth. South Dakota moved up fi fteen places, with two top-ten fi nishes. Pennsylvania, in spreading out the VC deals by allotting to more companies instead of a concentrated mix, as well as achieving general growth in VC infusion and VC relative to GSP, moved from 21st place in 2004 up to 7th in 2008.
Table 3. Risk Capital and Entrepreneurial Infrastructure Composite Index
State rankings, 2008
StateRank 2008
Rank 2004
Rank change 2004 to 2008
Score 2008 State
Rank 2008
Rank 2004
Rank change 2004 to 2008
Score 2008
California 1 2 1 81.27 South Dakota 26 41 15 53.78Massachusetts 2 1 -1 79.82 Hawaii 27 43 16 52.55Colorado 3 4 1 77.45 Missouri 28 25 -3 50.00Washington 4 8 4 71.82 Michigan 29 37 8 49.64New York 5 13 8 69.82 Louisiana 30 33 3 49.45Maryland 6 5 -1 69.64 Arkansas 31 42 11 49.09Pennsylvania 7 21 14 68.73 South Carolina 32 39 7 48.91North Carolina 8 7 -1 67.27 Florida 33 28 -5 48.60Georgia 8 10 2 67.27 Vermont 34 27 -7 48.40Arizona 10 18 8 66.91 Kansas 35 40 5 48.18Connecticut 11 12 1 66.36 Delaware 36 14 -22 47.80Texas 12 29 17 65.82 Indiana 37 26 -11 46.73Minnesota 13 9 -4 65.45 Tennessee 38 23 -15 44.91Maine 14 22 8 65.09 Nevada 39 36 -3 44.36Rhode Island 15 3 -12 64.18 Ohio 40 20 -20 44.00Utah 16 11 -5 63.27 Wyoming 40 38 -2 44.00Wisconsin 16 32 16 63.27 Kentucky 42 48 6 41.45New Hampshire 18 6 -12 63.11 Alabama 43 44 1 40.73Oregon 19 17 -2 62.60 Nebraska 44 35 -9 38.60New Mexico 20 19 -1 61.80 Montana 45 46 1 38.57New Jersey 21 16 -5 59.64 North Dakota 46 50 4 36.25Illinois 22 34 12 59.45 Iowa 47 45 -2 34.22Virginia 23 15 -8 56.91 West Virginia 48 30 -18 32.18Oklahoma 24 31 7 55.60 Mississippi 49 49 0 30.40Idaho 25 24 -1 54.50 Alaska 50 47 -3 21.71
State average 54.63
Human Capital Investment
Background and Relevance
Knowledge and the innovation capacities of human capital are at the core of the new intangible-based economics of place. In the old economy, human capital was not seen as a reservoir of talent exploitable for economic development. By contrast, today a state or region’s most important competitive advantage is the knowledge embedded in its people (intellectual capital). Firms and industry agglomerations have always attracted people, but today there’s also a new dynamic at work: concentrations of talent are attracting fi rms. Michael Milken was among the fi rst to recognize this shift when he stated, “Today, with the emergence of the information age, the strength of a country is based on knowledge. National greatness will arise not from our natural resources or our factories, but from our people—people with new ideas and skills.”46
Labor was once seen as an expense that must be minimized to achieve superior fi nancial performance; it was a rented, easily replaceable factor of production that warranted little investment. Even today, the balance sheets of
46. Michael Milken, Fueling America’s Growth, Education, Entrepreneurship and Access to Credit (Milken Institute, 1994).

28
Milken InstituteState Technology and Science Index
most corporations are mired in the industrial past because labor is only considered as an expense item. Human capital, or the value of the intellectual assets of U.S. companies, has been estimated to represent between 70 to 75 percent of their total asset value by University of Chicago Nobel laureate Gary Becker. Many technology fi rms have market capitalizations ten to twenty times the value of their physical assets.
In the new intangible economy, the knowledge, skills, experience, and innovation potential of talented individuals have greater value than capital equipment or even capital itself. A successful enterprise accesses, creates, and utilizes knowledge to sustain competitive advantage. It provides the required training, information technology, direction, and proper motivational system to ensure that its employees build new knowledge and value. And regions with fi rms that understand and live by these dynamics are well-positioned to exploit human capital for economic development. Former Federal Reserve Chairman Alan Greenspan summarized this new reality succinctly when he stated that “virtually unimaginable a half-century ago was the extent to which concepts and ideas would substitute for physical resources and human brawn in the production of goods and services.”47
New fi elds within political economy and urban economics frequently expound on how human capital and companies decide where to locate. Charles Tiebout famously observed that consumers migrate toward new communities based on the public amenities off ered and at the prices at which they are off ered.48 Once dissatisfi ed, and given that they enjoy perfect mobility and perfect information, residents will once again sort themselves until location equilibrium is reached. This explanation demonstrates how even states with high business costs can manage to attract talent if they suffi ciently leverage their other assets to compensate for those higher costs. A recent job market paper hints at the incoming wave of retirement decisions based on the Tiebout hypothesis.49 Retiring baby boomers will impact the labor market landscape across the nation as well as impact the fl ow of venture capital into the future. This highly educated work force is beginning to redefi ne the concept of “retirement,” as they continue to stay abreast of new innovation and new projects in the pipeline. Their decisions will drive where and to whom venture capital will fall. We may be seeing the start of this impact in Hawaii, as the 2008 edition of the State Technology and Science Index reveals that the islands’ demographics refl ect an infl ux of highly educated people with the ability to lure venture capital funding into the state.
Research on fi rm location is based on the Tiebout model since human capital is an integral part of the capital asset. In the past, people tended to follows jobs to places, but today economic and lifestyle considerations are both important. Richard Florida of Carnegie Mellon has studied this phenomenon and developed a “creative capital theory.” In The Rise of the Creative Class, he states:
Essentially my theory says that regional economic growth is driven by the location choices of creative people—the holders of creative capital—who prefer places that are diverse, tolerant and open to new ideas. (1) It identifi es a type of human capital, creative people, as being key to economic growth; and (2) it identifi es the underlying factors that shape the location decisions of people, instead of merely saying that regions are blessed with certain endowments of them.50
47. Alan Greenspan, paper presented at The Conference Board’s 80th Anniversary Dinner, 1996.
48. Charles Tiebout, “A Pure Theory of Local Expenditures,” The Journal of Political Economy 64, no. 5 (1956).
49. Seokjin Woo, “Tiebout Migration and Retirement of Older Workers,” University of Wisconsin-Madison job market paper (2005).
50. Richard Florida, The Rise of the Creative Class and How It’s Transforming Work, Leisure, Community and Everyday Life (New York: Basic Books, 2002).
29
Milken InstituteState Technology and Science Index
In other words, geography matters more than ever. Skilled technical and creative people determine fi rm and regional success, and fi rms must consider where high-end human capital chooses to locate.51 Skilled professionals—especially science and technical talent—increasingly determine the future economic prosperity of states and regions.
Perhaps Jane Jacobs conveys the message on the importance of human capital most poignantly. She draws parallels between the vibrant and fl exible processes of nature in order to build better models for economic planning. She culls examples from chaos theory to cell biology, ecology, and evolution. “Beginning with the very start of a settlement and continuing for as long as the place maintains an economy, human eff ort is combined with imports. …And the most important ingredient qualitatively—although not always quantitatively—is human capital. That means skills, information, and experience—cultivated human potentialities—resulting from investments made by the public, by parents, by employers, and by individuals themselves.”52
Talent is vital to regional prosperity because we have entered a knowledge-based economy. This change is so fundamental that it confl icts with basic economic concepts, such as scarcity, that have been taught to students for generations. Intellectual capital can be a bountiful resource that does not adhere to the law of diminishing returns. Knowledge resides with an individual or group and is not an easily manipulated asset.53 Knowledge grows when there is collaboration and sharing with others, and it is not depleted because even if it is transferred, the original owner still possesses it. Innovation, or the fl ow of new knowledge, thrives in an environment of collaboration, but dies in an environment based solely on competition.
There are two basic forms of knowledge that contribute to economic value and growth: “theoretical” and “tacit” knowledge. Theoretical knowledge is acquired through traditional formalized primary, secondary, and tertiary educational systems. This knowledge can be scientifi c, technical, or based in the liberal arts. Knowledge work is often unstructured and tends to be iterative, relying on both deductive and inductive reasoning. Formalized education provides a framework to allow eff ective learning and research activities that create new, formalized knowledge.
Tacit knowledge can best be described as informal or how-to knowledge. It is often created within teams that innovate inside a fi rm. Firms create value through development of knowledge-management strategies that foster sharing knowledge throughout an organization. In the past, knowledge was typically acquired and resident within separate individuals or groups. This knowledge is embedded in the systems, processes, methodologies, and technologies resident within organizations—residing in people’s thinking and experiences.54 There is evidence that knowledge spillovers are typically based upon tacit knowledge. Innovative activity has a high propensity to cluster spatially in industries where tacit knowledge plays a critical role because it is primarily transferred through informal networks, typically demanding direct and repeated contact and dialogue.
Many human capital skills have been transferred from knowledge created long ago. What is unique today is the high value associated with recently acquired knowledge and skills. Knowledge workers who possess the most current skills have dramatically higher earning power than workers with older skills. For example, computer programmers who are profi cient in the latest programming languages earn more than twice as much as those with knowledge in older languages.
51. Edward E. Leamer and Michael Storper, “The Economic Geography of the Internet Age,” NBER Working Paper, no. 8450 (2001).
52. Jane Jacobs, The Nature of Economies (New York: First Vintage Books Edition, 2001).
53. Dennis Kessler, Leigh Donoghue, and Anne DeLacy, “Knowledge Workers Revealed,” ed. The Economist Intelligence Unit and Anderson Consulting (1998).
54. Joel Kotkin and Ross DeVol, Knowledge-Value Cities in the Digital Age (Milken Institute, 2001).

30
Milken InstituteState Technology and Science Index
Knowledge is now being incorporated as a distinct factor in growth theory. A diverse set of theoretical and empirical work has emerged as endogenous, or new, growth theory. This body of work diff erentiates itself from traditional growth theory by emphasizing that economic growth is an outcome of a dynamic economic system. Endogenous growth theory postulates several channels through which technology, human capital, and the creation of new ideas enable a virtuous circle and feedback to economic growth.
New growth theory shows that knowledge has a separate and distinct impact on promoting economic growth. New growth theory is generally associated with Stanford University economist Paul Romer, who stated, “What is important for growth is integration not into an economy with a large number of people, but rather one with a large amount of human capital.”55
Several studies have found that people are more productive when they work around other individuals with a strong investment in human capital. The Milken Institute and other researchers have found strong statistical relationships between the depth of human capital and urban and regional growth.56 For example, diff erences in per capita income among states are most closely associated with the percent of the adult population that has at least a bachelor’s degree.57 Individual human capital is more productive in the presence of high collective human capital.58
In a pioneering study, Edward Glaeser discovered that the need to access common pools of talent was becoming stronger in determining why fi rms tend to cluster together in regional complexes rather than on the basis of access to suppliers and customers.59 Regional migration patterns of knowledge workers are another way to test the sustainability of regional economic growth diff erentials. Analysis supports the pattern that knowledge workers are attracted to regions with higher returns on knowledge.
As with private fi rms, states and regions must access, create and utilize knowledge to sustain a competitive advantage in the intangible economy. Talented individuals are highly mobile and can reward regions that attract them and punish those that lose them. Regions must utilize their knowledge assets, such as universities, research centers, and especially, the talent that they create or attract to fuel economic growth.
State Rankings
Maryland pushed past three states to lead the nation in the Human Capital Investment Composite Index with a score of 78.19. Placing in the top fi ve in seven of the twenty individual indicators, Maryland excels by virtue of its highly educated work force as well as its number of graduate students in science and engineering. Although its SAT scores are mediocre, the state’s exceptional university system attracts and confers a large number of advanced and doctoral degrees. The quality of the educational system is highlighted in the number of graduate students as well as postdocs awarded. Massachusetts comes in at 2nd place with a score of 77.90. The rest of the top ten includes Colorado (74.86), Connecticut (73.81), Minnesota (70.86), New York (69.90), Utah (68.29), Virginia (67.62), Vermont (67.05), and Delaware (65.14).
55. Paul Romer, “Increasing Returns and Long Run Growth,” Journal of Political Economy 94 (1986).
56. Paul D. Gottlieb and Michael Fogarty, Educational Attainment and Metropolitan Growth (Milken Institute, 1999).
57. Ross DeVol, “The New Economics of Place,” Milken Institute Review (2001).
58. Paul Plummer and Mike Taylor, “Theories of Local Economic Growth (Part 2): Model Specifi cation and Empirical Validation,” Environment and Planning A 33, no. 3 (2001).
59. Edward Glaeser, “Are Cities Dying?,” Journal of Economic Perspectives (1998).

31
Milken InstituteState Technology and Science Index
The index attempts to measure each state’s stock of human capital and the rate of investment (fl ow) between states by gauging the concentration and momentum of various science and engineering fi elds. It also tries to capture how well R&D investments are being utilized by analyzing student scores. These indicators are meant to give a snapshot of how adequately the state is prepared to sustain employment in science and technology fi elds. State rankings for each indicator are converted into numerical scores; the scores are then totaled and divided by the number of indicators to derive a composite index score. The individual components that make up this composite index are described in further detail below.
Figure 6. Human Capital Investment Composite Index
Top ten states, 2008
DEVTVAUTNYMNCTCOMAMD
80
78
76
74
72
70
68
66
64
Score
Source: Milken Institute.
Verbal Scholastic Aptitude Test (SAT) scores are important to state education analysts because they allow them to measure the verbal competence of high school students on a time series and cross-sectional basis. Average math SAT scores are evidence of the strength and eff ectiveness of each state’s mathematics and critical-thinking curriculum. American College Testing Assessment (ACT) scores, like SAT scores, provide colleges and universities with a means of measuring students’ aptitude as well as an instrument to predict academic performance during the fi rst year of college.
Another component of the index, the prevalence of bachelor’s degrees, signals both the level of educational attainment and the type of skills that are demanded by the fi rms in a given state. Breaking it down further, the share of bachelor’s degrees granted in science or engineering fi elds demonstrates where professional interests lie among the college student population. Measuring the number of recent degrees granted in science or engineering (including bachelor’s, master’s, and PhD degrees) allows stakeholders and policy makers to assess momentum and popularity, and guides future eff orts to attract students. Since fi rms typically rely on research labor from nearby universities, a large pool of available support is a considerable asset and a valuable amenity that fi rms take under consideration when choosing a location.
The total number and the percentage of the population with advanced degrees indicate a state labor pool’s sophistication and level of skill development. Another measure included is the concentration of PhD degree holders.
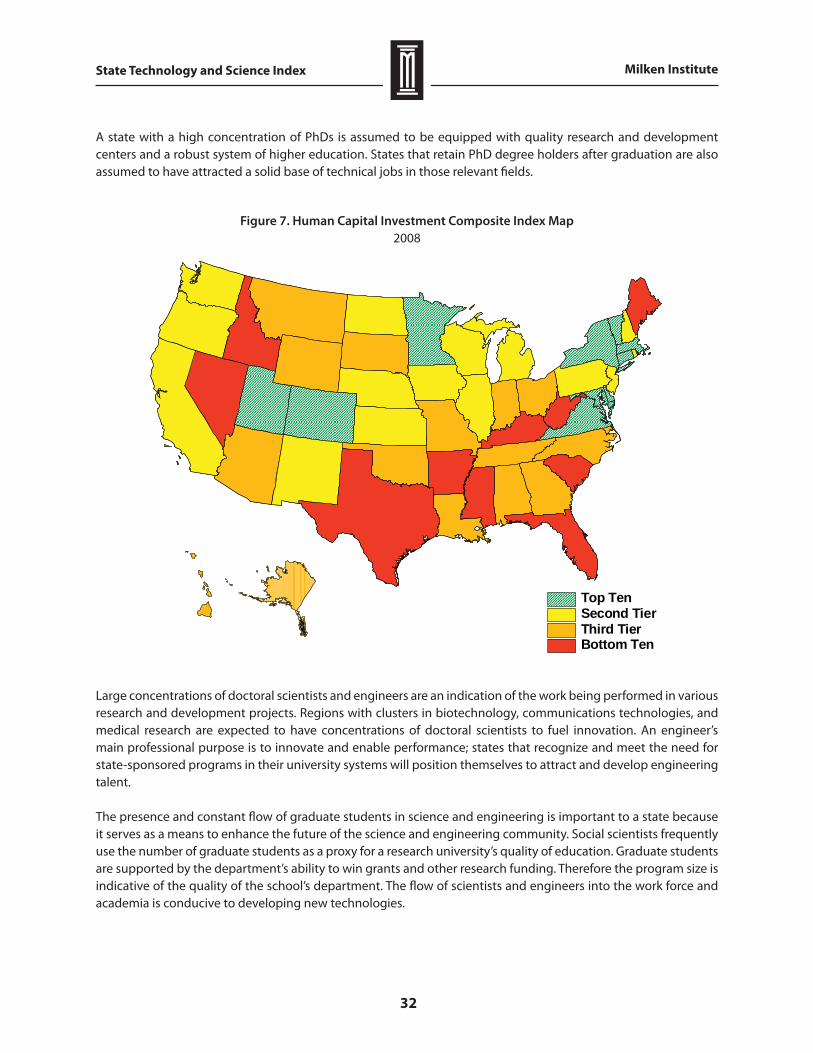
32
Milken InstituteState Technology and Science Index
A state with a high concentration of PhDs is assumed to be equipped with quality research and development centers and a robust system of higher education. States that retain PhD degree holders after graduation are also assumed to have attracted a solid base of technical jobs in those relevant fi elds.
Figure 7. Human Capital Investment Composite Index Map
2008
Top TenSecond TierThird TierBottom Ten
Large concentrations of doctoral scientists and engineers are an indication of the work being performed in various research and development projects. Regions with clusters in biotechnology, communications technologies, and medical research are expected to have concentrations of doctoral scientists to fuel innovation. An engineer’s main professional purpose is to innovate and enable performance; states that recognize and meet the need for state-sponsored programs in their university systems will position themselves to attract and develop engineering talent.
The presence and constant fl ow of graduate students in science and engineering is important to a state because it serves as a means to enhance the future of the science and engineering community. Social scientists frequently use the number of graduate students as a proxy for a research university’s quality of education. Graduate students are supported by the department’s ability to win grants and other research funding. Therefore the program size is indicative of the quality of the school’s department. The fl ow of scientists and engineers into the work force and academia is conducive to developing new technologies.
33
Milken InstituteState Technology and Science Index
Postdoctoral work is crucial to holders of PhDs and institutions alike because it allows degree-holders to further their knowledge in their fi eld of intellectual interest. Postdocs typically choose an institution based solely on its reputation and research. Their salaries are minimal. A larger postdoctoral population is an indicator of an institution’s prestige.
States can use their budgets to compete for graduate-level talent by funding universities and off ering favorable fi nancial aid packages to attract students to their institutions of higher learning. State appropriations for higher education show how much money is being allocated by the state to run its junior college and university systems. Increases in state appropriations for higher education give analysts insight into shifts in state spending patterns, and whether states are making wise investments in their future labor forces.
The indicator on home computer penetration illustrates the extent to which the population is technically profi cient. Penetration coupled with Internet access allows access to resources, both commercial and educational, for which residents might otherwise have to travel long distances.
The 2008 edition of the State Technology and Science Index reveals signifi cant changes in the Human Capital Investment Composite Index rankings. With an overall score of 78.19, Maryland took the lead from Colorado by demonstrating progress in eight of the twenty indicators. The clearest areas of improvement contributing to the state’s performance were in percentage of bachelor’s degrees granted in science and engineering as well as the magnitude of change in state appropriations for higher education (Maryland moved up twenty-eight and fi fteen positions in these measures, respectively). Massachusetts moved up one position to capture 2nd place in overall human capital investment with a score of 77.90. Colorado’s slip in the rankings (to 3rd place) was not due to any particularly poor performance, but rather to an overall softening. Connecticut and Minnesota round out the top fi ve. Connecticut achieved this through its performance in doctoral degrees relative to the population as well improvements in its home computer and Internet access indicators. Minnesota’s 5th-place fi nish represents a drop from the 2nd spot.
New York scores well in the number of master’s degrees in science and engineering relative to the work force population. Utah moves up four positions, cracking the top ten. Vermont slips to 9th place, but ranks 1st in the percentage of bachelor’s degrees in science and engineering relative to the workforce population. Virginia placed strongly by fi nishing in the top ten for seven of the twenty indicators. Delaware completes the top ten list, demonstrating strength in the number of doctoral engineers and scientists.
In the 2008 composite index for all measures of human capital investment, the spread between the best- and the worst-performing states widened. Taking a look at the bottom of the list, we fi nd that Nevada fell one place and now ranks last in the nation. It scores in the bottom ten in more than half of the indicators; its best showing is for percent change in state appropriations for higher education, where it ranks 20th for growth. Arkansas remains at 49th, ranking in the top ten for verbal SAT scores but 50th for doctoral engineers. South Carolina is consistently in the bottom ten except for a startling 2nd-place performance in state spending on student aid per capita. Mississippi ranks 47th, unchanged from the 2004 index. Florida’s worst performance is in the measure of doctoral scientists. Kentucky remains at par with its 2004 rankings, but improved in overall rankings for pre-college indicators (SAT and ACT scores). Texas is a new entry, placing in the bottom ten in three indicators and losing ground in the percentage of recent bachelor’s degrees granted in science and engineering relative to the work force. West Virginia, once dead last on the list in 2004, has climbed seven positions to 43rd place. Maine scores 38.19, placing 42nd. Despite fi nishing in the bottom ten, Idaho has a high percentage of computer penetration and Internet access and places 20th in terms of the number of doctoral engineers (in keeping with the fact that it is home to fi rms like Micron, and Hewlett-Packard has a large presence as well).

34
Milken InstituteState Technology and Science Index
Nebraska demonstrated the greatest improvement in human capital investment indicators, climbing from 25th to 11th place. This achievement is due to a variety of factors: not only did Nebraska’s computer penetration and Internet access rise dramatically since the last index was released in 2004, but state spending on student aid per capita has skyrocketed from nearly the bottom ten in the nation to 9th place. Doctoral degrees relative to the population and the recent PhDs awarded in science and engineering relative to the total work force have also undergone remarkable improvements.
Pennsylvania was another strong mover, advancing ten positions due to its strength in recent graduates in all levels of science and engineering. New Hampshire’s notable strength since the last release is in the percentage of bachelor’s degrees in science and engineering relative to its work force. North Carolina, Rhode Island, and West Virginia each improved seven positions. North Carolina’s high school students made notable improvements in SAT and ACT scores. Rhode Island’s new strength lies in diff erent levels of science and engineering, from number of graduate students to number of postdocs awarded. West Virginia climbed in the percentage of bachelor’s degrees in science and engineering relative to the work force as well as the number of PhDs awarded in science and engineering.
Table 4. Human Capital Investment Composite Index
State rankings, 2008
StateRank 2008
Rank 2004
Rank change 2004 to 2008
Score 2008 State
Rank 2008
Rank 2004
Rank change 2004 to 2008
Score 2008
Maryland 1 4 3 78.19 North Carolina 26 33 7 51.62Massachusetts 2 3 1 77.90 Missouri 27 26 -1 49.81Colorado 3 1 -2 74.86 Hawaii 27 29 2 49.81Connecticut 4 6 2 73.81 Montana 29 34 5 49.62Minnesota 5 2 -3 70.86 South Dakota 30 36 6 48.95New York 6 10 4 69.90 Wyoming 31 23 -8 48.19Utah 7 11 4 68.29 Alaska 32 31 -1 46.19Virginia 8 14 6 67.62 Arizona 33 35 2 46.00Vermont 9 5 -4 67.05 Louisiana 34 37 3 45.71Delaware 10 13 3 65.14 Indiana 35 30 -5 44.29Nebraska 11 25 14 64.95 Ohio 36 28 -8 42.76New Hampshire 12 21 9 64.19 Alabama 37 42 5 42.48California 13 7 -6 64.10 Georgia 38 43 5 40.57Pennsylvania 14 24 10 62.76 Oklahoma 39 41 2 39.81Rhode Island 15 22 7 62.10 Tennessee 40 40 0 39.14Washington 16 8 -8 62.10 Idaho 41 39 -2 38.86Iowa 17 16 -1 61.52 Maine 42 32 -10 38.19Illinois 18 17 -1 60.76 West Virginia 43 50 7 35.52Kansas 19 9 -10 60.38 Texas 44 38 -6 34.86New Mexico 20 15 -5 58.29 Kentucky 45 45 0 34.67New Jersey 21 12 -9 57.62 Florida 46 44 -2 32.95North Dakota 22 27 5 57.43 Mississippi 47 47 0 26.29Wisconsin 23 18 -5 55.71 South Carolina 48 48 0 24.95Michigan 24 19 -5 55.24 Arkansas 49 46 -3 23.90Oregon 25 20 -5 54.76 Nevada 50 49 -1 23.81
State average 52.29

35
Milken InstituteState Technology and Science Index
Technology and Science Work Force
Background and Relevance
A skilled technical and scientifi c work force is a requirement for successfully converting innovation into commercially viable products and services. The most economically successful places are those with businesses whose innovation systems are organized in a collaborative framework, with research, design, and production engaging in a dynamic, interactive learning process.60 Research and design is more eff ective if it occurs near production operations. The technical and scientifi c work force of a region propels its technological sophistication, innovation, and economic growth—not only for technology fi rms, but for all fi rms where innovation is a key competitive advantage.
A region with a high concentration of skilled technical and science workers has another advantage: industry clustering pools workers, creating a labor force with industry-specifi c skills.61 Companies situating themselves near technology clusters benefi t in terms of positive knowledge spillovers as well as agglomeration eff ects. As design engineers, programmers, biologists and the like migrate to a particular geographic cluster or remain in a cluster after graduating from local institutions, they reinforce that region’s initial advantages, stimulating further localized growth. In this way, a region gains the most fundamental source of its competitive advantage: highly mobile, geographically discriminating labor assets.
In a local high-velocity labor market, scientifi c and technical workers benefi t from the opportunity to move from one employer to another. Firms also benefi t when there is local technical talent that possesses the industry-specifi c skills they require, reducing the fi rms’ search costs. The ease with which locations can assemble, circulate, and reassemble teams of highly skilled workers helps to foster new fi rm formation and sustains mature technology fi rms.62
Technology spillovers can result from a local high-velocity labor market. New process and product innovations within a cluster can be shared through informal relationships. As labor moves between fi rms, labor-market network relationships evolve as ex-colleagues remain in informal contact with one another.63 This tacit knowledge sharing among technicians and scientists gives their host regions distinct advantages, as workers communicate the latest non-codifi ed advances in their fi elds. Technology- or knowledge-sharing might be perceived by some member fi rms as a negative externality at times, but usually generates a comparative advantage that sharpens the entire cluster’s edge over competing geographic clusters. California’s Silicon Valley provides perhaps the best example of knowledge sharing in a high-velocity labor market.
Business management guru Gary Hamel notes that most fi rms would be sent into cardiac arrest by the high employee turnover in Silicon Valley, but that fl uidity is probably one of the region’s greatest strengths. Hamel states that “every Silicon Valley CEO knows that if you don’t give your people truly exhilarating work … they’ll start turning in their badges.”64 Turnover in Silicon Valley is 20 to 25 percent per year during its periodic high-tech industry growth spurts. The best and the brightest tend to move the most. The region’s skilled technicians and scientists change employers with little hesitation, in constant pursuit of the next killer opportunity.
60. Ross DeVol et al., Manufacturing Matters: California’s Performance and Prospects (Milken Institute, 2002).
61. Paul Krugman, “What’s New About the New Economic Geography?,” Oxford Review of Economic Policy 14, no. 2 (1998).
62. David P. Angel, “High-Technology Agglomeration and the Labor Market,” Understanding Silicon Valley: The Anatomy of an Entrepreneurial Region, ed. Martin Kenney (Stanford: Stanford University Press, 2000).
63. Kenneth J. Arrow, “Economic Welfare and the Allocation of Resources for Invention,” The Rate and Direction of Inventive Activity: Economic and Social Factors (Princeton: Princeton University Press, 1962).
64. Hamel, Leading the Revolution.

36
Milken InstituteState Technology and Science Index
Skilled technical workers create economic value. Despite this recognition, fi rms have diffi culty defi ning what is unique about knowledge and technical workers and how to describe them. Science and technical workers do not just access knowledge and apply it to fi rm-specifi c objectives. More important, they harness new information to generate new knowledge, bringing both inductive and deductive analytic skills to complex problems and creating new concepts and processes. They are able to mold ideas to solve new problems. New knowledge generation can take the form of incremental innovation as well as radical innovation that propels a business into entirely new endeavors.
Science and technology work is based upon complexity and uncertainty; it demands a high degree of independent judgment. The complexity of work runs along a continuum, with routine work at one end and knowledge work at the other. Complex work involves unstructured problems with varying degrees of detail, extended time horizons, imprecise information inputs, and diff use scope. Routine work is characterized by structured problems demanding detail and accuracy, short time horizons, and information with clear formats and narrow scope.65 The second dimension is whether these technicians operate in a collaborative, team environment or as independent operators. A high level of interdependence is characterized by cross-functional and/or team-based organization, while low interdependence involves a single function or single actor.
When most people think of a technical or knowledge worker, they envision an individual specialist who is immersed in a particular fi eld of knowledge. These types of knowledge workers apply and build upon their specialized knowledge through their work. An electrical engineer is an excellent example of just such a knowledge worker. When these individual operators interact with others, it is typically within a community of colleagues. With similar specialized training, they develop both common terms of reference and their own common language fi lled with jargon that others cannot understand.
These scientists, engineers, and other skilled technicians are the new workforce elites. They are either individuals educated in the sciences and engineering fi elds or people who were not educated in these fi elds but hold occupations in these categories. Science and engineering (S&E) workers comprise less than 5 percent of the work force, but contribute far more to regional vitality than these fi gures may indicate.66
In 1999, there were approximately 13 million S&E workers (including all who were trained in these fi elds or employed in these occupations) residing in the United States.67 It is common for these workers to report that research and development is a major focus of their employment. More narrowly defi ned S&E jobs totaled 3.7 million in 2000, an increase of 159 percent between 1980 and 2000. This increase was an annual gain of 5 percent, versus 1.1 percent for all job categories in the United States over that time period. The most remarkable growth was witnessed in mathematics and computer sciences, where employment rose from 177,000 in 1980 to 1.3 million in 2000. But by 2006, the number of narrowly defi ned S&E jobs had fallen to only 3.3 million. The largest drop was in intensity of software engineers and the systems software work force. Part of the problem stems from unreported data, as Washington State (base camp for Microsoft) went unreported in 2006. Nevertheless, this was a general trend as other computer-related analysts and database occupations were hard hit as well even with all states reporting in.
There were substantial changes to median real (infl ation-adjusted) salary for recent S&E graduates in the past decade. Overall, salaries rose 15 percent across all fi elds of degree. The largest jump was recorded by computer and mathematical scientists, with a 20.4 percent increase due to the growing demand for these professions. 68
65. Kessler, Donoghue, and DeLacy, “Knowledge Workers Revealed.”
66. Jarle Moen, “Is Mobility of Technical Personnel a Source of R&D Spillover?,” NBER Working Paper, no. 7834 (2000).
67. “Science and Engineering Indicators–2004.”
68. “Science and Engineering Indicators–2008.” See also: http://www.nsf.gov/statistics/seind08/c3/c3s1.htm.

37
Milken InstituteState Technology and Science Index
In 2003, the median salary for S&E bachelor’s degree holders was $65,000. Median annual earnings (regardless of education level) in S&E occupations were $67,780.
The demand for S&E workers is expected to remain very strong. Looking ahead through 2014, employment in S&E occupations is projected to grow at twice the overall rate as total employment.69 This translates into the need for an additional 2.2 million S&E workers.70
In recent decades, the United States experienced a rapid increase in the immigration of foreign-born scientists and engineers. The knowledge of scientists and engineers can be transferred across borders more easily than other skills because it is more codifi ed. For example, 27 percent of doctorate holders in S&E in the United States were foreign-born in 1999. But after 9/11, new limitations were imposed on H-1B (“high-tech”) visas. Between FY 2001 and FY 2004, the U.S. Department of Homeland Security estimates that H-1B approvals have fallen from 97 percent to 92 percent.71 The quota was a backlash against foreign entry, instituted amid heightened concern for national security. The number of visas granted has been reduced and the process is often delayed due to in-depth background scrutiny.72
Technology-based economic development is largely dependent on the supply of scientifi c and engineering talent required to staff rapidly growing technology fi rms and their larger cousins.73 Innovation and the scientifi c and technical skill base of a region are best combined for maximum performance. For state and local economic development, the message is clear: the quality of scientists, engineers, physicists, systems engineers, and other creative technical workers that a region trains, retains, and attracts will profoundly aff ect its future technology industry development.74
State Rankings
Massachusetts claims 1st place in the Technology and Science Work Force Composite Index; its score of 91.06 refl ects a large and growing lead. Its closest competitor, Colorado, trails by more than four index points at 86.50. Maryland’s score of 84.89 puts it at 3rd place, down one position from the 2004 index. Rounding out the top ten were (in descending order) Washington (83.25), Virginia (79.56), California (75.00), Delaware (74.31), Texas (72.25), Connecticut (72.12), and New Jersey (71.67).
69. “Science and Engineering Indicators–2002.”
70. See Table 3-3 at http://www.nsf.gov/statistics/seind08/c3/c3s1.htm.
71. U.S. Department of Homeland Security, “Characteristics of Specialty Occupation Workers (H-1B): Fiscal Year 2004” (2004).
72. Vivek Wadhwa, “The Visa Shortage: Big Problem, Easy Fix,” BusinessWeek, October 17, 2007.
73. Michael H. Best, The New Competitive Advantage: The Renewal of American Industry (New York: Oxford University Press, 2001).
74. Joel Kotkin, The New Geography: How the Digital Revolution Is Reshaping the American Landscape (New York: Random House, 2002).

38
Milken InstituteState Technology and Science Index
Figure 8. Technology and Science Work Force Composite Index
Top ten states, 2008
NJCTTXDECAVAWAMDCOMA
95
90
85
80
75
70
Score
Source: Milken Institute.
The Technology and Science Work Force Composite Index is intended to measure the current work force and therefore the current supply of research and innovative capacity in specifi c fi elds of high-tech employment. These occupations chosen as indicators for the index are considered the foundations of a high-tech economy and thus convey the entrepreneurial activity present in each region.
We have divided the technology and science work force into three distinct general fi elds: computer and information science, life and physical scientists, and engineers. This division allows us to investigate the overall strength of these fi elds.
The fi rst component, intensity of computer and information science (IS) experts, is calculated by averaging the intensity scores of six diff erent types of computer and information science–related occupations: computer and information scientists, computer programmers, software engineers, computer support specialists, systems analysts, and database and network administrators. “Intensity” is derived by fi nding the percent share of employment (in computer and information science, in this case) relative to the total state employment.
The indicator for intensity of life and physical scientists is calculated by averaging the intensity scores of six diff erent types of life and physical science–related occupations: agricultural and food scientists, biochemists and biophysicists, microbiologists, medical scientists, physicists, and miscellaneous life and physical scientists. These occupations are important to a region’s scientifi c community because they provide support and promote entrepreneurial activities.
The intensity of engineers indicator is calculated by averaging the intensity scores of six diff erent types of engineering-related occupations: electronics engineers, electrical engineers, computer hardware engineers, biomedical engineers, architectural engineers, and other engineers. Engineers drive a region’s vitality, as they design and construct everything from the largest of bridges to the tiniest, most intricate medical devices. Their role in the economy’s innovation and prosperity is undeniable.

39
Milken InstituteState Technology and Science Index
In the four years that have passed since the last release of the State Technology and Science Index, many U.S. fi rms have outsourced “back-offi ce” support operations, relocating these functions to overseas locales like India and the Philippines where labor costs are cheaper. While there is concern about the loss of these jobs, states like California are looking ahead, rebuilding the computer platform and retooling applications for the next generation of more niche-driven computer systems, leaving service-driven occupations to places with lower labor costs. Therefore, rankings for computer and IS experts will continue to represent a signifi cant portion of the state’s work force and economic well-being.
We should also note that the methodology used to compile the 2008 index has changed since the report’s last release in 2004. The new methodology does not penalize states for not reporting employment statistics to the BLS. Instead, scores for states with missing data will only be tallied in those categories for which the state does supply data. These scores are then averaged in order to derive the Technology and Science Work Force Composite Index overall score and rankings. States are only accountable for scores that are reported.
Figure 9. Technology and Science Work Force Composite Index Map
2008
Top TenSecond TierThird TierBottom Ten
Just as in the 2004 edition, Massachusetts is the leader by a large margin in the Technology and Science Work Force Composite Index. Its 1st-place ranking in intensity of all types of engineers outpaced its closest competitor by a whopping ten index points, contributing to its overall win. In addition, although it ranks 1st in only two (medical scientists and biomedical engineers) of the eighteen individual occupation indicators that comprise the Technology and Science Work Force Composite Index, its margin is substantial in both.

40
Milken InstituteState Technology and Science Index
In two of the three intensity group composites (life and physical scientists and engineers), Colorado placed 2nd. Maryland recorded its strongest performance in the composite for computer and information scientists, and ranked 3rd with an overall score of 84.89.
Washington, ranked 4th with an overall score of 83.25, owes its position to the numbers of engineers and computer and IS experts within the state work force. Virginia, home to fi rms that work closely with the federal government, is not surprisingly in the top fi ve with a score of 79.56. California comes in at 6th, a drop from its previous spot in 3rd place. The data informing this index still refl ects the aftermath of dot-com slump, which hit California hard, but the state was nevertheless able to remain in the top ten due to its diversity of tech occupations. Delaware makes it entrance at 7th with an overall score of 74.31, posting a noteworthy seventy-seven life and physical scientists for every 100,000 workers. Texas retains its 8th-place position with a score of 72.25. Despite the economic downturn, Connecticut continues to improve its concentration of computer system analysts. New Jersey, with a score of 71.67, performed well, placing in the top ten in ten of the eighteen diff erent indicators.
At the opposite end of the spectrum, Wyoming comes in at 50th place with a score of only 18.50. Its strongest performance was a 3rd-place fi nish in intensity of ”other” engineers, a category that includes engineers working in petroleum, nuclear, mining and geological, industrial, and environmental fi elds. West Virginia fares only somewhat better, coming in at 49th place with an overall score of 25.50. Both Wyoming and West Virginia dropped fi ve positions since the 2004 State Technology and Science Index was published. Nevada’s lowest ranking is in database and network administrators. Mississippi is ranked 47th overall and 40th in intensity of life and physical scientists. Louisiana improved two positions to 46th place, performing best in intensity of agricultural engineers. Arkansas has improved four positions, and broke into the top ten for microbiologists. Maine has slipped seven positions to 44th place. Alaska and Kentucky are moving in opposite directions (Alaska fell four spots while Kentucky rose by a similar margin, with its improvement led by an 18th-place showing in agricultural and food scientists, up from 46th place). Oregon, coming in 41st with an overall score of 38.77, fell by a dramatic seventeen spots from the 2004 index.
Four states recorded double-digit gains in the Technology and Science Work Force Composite Index since the release of the 2004 index. Delaware posted the greatest improvement, jumping an impressive twenty-two positions. Building on its past strength in attracting biochemists and biophysicists, it has built new concentrations of talent in fi elds including microbiologists and other life and physical scientists. Vermont also demonstrated strong improvement, rising seventeen positions to 19th place. Wisconsin was also a strong mover, climbing sixteen positions. It posted top-ten performances in eight of the eighteen indicators, showing remarkable improvements in twelve categories. Climbing fourteen spots overall, New Hampshire rose from 31st to 14th for intensity of computer and information scientists. Hawaii and Rhode Island almost merit a mention, as both states improved by eight positions in the Technology and Science Work Force Composite Index.

41
Milken InstituteState Technology and Science Index
Table 5. Technology and Science Work Force Composite Index
State rankings, 2008
StateRank 2008
Rank 2004
Rank change 2004 to 2008
Score 2008 State
Rank 2008
Rank 2004
Rank change 2004 to 2008
Score 2008
Massachusetts 1 1 0 91.06 Alabama 26 25 -1 57.75Colorado 2 5 3 86.50 Oklahoma 27 28 1 56.82Maryland 3 2 -1 84.89 Nebraska 28 12 -16 56.59Washington 4 7 3 83.25 Idaho 29 34 5 55.69Virginia 5 4 -1 79.56 Georgia 30 11 -19 55.06California 6 3 -3 75.00 Indiana 31 31 0 50.94Delaware 7 29 22 74.31 Hawaii 32 40 8 50.15Texas 8 8 0 72.25 North Dakota 33 35 2 49.82Connecticut 9 9 0 72.12 Iowa 34 41 7 49.73New Jersey 10 6 -4 71.67 Florida 35 27 -8 48.11Utah 11 17 6 70.29 Tennessee 36 33 -3 47.88Minnesota 12 13 1 68.67 New Mexico 37 15 -22 47.00Rhode Island 13 21 8 68.31 South Carolina 38 43 5 46.94Wisconsin 14 30 16 66.89 Montana 39 38 -1 44.00Pennsylvania 15 18 3 66.35 South Dakota 40 42 2 42.67Illinois 16 19 3 66.00 Oregon 41 24 -17 38.77New York 17 20 3 64.35 Kentucky 42 46 4 38.00New Hampshire 18 32 14 63.86 Alaska 43 39 -4 36.67Vermont 19 36 17 61.33 Maine 44 37 -7 34.18Michigan 20 22 2 60.78 Arkansas 45 49 4 32.77North Carolina 21 16 -5 60.71 Louisiana 46 48 2 31.13Arizona 22 10 -12 60.50 Mississippi 47 47 0 30.29Kansas 23 14 -9 60.29 Nevada 48 50 2 26.33Ohio 24 23 -1 60.00 West Virginia 49 44 -5 25.50Missouri 25 26 1 58.94 Wyoming 50 45 -5 18.50
State average 56.38
Technology Concentration and Dynamism
Background and Relevance
The economic winners and losers of the fi rst half of the twenty-fi rst century will be largely determined by where clusters of existing technologies expand and where emerging science-based technologies form. Because knowledge is generated, transmitted, and shared more effi ciently in close proximity, economic activity based on new knowledge has a high propensity to cluster within a geographic area.75 As economic activity is increasingly based on intangible assets, those states with vibrant technology clusters will experience superior economic growth. In other words, if your state has several leading clusters, it will produce more innovations, fewer of which will escape to other regions (or if they do, they will do so at a slower rate).
Regional and state viability is now linked to the ability to establish local technology clusters that are networked with the global business community. The paradox of the global economy is that the enduring competitive advantages lie in location-specifi c competencies: knowledge, work force skills, customer and supplier relationships, entrepreneurial infrastructure, management practices, motivation, and quality-of-place attributes that allow fi rms to thrive. In short, think locally to succeed globally.76
75. DeVol, Blueprint for a High-Tech Cluster: The Case of the Microsystems Industry in the Southwest.
76. Rosabeth Moss Kanter, “Thriving Locally in the Global Economy,” World View: Global Strategies for the New Economy, ed. Jeff rey Garten (Boston: Harvard Business School Publishing, 2000).
42
Milken InstituteState Technology and Science Index
The development of social networks is seen as the medium of transmission to facilitate innovation-based economic development. Firms in close proximity transmit ideas through inter-fi rm links, which often correlate to the movement of labor. Engineers are most likely to have informal linkages while physicists have the least number (though the highest levels) of contacts with people they meet through university relationships. This technology transfer through social capital mobility improves the speed of development and solidifi es cooperation.77 For fi rms, the benefi ts are large. Increasing the number of their highly skilled labor pool is akin to increasing their number of business contacts and size of future expert applicants to draw upon.78
Industry clusters and their associated support infrastructure—especially in those based upon technology agglomerations—are a region’s best defense against being arbitraged in a global cost-minimization game. Firms, and the clusters to which they belong, can mitigate input-cost disadvantages through global sourcing. Location sustainability is contingent upon making more productive use of inputs, based largely on innovation competencies. Clusters linked to the outside world off er their regions access to the best practices and latest industry developments.79 Regions will excel to the extent that their fi rms and their talent can innovate successfully by being in that specifi c location, rather than somewhere else.
To create international comparative advantage in an information-age economy, it is imperative to cluster innovative activity. The spatial dimensions of economic activity are becoming an interesting fi eld of inquiry—space is central to understanding how an economy works.80 Since the late 1980s, there has been renewed interest in “economic geography” mainly because of new statistical tools. If we really lived in a world of constant returns, we would not see such a high level of specialized economic activity within regions. Clustering results from businesses and workers seeking geographic proximity with others engaged in related activities. Increasing returns lead to competitive advantages; the more that is produced, the cheaper it is to make. Such externalities, or what an economist might call agglomeration eff ects, typically arise from three primary sources: labor-force pooling, supplier networks, and technology spillovers.
How do we describe clusters? A common misperception of clusters is that they are based upon a single industry. One single industry might be the core of a cluster, but without its partners, it may not endure for long. Industry clusters are geographic concentrations of sometimes competing, sometimes collaborating fi rms, and their related supplier network.81 They are agglomerations of inter-related industries that foster wealth creation in a region, principally through the export of goods and services beyond its borders.
Clusters depict regional economic relationships—local industry drivers and regional dynamics—more richly and aptly than do standard industrial methods. An industry cluster diff ers from the traditional defi nition of an industry group. It represents an entire value chain of a broadly defi ned industry sector from suppliers to end products, including its related suppliers and specialized infrastructure. A cluster of interdependent linked fi rms and institutions represents a collaborative organization form that off ers its members advantages in effi ciency, eff ectiveness, and fl exibility.82
77. Rupert Waters and Helen Lawton Smith, “Social Networks in High-Technology Local Economies: The Cases of Oxfordshire and Cambridgeshire,” European Urban and Regional Studies 15, no. 1.
78. Albert-Laszlo Barabasi, Linked: How Everything Is Connected to Everything Else and What It Means (New York: Plume, 2003).
79. Diane Coyle, Paradoxes of Prosperity: Why the New Capitalism Benefi ts All (New York: Texere, 2001).
80. Mashisa Fujita, Paul Krugman, and Anthony J. Venables, The Spatial Economy: Cities, Regions, and International Trade (Cambridge: The MIT Press, 1999).
81. Joel Kotkin and Ross DeVol, Knowledge-Values Cities in the Digital Age (Milken Institute, 2001).
82. Michael E. Porter, “Clusters and the New Economics of Competition,” World View: Global Strategies for the New Economy, ed. Jeff rey E. Garten, (Boston: Harvard Business School Publishing, 2000).
43
Milken InstituteState Technology and Science Index
Supplier networks are instrumental to the success of clusters and sustained agglomeration processes. Clusters are internally connected by the fl ow of goods and services, and this local fl ow is stronger than the fl ow linking the cluster to the rest of the local economy. Cluster members usually include governmental and other nongovernmental entities such as public/private partnerships, trade associations, universities, think tanks, and vocational training programs. These institutions provide specialized skill training, education, research, and technical support. Cluster members include both high and low-value activities.83
The key to regional technology sustainability is the diversity of its ecosystem. Locally based innovative technology fi rms that evolve into dominant players are necessary, but not suffi cient for sustaining the system. These newly dominant fi rms assist regions in developing technology-management capabilities that can be leveraged to quicken the pace of innovation for new entrants. Newly formed entrepreneurial fi rms can tap into the technology-management capabilities resident in the region to rapidly exploit emerging technology-market opportunities. Many high-tech regions have developed capabilities for rapid design changes at dominant fi rms, and more importantly, integrating new regional knowledge into new fi rm births.
The process of commercializing emerging technologies requires the ability to manage uncertainty and complexity, as many innovations will be highly disruptive in nature, potentially threatening key regional incumbents. The failures of established incumbents are well cataloged and commercialization models have explicitly incorporated that attackers from the outside are generally required when an emerging technology threatens the existing regime.84 The issues that can leave incumbents ill-prepared stem from the technological doubts, vague market signals, and nascent competitive structures that diff erentiate emerging from established technologies. To cope and triumph requires innovative managerial competencies and new cross-functional skills.85
Sustaining a technology-based ecosystem in a particular region requires more than technology capabilities. Social capabilities are required to promote the ecosystem as well. Discussing leading technology clusters, Rob Koepp points out in his book, Clusters of Creativity, “The progress of these clusters can only be understood if one gets behind how they and the enterprises that populate them have been managed, specifi cally in regards to how management practices facilitate a cluster’s lifeblood of innovation and entrepreneurship—two pillars of economic behavior that are universal to all forms of economic existence, not just the particular sectors of advanced technology with which the Siliconia are so readily associated.”86
Diversity of technology-based clusters is important for regional success as well. A strong agglomeration in one to two technology industries such as telecommunications services or communications-networking equipment can be an economic engine during a boom, but a liability during a bust, as many places have discovered.87 Technology diversity can also act as a virtual unplanned innovation engine. Serendipitous confl uences from seemingly unrelated technology fi elds can create a critical advantage for the host region. Ronald Kostoff , in a broad survey of regional innovation processes, found that “an advanced pool of knowledge must be developed in many fi elds before synthesis leading to innovation can occur.”88 Additionally, technology advances are likely to emerge from cross-disciplinary capabilities. For example, the leading centers of biotechnology may well be those with the proper mix of bioinformatics, mathematics, and microbiology.
83. Porter, On Competition.
84. Richard Foster, Innovation: The Attacker’s Advantage (New York: Summit Book, 1986).
85. George S. Day and Paul J. H. Schoemaker, Managing Emerging Technologies (New York: John Wiley and Sons, 2000).
86. Rob Koepp, Clusters of Creativity: Enduring Lessons on Innovation and Entrepreneurship from Silicon Valley and Europe’s Silicon Fen (Chichester: John Wiley & Sons, 2002).
87. DeVol, America’s High-Tech Economy, Development, and Risks for Metropolitan Areas.
88. R.N. Kostoff , “Successful Innovation: Lessons from the Literature,” Research-Technology Management 60, no. 1 (1994).

44
Milken InstituteState Technology and Science Index
Jacobs’s observations on dynamic externalities for all types of industries in a particular location appear to be prescient for technology fi rms.89 She maintained that these dynamic externalities form based upon communications about production possibilities among fi rms in diff erent industries, as opposed to the specialization or concentration of the same industry. Diversity speeds up the technological adoption process in a collective cumulative process. Vinod Sutaria expands on this in his book The Dynamics of New Firm Formation, in which he states, “Dynamic externalities, through their unpredictable and creative nature, pose a serious threat to the static assumptions of neoclassical theory. The existence of dynamic externalities is expected to stimulate the formation of new fi rms. There is a clear link between them.”90
Technology-based clusters determine which places succeed and which fall behind. Without growth in high-tech industries, states cannot rise to the top of the intangible economy. It is imperative for state and local development offi cials and business leaders to promote high-tech expansion and cluster formation, or they risk substandard economic growth in the future. Although high tech is not the only development strategy to pursue, it is a key distinguishing feature of regional vitality in the twenty-fi rst century.
State Rankings
Utah has claimed 1st place in the Technology Concentration and Dynamism Composite Index in 2008, moving up from 8th place in the 2004 index. Its overall score of 85.40 pushes past 2nd-place Maryland by fi ve index points. Maryland, which took top honors in the Human Capital Investment Composite Index, makes another strong showing here. Third-place Virginia scores 77.40, and relinquishes the leading position it enjoyed in the 2004 index. The remainder of the top ten includes New Mexico (75.00), Colorado (74.40), Arizona (74.20), California (72.60), Washington (72.40), New Jersey (71.60), and New Hampshire (71.33).
Figure 10. Technology Concentration and Dynamism Composite Index
Top ten states, 2008
NHNJWACAAZCONMVAMDUT
86
84
82
80
78
76
74
72
70
Score
Source: Milken Institute.
89. Jane Jacobs, The Economies of Cities (New York: Vintage Books, 1968).
90. Vinod Sutaria, The Dynamics of New Firm Formation (Burlington: Ashgate Publishing Company, 2001).

45
Milken InstituteState Technology and Science Index
The accompanying map depicts each state’s position in the Technology Concentration and Dynamism Composite Index. Unlike the four indices presented earlier, this composite measures technology outcomes. After states pull in fi nancing from public and private sources, invest in human capital, and amass a skilled work force, what results do they produce? This measurement illustrates how effi ciently each state is performing given its many investments. In essence, the composite reveals each state’s entrepreneurial, governmental, and policy-formulating success, or lack thereof. Measuring high-tech employment, payroll activity, net business formations, and growth reveals the successes or failures of regional eff orts.
Figure 11. Technology Concentration and Dynamism Composite Index Map
2008
Top TenSecond TierThird TierBottom Ten
Although the U.S. trade balance in high-tech manufacturing has declined—due mainly to the loss in export shares by U.S. industries producing communications equipment, and offi ce machinery and computers—high-tech services and manufacturing still remain a large component of global manufacturing-sector growth.91 In the latest Science and Engineering Indicator 2008, the United States is still ranked 1st in three of the fi ve high-technology industries (scientifi c instruments, aerospace, and pharmaceuticals) and is ranked 2nd in the other two (communications equipment and offi ce machinery and computers).
High-tech businesses are vitally important to a region’s economic growth, especially since jobs in this sector typically command above-average salaries. The aggregate nature of the high-tech industries also induces similar fi rms to establish themselves in close proximity to take advantage of the economies of scale in knowledge and
91. http://www.nsf.gov/statistics/seind08/c6/c6h.htm#c6h1 (Accessed on March 21, 2008).

46
Milken InstituteState Technology and Science Index
manufacturing as well. Drawing comparisons between employment and establishments in the high-tech sector to salaries being paid to high-tech workers allow analysts to determine the quality of jobs being created in the sector and in the economy as a whole.
The intangible economy is constantly in fl ux. The ability to narrowly examine which high-tech industries are most aff ected by changes in the economy and in global demand allows economists to trace the impact on the state’s economic performance and predict whether there will be consequences for household employment and public policy agendas that are intrinsically tied to corporate revenues and personal income.
Business births are a sign of economic stability and optimism—and business births in the technology sector are particularly important because regional prosperity during the last three decades has been linked to high-tech expansion. The indicator on net formation of high-tech business establishments allows analysts and policy makers to gauge the supplier network and the state of a regional economy.
The component focusing on the number of Technology Fast 500 companies in a state refl ects the success of its high-technology sector in terms of growth and expansion. The presence of Fast 500 companies shows where the fastest-growing privately held companies are located. While the Technology Fast 500 list focuses solely on high-tech fi rms, the Inc. 500 rankings give a general snapshot of all companies. When taken together, they measure how well tech fi rms are performing against a wider playing fi eld.
Examining where technology is prevalent is not the same as examining where technology is growing. The indicator for average yearly growth in high tech aims to capture where technology has grown fastest during the past fi ve years regardless of industry base. Determining the number of industries that are growing faster than the United States on average is key to performing cross-state analysis because it allows analysts to see exactly which industries within the high-tech sector are more successful in diff erent parts of the country than in others. High-tech industries stimulate the economy diff erently according to their location, depending on the size of the region and the corresponding multiplier eff ect.92
Utah leads the Technology Concentration and Dynamism Composite Index in 2008, placing in the top ten in most of the individual indicators and ranking 1st in the nation in net formation of high-tech establishments. With 8.72 percent of its state establishments in high-tech industries (fi nishing 4th in this indicator), Maryland comes in at a distant 2nd place in the composite index with an overall score of 80.40. Virginia, the leader in 2004, has slipped, but still performs well overall with respectable representation in Inc. 500 companies as well as 2nd-place fi nishes in percentage of high-tech establishment births and percent of establishments in high-tech industries. New Mexico has shown the greatest improvement in this composite, zooming up twenty-seven positions to take 4th place with an overall score of 75.00. With 13.1 percent of establishment births occurring in high-tech industries, Colorado ranks 5th in the Technology Concentration and Dynamism Composite Index.
Arizona is another state that has shown considerable momentum, moving up eleven spots into 6th place overall. It holds the distinction of having 1.4 Inc. 500 companies for every 10,000 establishments, a respectable 3rd-place fi nish in that indicator. California has lost ground since the 2004 index, falling from 4th to 7th with a score of 72.60. Washington’s best performance is 1st place in both state payroll and state employment in high-tech industries. New Jersey ranked in the top ten for six of the indicators, with an overall score of 71.60, while New Hampshire just made the top ten with a score of 71.33.
92. Yujeung Ho, “Contribution of High-Technology Industry to Regional Economic Growth at Diff erent Positions in the Distribution of a Region’s Size,” International Review of Public Administration, vol. 12, no. 1 (2007).

47
Milken InstituteState Technology and Science Index
It seems pertinent to point out that in comparing the 2004 and 2008 rankings, the overall spreads for raw scores decreased, indicating greater competition as states struggle to fi nd their comparative advantage with the resources available to them.
At the bottom of the rankings, Louisiana places last (50th) in the Technology Concentration and Dynamism Composite Index, with an overall score of 26.00. Mississippi, which brought up the rear in 2004, improves its position slightly to 49th place. Posting fi fteen high-tech industries growing faster than the U.S. average was Mississippi’s best showing. Ohio, which ranks 48th, was clearly aff ected by the change in the Milken Institute’s defi nition of high-tech industries, which now excludes heavy manufacturing. South Dakota, not a newcomer to the bottom ten, scores 30.25 and ranks 47th. Oklahoma falls fourteen positions to 46th place, ranking dead last in terms of average annual growth for high-tech industries.
West Virginia slips into the bottom ten, as its average annual growth for high-tech industries fell from 2nd in 2004 all the way to 27th in 2008. Tennessee witnessed its worst growth in net formations of high-tech industries. Michigan experienced a tough ride from 23rd in the 2004 index down to 43rd place. Nebraska failed to improve in only two of the eight individual indicators, but its largest slip in rankings occurs in high-tech industries with LQs higher than the national fi gure. Rounding out the bottom ten is Maine, which rose by four positions since 2004 on the strength of improved high-tech employment.
New Mexico, as mentioned earlier, is the clear winner in terms of improvement, climbing up twenty-seven positions and showing the ability to attract high-paying, high-tech occupations into the state. Hawaii also improved dramatically, moving up seventeen positions to 30th place in the overall composite score with a strong jump in the percent of high-tech establishment births. North Dakota’s move up thirteen positions was enhanced by its performance in net formation of high-tech establishments. Arizona and Montana both gained in several growth indicators, improving by eleven positions in 2008.
Table 6. Technology Concentration and Dynamism Composite Index
State rankings, 2008
StateRank 2008
Rank 2004
Rank change 2004 to 2008
Score 2008 State
Rank 2008
Rank 2004
Rank change 2004 to 2008
Score 2008
Utah 1 7 6 85.40 Montana 26 37 11 54.89Maryland 2 6 4 80.40 Indiana 27 19 -8 52.00Virginia 3 1 -2 77.40 Pennsylvania 28 15 -13 51.20New Mexico 4 31 27 75.00 New York 29 25 -4 50.40Colorado 5 2 -3 74.40 Hawaii 30 47 17 49.50Arizona 6 17 11 74.20 Illinois 31 16 -15 47.00California 7 4 -3 72.60 South Carolina 32 36 4 45.20Washington 8 13 5 72.40 Wisconsin 33 30 -3 44.80New Jersey 9 5 -4 71.60 Missouri 33 35 2 44.80New Hampshire 10 7 -3 71.33 North Dakota 35 48 13 43.78Massachusetts 11 3 -8 71.20 Alaska 36 43 7 42.44Idaho 12 22 10 69.20 Wyoming 37 46 9 41.50Rhode Island 13 21 8 66.44 Arkansas 38 44 6 40.60Connecticut 14 14 0 66.20 Iowa 39 41 2 39.80Texas 15 12 -3 65.60 Kentucky 40 33 -7 39.11Oregon 16 18 2 63.60 Maine 41 45 4 38.75Georgia 17 10 -7 63.00 Nebraska 42 38 -4 38.22Kansas 18 20 2 61.60 Michigan 43 23 -20 35.00Minnesota 19 11 -8 61.40 Tennessee 44 42 -2 32.44Florida 19 29 10 61.40 West Virginia 45 39 -6 32.00Delaware 21 9 -12 60.40 Oklahoma 46 32 -14 30.89North Carolina 22 26 4 60.00 South Dakota 47 49 2 30.25Nevada 23 28 5 59.78 Ohio 48 24 -24 28.80Vermont 24 27 3 57.40 Mississippi 49 50 1 27.78Alabama 25 34 9 57.00 Louisiana 50 40 -10 26.00
State average 54.12

48
Milken InstituteState Technology and Science Index
Overall Findings
The State Technology and Science Index takes inventory of the technology and science assets that can be leveraged to promote economic development in each state. These include research and development capabilities that can be commercialized, along with the entrepreneurial capacity and risk capital infrastructure that determine the success rate of converting research into commercially viable technology services and products. Human capital is the most important intangible asset, and our index has found multiple ways of measuring investments and achievements in this area. The index also examines the intensity of each state’s technology and science work force to learn whether there is suffi cient high-end technical talent on the ground. And fi nally, the index measures technology concentration and dynamism, an indicator of outcomes, growth, and eff ectiveness in transforming regional assets into regional prosperity. The value of the overall index lies in the breadth, depth, and relevance of the many indicators it encompasses.
Figure 12. State Technology and Science Index
Top ten states, 2008
RINHUTCTVAWACACOMDMA
85
80
75
70
65
60
Score
Source: Milken Institute.
When all of these factors are combined, Massachusetts once again emerges as the nation’s leader in the 2008 State Technology and Science Index with an overall score of 82.61. Although it claimed the top spot for the third edition in a row, the state’s lead is shrinking. Contributing to this slight slip is an 11th-place fi nish in the Technology Concentration and Dynamism Composite Index, a showing that was off set by 1st-place fi nishes in two other composite indices (Technology and Science Work Force and Research and Development Inputs).
Closing in fast is 2nd-place Maryland, which moved up from number 4 in the 2004 index. Maryland ranks 1st in the nation for Human Capital Investment, and, unlike Massachusetts, it places consistently in the top ten for all fi ve composite indices. Its substantial improvement since the 2004 index indicates that it will be a serious challenger in the future. Foreshadowing Maryland’s rise, the 2004 index predicted the state’s successful commercialization of its intangible assets in the near future, leveraged by its strengths in life sciences and communication technology. Its worst ranking in the 2004 composite indices, a 6th-place fi nish in Technology Concentration and Dynamism, improved to a 2nd-place fi nish in 2008. Alternative assistance, like the Sunny Day Fund, has attracted businesses into the state by providing a more stable creative work force, while new projects like Maryland’s Nanocenter have linked research facilities with industry know-how to promote cutting-edge product development.
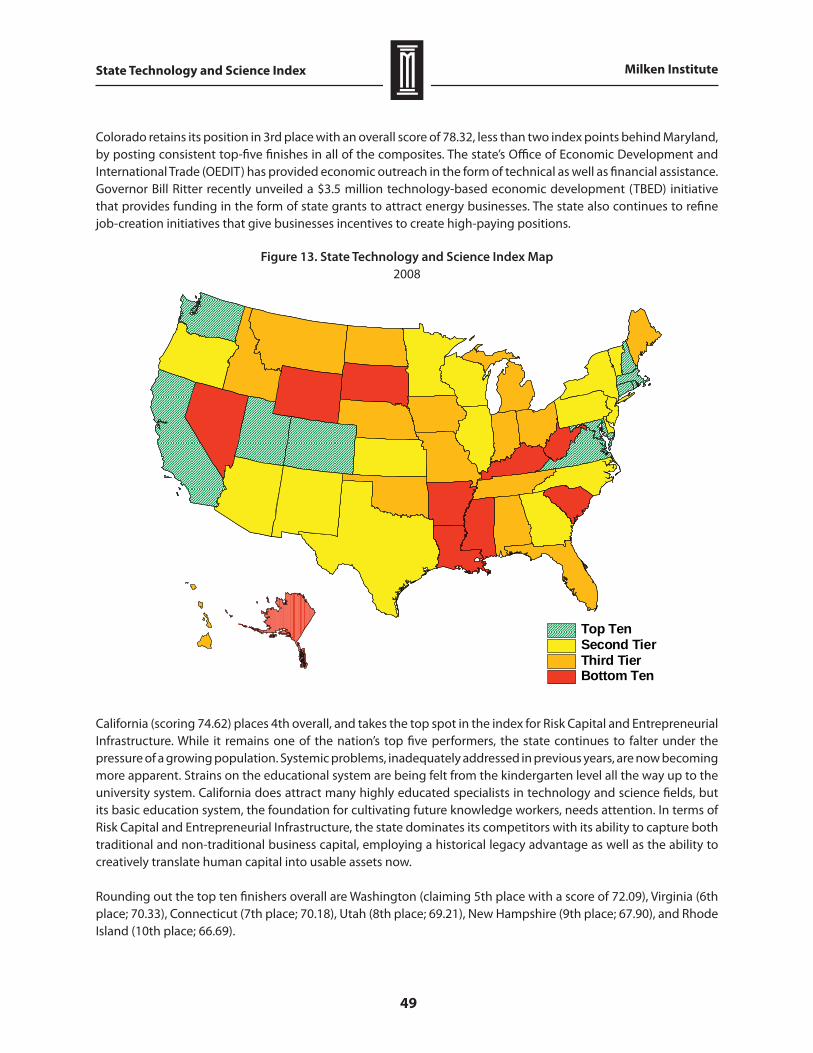
49
Milken InstituteState Technology and Science Index
Colorado retains its position in 3rd place with an overall score of 78.32, less than two index points behind Maryland, by posting consistent top-fi ve fi nishes in all of the composites. The state’s Offi ce of Economic Development and International Trade (OEDIT) has provided economic outreach in the form of technical as well as fi nancial assistance. Governor Bill Ritter recently unveiled a $3.5 million technology-based economic development (TBED) initiative that provides funding in the form of state grants to attract energy businesses. The state also continues to refi ne job-creation initiatives that give businesses incentives to create high-paying positions.
Figure 13. State Technology and Science Index Map
2008
Top TenSecond TierThird TierBottom Ten
California (scoring 74.62) places 4th overall, and takes the top spot in the index for Risk Capital and Entrepreneurial Infrastructure. While it remains one of the nation’s top fi ve performers, the state continues to falter under the pressure of a growing population. Systemic problems, inadequately addressed in previous years, are now becoming more apparent. Strains on the educational system are being felt from the kindergarten level all the way up to the university system. California does attract many highly educated specialists in technology and science fi elds, but its basic education system, the foundation for cultivating future knowledge workers, needs attention. In terms of Risk Capital and Entrepreneurial Infrastructure, the state dominates its competitors with its ability to capture both traditional and non-traditional business capital, employing a historical legacy advantage as well as the ability to creatively translate human capital into usable assets now.
Rounding out the top ten fi nishers overall are Washington (claiming 5th place with a score of 72.09), Virginia (6th place; 70.33), Connecticut (7th place; 70.18), Utah (8th place; 69.21), New Hampshire (9th place; 67.90), and Rhode Island (10th place; 66.69).

50
Milken InstituteState Technology and Science Index
Fifth-place Washington improves its overall ranking, moving up from 6th position in the 2002 and 2004 editions of the index. Led by increasing numbers of patents and small business incubators, Washington continues to foster viable research and business creativity. Virginia, in the 6th spot overall, has been seeking to shore up its future technical work force. It has enlisted the Virginia Biotechnology Association and the Virginia Manufacturing Association to lead a statewide eff ort to recruit, train, and certify skilled manufacturing technicians. The state has fallen one position overall since the 2004 index, running virtually neck-and-neck with 7th-ranked Connecticut and 8th-ranked Utah; these states are separated by a margin of fewer than 1.1 index points.
Connecticut continues to demonstrate its readiness to embrace the elements of a creative economy. As Governor Jodi Rell noted in her 2008 State of the State address, “The creation of jobs is always one of our top priorities. And at a time like this … it’s more important than ever that we focus on economic development.” Recommendations for millions in capital funds to support nanotechnology and assist small businesses that “are responsible for creating the vast majority of new and replacement jobs” are likely to keep the state in good standing.93 Utah ranks 8th overall, and 1st in the Technology Concentration and Dynamism Composite Index. The state has fostered a culture of entrepreneurship; it recently opened another in a series of business incubators. This new $10.7 million facility in Brigham City will provide start-up companies space at subsidized rates as well as providing technical classes, conferences, and a host of business resources. New Hampshire breaks into the top ten overall, moving up from 12th to 9th, boosted by its performance in the Research and Development Inputs Composite Index (where it placed 5th). Rhode Island rounds up the top ten, with its best showing also coming in the R&D composite (6th place).
Table 7. State Technology and Science Index
State rankings, 2008
StateRank 2008
Rank 2004
Rank change 2004 to 2008
Score 2008 State
Rank 2008
Rank 2004
Rank change 2004 to 2008
Score 2008
Massachusetts 1 1 0 82.61 Michigan 26 25 -1 52.27Maryland 2 4 2 80.04 Idaho 27 30 3 51.37Colorado 3 3 0 78.32 Hawaii 28 39 11 51.23California 4 2 -2 74.62 Alabama 29 36 7 49.99Washington 5 6 1 72.09 Missouri 30 31 1 49.62Virginia 6 5 -1 70.33 North Dakota 31 45 14 48.92Connecticut 7 10 3 70.18 Montana 32 38 6 48.15Utah 8 9 1 69.21 Indiana 33 29 -4 47.75New Hampshire 9 12 3 67.90 Nebraska 34 28 -6 47.52Rhode Island 10 11 1 66.69 Iowa 35 37 2 45.90Minnesota 11 8 -3 64.06 Ohio 36 24 -12 45.25New Jersey 12 7 -5 63.44 Florida 37 32 -5 43.76Pennsylvania 13 16 3 63.23 Oklahoma 38 35 -3 41.85Delaware 14 13 -1 62.30 Maine 39 33 -6 41.82New York 15 15 0 62.22 Tennessee 40 34 -6 40.32New Mexico 16 14 -2 61.86 South Dakota 41 47 6 39.64Arizona 17 17 0 61.34 South Carolina 42 44 2 39.12North Carolina 18 20 2 59.63 Wyoming 43 41 -2 38.38Vermont 19 22 3 58.78 Alaska 44 40 -4 37.68Texas 20 23 3 57.78 Nevada 45 43 -2 37.02Illinois 21 21 0 57.19 Louisiana 46 42 -4 35.58Wisconsin 22 27 5 57.12 Kentucky 47 48 1 34.67Oregon 23 19 -4 56.17 Arkansas 48 49 1 32.96Kansas 24 26 2 54.18 West Virginia 49 46 -3 30.49Georgia 25 18 -7 53.30 Mississippi 50 50 0 29.81
State average 53.71
Turning our attention to the opposite end of the spectrum, Mississippi ranks 50th in the overall 2008 index with a score of only 29.81, marking the second time it has held this dubious distinction. In a pitch to improve upon its
93. http://www.ct.gov/governorrell/site/default.asp (Accessed May 16, 2008).
51
Milken InstituteState Technology and Science Index
poor showing (49th position) in Risk Capital and Entrepreneurial Infrastructure, Mississippi has rolled out funds (in House Bill 1724) administrated by the Mississippi Technology Alliance (MTA) to draw attention from venture capitalists. West Virginia slid from 46th place in the 2004 index to 49th place in 2008. In order to retain more of its talented human capital, the state has instituted Bucks for Brains, a research endowment that would help institutions like West Virginia University and Marshall University entice top-level researchers with equipment and laboratories. Arkansas climbed one spot up to 48th, with an improved performance in the Risk Capital and Entrepreneurial Infrastructure Composite Index (in which it rose from 42nd place in 2004 to 31st place in the latest release).
Kentucky achieved a modest improvement of one spot to 47th place overall in 2008, with a positive performance in the growth of companies receiving VC investment in 2005–2006 (it placed 2nd in the nation for this indicator). Louisiana fell from a ranking of 42nd overall in 2004 to 46th, coming in last place in the nation for technology concentration. Forty-fi fth-ranked Nevada is part of a coalition of seventeen states that will expand broadband access to rural counties under a $267 million USDA loan package. Alaska has fallen from 40th in the 2004 index down to 44th place overall in 2008. Wyoming takes the 43rd spot in 2008, falling two notches, while South Carolina moved in the opposite direction, coming in at 42nd to improve by two positions. Rounding out the bottom ten at number 41 overall, South Dakota has announced plans to restructure its existing programs for supporting entrepreneurs by targeting not just new fi rms but also existing businesses.
Examining the overall results for big movers, North Dakota emerges as most improved, moving up an impressive fourteen positions from 45th in the 2002 and 2004 editions of State Technology and Science Index to take 31st place in 2008. Its strong momentum stems from the state government’s commitment to develop “Centers of Excellence.” Unveiled in 2004, this plan earmarks a portion of the state budget to matching funds for universities and colleges that develop Centers of Excellence that foster regional development in science and technology. This $50 million plan, which leverages additional federal and private funding, has already begun to spur R&D, new technology, and job creation in multiple sectors. North Dakota has also been addressing the issue of brain drain by off ering tuition reimbursements of up to $5,000 for students in technology and teaching fi elds who choose to work in-state after graduating from local universities. Another program, Operation: Intern, North Dakota’s Future at Work, seeks to match college students with local employers in order to cement relationships and prevent talent loss.
Hawaii also posted remarkable improvement, climbing eleven spots to rank 28th overall in the 2008 index. The state has focused on attracting small businesses, especially targeting clean energy and life sciences. While part of the strategy is geared toward cultivating strong science education at the pre-college level, the state has also established $5 million in R&D funding for small businesses in particular science and engineering fi elds to commercialize defense-related dual-use technology. Recent legislation also seeks to put Hawaii on the map in terms of becoming a leader in bioenergy and other energy-effi cient technologies. The state’s ambitious clean green goals call for a 72 percent reduction in crude oil consumption and a self-suffi ciency clause to cover 70 percent of the state’s energy needs by 2030 through clean energy sources. These plans are aided by Hawaii’s abundance of geothermal and wind potential as well as the rising transaction cost of importing fuel.
Alabama rose seven positions from 36th to 29th in the 2008 index. The state’s best performance was in the indicator for the number of high-tech industries growing faster than the U.S. average. Montana and South Dakota each improved by six positions in 2008, with South Dakota placing fi rst in the nation for R&D in clean technology, while Montana saw gains in all types of R&D funding sources (academic, industry, and federal).
When analyzing the results of the latest State Technology and Science Index, states must be aggressive about evaluating their relative positions in each of the composite indices in order to assure that they do not lose valuable human and fi nancial capital. The competition is fi erce—and it will surely continue to intensify as the national economy enters a challenging period.

53
Milken InstituteState Technology and Science Index
References
Acs, Zoltan. “How Is Entrepreneurship Good for Economic Growth?” Innovations: Technology, Governance, Globalization 1, no. 1 (2006).
_______. Innovation and the Growth of Cities. Northhampton: Edward Elgar Publishing, 2002.Angel, David P. “High-Technology Agglomeration and the Labor Market.” In Understanding Silicon Valley: The
Anatomy of an Entrepreneurial Region, edited by Martin Kenney, 127–28. Stanford: Stanford University Press, 2000.
Arrow, Kenneth J. “Economic Welfare and the Allocation of Resources for Invention.” In The Rate and Direction of Inventive Activity: Economic and Social Factors, 609–25. Princeton: Princeton University Press, 1962.
Atkinson, Robert D., and Daniel K.Correa. “The 2007 State New Economy Index: Benchmarking Economic Transformation in the States.” http://www.nga.org/Files/pdf/0702INNOVATIONNEWECONOMY.PDF. (Accessed March 14, 2008).
Atkinson, Robert D., and Paul Gottlieb. “The Metropolitan New Economy Index.” 33: Progressive Policy Institute, 2001.
Barabasi, Albert-Laszlo. Linked: How Everything Is Connected to Everything Else and What It Means. New York: Plume, 2003.
Baumol, William J., Robert E. Litan, and Carl J. Schramm. Good Capitalism, Bad Capitalism, and the Economics of Growth and Prosperity. New Haven: Yale University Press, 2007.
Best, Michael H. The New Competitive Advantage: The Renewal of American Industry. New York: Oxford University Press, 2001.
Bok, Derek. Universities in the Marketplace: The Commercialization of Higher Education. Princeton: Princeton University Press, 2004.
Boutellier, Roman, Oliver Gassman, and Maximilian Von Zedtwiz. Managing Global Innovation. New York: Springer, 2000.
Branscomb, Lewis, and Richard Florida. Investing in Innovation: Creating a Research and Innovation Policy That Works. Cambridge: The MIT Press, 1998.
The California Strategic Growth Plan: Governor’s Budget Summary 2008–2009. 2008.Chavez, Jon. “Tackling Ohio’s Electric Rates.” Toledo Blade, June 17, 2007.Coyle, Diane. Paradoxes of Prosperity: Why the New Capitalism Benefi ts All. New York: Texere, 2001.Day, George S., and Paul J. H. Schoemaker. Managing Emerging Technologies. New York: John Wiley and Sons,
2000.DeVol, Ross C. America’s High-Tech Economy, Development, and Risks for Metropolitan Areas. Milken Institute, 1999. Blueprint for a High-Tech Cluster: The Case of the Microsystems Industry in the Southwest. Milken Institute,
2000. _______. “The New Economics of Place.” Milken Institute Review (March 2002).DeVol, Ross C., Armen Bedroussian, Anna Babayan, Meggy Frye, Daniela Murphy, Tomas J. Philipson, Lorna Wallace,
Perry Wong, and Benjamin Yeo. Mind to Market: A Global Analysis of University Biotechnology Transfer and Commercialization. Milken Institute, 2006.
DeVol, Ross C., Armen Bedroussian, Rob Koepp, and Perry Wong. Manufacturing Matters: California’s Performance and Prospects. Milken Institute, 2002.
DeVol, Ross C., and Lorna Wallace. “Student Visa Regulatory Approval Process.” Milken Institute Review 7, no. 1 (2005).
Edwards, Chris. “Entrepreneurial Dynamism and the Success of U.S. High-Tech.” edited by Joint Economic Committee Staff Report, 7–8, 1999.
_______. “Entrepreneurs Creating the New Economy.” edited by Joint Economic Committee Staff Report, 3–5, 2000.

54
Milken InstituteState Technology and Science Index
Engel, Dirk, and Andreas Fier. “Does R&D-Infrastructure Attract High-Tech Start-Ups?” ZEW Discussion Paper 00-30 (2000).
Florida, Richard. The Rise of the Creative Class and How It’s Transforming Work, Leisure, Community and Everyday Life. New York: Basic Books, 2002.
Foster, Richard. Innovation: The Attacker’s Advantage. New York: Summit Book, 1986.Fujita, Mashisa, Paul Krugman, and Anthony J. Venables. The Spatial Economy: Cities, Regions, and International
Trade. Cambridge: The MIT Press, 1999.Gladwell, Malcolm. The Tipping Point: How Little Things Can Make a Big Diff erence. Boston: Back Bay Books, 2000.Glaeser, Edward. “Are Cities Dying?” Journal of Economic Perspectives (1998): 139–60.Gottlieb, Paul D., and Michael Fogarty. Educational Attainment and Metropolitan Growth. Milken Institute, 1999.Greenspan, Alan. Paper presented at the The Conference Board’s 80th Anniversary Dinner, 1996.Gromb, Denis, and Davis Schartstein. “Entrepreneurship in Equilibrium.” NBER Working Paper, no. 9001 (2002):
1–4.Gary Hamel. Leading the Revolution. Boston: Harvard Business School Press, 2000.“Investing in North Dakota’s Energy Sector.” http://www.pomeroy.house.gov/index.asp?Type=B_
BASIC&SEC=%7B3C8AA257-2D7D-4948-A0D2-25AFBE6779D3%7D. (Accessed February 2, 2008).Jacobs, Jane. The Economies of Cities. New York: Vintage Books, 1968. The Nature of Economies. New York: First Vintage Books Edition, 2001.Kanter, Rosabeth Moss. “Thriving Locally in the Global Economy,” World View: Global Strategies for the New Economy.
Boston: Harvard Business School Publishing, 2000.Karlsson, Magnus. “Commercialization of Research Results in the United States: An Overview of Federal and
Academic Technology Transfer.” Swedish Institute for Growth Policy Studies (ITPS), 2004.Kenney, Martin, and Richard Florida. Understanding Silicon Valley: The Anatomy of an Entrepreneurial Region.
Stanford: Stanford University Press, 2000.Kessler, Dennis, Leigh Donoghue, and Anne DeLacy. “Knowledge Workers Revealed.” edited by The Economist
Intelligence Unit and Anderson Consulting, 1998.Koepp, Rob. Clusters of Creativity: Enduring Lessons on Innovation and Entrepreneurship from Silicon Valley and
Europe’s Silicon Fen. Chichester: John Wiley & Sons, 2002.Kostoff , R.N.. “Successful Innovation: Lessons from the Literature.” Research-Technology Management 60, no. 1
(1994).Kotkin, Joel. The New Geography: How the Digital Revolution Is Reshaping the American Landscape. New York: Random
House, 2002.Kotkin, Joel, and Ross DeVol. Knowledge-Value Cities in the Digital Age. Milken Institute, 2001. Krugman, Paul. “What’s New About the New Economic Geography?” Oxford Review of Economic Policy 14, no. 2
(1998): 7–17.Leamer, Edward E. and Michael Storper. “The Economic Geography of the Internet Age.” NBER Working Paper, no.
8450 (2001): 9–12.Mairesse, Jacques. “To Be or Not to Be Innovative: An Exercise in Measurement.” NBER Working Paper, no. 8644
(2001): 5–17.Marshall, Alfred. Principles of Economics. London: MacMillan, 1890.Michelacel, Claudio. “Low Returns in R&D Due to Lack of Entrepreneurial Skills.” In Discussion Paper Series, 1–13:
Centre for Economic Policy Research, 2002.Milken, Michael. Fueling America’s Growth, Education, Entrepreneurship and Access to Credit. Milken Institute, 1994. Moen, Jarle. “Is Mobility of Technical Personnel a Source of R&D Spillover?” NBER Working Paper, no. 7834 (2000):
1–4.Moskowitz, Tobias, and Annette Vissing-Jorgenson. “The Returns to Entrepreneurial Investment. A Private Equity
Premium Puzzle?” NBER Working Paper, no. 8876 (2002).

55
Milken InstituteState Technology and Science Index
Plummer, Paul, and Mike Taylor. “Theories of Local Economic Growth (Part 2): Model Specifi cation and Empirical Validation.” Environment and Planning A 33, no. 3 (2001): 385–98.
Porter, Michael E. On Competition. Boston: Harvard Business Review Book Series, 1998._______. “Clusters and the New Economics of Competition.” In World View: Global Strategies for the New Economy,
ed. by Jeff rey E. Garten. Boston: Harvard Business School Publishing, 2000.Porter, Michael E. and Scott Stern. “The New Challenge to America’s Prosperity: Findings from the Innovation Index.”
Council on Competitiveness, 1999.Reuters. “Ohio Leads the Way for Start-up Business Success in the Polymer Industry.” January 8, 2008.Reynolds, Paul D., and Michael Hay. “Global Entrepreneuriship Monitor: 1999 Executive Report.” 9–10: Kauff man
Center for Entrepreneurial Leadership at the Ewing Marion Kauff man Foundation, 1999.Romer, Paul. “Increasing Returns and Long Run Growth.” Journal of Political Economy 94 (1986): 1002–37.Rosenfeld, Stuart. “A Governor’s Guide to Cluster-Based Economic Development.” 13–15: National Governors
Association, 2002.Rowen, Henry. “Serendipity of Strategy: How Technology Markets Came to Favor Silicon Valley.” In The Silicon Valley
Edge, 184–93. Stanford: Stanford University Press, 2000.Schumpeter, J.A. The Theory of Economic Development. Cambridge: Harvard University Press, 1934.“Science and Engineering Indicators–2002.” edited by National Science Board, National Science Foundation,
2002. “Science and Engineering Indicators–2004.” edited by National Science Board, National Science Foundation,
2004. “Science and Engineering Indicators–2008.” edited by National Science Board, National Science Foundation,
2008. U.S. Department of Agriculture, Economic Research Service, “State Fact Sheets: North Dakota,” http://www.ers. usda.gov/Statefacts/ND.htm. (Accessed April 2, 2008).U.S. Department of Homeland Security. “Characteristics of Specialty Occupation Workers (H-1b): Fiscal Year 2004.”
2004.Storper, Michael. The Regional World: Territorial Development in a Global Economy. New York: The Guilford Press,
1977.Sutaria, Vinod. The Dynamics of New Firm Formation. Burlington: Ashgate Publishing Company, 2001.“Technical Note: Defi ning High-Technology Industries.” http://www.nsf.gov/statistics/seind06/c8/c8.cfm?opt=9.
(Accessed April 2, 2008).Thurow, Lester C. Building Wealth: The New Rules for Individuals, Companies, and Nations in a Knowledge-Based
Economy. New York: Harper Collins Publishers, 1999.Thursby, Jerry G., and Marie C. Thursby. “Who Is Selling the Ivory Tower? Sources of Growth in University Licensing.”
Management Science 48, no. 1 (2002): 90–104.Tiebout, Charles. “A Pure Theory of Local Expenditures.” The Journal of Political Economy 64, no. 5 (1956).Tirole, Jean. The Theory of Industrial Organization. Cambridge, The MIT Press, 1988.van Stel, Adriaan Johannes. “Entrepreneurship and Economic Growth: Some Empirical Studies.” EIM Business and
Policy Research in Zoetermeer, 2005.Wadhwa, Vivek. “The Visa Shortage: Big Problem, Easy Fix.” BusinessWeek, October 17, 2007.Waters, Rupert, and Helen Lawton Smith. “Social Networks in High-Technology Local Economies: The Cases of
Oxfordshire and Cambridgeshire.” European Urban and Regional Studies 15, no. 1.Wilson, Paul, and Jim Siegel. “Steel Mill No Longer Considering Ohio.” The Columbus Dispatch. February 22, 2008.Woo, Seokjin. “Tiebout Migration and Retirement of Older Workers.” University of Wisconsin-Madison job market
paper (2005).Yago, Glenn, Thomas Hall, and Juan Montoya. Think Locally–Act Globally: Capital Market Restructuring and Sustainable
Global Economic Growth. Milken Institute, 2000.

57
Milken InstituteState Technology and Science Index
About the Authors
Ross C. DeVol is Director of Regional Economics at the Milken Institute. He oversees the Institute’s research eff orts on the dynamics of comparative regional growth performance, and technology and its impact on regional and national economies. He is an expert on the new intangible economy and how regions can prepare themselves to compete in it. He authored the groundbreaking study America’s High-Tech Economy: Growth, Development, and Risks for Metropolitan Areas, an examination of how clusters of high-technology industries across the country aff ect economic growth in those regions. He also created the Best Performing Cities Index, an annual ranking of U.S. metropolitan areas showing where jobs are being created and economies are growing. Prior to joining the Institute, DeVol was senior vice president of Global Insight, Inc. (formerly Wharton Econometric Forecasting), where he supervised the Regional Economic Services group. DeVol supervised the re-specifi cation of Global Insight’s regional econometric models and played an instrumental role on similar work on its U.S. Macro Model, originally developed by Nobel laureate Lawrence Klein. He was the fi rm’s chief spokesman on international trade. He also served as the head of Global Insight’s U.S. Long-Term Macro Service and authored numerous special reports on behalf of the U.S. Macro Group. He is ranked among the “Super Stars” of Think Tank Scholars by International Economy magazine. DeVol earned his master’s degree in economics at Ohio University.
Anita Charuworn is a Senior Research Analyst in Regional Economics at the Milken Institute. Her projects involve estimating the intergenerational impacts of health improvements on state-level productivity, as well as compiling the State Technology and Science Index. Charuworn received her PhD in economics from the University of California, Irvine, and a bachelor’s degree in economics from the University of California, Los Angeles. Her research examines the distribution impact of public policies on health outcomes, and how intellectual property rights protection drives innovation within pharmaceuticals. Prior to joining the Institute, she worked as a business consultant, advising clients on ways to develop competitive pricing strategies in a global marketplace.
Soojung Kim is a Senior Research Analyst in the Regional Economics group at the Milken Institute. Her research interests are regional economics, economic development, and infrastructure. Her expertise covers econometric modeling, transportation network analysis, and GIS applications. Kim has participated in various research projects on national and regional economic impact analysis applying Input-Output and other applied econometrics models. Prior to her graduate study, she was a transportation researcher at the Seoul Development Institute, funded by the Seoul Metropolitan Government in Korea. Kim received her PhD in urban planning from the University of Southern California, her master’s degree in city planning from Seoul National University in Korea, and her bachelor’s degree from Yonsei University in Korea.

State Technology
and Science Index
Enduring Lessons for the Intangible Economy
by Ross DeVol and Anita Charuwornwith Soojung Kim
June 2008
1250 Fourth StreetSanta Monica, CA 90401
Phone: 310.570.4600Fax: 310.570.4601E-mail: [email protected]