GLOBAL OPPORTUNITY INDEX 2021 - Milken Institute
51
GLOBAL OPPORTUNITY INDEX 2021 Focus on Lan America Oscar Contreras, PhD, Benjamin Smith, Joseph Bendix, and Claude Lopez, PhD
Transcript of GLOBAL OPPORTUNITY INDEX 2021 - Milken Institute

GLOBAL OPPORTUNITY INDEX 2021 Focus on Latin America
Oscar Contreras, PhD, Benjamin Smith, Joseph Bendix, and Claude Lopez, PhD

ABOUT THE MILKEN INSTITUTEThe Milken Institute is a nonprofit, nonpartisan think tank.
For the past three decades, the Milken Institute has served as a catalyst for practical, scalable solutions to global challenges by connecting human, financial, and educational resources to those who need them. Guided by a conviction that the best ideas, under-resourced, cannot succeed, we conduct research and analysis and convene top experts, innovators, and influencers from different backgrounds and competing viewpoints. We leverage this expertise and insight to construct programs and policy initiatives.
These activities are designed to help people build meaningful lives in which they can experience health and well-being, pursue effective education and gainful employment, and access the resources required to create ever-expanding opportunities for themselves and their broader communities.
©2021 Milken Institute
This work is made available under the terms of the Creative Commons Attribution-NonCommercial-NoDerivs 3.0 Unported License, available at creativecommons.org/licenses/by-nc-nd/3.0/.

CONTENTS 1 Executive Summary
2 Introduction
4 Latin America's Performance in GOI 2021
6 Comparison with EMDE Benchmark Group
8 Regional Comparison
12 Top-5 Economies in Latin America
14 Recent Trends in Private Cross-Border Capital Flows to Latin America
17 Components of Private Cross-Border Capital Inflows
19 Composition of Private Cross-Border Capital Inflows
20 Heterogeneity in Private Cross-Border Capital Inflows
24 Heterogeneity in the Composition of Capital Inflows
25 Foreign Direct Investment: A Closer Look
27 Origin of Foreign Direct Investment
28 FDI by Sector
29 Cross-Border Mergers and Acquisitions in Latin America
32 Origin of Acquiring Firms
33 Target Industries and Contract Structure
34 Deal-Making Process: The "ABCD" Companies in Latin America
35 Industry of Acquiring Firms
37 Conclusion: The Road Ahead
39 Appendix: Economy Grouping
41 Endnotes
43 Bibliography
45 Acknowledgments
45 About the Authors

MILKEN INSTITUTE GLOBAL OPPORTUNITY INDEX 1
EXECUTIVE SUMMARY This report uses the 2021 Global Opportunity Index and its different categories to provide an overview of Latin America's attractiveness to foreign investors, especially when compared to other emerging markets and developing economies (EMDE). It also offers an in-depth look at Latin America's global capital inflows (emphasizing their composition and evolution over the past decade) and the regions' cross-border M&A activity.
The report illuminates Latin America's declining ability to attract foreign capital over the past decade and, by doing so, helps to identify opportunities to improve foreign investors' perception of the region.
The analysis shows that when it comes to attracting foreign investors, Latin American countries compare well with other emerging markets and developing economies in the following categories:
• Workforce Talent, which captures the qualifications and diversity of the labor force
• Financial Size and Condition, which reflects the breadth and depth of the existing financial system
However, Latin America underperforms relative to other emerging markets and developing economies in two key areas:
• Business Constraints, including the cost and time required to start a new business and the percentage of firms that identify corruption, labor regulations, and taxes as an impediment to business
• Investors' Rights, which account for the strength of investors' protection, property rights, and instability in government policymaking
Overall, the report highlights that many of the main challenges to foreign investors (and, more broadly, to a sound investment climate in the region) stem from the lack of a strong, transparent, and predictable legal framework, including well-functioning legal and judicial systems. Thus, the analysis suggests that Latin American governments must take concrete measures to strengthen the rule of law and tackle the pervasive corruption that undermines public trust.

MILKEN INSTITUTE GLOBAL OPPORTUNITY INDEX 2
INTRODUCTION Access to foreign capital can play a crucial role in promoting economic growth and development in Latin America. If accompanied by sound policies, the flow of international capital to the region can not only supplement insufficient domestic savings, create new jobs, and increase a country's productive capacity, but it can introduce new technologies (including management and organizational practices) and foster competition and innovation among local firms.
Yet Latin America's ability to attract foreign capital has declined over time, affecting its relative position among emerging markets and developing economies (EMDE). Between 2010 and 2014, the region attracted 28 percent of total global flows directed to these economies, making Latin America the largest recipient among this group of countries. But that fraction decreased to about 22 percent between 2015 and 2019, below that of China (30 percent) and other emerging and developing Asian countries (24 percent).
Whether Latin America can regain its status and return as the primary destination of capital flows among emerging markets and developing economies will depend on its ability to improve foreign investors' perception of the region. In turn, this will depend on Latin America's ability to identify opportunities (relative to its peers) and undertake the appropriate reforms.
This report uses the 2021 Global Opportunity Index and its different categories to provide an overview of Latin America's attractiveness to foreign investors, particularly when compared to other emerging markets and developing economies. The Global Opportunity Index, which provides foreign investors with a broad outlook of a country's investment landscape, is based on a combination of 96 variables organized around five broad categories (each one capturing a different aspect of the country's investment climate): Business Perception, Economic Fundamentals, Financial Services, Institutional Framework, and International Standards & Policy.1 The report also offers an in-depth look at global capital inflows to Latin America (emphasizing their composition and evolution over the past decade) and the regions' M&A landscape.
The analysis illustrates that Latin American countries perform well relative to other emerging markets and developing economies in two areas. The first is Economic Fundamentals—particularly Workforce Talent, which accounts for labor force participation and the workforce's qualifications and diversity. The second is Financial Services—especially Financial Size and Condition, which reflects the existing financial system's breadth and depth.

MILKEN INSTITUTE GLOBAL OPPORTUNITY INDEX 3
By contrast, Latin America lags behind other emerging markets and developing economies in two crucial categories. The first is Business Perception—especially Business Constraints, which include the cost and time required to start a new business and the percentage of firms that identify corruption, labor regulations, and taxes as an impediment to business. The second is Institutional Framework—particularly Investors' Rights, which account for the strength of investors' rights, protection of property rights, and instability in government policymaking.
Overall, the report highlights that a sound macroeconomic framework, such as the one achieved by many of the region's economies, is necessary but not sufficient to attract foreign investors. A healthy investment climate also requires a robust, transparent, and predictable legal framework, including well-functioning legal and judicial systems.
There is no single recipe for success when it comes to attracting and retaining foreign investors. But the report suggests that most Latin American economies would greatly benefit from taking concrete measures to strengthen the rule of law and tackle the pervasive corruption that continues to undermine public trust.

MILKEN INSTITUTE GLOBAL OPPORTUNITY INDEX 4
LATIN AMERICA'S PERFORMANCE IN GOI 2021Figure 1 shows the ranking of the 20 Latin American (LATAM) countries in the Global Opportunity Index, 2021.
With over 100 positions separating the best and worst ranked countries, it is clear that the LATAM region offers a diversity of opportunities for foreign investors.
This heterogeneity becomes more apparent when the Index is disaggregated into its five constituent categories and fourteen sub-categories. These categories capture economic, financial, legal, regulatory, and institutional factors that, when taken together, offer a holistic view of a country's investment landscape.
• Business Perception measures the constraints facing businesses and the ease for businesses to resolve disputes.
• Recovery & Resolution Process
• Business Constraint
• Economic Fundamentals captures a country's macroeconomic outlook, workforce talent, and potential for future innovation and development.
• Future Environment of Growth
• Economic Performance
• Workforce Talent
• Financial Services measures the depth and breadth of a country's access to financial services.
• Financial Access
• Financial Size & Condition

MILKEN INSTITUTE GLOBAL OPPORTUNITY INDEX 5
• Institutional Framework captures the extent to which a country's institutions help or hinder business activity.
• Transparency
• Innovation
• Investors' Rights
• Public Governance
• International Standards & Policy measures how integrated a country is within the international community and the likelihood they will conform to international standards.
• Economic Openness
• Tax & Regulation
• Patent & Trademark
Source: Milken Institute, Global Opportunity Index (2021)
Figure 1: GOI 2021 Ranking
Chile
Uruguay
Costa Rica
Mexico
Panama
Peru
Colombia
Brazil
Argentina
Paraguay
Guatemala
El Salvador
Nicaragua
Guyana
Ecuador
Bolivia
Honduras
Belize
Suriname
Venezuela
51
70
92
67
65
100
106
120
119
110
123
102
85
91
138
130
139
127
137
144
50
60
48
85
71
61
64
62
82
75
101
95
106
125
76
86
104
93
102
129
29
44
45
78
46
63
69
41
80
95
88
82
97
101
81
64
86
72
103
77
30
29
44
59
80
69
58
70
95
117
106
118
131
101
108
140
98
111
128
145
39
55
59
49
82
47
50
92
69
76
77
108
86
101
116
119
121
145
118
112
36
48
55
64
65
66
68
76
88
93
97
99
100
104
111
113
117
118
126
137
Color key for ranking <30 31-60 61-90 91-120 120+
BusinessPerception
EconomicFundamentals
FinancialServices
InstitutionalFramework
InternationalStandards & Policy
Total IndexRanking
MILKEN INSTITUTE GLOBAL OPPORTUNITY INDEX 6
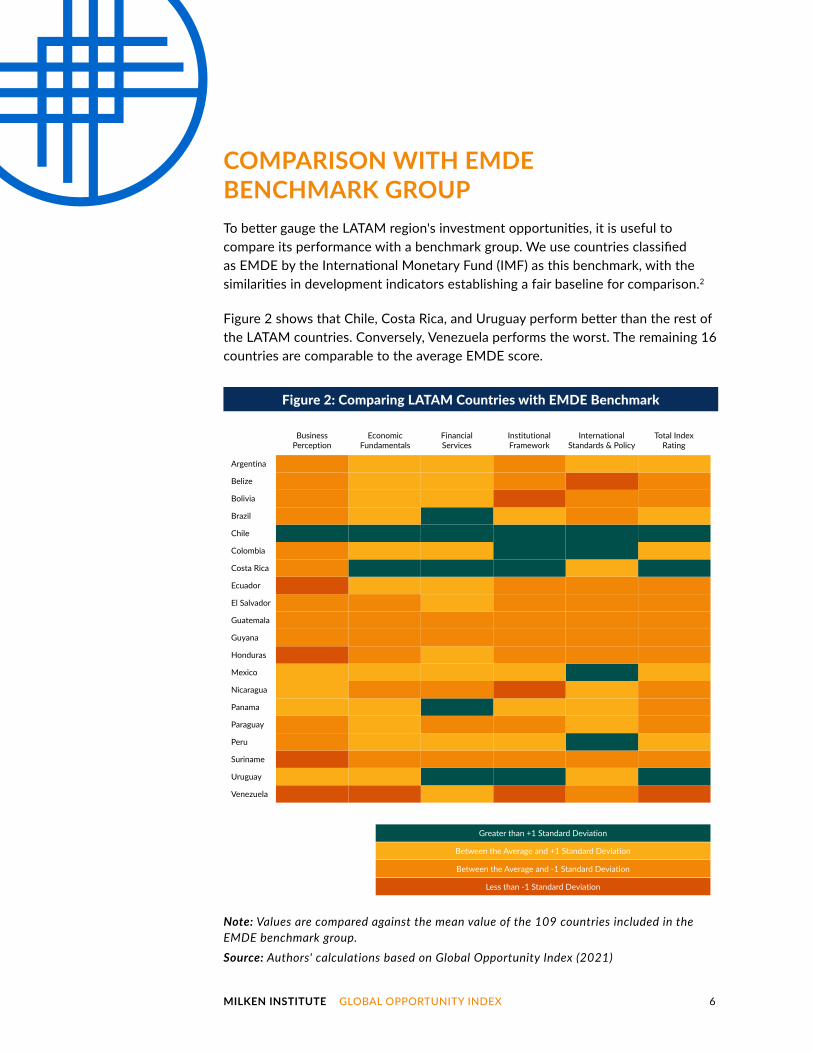
COMPARISON WITH EMDE BENCHMARK GROUPTo better gauge the LATAM region's investment opportunities, it is useful to compare its performance with a benchmark group. We use countries classified as EMDE by the International Monetary Fund (IMF) as this benchmark, with the similarities in development indicators establishing a fair baseline for comparison.2
Figure 2 shows that Chile, Costa Rica, and Uruguay perform better than the rest of the LATAM countries. Conversely, Venezuela performs the worst. The remaining 16 countries are comparable to the average EMDE score.
Note: Values are compared against the mean value of the 109 countries included in the EMDE benchmark group.Source: Authors' calculations based on Global Opportunity Index (2021)
Figure 2: Comparing LATAM Countries with EMDE Benchmark
Argentina
Belize
Bolivia
Brazil
Chile
Colombia
Costa Rica
Ecuador
El Salvador
Guatemala
Guyana
Honduras
Mexico
Nicaragua
Panama
Paraguay
Peru
Suriname
Uruguay
Venezuela
Greater than +1 Standard Deviation
Between the Average and +1 Standard Deviation
Between the Average and -1 Standard Deviation
Less than -1 Standard Deviation
BusinessPerception
EconomicFundamentals
FinancialServices
InstitutionalFramework
InternationalStandards & Policy
Total IndexRating

MILKEN INSTITUTE GLOBAL OPPORTUNITY INDEX 7
Overall, the LATAM region's performance is more homogenous than the EMDE group (see figure 3). Countries from the region perform better than the benchmark group in Economic Fundamentals, Financial Services, and International Standards & Policy. They underperform the benchmark in Business Perception and Institutional Framework.
Note: The figure shows boxplots for each category of the Index and group of countries. Each boxplot displays the upper and lower quartiles of the distribution (upper and lower edges of the box), the median (denoted by the horizontal line inside the box), the mean (represented by the “X” marker), and the maximum and minimum values (whiskers) excluding outliers. See the appendix for a list of countries classified as EMDE.Source: Authors' calculations based on Global Opportunity Index (2021)
Figure 3: LATAM Region Performance against EMDE Benchmark, Category Level
D. Institutional Framework E. International Standards & Policy F. Total Index
A. Business Perception B. Economic Fundamentals C. Financial Services
0
0.1
0.2
0.3
0.4
0.5
0.6
0.7
0.8
0.9
1
0
0.1
0.2
0.3
0.4
0.5
0.6
0.7
0.8
0.9
1
0
0.1
0.2
0.3
0.4
0.5
0.6
0.7
0.8
0.9
1
EMDE BenchmarkLatin America EMDE BenchmarkLatin America EMDE BenchmarkLatin America
Inde
x
Inde
x
Inde
x
0
0.1
0.2
0.3
0.4
0.5
0.6
0.7
0.8
0.9
1
0
0.1
0.2
0.3
0.4
0.5
0.6
0.7
0.8
0.9
1
0
0.1
0.2
0.3
0.4
0.5
0.6
0.7
0.8
0.9
1
EMDE BenchmarkLatin America EMDE BenchmarkLatin America EMDE BenchmarkLatin America
Inde
x
Inde
x
Inde
x

MILKEN INSTITUTE GLOBAL OPPORTUNITY INDEX 8
REGIONAL COMPARISONDisaggregating the EMDE benchmark group by geographic region shows that LATAM compares well with South Asia and only slightly underperforms the Middle East & North Africa region (see figure 4).
At the category level, Latin America is impressive in Economic Fundamentals and Financial Services. In these two categories, it scores higher than all the other regions excluding Europe & Central Asia and East Asia & Pacific.
The LATAM region underperforms in Business Perception and Institutional Framework, with only EMDE countries from Sub-Saharan Africa scoring worse. The region has a mixed performance in International Policy & Standards, with a performance comparable to the Middle East & North Africa and the highest variance among all the categories. Thus, heterogeneity in the LATAM region is most apparent in how countries conform to international standards and how they have integrated within the international community using statecraft tools such as trade agreements and investment treaties.

MILKEN INSTITUTE GLOBAL OPPORTUNITY INDEX 9
Note: The figure shows boxplots for each category of the Index and group of countries. Each boxplot displays the upper and lower quartiles of the distribution (upper and lower edges of the box), the median (denoted by the horizontal line inside the box), the mean (represented by the “X” marker), and the maximum and minimum values (whiskers) excluding outliers. See the appendix for a list of countries classified as EMDE. Caribbean countries are not included as a regional grouping due to insufficient sample size.Source: Authors' calculations based on Global Opportunity Index (2021)
Figure 4: LATAM Region Compared against EMDE Regional Groupings, Category Level
At the sub-category level, the areas where LATAM countries perform well and those where they should improve to increase their overall attractiveness to foreign investors become clearer (see figure 5).
Business Constraint, a sub-category of Business Perception, shows LATAM countries performing worse than any other EMDE region. This sub-category captures the cost and effectiveness of starting a new business and the percentage of firms that identify corruption, labor regulations, and tax as an impediment to business.
D. Institutional Framework
A. Business Perception
E. International Standards & Policy
B. Economic Fundamentals
F. Total Index
C. Financial Services
0
0.1
0.2
0.3
0.4
0.5
0.6
0.7
0.8
0.9
1
EMDE East Asia
& Pacific
EMDE Europe & Central Asia
EMDE Middle East &
North Afric
a
EMDE South Asia
EMDE Sub-Saharan Africa
Latin America
0
0.1
0.2
0.3
0.4
0.5
0.6
0.7
0.8
0.9
1
EMDE East Asia
& Pacific
EMDE Europe & Central Asia
EMDE Middle East &
North Afric
a
EMDE South Asia
EMDE Sub-Saharan Africa
Latin America
0
0.1
0.2
0.3
0.4
0.5
0.6
0.7
0.8
0.9
1
EMDE East Asia
& Pacific
EMDE Europe & Central Asia
EMDE Middle East &
North Afric
a
EMDE South Asia
EMDE Sub-Saharan Africa
Latin America
Inde
x
Inde
x
Inde
x
0
0.1
0.2
0.3
0.4
0.5
0.6
0.7
0.8
0.9
1
EMDE East Asia
& Pacific
EMDE Europe & Central Asia
EMDE Middle East &
North Afric
a
EMDE South Asia
EMDE Sub-Saharan Africa
Latin America
0
0.1
0.2
0.3
0.4
0.5
0.6
0.7
0.8
0.9
1
EMDE East Asia
& Pacific
EMDE Europe & Central Asia
EMDE Middle East &
North Afric
a
EMDE South Asia
EMDE Sub-Saharan Africa
Latin America
0
0.1
0.2
0.3
0.4
0.5
0.6
0.7
0.8
0.9
1
EMDE East Asia
& Pacific
EMDE Europe & Central Asia
EMDE Middle East &
North Afric
a
EMDE South Asia
EMDE Sub-Saharan Africa
Latin America
Inde
x
Inde
x
Inde
x

MILKEN INSTITUTE GLOBAL OPPORTUNITY INDEX 10
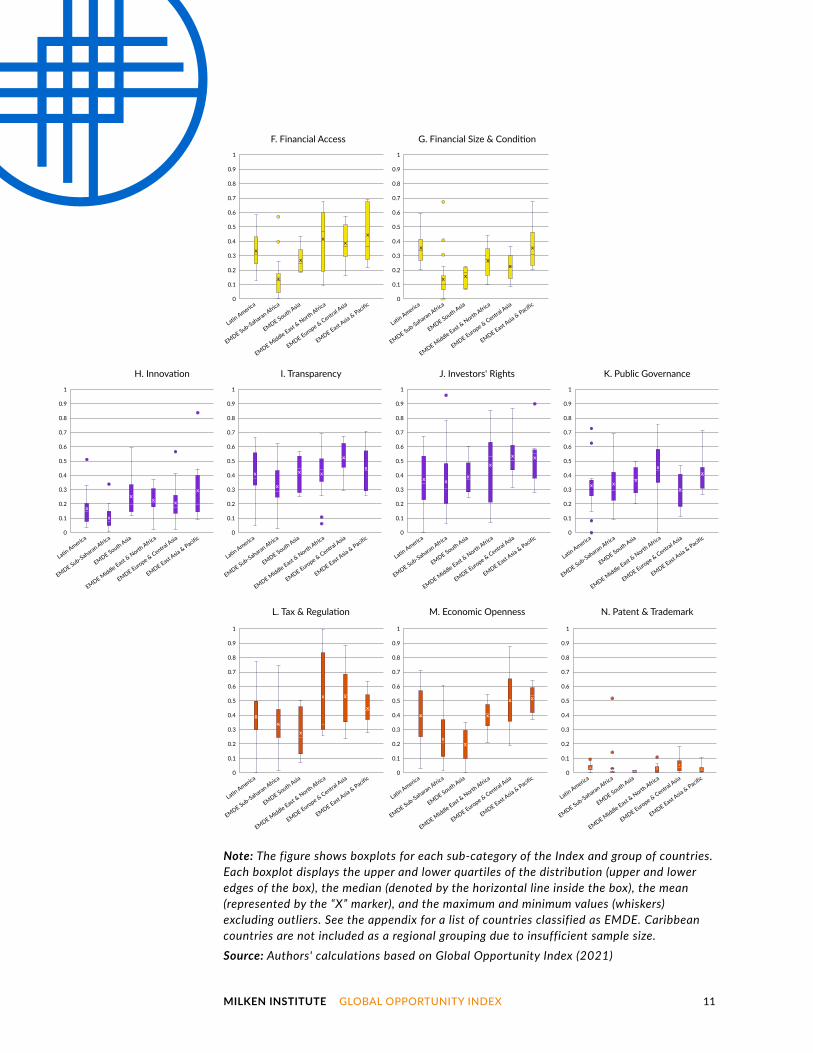
Investors' Rights, a sub-category of Institutional Framework, is another weak point for LATAM countries. This weakness reflects a lack of legitimacy in the rights afforded to investors and instability in government policymaking. This finding is intuitive given the number of investor-state disputes that have involved LATAM countries in recent years, with Mexico, Peru, and Colombia all facing three known disputes in 2019—tied for the highest number of new disputes brought against a single country that year.3
The best sub-categories for LATAM countries are found in Economic Fundamentals and Financial Services. Workforce Talent, a measure of the workforce's qualifications and diversity, is a strong point for the region and is a good sign for investors that prioritize highly skilled workers. Financial Size & Condition, a measure of the existing financial system’s breadth and depth and a good indicator for future business activity, is the region’s other top sub-category.
Figure 5: LATAM Region Compared against EMDE Regional Groupings, Sub-category Level
C. Future Environment of Growth
A. Recovery & Resolution Process
D. Workforce Talent
B. Business Constraint
E. Economic Performance
0
0.1
0.2
0.3
0.4
0.5
0.6
0.7
0.8
0.9
1
EMDE East Asia
& Pacific
EMDE Europe & Central Asia
EMDE Middle East &
North Afric
a
EMDE South Asia
EMDE Sub-Saharan Africa
Latin America
0
0.1
0.2
0.3
0.4
0.5
0.6
0.7
0.8
0.9
1
EMDE East Asia
& Pacific
EMDE Europe & Central Asia
EMDE Middle East &
North Afric
a
EMDE South Asia
EMDE Sub-Saharan Africa
Latin America
0
0.1
0.2
0.3
0.4
0.5
0.6
0.7
0.8
0.9
1
EMDE East Asia
& Pacific
EMDE Europe & Central Asia
EMDE Middle East &
North Afric
a
EMDE South Asia
EMDE Sub-Saharan Africa
Latin America
0
0.1
0.2
0.3
0.4
0.5
0.6
0.7
0.8
0.9
1
EMDE East Asia
& Pacific
EMDE Europe & Central Asia
EMDE Middle East &
North Afric
a
EMDE South Asia
EMDE Sub-Saharan Africa
Latin America
0
0.1
0.2
0.3
0.4
0.5
0.6
0.7
0.8
0.9
1
EMDE East Asia
& Pacific
EMDE Europe & Central Asia
EMDE Middle East &
North Afric
a
EMDE South Asia
EMDE Sub-Saharan Africa
Latin America
MILKEN INSTITUTE GLOBAL OPPORTUNITY INDEX 11
Note: The figure shows boxplots for each sub-category of the Index and group of countries. Each boxplot displays the upper and lower quartiles of the distribution (upper and lower edges of the box), the median (denoted by the horizontal line inside the box), the mean (represented by the “X” marker), and the maximum and minimum values (whiskers) excluding outliers. See the appendix for a list of countries classified as EMDE. Caribbean countries are not included as a regional grouping due to insufficient sample size.Source: Authors' calculations based on Global Opportunity Index (2021)
L. Tax & Regulation
H. Innovation
F. Financial Access
M. Economic Openness
I. Transparency
G. Financial Size & Condition
N. Patent & Trademark
J. Investors' Rights K. Public Governance
0
0.1
0.2
0.3
0.4
0.5
0.6
0.7
0.8
0.9
1
EMDE East Asia
& Pacific
EMDE Europe & Central Asia
EMDE Middle East &
North Afric
a
EMDE South Asia
EMDE Sub-Saharan Africa
Latin America
0
0.1
0.2
0.3
0.4
0.5
0.6
0.7
0.8
0.9
1
EMDE East Asia
& Pacific
EMDE Europe & Central Asia
EMDE Middle East &
North Afric
a
EMDE South Asia
EMDE Sub-Saharan Africa
Latin America
0
0.1
0.2
0.3
0.4
0.5
0.6
0.7
0.8
0.9
1
EMDE East Asia
& Pacific
EMDE Europe & Central Asia
EMDE Middle East &
North Afric
a
EMDE South Asia
EMDE Sub-Saharan Africa
Latin America
0
0.1
0.2
0.3
0.4
0.5
0.6
0.7
0.8
0.9
1
EMDE East Asia
& Pacific
EMDE Europe & Central Asia
EMDE Middle East &
North Afric
a
EMDE South Asia
EMDE Sub-Saharan Africa
Latin America
0
0.1
0.2
0.3
0.4
0.5
0.6
0.7
0.8
0.9
1
EMDE East Asia
& Pacific
EMDE Europe & Central Asia
EMDE Middle East &
North Afric
a
EMDE South Asia
EMDE Sub-Saharan Africa
Latin America
0
0.1
0.2
0.3
0.4
0.5
0.6
0.7
0.8
0.9
1
EMDE East Asia
& Pacific
EMDE Europe & Central Asia
EMDE Middle East &
North Afric
a
EMDE South Asia
EMDE Sub-Saharan Africa
Latin America
0
0.1
0.2
0.3
0.4
0.5
0.6
0.7
0.8
0.9
1
EMDE East Asia
& Pacific
EMDE Europe & Central Asia
EMDE Middle East &
North Afric
a
EMDE South Asia
EMDE Sub-Saharan Africa
Latin America
0
0.1
0.2
0.3
0.4
0.5
0.6
0.7
0.8
0.9
1
EMDE East Asia
& Pacific
EMDE Europe & Central Asia
EMDE Middle East &
North Afric
a
EMDE South Asia
EMDE Sub-Saharan Africa
Latin America
0
0.1
0.2
0.3
0.4
0.5
0.6
0.7
0.8
0.9
1
EMDE East Asia
& Pacific
EMDE Europe & Central Asia
EMDE Middle East &
North Afric
a
EMDE South Asia
EMDE Sub-Saharan Africa
Latin America

MILKEN INSTITUTE GLOBAL OPPORTUNITY INDEX 12
TOP-5 ECONOMIES IN LATIN AMERICAThe remaining portion of this section will focus on the five largest economies in the LATAM region.4 As discussed in greater detail in Section 2, most foreign capital inflows to the region are concentrated among Argentina, Brazil, Chile, Colombia, and Mexico. Therefore, it is fair to assume that investors are particularly attentive to these five countries' performance in the Index.
As figures 6 and 7 show below, Chile is the best performer among the region's largest economies with a strong performance across the five categories. Mexico is also fairly uniform in its performance, except for Financial Services, where it underperforms. Colombia is slightly worse than Mexico, with suppressed scores in Business Perception and Financial Services.
Brazil and Argentina's performance reflects the approach towards attracting foreign investment that has often been associated with the LATAM region, highly skewed toward achieving macroeconomic stability. Both countries perform well in Economic Fundamentals and, to a lesser extent, Financial Services. However, like the region as a whole, there is significant room for improvement in Business Perception and Institutional Framework, reflecting issues of corruption, transparency, and reliable redress for grievances.
Collectively, Chile and Mexico model the performance that the other large economies in the region should endeavor to achieve—a near-uniform competency across all categories, as opposed to a strong performance in one and weakness in the others.

MILKEN INSTITUTE GLOBAL OPPORTUNITY INDEX 13
Note: Values are compared with the mean value of the 109 countries included in the EMDE benchmark group.Source: Authors' calculations based on Global Opportunity Index (2021)
Figure 7: Comparing Top-5 LATAM Economies with EMDE Benchmark Group
Figure 6: Performance of Top-5 LATAM Economies
Source: Authors' calculations based on Global Opportunity Index (2021)
Business Perception
International Standards & Policy
1
.8
.6
.4
.2
0
Institutional Framework
Economic Fundamentals
Financial Services
Brazil Chile Colombia MexicoArgentina
Recovery & Resolution Process
Business Constraint
Future Environment of Growth
Economic Performance
Workforce Talent
Financial Access
Financial Size & Condition
Transparency
Innovation
Investors’ Rights
Public Governance
Economic Openness
Tax & Regulation
BusinessPerception
EconomicFundamentals
FinancialServices
InstitutionalFramework
InternationalStandards& Policy
Patent & Trademark
Greater than +1 Standard Deviation
Between the Average and +1 Standard Deviation
Between the Average and -1 Standard Deviation
Less than -1 Standard Deviation
Argentina Brazil Chile Colombia Mexico

MILKEN INSTITUTE GLOBAL OPPORTUNITY INDEX 14
RECENT TRENDS IN PRIVATE CROSS-BORDER CAPITAL FLOWS TO LATIN AMERICALatin America has long received a relatively small fraction of global capital flows, and this fraction has further declined over the past decade (see figure 8).5 The share of international capital flows going to the region fell from about 7.5 percent in 2010-2014 to about 5 percent in 2015-2019. Furthermore, this decline was not due to an overall reduction in capital flows to emerging and developing economies (see figures 9 and 10). Over the same two periods, inflows to China increased from about 6 to 7 percent of total global flows, and inflows to other emerging and developing Asian markets increased from about 5 to 6 percent. Only emerging and developing Europe experienced a larger reduction than Latin America, with its share in global flows decreasing from about 4 percent during the 2010-2014 period to about 2 percent during 2015-2019.

MILKEN INSTITUTE GLOBAL OPPORTUNITY INDEX 15
Note: See the appendix for a full list of the economies included in the EMDE category.Source: Authors' calculations based on IMF International Financial Statistics (2020)
Figure 8. Private Cross-Border Capital Inflows to Latin America(As a percentage of total inflows)
This reversal in global capital inflows has affected Latin America's relative position among emerging markets and developing economies. Between 2010 and 2014, the region attracted 28 percent of total global flows directed to these economies, making Latin America the largest recipient among this group of countries. But that fraction decreased to about 22 percent during the 2015-2019 period, below that of China (30 percent) and other emerging and developing Asian economies (24 percent).
Share in World Total Share in EMDE Total
0%
5%
10%
15%
20%
25%
30%
35%
2019201820172016201520142013201220112010
7% 7% 7%5% 5% 4%
8%
5%
30% 29%
26% 26%
30%28%
24%
21%22%
17%
9% 9%

MILKEN INSTITUTE GLOBAL OPPORTUNITY INDEX 16
Note: See the appendix for a full list of the economies included in each category.Source: Authors' calculations based on IMF International Financial Statistics (2020)
Note: See the appendix for a full list of the economies included in each category.Source: Authors' calculations based on IMF International Financial Statistics (2020)
Figure 9. Private Cross-Border Capital Inflows by Destination, Share in World Inflows
Figure 10. Private Cross-Border Capital Inflows by Destination, Share in EMDE Inflows
74%
7%
6%
5%
4%
4%
76%
5%
7%
6%
2%4%
Rest of EMDE EconomiesEMDE EuropeEMDE Asia (excl. China)ChinaLatin AmericaAdvanced Economies
A.2010-2014 B. 2015-2019
28%24%
19%
15%
14%
22%30%
24%
7%
17%
2010-2014Average
2015-2019Average
Rest of EMDE EconomiesEMDE EuropeEMDE Asia (excl. China)ChinaLatin America
A.2010-2014 B. 2015-2019
28%24%
19%
15%
14%
22%30%
24%
7%
17%
2010-2014Average
2015-2019Average
Rest of EMDE EconomiesEMDE EuropeEMDE Asia (excl. China)ChinaLatin America
A.2010-2014 B. 2015-2019
74%
7%
6%
5%
4%
4%
76%
5%
7%
6%
2%4%
Rest of EMDE EconomiesEMDE EuropeEMDE Asia (excl. China)ChinaLatin AmericaAdvanced Economies
A.2010-2014 B. 2015-2019
74%
7%
6%
5%
4%
4%
76%
5%
7%
6%
2%4%
Rest of EMDE EconomiesEMDE EuropeEMDE Asia (excl. China)ChinaLatin AmericaAdvanced Economies
A.2010-2014 B. 2015-2019

MILKEN INSTITUTE GLOBAL OPPORTUNITY INDEX 17
COMPONENTS OF PRIVATE CROSS-BORDER CAPITAL INFLOWSFigures 11 and 12 illustrate that while all four types of capital flows to Latin America decreased over the past decade, the decline was particularly large for bank-related and portfolio investment flows. During the 2015-2019 period, cross-border capital flows from banks and other private sources were 96 percent lower than during the previous five years. Between the same two periods, portfolio investment in debt decreased by 60 percent, and portfolio investment in equity decreased by 52 percent. By contrast, the decline in foreign direct investment (FDI) inflows was relatively small—only about 14 percent.
Furthermore, the figures also illustrate that different types of capital flows exhibit significantly different behavior in terms of volatility. This volatility has long been a concern for policymakers in Latin America, given the region's history of economic crises and sharp capital flow reversals.6 The figures show that FDI inflows are (by far) the least volatile component of capital flows, whereas bank-related and other private sources are clearly the most volatile. Portfolio investment inflows fall somewhere in between—and, within this category, portfolio debt tends to be more stable than portfolio equity. Although the volatility of capital flows is partly determined by global conditions, domestic policies can help reduce it—particularly those aimed at promoting macroeconomic soundness and strengthening local banking systems.7
Source: Authors' calculations based on IMF International Financial Statistics (2020)
Figure 11. Private Cross-Border Capital Inflows to Latin America, by Component
A. In US$ Billions B. As a Percentage of GDP
Foreign direct investment Portfolio equity Portfolio debt Banks and other private flows Total
-1%
0%
1%
2%
3%
4%
5%
6%
7%
8%
2019201820172016201520142013201220112010
0
50
-50
100
150
200
250
300
350
400
450
2019201820172016201520142013201220112010
Banks and other private flows TotalPortfolio debtPortfolio equityForeign direct investment
A. In US$ Billions B. As a Percentage of GDP

MILKEN INSTITUTE GLOBAL OPPORTUNITY INDEX 18
Source: Authors' calculations based on IMF International Financial Statistics (2020)
Figure 12. Composition of Private Cross-Border Capital Inflows to Latin America (US$ billions)
Argentina Brazil Chile Mexico OthersColombia Total
A. Total Private Inflows
D. Portfolio Debt
B. FDI
E. Banks of Other Private Flows
C. Portfolio Equity
0
50
100
150
200
250
300
350
400
450
20192018201720162015201420132012201120100
50
100
150
200
250
2019201820172016201520142013201220112010-10
0
10
20
30
40
50
2019201820172016201520142013201220112010
-40
-20
0
20
40
0
80
100
2019201820172016201520142013201220112010-40
-20
0
20
40
60
80
100
120
140
2019201820172016201520142013201220112010
A. Total Private Inflows B. FDI C. Portfolio Equity
D. Portfolio Debt E. Banks and Other Private Flows
OthersMexicoColombiaChileBrazilArgentina Total
0
50
100
150
200
250
300
350
400
450
20192018201720162015201420132012201120100
50
100
150
200
250
2019201820172016201520142013201220112010-10
0
10
20
30
40
50
2019201820172016201520142013201220112010
-40
-20
0
20
40
0
80
100
2019201820172016201520142013201220112010-40
-20
0
20
40
60
80
100
120
140
2019201820172016201520142013201220112010
A. Total Private Inflows B. FDI C. Portfolio Equity
D. Portfolio Debt E. Banks and Other Private Flows
OthersMexicoColombiaChileBrazilArgentina Total

MILKEN INSTITUTE GLOBAL OPPORTUNITY INDEX 19
Note: Importance is calculated by dividing the absolute value of a given type of inflow by the sum of the absolute values of all kinds of flows.Source: Authors' calculations based on IMF International Financial Statistics (2020)
Figure 13. Importance of Various Types of Private Cross-Border Capital Inflows to Latin America
COMPOSITION OF PRIVATE CROSS-BORDER CAPITAL INFLOWSThe recent evolution of the various types of cross-border capital flows to Latin America has led to a gradual shift in its overall composition (see figure 13). For instance, while initially a relatively important component, the significance of bank-related and other private sources declined considerably between 2015 and 2019. Over the same period, the relative importance of portfolio investment in debt also fell, but it remained the second most important component of total inflows. On the other hand, while the volume of portfolio investment in equity has always been relatively small, its overall significance sharply fell during 2018 and 2019. Finally, the decade witnessed a significant increase in the importance of foreign direct investment. The share of FDI in total private cross-border capital inflows to Latin America jumped from about 51 percent in the first part of the decade to just above 72 percent during the 2015-2019 period.
0%
20%
40%
60%
80%
100%
2019201820172016201520142013201220112010
Banks and other private flowsPortfolio debtPortfolio equityForeign direct investment
MILKEN INSTITUTE GLOBAL OPPORTUNITY INDEX 20
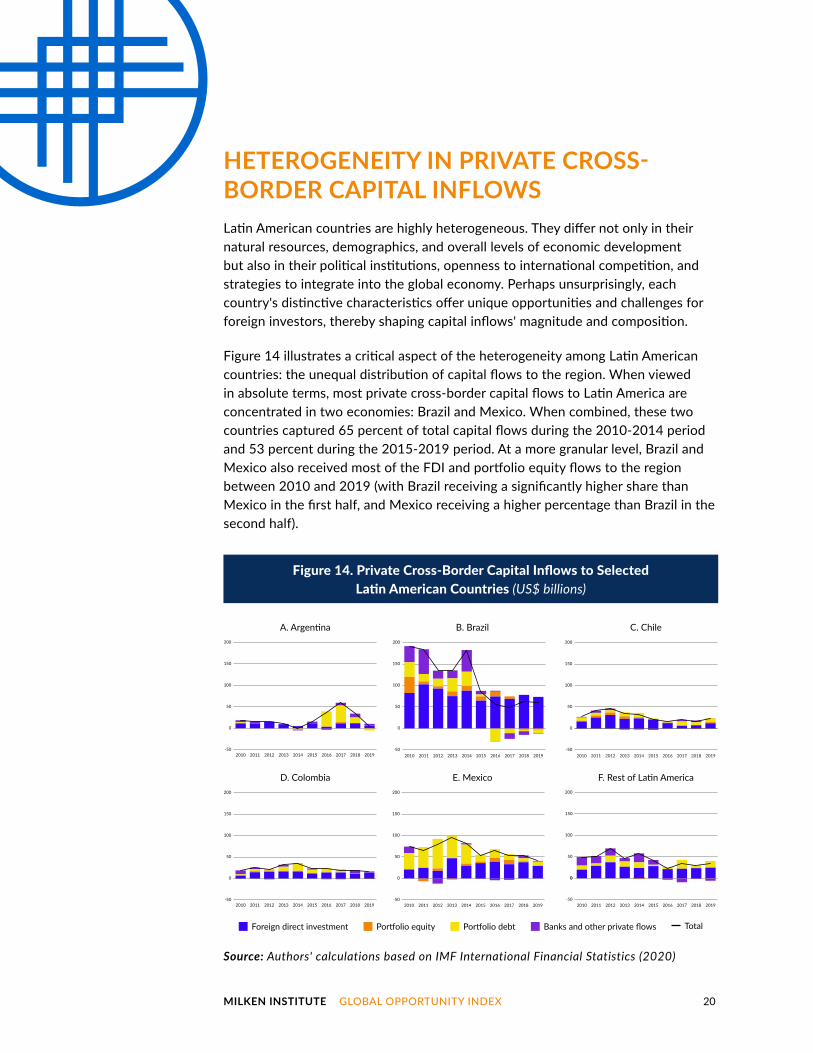
HETEROGENEITY IN PRIVATE CROSS-BORDER CAPITAL INFLOWSLatin American countries are highly heterogeneous. They differ not only in their natural resources, demographics, and overall levels of economic development but also in their political institutions, openness to international competition, and strategies to integrate into the global economy. Perhaps unsurprisingly, each country's distinctive characteristics offer unique opportunities and challenges for foreign investors, thereby shaping capital inflows' magnitude and composition.
Figure 14 illustrates a critical aspect of the heterogeneity among Latin American countries: the unequal distribution of capital flows to the region. When viewed in absolute terms, most private cross-border capital flows to Latin America are concentrated in two economies: Brazil and Mexico. When combined, these two countries captured 65 percent of total capital flows during the 2010-2014 period and 53 percent during the 2015-2019 period. At a more granular level, Brazil and Mexico also received most of the FDI and portfolio equity flows to the region between 2010 and 2019 (with Brazil receiving a significantly higher share than Mexico in the first half, and Mexico receiving a higher percentage than Brazil in the second half).
Source: Authors' calculations based on IMF International Financial Statistics (2020)
Figure 14. Private Cross-Border Capital Inflows to Selected Latin American Countries (US$ billions)
A. Argentina
D. Colombia
B. Brazil
E. Mexico
C. Chile
F. Rest of Latin America
-50
0
50
100
150
200
2019201820172016201520142013201220112010-50
0
50
100
150
200
2019201820172016201520142013201220112010-50
0
50
100
150
200
2019201820172016201520142013201220112010
-50
0
50
100
150
200
2019201820172016201520142013201220112010-50
0
50
100
150
200
2019201820172016201520142013201220112010-50
0
50
100
150
200
2019201820172016201520142013201220112010
0
Foreign direct investment Portfolio equity Portfolio debt Banks and other private flows Total

MILKEN INSTITUTE GLOBAL OPPORTUNITY INDEX 21
Furthermore, the figure illustrates that, over the past decade, capital inflows have been significantly more volatile in Argentina and Brazil than in the rest of Latin America. This volatility has been primarily driven by the behavior of portfolio investment in debt and bank-related inflows, and it can be partially explained by the economic challenges faced by these two countries in the mid- and late 2010s. These challenges included Argentina's debt default in 2014 and economic crisis in 2018, as well as Brazil's severe economic recession in mid-2014—a product of the sharp decline in commodity prices and a series of internal political events that severely undermined investors' confidence.
Figure 15, on the other hand, shows that the distribution of flows has become more equal over time, particularly across portfolio investment (both in debt and equity) and bank-related flows. This change coincided with Argentina’s increased relative importance in the region.
Note: Importance is calculated by dividing the absolute value of the inflows to a given country by the sum of the absolute values of the inflows to all the countries in the region.Source: Authors' calculations based on IMF International Financial Statistics (2020)
Figure 15. Importance of Selected Countries in Private Cross-Border Capital Inflows to Latin America
A. 2010-2014 B. 2015-2019
Argentina Brazil Chile Mexico OthersColombia
15%
3% 44% 10% 7% 21% 15%
5% 46% 12% 7% 14%
69% 19% 10%
26% 8% 7% 49% 11%
61% 5% 28%Banks andothers
Portfoliodebt
Portfolioequity
FDI
Total 14% 29% 9% 9% 24% 15%
5% 44% 7% 8% 21% 15%
7% 37% 5% 46%
27% 16% 9% 9% 22% 17%
36% 23% 11% 14% 15%Banks andothers
Portfoliodebt
Portfolioequity
FDI
Total

MILKEN INSTITUTE GLOBAL OPPORTUNITY INDEX 22
From a country's perspective, however, what matters is the magnitude of inflows relative to the economy's size. When viewed as a percentage of GDP, private cross-border capital inflows were significantly higher in Chile than in the rest of Latin America, with an annual average of just below 11 percent between 2010 and 2019 (see figure 16). Colombia follows in a relatively distant second place, with a yearly average of about 7 percent over the same period. Mexico and Brazil are in third and fourth places with 5.6 percent and 5.1 percent, respectively. Finally, among the five largest economies of the region, Argentina exhibits the lowest capital inflows as a fraction of GDP, with an annual average of just below 4 percent over the 2010-2019 period.
Figures 14 and 16 also illustrate that the decline in capital flows to Latin America during the 2010s was a widespread phenomenon and not driven by a single country. Indeed, capital flows declined in most of the region's economies, both in absolute terms and as a fraction of GDP. For example, as a fraction of GDP, and relative to the 2010-2014 period, capital flows during 2015-2019 were about 50 percent lower in Brazil and Chile, 13 percent lower in Colombia, 31 percent lower in Mexico, and 43 percent lower in the rest of the region. Among the region's largest economies, Argentina was the only country that did not experience an overall decline in capital flows over the last decade. In fact, capital flows to Argentina during the 2015-2019 period were about 120 percent higher than during 2010-2014.

MILKEN INSTITUTE GLOBAL OPPORTUNITY INDEX 23
Source: Authors' calculations based on IMF International Financial Statistics (2020)
Figure 16. Private Cross-Border Capital Inflows to Selected Latin American Countries (As a percentage of GDP)
However, Argentina's unique behavior must be understood within the broader context of its often tumultuous economic and political history. Following a sharp decline between 2010 and 2014—a result of the country's multiple economic challenges that culminated in the 2014 government's default—global capital flows rose rapidly during the 2014-2017 period—after the election of President Macri in 2015 and the country's return to international capital markets. But the recovery was mostly driven by portfolio investment in debt and (to a lesser extent) bank-related inflows, both highly volatile and for the most part related to a surge in public debt. In late 2017, the economy began to deteriorate, and capital flows once again declined, only to plunge in 2019 after the presidential election—where President Macri lost to the Peronist ticket, whose campaign was primarily based on a reorientation of the country's economic policies.8
A. Argentina
D. Colombia
B. Brazil
E. Mexico
C. Chile
F. Rest of Latin America
Foreign direct investment Portfolio equity Portfolio debt Banks and other private flows Total
-2%
2%
6%
10%
14%
18%
2019201820172016201520142013201220112010-2%
2%
6%
10%
14%
18%
2019201820172016201520142013201220112010-2%
2%
6%
10%
14%
18%
2019201820172016201520142013201220112010
-2%
2%
6%
10%
14%
18%
2019201820172016201520142013201220112010-2%
2%
6%
10%
14%
18%
2019201820172016201520142013201220112010-2%
2%
6%
10%
14%
18%
2019201820172016201520142013201220112010

MILKEN INSTITUTE GLOBAL OPPORTUNITY INDEX 24
Note: Importance is calculated by dividing the absolute value of a given type of inflow by the sum of the absolute values of all kinds of flows.Source: Authors' calculations based on IMF International Financial Statistics (2020)
Figure 17. Importance of Various Types of Private Cross-Border Capital Inflows to Selected Latin American Countries
HETEROGENEITY IN THE COMPOSITION OF CAPITAL INFLOWSThe composition of capital flows also varies across countries and over time within a given country. Figure 17 illustrates this heterogeneity, showing the relative importance of the various types of private cross-border capital inflows to the five largest Latin American economies and the rest of the region. On average, between 2015 and 2019, foreign direct investment and portfolio debt inflows have been the most important components of capital flows for all economies. However, there are marked differences across countries. For instance, FDI flows are unusually large in Brazil (81 percent), and portfolio debt flows are unusually large in Argentina (55 percent). In Mexico, bank-related inflows have been insignificant over the 2010-2019 period, primarily due to its macroprudential regulation. Finally, the importance of portfolio equity flows has decreased in Brazil, Chile, and Colombia, but it has increased in Mexico and, to a lesser extent, Argentina.
A. 2010-2014 B. 2015-2019
Others
Mexico
Colombia
Chile
Brazil
Argentina
Others
Mexico
Colombia
Chile
Brazil
Argentina86% 12%
53% 9% 16% 22%
52% 8% 28% 12%
14%
65% 21%11%
35% 63%
50% 20% 30%
14%30% 55% 13%
5%
81% 11%
7%
61% 30% 6%
64% 28% 7%
65% 10% 25%
67% 28%
Foreign direct investment Portfolio equity Portfolio debt Banks and other private flows

MILKEN INSTITUTE GLOBAL OPPORTUNITY INDEX 25
FOREIGN DIRECT INVESTMENT: A CLOSER LOOKForeign direct investment is by far the largest source of private capital inflows to Latin America. On average, between 2015 and 2019, FDI accounted for more than 70 percent of all private cross-border capital flows into the region. It is also one of the more stable flows and, according to a growing consensus, one that can provide significant benefits for the host economies. A recent article by the World Bank, for example, indicates that "FDI can accelerate the ‘catching up’ process of developing economies and facilitate their integration within regional and global value chains."9
FDI inflows can be classified into three main categories. The first category is equity finance, in which foreign investors acquire already-existing companies (M&A) or establish new ones (greenfield projects). The second is the reinvestment of earnings, which refers to earnings of firms owned by foreign investors not remitted to the parent company. Finally, the third category is intercompany loans, which consist of loans extended by foreign parent companies or affiliated enterprises.
Source: Authors' calculations based on IMF International Financial Statistics (2020)
Figure 18. FDI Inflows to Latin America and Selected Countries, by Component, 2010-2019 Average (Percentage of total FDI inflows)
Argentina
30% 24% 46%
63% 9% 28%
37% 28% 35%
15% 26% 59%
30% 15% 55%
41% 21% 38%
46% 26% 28%Others
Mexico
Colombia
Chile
Brazil
LATAM
EquityIntercompany loansReinvestment of earnings

MILKEN INSTITUTE GLOBAL OPPORTUNITY INDEX 26
Most FDI inflows to Latin America take the form of equity capital. On average, between 2010 and 2019, this type of flow accounted for about 46 percent of the region's FDI flows (see figure 18). The relative importance of equity flows, however, varies significantly across countries. For instance, over the same period, the share of equity flows in total FDI was unusually large in Brazil (59 percent) and Colombia (55 percent). In contrast, it was relatively small in Argentina (28 percent). Chile and Mexico fell somewhere in between with 35 percent and 38 percent, respectively. The overall importance of equity capital flows is a good signal for Latin America. This type of flow is usually the strongest indicator of long-term interest among foreign investors.
FDI can also take the form of reinvestment of earnings, reflecting the confidence of foreign investors who have already established operations or have acquired businesses in the region. This type of FDI is vital in Latin America, accounting for about 30 percent of all FDI inflows between 2010 and 2019 (see figure 18). The relevance of reinvested earnings, however, varies significantly across countries. For some of the major economies in the region, such as Chile, Colombia, and Mexico, reinvested earnings accounted for more than 30 percent of total FDI inflows between 2010 and 2019; for Argentina, they made up an even larger fraction (about 60 percent). In contrast, over the same period, reinvested earnings accounted for only about 15 percent of Brazil's total FDI inflows. For the rest of the region, this type of investment is also significant, accounting for about 46 percent of all foreign direct investment.
The relevance of reinvested earnings in Latin America has an important implication for the future short-term behavior of FDI inflows: The impact of the COVID-19 pandemic on foreign direct investment inflows to the region is likely to be severe. The current global crisis is expected to substantially lower the earnings of foreign affiliates based in Latin America, and investors are expected to reinvest a smaller share of these earnings than they have done in the past. Accordingly, FDI inflows to the region will likely drop substantially in the short term.10
Finally, between 2010 and 2019, intercompany loans accounted for almost one-fourth of total FDI inflows to the region. At a more granular level, and over the same period, this type of flow accounted for about 9 percent of total FDI inflows to Argentina, 26 percent to Brazil, 28 percent to Chile, 15 percent to Colombia, 21 percent to Mexico, and 26 percent to the rest of the region.
Intercompany loans are challenging to interpret, as their intentions and consequences are usually unclear, and they are often simply used for tax-planning purposes. However, some studies have shown that parent companies tend to use intercompany loans to support their foreign affiliates during challenging times. If that happens in the current situation, a rise in intercompany loans could partially offset a decline in reinvested earnings and equity flows.11

MILKEN INSTITUTE GLOBAL OPPORTUNITY INDEX 27
ORIGIN OF FOREIGN DIRECT INVESTMENTThe origin of foreign direct investment inflows to Latin America has remained relatively stable between 2010 and 2018 (see figure 19). Most of the FDI flowing into the region came from the United States and Europe, with the former having a stronger presence in Mexico and the latter in South America (particularly in Argentina and Brazil). This pattern aligns with the historically strong commercial ties between Mexico and the United States, on the one hand, and between South America and Europe, on the other.
Source: Central Bank of Argentina, Central Bank of Chile, and Economic Commission for Latin America and the Caribbean (2020)
Figure 19. FDI Inflows to Selected Latin American Countries, by Origin (Percentage of total FDI inflows)
Argentina Brazil Chile Colombia Mexico
0%
20%
40%
-40%
-20%
60%
80%
100%
20182012-1720182012-1720182012-1720182012-1720182014-16
OthersJapanCanadaLatin America and the CaribbeanUnited StatesEurope

MILKEN INSTITUTE GLOBAL OPPORTUNITY INDEX 28
Note: Due to data limitations, Latin America's calculations exclude Guyana, Peru, Suriname, and Venezuela. Totals may not equal 100 because of rounding.Source: Economic Commission for Latin America and the Caribbean (2020)
Figure 20. FDI Inflows to Latin America and Selected Countries, by Sector(Percentage of total FDI inflows)
The importance of other sources varies by country. Inflows from other Latin American economies, for instance, have been particularly significant in Argentina and Colombia, surpassing even those from the United States. In Argentina, inflows from other Latin American economies accounted for 22 percent of total FDI inflows between 2014 and 2016; in Colombia, they accounted for 35 percent in 2012-2017 and 29 percent in 2018. On the other hand, Canada has a significant presence in Mexico (presumably because of NAFTA) and Chile (given its rich copper and lithium deposits and the predominance of Canadian mining companies).
FDI BY SECTORThe services and manufacturing sectors are the two primary recipients of foreign direct investment in Latin America (see figure 20). On average, between 2014 and 2018, about 43 percent of total FDI flows to the region were directed to services, 41 percent to manufacturing, 13 percent to natural resources, and about 2 percent to other sectors (mostly mining). This outcome is not surprising, as manufacturing and services already captured most foreign investment between 2010 and 2014. The novelty is the significant reduction in the natural resources sector, which during the 2010-2014 period accounted for about 22 percent of the total FDI inflows. This reduction was primarily driven by the relative worsening in commodity prices during the second half of the 2010s, indicating that the decline is likely to persist until global economic conditions improve.
22%
23%
37% 38% 2%
34% 43%
18% 49% 33%
36% 45%5% 14%
51% 13% 36%
10% 56% 35%
A. 2010-2014
Mexico
Colombia
Chile
Brazil
Argentina
LATAM 13%
16%
41% 43% 2%
31% 53%
13% 51% 36%
2%18% 50% 29%
29% 16% 55%
4% 50% 46%
B. 2015-2018
Mexico
Colombia
Chile
Brazil
Argentina
LATAM
OthersServicesManufacturesNatural resources
A. 2010-2014 B. 2015-2018
22%
23%
37% 38% 2%
34% 43%
18% 49% 33%
36% 45%5% 14%
51% 13% 36%
10% 56% 35%Mexico
Colombia
Chile
Brazil
Argentina
LATAM 13%
16%
41% 43% 2%
31% 53%
13% 51% 36%
2%18% 50% 29%
29% 16% 55%
4% 50% 46%Mexico
Colombia
Chile
Brazil
Argentina
LATAM

MILKEN INSTITUTE GLOBAL OPPORTUNITY INDEX 29
Finally, figure 20 illustrates that aggregate data hide key differences in the sectoral allocation of FDI at the country level. Inflows into the natural resources sector, for example, are unusually large in Colombia—where they represented 29 percent of total FDI inflows between 2015 and 2019—but relatively insignificant in Mexico—where they accounted for only about 4 percent of the total. There are also wide variations across countries in the share of FDI going into manufacturing between 2015 and 2019, ranging from 51 percent in Brazil and 50 percent in Mexico to 16 percent in Colombia and 2 percent in Chile. Furthermore, inflows to other sectors (mostly mining) are significant only in Chile, accounting for about 29 percent of total FDI.

MILKEN INSTITUTE GLOBAL OPPORTUNITY INDEX 30
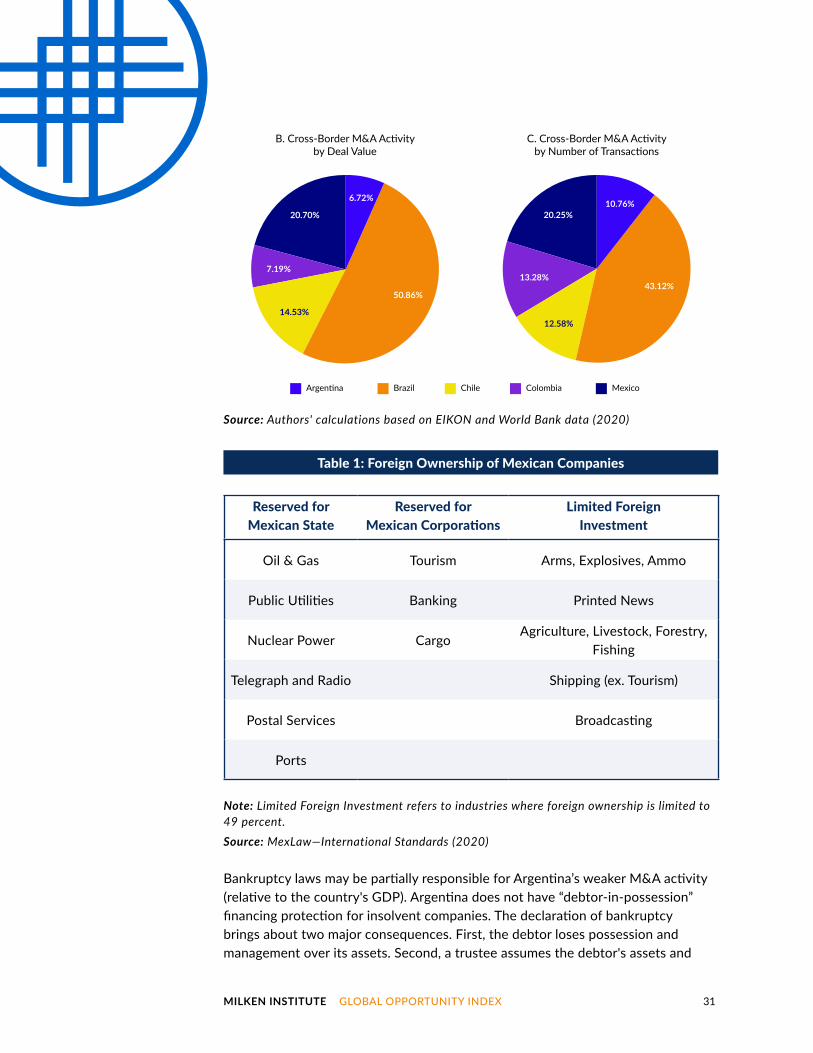
CROSS-BORDER MERGERS AND ACQUISITIONS IN LATIN AMERICA Cross-border mergers and acquisitions (M&A) are an essential component of Latin America’s FDI, and most of the region’s activity is dominated by the five largest economies by GDP. From 2010 to 2020, Brazil attracted the most M&A, both in number of transactions and in aggregate deal value, followed by Mexico and Chile (see figure 21). It should be mentioned that Mexico regulates foreign ownership for some key sectors, impacting the number of deals (see table 1).
Figure 21. M&A Activity in Latin America, Target Nations
0
1,000
2,000
3,000
4,000
5,000
6,000
7,000
ColombiaArgentinaChileMexicoBrazil0
100
200
300
400
500
600
700
A. All M&A Activity in Latin America, Target Nat ions (Number of transactions and $US billions)
Cross-Border TransactionsDomestic Transactions Aggregate Deal Volume (right scale)
MILKEN INSTITUTE GLOBAL OPPORTUNITY INDEX 31
Table 1: Foreign Ownership of Mexican Companies
Note: Limited Foreign Investment refers to industries where foreign ownership is limited to 49 percent.Source: MexLaw—International Standards (2020)
Bankruptcy laws may be partially responsible for Argentina’s weaker M&A activity (relative to the country's GDP). Argentina does not have “debtor-in-possession” financing protection for insolvent companies. The declaration of bankruptcy brings about two major consequences. First, the debtor loses possession and management over its assets. Second, a trustee assumes the debtor's assets and
Reserved for Mexican State
Reserved for Mexican Corporations
Limited Foreign Investment
Oil & Gas Tourism Arms, Explosives, Ammo
Public Utilities Banking Printed News
Nuclear Power CargoAgriculture, Livestock, Forestry,
Fishing
Telegraph and Radio Shipping (ex. Tourism)
Postal Services Broadcasting
Ports
Source: Authors' calculations based on EIKON and World Bank data (2020)
B. Cross-Border M&A Activityby Deal Value
C. Cross-Border M&A Activityby Number of Transactions
20.25%10.76%
43.12%13.28%
12.58%
20.70%
6.72%
50.86%
7.19%
14.53%
Argentina Brazil Chile MexicoColombia

MILKEN INSTITUTE GLOBAL OPPORTUNITY INDEX 32
businesses' administration. In most cases, this leads to an immediate liquidation of the entity, without a chance for a turnaround, creating uncertainty and instability in industries that are not inherently cash flow safe.
Exacerbating the previous issue is the relative insolvency of the Argentinian government, which can significantly affect M&A activity through the Country Risk Premium (CRP).12 The Country Risk Premium is the additional return demanded by investors to compensate them for the higher inherent risk in foreign countries. The CRP can significantly impact valuation calculations (and therefore investment decisions) and is affected by several factors, including political instability, economic risks (inflation), sovereign debt burden, sovereign debt default probability, and adverse government regulations (bankruptcy law, expropriation, and currency controls).
Figure 22 depicts the most recent country risk premium for the five largest Latin American economies. The most economically stable nations (such as the United States, Norway, and Germany) all have CRP's of 0 percent. By contrast, Argentina has a CPR of 17.63 percent, the highest among the selected countries—and about four times higher than Brazil's.13 This means that if an investor wants to purchase a company in Argentina, they will demand an additional return of 17.63 percent compared to an identical deal in the United States (to compensate them for the inherent risk associated with the cost of doing business in Argentina).
Source: Aswath Damodaran (2020)
Figure 22. Country Risk Premiums
0%
5%
10%
15%
20%
ChileMexicoColombiaBrazilArgentina
17.63%
4.41%
2.80% 2.35%1.03%

MILKEN INSTITUTE GLOBAL OPPORTUNITY INDEX 33
ORIGIN OF ACQUIRING FIRMSFigure 23 illustrates the number of cross-border M&A transactions and the aggregate deal value for the most frequent purchasers of the five largest Latin American economies. US companies and private capital firms accounted for most of the M&A activities, with over 1,200 transactions over the last 10 years at an aggregate deal value of over US$70 billion. The second place is split between Canada by number of transactions, at 450, and Spain, by aggregate deal value, at approximately US$33.5 billion.
Source: Authors' calculations based on EIKON data (2020)
Figure 23. Cross-Border M&A Activity, by Acquiring Countries(Number of transactions and US$ billions)
# Transactions Deal value (right scale)
0
200
400
600
800
1,000
1,200
1,400
Switz
erlan
dChile
Australi
a
German
yJap
anFra
nce
United Kingd
omSp
ain
Canad
a
United St
ates
0
10
20
30
40
50
60
70
80
MILKEN INSTITUTE GLOBAL OPPORTUNITY INDEX 34
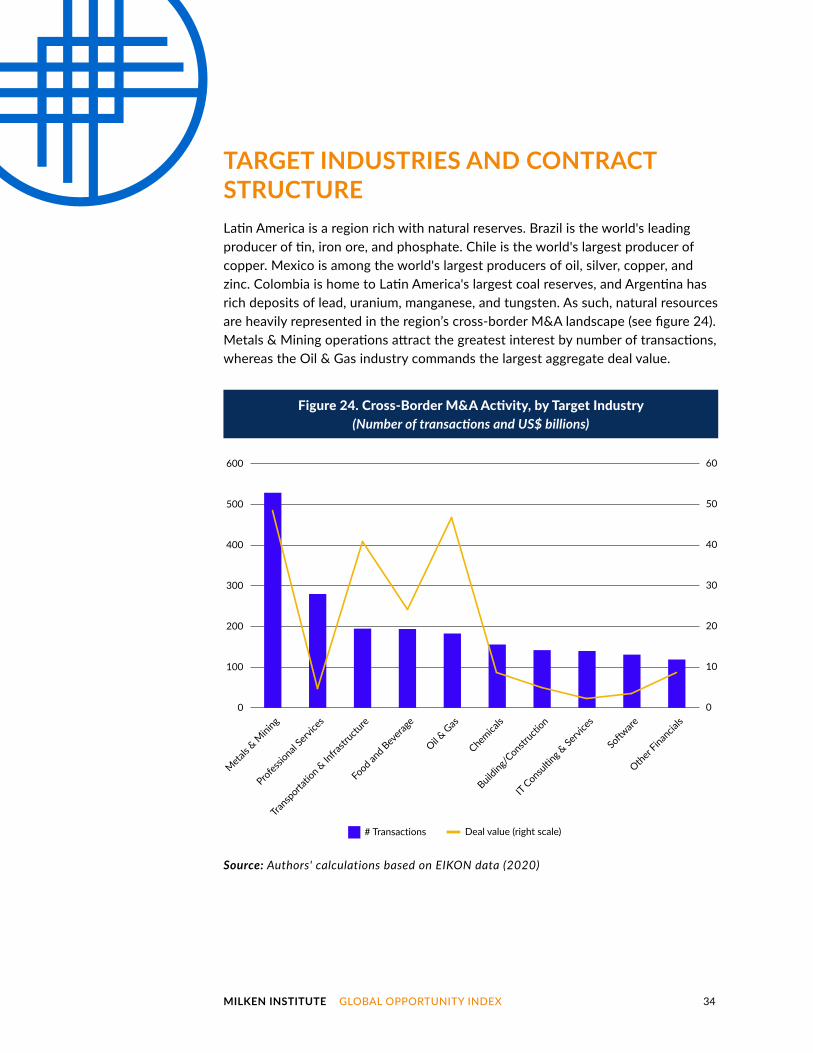
TARGET INDUSTRIES AND CONTRACT STRUCTURELatin America is a region rich with natural reserves. Brazil is the world's leading producer of tin, iron ore, and phosphate. Chile is the world's largest producer of copper. Mexico is among the world's largest producers of oil, silver, copper, and zinc. Colombia is home to Latin America's largest coal reserves, and Argentina has rich deposits of lead, uranium, manganese, and tungsten. As such, natural resources are heavily represented in the region’s cross-border M&A landscape (see figure 24). Metals & Mining operations attract the greatest interest by number of transactions, whereas the Oil & Gas industry commands the largest aggregate deal value.
Source: Authors' calculations based on EIKON data (2020)
Figure 24. Cross-Border M&A Activity, by Target Industry(Number of transactions and US$ billions)
# Transactions Deal value (right scale)
0
100
200
300
400
500
600
0
10
20
30
40
50
60
Other Finan
cials
Softw
are
IT Consultin
g & Se
rvice
s
Building/
Constructi
on
Chemica
ls
Oil & G
as
Food an
d Bevera
ge
Transp
ortatio
n & In
frastr
ucture
Professio
nal Se
rvice
s
Metals &
Mining

MILKEN INSTITUTE GLOBAL OPPORTUNITY INDEX 35
Contracts concerning Metals & Mining deals in Latin America are typically on a production basis, as opposed to a geographic mining location. Governments in the region tend to have separate guarantees built into contracts to protect purchasers against production uncertainty. These contracts can also contain a minimum production threshold of resources obtained/produced, despite geographic limitations. This last contract feature differs significantly from standard global Oil & Gas deals, where rights are typically relegated to specified oil fields and do not contain any terminology guaranteeing a minimum production threshold. Other contract variations include “earn-outs” and increased percentage participation rights based upon successful geological surveys intended to provide mineral amount estimations.
An example of one such contract is covered below and supplied by GlobeNewswire ("Cerro Grande Mining Corporation Announces Letter of Intent," 2020):
On July 15, 2020, Chilean company Cerro Grande Mining Corp entered into a Letter of Intent with Minera Tamidak, the Pimentón Copper Mining Project's landowner. Tamidak acquired the mining project in bankruptcy proceedings back in 2018 and is now entering into a Joint Venture with Cerro to continue mining operations. In the JV agreement, following a 3D deep penetrating geophysical survey, Cerro will have the right to acquire up to 49 percent equity interest in the first 12 months. In addition to the initial 49 percent, should Cerro be happy with the survey results and complete an in-house feasibility study with approval from the Chilean government, Cerro will have additional purchasing rights up to 70 percent after an additional USD 5 million consideration is paid to Tamidak. Finally, should both parties agree to a “Decision to Mine” (decide it is worth the investment), Cerro will be able to increase its ownership to 75 percent, assuming the company covers all commercial mining and production costs. In this instance, several key clauses of protection are included to neutralize uncertainty in the acquisition process. Tamidak owns the land, and Cerro has the mining capabilities. Neither is certain of the size or value of the copper reserves in the ground.
DEAL-MAKING PROCESS: THE "ABCD" COMPANIES IN LATIN AMERICATypically, investment banking groups are structured in a way that caters to either a specific financial product (M&A, IG/HY Debt, or Equity Capital Markets) or industry coverage (O&G, Consumer Products, Technology, etc.). However, several investment banks deviate from the product/industry delineation with a separate LATAM coverage group specifically designed to serve the area. These groups specialize in how each country's transactional landscape operates and focus on the larger industries driving each economy.

MILKEN INSTITUTE GLOBAL OPPORTUNITY INDEX 36
LATAM-focused investment banking groups are also useful in navigating some of the informational holes of the M&A space. As illustrated in figure 22, government stability and ease of access to information are relevant topics when deciding whether to entertain a Latin American M&A deal process. LATAM coverage groups help to close these informational gaps, and broader international corporations create Latin American subsidiaries to best position themselves for future buying opportunities to navigate the deal process.
The largest food and agricultural companies globally, Archer Daniels Midland (ADM), Bunge, Cargill, and Louis Dreyfus (collectively known as ABCD), provide a great illustration of the use of subsidiaries. These four companies have used more than 10 subsidiaries to make 28 acquisitions and 12 minority investment/joint ventures in Brazil, Mexico, Argentina, Colombia, and Chile over the last 10 years. Cargill, the world's largest food and agricultural conglomerate and largest private company in the United States, was able to side-step maximum land ownership regulations in Colombia by creating several shell companies to acquire more than 50,000 hectares of farming land. While Latin America is known for its natural resources, it is also a food and beverage production powerhouse.
The ABCD companies have demonstrated intense interest in the Latin American region along the entire supply chain, from production and equipment to chemical preservation, packaging, shipping, and even the tech that automates and controls the process. Cargill provides a useful illustration of a Technology industry venture. In 2018, it completed an equity investment in Agriness, a Brazilian cloud-based farm production technology platform that increases swine production and tracks key performance metrics. Similarly, Bunge entered the Machinery industry in 2019 when it bought a 30 percent minority stake in Brazilian farm machinery supplier Agrofel, effectively controlling the farmers before and after the grain production process.
Another illustration is ADM and its entry into the Transportation and Infrastructure industry. ADM bought two separate Brazilian ports (Port Terminal Pará, Barcarena) in 2012 while also acquiring Brazilian port and shipping agency Blue Ocean Agencia Maritima in a 2020 joint venture with Norton Lilly International, a transportation conglomerate headquartered in Mobile, Alabama. Furthermore, in January 2020, ADM expanded its reach into the Chemicals industry when it acquired Yerbalatina Phytoactives, a Brazilian chemical manufacturing company that focuses on the production of extracts and ingredients for customers in the food, beverage, and health industries.
MILKEN INSTITUTE GLOBAL OPPORTUNITY INDEX 37
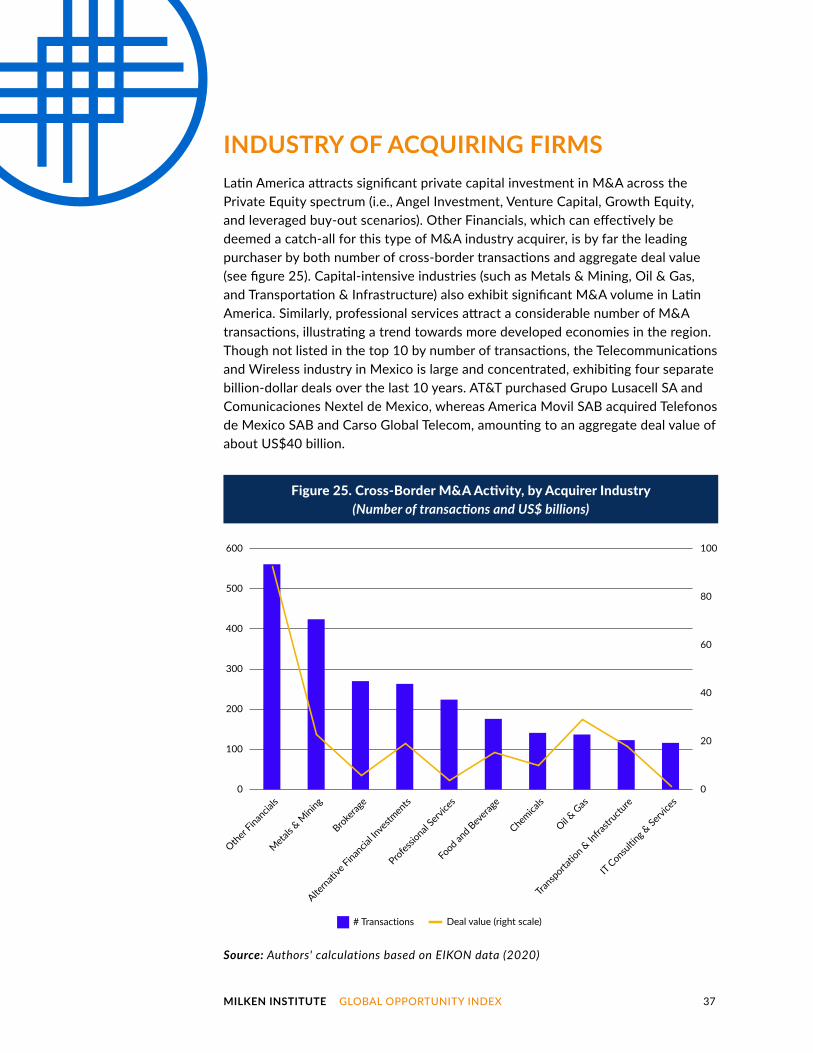
INDUSTRY OF ACQUIRING FIRMSLatin America attracts significant private capital investment in M&A across the Private Equity spectrum (i.e., Angel Investment, Venture Capital, Growth Equity, and leveraged buy-out scenarios). Other Financials, which can effectively be deemed a catch-all for this type of M&A industry acquirer, is by far the leading purchaser by both number of cross-border transactions and aggregate deal value (see figure 25). Capital-intensive industries (such as Metals & Mining, Oil & Gas, and Transportation & Infrastructure) also exhibit significant M&A volume in Latin America. Similarly, professional services attract a considerable number of M&A transactions, illustrating a trend towards more developed economies in the region. Though not listed in the top 10 by number of transactions, the Telecommunications and Wireless industry in Mexico is large and concentrated, exhibiting four separate billion-dollar deals over the last 10 years. AT&T purchased Grupo Lusacell SA and Comunicaciones Nextel de Mexico, whereas America Movil SAB acquired Telefonos de Mexico SAB and Carso Global Telecom, amounting to an aggregate deal value of about US$40 billion.
Source: Authors' calculations based on EIKON data (2020)
Figure 25. Cross-Border M&A Activity, by Acquirer Industry(Number of transactions and US$ billions)
0
100
200
300
400
500
600
0
20
40
60
80
100
IT Consultin
g & Se
rvice
s
Transp
ortatio
n & In
frastr
ucture
Oil & G
as
Chemica
ls
Food an
d Bevera
ge
Professio
nal Se
rvice
s
Alternati
ve Finan
cial In
vestm
ents
Brokerag
e
Metals &
Mining
Other Finan
cials
# Transactions Deal value (right scale)

MILKEN INSTITUTE GLOBAL OPPORTUNITY INDEX 38
CONCLUSION: THE ROAD AHEAD Access to foreign capital can have important implications for Latin America's economic performance. When accompanied by sound policies, global capital inflows can promote domestic economic growth and, more broadly, be used by local governments to foster their national economic agendas.
But before receiving any benefit, Latin American countries must first attract international investors, requiring appropriate institutional and macroeconomic frameworks.
This report illustrates that when it comes to attracting foreign investors, Latin American countries compare well with other emerging markets and developing economies in the following categories:
• Workforce Talent, which captures the qualifications and diversity of the labor force, and
• Financial Size and Condition, which reflects the breadth and depth of the existing financial system.
The overall performance in these categories is encouraging for Latin America, as it reflects the success of some initiatives undertaken by governments across the region over the past decades. It is also a good sign for investors, particularly those in sectors that prioritize highly skilled workers.
However, Latin American economies lag other emerging markets and developing economies in two crucial areas:
• Business Constraints, including the cost and time required to start a new business and the percentage of firms that identify corruption, labor regulations, and taxes as an impediment to business, and
• Investors' Rights, which account for the strength of investors' protection, property rights, and instability in government policymaking.
Improving both areas is critical to increasing the region's attractiveness to foreign investors—and, more broadly, to generating a favorable investment climate. Doing so will take time and require long-term policies, as governments will need

MILKEN INSTITUTE GLOBAL OPPORTUNITY INDEX 39
to enhance current legal frameworks and ensure their proper implementation over time. It will also require political will and significant changes to longstanding institutions, which are likely to generate opposition from local interest groups.
With over 100 positions separating the best and worst ranked countries, it is clear that Latin American economies are highly heterogeneous. They differ not only in their natural resources, economic openness, and overall levels of development, but also in their political systems, legal frameworks, and administrative procedures. These differences imply that the right combination of policies to address the issues mentioned above, as well as their implementation, will likely vary across countries. But while details may differ, our analysis confirms that most governments in the region must take tangible steps to address corruption, rebuild trust in government, and consolidate the rule of law.14

MILKEN INSTITUTE GLOBAL OPPORTUNITY INDEX 40
Table A.1. List of Countries by Economic Group
APPENDIX: ECONOMY GROUPING
Advanced Economies
Australia France Korea, Rep. SingaporeAustria Germany Latvia Slovak RepublicBelgium Greece Lithuania SloveniaCanada Hong Kong Luxembourg SpainCyprus Iceland Malta SwedenCzech Republic Ireland Netherlands SwitzerlandDenmark Israel New Zealand TaiwanEstonia Italy Norway United KingdomFinland Japan Portugal United States
Latin America
Argentina Colombia Guyana ParaguayBelize Costa Rica Honduras PeruBolivia Ecuador Mexico SurinameBrazil El Salvador Nicaragua UruguayChile Guatemala Panama Venezuela
EMDE Asia (excl. China)
Bangladesh Kiribati Nauru Sri LankaBhutan Lao PDR Nepal ThailandBrunei Darussalam Malaysia New Caledonia Timor-LesteCambodia Maldives Palau TongaFiji Marshall Islands Papua New Guinea TuvaluFrench Polynesia Micronesia Philippines VanuatuIndia Mongolia Samoa VietnamIndonesia Myanmar Solomon Islands

MILKEN INSTITUTE GLOBAL OPPORTUNITY INDEX 41
EMDE Europe
Albania Croatia North Macedonia TurkeyBelarus Hungary Poland UkraineBosnia and Herzegovina
Kosovo Moldova
Romania Russia
Bulgaria Montenegro Serbia
Source: IMF, WEO Groups and Aggregates Information (2020)
Rest of EMDE Economies
Afghanistan Equatorial Guinea Libya South AfricaAlgeria Eritrea Madagascar South SudanAngola Eswatini Malawi SudanArmenia Ethiopia Mali SyriaAzerbaijan Gabon Mauritania TajikistanBahrain Gambia, The Mauritius TanzaniaBenin Georgia Morocco TogoBotswana Burkina Faso
Ghana Guinea
Mozambique Namibia
Trinidad and Tobago
Burundi Guinea-Bissau Niger TunisiaCabo Verde Haiti Nigeria TurkmenistanCameroon Iran, Islamic Rep. Oman UgandaCentral African Republic Chad
Iraq Jamaica Jordan
Pakistan Qatar Rwanda
Uzbekistan West Bank and Gaza
Comoros Congo, Dem. Rep.
Kazakhstan Kenya
São Tomé and Principe
Yemen Zambia
Congo, Rep. Kuwait Saudi Arabia ZimbabweCôte d'Ivoire Kyrgyz Republic SenegalDjibouti Lebanon SeychellesDominican Rep. Lesotho Sierra LeoneEgypt Liberia Somalia

MILKEN INSTITUTE GLOBAL OPPORTUNITY INDEX 42
ENDNOTES 1. For more details on the Global Opportunity Index, see Smith (2021).
2. The IMF sorts the world into advanced and EMDE countries based upon a country’s per capita income, export diversification, and degree of integration into the global financial system (see the appendix). Of the total 145 countries included in the GOI 2021, 109 countries are categorized as EMDE, and 36 are advanced economies. All 20 of the LATAM countries included in this report are classified as EMDE.
3. Investor-state disputes (also known as ISDs) involve a foreign investor initiating binding arbitration against the government of the country in which their investment is located. Disputes typically relate to the alleged direct or indirect expropriation of an investor’s investment by the host government. The provisions that make this possible are stipulated in the investment protection chapters of most international investment agreements. See UNCTAD (2020a).
4. Economy size in Latin America is determined using GDP (current US$) figures provided by the World Bank.
5. To capture foreign investors’ attitude towards Latin America, we focus on “gross” inflows, defined as any change in external liabilities incurred by the recipient economy (see OECD, 2018). These inflows can have a positive sign (when nonresidents purchase domestic assets) or a negative sign (when nonresidents sell their domestic assets). For the same reason, we also focus on “private” inflows and exclude some types of instruments that are largely affected by non-market factors. Hence, we exclude reserve asset accumulations and flows to the general government and monetary authorities within the “Other Investment” component of the financial account. We also exclude capital movements associated to financial derivatives, which represent a small fraction of total flows, and to offshore financial centers, which tend to be unrelated to domestic factors.
6. The recent history of cross-border capital flows to Latin America includes "the flood of dollars from newly rich Middle Eastern oil exporters, recycled as loans from U.S. and European banks, that washed over the region starting in the mid-1970s. Then came the Mexican debt default of 1982, which set off an economically devastating outflow of capital from the region that lasted for most of the 1980s. In the early 1990s the capital flows resumed, with portfolio

MILKEN INSTITUTE GLOBAL OPPORTUNITY INDEX 43
and direct investment this time playing a bigger role than bank loans. The Mexican peso crisis of 1994 slowed this inflow, but unlike the debt crisis of the 1980s it hasn't stopped it." (Fox, 1998)
7. For a discussion of Latin America's experience with global capital flows, see Edwards (1998).
8. For a brief review of Argentina’s recent economic challenges, see Nelson (2020).
9. Fruman and Forneris (2016).
10. See OECD (2020) and UNCTAD (2020b).
11. See Desai, Fritz Foley, and Forbes (2008), and Alfaro and Chen (2012).
12. The Argentinian government has declared bankruptcy on its national debt numerous times, most recently in 2016, and has defaulted on its debt to creditors most recently in May 2020.
13. In a sample of about 200 countries, Argentina had the second-highest CPR, below only Sudan, Yemen, and Venezuela (all three tied in last place).
14. For a brief discussion of corruption in Latin America, see Lagunes et al. (2019).

MILKEN INSTITUTE GLOBAL OPPORTUNITY INDEX 44
BIBLIOGRAPHY Alfaro, Laura, and Maggie Xiaoyang Chen. "Surviving the Global Financial Crisis: Foreign Ownership and Establishment Performance." American Economic Journal: Economic Policy. 2012.
"Cerro Grande Mining Corporation Announces Letter of Intent to Acquire the Assets Relating to the Pimentón Copper Gold Mining Project." GlobeNewswire. July 15, 2020. http://www.globenewswire.com/news-release/2020/07/15/2062662/0/en/Cerro-Grande-Mining-Corporation-Announces-Letter-of-Intent-to-acquire-the-Assets-relating-to-the-Piment%C3%B3n-Copper-Gold-Mining-Project.html.
Desai, Mihir A., C. Fritz Foley, and Kristin J. Forbes. "Financial Constraints and Growth: Multinational and Local Firm Responses to Currency Depreciations." The Review of Financial Studies. 2008.
Edwards, Sebastian. "Capital Inflows into Latin America: A Stop-Go Story? National Bureau of Economic Research, No. W6441 (1998). https://www.nber.org/papers/w6441.
Fox, Justin. "Lessons from Latin American Capital Flows." The Digest. October 1998. https://www.nber.org/digest/oct98/lessons-latin-american-capital-flows.
Fruman, C., and X. Forneris. "The False Debate: Choosing between Promoting FDI and Domestic Investment." World Bank: Private Sector Development Blog. June 6, 2016. https://blogs.worldbank.org/psd/false-debate-choosing-between-promoting-fdi-and-domestic-investment.
Lagunes, Paul, Xiaoxuan Yang, and Andrés Castro. "The State of Corruption in Latin America." Baker Institute Report 7 (2019). https://www.bakerinstitute.org/media/files/files/09570f2e/bi-report-070819-latam-corruption.pdf.
Milken Institute. Global Opportunity Index, 2021. https://milkeninstitute.org/global-opportunity-index.
Nelson, Rebecca M. "Argentina's Economic Crisis and Default." Congressional Research Service: Reports on Foreign Policy and Regional Affairs. June 15, 2020. https://crsreports.congress.gov/product/pdf/IF/IF10991/6.
OECD. “Measurement and Identification of Capital Inflow Surges.” October 2018. https://www.oecd.org/daf/inv/Measurement-identification-of-capital-inflow-surges-technical-note.pdf.

MILKEN INSTITUTE GLOBAL OPPORTUNITY INDEX 45
OECD. "Foreign Direct Investment Flows in the Time of COVID-19." 2020. https://www.oecd.org/coronavirus/policy-responses/foreign-direct-investment-flows-in-the-time-of-covid-19-a2fa20c4/.
Smith, Benjamin. "Global Opportunity Index 2021: White Paper." Milken Institute. 2021.
UNCTAD. "Investor-State Dispute Settlement Cases Pass the 1,000 Mark: Cases and Outcomes in 2019." IIA Issues Note: International Investment Agreements. New York and Geneva: United Nations. 2020a. https://unctad.org/system/files/official-document/diaepcbinf2020d6.pdf.
UNCTAD. "World Investment Report 2020: International Production beyond the Pandemic." New York and Geneva: United Nations. 2020b. https://unctad.org/system/files/official-document/wir2020_en.pdf.

MILKEN INSTITUTE GLOBAL OPPORTUNITY INDEX 46
ACKNOWLEDGMENTSThe authors would like to thank Keith Savard, Jihad Dagher, Bill Lee, and Perry Wong for numerous discussions related to this topic. They would also like to thank participants at the Milken Institute Research Department brown-bag meetings for useful comments.
ABOUT THE AUTHORSOscar Contreras, PhD, is an economist specializing in International Finance within the Research Department at the Milken Institute. He has experience in macroeconomics and financial markets, particularly in emerging economies. Before joining the Institute, Contreras was a senior economist at the research department of the Central Bank of Mexico, where he was responsible for providing macroeconomic analysis on monetary policy issues and conducting original research on macroeconomic and financial topics. Prior to his work at the Bank, he was an assistant professor at the University College for Financial Studies in Madrid, Spain. Contreras holds a PhD in economics from Northwestern University and a BA (Hons) in economics from the Center for Economic Research and Teaching in Mexico City.
Benjamin Smith is a research analyst in International Finance within the Research Department at the Milken Institute. His specialty areas include the intersection between technology and financial services, global economic policymaking, and foreign direct investment. Prior to joining the Milken Institute, Smith worked on trade policy issues with research institutes in the US and Canada and published articles on US economic policy with a leading international affairs magazine. Smith holds an MA in political science from Colorado State University and a BA from Keele University.
Joseph Bendix is a research analyst in International Finance within the Research Department at the Milken Institute. His work focuses on topics related to systemic risk, capital flows, and investment. More specifically, he is in charge of identifying and analyzing the market-level data sets in many of the research reports produced by the Institute. Bendix lends his experience to developing presentations for the Institute's conferences throughout the year. He holds a bachelor's in economics and a master of science in finance from the University of San Diego.

MILKEN INSTITUTE GLOBAL OPPORTUNITY INDEX 47
Claude Lopez, PhD, is the head of the Research Department at the Milken Institute, where she leads data-driven efforts aimed at influencing global policy issues on International Finance, Health Economics, and Regional Economics. She is an active member of the T20 task force on international financial architecture for stability and development and a contributor to W20 (Women 20), two advisory committees to the G20. Lopez has over 20 years of experience in academic and policy research in the US and abroad. Before joining the Institute, Lopez headed multiple research teams at the Banque de France, the nation's central bank, and was a professor of economics at the University of Cincinnati. She has an MS in econometrics from Toulouse School of Economics and a PhD in economics from the University of Houston.

SANTA MONICA | WASHINGTON | NEW YORK | LONDON | ABU DHABI | SINGAPORE