ESG Ratings: The Road Ahead - Milken Institute
52
ESG Ratings: The Road Ahead CLAUDE LOPEZ, PHD, OSCAR CONTRERAS, PHD, AND JOSEPH BENDIX
Transcript of ESG Ratings: The Road Ahead - Milken Institute
ESG Ratings: The Road Ahead
CLAUDE LOPEZ, PHD, OSCAR CONTRERAS, PHD,
AND JOSEPH BENDIX

ABOUT THE MILKEN INSTITUTE
The Milken Institute is a nonprofit, nonpartisan think tank. We catalyze practical,
scalable solutions to global challenges by connecting human, financial, and
educational resources to those who need them.
We leverage the expertise and insight gained through research and the convening
of top experts, innovators, and influencers from different backgrounds and
competing viewpoints to construct programs and policy initiatives. Our goal is
to help people build meaningful lives in which they can experience health and
well-being, pursue effective education and gainful employment, and access the
resources required to create ever-expanding opportunities for themselves and
their broader communities.
©2020 Milken Institute
This work is made available under the terms of the Creative Commons Attribution-NonCommercialNoDerivs 3.0
Unported License, available at creativecommons.org/licenses/by-nc-nd/3.0/.

MILKEN INSTITUTE ESG RATINGS: THE ROAD AHEAD
CONTENTS
1 Executive Summary
3 Introduction
9 What Is ESG Investing?
12 Disagreement among ESG Ratings
13 Disagreement by Economic Sector
18 What Is Driving the Discrepancies in ESG Scores?
20 Is It about the Data?
20 Variables' Predictive Power
24 Variable Contributions
24 Is It about the Methods?
24 Variable Interactions
29 Ratings: Observed versus Generated
30 Conclusion
31 Appendix 1 Number of ESG-Focused Funds
32 Appendix 2 ROE and Beta by ESG Score Decile
34 Appendix 3 Disagreement among Ratings and Market Capitalization
36 Appendix 4 Disagreement among Ratings at the Firm Level
38 Appendix 5 Top Individual Predictors for ESG Scores
40 Appendix 6 Variable Subcategories
42 Appendix 7 Calculating Variable Contributions
43 Appendix 8 Observed versus Generated Ratings and Firms' Characteristics
45 Bibliography
47 Acknowledgments
48 About the Authors

MILKEN INSTITUTE ESG RATINGS: THE ROAD AHEAD 1
ESG RATINGS: THE ROAD AHEAD
Claude Lopez, PhD, Oscar Contreras, PhD, and Joseph Bendix
EXECUTIVE SUMMARY
Environmental, social, and governance (ESG) issues have become particularly
important in recent years for investors, spurring companies to increase their efforts
at being socially responsible. Many leading publicly traded firms are releasing more
information about their ESG efforts. This trend is particularly true for social issues,
which have become more prominent amid widespread concerns about race relations,
law enforcement, and the pandemic.
In the absence of a structured framework to report and monitor firms’ ESG efforts,
the burden lies on companies to communicate on their initiatives and on investors
to research them. New technologies, such as big data analysis or AI, can help process
a larger set of information from different sources such as firms’ communication
strategies or other alternative sources. However, there is a need to define a core set of
variables that would capture these efforts as part of a long-term strategy. ESG rating
agencies could then process this information and provide their assessment of the
firms.
In this report, we show that a standard set of variables would partially resolve
inconsistencies and lack of uniform standards among rating providers, which often
confuses investors. Furthermore, we dissociate the impact of the rating agencies’
different focus on E, S, or G from that of using non-standardized data. While the
former, if properly disclosed, can be useful as it allows investors to choose what rating
will align more with their preferences, the latter necessarily requires harmonization
of the data.
Using publicly available information, we illustrate how difficult it is to understand
or predict some of the existing ratings. Yet we are also able to identify some
commonalities. All ratings agree on the worst performers. They also reach some
consensus when measuring risks arising from governance factors, especially for

MILKEN INSTITUTE ESG RATINGS: THE ROAD AHEAD 2
Corporate Social Responsibility Strategy and Management. Corporate Social
Responsibility Strategy includes variables that reflect a company’s practices to
communicate that it integrates economic (financial), social, and environmental
dimensions into its daily decisions. Management includes variables that measure a
company’s commitment and effectiveness towards following best practice corporate
governance principles.
Overall, our study has two main implications in assessing how well-equipped firms
are to address ESG risks. First, there is a need for data standardization, starting with
establishing common disclosure standards for ESG worldwide. The coordination of
data collection would reduce the reporting burden for firms, leading to improved
information quality. The goal is not to add to the existing efforts but to consolidate
and standardize the data collection efforts. This would increase firms’ participation
while improving the rating agencies’ credibility with investors.
The second implication of our study is the importance of transparency in the
methodologies used to calculate the rating. In other words, are E, S, and G factors
equally important? Or does the rating focus mostly on one of them? Each method uses
a different set of weights to aggregate data, which leads to a different rating, even
when using the same data. Rating agencies’ different emphases can be informative
as long as the agencies are clear about which ESG issues they prioritize and to what
degree. Such transparency will allow investors, firms, and other users to decide which
rating aligns best with their priorities.

MILKEN INSTITUTE ESG RATINGS: THE ROAD AHEAD 3
1 The volume of assets under management with an ESG focus can vary a lot depending on what is included. The numbers in the GSIA report should be considered as broad estimates, as they include multiple investment strategies.
2 For an analysis of this “monitoring effect” in a corporate governance context, see Grimminger and Di Benedetta (2013).
3 Wong and Petroy (2020).
4 BNP Paribas (2019).
INTRODUCTION
Asset owners and managers are increasingly incorporating Environmental, Social, and
Governance (ESG) factors into their financial analysis and decisions. According to the
Global Sustainable Investment Alliance (GSIA), an international agency that collects
information across Europe, the United States, Canada, Japan, Australia, and New
Zealand, the value of assets under management with an explicit ESG mandate reached
US $30.7 trillion at the beginning of 2018, an impressive 34 percent increase relative
to 2016. Investment strategies that explicitly incorporate ESG criteria now command
a significant fraction of all professionally managed assets across all these regions,
ranging from about 18 percent in Japan to more than 50 percent in Canada, Australia,
and New Zealand (see Figure 1.b).1
However, ESG-focused funds remain a low percentage of total assets under
management at the world’s largest asset managers (see Table 1). The lack of offerings
may be one of the explanations (see Figure 2 and Appendix 1).
The increasing focus on ESG investing has spurred an increase in the number and
influence of ESG rating agencies. By providing clear, cost-effective, and consistent
information about companies’ ESG performance, these agencies can play a crucial
role in helping funds and other investment groups pinpoint firms that meet their ESG
philosophies and standards. Moreover, an independent assessment of a company’s
ESG performance can also present companies with an opportunity to differentiate
themselves, potentially influencing them to adopt better practices to avert
downgrades or improve their scores.2
Some market participants remain skeptical of the value of ESG rating agencies’
information. A recent survey conducted by Sustainalytics, a major provider of ESG
research and ratings, found that many investors regularly rely on ratings to inform
their decisions. Yet, they find them difficult to use and sometimes are frustrated
by them.3 Inconsistencies in the information used and lack of comparability across
ratings have particularly confused investors and become a barrier to greater
adoption of ESG investing.4 These discrepancies across ESG ratings affect company
managers, who may face less urgency to improve their ESG performance and identify
appropriate strategies to do so.

MILKEN INSTITUTE ESG RATINGS: THE ROAD AHEAD 4
Differences across ESG scores can naturally emerge if rating providers adopt
different definitions of ESG performance. Some agencies, for example, may equate
ESG performance with a company’s compliance with specific ethical standards. In
contrast, others may emphasize a company’s ability to manage financially material
risks and opportunities arising from ESG factors. To a certain extent, the availability
of ratings with different definitions is natural, given the subjective nature of ESG
criteria. But more importantly,
it might be required to
satisfy investors and asset
managers with different
needs and motivations.
Agencies do not have to
agree on a single definition
but they should focus on
standardizing data, labeling
ratings more clearly, and
ensuring they are transparent
about their objectives.
Such priorities would allow
market participants to
differentiate products better
and to determine whether
a particular definition aligns
with their goals.
Figure 1: Professionally Managed Assets with an ESG Mandate
b) ESG Investing as a Fraction of Total Assets under Management, 2012-2018
a) Fraction of Global ESG Investing by Region (as of 2018)
Source: GSIA (2019)

MILKEN INSTITUTE ESG RATINGS: THE ROAD AHEAD 5
Inconsistencies across ESG rating agencies are not only an issue of definitions.
At least two other reasons can lead rating providers to score the same company
differently. First, rating providers may disagree on how to measure the same ESG
factor. Despite efforts by multiple standard-setting organizations, there is no
universally accepted approach to measuring non-financial indicators. Rating agencies
employ hundreds of ESG-related variables. Some come from company reports and
regulatory filings and, therefore, should be consistent across agencies. Yet many
others come through interviews or questionnaires and third-party independent
reports with potentially conflicting approaches. Second, even if agencies agree on how
to measure different ESG-related factors, each ESG agency has developed its own
methodology to decide what ESG-related indicators to consider and how to aggregate
them into an overall score.
Figure 2. Funds Satisfying Basic Investment Screen: ESG-Focused Funds versus Overall Category
Source: Morningstar Direct (2020)
Note: Out of 288 ESG-focused funds identified by Morningstar in the US, only 104 would pass a simple investment screen commonly employed by fund-of-fund managers: at least three years of historical returns and a fund size over US$50 million (Lauricella, 2020).

MILKEN INSTITUTE ESG RATINGS: THE ROAD AHEAD 6
Besides documenting the extent of the disagreement among ESG scores, we provide
insights into the drivers behind the inconsistencies. We contrast the impact of the
data and of the methodologies. We agree that the lack of data standardization is an
issue for both investors and assessed firms, and it should be resolved by harmonizing
the data collected and streamlining the process. However, differing methodologies
are not necessarily a negative thing if they reflect each rating agency’s prioritization
Table 1. Assets under Management (AUM) in ESG-Focused Funds
CompanyAUM ($US Billions)
ESG Investment ($US Billions)
ESG AUM Percentage
BlackRock $6,470.00 $17.58 0.27%
Vanguard $6,200.00 $9.54 0.15%
UBS $3,260.00 $0.29 0.01%
Fidelity $2,900.00 $0.67 0.02%
State Street $2,690.00 $0.17 0.01%
Allianz $2,490.00 $0.21 0.01%
Capital Group $2,060.00 $0.00 0.00%
JP Morgan Asset Management $1,900.00 $0.08 0.00%
Goldman Sachs $1,859.00 $0.13 0.01%
Bank of New York Mellon $1,800.00 $0.36 0.02%
PIMCO $1,780.00 $1.96 0.11%
Amundi $1,653.00 $0.32 0.02%
Prudential Financial $1,481.00 $0.00 0.00%
AXA Group $879.00 $0.00 0.00%
Morgan Stanley $552.00 $6.72 1.22%
Note: Funds classified as ESG explicitly stated in their mandates that the investments were chosen primarily for their ESG-risk mitigating characteristics. Keywords in the primary investment mandate also include impact investing, gender/ethnic diversification, and environmental sustainability.
Source: Morningstar Direct (2020)

MILKEN INSTITUTE ESG RATINGS: THE ROAD AHEAD 7
or specialization in a particular dimension (E, S, or G). However, agencies must be
transparent about what they are offering users and regarding how they arrived at the
assessment. Overall, we hope to inform market participants on how to contextualize
and critically evaluate discrepancies in ESG scores and offer useful information on
how to address them.
Our analysis focuses on rating agencies that employ the same definition of ESG
performance: a company’s ability to manage financially material risks and opportunities
arising from ESG factors. This allows us to concentrate on differences in how agencies
measure ESG factors and their methodologies for aggregating them into a single score.
We shed light on the sources of disagreement among ESG ratings using an indirect
approach. Our indirect method relies on machine learning techniques to identify and
estimate the relationship between the ESG ratings and publicly available explanatory
variables, which do not (necessarily) coincide with the ones used by the rating
agencies. We then compare the relationships among the rating of three agencies using
various methods. Finally, we assess the ability of our estimated ratings to replicate the
disagreement among the agencies’ ratings.
While all the agencies in our study use the same definition of ESG performance, their
ratings strongly coincide only for the worst performers, which represent a relatively
small number of firms. Overall, the substantial discrepancies among rating providers
cannot be easily explained based on information readily available to investors.
Our findings underscore the importance of data standardization and the necessity for
agencies to be transparent regarding the method they used and the information they
prioritize in their ESG assessment. Addressing these two issues will enable companies
and investors to make more sense of the ratings and use the information about ESG
factors to make better decisions.
The remainder of this report is organized as follows. To establish common
terminology, we begin with a discussion of the definition of ESG investing. We then
document the extent of disagreement over ESG scores among the three major rating
agencies at different levels of data aggregation. Next, we use machine learning
techniques to understand better how the various rating agencies assess a company’s
ESG performance based on a set of publicly available explanatory variables. Finally,
we offer some conclusions drawn from our analysis.

MILKEN INSTITUTE ESG RATINGS: THE ROAD AHEAD 8
ESG SCORE LEVELS AND FINANCIAL VARIABLES
This box illustrates the relationship between ESG score levels and some widely used financial variables for the studied group of companies.
After sorting the firms from the largest (10th decile) to the smallest (1st decile) based on their market capitalization, Figure 3 plots the average Beta (a measure of a particular asset’s volatility relative to the risk of general systemic market movement) and the average ESG scores for the three rating agencies. All three rating agencies award higher average scores to larger companies. These same firms show more resiliency (lower Beta) to risks, including ESG ones.
BOX
1
Figure 3. ESG Scores and Beta by Market Capitalization Decile
Source: Authors’ calculations using Bloomberg and Refinitiv Eikon data (2020)

MILKEN INSTITUTE ESG RATINGS: THE ROAD AHEAD 9
WHAT IS ESG INVESTING?
Although there is no universally accepted definition, ESG investing is widely
understood as an investment approach that looks beyond traditional financial
indicators by considering environmental, social, and governance (ESG) factors in the
selection and management of an investment portfolio. In various ways, many investors
have already been incorporating ESG issues into their investment frameworks for
some time. The modern reference to ESG investing, however, denotes a more explicit,
systematic integration of ESG factors into the investment process, as opposed to a
more informal, less structured approach.
INVESTORS CAN HAVE MULTIPLE MOTIVATIONS
Investors integrate ESG factors into their financial decisions for various (not mutually
exclusive) reasons. (See Box 2 for a list of factors commonly referred to as ESG).
• Some investors may consider that ESG data can help paint a broader picture of
a company’s operating environment. Accordingly, they rely on ESG investing
to identify and manage risks and opportunities that they cannot easily detect
through standard financial analysis—that is, as a source of financial value.
According to Dan Hanson, former managing director at BlackRock, “ESG is a
proxy for risk that is not priced in, and companies that better manage these risks
can deliver returns with greater certainty …”5 Reducing exposure to polluters or
companies with poor waste management policies, for example, can help mitigate
regulatory risk, whereas screening for good social practices (such as workplace
culture, human rights protection, or corporate community engagement) can
reduce exposure to scandals that could damage a company’s reputation.6
• Other investors rely on ESG investing to meet their values (e.g., ethical, religious,
political, or cultural) or to promote specific environmental, social, or governance
outcomes they deem desirable. Investors, for instance, may integrate ESG factors
into their financial decisions to identify and exclude companies engaging in
practices they find morally questionable, including low labor standards or human
rights violations. These investors might seek to advance their non-financial
objectives without hampering financial objectives. In some cases, they might
5 Cited in Koehler and Hespenheide (2013).
6 For studies on the relationship between ESG performance and profitability, see Friede et al. (2015) and, more recently, Verheyden et al. (2016).

MILKEN INSTITUTE ESG RATINGS: THE ROAD AHEAD 10
even be willing to sacrifice financial returns to achieve their non-financial goals. A
recent survey conducted by UBS among asset owners across 46 countries found
that “doing good for society and the environment” is among the top four drivers
behind ESG investing.7
• And still others, such as institutional investors or financial advisors acting
on behalf of a third party, may rely on ESG criteria to satisfy specific legal
requirements. One of the world’s largest investment funds, for example, the
Norwegian Government Pension Fund Global, is mandated to avoid companies
that contribute to or are responsible for “serious or systematic human rights
violations, … serious violations of the rights of individuals in situations of war or
conflict, severe environmental damage, … gross corruption, [or] other particularly
serious violations of fundamental ethical norms.”8
MULTIPLE LABELS FOR SIMILAR ISSUES
Despite its growing popularity, there are substantial terminological and conceptual
inconsistencies surrounding ESG investing. Phrases such as sustainable, responsible,
or socially responsible investing are sometimes conflated or used interchangeably
with the term ESG investing. The broad array of terms that describe various ESG
approaches and a lack of consistency in their use have confused investors. A recent
survey conducted by State Street Global Advisors found that over half of those
investors already implementing some type of ESG strategy within their portfolio were
struggling with a lack of clarity around ESG terminology in their organizations.9
To reduce confusion among investors, and because the common theme underlying
all the different labels is an emphasis on ESG issues, we believe that the more neutral
term, ESG investing, is appropriate. Accordingly, we see ESG investing as an umbrella
term for an investment approach that involves some type of environmental, social, or
governance consideration that can have various motivations and that, depending on
the investor’s goals, resources, and circumstances, may involve different strategies.10
7 See, for example, Fritsch (2019).
8 Norway’s Ministry of Finance (2019).
9 State Street Global Advisors (2018).
10 For a detailed discussion on how to incorporate ESG factors into the investment process, see Grim and Berkowitz (2018).
MILKEN INSTITUTE ESG RATINGS: THE ROAD AHEAD 11
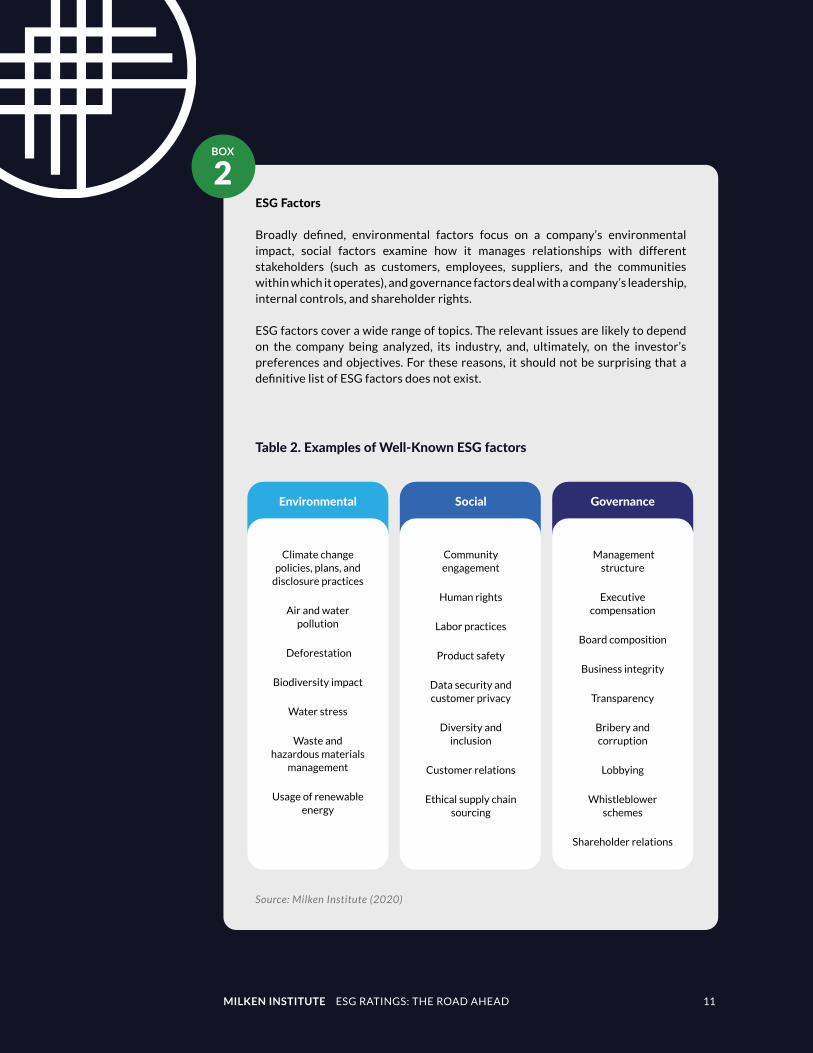
ESG Factors
Broadly defined, environmental factors focus on a company’s environmental impact, social factors examine how it manages relationships with different stakeholders (such as customers, employees, suppliers, and the communities within which it operates), and governance factors deal with a company’s leadership, internal controls, and shareholder rights.
ESG factors cover a wide range of topics. The relevant issues are likely to depend on the company being analyzed, its industry, and, ultimately, on the investor’s preferences and objectives. For these reasons, it should not be surprising that a definitive list of ESG factors does not exist.
BOX
2
Table 2. Examples of Well-Known ESG factors
Environmental Social Governance
Climate change policies, plans, and
disclosure practices
Air and water pollution
Deforestation
Biodiversity impact
Water stress
Waste and hazardous materials
management
Usage of renewable energy
Community engagement
Human rights
Labor practices
Product safety
Data security and customer privacy
Diversity and inclusion
Customer relations
Ethical supply chain sourcing
Management structure
Executive compensation
Board composition
Business integrity
Transparency
Bribery and corruption
Lobbying
Whistleblower schemes
Shareholder relations
Source: Milken Institute (2020)

MILKEN INSTITUTE ESG RATINGS: THE ROAD AHEAD 12
DISAGREEMENT AMONG ESG RATINGS
Our analysis considers three major rating agencies that emphasize the financial
impact of ESG factors when measuring a company’s ESG performance: RobecoSAM,
Sustainalytics, and Thomson Reuters.11 Considering only ratings that agree on
a definition of ESG performance allows us to concentrate on the different ways
agencies measure ESG factors and the methodologies they use to aggregate them
into a single score. Our sample contains annual information on 943 firms for the
year 2018, the latest for which all three ESG scores were available.12 The data were
collected from Bloomberg and Refinitiv Eikon.
A simple glance at the distributions of ESG ratings (see Figure 4) confirms that the
agencies’ assessments of the firms are different: Most of Thomson Reuters scores
are concentrated around high values, between 50 and 80, while RobecoSAM
and Sustainalytics spread them mostly evenly between 10 and 90.
11 According to Gaffuri (2017), RobecoSAM’s methodology seeks to identify “… any [ESG] factor which might have a present or future impact on companies’ value drivers, competitive position, and thus on long-term shareholder value creation.” According to Sustainalytics (2019), its rating “measure[s] the degree to which a company’s economic value is at risk driven by ESG factors.” And according to Thomson Reuters (2018), its rating helps to “easily identify companies with … exposure to ESG risks.”
12 To construct our sample of firms, we started with the 2,000 largest companies by market capitalization. We then excluded companies for which we were unable to procure information on all three different ESG scores, as well as companies for which a substantial fraction of the explanatory variables used in the following section was missing. For multiannual scores, we consider the last available for 2018.
Figure 4: ESG Score Distributions
Bloomberg and Refinitiv Eikon (2020)

MILKEN INSTITUTE ESG RATINGS: THE ROAD AHEAD 13
The pairwise correlations, reported in Table 3, confirm that RobecoSAM and
Sustainalytics tend to agree the most in their assessment with a correlation of 0.72.
This level of agreement is significantly lower than the one usually encountered among
credit ratings, with an average correlation of 0.986.13
13 For other studies reporting correlations among ESG rating agencies, see Berg et al. (2020), Gibson et al. (2019), and State Street Global Advisors (2019).
14 We use the Thomson Reuters Business Classification to assign each company into one of ten different economic sectors.
15 The higher heterogeneity in the Energy sector should be taken carefully, for it is also one of the sectors with the lowest number of observations (48).
Table 3: Correlations between ESG Ratings
Pair of Scores Correlation
RobecoSAM vs. Sustainalytics 0.72
RobecoSAM vs. Thomson Reuters 0.65
Sustainalytics vs. Thomson Reuters 0.65
Note: The correlations are the Pearson product-moment correlation coefficients.
DISAGREEMENT BY ECONOMIC SECTOR
A look at the economic sectors (with Figure 5 for correlations and Table 4 for a
short description of the sectors including their unique regulatory and financial
characteristics) allows us to derive more granular insights into the differences:14
• The overall level of agreement among ratings (i.e., the average pairwise
correlation between ESG scores) varies substantially across sectors, ranging from
0.50 in Energy to 0.77 in Technology.
• The highest within-sector heterogeneity in the level of agreement among ratings
occurs in the sector with the lowest correlation, Energy.15 The companies in
this sector may be harder to evaluate, as they are highly regulated or because
significant investments in infrastructure make it harder to identify the relevant
ESG risks and the appropriate strategies to deal with those risks.
Source: Authors’ calculations using Bloomberg and Refinitiv Eikon data (2020)

MILKEN INSTITUTE ESG RATINGS: THE ROAD AHEAD 14
• Sectors with a higher level of agreement among ratings, such as Financials,
Technology, and Cyclical Consumer Goods & Services, seem to place less emphasis
on environmental factors, particularly the first two. This insight could indicate,
for example, more consistency across rating agencies on the appropriate way to
measure financially material risks arising from social and governance factors.
Overall, the three rating agencies give very different ESG scores, with a correlation
below 0.5, to more than 60 percent of the firms. In contrast, they have a very similar
assessment, with a correlation of 0.95 or more, for only 10 percent of the firms, the
worst-performing ones. (See Appendices 3 and 4 for an analysis of disagreement by
market capitalization decile and at the firm level).
Substantial discrepancies in ESG scores across rating agencies is a problem for both
investors and companies. Investors may have difficulties in integrating ESG factors
into their portfolios in a manner that reflects their preferences. Companies could
be discouraged from improving their ESG performance, as they may not be able to
identify an appropriate strategy, or they may find the outcome too uncertain and not
worth the investment.
Figure 5: Correlations between ESG Ratings
Bloomberg and Refinitiv Eikon (2020)

MILKEN INSTITUTE ESG RATINGS: THE ROAD AHEAD 15
Sector DescriptionUnique Financial and Regulatory Characteristics
Basic Material(68)
Companies involved in the discovery, development, and processing of raw materials, including mining and metal refining, chemicals, and packaging (e.g., Ecolab, Dupont, Dow).
Companies in this sector supply most of the materials used in construction. Thus, they are sensitive to changes in the business cycle and tend to thrive when the economy is strong, exhibiting a rather high Beta of 1.13 on average.
Consumer Cyclical(120)
Companies that produce elastic or non-essential goods and services purchased by individuals and households such as automobiles (e.g., Ford, GM), specialty retailers (e.g., Amazon), hotels and entertainment (e.g., Marriott International), and media-publishing (e.g., ViacomCBS).
Compared to the Consumer Non-Cyclical sector, the Consumer Cyclical sector has higher profit margins, but its demand is more sensitive to the business cycle. The sector has a reactive Beta to the market, at 1.17. Consumer Non-Cyclical companies trade at the lowest sector average of 2.1x sales.
Consumer Non-Cyclical(82)
Companies that produce inelastic or essential goods and services purchased by individuals and households. Industries within the sector include food and drug retailers (e.g., Walmart), food and tobacco producers (e.g., General Mills), beverage producers (e.g., Coca-Cola), and personal and household products/services (e.g., Procter & Gamble).
Within the Consumer Non-Cyclical sector, businesses provide goods/services that have a relatively inelastic demand. Due to this inelasticity, Consumer Non-Cyclical companies can employ larger debt levels relative to other sectors, utilizing leverage to increase return on equity (ROE). Consumer Non-Cyclicals exhibit a comparatively smaller average Beta at just 0.65.
Energy(48)
The Energy sector includes companies involved in the exploration and development of oil or gas reserves, oil and gas drilling, and refining (e.g., Exxon Mobil, Chevron, Occidental Petroleum, Schlumberger).
Companies in the Energy sector incur large capital expenditure costs to create and maintain core business activity infrastructure. Energy providers are extremely susceptible to output pricing and supply and demand shocks, leading to the highest average Beta across sectors (at 1.36). The industry also pays the largest dividend yield to investors, averaging 7.06 percent on an annual basis.
Table 4. Economic Sectors: Description and Unique Features

MILKEN INSTITUTE ESG RATINGS: THE ROAD AHEAD 16
Financials(226)
The largest represented sector in the S&P 500 by number of firms. It includes large banking institutions (e.g., JPMorgan Chase & Co., Bank of America), payment services (e.g., American Express), as well as insurance and asset management institutions (e.g., BlackRock and MetLife).
The Financials sector treats debt fundamentally different from all other economic sectors, utilizing it as a revenue-generating asset from a lender/investor perspective. This feature creates the widest discrepancy between enterprise value and market capitalization at a 2.09:1 ratio among the economic sectors. Financials are more volatile than the overall market, with an average Beta of 1.08. ROE for the sector was 12.01 percent, below the sector-agnostic average of 27 percent. The Financials sector is also highly regulated and therefore affected by governmental decisions.
Health Care(83)
The Health Care sector consists of companies that provide medical services (e.g., UnitedHealth Group, Cigna), health-care equipment and devices (e.g., Johnson & Johnson, Thermo Fisher Scientific), and pharmaceuticals/biotechnology (e.g., Gilead, Pfizer, Merck).
Because of the necessity of its products, the Health Care sector has a Beta (.98) that most closely mirrors the S&P 500, while generating the second-highest average ROE at 31 percent. Influenced by outliers within the highly volatile biotechnology industry, the Health Care sector has by far the largest average EV/EBIT valuation multiple at 111x, ranging from 7x to 7,152x. The sector also exhibits the second-highest average price-to-earnings ratio at 38, partly due to the highly regulated Food and Drug Administration approval process (with successful drug patents allowing for monopolies on certain drug/treatment advancements that possess pricing power to recoup R&D costs).
Industrials(132)
Enterprises that produce machinery (e.g., Boeing, Caterpillar), passenger and material transportation (e.g., Delta, UPS), and aerospace and defense (e.g., Lockheed Martin, Raytheon) all fall under the Industrials umbrella.
The most diverse sector in terms of products or services, Industrials exhibits the largest range of ROE in the S&P 500, returning anywhere between -225 percent and +766 percent. Industrials also exhibit comparatively lower valuation multiples on average: 14x EV/EBITDA, 16x EV/EBIT, 2.8x EV/Sales, and 21 P/E.
Sector DescriptionUnique Financial and Regulatory Characteristics
Table 4. Economic Sectors: Description and Unique Features (continued)

MILKEN INSTITUTE ESG RATINGS: THE ROAD AHEAD 17
Sector DescriptionUnique Financial and Regulatory Characteristics
Technology(96)
The Technology sector offers a wide range of products and services for both customers and other businesses. Industries within the Technology sector include software and IT (e.g., Microsoft), communications and networking (e.g., Facebook), computers, phones, household electronics (e.g., Apple), and office equipment (e.g., Cisco).
The Technology sector is unique in many ways. Contrary to other sectors, profit takes a back seat to growth, and operating metrics are not as pertinent to the valuation discussion. Because of this growth focus, operators in this sector tend to shy away from debt financing, exhibiting a comparatively low 82 percent debt-to-equity ratio on average for 2018. The propensity for equity financing provides for larger cash-on-hand in the balance sheet, making it the only sector in the S&P 500 whose average market capitalization is greater than the enterprise value of the firm. Strong cash infusions through equity offerings allow tech companies to possess the largest average current and quick ratios on the balance sheet, at 2.35 and 2.14, respectively. The Technology sector is characterized by high average valuation multiples, trading at 22x EBITDA, 5.5x sales, and 52x earnings, the highest of any sector.
Telecom(29)
The Telecommunications sector consists of companies that transmit data in words, voice, audio, or video globally (e.g., AT&T, Verizon, T-Mobile, CenturyLink).
While the sector remains concentrated, it is moving toward a more decentralized system with less regulation and barriers to entry. Beta is much lower than average at .62. Because firms often operate on a subscription and revenue recognition model, dividend yields are larger than in most other economic sectors at an average of 5.52 percent yield per year, second only to Energy.
Utilities(59)
The Utilities sector includes companies that provide basic amenities, such as water, sewage services, electricity, dams, and natural gas (e.g., Nextera Energy, Duke Energy, Edison International, Sempra).
Utilities are part of the public service landscape and, therefore, heavily regulated. It typically offers stable and consistent dividends (4.47 percent), coupled with less price volatility relative to equity markets, possessing the smallest average Beta at .61. Because of the inelastic nature of the products and services provided, Utilities companies do not need the same type of balance sheet cash cushion required in other economic sectors, allowing them to possess the lowest average quick and current ratios of any sector at .85 and .93, respectively.
Note: The number in parenthesis below the sector name indicates the number of companies in our sample.
Source: Authors’ calculations using Bloomberg and Refinitiv Eikon data (2020)
Table 4. Economic Sectors: Description and Unique Features (continued)

MILKEN INSTITUTE ESG RATINGS: THE ROAD AHEAD 18
WHAT IS DRIVING THE DISCREPANCIES IN ESG SCORES?
Understanding what drives these discrepancies is essential to make sense of them.
Not having access to the raw data or the detailed methodologies employed by the
different ESG rating agencies, our analysis of their disagreement relies on an indirect
approach that uses publicly available information. It consists of three steps:
1. Collection of publicly available ESG and other indicators for the firms studied.
A total of 207 ESG indicators (58 related to environmental factors, 70 to social
factors, and 79 to corporate governance factors), as well as 35 financial variables
and information on both headquarters location and economic sector.16
2. Estimation of the relation between the ESG ratings and the explanatory
variables. Standard econometric techniques cannot easily handle a large number
of variables, and they usually require specifying a particular structure on the
relationships among variables. As an alternative, we use a machine learning
technique called random forest. Random forest models can accommodate
complex, non-linear patterns and can handle different types of variables
efficiently.17
3. Comparison of the estimation results across ratings. Estimation results look at
three distinct and complementary angles: (i) the variables’ ability to predict the
ESG scores, (ii) their contribution to the ratings predicted by our estimation, and
(iii) the importance of the variables’ interaction when predicting the ESG scores.
Exercises (i) and (ii) tell us how informative individual variables are regarding
the content of the ratings. On the other hand, (iii) tells us something about how
that information is aggregated into a single score (not how agencies actually
do it, but how it is done in terms of the estimated relations between ratings
and explanatory variables). Finally, we compare the disagreement among the
predicted ESG ratings with the one observed among the agencies’ ratings.
16 The data were collected from Refinitiv-Eikon, a major provider of financial news and information. A detailed list of all the explanatory variables is available upon request.
17 In contrast to other algorithms, random forest models also generate an internal measure of the model’s ability to predict previously unseen observations, thereby eliminating the need to use a separate dataset to evaluate their performance.

MILKEN INSTITUTE ESG RATINGS: THE ROAD AHEAD 19
RANDOM FOREST MODELS: A PRIMER
A random forest is a machine learning algorithm. It combines the outcomes of a large number of individual decision trees to generate a single prediction, either by calculating the average (when the prediction variable is continuous) or by implementing a “majority vote” (when the prediction variable is categorical). Unsurprisingly, the model is called a forest because it relies on a multiplicity of decision trees. But what exactly is a decision tree? Why do we need many of them? And in what sense is the forest random?
A decision tree is a predictive algorithm that, as its name implies, uses a tree-like structure to predict the value of a target variable using a set of explanatory variables. A decision tree starts with a single node, which then branches into possible outcomes based on the value of one of the explanatory variables. Each of those outcomes leads to additional nodes, which once again branch off into other possibilities based on another explanatory variable, giving it a tree-like shape. This process continues until a terminal node is reached, which leads to no additional sub-nodes and contains our prediction for the variable of interest. Decisions regarding what explanatory variables to use at each node, and how to use them to split the tree, are taken sequentially (from top to bottom) and are based on the gain in precision induced by the split.
Although decision trees provide a very intuitive modeling approach, they tend to perform poorly when predicting previously unseen observations (i.e., observations that were not used to estimate the model). This poor performance occurs because decision trees suffer from a problem called “high variance.” Since decision tree models are incredibly flexible, they tend to overfit the data used to estimate them. As a result, decision trees tend to capture not only the actual relationship between predictors and outcome but also the noise contained in the sample (which results in poor predictive performance).
Various techniques (such as pruning, minimum node size, and maximum number of terminal nodes) can mitigate overfitting, but estimating a random forest is one of the most common approaches. The basic idea is simple: By combining many “imperfect” decision trees, we can “average out” their individual mistakes and dramatically improve the accuracy of our predictions. This approach, however, requires that each decision tree in the forest be different so that it provides new information. It is here where the “random” part of the model becomes relevant. Ideally, we would like to estimate each decision tree using a different sample from the population of interest; this is rarely feasible. Instead, we can achieve something similar by injecting randomness into the tree-growing process by doing the following: 1) estimating each tree using a different random sample with replacement drawn from the original dataset, and 2) deciding how to split a node and limiting the search to a randomly selected subset of explanatory variables.
BOX
3

MILKEN INSTITUTE ESG RATINGS: THE ROAD AHEAD 20
IS IT ABOUT THE DATA?
We use data publicly available on the firms to identify what information the ESG
ratings are capturing. Although these variables do not necessarily coincide with those
employed by the rating agencies, we can expect them to be related to the various ESG
ratings—and, therefore, to be representative of their content. Furthermore, using
the same variables across the ratings allows us to indirectly assess the impact of
standardizing the information.
Variables’ Predictive Power18
One way to do that is by assessing the ability of the explanatory variables, individually
or grouped, to predict the rating agencies’ ESG scores.
First, focusing on the top 10 variables with the highest predictive power for each of
the ESG scores, Table 5 shows that:19
• The factors have different predictive power across the ratings. Although
environmental factors seem to be important predictors for all three ESG scores,
they are disproportionally so for Thomson Reuters. By contrast, RobecoSAM and
Sustainalytics appear to offer a more balanced picture across environmental,
social, and governance indicators.
• Very few factors overlap across the three ratings. Of the top ten predictors, only
two are common among all rating providers: Target Emissions and Corporate Social Responsibility Reporting.20 However, RobecoSAM and Sustainalytics share eight
common top predictors.
Second, we extend the analysis to all variables. To do so, we aggregate them in
categories when assessing how well they predict the different ratings. Figure 6
reports the outcome when considering five broad categories: environmental, social,
governance, financial, and others. Figure 7 expands the analysis to 18 subcategories:
three environmental, four social, three governance, six financial, and two related to
other factors.
18 Our analysis is based on two of the most widely used measures, Mean Decrease in Impurity and Perturbation Importance, using Li et al. (2019) and Breiman (2001), respectively.
19 The top predictors were chosen by ranking all explanatory variables in ascending order according to each of our two measures and selecting the first 10 variables to appear in both rankings.
20 Target Emissions measures whether a company has set and achieved short-term and long-term targets to reduce emissions to land, air, or water from business operations. Corporate Social Responsibility Reporting measures a company’s efforts to publish a report on Corporate Social Responsibility, Health and Safety, or Sustainability issues.

MILKEN INSTITUTE ESG RATINGS: THE ROAD AHEAD 21
Thomson Reuters RobecoSAM Sustainalytics
Environmental Variables
Target Emissions Target Emissions Target Emissions
Resource Reduction Policy Renewable Energy Use Renewable Energy Use
Emissions Policy Resource Reduction TargetsEnvironmental Supply Chain Management
Environmental Supply Chain Management
Policy Environmental Supply Chain
Environmental Supply Chain Policy Resource Reduction Targets
Environment Management Training
Energy Efficiency Policy
Social Variables
Flexible Working Hours Fundamental Human Rights Fundamental Human Rights
Human Rights Contractor Human Rights Contractor
Human Rights Policy
Governance Variables
Corporate Social Responsibility Reporting
Corporate Social Responsibility Reporting
Corporate Social Responsibility Reporting
Independent Board Members Stakeholder Engagement Stakeholder Engagement
Global Compact Signatory Global Compact Signatory
Board Gender Diversity
Source: Authors’ calculations using Bloomberg and Refinitiv Eikon data (2020)
Table 5. Top 10 Predictors for ESG Scores
• The overall environmental and governance factors have the highest predictive
power for all three ESG scores. Social and financial considerations—in no
particular order—follow, and then other factors.
• Emissions and Resource Use have the most predictive power for environmental
factors. Emissions refers to variables that measure a company’s commitment and
effectiveness in reducing environmental emissions in production and operational
processes. Resource Use refers to variables that reflect a company’s performance
and capacity to reduce the use of materials, energy, or water, and to find more
eco-efficient solutions by improving supply chain management. The subcategory
Innovation, which includes variables that reflect a company’s capacity to reduce
its environmental impact through new environmental technologies and processes,
shows little power.

MILKEN INSTITUTE ESG RATINGS: THE ROAD AHEAD 22
• CSR Strategy and Management capture most of the predictive power of
governance factors across the ratings.21 Yet Management is significantly more
relevant than CSR Strategy in predicting Sustainalytics’ ESG scores. The results
also confirm our previous finding that the relative importance of environmental
variables is significantly higher for Thomson Reuters than for the other two rating
agencies.
• Among social variables, Human Rights and Workforce have the highest
predictive power across all agencies. Product Responsibility has the lowest.22
However, while Workforce is the most critical social subcategory for Thomson
Reuters, Human Rights is the top predictor for RobecoSAM and Sustainalytics.
21 CSR Strategy includes variables that reflect a company’s practices to communicate that it integrates the economic (financial), social, and environmental dimensions into its daily decision-making processes. On the other hand, Management includes variables that measure a company’s commitment toward and effectiveness in following best practice corporate governance principles.
22 Human Rights include variables that measure a company’s effectiveness towards respecting the fundamental human rights conventions. Workforce refers to variables that reflect a company’s effectiveness towards job satisfaction, a healthy and safe workplace, maintaining diversity and equal opportunities, and development opportunities for its workforce. Product Responsibility includes variables that reflect a company’s capacity to produce quality goods and services integrating the customer’s health and safety, integrity, and data privacy.
Figure 6: Predictive Power by Category
Source: Bloomberg and Refinitiv Eikon (2020)

MILKEN INSTITUTE ESG RATINGS: THE ROAD AHEAD 23
Figure 7: Predictive Power by Subcategory
Source: Authors’ calculations using Bloomberg and Refinitiv Eikon data (2020)
a) Measure 1: Mean Decrease in Impurity
b) Measure 2: Perturbation Impurity

MILKEN INSTITUTE ESG RATINGS: THE ROAD AHEAD 24
Variable Contributions
The other way to identify what information the ESG ratings are capturing is to
evaluate how much each variable contributes to the predicted ESG rating. To do
so, we use the predictive power of the variables to generate new ESG ratings. We
then estimate the actual contribution of each group of variables to these predicted
ESG ratings. Figure 8 reports the results for the categories and Figure 9 for the
subcategories.23 Ultimately, this allows us to identify how much the different factors
matter when calculating the various ratings, based on the information derived from
the machine learning analysis:
• Governance and financial variables are the top two contributors for all three
ratings. Governance is the category whose importance is robust across the two
analyses: prediction power of a category and contribution to the predicted score.
Yet, its magnitude varies significantly across rating providers.
• Management and CSR Strategy drive the contribution of governance, in line with
the previous analysis. Yet, CSR Strategy contributes negatively to the predicted
Sustainalytics score.
• Balance Sheet and Cash Flow Statement drive the contribution of financial
variables. And both are negatively related to the predicted Sustainalytics score.
• Environmental variables are still important for the predicted Thomson Reuters
score, especially Emissions and Resources Use.
• Workforce remains an important sub-category for social variables, in line with
the previous analysis.
IS IT ABOUT THE METHODS?
Beyond the variables, the methods for aggregating the information differ from one
rating to another. We illustrate this point by looking at how the variables interact.
Finally, we show how challenging it is for investors to understand and rationalize the
discrepancies across ESG scores by comparing the rating we have generated with the
one provided by the agencies.
Variable Interactions
Looking at the interaction among variables or groups of variables helps explain how
the ways agencies aggregate information impacts ratings. We use the estimated
random forests to determine whether—and to what extent—the different explanatory
23 See Appendix 7 for more details on how variable contributions are calculated.

MILKEN INSTITUTE ESG RATINGS: THE ROAD AHEAD 25
Figure 8. Contribution to Predicted ESG Scores by Category
Figure 9. Contribution to Predicted ESG Scores by Subcategory
Source: Authors’ calculations using Bloomberg and Refinitiv Eikon data (2020)
Source: Authors’ calculations using Bloomberg and Refinitiv Eikon data (2020)

MILKEN INSTITUTE ESG RATINGS: THE ROAD AHEAD 26
variables interact with each other when predicting the ESG scores. The overall
interaction (see Figures 10 and 11) is different across the ratings, especially at the
subcategory level. For example, while the overall interaction effects of environmental
variables are concentrated on the subcategory Resource Use for the predicted
Thomson Reuters and RobecoSAM ratings, they appear to be (roughly) evenly divided
between Emissions and Resource Use for Sustainalytics. Similarly, although the overall
interaction effects associated with governance variables seem to be concentrated on
the subcategory Management for the predicted Sustainalytics rating, they are more
evenly distributed between Management and Shareholders for RobecoSAM and (to a
lesser extent) for Thomson Reuters.
Figures 12 and 13 focus on the pairwise interaction by category and subcategories.24
These pairwise effects measure the extent to which variables belonging to one group
interact with variables in another group. As expected, the results show significant
differences across rating agencies. For the predicted Thomson Reuters rating, for
example, most pairwise interaction effects are relatively weak and evenly distributed
across categories and subcategories.
By contrast, pairwise interaction effects appear to be relatively larger and more
concentrated for the other two predicted ratings. In the case of RobecoSAM, the
most substantial pairwise interaction effects are between financial and governance
variables (especially between Valuation and Management), within financial variables
(driven by the interaction between Balance Sheet and Operating Metrics), between
environmental and social variables (mostly driven by the interaction between
Emissions and Product Responsibility), and between financial variables and other
(Valuation and Location).
Similarly, for the predicted Sustainalytics rating, there are significant interaction
effects between governance and environment (Management and Resource Use),
governance and finance (Human Rights and Balance Sheet), and within governance
(variables in the Management subcategory).
Perhaps surprisingly, the interaction between Classification (which includes
a company’s economic sector) and all the environmental, social, and governance
subcategories appears to be very weak. This result is at odds with the use of sector-
specific methodologies, a claim made by all three rating agencies in our sample.25
Our analysis uses standardized data to show how information processing matters
for the ratings. Yet harmonization of the methods is not necessarily the solution.
24 Following Friedman and Popescu (2008), we estimate variable interaction effects by decomposing the prediction function into main and interaction effects and measuring how much the variance in the model’s predictions depends on the latter.
25 See Gaffuri (2017, p. 11), Sutainalytics (2019, p. 5-6), and Thomson Reuters (2018, p. 6).

MILKEN INSTITUTE ESG RATINGS: THE ROAD AHEAD 27
Figure 10. Overall Interaction Strength by Category
Figure 11. Overall Interaction Strength by Subcategory
Source: Authors’ calculations using Bloomberg and Refinitiv Eikon data (2020)
Source: Authors’ calculations using Bloomberg and Refinitiv Eikon data (2020)

MILKEN INSTITUTE ESG RATINGS: THE ROAD AHEAD 28
Figure 12. Pairwise Interaction Strength by Category
Figure 13. Pairwise Interaction Strength by Subcategory
Source: Authors’ calculations using Bloomberg and Refinitiv Eikon data (2020)
Source: Authors’ calculations using Bloomberg and Refinitiv Eikon data (2020)

MILKEN INSTITUTE ESG RATINGS: THE ROAD AHEAD 29
Not being able to reconcile the ratings due to their different data treatment is not
an issue as long as the differences reflect the rating agencies’ priorities, emphasizing
the ESG issues they deem most important. If that is the case, these choices must be
shared with the rating users, investors, or firms, which will decide which rating is more
aligned with their priorities.
RATINGS: OBSERVED VERSUS GENERATED
To conclude our analysis, we check the ability of the generated ratings to replicate
the level of disagreement between the actual ESG rating of the agencies. Comparing
predicted and observed levels of disagreement offers valuable information to
investors: It captures the difficulty in predicting and understanding the discrepancies
across ESG scores based on information readily available to market participants.
Table 6 reports correlation coefficients for each possible pair of ESG scores as
predicted by the estimated random forests and as observed in the data. For all three
pairs, the correlations between predicted scores are greater than those observed
in the agencies’ ESG ratings. Using similar data while allowing for different methods
to process it strengthens the convergence across the ratings, confirming that using
standardized data will lead to more comparable ratings.26
26 Novick (2020).
Observed ESG Scores Predicted ESG Scores
RobecoSAM vs. Sustainalytics 0.72 0.87
RobecoSAM vs. Thomson Reuters 0.65 0.82
Sustainalytics vs. Thomson Reuters 0.65 0.79
Table 6. Correlations between ESG Ratings: Observed and Predicted
Note: The correlations are the Pearson product-moment correlation coefficients.
Source: Authors’ calculations using Bloomberg and Refinitiv Eikon data (2020)

MILKEN INSTITUTE ESG RATINGS: THE ROAD AHEAD 30
CONCLUSION
Rating providers’ inconsistencies and the inability to compare their findings often
confuse investors. While differences across ESG scores can naturally emerge if rating
providers adopt different definitions of ESG performance, our analysis shows that
differences arise even when the rating agencies use similar definitions. Thus, the focus
when it comes to ESG ratings should not be on agreeing on a single definition but on
standardizing the data, achieving greater clarity in labeling ratings, and making their
objectives more transparent.
Our analysis illustrates how difficult it is to understand or predict the ratings. It
shows that most discrepancies among rating providers cannot be easily explained by
information readily available to investors or other users of these ratings. Yet two clear
outcomes emerge:
• The three ratings strongly agree on who are the worst performers, with a
correlation higher than 0.95.
• The three ratings reach some consensus when measuring risks arising from
governance factors, especially for Corporate Social Responsibility Strategy and Management. The first subcategory of governance includes variables that reflect
a company’s practices to communicate that it integrates economic (financial),
social, and environmental concerns into its daily decision-making. The second
one includes variables that measure a company’s commitment toward and
effectiveness in following best practice and corporate governance principles.
Overall, our study has two main implications in assessing how well-equipped firms
are to deal with ESG risks. First, there is a need for data standardization. The use of
standardized data will help to reconcile the ratings, at least partially. The first step
will be to agree on common disclosure standards and to align the different existing
ESG disclosure standards worldwide. The resulting harmonization of the data would
reduce the reporting burden on the firms and increase the quality of the information
collected. This will increase the firms’ participation while improving the rating
agencies’ credibility with investors.
Creating consistent, high-quality data is only part of the solution. The second
implication of our study is the importance of transparency regarding the
methodologies to calculate the rating or the focus of the rating. Are E, S, and G
factors equally important? Or is the rating focusing mostly on one of them? Our study
highlights the importance of rating agencies’ different methodologies for aggregating
data and their impact on the ratings. Rating agencies’ different emphases can be
informative by reflecting the ESG issues that agencies deem most important. But the
agencies must be transparent about their methods with investors, firms, and other
users who can then decide which rating most aligns with their priorities.

MILKEN INSTITUTE ESG RATINGS: THE ROAD AHEAD 31
APPENDIX 1.
Number of ESG-Focused Funds
Table A.1. Number of ESG-Focused Funds in Largest Asset Management Firms
Company# of Funds (All Share Classes)
# of ESG Funds
Percentage ESG
BlackRock 1,038 18 1.73%
Prudential Financial 322 0 0.00%
Fidelity 318 5 1.57%
Morgan Stanley 262 7 2.67%
Vanguard 207 6 2.90%
Bank of New York Mellon 205 8 3.90%
JP Morgan Asset Management 197 2 1.02%
PIMCO 146 14 9.59%
State Street 140 2 1.43%
Amundi 136 5 3.68%
Goldman Sachs 104 2 1.92%
Capital Group 62 0 0.00%
Allianz 51 3 5.88%
UBS 26 4 15.38%
AXA Group 10 0 0.00%
Note: Funds classified as ESG explicitly stated in their mandates that investments were chosen primarily for their ESG-risk mitigating characteristics. Keywords in the primary investment mandate also included impact investing, gender/ethnic diversification, and environmental sustainability.
Source: Morningstar Direct (2020)

MILKEN INSTITUTE ESG RATINGS: THE ROAD AHEAD 32
APPENDIX 2.
ROE and Beta by ESG Score Decile
Figure A.1.
a) Thomson Reuters' ROE and Beta by ESG Score Decile
b) RobecoSAM's ROE and Beta by ESG Score Decile

MILKEN INSTITUTE ESG RATINGS: THE ROAD AHEAD 33
c) Sustainalytics' ROE and Beta by ESG Score Decile
Source: Bloomberg and Refinitiv Eikon data (2020)

MILKEN INSTITUTE ESG RATINGS: THE ROAD AHEAD 34
APPENDIX 3.
Disagreement among Ratings and Market Capitalization
The analysis in the main text indicates that the extent of disagreement among ESG
ratings varies substantially. To better understand what is driving this heterogeneity,
this appendix shows correlations for each pair of ESG scores after dividing companies
into deciles based on their market capitalization. Figure A.2 below shows the results
of the exercise.
Figure A.2. Correlations between ESG Scores by Market Capitalization Decile
Source: Authors’ calculations using Bloomberg and Refinitiv Eikon data (2020)

MILKEN INSTITUTE ESG RATINGS: THE ROAD AHEAD 35
First, consistent with our previous findings (both when we pool all firms and when
we divide them by economic sector), RobecoSAM and Sustainalytics exhibit the
highest pairwise correlation across market capitalization deciles. Second, all pairwise
correlations follow a relatively similar pattern as we move from companies with
low market capitalization to companies with high market capitalization. Third, the
relationship between the (average) level of agreement among ratings and the level of
market capitalization is not monotonic. The level of agreement among rating agencies
appears to be slightly higher for companies with intermediate levels of market
capitalizations (i.e., deciles 4, 5, and 6) than for companies with low or high levels
(especially those in deciles 2, 7, and 10). The results suggest no clear relationship
between the level of market capitalization and the degree of agreement among rating
agencies in our sample.

MILKEN INSTITUTE ESG RATINGS: THE ROAD AHEAD 36
APPENDIX 4.
Disagreement among Ratings at the Firm Level
Figure A.3 explores how disagreement varies across individual firms. It shows
correlations between ESG scores after grouping companies based on an individual
measure of “disagreement among rating agencies.”27 Surprisingly, the results reveal
that the extent of the inconsistencies among rating providers varies substantially
across firms. Indeed, if disagreement among agencies were roughly constant across
all companies, the curve in Figure A.3 would be relatively flat. Instead, the average
correlation between ESG scores increases from a value of about 0 (for companies in
the first decile) to a value slightly above 0.9 (for companies in the top decile).
Figure A.3. Correlations between ESG Scores by Decile (Based on Firm-Specific Measure of Disagreement)
Source: Authors’ calculations using Bloomberg and Refinitiv Eikon data (2020)
27 To calculate our firm-level measure of disagreement, we first normalize all ESG scores by subtracting their respective means and dividing them by their respective standard deviations. For each company in our sample, we then calculate the mean of the absolute value of the normalized scores across all three rating agencies. The resulting number is our firm-level measure of disagreement. For a similar exercise, see Berg et al. (2019).

MILKEN INSTITUTE ESG RATINGS: THE ROAD AHEAD 37
As discussed in section four, economic sectors explain part of the variation in
disagreement across firms. Figure A.4, which plots the distributions of ESG scores
after grouping companies based on our firm-specific measure of disagreement, offers
two additional insights. First, as the firm-level measure of inconsistencies increases,
ESG scores move away from their respective means (i.e., the vertical dotted lines).
Thus, the level of agreement among ratings appears to be higher for companies
whose scores are away from the mean (i.e., “relatively good” and “relatively bad”
firms) than it is for companies whose scores are close to the average. Second, for all
three rating agencies, most companies in the top decile of our firm-specific measure
of disagreement have extremely low ESG scores, indicating that the strongest
agreement among rating providers occurs across the worst performers.
Figure A.4. ESG Score Distributions by Decile (Based on Firm-Specific Measure of Disagreement)
Source: Authors’ calculations using Bloomberg and Refinitiv Eikon data (2020)
Note: The vertical dotted line represents the overall average score for each of the rating agencies.
MILKEN INSTITUTE ESG RATINGS: THE ROAD AHEAD 38
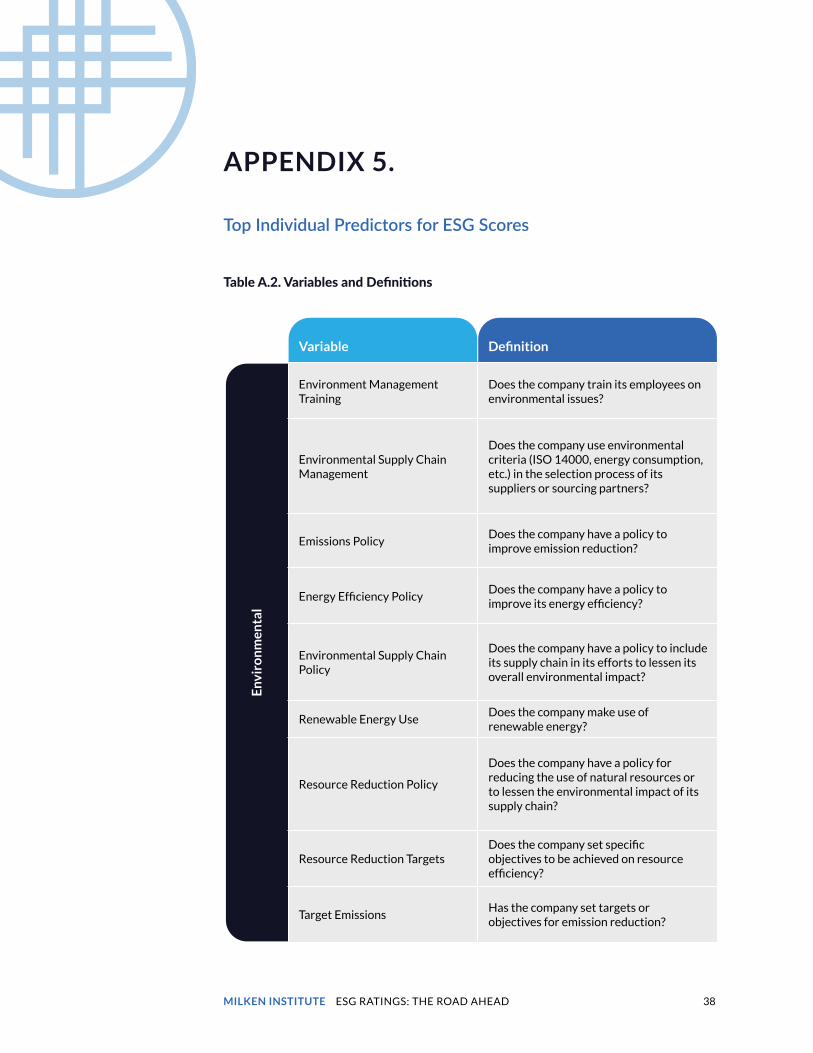
APPENDIX 5.
Top Individual Predictors for ESG Scores
Table A.2. Variables and Definitions
Variable Definition
Env
iro
nm
enta
l
Environment Management Training
Does the company train its employees on environmental issues?
Environmental Supply Chain Management
Does the company use environmental criteria (ISO 14000, energy consumption, etc.) in the selection process of its suppliers or sourcing partners?
Emissions PolicyDoes the company have a policy to improve emission reduction?
Energy Efficiency PolicyDoes the company have a policy to improve its energy efficiency?
Environmental Supply Chain Policy
Does the company have a policy to include its supply chain in its efforts to lessen its overall environmental impact?
Renewable Energy UseDoes the company make use of renewable energy?
Resource Reduction Policy
Does the company have a policy for reducing the use of natural resources or to lessen the environmental impact of its supply chain?
Resource Reduction TargetsDoes the company set specific objectives to be achieved on resource efficiency?
Target EmissionsHas the company set targets or objectives for emission reduction?

MILKEN INSTITUTE ESG RATINGS: THE ROAD AHEAD 39
Variable Definition
Soci
al
Flexible Working HoursDoes the company claim to provide flexible working hours or working hours that promote a work-life balance?
Fundamental Human Rights
Does the company claim to comply with the fundamental human rights convention of the ILO or support the UN declaration of human rights?
Human Rights Contractor
Does the company report or show to use human rights criteria in the selection or monitoring process of its suppliers or sourcing partners?
Human Rights PolicyDoes the company have a policy to ensure the respect of human rights in general?
Gov
ern
ance
Board Gender DiversityWhat is the percentage of females on the board?
Corporate Social Responsibility Reporting
Does the company publish a separate corporate social responsibility/health and safety/sustainability report or a section in its annual report on these issues?
Global Compact Signatory
Has the company signed the UN Global Compact? The UN GC is a non-binding United Nations pact to encourage businesses worldwide to adopt sustainable and socially responsible policies and to report on their implementation.
Independent Board MembersWhat is the percentage of independent board members as reported by the company?
Stakeholder Engagement
Does the company explain how it engages with its stakeholders? How does it involve the stakeholders in its decision-making process?

MILKEN INSTITUTE ESG RATINGS: THE ROAD AHEAD 40
APPENDIX 6.
Variable Subcategories
Table A.3. Definition of Variable Subcategories
Category Subcategory Subcategory Definition
Environmental Emissions
Variables that measure a company’s commitment and effectiveness towards reducing environmental emissions in its production and operational processes.
Environmental Innovation
Variables that reflect a company’s capacity to reduce the environmental costs and burdens for its customers, thereby creating new market opportunities through new environmental technologies and processes or eco-designed products.
Environmental Resource Use
Variables that reflect a company’s performance and capacity to reduce the use of materials, energy, or water, and to find more eco-efficient solutions by improving supply chain management.
Social CommunityVariables that reflect a company’s commitment to being a good citizen, protecting public health, and respecting business ethics.
Social Human RightsVariables that reflect a company’s effectiveness in respecting fundamental human rights conventions.
SocialProduct Responsibility
Variables that reflect a company’s capacity to produce quality goods and services, integrating the customer’s health and safety, integrity, and data privacy.
Social Workforce
Variables that measure a company’s effectiveness in providing job satisfaction, providing a healthy and safe workplace, maintaining diversity and equal opportunities, and developing opportunities for its workforce.

MILKEN INSTITUTE ESG RATINGS: THE ROAD AHEAD 41
Category Subcategory Subcategory Definition
Governance CSR Strategy
Variables that reflect a company’s practices to communicate that it integrates economic (financial), social, and environmental dimensions into its daily decision-making processes.
Governance ManagementVariables that measure a company’s commitment and effectiveness towards following best practice corporate governance principles.
Governance ShareholdersVariables that measure a company’s effectiveness towards equal treatment of shareholders and the use of anti-takeover devices.
Financial Balance SheetVariables that reflect a company’s assets, liabilities, and shareholders’ equity.
FinancialCash Flow Statement
Variables that summarize the amount of cash and cash equivalents entering and leaving a company.
FinancialIncome Statement
Variables that measure a company’s revenues and expenses during a period. Variables also indicating how the revenues are transformed into the net income or net profit.
FinancialOperating Metrics
Variables that illustrate a company’s overall performance, such as return on equity, return on assets, and EBITDA.
FinancialTrading Statistics
Variables that reflect the trading of a company’s stock, such as monthly Sharpe Ratio, volatility, institutional ownership, 200-day price PCT change, and liquidity measures.
FinancialValuation Metrics
Variables that reflect and are related to a company’s valuation, such as market capitalization, enterprise value, P/E ratio, P/EG ratio, Beta, and dividend yield.
Others ClassificationEconomic sector, according to the Thomson Reuters Business Classification.
Others LocationCountry of headquarters, also known as Country of Domicile.

MILKEN INSTITUTE ESG RATINGS: THE ROAD AHEAD 42
APPENDIX 7.
Calculating Variable Contributions
To understand how variable contributions are calculated in a random forest model,
notice that given a set of independent variables or predictors, we can estimate how the
value of the prediction changes after every split in each decision tree. Since each split is
associated with a variable, and since the split either adds or subtracts to the predicted
value given in the previous node, the final prediction can be boiled down to the sum of
the variable contributions plus the “bias” (i.e., the model’s prediction at the beginning
of the decision tree). After averaging all the individual decision trees in the random
forest model, the final prediction can be represented by the following formula:
prediction(x) = bias + contribution(1, x) + … + contribution(n, x)
where
• x is a set of predictors,
• bias is the model’s prediction before using any predictor (usually the mean of the
variable we want to predict in the original dataset),
• contribution (j, x) is the contribution of variable j to the final prediction, and
• n is the number of predictors.
Although the previous expression is superficially similar to a linear regression, the
coefficients of a linear regression are fixed, with a single constant for every variable.
For the random forest model, by contrast, each variable’s contribution is a complex
function, one that also depends on all other variables that together determine the
decision path that generates the prediction, and thus, the contributions that are
passed along the way.28
28 For a detailed discussion of the methodology, see https://blog.datadive.net/interpreting-random-forests/.

MILKEN INSTITUTE ESG RATINGS: THE ROAD AHEAD 43
APPENDIX 8.
Observed versus Generated Ratings and Firms’ Characteristics
In this appendix, we explore whether our model’s ability to account for the
disagreement among ESG rating agencies varies with some of the firms’ characteristics.
To this end, we divide companies by economic sector and market capitalization decile
and then compare the mean and median correlations between the ESG scores observed
in the actual data with those predicted by the random forest models. Figures A.5(a) and
A.6(a) show the results of the exercise. The results suggest that the random forests do a
reasonably good job at capturing variations in the level of disagreement among ratings
across sectors and market capitalization deciles but that they tend to underpredict the
level itself. Thus, the figures indicate that the importance of factors not captured by the
random forests in explaining the disagreement among ratings remains significant across
all economic sectors and market capitalization deciles. This last point is confirmed by
Figures A.5(b) and A.6(b), which display the fraction of disagreement explained by the
random forest models for each economics sector and market capitalization decile. The
figures show that the ability of the random forests to account for the disagreement
among agencies ranges from 45.2 percent to 67.3 percent across economic sectors and
from 46.6 percent to 59.5 percent across market capitalization. Although the specific
numbers may vary, the overall picture seems to confirm that the models can account for
around half the observed disagreement among rating agencies.

MILKEN INSTITUTE ESG RATINGS: THE ROAD AHEAD 44
a) Predicted versus Observed Correlations between ESG Scores
a) Predicted versus Observed Correlations between ESG Scores
b) Percent of Disagreement Explained by Random Forest Models
b) Percent of Disagreement Explained by Random Forest Models
Figure A.5. Explanatory Power of Random Forest Models by Economic Sector
Figure A.6. Explanatory Power of Random Forest Models by Market Capitalization Decile
Source: Authors’ calculations using Bloomberg and Refinitiv Eikon data (2020)
Source: Authors’ calculations using Bloomberg and Refinitiv Eikon data (2020)

MILKEN INSTITUTE ESG RATINGS: THE ROAD AHEAD 45
BIBLIOGRAPHY
Berg, F., J. Koelbel, and R. Rigobon. “Aggregate Confusion: The Divergence of ESG
Ratings.” MIT Sloan Working Paper 5822-19. 2020.
BNP Paribas. “The ESG Global Survey 2019.” 2019.
Breiman, L. “Random Forests.” Machine learning. 2020.
Clarkin, C. M., M. Sawyer, and J. L. Levin. “The Rise of Standardized ESG Disclosure
Frameworks in the United States.” Harvard Law School Forum on Corporate Governance.
Monday, June 22, 2020.
Friede, G., T. Busch, and A. Bassen. “ESG and Financial Performance: Aggregated
Evidence from More than 2000 Empirical Studies.” Journal of Sustainable Finance & Investment, 5(4), (2015): 210-233.
Friedman, J. H., and B. E. Popescu. “Predictive Learning via Rule Ensembles.” The Annals of Applied Statistics. 2008.
Fritsch, D. “ESG: Do You or Don’t You? Are the World’s Asset Owners Thinking about
Long-Term, Sustainable Finance?” Responsible Investor Research, UBS. 2019.
Gaffuri, J. RobecoSAM CSA. Lecture at Lisbon, January 2017. http://www.bcsdportugal.
org/wp-content/uploads/2013/10/JVAN-GAFFURI.pdf.
Gibson, R., et al. “ESG Rating Disagreement and Stock Returns.” ECGI Working Paper
Series in Finance, N° 651/2020. 2019.
“2018 Global Sustainable Investment Review.” Global Sustainable Investment Alliance.
2019.
Grim, M. D., and D. B. Berkowitz. “ESG, SRI, and Impact Investing: A Primer for Decision-Making.” Vanguard Research. 2018.
Grimminger, A., and P. D. Benedetta. “Raising the Bar on Corporate Governance: A Study
of Eight Stock Exchange Indices.” World Bank Group. 2013.
Koehler, D., and E. Hespenheide. “Finding the Value in Environmental, Social and
Governance Performance.” Deloitte Review Vol. 12 (January 2013).
Lauricella, T. “4 Lessons from BlackRock’s Bold Sustainable Investing

MILKEN INSTITUTE ESG RATINGS: THE ROAD AHEAD 46
Statement.” Morningstar. 2020. https://www.morningstar.com.au/funds/article/4-
lessons-from-blackrocks-bold-sustainable-in/198904.
Li, X., et al. “A Debiased MDI Feature Importance Measure for Random Forests.”
Advances in Neural Information Processing Systems. 2019.
Novick, B. “Towards a Common Language for Sustainable Investing.” Harvard Law
School Forum on Corporate Governance. Wednesday, January 22, 2020.
“Report on US Sustainable, Responsible and Impact Investing Trends.” US SIF
Foundation. 2018. https://www.ussif.org/files/Trends/Trends%202018%20
executive%20summary%20FINAL.pdf.
State Street Global Advisors. “Performing for the Future. ESG’s Place in Investment
Portfolios. Today and Tomorrow.” 2017 ESG Survey Report. 2018.
State Street Global Advisors. “The ESG Data Challenge.” March 2019. https://www.
ssga.com/investment-topics/environmental-social-governance/2019/03/esg-data-
challenge.pdf.
“The ESG Risk Rating: Methodology Abstract, Version 2.0.” Sustainalytics. 2019.
“Thomson Reuters ESG Scores.” Thomson Reuters. 2018.
Verheyden, T., R. G. Eccles, and A. Feiner. “ESG for All? The Impact of ESG Screening on
Return, Risk, and Diversification.” Journal of Applied Corporate Finance, 28(2), (2016):
47-55.
Wong, C., and E. Petroy. “Rate the Raters 2020: Investor Survey and Interview
Results.” 2020. https://sustainability.com/wp-content/uploads/2020/03/
sustainability-ratetheraters2020-report.pdf.

MILKEN INSTITUTE ESG RATINGS: THE ROAD AHEAD 47
ACKNOWLEDGMENTS
The authors would like to thank Keith Savard, Jihad Dagher, Bill Lee, Perry Wong,
Jakob Wilhelmus, and Jose Siaba Serrate for numerous insightful discussions related
to this topic. They also would like to thank participants at the Milken Institute
Research Department brown bag—Caitlin MacLean, Sean Sandbach, Sarah Sandler,
and Karen Rogers—for useful discussions. Claude Lopez would like to thank
participants at the T20 Summits Japan and Saudi Arabia.

MILKEN INSTITUTE ESG RATINGS: THE ROAD AHEAD 48
ABOUT THE AUTHORS
Claude Lopez, PhD, is the head of the Research Department at the Milken Institute,
where she leads data-driven efforts aimed at influencing global policy issues on
International Finance, Health Economics, and Regional Economics. She is an active
member of the T20 task force on international financial architecture for stability and
development, and a contributor to W20 (Women 20), two advisory committees to the
G20. Lopez has over 20 years of experience in academic and policy research in the
US and abroad. Before joining the Institute, Lopez headed multiple research teams at
the Banque de France, the nation’s central bank, and was a professor of economics at
the University of Cincinnati. She has an MS in econometrics from Toulouse School of
Economics and a PhD in economics from the University of Houston.
Oscar Contreras, PhD, is an economist specializing in International Finance within the
Research Department at the Milken Institute. He has experience in macroeconomics
and financial markets, particularly in emerging economies. Before joining the Institute,
Contreras was a senior economist at the Research Department of the Central Bank of
Mexico, where he was responsible for providing macroeconomic analysis on monetary
policy issues and conducting original research on macroeconomic and financial
topics. Prior to his work at the bank, he was an assistant professor at the University
College for Financial Studies in Madrid, Spain. Contreras holds a PhD in economics
from Northwestern University and a BA (Hons) in economics from the Center for
Economics Research and Teaching in Mexico City.
Joseph Bendix is a research analyst in International Finance within the Research
Department at the Milken Institute. His work focuses on topics related to systemic
risk, capital flows, and investment. More specifically, he is in charge of identifying and
analyzing the market-level data sets in many of the research reports produced by the
Institute. Bendix lends his experience to developing presentations for the Institute’s
conferences throughout the year. He holds a bachelor’s in economics and a Master of
Science in finance from the University of San Diego.

SANTA MONICA | WASHINGTON | NEW YORK | LONDON | ABU DHABI | SINGAPORE