Stable Isotope Ratio Analysis provides the methods of...
34
Stable Isotope Ratio Analysis provides the methods of choice for food authentication Michèle Lees Independent Expert on Food Integrity, previously Director of Collaborative Research, Eurofins, France
Transcript of Stable Isotope Ratio Analysis provides the methods of...

Stable Isotope Ratio Analysis provides the methods of choice for food authentication
Michèle Lees
Independent Expert on Food Integrity, previously Director of Collaborative Research, Eurofins, France

Context
Stable Isotope Ratio Analysis (SIRA)
now widely deployed to authenticate food and beverages
a number have gained official recognition and have been successfully used in legal court cases
What has led to this broad acceptance ?
good practices have ensured that the measuring systems and their results are robust and fit for purpose
the tools developed often provide the only solution to real problems of food fraud
2

Method Product Fraction Technique Isotope ratios
AOAC Official Method 995.17 Fruit juice Ethanol (from fermentation) SNIF-NMR (D/H)I, (D/H)II, R
AOAC Official Method 998.12 Honey Honey & proteins IRMS 13C/12C
AOAC Official Method 2000.19 Maple syrup Ethanol (from fermentation) SNIF-NMR (D/H)I, (D/H)II, R
AOAC Official Method 2004.01 Fruit juice & maple syrup Ethanol (from fermentation) IRMS 13C/12C
AOAC Official Method 2006.05 Vanillin Vanillin SNIF-NMR (D/H)i
CEN (TC174 N108, ENV 12140) Fruit juice Sugars IRMS 13C/12C
CEN (TC174 N108, ENV 12141) Fruit juice Water IRMS 18O/16O
OIV-MA-AS311-05, OIV/OENO 381/2009 Wines & Spirits Ethanol SNIF-NMR (D/H)I, (D/H)II, R
OIV-MA-AS312-06, OIV/OENO 381/2009 Wines & Spirits Ethanol IRMS 13C/12C
OIV-MA-AS2-12, OIV/OENO 381/2009 Wines & Spirits Water IRMS 18O/16O
CEN, EN 16466-1:2012 Vinegar Acetic acid SNIF-NMR (D/H)CH3
CEN, EN 16466-2:2012 Vinegar Acetic acid IRMS 13C/12C
CEN, EN 16466-3:2012 Vinegar Water IRMS 18O/16O
AOAC = Association of Official Analytical Chemists (USA); CEN = European Committee for Standardization (EU) OIV = International Organisation of Vine and Wine
Officially-recognised methods for food authentication
3
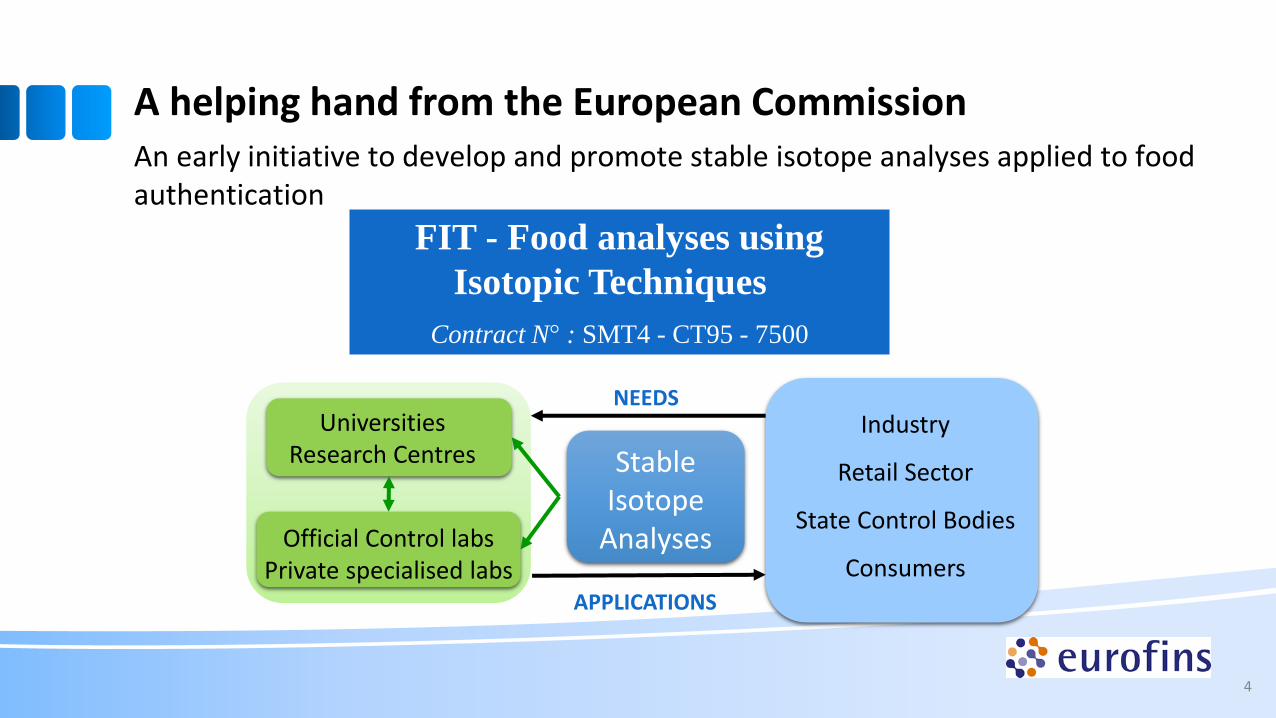
FIT - Food analyses using
Isotopic Techniques
Contract N° : SMT4 - CT95 - 7500
An early initiative to develop and promote stable isotope analyses applied to food authentication
Industry
Retail Sector
State Control Bodies
Consumers APPLICATIONS
NEEDS
Stable Isotope
Analyses
Universities Research Centres
Official Control labs Private specialised labs
A helping hand from the European Commission
4

BELGIUM P. de Bièvre & P. Taylor , J. Pauwels & G.N Kramer ,
IRMM
FRANCE G.J. Martin, CEAIS J. Koziet, Pernod Ricard A. Le Leuch, DGCCRF M.H. Merle & S. Giraudon, DGCCRF C. Lamoureux, DGDDI E. Jamin, M. Lees, G.G. Martin, Y.L. Martin & G.Remaud, Eurofins Scientific G.J. Martin, N. Naulet & R. Robins, U. de Nantes
IRELAND K. Mac Namara, Irish Distillers
UNITED KINGDOM J. Dennis, S. Kelly, I. Parker & M. Sharman, CSL S. Brookes & A. Bradley, Europa Scientific G. Goldwin, MAFF London R. Wood, MAFF Norwich P. Turner & F. Fourel, Micromass
SPAIN A.I. Blanch-Cortes, Min. de Agricultura, Pesca y Alimentacion
PORTUGAL M. Curto, A. Teixeira & L. Santos, INETI J. Lopes, Instituto da Vinho e do Vinho Paulo Barros , Instituto do Vinho do Porto
FINLAND
P. Lehtonen , Alko Group
ITALY G. Versini, D. Depentori & A. Monetti, Ist. Agrario di San Michele all’Adige A. Ciambotti & P. Bosia, Ist. Sper. per l’Enologia di Asti G. Serrini, C. Guillou & F.Reniero, JRC Ispra
AUSTRIA F. Pichlmayer, IAEA G. Haberhauer , Austrian Research Centre
GREECE G. Bonas, T .Mavromoustakos & E. Zervou , NHRF
GERMANY R. Wittkowski , BgVV A. Hermann , Chem. Unters. Speyer. H. Förstel , Forschungszentrum Jülich N. Christoph , LUA Nordbayern A. Mosandl & U. Hener, U. Frankfurt
H.L. Schmidt & A. Rossmann , T.U. München
SWEDEN G. Fuchs & S. Wretling ,
National Food Administration
The FIT Thematic Network 1996-1998
5

Using stable isotope techniques as official control methods
Key requirements
Applications that target areas of concern for food control laboratories
Interpretation of results: extensive reference data base
Reliability: robust method performance, quality control
6

3 Case studies
7
Developing a method to differentiate between wild and farmed salmon
Solving the problem of adulterated palm sugar
Keeping up with clever fraudsters: the case of vanilla authentication

Case study N°1: Developing a method to differentiate between wild and farmed salmon
Background (www.fao.org/fishery/culturedspecies/Salmo_salar/en)
Considerable increase in global production of farmed salmon
Farmed Atlantic salmon >90 percent of the farmed salmon market, and >50 percent of the total global salmon market
Commission Regulation 2065/2001/EC
labelling and traceability requirements for aquaculture products, including:
• the production method (farmed or caught at sea or in freshwater)
EU-funded project G6RD-CT-2001-00512 COFAWS (Confirmation of the Origin of Farmed and Wild Salmon)

Muscle
Water
extraction
Fatty Acid Methyl Esters (FAMEs)
saponification Fatty Acids
Glycerol (+Choline)
Feed
transesterification
Seawater
extraction
Muscle
extraction
saponification
transesterification
extraction 13C-IRMS 15N-IRMS
13C-IRMS 18O-IRMS
Feed Oil
Triacylglycerides
+ PC 13C-IRMS
2H-SNIF-NMR (Triacetin) 13C-IRMS, 18O-IRMS
15N-IRMS, %N GC
2H-SNIF-NMR 13C GC-C-IRMS
2H-SNIF-NMR 18O-IRMS
2H-SNIF-NMR 18O-IRMS
9
Database requirements – the COFAWS project

Geographical origin
Authentic
Wild
Farmed
Slow/fast growth
Season
Type of feed Market As labelled
Sample collection Norway, Scotland, Ireland, Faroes, Iceland, Chile, Canada …
Database requirements – the COFAWS project
10

Analysis of Variance (ANOVA) : wild vs. farmed
0
20
40
60
80
100
120
140
O18oil
N15chol
(D/H
)1T
CLU
3
C18:2
n-6
C16:1
n-7
C14:0
CLU
1
(D/H
)2T
C13A
c
C18:0
C22:6
n-3
O18G
ly
C13R
P
CLU
9
CLU
6
C18:1
n-7
C13G
ly
C20:5
n-3
CLU
8
C16:0
C18:1
n-9
C22-1
n-1
1
C20:1
n-9
CLU
5
(D/H
)3T
CLU
7
CLU
2
C22:5
n-3
CLU
4
Best discriminatory parameters
COFAWS project results
11

F. Thomas et al. J. Agric. Food Chem., 2008, 56, 989-997.
d 18
O Salmon oil (‰)
d 1
5
N C
ho
line
(‰)
Authentic farmed samples Authentic wild samples Market farmed samples Market wild samples
Mislabeled market samples:
-Labeled « wild », -Found « farmed »
Differentiation of wild and farmed fish by isotopic methods
Validated method to distinguish wild and farmed salmon
12
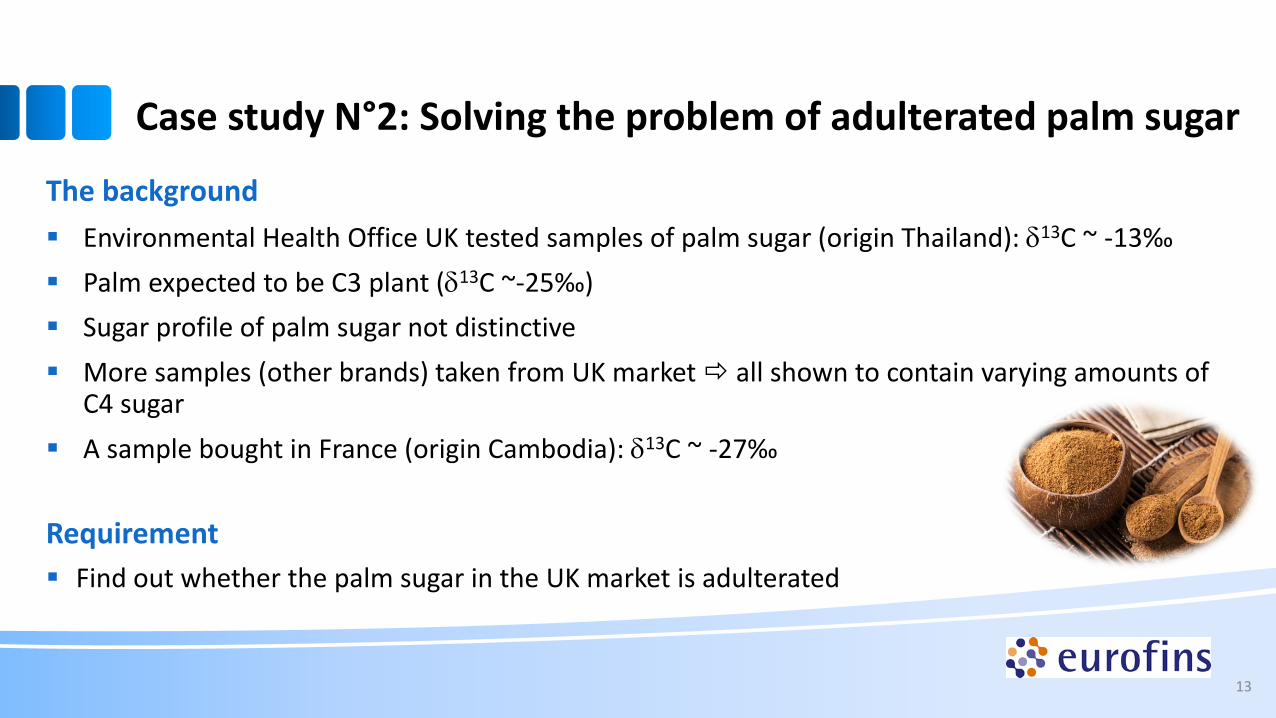
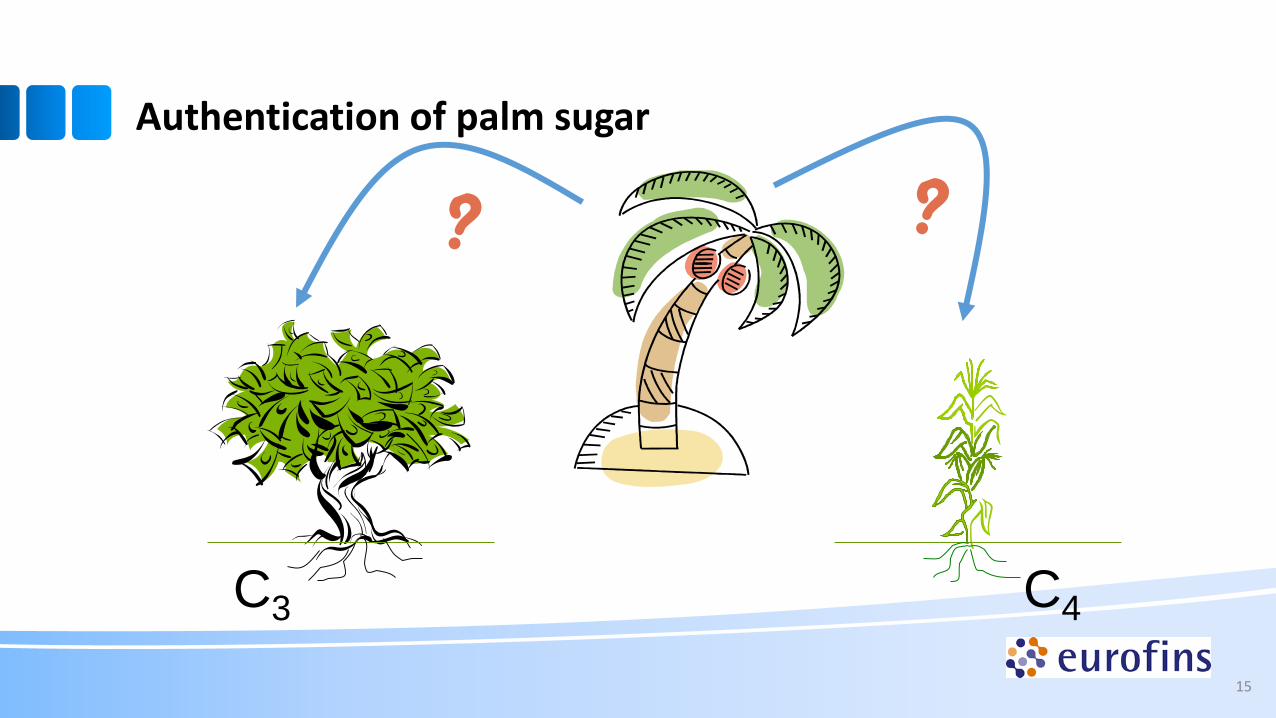
Case study N°2: Solving the problem of adulterated palm sugar
The background
Environmental Health Office UK tested samples of palm sugar (origin Thailand): d13C ~ -13‰
Palm expected to be C3 plant (d13C ~-25‰)
Sugar profile of palm sugar not distinctive
More samples (other brands) taken from UK market all shown to contain varying amounts of C4 sugar
A sample bought in France (origin Cambodia): d13C ~ -27‰
Requirement
Find out whether the palm sugar in the UK market is adulterated
13

Where does the sugar in a plant come from :
Carbon dioxide
C3 C4
CO2
most plants values around -25‰
Gramineae family e.g. sugarcane, maize, values around -10‰
Authentication of palm sugar
14
C3 C4
? ?
15
Authentication of palm sugar

16
Authentication of palm sugar

17
Authentication of palm sugar

18
Authentication of palm sugar

Samples of sap taken from the coconut plantation (as well as leaves, flowers)
19
Authentication of palm sugar

The results : d13C‰
-26.9 -25.2 -24.8 -25.7
-20.3
-15.4
-30
-20
-10
0
Palm
leaf Palm
flower Sap
(A) Sap
(B) Palm
sugar Commercial
samples
Authentication of palm sugar
20

Authentication of palm sugar
21

Case study N°3: Keeping up with clever fraudsters: the case of vanilla authentication
Vanilla Planifolia – the background
Premium product
Important flavour compound for the food industry
Also used extensively in perfumes, cosmetics, etc.
Labour intensive production
High and variable costs linked to poor yields and harvesting difficulties
22

Building up a database for the main vanilla production regions
Vanilla authentication: an interesting case study Geographical origin ?
23

1964 1974 1984 1994 2004 2006 2008 2009
Indonesia 150 300 520 1770 3700 3700 4146 4362
Madagascar 1050 2283 2277 1320 839 2534 3055 2830
China 0 0 0 400 900 1200 1400 1382
Mexico 90 29 161 167 252 291 600 524
Tonga 0 10 16 100 131 140 199 263
French Polynesia 100 21 6 13 44 25 49 74
Comores 175 160 160 131 60 75 70 65
Uganda 10 10 10 20 61 48 52 48
Réunion 45 27 56 33 25 22 12 12
Amount of vanilla produced (tons) (FAO-STAT)
Different species : Vanilla Tahitiensis
Cyclones and political unrest in Madagascar scarcity of supply, new producers enter
market
China appears on the scene and is becoming a major producer
24
Vanilla authentication: an interesting case study

Vanilla authentication: an interesting case study
A classic case of supply and demand …
Euros/tonne Tonnes
produced
High risk of adulteration!
25

Main component : Vanillin
OCH3
OH
OH
Typical vanilla aromatic profile (regulatory guidelines exist to assess vanilla authenticity)
26
Vanilla authentication: an interesting case study

Paper Industry
Tropical
Agriculture
VANILLIN
Vanilla Fragrans
Chemical Industry
Vanilla Planifolia
OCH3
OH
OH
(Guaiacol)
(Lignin)
Commercial sources of vanillin
2001: 400 € / tonne
2003: 750 € / tonne
Guaiacol
Lignin
12 - 15 € / tonne
Vanilla authentication: an interesting case study
27

Vanilla is a CAM (Crassulacean Acid Metabolism) plant
Use of 13C/12C ratios to detect frauds
d13C Vanillin (‰ /V.PDB) > -21.2 (vanilla beans) ; ~ -30 (synthesis)
d13C (‰ /V.PDB)
for pHB > -19.2 ; for vanillic acid > -24.0 ; for pHB acid > -23.0
13C/12C ratios of other vanilla components specified in the legislation
13C enrichment during synthesis able to fool the authentication method BUT
Selective 13C enrichment is undectable when analysing whole compounds BUT
28

PCA using (D/H)1, (D/H)3,
(D/H)4, (D/H)5
SNIF–NMR® ANALYSIS of vanillin
OCH3
OH
OH(D/H)1
(D/H)2
(D/H)3
(D/H)4
(D/H)5
(D/H)3
1 23 4
5
TMU
Solvent
8.4
7.5
7.0
3.9
2.8
2.0
9.8
OCH3
OH
OH(D/H)1
(D/H)2
(D/H)3
(D/H)4
(D/H)5
(D/H)3
1 23 4
5
TMU
Solvent
8.4
7.5
7.0
3.9
2.8
2.0
9.8
1 23 4
5
TMU
Solvent
8.4
7.5
7.0
3.9
2.8
2.0
9.8
8.4
7.5
7.0
3.9
2.8
2.0
9.8
Site specific isotope ratios measured using 2H SNIF-NMR
29
F1
F2
ex-lignin
ex-beans
ex-guaïacol

Zoom of 2H-NMR spectrum
Presence of a small peak due to OCHD2
From Remaud et al., J. Agric. & Food Chem., 1997
10.6
0
9.6
3
8.6
5
7.6
8
6.7
0
5.7
3
4.7
5
3.7
8
2.8
0
1.8
3
ppm
1 2
3
4
5
TMU
Solvent
OCHD 2
SNIF-NMR® and detection of isotopic manipulation of vanillin BUT
30

Using stable isotope techniques as official control methods
Key requirements
Applications that target areas of concern for food control laboratories
Interpretation of results: extensive reference database
Reliability: robust method performance, quality control
31

Proficiency Testing
Initiated in 1994 => The ONLY one dedicated to Food analysis using Isotopic Techniques (FIT)
Complies with the ISO/IUPAC/AOAC International Harmonised Protocol for Proficiency Testing of analytical laboratories
Expert Committee reviews results
70 participants in 2016
3 rounds per year, 6 samples per round
The FIT- Proficiency Testing Scheme
32

FIT- Proficiency Testing Scheme
Type of samples: Wine, spirit Fruit juice Pure alcohol Honey Olive oil Vinegar Pure organic product Flour, cereal, rice Water Aroma extract Pure aroma molecule
Techniques: EA-IRMS (Combustion,
Pyrolysis, Equilibration) GC-C-IRMS SNIF-NMR
Parameters: C13 Ethanol, Sugars, Pulp, Honey, Proteins, Acetic
Acid C13 CO2 Sparkling wine C13 Vanillin, pHB, … O18 Water H2 Water N15 Proteins, Raw Product H2-Py Proteins, Raw Product O18-Py Ethanol, Raw Product S34 Proteins, Raw Product (D/H)1 and (D/H)2 Ethanol (D/H)1 Acetic Acid (D/H)i Vanillin Contact: [email protected]
33

34
Thank you for your attention!
34