5.11 Stable Isotope Applications in Hydrologic...
46
5.11 Stable Isotope Applications in Hydrologic Studies C. Kendall and D. H. Doctor United States Geological Survey, Menlo Park, CA, USA 5.11.1 INTRODUCTION 320 5.11.1.1 Environmental Isotopes as Tracers 320 5.11.1.2 Isotope Fundamentals 321 5.11.1.2.1 Basic principles 321 5.11.1.2.2 Isotope fractionation 321 5.11.1.2.3 Rayleigh fractionation 322 5.11.1.2.4 Terminology 322 5.11.1.3 Causes of Isotopic Variation 323 5.11.1.3.1 Isotope fractionations during phase changes 323 5.11.1.3.2 Mixing of waters and/or solutes 324 5.11.1.3.3 Geochemical and biological reactions 325 5.11.2 TRACING THE HYDROLOGICAL CYCLE 326 5.11.2.1 Deuterium and Oxygen-18 326 5.11.2.1.1 Basic principles 326 5.11.2.1.2 Precipitation 326 5.11.2.1.3 Shallow groundwaters 327 5.11.2.1.4 Deep groundwaters and paleorecharge 328 5.11.2.1.5 Surface waters 329 5.11.2.2 Tritium 331 5.11.2.3 Determination of Runoff Mechanisms 332 5.11.2.3.1 Isotope hydrograph separation and mixing models 332 5.11.2.3.2 Temporal and spatial variability in end-members 335 5.11.2.4 Estimation of Mean Residence Time 337 5.11.3 CARBON, NITROGEN, AND SULFUR SOLUTE ISOTOPES 338 5.11.3.1 Carbon 338 5.11.3.1.1 Carbon isotope fundamentals 339 5.11.3.1.2 d 13 C of soil CO 2 and DIC 339 5.11.3.1.3 Tracing sources of carbonate alkalinity in rivers 341 5.11.3.1.4 Tracing sources of carbonate alkalinity in catchments 342 5.11.3.1.5 Carbon-14 342 5.11.3.1.6 Sources of dissolved organic carbon 344 5.11.3.2 Nitrogen 344 5.11.3.2.1 Nitrogen isotope fundamentals 344 5.11.3.2.2 Oxygen isotopes of nitrate 345 5.11.3.2.3 Tracing atmospheric sources of nitrate 345 5.11.3.2.4 Fertilizer and animal waste sources of nitrogen 347 5.11.3.2.5 Soil sources of nitrogen 347 5.11.3.2.6 Processes affecting nitrogen isotopic compositions 347 5.11.3.2.7 Processes affecting the d 18 O of nitrate 348 5.11.3.2.8 Small catchment studies 349 5.11.3.2.9 Large river studies 350 5.11.3.2.10 Subsurface waters 351 5.11.3.3 Sulfur 352 5.11.3.3.1 Sulfur isotope fundamentals 352 5.11.3.3.2 Oxygen isotopes of sulfate 353 5.11.3.3.3 Tracing atmospheric deposition 354 319
Transcript of 5.11 Stable Isotope Applications in Hydrologic...
5.11Stable Isotope Applications inHydrologic StudiesC. Kendall and D. H. Doctor
United States Geological Survey, Menlo Park, CA, USA
5.11.1 INTRODUCTION 3205.11.1.1 Environmental Isotopes as Tracers 3205.11.1.2 Isotope Fundamentals 321
5.11.1.2.1 Basic principles 3215.11.1.2.2 Isotope fractionation 3215.11.1.2.3 Rayleigh fractionation 3225.11.1.2.4 Terminology 322
5.11.1.3 Causes of Isotopic Variation 3235.11.1.3.1 Isotope fractionations during phase changes 3235.11.1.3.2 Mixing of waters and/or solutes 3245.11.1.3.3 Geochemical and biological reactions 325
5.11.2 TRACING THE HYDROLOGICAL CYCLE 3265.11.2.1 Deuterium and Oxygen-18 326
5.11.2.1.1 Basic principles 3265.11.2.1.2 Precipitation 3265.11.2.1.3 Shallow groundwaters 3275.11.2.1.4 Deep groundwaters and paleorecharge 3285.11.2.1.5 Surface waters 329
5.11.2.2 Tritium 3315.11.2.3 Determination of Runoff Mechanisms 332
5.11.2.3.1 Isotope hydrograph separation and mixing models 3325.11.2.3.2 Temporal and spatial variability in end-members 335
5.11.2.4 Estimation of Mean Residence Time 337
5.11.3 CARBON, NITROGEN, AND SULFUR SOLUTE ISOTOPES 3385.11.3.1 Carbon 338
5.11.3.1.1 Carbon isotope fundamentals 3395.11.3.1.2 d13C of soil CO2 and DIC 3395.11.3.1.3 Tracing sources of carbonate alkalinity in rivers 3415.11.3.1.4 Tracing sources of carbonate alkalinity in catchments 3425.11.3.1.5 Carbon-14 3425.11.3.1.6 Sources of dissolved organic carbon 344
5.11.3.2 Nitrogen 3445.11.3.2.1 Nitrogen isotope fundamentals 3445.11.3.2.2 Oxygen isotopes of nitrate 3455.11.3.2.3 Tracing atmospheric sources of nitrate 3455.11.3.2.4 Fertilizer and animal waste sources of nitrogen 3475.11.3.2.5 Soil sources of nitrogen 3475.11.3.2.6 Processes affecting nitrogen isotopic compositions 3475.11.3.2.7 Processes affecting the d18O of nitrate 3485.11.3.2.8 Small catchment studies 3495.11.3.2.9 Large river studies 3505.11.3.2.10 Subsurface waters 351
5.11.3.3 Sulfur 3525.11.3.3.1 Sulfur isotope fundamentals 3525.11.3.3.2 Oxygen isotopes of sulfate 3535.11.3.3.3 Tracing atmospheric deposition 354
319
5.11.3.3.4 Sulfur in catchment surface waters 3565.11.3.3.5 Sulfur in groundwater 356
5.11.4 USE OF A MULTI-ISOTOPE APPROACH FOR THE DETERMINATION OF FLOW PATHS ANDREACTION PATHS 357
5.11.5 SUMMARY AND CONCLUSIONS 358
ACKNOWLEDGMENTS 358
REFERENCES 358
5.11.1 INTRODUCTION
The topic of stream flow generation hasreceived considerable attention over the last twodecades, first in response to concern about “acidrain” and more recently in response to theincreasingly serious contamination of surfaceand shallow groundwaters by anthropogeniccontaminants. Many sensitive, low-alkalinitystreams in North America and Europe are alreadyacidified (see Chapter 9.10). Still more streamsthat are not yet chronically acidic may undergoacidic episodes in response to large rainstormsand/or spring snowmelt. These acidic events canseriously damage local ecosystems. Future cli-mate changes may exacerbate the situation byaffecting biogeochemical controls on the transportof water, nutrients, and other materials from landto freshwater ecosystems.
New awareness of the potential danger to watersupplies posed by the use of agricultural chemi-cals and urban industrial development has alsofocused attention on the nature of rainfall-runoffand recharge processes and the mobility of varioussolutes, especially nitrate and pesticides, inshallow systems. Dumping and spills of otherpotentially toxic materials are also of concernbecause these chemicals may eventually reachstreams and other public water supplies. A betterunderstanding of hydrologic flow paths and solutesources is required to determine the potentialimpact of contaminants on water supplies,develop management practices to preserve waterquality, and devise remediation plans for sites thatare already polluted.
Isotope tracers have been extremely useful inproviding new insights into hydrologic processes,because they integrate small-scale variability togive an effective indication of catchment-scaleprocesses. The main purpose of this chapter isto provide an overview of recent research intothe use of naturally occurring stable isotopes totrack the movement of water and solutes inhydrological systems where the waters are rela-tively fresh: soils, surface waters, and shallowgroundwaters. For more information on shallow-system applications, the reader is referred toKendall and McDonnell (1998). For informationon groundwater systems, see Cook and Herczeg(2000).
5.11.1.1 Environmental Isotopes as Tracers
Environmental isotopes are naturally occurring(or, in some cases, anthropogenically produced)isotopes whose distributions in the hydrospherecan assist in the solution of hydrological andbiogeochemical problems. Typical uses ofenvironmental isotopes include the identificationof sources of water and solutes, determination ofwater flow paths, assessment of biologic cyclingof nutrients within the ecosystem, and testing flowpath, water budget, and geochemical modelsdeveloped using hydrologic or geochemical data.
Environmental isotopes can be used as tracersof waters and solutes in shallow low-temperatureenvironments because:
(i) Waters that were recharged at differenttimes, were recharged in different locations, orthat followed different flow paths are often iso-topically distinct; in other words, they havedistinctive “fingerprints.”
(ii) Unlike most chemical tracers, environmen-tal isotopes are relatively conservative in reactionswith the bedrock and soil materials. This isespecially true of oxygen and hydrogen isotopesin water; the waters mentioned above retain theirdistinctive fingerprints until they mix with otherwaters.
(iii) Solutes in the water that are derived fromatmospheric sources are often isotopically distinctfrom solutes derived from geologic and biologicsources within the catchment.
(iv) Both biological cycling of solutes andwater/rock reactions often change isotopic ratiosin the solutes in predictable and recognizabledirections; these processes often can be recon-structed from the isotopic compositions.
The applications of environmental isotopes ashydrologic tracers in low-temperature, freshwatersystems fall into two main categories: (i) tracers ofthe water itself (water isotope hydrology) and (ii)tracers of the solutes in the water (solute isotopebiogeochemistry). These classifications are by nomeans universal but they are useful conceptuallyand often eliminate confusion when comparingresults using different tracers.
Water isotope hydrology focuses on the iso-topes that form water molecules: the oxygenisotopes (oxygen-16, oxygen-17, and oxygen-18)and the hydrogen isotopes (protium, deuterium,and tritium). These isotopes are ideal tracers of
Stable Isotope Applications in Hydrologic Studies320
water sources and movement because they areconstituents of water molecules, not somethingthat is dissolved in the water like other tracers thatare commonly used in hydrology (e.g., dissolvedspecies such as chloride).
Oxygen and hydrogen isotopes are generallyused to determine the source of the water (e.g.,precipitation versus groundwater in streams,recharge of evaporated lake water versus snow-melt water in groundwater). In catchmentresearch, the main use is for determining thecontributions of “old” and “new” water to highflow (storm and snowmelt runoff) events instreams. “Old” water is defined as the water thatexisted in a catchment prior to a particular stormor snowmelt period. Old water includes ground-water, soil water, and surface water. “New” wateris either rainfall or snowmelt, and is defined asthe water that triggers the particular storm orsnowmelt runoff event.
Solute isotope biogeochemistry focuses onisotopes of constituents that are dissolved in thewater or are carried in the gas phase. The mostcommonly studied solute isotopes are the isotopesof carbon, nitrogen, and sulfur. Less commonlyinvestigated stable, nonradiogenic isotopesinclude lithium, chloride, boron, and iron.
Although the literature contains numerous casestudies involving the use of solutes (and some-times solute isotopes) to trace water sources andflow paths, such applications include an implicitassumption that these solutes are transportedconservatively with the water. Unlike the isotopesin the water molecules, the ratios of soluteisotopes can be significantly altered by reactionwith geological and/or biological materials as thewater moves through the system. While the utilityof solutes in the evaluation of rainfall-runoffprocesses has been repeatedly demonstrated, ina strict sense, solute isotopes only trace solutes.Solute isotopes also provide information on thereactions that are responsible for their presence inthe water and the flow paths implied by theirpresence.
5.11.1.2 Isotope Fundamentals
5.11.1.2.1 Basic principles
Isotopes are atoms of the same element that havedifferent numbers of neutrons but the same numberof protons and electrons. The difference in thenumber of neutrons between the various isotopes ofan element means that the various isotopes havedifferent masses. The superscript number to the leftof the element abbreviation indicates the number ofprotons plus neutrons in the isotope. For example,among the hydrogen isotopes, deuterium (denotedas 2H or D) has one neutron and one proton. This is
approximately twice the mass of protium (1H),whereas tritium (3H) has approximately three timesthe mass of protium.
The stable isotopes have nuclei that do not decayto other isotopes on geologic timescales, but maythemselves be produced by the decay of radioactiveisotopes. Radioactive (unstable) isotopes havenuclei that spontaneously decay over time toform other isotopes. For example, 14C, a radioiso-tope of carbon, is produced in the atmosphere bythe interaction of cosmic-ray neutrons with stable14N. With a half-life of,5,730 yr, 14C decays backto 14N by emission of a beta particle. The stable14N produced by radioactive decay is called “radio-genic” nitrogen. This chapter focuses on stable,nonradiogenic isotopes. For a more thoroughdiscussion of the fundamentals of isotope geo-chemistry, see Clark and Fritz (1997) and Kendalland McDonnell (1998).
5.11.1.2.2 Isotope fractionation
For elements of low atomic numbers, the massdifferences between the isotopes of an element arelarge enough for many physical, chemical, andbiological processes or reactions to “fractionate”or change the relative proportions of variousisotopes. Two different types of processes—equilibrium isotope effects and kinetic isotopeeffects—cause isotope fractionation. As a conse-quence of fractionation processes, waters andsolutes often develop unique isotopic compo-sitions (ratios of heavy to light isotopes) that maybe indicative of their source or of the processesthat formed them.
Equilibrium isotope-exchange reactionsinvolve the redistribution of isotopes of anelement among various species or compounds ina closed, well-mixed system at chemical equili-brium. At isotope equilibrium, the forward andbackward reaction rates of any particular isotopeare identical. This does not mean that the isotopiccompositions of two compounds at equilibriumare identical, but only that the ratios of thedifferent isotopes in each compound are con-stant for a particular temperature. During equili-brium reactions, the heavier isotope generallypreferentially accumulates in the speciesor compound with the higher oxidation state. Forexample, during sulfide oxidation, the sulfatebecomes enriched in 34S relative to sulfide(i.e., has a more positive d34S value); consequently,the residual sulfide becomes depleted in 34S.
Chemical, physical, and biological processescan be viewed as either reversible equilibriumreactions or irreversible unidirectional kineticreactions. In systems out of chemical and isotopicequilibrium, forward and backward reaction ratesare not identical, and isotope reactions may, in
Introduction 321
fact, be unidirectional if reaction products becomephysically isolated from the reactants. Suchreaction rates are dependent on the ratios of themasses of the isotopes and their vibrationalenergies, and hence are called kinetic isotopefractionations.
The magnitude of a kinetic isotope fractionationdepends on the reaction pathway, the reaction rate,and the relative bond energies of the bonds beingsevered or formed by the reaction. Kineticfractionations, especially unidirectional ones, areusually larger than the equilibrium fractionationfactor for the same reaction in most low-temperature environments. As a rule, bondsbetween the lighter isotopes are broken moreeasily than equivalent bonds of heavier isotopes.Hence, the light isotopes react faster and becomeconcentrated in the products, causing the residualreactants to become enriched in the heavyisotopes. In contrast, reversible equilibrium reac-tions can produce products heavier or lighter thanthe original reactants.
Biological processes are generally uni-directional and are excellent examples of“kinetic” isotope reactions. Organisms preferen-tially use the lighter isotopic species because ofthe lower energy “costs,” resulting in significantfractionations between the substrate (which gen-erally becomes isotopically heavier) and thebiologically mediated product (which generallybecomes isotopically lighter). The magnitude ofthe fractionation depends on the reaction pathwayutilized and the relative energies of the bondsbeing severed and formed by the reaction. Ingeneral, slower reaction steps show greaterisotopic fractionation than faster steps becausethe organism has time to be more selective.Kinetic reactions can result in fractionations verydifferent from, and typically larger than, theequivalent equilibrium reaction.
Many reactions can take place either underpurely equilibrium conditions or be affected by anadditional kinetic isotope fractionation. Forexample, although evaporation can take placeunder purely equilibrium conditions (i.e., at 100%humidity when the air is still), more typicallythe products become partially isolated from thereactants (e.g., the resultant vapor is blowndownwind). Under these conditions, the isotopiccompositions of the water and vapor are affectedby an additional kinetic isotope fractionation ofvariable magnitude.
The partitioning of stable isotopes between twosubstances A and B can be expressed by using theisotopic fractionation factor a (alpha):
a ¼ Rp=Rs ð1Þ
where Rp and Rs are the ratios of the heavy tolight isotope (e.g., 2H/1H or 18O/16O) in theproduct and substrate (reactant), respectively.
Values for a tend to be very close to 1. Anisotope enrichment factor, 1, can be defined as
1p–s ¼ ða2 1Þ £ 1; 000 ð2Þ
5.11.1.2.3 Rayleigh fractionation
The Rayleigh equation is an exponentialrelation that describes the partitioning of iso-topes between two reservoirs as one reservoirdecreases in size. The equations can be used todescribe an isotope fractionation process if: (i)the material is continuously removed from amixed system containing molecules of two ormore isotopic species (e.g., water with 18O and16O, or sulfate with 34S and 32S); (ii) thefractionation accompanying the removal processat any instant is described by the fractiona-tion factor a; and (iii) a does not change duringthe process. The general form of the Rayleighequation is
R ¼ Ro f ða21Þ ð3Þ
where Ro is the isotope ratio (e.g., 18O/16O) ofthe original substrate, and f is the fraction ofremaining substrate. A commonly used approxi-mate version of the equation is
d ø do þ 1 lnð f Þ ð4Þ
where do is the initial isotopic composition. Thisapproximation is valid for do values near 0 andpositive 1 values less than ,þ10‰:
In a strict sense, the term “Rayleigh fractiona-tion” should only be used for chemically opensystems where the isotopic species removed atevery instant are in thermodynamic and isotopicequilibrium with those remaining in the system atthe moment of removal. Furthermore, such an“ideal” Rayleigh distillation is one where thereactant reservoir is finite and well mixed, and doesnot re-react with the product (Clark and Fritz,1997). However, the term “Rayleigh fraction-ation” is commonly applied to equilibrium closedsystems and kinetic fractionations as well becausethe situations may be computationally identical.Isotopic fractionations are strongly affected bywhether a system is open or closed.
5.11.1.2.4 Terminology
Stable isotopic compositions are normallyreported as delta (d) values in parts per thousand(denoted as ‰ or permil, per mil, per mille, or permill) enrichments or depletions relative to astandard of known composition. The term “d” isspelled and pronounced delta, not del. d values arecalculated by
d ðin ‰Þ ¼ ðRsample=Rstandard 2 1Þ £ 1; 000 ð5Þ
Stable Isotope Applications in Hydrologic Studies322
where “R” is the ratio of the heavy to lightisotope. A positive delta value means that theisotopic ratio of the sample is higher than that ofthe standard; a negative value means that theisotope ratio of the sample is lower than that of thestandard.
Stable oxygen and hydrogen isotopic ratiosare normally reported relative to the “standardmean ocean water” (SMOW) standard (Craig,1961b) or the equivalent Vienna-SMOW (V-SMOW) standard. Carbon, nitrogen, and sulfurstable isotope ratios are reported relative tothe Pee Dee Belemnite (PDB) or Vienna-PDB(VPDB), ambient air (AIR), and Canyon DiabloTroilite (CDT) standards, respectively, as definedlater. The use of the “V” before SMOW or PDBindicates that the measurements were calibratedon normalized per mil scales (Coplen, 1996).
The d values for stable isotopes are determinedusing isotope ratio mass spectrometry, typicallyeither using gas-source stable isotope massspectrometers (e.g., hydrogen, carbon, nitrogen,oxygen, sulfur, chlorine, and bromine) or solid-source mass spectrometry (e.g., lithium, boron,and iron). The analytical precisions are smallrelative to the ranges in d values that occur innatural earth systems. Typical one standarddeviation (1s) analytical precisions for oxygen,carbon, nitrogen, and sulfur isotopes are in the0.05–0.2‰ range; typical precisions for hydrogenisotopes are generally poorer, from 0.2‰ to 1.0‰,because of the low 2H : 1H ratio of naturalmaterials.
5.11.1.3 Causes of Isotopic Variation
5.11.1.3.1 Isotope fractionations duringphase changes
The most important phase changes in hydro-logical systems are associated with water as itcondenses, evaporates, and melts. At equilibrium,the isotope fractionation between two coexistingphases is a function of temperature. As the phasechange proceeds, the d values of both the reactantand product change in a regular fashion. Forexample, as water evaporates, the d18O and d2Hvalues of the residual water increase, and the dvalues of the resulting vapor also increase. Thelower the humidity, the greater the kineticfractionation associated with the phase change.The changes in their d values can be describedusing the Rayleigh equations. The Rayleighequation applies to an open system from whichmaterial is removed continuously under conditionof a constant fractionation factor.
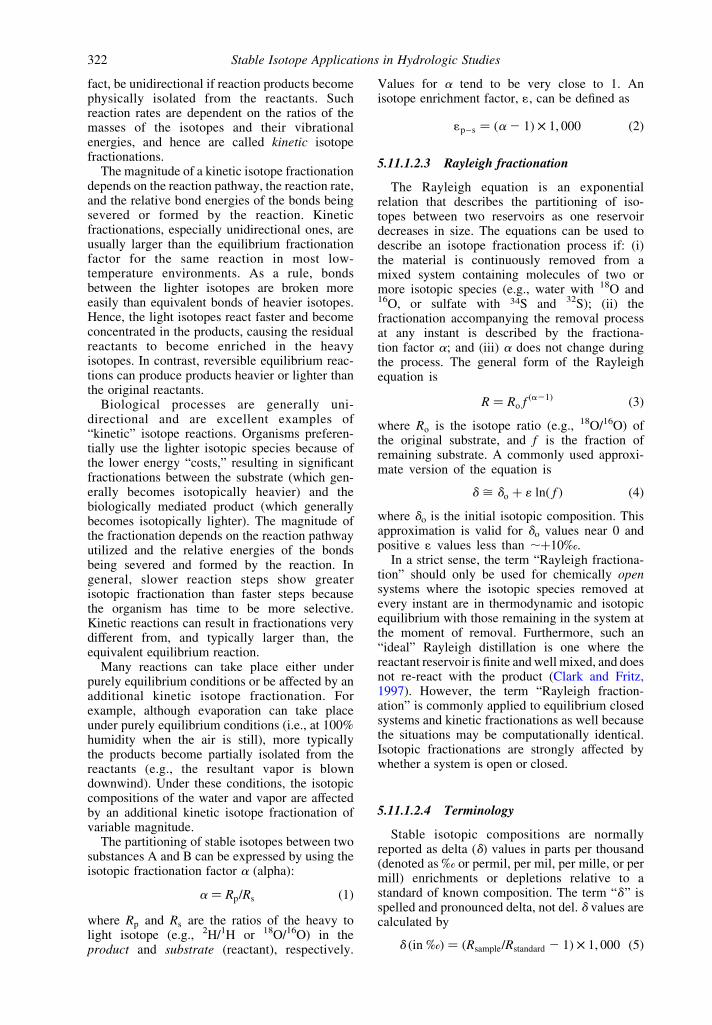
The isotope enrichment achieved can be verydifferent in closed versus open systems. Forexample, Figure 1 shows the changes in the d18O
of water and vapor during both open-system (solidlines) and closed-system (dashed lines) evapor-ation with a constant fractionation factoral2v ¼ 1.010 (i.e., the newly formed vapor isalways 10‰ lower than the residual water).During open-system evaporation where thevapor is continuously removed (i.e., isolatedfrom the water), as evaporation progresses(i.e., f ! 0), the d18O of the remaining water(solid line A) becomes higher. The d18O of theinstantaneously formed vapor (solid line B)describes a curve parallel to that of the remainingwater, but lower than it (for all values of f ) by theprecise amount dictated by the fractionation factorfor ambient temperature, in this case by 10‰. Forhigher temperatures, the a value would be smallerand the curves closer together. The integratedcurve, giving the isotopic composition of theaccumulated vapor thus removed, is shown assolid line C. Mass-balance considerations requirethat the isotope content of the total accumulated
Figure 1 Isotopic change under open- and closed-system Rayleigh conditions for evaporation with afractionation factor a ¼ 1.01 for an initial liquidcomposition of d18O ¼ 0. The d18O of the remainingwater (solid line A), the instantaneous vapor beingremoved (solid line B), and the accumulated vaporbeing removed (solid line C) all increase during single-phase, open-system, evaporation under equilibriumconditions. The d18O of water (dashed line D) andvapor (dashed line E) in a two-phase closed system alsoincrease during evaporation, but much less than in anopen system; for a closed system, the d values of theinstantaneous and cumulative vapor are identical (after
Gat and Gonfiantini, 1981).
Introduction 323
vapor approaches the initial water d18O value asf ! 0: Hence, any process that can be modeled asa Rayleigh fractionation will not exhibit fraction-ation between the product and source if theprocess proceeds to completion (with 100%yield). This is a rare occurrence in nature sincehydrologic systems are neither commonly com-pletely open nor completely closed systems.
The dashed lines in Figure 1 show the d18O ofvapor (E) and water (D) during equilibriumevaporation in a closed system (i.e., where thevapor and water are in contact for the entire phasechange). Note that the d18O of vapor in the opensystem where the vapor is continuously removed(line B) is always higher than the d18O of vapor ina closed system where the vapor (line E) and water(line D) remain in contact. In both cases, theevaporation takes place under equilibrium con-ditions with a ¼ 1.010, but the cumulative vaporin the closed system remains in equilibrium withthe water during the entire phase change. As arule, fractionations in a true “open-system”Rayleigh process create a much larger range inthe isotopic compositions of the products andreactants than in closed systems. This is becauseof the lack of back-reactions in open systems.Natural processes will produce fractionationsbetween these two “ideal” cases.
5.11.1.3.2 Mixing of waters and/or solutes
Waters mix conservatively with respect to theirisotopic compositions. In other words, the isotopiccompositions of mixtures are intermediatebetween the compositions of the end-members.Despite the terminology (the d notation andunits of ‰) and common negative values, thecompositions can be treated just like any other
chemical constituent (e.g., chloride content)for making mixing calculations. For example,if two streams with known discharges ðQ1;Q2Þand known d18O values (d18O1, d18O2) merge andbecome well mixed, the d18O of the combinedflow ðQTÞ can be calculated from
QT ¼ Q1 þ Q2 ð6Þ
d18OTQT ¼ d18O1Q1 þ d18O2Q2 ð7Þ
Another example: any mixing proportions oftwo waters with known d18O and d2H valueswill fall along a tie line between the compositionsof the end-members on a d18O versus d2H plot.
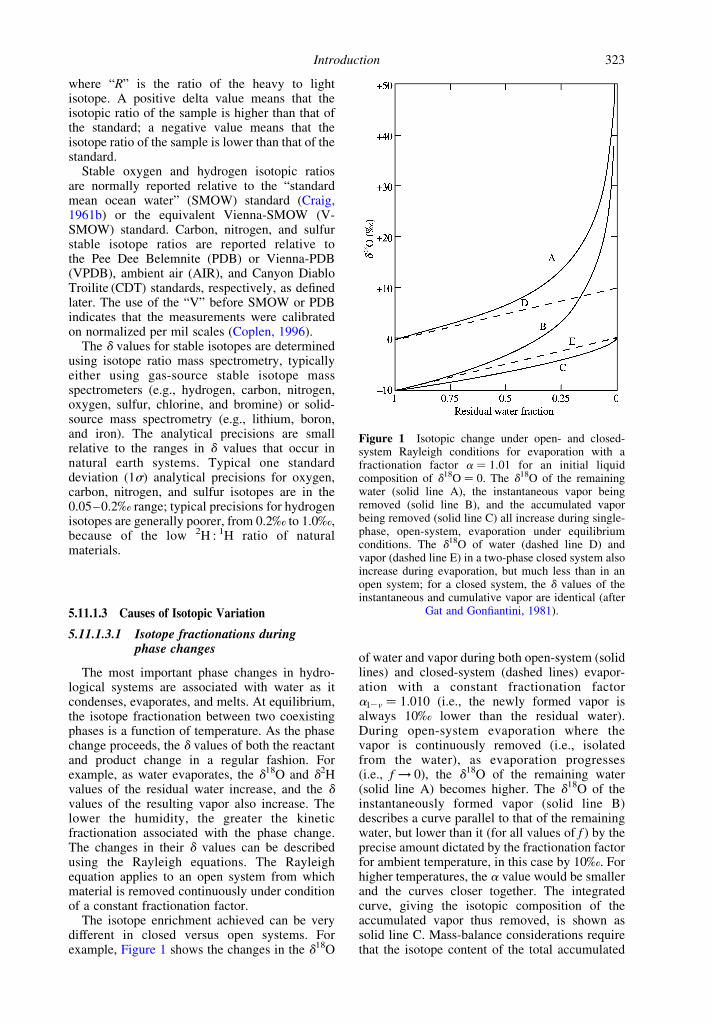
What is not so obvious is that on many types ofX–Y plots, mixtures of two end-members will notnecessarily plot along straight lines but insteadalong hyperbolic curves (Figure 2(a)). This hasbeen explained very elegantly by Faure (1986),using the example of 87Sr/86Sr ratios. The basicprinciple is that mixtures of two componentsthat have different isotope ratios (e.g., 87Sr/86Sr or15N/14N) and different concentrations of theelement in question (e.g., strontium or nitrogen)form hyperbolas when plotted on diagrams withcoordinates of isotope ratios versus concentration.As the difference between the elemental concen-trations of two components (end-members)approaches 0, the hyperbolas flatten to lines.The hyperbolas are concave or convex, dependingon whether the component with the higher isotoperatio has a higher or lower concentration than theother component. Mixing hyperbolas can betransformed into straight lines by plotting isotoperatios versus the inverse of concentration (1/C),as shown in Figure 2(b). One way to avoidcurved lines on plots of d values versus soluteconcentrations is to plot molality instead of
Figure 2 (a) Hyperbolas formed by the mixing of components (waters or minerals) A and B with different Srconcentrations and Sr isotope ratios (87Sr/86Sr). If the concentrations of Sr in A and B are identical, the mixingrelation would be a straight line; otherwise, the mixing relations are either concave or convex curves, as shown.(b) Plotting the reciprocals of the strontium concentrations transforms the mixing hyperbolas into straight lines. If thecurves in (a) were the result of some fractionation process (e.g., radioactive decay) that is an exponential relation,
plotting the reciprocals of the Sr concentrations would not produce straight lines (after Faure, 1986).
Stable Isotope Applications in Hydrologic Studies324

molarity for the solute. Mixing and fractionationlines on d18O versus d2H plots are generallystraight lines, because the concentrations ofoxygen and hydrogen in water are essentiallyconstant except for extremely saline brines.
Although the topic is rarely discussed, theisotope concentration of a sample is not necess-arily equal to the isotope activity. For example,the isotope activity coefficient for water-O orwater-H can be positive or negative, depending onsolute type, molality, and temperature of thesolution. The isotopic compositions of watersand solutes can be affected significantly by theconcentration and types of salts, because theisotopic compositions of waters in the hydrationspheres of salts and in regions farther from thesalts are different (see Horita (1989) for a gooddiscussion of this topic). In general, the only timeswhen it is important to consider isotope activitiesare for low pH, high SO4, and/or high magnesiumbrines because the activity and concentration dvalues of these waters (da and dc) are significantlydifferent. For example, the difference(d2Ha 2 d2Hc) between the activity and concen-tration d values for sulfuric acid solutions in minetailings is ,þ16‰ for 2 m solutions. For normalsaline waters (e.g., seawater), the activity coeffi-cients for d18O and d2H are essentially equal to 1.
Virtually all laboratories report d18O activities(not concentrations) for water samples. The d2Hof waters may be reported in either concentrationor activity d values, depending on the method usedfor preparing the samples for analysis. Methodsthat involve quantitative conversion of the H inH2O to H2 produce dc values. Methods thatanalyze H2O by equilibrating it with H2 (or withCO2), and then analyzing the equilibrated gas forisotopic composition produce da values. “Equili-brate” in this case means letting the liquid and gasreach isotopic equilibrium at a constant, knowntemperature. d13C, d15N, and d34S preparationmethods do not involve equilibration and, hence,these are dc values. To avoid confusion, labora-tories and research papers should always reportthe method used.
5.11.1.3.3 Geochemical and biologicalreactions
Reactions in shallow systems that frequentlyoccur under equilibrium isotope conditionsinclude (i) solute addition and precipitation (e.g.,oxygen exchange between water and carbonate,sulfate, and other oxides, carbonate dissolutionand precipitation) and (ii) gas dissolution andexchange (e.g., exchange of hydrogen betweenwater and dissolved H2S and CH4, oxygen isotopeexchange between water and CO2). However,most of the reactions occurring in the soil zone, in
shallow groundwater, and in surface waters arebiologically mediated, and hence produce non-equilibrium isotope fractionations. These reac-tions may behave like Rayleigh fractionations inthat there may be negligible back-reactionbetween the reactant and product, regardless ofwhether the system is open or closed. This arisesdue to the slow rates of many inorganic isotopicequilibrium exchange reactions at near-surfaceenvironmental conditions (i.e., low temperature,low pressure, pH 6–9).
Nonequilibrium isotopic fractionations typi-cally result in larger ranges of isotopic compo-sitions between reactants and products than thoseunder equivalent equilibrium conditions. Anexample of this process is biologically mediateddenitrification (reduction) of nitrate to N2 ingroundwater. The N2 produced may be lost tothe atmosphere, but even if it remains in contactwith the residual nitrate, the gas does not re-equilibrate with the nitrate nor is there a bio-logically mediated back-reaction.
Graphical methods are commonly used fordetermining whether the data support an interpret-ation of mixing of two potential sources orfractionation of a single source. Implicit in suchefforts is often the idea that mixing will produce a“straight line” connecting the compositions of thetwo proposed end-members whereas fractionationwill produce a “curve.” However, as shown inFigure 3(a), both mixing and fractionation (inthis case, denitrification) can produce curves(Mariotti et al., 1988), although both relationscan look linear for small ranges of concentrations.However, the equations describing mixing andfractionation processes are different and, under
Figure 3 (a) Theoretical evolution of the d15N and thenitrate-N concentration during mixing (solid line) oftwo waters X and Y, and during an isotope fractio-nating process (e.g., denitrification of water X with anNO3 concentration of 10 ppm). Denitrification for1 ¼ 24:1‰ results in a curve (dashed line) that endsat Y. Two different enrichment factors are compared:1 ¼ 24:1‰ and 1 ¼ 28:1‰: The data points repres-ent successive 0.1 increments of mixing or denitri-fication progress. (b) Plotting the natural log of theconcentrations for a fractionation process yieldsstraight lines, different for different 1 values (after
Mariotti et al., 1988).
Introduction 325
favorable conditions, the process responsible forthe curve can be identified. This is becauseRayleigh fractionations are exponential relations(Equation (3)), and plotting d values versus thenatural log of concentration ðCÞ will produce astraight line (Figure 3(b)). If an exponentialrelation is not observed and a straight line isproduced on a d versus 1=C plot (as in Figure 2(b)),this supports the contention that the data areproduced by simple mixing of two end-members.
5.11.2 TRACING THE HYDROLOGICALCYCLE
In most low-temperature, near-surface environ-ments, stable hydrogen and oxygen isotopesbehave conservatively. This means that as watermolecules move through the subsurface, chemicalexchange between the water and oxygen andhydrogen in the organic and inorganic materialsthrough which flow occurs will have a negligibleeffect on the overall isotope ratios of the water (anexception is within certain geothermal systems,especially in carbonates, where large amounts ofoxygen exchange between the water and rock canoccur). Water isotopes are useful tracers of waterflow paths, especially in confined groundwatersystems dominated by Darcian flow in which asource of water with a distinctive isotopiccomposition forms a “plume” in the subsurface.This phenomenon forms the basis of the science ofisotope hydrology, or the use of stable waterisotopes in hydrological studies.
Although tritium also exhibits insignificantreaction with geologic materials, it does changein concentration over time because it is radio-active and decays with a half-life of ,12.4 yr. Themain processes that dictate the oxygen andhydrogen isotopic compositions of waters in acatchment are: (i) phase changes that affect thewater above or near the ground surface (evapor-ation, condensation, and melting) and (ii) simplemixing at or below the ground surface.
Oxygen and hydrogen isotopes can be used todetermine the source of groundwaters and surfacewaters. For example, d18O and d2H can be used todetermine the contributions of old and new water toa stream or shallow groundwater during periods ofhigh runoff because the rain or snowmelt (newwater) that triggers the runoff is often isotopicallydifferent from the water already in the catchment(old water). This section briefly explains whywaters from different sources often have dif-ferent isotopic compositions. For more detaileddiscussions of these and other environmentalisotopes, the reader can consult texts such asKendall and McDonnell (1998) and Cook andHerczeg (2000).
5.11.2.1 Deuterium and Oxygen-18
5.11.2.1.1 Basic principles
Craig (1961a) observed that d18O and d2H (ordD) values of precipitation that has not beenevaporated are linearly related by
d2H ¼ 8d18O þ 10 ð8Þ
This equation, known as the “global meteoricwaterline” (GMWL), is based on precipitationdata from locations around the globe. The slopeand intercept of the “local meteoric waterline”(LMWL) for rain from a specific catchment orbasin can be different from the GMWL. Thedeuterium excess (d excess, or d ) parameter hasbeen defined to describe these different meteoricwaterlines (MWLs), such that
d ¼ d2H 2 8d18O ð9Þ
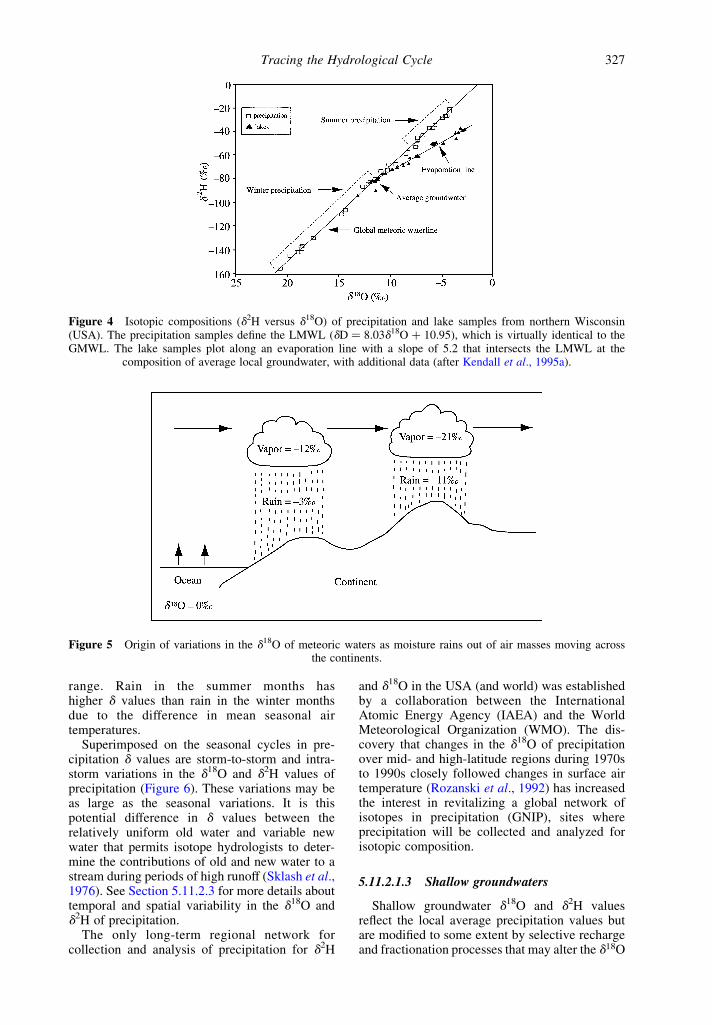
On d18O versus d2H plots, water that has evapo-rated from open surfaces (e.g., ponds and lakes), ormixed with evaporated water, plots belowthe MWL along a trajectory typically with aslope between 2 and 5 (Figure 4). The slope of theevaporation line and the isotopic evolution of thereservoir are strongly dependent upon the humidityunder which evaporation occurs, as well astemperature and wind speed (Clark and Fritz,1997), with lower slopes found in arid regions.
5.11.2.1.2 Precipitation
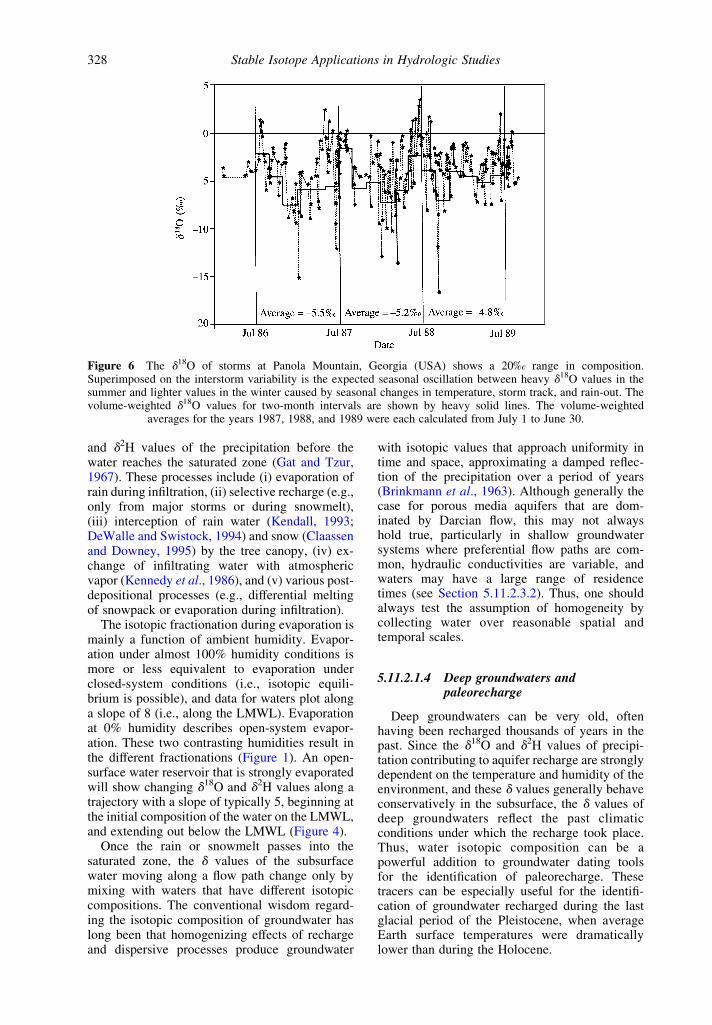
The two main factors that control the isotopiccharacter of precipitation at a given location arethe temperature of condensation of the precipi-tation and the degree of rainout of the air mass (theratio of water vapor that has already condensedinto precipitation to the initial amount of watervapor in the air mass). The d18O and d2H ofprecipitation are also influenced by altitude,distance inland along different storm tracks,environmental conditions at the source of thevapor, latitude, and humidity. Progressive rainoutas clouds move across the continent causessuccessive rainstorms to have increasingly lowerd values (Figure 5). At any point along the stormtrajectory (i.e., for some specific fraction f ofthe total original vapor mass), d18O and d2H of theresidual fraction of vapor in the air mass can becalculated using the Rayleigh equation.
At a given location, the seasonal variationsin d18O and d2H values of precipitation and theweighted average annual d18O and d2H valuesof precipitation do not vary greatly from yearto year. This happens because the annual rangeand sequence of climatic conditions (tempera-tures, vapor source, direction of air mass move-ment, etc.) generally vary within a predictable
Stable Isotope Applications in Hydrologic Studies326
range. Rain in the summer months hashigher d values than rain in the winter monthsdue to the difference in mean seasonal airtemperatures.
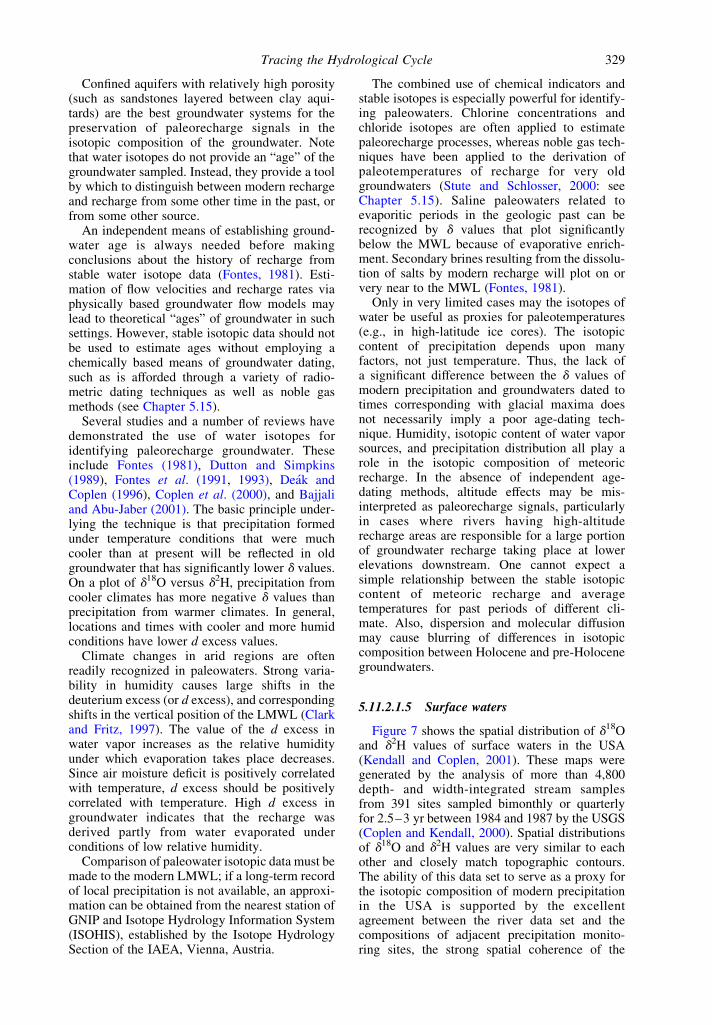
Superimposed on the seasonal cycles in pre-cipitation d values are storm-to-storm and intra-storm variations in the d18O and d2H values ofprecipitation (Figure 6). These variations may beas large as the seasonal variations. It is thispotential difference in d values between therelatively uniform old water and variable newwater that permits isotope hydrologists to deter-mine the contributions of old and new water to astream during periods of high runoff (Sklash et al.,1976). See Section 5.11.2.3 for more details abouttemporal and spatial variability in the d18O andd2H of precipitation.
The only long-term regional network forcollection and analysis of precipitation for d2H
and d18O in the USA (and world) was establishedby a collaboration between the InternationalAtomic Energy Agency (IAEA) and the WorldMeteorological Organization (WMO). The dis-covery that changes in the d18O of precipitationover mid- and high-latitude regions during 1970sto 1990s closely followed changes in surface airtemperature (Rozanski et al., 1992) has increasedthe interest in revitalizing a global network ofisotopes in precipitation (GNIP), sites whereprecipitation will be collected and analyzed forisotopic composition.
5.11.2.1.3 Shallow groundwaters
Shallow groundwater d18O and d2H valuesreflect the local average precipitation values butare modified to some extent by selective rechargeand fractionation processes that may alter the d18O
Figure 4 Isotopic compositions (d2H versus d18O) of precipitation and lake samples from northern Wisconsin(USA). The precipitation samples define the LMWL (dD ¼ 8.03d18O þ 10.95), which is virtually identical to theGMWL. The lake samples plot along an evaporation line with a slope of 5.2 that intersects the LMWL at the
composition of average local groundwater, with additional data (after Kendall et al., 1995a).
Figure 5 Origin of variations in the d18O of meteoric waters as moisture rains out of air masses moving acrossthe continents.
Tracing the Hydrological Cycle 327
and d2H values of the precipitation before thewater reaches the saturated zone (Gat and Tzur,1967). These processes include (i) evaporation ofrain during infiltration, (ii) selective recharge (e.g.,only from major storms or during snowmelt),(iii) interception of rain water (Kendall, 1993;DeWalle and Swistock, 1994) and snow (Claassenand Downey, 1995) by the tree canopy, (iv) ex-change of infiltrating water with atmosphericvapor (Kennedy et al., 1986), and (v) various post-depositional processes (e.g., differential meltingof snowpack or evaporation during infiltration).
The isotopic fractionation during evaporation ismainly a function of ambient humidity. Evapor-ation under almost 100% humidity conditions ismore or less equivalent to evaporation underclosed-system conditions (i.e., isotopic equili-brium is possible), and data for waters plot alonga slope of 8 (i.e., along the LMWL). Evaporationat 0% humidity describes open-system evapor-ation. These two contrasting humidities result inthe different fractionations (Figure 1). An open-surface water reservoir that is strongly evaporatedwill show changing d18O and d2H values along atrajectory with a slope of typically 5, beginning atthe initial composition of the water on the LMWL,and extending out below the LMWL (Figure 4).
Once the rain or snowmelt passes into thesaturated zone, the d values of the subsurfacewater moving along a flow path change only bymixing with waters that have different isotopiccompositions. The conventional wisdom regard-ing the isotopic composition of groundwater haslong been that homogenizing effects of rechargeand dispersive processes produce groundwater
with isotopic values that approach uniformity intime and space, approximating a damped reflec-tion of the precipitation over a period of years(Brinkmann et al., 1963). Although generally thecase for porous media aquifers that are dom-inated by Darcian flow, this may not alwayshold true, particularly in shallow groundwatersystems where preferential flow paths are com-mon, hydraulic conductivities are variable, andwaters may have a large range of residencetimes (see Section 5.11.2.3.2). Thus, one shouldalways test the assumption of homogeneity bycollecting water over reasonable spatial andtemporal scales.
5.11.2.1.4 Deep groundwaters andpaleorecharge
Deep groundwaters can be very old, oftenhaving been recharged thousands of years in thepast. Since the d18O and d2H values of precipi-tation contributing to aquifer recharge are stronglydependent on the temperature and humidity of theenvironment, and these d values generally behaveconservatively in the subsurface, the d values ofdeep groundwaters reflect the past climaticconditions under which the recharge took place.Thus, water isotopic composition can be apowerful addition to groundwater dating toolsfor the identification of paleorecharge. Thesetracers can be especially useful for the identifi-cation of groundwater recharged during the lastglacial period of the Pleistocene, when averageEarth surface temperatures were dramaticallylower than during the Holocene.
Figure 6 The d18O of storms at Panola Mountain, Georgia (USA) shows a 20‰ range in composition.Superimposed on the interstorm variability is the expected seasonal oscillation between heavy d18O values in thesummer and lighter values in the winter caused by seasonal changes in temperature, storm track, and rain-out. Thevolume-weighted d18O values for two-month intervals are shown by heavy solid lines. The volume-weighted
averages for the years 1987, 1988, and 1989 were each calculated from July 1 to June 30.
Stable Isotope Applications in Hydrologic Studies328
Confined aquifers with relatively high porosity(such as sandstones layered between clay aqui-tards) are the best groundwater systems for thepreservation of paleorecharge signals in theisotopic composition of the groundwater. Notethat water isotopes do not provide an “age” of thegroundwater sampled. Instead, they provide a toolby which to distinguish between modern rechargeand recharge from some other time in the past, orfrom some other source.
An independent means of establishing ground-water age is always needed before makingconclusions about the history of recharge fromstable water isotope data (Fontes, 1981). Esti-mation of flow velocities and recharge rates viaphysically based groundwater flow models maylead to theoretical “ages” of groundwater in suchsettings. However, stable isotopic data should notbe used to estimate ages without employing achemically based means of groundwater dating,such as is afforded through a variety of radio-metric dating techniques as well as noble gasmethods (see Chapter 5.15).
Several studies and a number of reviews havedemonstrated the use of water isotopes foridentifying paleorecharge groundwater. Theseinclude Fontes (1981), Dutton and Simpkins(1989), Fontes et al. (1991, 1993), Deak andCoplen (1996), Coplen et al. (2000), and Bajjaliand Abu-Jaber (2001). The basic principle under-lying the technique is that precipitation formedunder temperature conditions that were muchcooler than at present will be reflected in oldgroundwater that has significantly lower d values.On a plot of d18O versus d2H, precipitation fromcooler climates has more negative d values thanprecipitation from warmer climates. In general,locations and times with cooler and more humidconditions have lower d excess values.
Climate changes in arid regions are oftenreadily recognized in paleowaters. Strong varia-bility in humidity causes large shifts in thedeuterium excess (or d excess), and correspondingshifts in the vertical position of the LMWL (Clarkand Fritz, 1997). The value of the d excess inwater vapor increases as the relative humidityunder which evaporation takes place decreases.Since air moisture deficit is positively correlatedwith temperature, d excess should be positivelycorrelated with temperature. High d excess ingroundwater indicates that the recharge wasderived partly from water evaporated underconditions of low relative humidity.
Comparison of paleowater isotopic data must bemade to the modern LMWL; if a long-term recordof local precipitation is not available, an approxi-mation can be obtained from the nearest station ofGNIP and Isotope Hydrology Information System(ISOHIS), established by the Isotope HydrologySection of the IAEA, Vienna, Austria.
The combined use of chemical indicators andstable isotopes is especially powerful for identify-ing paleowaters. Chlorine concentrations andchloride isotopes are often applied to estimatepaleorecharge processes, whereas noble gas tech-niques have been applied to the derivation ofpaleotemperatures of recharge for very oldgroundwaters (Stute and Schlosser, 2000: seeChapter 5.15). Saline paleowaters related toevaporitic periods in the geologic past can berecognized by d values that plot significantlybelow the MWL because of evaporative enrich-ment. Secondary brines resulting from the dissolu-tion of salts by modern recharge will plot on orvery near to the MWL (Fontes, 1981).
Only in very limited cases may the isotopes ofwater be useful as proxies for paleotemperatures(e.g., in high-latitude ice cores). The isotopiccontent of precipitation depends upon manyfactors, not just temperature. Thus, the lack ofa significant difference between the d values ofmodern precipitation and groundwaters dated totimes corresponding with glacial maxima doesnot necessarily imply a poor age-dating tech-nique. Humidity, isotopic content of water vaporsources, and precipitation distribution all play arole in the isotopic composition of meteoricrecharge. In the absence of independent age-dating methods, altitude effects may be mis-interpreted as paleorecharge signals, particularlyin cases where rivers having high-altituderecharge areas are responsible for a large portionof groundwater recharge taking place at lowerelevations downstream. One cannot expect asimple relationship between the stable isotopiccontent of meteoric recharge and averagetemperatures for past periods of different cli-mate. Also, dispersion and molecular diffusionmay cause blurring of differences in isotopiccomposition between Holocene and pre-Holocenegroundwaters.
5.11.2.1.5 Surface waters
Figure 7 shows the spatial distribution of d18Oand d2H values of surface waters in the USA(Kendall and Coplen, 2001). These maps weregenerated by the analysis of more than 4,800depth- and width-integrated stream samplesfrom 391 sites sampled bimonthly or quarterlyfor 2.5–3 yr between 1984 and 1987 by the USGS(Coplen and Kendall, 2000). Spatial distributionsof d18O and d2H values are very similar to eachother and closely match topographic contours.The ability of this data set to serve as a proxy forthe isotopic composition of modern precipitationin the USA is supported by the excellentagreement between the river data set and thecompositions of adjacent precipitation monito-ring sites, the strong spatial coherence of the
Tracing the Hydrological Cycle 329
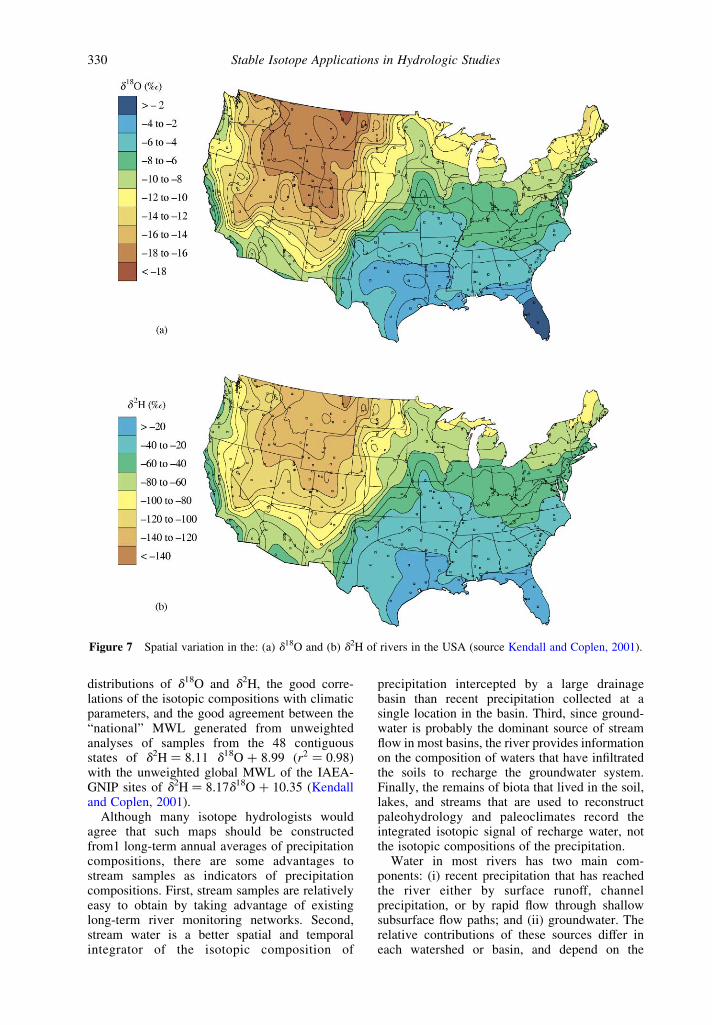
distributions of d18O and d2H, the good corre-lations of the isotopic compositions with climaticparameters, and the good agreement between the“national” MWL generated from unweightedanalyses of samples from the 48 contiguousstates of d2H ¼ 8.11 d18O þ 8.99 ðr2 ¼ 0:98Þwith the unweighted global MWL of the IAEA-GNIP sites of d2H ¼ 8.17d18O þ 10.35 (Kendalland Coplen, 2001).
Although many isotope hydrologists wouldagree that such maps should be constructedfrom1 long-term annual averages of precipitationcompositions, there are some advantages tostream samples as indicators of precipitationcompositions. First, stream samples are relativelyeasy to obtain by taking advantage of existinglong-term river monitoring networks. Second,stream water is a better spatial and temporalintegrator of the isotopic composition of
precipitation intercepted by a large drainagebasin than recent precipitation collected at asingle location in the basin. Third, since ground-water is probably the dominant source of streamflow in most basins, the river provides informationon the composition of waters that have infiltratedthe soils to recharge the groundwater system.Finally, the remains of biota that lived in the soil,lakes, and streams that are used to reconstructpaleohydrology and paleoclimates record theintegrated isotopic signal of recharge water, notthe isotopic compositions of the precipitation.
Water in most rivers has two main com-ponents: (i) recent precipitation that has reachedthe river either by surface runoff, channelprecipitation, or by rapid flow through shallowsubsurface flow paths; and (ii) groundwater. Therelative contributions of these sources differ ineach watershed or basin, and depend on the
Figure 7 Spatial variation in the: (a) d18O and (b) d2H of rivers in the USA (source Kendall and Coplen, 2001).
Stable Isotope Applications in Hydrologic Studies330
physical setting of the drainage basin (e.g.,topography, soil type, depth to bedrock, vege-tation, fractures, etc.), climatic parameters (e.g.,precipitation amount, seasonal variations inprecipitation, temperature, potential evapotran-spiration, etc.), and human activities (e.g., dams,reservoirs, irrigation usages, clearing for agricul-ture, channel restructuring, etc.).
The d18O and d2H of rivers will reflect how therelative amounts of precipitation and groundwatervary with time, and how the isotopic compositionsof the sources themselves change over time.Seasonal variations will be larger in streamswhere recent precipitation is the main source offlow, and smaller in streams where groundwater isthe dominant source. As the basin size increases,the isotopic compositions of river waters are alsoincreasingly affected by evaporation (Gat andTzur, 1967). Local precipitation events are animportant component of river water in the head-waters of large basins. For example, the averageamount of new water in small, forested watershedsduring storms is ,40%, although during stormsthe percentage can be higher (Genereux andHooper, 1998). However, in the lower reaches,local additions of precipitation can be of minorimportance (Friedman et al., 1964; Salati et al.,1979), except during floods (Criss, 1999). Forexample, analysis of long-term tritium records forseven large (5,000–75,000 km2) drainage basinsin the USA indicated that ,60% ^ 20% of theriver water was less than 1 yr old (Michel, 1992).
The dual nature of river water (partly recentprecipitation, partly groundwater) can beexploited for studying regional hydrology orclimatology. Under favorable circumstances,knowledge of the isotopic compositions of themajor water sources can be used to quantify thetime-varying contributions of these sources toriver water (Sklash et al., 1976; Kendall andMcDonnell, 1998). Alternatively, if the isotopiccomposition of base flow is thought to be agood representation of mean annual precipitation(Fritz, 1981), then the d18O and d2H of riverssampled during low flow can integrate thecomposition of rain over the drainage areasand be useful for assessing regional patterns inprecipitation related to climate.
5.11.2.2 Tritium
Tritium (3H) is a radiogenic and radioactiveisotope of hydrogen with a half-life of 12.4 yr.It is an excellent tracer for determining time-scales for the mixing and flow of waters becauseit is considered to be relatively conservativegeochemically, and is ideally suited for studyingprocesses that occur on a timescale of less than100 yr. Tritium content is expressed in tritium
units (TU), where 1 TU equals 1 3H atom in 1018
atoms of hydrogen.Prior to the advent of atmospheric testing of
thermonuclear devices in 1952, the tritium contentof precipitation was probably in the range of2–8 TU (Thatcher, 1962); this background con-centration is produced by cosmic ray spallation.While elevated tritium levels have been measuredin the atmosphere since 1952, tritium produced bythermonuclear testing (“bomb tritium”) has beenthe dominant source of tritium in precipitation.A peak concentration of several thousand TU wasrecorded in precipitation in the northern hemi-sphere in 1963, the year that the atmospheric testban treaty was signed. After 1963, the tritiumlevels in precipitation began to decline graduallybecause of radioactive decay and the cessation ofatmospheric testing.
The simplest use of tritium is to check whetherdetectable concentrations are present in the water.Although pre-bomb atmospheric tritium concen-trations are not well known, waters derivedexclusively from precipitation before 1953would have maximum tritium concentrations of,0.1–0.4 TU by 2003. For waters with highertritium contents, some fraction of the water musthave been derived since 1953; thus, the tritiumconcentration can be a useful marker for rechargesince the advent of nuclear testing.
Distinct “old” and “new” water tritium valuesare required for storm and snowmelt runoffhydrograph separation. In small (first-order)catchments where the average residence time(the average time it takes for precipitation to enterthe ground and travel to the stream) of the oldwater is on the order of months, the old and newwater tritium concentrations will not likely bedistinguishable. However, in some larger catch-ments with longer residence times, old and newwaters may be distinctive as a result of the gradualdecline in precipitation tritium values since 1963and the even more gradual decline in groundwatertritium values.
Tritium measurements are frequently used tocalculate recharge rates, rates or directions ofsubsurface flow, and residence times. For thesepurposes, the seasonal, yearly, and spatial vari-ations in the tritium content of precipitation mustbe accurately assessed. This is difficult to dobecause of the limited data available, especiallybefore the 1960s. For a careful discussion ofhow to calculate the input concentration at aspecific location, see Michel (1989) and Plummeret al. (1993). Several different approaches(e.g., piston-flow, reservoir, compartment, andadvective-dispersive models) to modeling tritiumconcentrations in groundwater are discussed byPlummer et al. (1993). The narrower topic ofusing environmental isotopes to determineresidence time is discussed briefly below.
Tracing the Hydrological Cycle 331
If the initial concentration of 3H in theatmosphere is not known, an alternative datingmethod is to analyze waters for both 3H and 3He.Because 3H decays to 3He, it is possible to use thetritiogenic 3He component of 3He in groundwateras a quantitative tracer of the age of the watersince it was separated from the atmosphere.
5.11.2.3 Determination of Runoff Mechanisms
A major uncertainty in hydrologic and chemicalmodeling of catchments has been the quantifi-cation of the contributions of water and solutesfrom various hydrologic pathways. Isotope hydro-graph separation apportions storm and snowmelthydrographs into contributing components basedon the distinctive isotopic signatures carried bythe two or more water components (e.g., newprecipitation, soil water, and groundwater). Thebasic principle behind isotope hydrograph separ-ation is that, if the isotopic compositions of thesources of water contributing to stream flow dur-ing periods of high runoff are known and are dif-ferent, then the relative amounts of each source canbe determined. Since these studies began in the1960s, the overwhelming conclusion is that oldwater is by far the dominant source of runoff inhumid, temperate environments (Sklash et al.,1976; Pearce et al., 1986; Bishop, 1991). Buttle(1998) provides a succinct review of watershedhydrology.
5.11.2.3.1 Isotope hydrograph separationand mixing models
Until the 1970s, the term “hydrograph separ-ation” meant a graphical technique that had beenused for decades in predicting runoff volumes andtiming. For example, the graphical separationtechnique introduced by Hewlett and Hibbert(1967) is commonly applied to storm hydrographs(i.e., stream flow versus time graphs) fromforested catchments to quantify “quick flow” and“delayed flow” contributions. According to thistechnique, the amounts of quick flow and delayedflow in stream water can be determined simply byconsidering the shape and timing of the dischargehydrograph.
Isotope hydrograph separation apportions stormand snowmelt hydrographs into contributingcomponents based on the distinctive isotopicsignatures carried by the old and new watercomponents. Hence, the method allows thecalculation of the relative contributions of newprecipitation and older groundwater to streamflow. A major limitation of the tracer method isthat we cannot directly determine how the waterreaches the stream (i.e., geographic source of the
water) nor the actual runoff generation mechanismfrom knowledge of the temporal sources of water.In a very real sense, the isotope hydrographseparation technique is still a “black box” methodthat provides little direct information about whatis actually going on in the subsurface. However, incombination with other types of information (e.g.,estimates of saturated areas or chemical solutecompositions of water along specific flow paths),runoff mechanisms can sometimes be inferred.
Hydrograph separations are typically per-formed with only one isotope, both to save onthe cost of analyses and because of the highcorrelation coefficient between d18O and d2H(r2 . 0:95; Gat, 1980). However, analysis ofboth isotopes will often prove very beneficial,and is highly recommended.
Two-component mixing models. Isotopehydrograph separation normally involves atwo-component mixing model for the stream.The model assumes that water in the stream at anytime during storm or snowmelt runoff is a mixtureof two components: new water and old water.
During base-flow conditions (the low-flowconditions that occur between periods of stormand snowmelt runoff ), the water in a stream isdominated by old water. The chemical andisotopic character of stream water at a givenlocation during base flow represents an integrationof the old-water discharged from upstream. Duringstorm and snowmelt runoff events, however, newwater is added to the stream. If the old and newwater components are chemically or isotopicallydifferent, the stream water becomes changedby the addition of the new water. The extent ofthis change is a function of the relative contri-butions by the old and new water components.
The contributions of old and new water in thestream at any time can be calculated by solving themass-balance equations for the water and tracerfluxes in the stream, provided that the stream, oldwater, and new water tracer concentrations areknown:
Qs ¼ Qo þ Qn ð10Þ
CsQs ¼ CoQo þ CnQn ð11Þ
where Q is discharge, C refers to tracer concen-tration, and the subscripts “s,” “o,” and “n”indicate the stream, the old water components,and the new water components, respectively. Ifstream samples are taken at a stream gaugingstation, the actual volumetric contributions of oldand new water can be determined. If no dischargemeasurements are available, old and new watercontributions can be expressed as percentages oftotal discharge.
Although the simple two-component mixingmodel approach to stream hydrograph separationdoes not directly identify the actual runoff
Stable Isotope Applications in Hydrologic Studies332
generation mechanisms, the model can sometimesallow the hydrologist to evaluate the importanceof a given conversion process in a catchment.For example, if a rapid conversion mechanism(partial-area overland flow, saturation overlandflow, or perhaps subsurface flow through macro-pores) is the dominant conversion process con-tributing to a storm runoff hydrograph, the isotopiccontent of the stream will generally reflect mostlynew water in the stream. Conversely, if a slowconversion mechanism (Darcian subsurface flow)is dominant in producing the storm runoff,the isotopic content of the stream should indicatemostly old water in the stream. Evaluation of theflow processes can be enhanced by applying themixing model to water collected from subsurfacerunoff collection pits, overland flow, andmacropores.
Sklash and Farvolden (1982) listed five assump-tions that must hold for reliable hydrographseparations using environmental isotopes:
(i) the old water component for an event can becharacterized by a single isotopic value orvariations in its isotopic content can bedocumented;
(ii) the new water component can be charac-terized by a single isotopic value or variations inits isotopic content can be documented;
(iii) the isotopic content of the old watercomponent is significantly different from that ofthe new water component;
(iv) vadose water contributions to the streamare negligible during the event or they must beaccounted for (use an additional tracer if iso-topically different from groundwater); and
(v) surface water storage (channel storage,ponds, swamps, etc.) contributions to the streamare negligible during the runoff event.
The utility of the mixing equations for a givenhigh runoff period is a function mainly of themagnitude of ðdo 2 dnÞ relative to the analyticalerror of the isotopic measurements, and theextent to which the aforementioned assumptionsare indeed valid (Pearce et al., 1986; Genereux,1998). Clearly the relative amounts of new versusold water are affected by many environmentalparameters such as: size of the catchment, soilthickness, ratio of rainfall rate to infiltration rate,steepness of the watershed slopes, vegetation,antecedent moisture conditions, permeability of
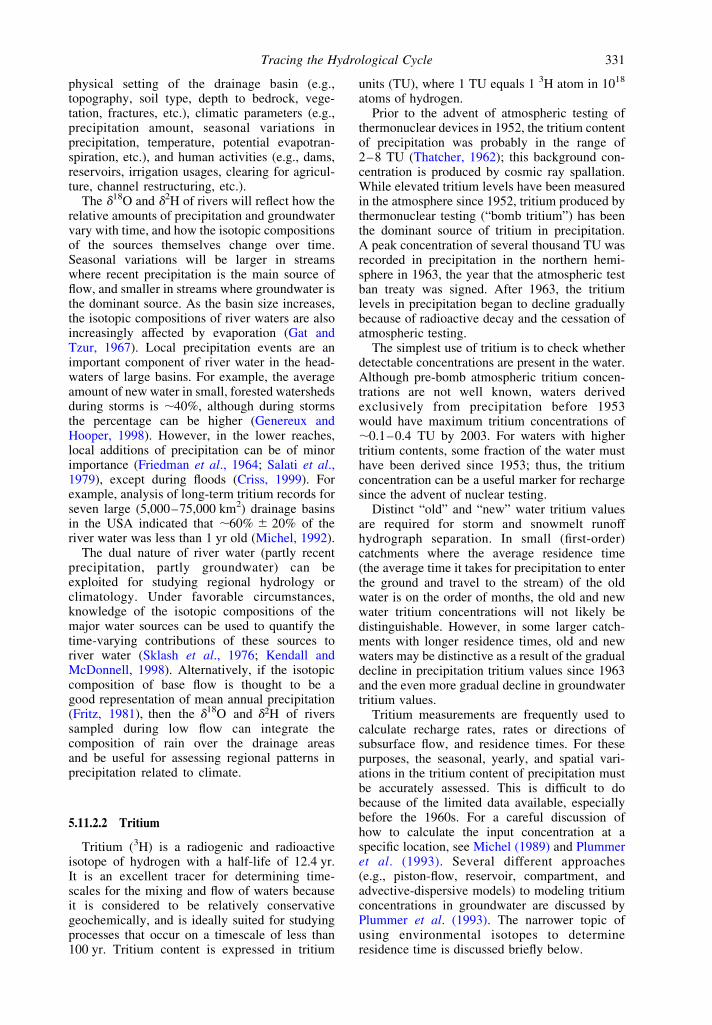
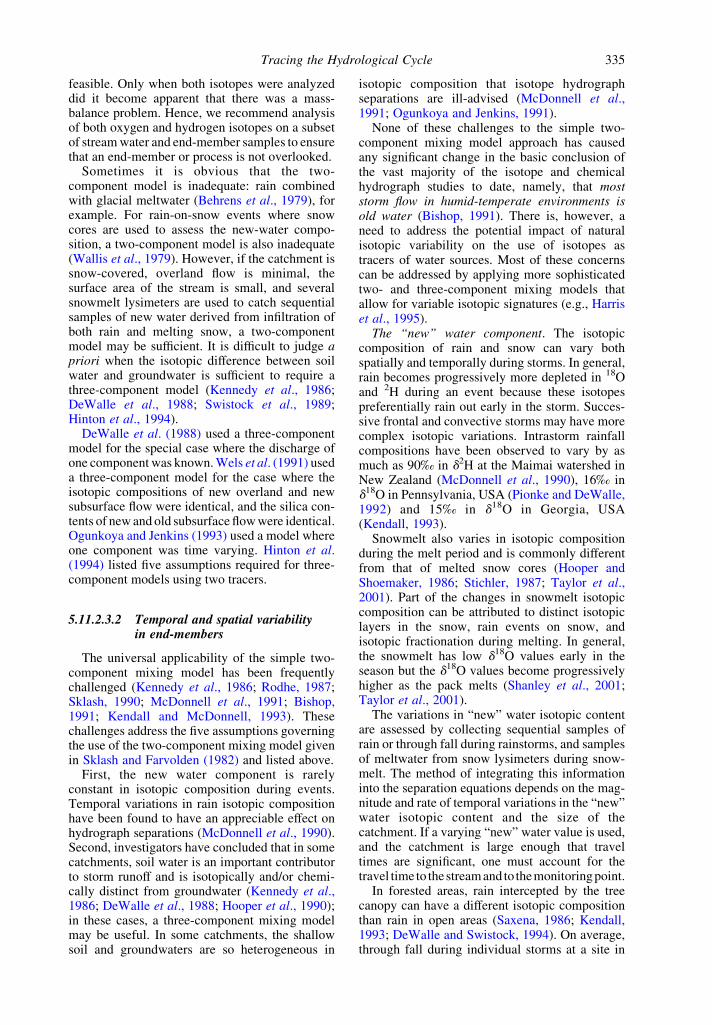
Figure 8 Early spring samples from four streams at Sleepers River Watershed, Vermont, have d18O valuesintermediate between the compositions of snowmelt collected in pan lysimeters and groundwater. Diurnalfluctuations in discharge correlate with diurnal changes in d18O, especially at W-2. W-2, a 59 ha agricultural basin,shows much greater contributions from snowmelt than the other three catchments. The three mixedagricultural/forested nested catchments—W-9 (47-ha), W-3 (837-ha), and W-5 (11,125)—show increasing
contributions from new snowmelt as scale increases (after Shanley et al., 2001).
Tracing the Hydrological Cycle 333
the soil, amount of macropores, and storagecapacity of the catchment.
Figure 8 shows an example of a two-componenthydrograph separation for four catchmentsat Sleepers River Watershed, Vermont USA(Shanley et al., 2001). During the snowmeltperiod, groundwater appeared to have an approxi-mately constant d18O value of –11.7 ^ 0.3‰,whereas snowmelt collected in snow lysimetersranged from 220‰ to 214‰. The streamsamples had d18O values intermediate betweenthe snowmelt and groundwater. Two-componentisotope separations showed that the meltwaterinputs to the stream ranged from 41% to 74%, andgenerally increased with catchment size (41–11,125 ha). Another multicatchment isotopehydrograph study showed no correlation of basinsize and the percent contribution of subsurfaceflow to stream flow (Sueker et al., 2000). This studyfound that subsurface flow positively correlatedwith the amount of surficial material in the basinand negatively correlated with basin slope.
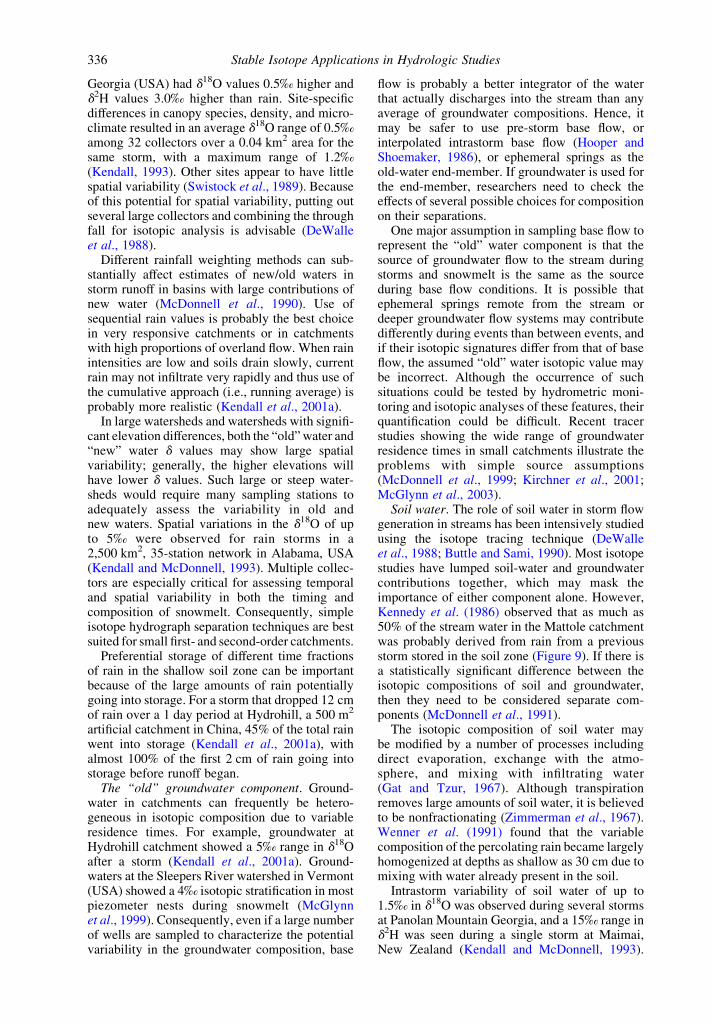
Three-component mixing models. Some isotopehydrograph separation studies have shown thatthe stream d18O values fall outside of the mixingline defined by the two “end-members” (DeWalleet al., 1988). Other studies have shown thatstream d values fall off the mixing line when bothd18O and d2H are used for fingerprinting(Kennedy et al., 1986). If the stream water isnot collinear with the two suspected end-members, either the end-members are inaccurateor there must be another component (probablysoil water) that plots above or below the mixingline for the other components (Kennedy et al.,1986). In this case, three-component models using
silica or some other chemical tracer can be usedto estimate the relative contributions of thesources to stream water (DeWalle et al., 1988;Wels et al., 1991; Hinton et al., 1994; Genereuxand Hooper, 1998).
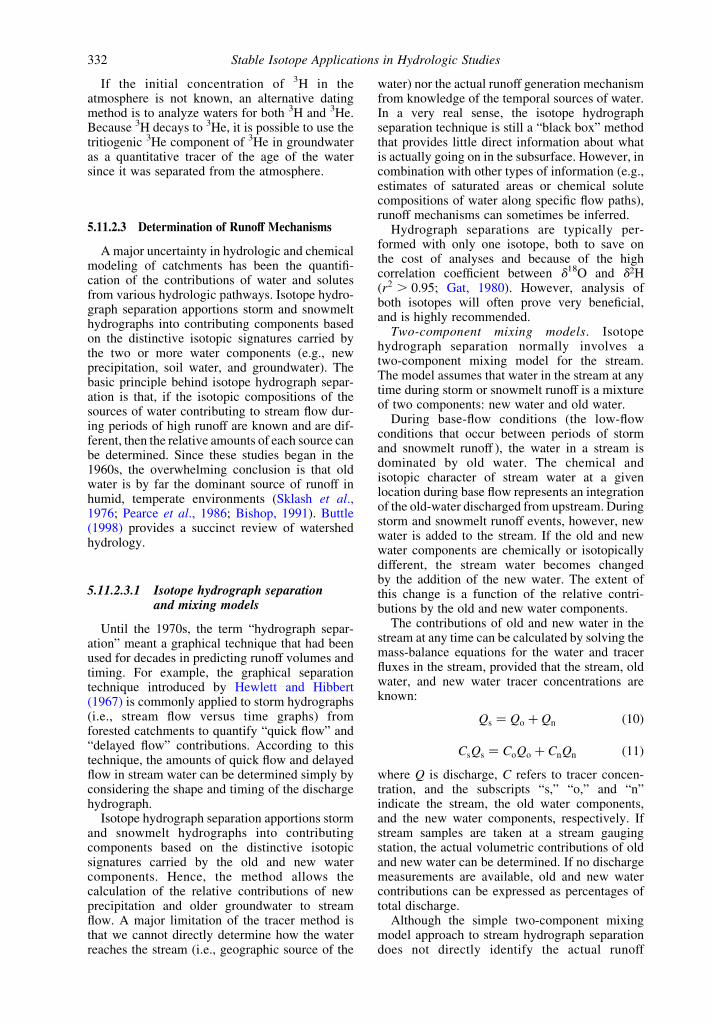
Figure 9 shows that stream water samples at theMattole River in California plot above the mixingline defined by the two supposed sources of thestream water, namely, pre-storm base flow andnew rain (Kennedy et al., 1986). As often is thecase, the mixing line is collinear with the LMWL.Thus, no mixture of waters from these two sourcesof water can produce the stream water. This meansthat either (i) there is an additional source of water(above the line) which contributes significantly tostream flow or (ii) some process in the catchmenthas caused waters to shift in isotopic composition.This third source of water is often soil water.Although no soil-water samples were collectedduring the January 1972 storm at the Mattole River,the composition of the last big storm to hit the area(which presumably was a major source of rechargeto the soil zone) was analyzed for d18O andd2H. The stream samples plot along a mixing lineconnecting the average composition of the earlierstorm and the average composition of January rain.Hence, the stream samples on Figure 9 wereprobably mainly a mixture of soil water rechargedduring the previous storm and new rainwater, withsmaller contributions from base flow.
If only d18O or d2H had been analyzed, thestream water would have plotted intermediatebetween the two end-members (consider the pro-jections of these water compositions onto thed18O and d2H scales) and a two-component iso-tope hydrograph separation would have seemed
Figure 9 Storm flow samples from the Mattole River, California, have d18O and dD values that do not plot along themixing line (solid line) between the two supposed sources: new rain and pre-storm base flow. Therefore, there must beanother source of water, possibly soil water derived from a previous storm, contributing significant amounts of waterto storm flow. The stream samples plot along a mixing line (dashed line) between the composition of average new rain
and the composition of previous rain (after Kennedy et al., 1986).
Stable Isotope Applications in Hydrologic Studies334
feasible. Only when both isotopes were analyzeddid it become apparent that there was a mass-balance problem. Hence, we recommend analysisof both oxygen and hydrogen isotopes on a subsetof stream water and end-member samples to ensurethat an end-member or process is not overlooked.
Sometimes it is obvious that the two-component model is inadequate: rain combinedwith glacial meltwater (Behrens et al., 1979), forexample. For rain-on-snow events where snowcores are used to assess the new-water compo-sition, a two-component model is also inadequate(Wallis et al., 1979). However, if the catchment issnow-covered, overland flow is minimal, thesurface area of the stream is small, and severalsnowmelt lysimeters are used to catch sequentialsamples of new water derived from infiltration ofboth rain and melting snow, a two-componentmodel may be sufficient. It is difficult to judge apriori when the isotopic difference between soilwater and groundwater is sufficient to require athree-component model (Kennedy et al., 1986;DeWalle et al., 1988; Swistock et al., 1989;Hinton et al., 1994).
DeWalle et al. (1988) used a three-componentmodel for the special case where the discharge ofone component was known. Wels et al. (1991) useda three-component model for the case where theisotopic compositions of new overland and newsubsurface flow were identical, and the silica con-tents of new and old subsurface flow were identical.Ogunkoya and Jenkins (1993) used a model whereone component was time varying. Hinton et al.(1994) listed five assumptions required for three-component models using two tracers.
5.11.2.3.2 Temporal and spatial variabilityin end-members
The universal applicability of the simple two-component mixing model has been frequentlychallenged (Kennedy et al., 1986; Rodhe, 1987;Sklash, 1990; McDonnell et al., 1991; Bishop,1991; Kendall and McDonnell, 1993). Thesechallenges address the five assumptions governingthe use of the two-component mixing model givenin Sklash and Farvolden (1982) and listed above.
First, the new water component is rarelyconstant in isotopic composition during events.Temporal variations in rain isotopic compositionhave been found to have an appreciable effect onhydrograph separations (McDonnell et al., 1990).Second, investigators have concluded that in somecatchments, soil water is an important contributorto storm runoff and is isotopically and/or chemi-cally distinct from groundwater (Kennedy et al.,1986; DeWalle et al., 1988; Hooper et al., 1990);in these cases, a three-component mixing modelmay be useful. In some catchments, the shallowsoil and groundwaters are so heterogeneous in
isotopic composition that isotope hydrographseparations are ill-advised (McDonnell et al.,1991; Ogunkoya and Jenkins, 1991).
None of these challenges to the simple two-component mixing model approach has causedany significant change in the basic conclusion ofthe vast majority of the isotope and chemicalhydrograph studies to date, namely, that moststorm flow in humid-temperate environments isold water (Bishop, 1991). There is, however, aneed to address the potential impact of naturalisotopic variability on the use of isotopes astracers of water sources. Most of these concernscan be addressed by applying more sophisticatedtwo- and three-component mixing models thatallow for variable isotopic signatures (e.g., Harriset al., 1995).
The “new” water component. The isotopiccomposition of rain and snow can vary bothspatially and temporally during storms. In general,rain becomes progressively more depleted in 18Oand 2H during an event because these isotopespreferentially rain out early in the storm. Succes-sive frontal and convective storms may have morecomplex isotopic variations. Intrastorm rainfallcompositions have been observed to vary by asmuch as 90‰ in d2H at the Maimai watershed inNew Zealand (McDonnell et al., 1990), 16‰ ind18O in Pennsylvania, USA (Pionke and DeWalle,1992) and 15‰ in d18O in Georgia, USA(Kendall, 1993).
Snowmelt also varies in isotopic compositionduring the melt period and is commonly differentfrom that of melted snow cores (Hooper andShoemaker, 1986; Stichler, 1987; Taylor et al.,2001). Part of the changes in snowmelt isotopiccomposition can be attributed to distinct isotopiclayers in the snow, rain events on snow, andisotopic fractionation during melting. In general,the snowmelt has low d18O values early in theseason but the d18O values become progressivelyhigher as the pack melts (Shanley et al., 2001;Taylor et al., 2001).
The variations in “new” water isotopic contentare assessed by collecting sequential samples ofrain or through fall during rainstorms, and samplesof meltwater from snow lysimeters during snow-melt. The method of integrating this informationinto the separation equations depends on the mag-nitude and rate of temporal variations in the “new”water isotopic content and the size of thecatchment. If a varying “new” water value is used,and the catchment is large enough that traveltimes are significant, one must account for thetravel time to thestream and to themonitoringpoint.
In forested areas, rain intercepted by the treecanopy can have a different isotopic compositionthan rain in open areas (Saxena, 1986; Kendall,1993; DeWalle and Swistock, 1994). On average,through fall during individual storms at a site in
Tracing the Hydrological Cycle 335
Georgia (USA) had d18O values 0.5‰ higher andd2H values 3.0‰ higher than rain. Site-specificdifferences in canopy species, density, and micro-climate resulted in an average d18O range of 0.5‰among 32 collectors over a 0.04 km2 area for thesame storm, with a maximum range of 1.2‰(Kendall, 1993). Other sites appear to have littlespatial variability (Swistock et al., 1989). Becauseof this potential for spatial variability, putting outseveral large collectors and combining the throughfall for isotopic analysis is advisable (DeWalleet al., 1988).
Different rainfall weighting methods can sub-stantially affect estimates of new/old waters instorm runoff in basins with large contributions ofnew water (McDonnell et al., 1990). Use ofsequential rain values is probably the best choicein very responsive catchments or in catchmentswith high proportions of overland flow. When rainintensities are low and soils drain slowly, currentrain may not infiltrate very rapidly and thus use ofthe cumulative approach (i.e., running average) isprobably more realistic (Kendall et al., 2001a).
In large watersheds and watersheds with signifi-cant elevation differences, both the “old” water and“new” water d values may show large spatialvariability; generally, the higher elevations willhave lower d values. Such large or steep water-sheds would require many sampling stations toadequately assess the variability in old andnew waters. Spatial variations in the d18O of upto 5‰ were observed for rain storms in a2,500 km2, 35-station network in Alabama, USA(Kendall and McDonnell, 1993). Multiple collec-tors are especially critical for assessing temporaland spatial variability in both the timing andcomposition of snowmelt. Consequently, simpleisotope hydrograph separation techniques are bestsuited for small first- and second-order catchments.
Preferential storage of different time fractionsof rain in the shallow soil zone can be importantbecause of the large amounts of rain potentiallygoing into storage. For a storm that dropped 12 cmof rain over a 1 day period at Hydrohill, a 500 m2
artificial catchment in China, 45% of the total rainwent into storage (Kendall et al., 2001a), withalmost 100% of the first 2 cm of rain going intostorage before runoff began.
The “old” groundwater component. Ground-water in catchments can frequently be hetero-geneous in isotopic composition due to variableresidence times. For example, groundwater atHydrohill catchment showed a 5‰ range in d18Oafter a storm (Kendall et al., 2001a). Ground-waters at the Sleepers River watershed in Vermont(USA) showed a 4‰ isotopic stratification in mostpiezometer nests during snowmelt (McGlynnet al., 1999). Consequently, even if a large numberof wells are sampled to characterize the potentialvariability in the groundwater composition, base
flow is probably a better integrator of the waterthat actually discharges into the stream than anyaverage of groundwater compositions. Hence, itmay be safer to use pre-storm base flow, orinterpolated intrastorm base flow (Hooper andShoemaker, 1986), or ephemeral springs as theold-water end-member. If groundwater is used forthe end-member, researchers need to check theeffects of several possible choices for compositionon their separations.
One major assumption in sampling base flow torepresent the “old” water component is that thesource of groundwater flow to the stream duringstorms and snowmelt is the same as the sourceduring base flow conditions. It is possible thatephemeral springs remote from the stream ordeeper groundwater flow systems may contributedifferently during events than between events, andif their isotopic signatures differ from that of baseflow, the assumed “old” water isotopic value maybe incorrect. Although the occurrence of suchsituations could be tested by hydrometric moni-toring and isotopic analyses of these features, theirquantification could be difficult. Recent tracerstudies showing the wide range of groundwaterresidence times in small catchments illustrate theproblems with simple source assumptions(McDonnell et al., 1999; Kirchner et al., 2001;McGlynn et al., 2003).
Soil water. The role of soil water in storm flowgeneration in streams has been intensively studiedusing the isotope tracing technique (DeWalleet al., 1988; Buttle and Sami, 1990). Most isotopestudies have lumped soil-water and groundwatercontributions together, which may mask theimportance of either component alone. However,Kennedy et al. (1986) observed that as much as50% of the stream water in the Mattole catchmentwas probably derived from rain from a previousstorm stored in the soil zone (Figure 9). If there isa statistically significant difference between theisotopic compositions of soil and groundwater,then they need to be considered separate com-ponents (McDonnell et al., 1991).
The isotopic composition of soil water maybe modified by a number of processes includingdirect evaporation, exchange with the atmo-sphere, and mixing with infiltrating water(Gat and Tzur, 1967). Although transpirationremoves large amounts of soil water, it is believedto be nonfractionating (Zimmerman et al., 1967).Wenner et al. (1991) found that the variablecomposition of the percolating rain became largelyhomogenized at depths as shallow as 30 cm due tomixing with water already present in the soil.
Intrastorm variability of soil water of up to1.5‰ in d18O was observed during several stormsat Panolan Mountain Georgia, and a 15‰ range ind2H was seen during a single storm at Maimai,New Zealand (Kendall and McDonnell, 1993).
Stable Isotope Applications in Hydrologic Studies336
Analysis of over 1,000 water samples at Maimai(McDonnell et al., 1991) showed a systematictrend in soil-water composition in both downslopeand downprofile directions. Multivariate clusteranalysis also revealed three distinct soil watergroupings with respect to soil depth and catchmentposition, indicating that the soil water reservoir ispoorly mixed on the timescale of storms.
If the isotopic variability of rain, through fall,meltwater, soil water, and groundwater is signifi-cant at the catchment scale (i.e., if hill-slopewaters that are variable in composition actuallyreach the stream during the storm event) or iftransit times are long and/or variable, then simpletwo- and three-component, constant composition,mixing models may not provide realistic interpre-tations of the system hydrology. One approach isto develop models with variable end-members(Harris et al., 1995). Another possible solution isto include alternative, independent, chemical orisotopic methods for determining the relativeamounts of water flowing along different subsur-face flow paths. Recent comparisons of isotopicand chemical approaches include Rice andHornberger (1998) and Kendall et al. (2001a).
Additional isotopic tracers include radon-222(Genereux and Hemond, 1990; Genereux et al.,1993); beryllium-7 and sulfur-35 (Cooperet al., 1991); carbon-13 (Kendall et al., 1992);strontium-87 (Bullen and Kendall, 1998); andnitrogen-15 (Burns and Kendall, 2002). In par-ticular, carbon isotopes, possibly combined withstrontium isotopes, appear to be useful fordistinguishing between deep and shallow flowpaths and, combined with oxygen isotopes, fordistinguishing among water sources. Finally, anumber of mathematical models can be employedthat incorporate the variability of input tracerconcentrations, and which attempt to reproduceobserved output concentrations (Kirchner et al.,2001; McGlynn et al., 2003). Some of these tech-niques will be discussed in the following section.
5.11.2.4 Estimation of Mean Residence Time
Arguably the most important quantity that canbe estimated in hydrologic studies is the age of thewater that has been sampled. Water age has utilityfor determining hydrological processes in catch-ments (as discussed previously), as well as directimplications for management of larger ground-water resources via determination of aquifersustainability and migration rates of contaminants.Thus, the estimation of mean residence time(MRT) of groundwater in a catchment or in anaquifer is an important goal. The discussionabove demonstrated that the stable isotopes ofthe water molecule can be used to determine—qualitatively—the relative ages of water massesmoving through a watershed using the mean input
concentration of the tracer (i.e., mean isotopiccomposition of precipitation). While this methodis imperfect, the signals observed in isotope datacollected in time series are clear and informative.These signals can be used in a more quantitativemanner to calibrate flow and transport models.While it is beyond the scope of this chapter tothoroughly review modeling techniques in hydro-logy, it is worth noting some of the recentadvances in the combined use of geochemicaldata and hydrometric data for improving andcalibrating predictive models. The topic ofgroundwater residence time is discussed in detailin Chapter 5.15.
One approach taken to model flow in catch-ments by using isotopic tracers is the lumped-parameter modeling approach. The approach isbased upon the use of a mathematical convolutionintegral for the prediction of tracer output atsampling points that are assumed to integrate flowprocesses occurring over some (undefined) spatialand (defined) temporal scale. The convolution isperformed between a defined tracer input functionobserved or estimated from tracer data in timeseries (such as the isotopic composition ofprecipitation) and a chosen model functionrepresentative of the manner in which transittimes are distributed in the system according to asteady-state equation of the general form
CoðtÞ ¼ð1
0Ciðt 2 tÞgðtÞdt ð12Þ
where CoðtÞ and CiðtÞ are output and input tracerconcentrations, t is the residence time, and gðtÞ isthe system response or weighting function for thetracer (Unnikrishna et al., 1995; Maloszewski andZuber, 1996). Commonly used forms of theweighting function ðgðtÞÞ include the piston flowmodel (PFM), the exponential model (EM), thedispersion model (DM), and the combinedexponential-piston flow model (EPM). Details ofthese weighting function models are provided inMaloszewski and Zuber (1996).
In the lumped-parameter approach, there is nonotion a priori about the geometry of the flowpaths in the system. This contrasts with thedeterministic or distributed modeling approach,which strives to apply governing equations of flowto an estimated geometric flow field. In the latterapproach, it is assumed that the propertiescontrolling flow (such as hydraulic conductivity,transmissivity, porosity, etc.) can be adequatelyestimated at all points in the catchment model,regardless of scale or depth. In addition, determi-nistic models are founded in Darcian flow, whichin fact may contribute in small degree to measuredtracer responses in surface water and shallowgroundwater systems. The lumped-parameterapproach, however, makes no assumption aboutthe geometry of the system. Instead, the factors
Tracing the Hydrological Cycle 337
that give rise to observed (measured) tracer outputresponses to observed (measured) tracer inputs arelumped together within a small number of modelparameters.
These model parameters may or may not haveany direct physical meaning, depending largelyupon individual interpretation. The parameters do,however, represent a real means by which tocharacterize responses, predict flows, and facilitatecomparisons among systems. These models aresometimes called “black box” models, reflectingthe fact that nothing is assumed known about theflow system, and the entire system is treated asbeing homogeneous with respect to the distributionof flow lines. Some who espouse their use havesoftened the moniker to “gray-box” models, inorder to reflect the notion that significant knowl-edge about the system being studied is required inorder to (i) choose an appropriate model formu-lation, (ii) make meaningful interpretations ofmodel output, and (iii) to apply the models wisely.In any case, it is clear that, where tracer inputs andoutputs from a hydrologic system are measurableon the timescale of their major variability, lumped-parameter modeling has been the most widelyapplied approach. Recent reviews and applicationsof lumped-parameter modeling for MRT esti-mation in catchments have been conducted byMaloszewski and Zuber (1996), Unnikrishna et al.(1995), McGuire et al. (2002), and McGlynn et al.(2003).
Using the lumped-parameter modelingapproach with d18O data, McGuire et al. (2002)calculated MRTs of 9.5 and 4.8 months for twowatersheds in the central Appalachian Mountainsof Pennsylvania (USA). Soil-water residence timeat a depth of 100 cm was estimated to be ,2months, indicating that the shallow groundwaterwas rapidly mobilized in response to precipitationevents. In the steeper Maimai catchment of NewZealand, Stewart and McDonnell (1991) reportedMRTs calculated using d2H data ranging from12 d to greater than 100 d. Shallow suctionlysimeters showed the most rapid responses(12–15 d). MRTs increased with increasing soildepth, such that lysimeters at 40 cm depth showedMRTs of 50–70 d, and lysimeters at 800 cm depthshowed residence times of ,100 d or more.
5.11.3 CARBON, NITROGEN, AND SULFURSOLUTE ISOTOPES
This section presents a discussion of thefundamentals of three major solute isotopesystems: carbon, nitrogen, and sulfur. Recentcomprehensive reviews of the geochemistryof several other solute isotope tracers in hydro-logic systems include those by Faure (1986),
Kendall and McDonnell (1998), and Cook andHerczeg (2000). As discussed above, waterisotopes often provide useful information aboutresidence times and relative contributions fromdifferent water sources; these data can then beused to make hypotheses about water flow paths.Solute isotopes can provide an alternative, inde-pendent isotopic method for determining therelative amounts of water flowing along varioussubsurface flow paths. However, the least ambig-uous use of solute isotopes is for tracing therelative contributions of potential solute sources togroundwater and surface water.
5.11.3.1 Carbon
Over the last several decades, the decline inalkalinity in many streams in Europe and innortheastern USA as a result of acid depositionhas been a subject of much concern (Likens et al.,1979). The concentration of bicarbonate, themajor anion buffering the water chemistry ofsurface waters and the main component ofdissolved inorganic carbon (DIC) in most streamwaters, is a measure of the “reactivity” of thewatersheds and reflects the neutralization ofcarbonic and other acids by reactions with silicateand carbonate minerals encountered by the acidicwaters during their residence in watersheds(Garrels and Mackenzie, 1971). Under favorableconditions, carbon isotopes of DIC can bevaluable tools by which to understand thebiogeochemical reactions controlling carbonatealkalinity in groundwater and watersheds (Mills,1988; Kendall et al., 1992; see Chapter 5.14).
The d13C of DIC can also be a useful tracer ofthe seasonal and discharge-related contributionsof different hydrologic flow paths to surfacestream flow (Kendall et al., 1992) and to shallowgroundwater discharge from springs in carbonateand fractured rock terrains (Deines et al., 1974;Staniaszek and Halas, 1986; Doctor, 2002). Inmany carbonate-poor catchments, waters alongshallow flow paths in the soil zone havecharacteristically low d13CDIC values reflectingthe dominance of soil CO2 contributions of DIC;waters along deeper flow paths within lessweathered materials have intermediate d13CDIC
values characteristic of carbonic-acid weatheringof carbonates (Bullen and Kendall, 1998). Incarbonate terrains, the extent of chemical evolu-tion of the d13C of carbon species in groundwatercan be used to distinguish between ground-waters traveling along different flow paths(Deines et al., 1974).
The carbon isotopic composition of dissolvedorganic carbon (DOC) has also been successfullyapplied to studies of hydrologic and biogeochem-ical processes in watersheds. Humic and fulvicacids are the primary components of DOC in
Stable Isotope Applications in Hydrologic Studies338
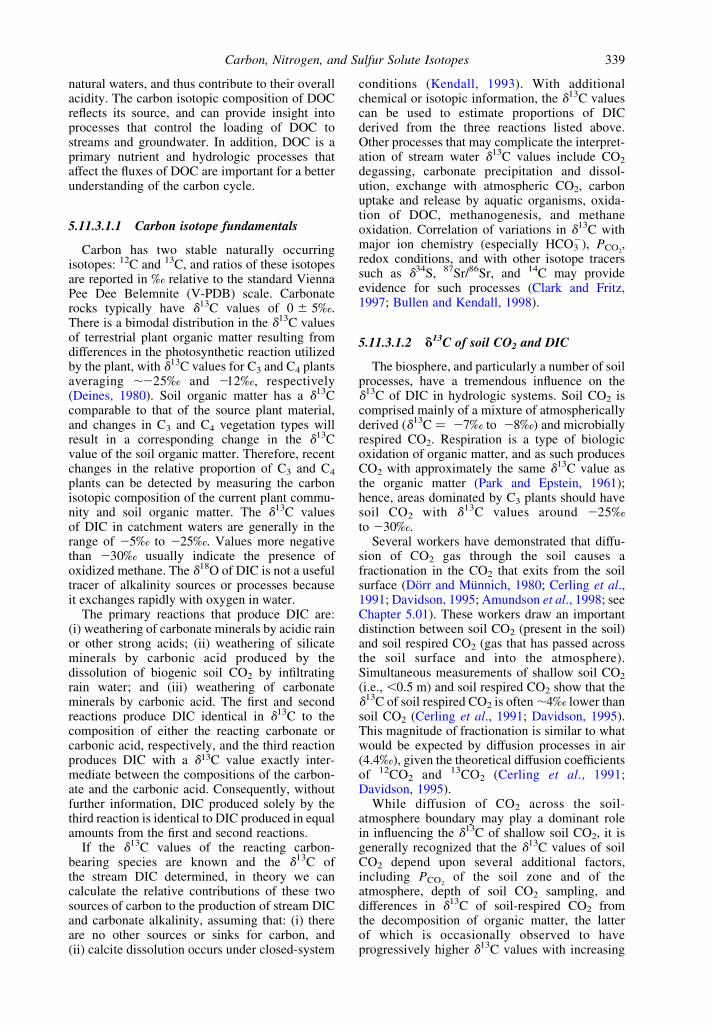
natural waters, and thus contribute to their overallacidity. The carbon isotopic composition of DOCreflects its source, and can provide insight intoprocesses that control the loading of DOC tostreams and groundwater. In addition, DOC is aprimary nutrient and hydrologic processes thataffect the fluxes of DOC are important for a betterunderstanding of the carbon cycle.
5.11.3.1.1 Carbon isotope fundamentals
Carbon has two stable naturally occurringisotopes: 12C and 13C, and ratios of these isotopesare reported in ‰ relative to the standard ViennaPee Dee Belemnite (V-PDB) scale. Carbonaterocks typically have d13C values of 0 ^ 5‰.There is a bimodal distribution in the d13C valuesof terrestrial plant organic matter resulting fromdifferences in the photosynthetic reaction utilizedby the plant, with d13C values for C3 and C4 plantsaveraging ,225‰ and 212‰, respectively(Deines, 1980). Soil organic matter has a d13Ccomparable to that of the source plant material,and changes in C3 and C4 vegetation types willresult in a corresponding change in the d13Cvalue of the soil organic matter. Therefore, recentchanges in the relative proportion of C3 and C4
plants can be detected by measuring the carbonisotopic composition of the current plant commu-nity and soil organic matter. The d13C valuesof DIC in catchment waters are generally in therange of 25‰ to 225‰. Values more negativethan 230‰ usually indicate the presence ofoxidized methane. The d18O of DIC is not a usefultracer of alkalinity sources or processes becauseit exchanges rapidly with oxygen in water.
The primary reactions that produce DIC are:(i) weathering of carbonate minerals by acidic rainor other strong acids; (ii) weathering of silicateminerals by carbonic acid produced by thedissolution of biogenic soil CO2 by infiltratingrain water; and (iii) weathering of carbonateminerals by carbonic acid. The first and secondreactions produce DIC identical in d13C to thecomposition of either the reacting carbonate orcarbonic acid, respectively, and the third reactionproduces DIC with a d13C value exactly inter-mediate between the compositions of the carbon-ate and the carbonic acid. Consequently, withoutfurther information, DIC produced solely by thethird reaction is identical to DIC produced in equalamounts from the first and second reactions.
If the d13C values of the reacting carbon-bearing species are known and the d13C ofthe stream DIC determined, in theory we cancalculate the relative contributions of these twosources of carbon to the production of stream DICand carbonate alkalinity, assuming that: (i) thereare no other sources or sinks for carbon, and(ii) calcite dissolution occurs under closed-system
conditions (Kendall, 1993). With additionalchemical or isotopic information, the d13C valuescan be used to estimate proportions of DICderived from the three reactions listed above.Other processes that may complicate the interpret-ation of stream water d13C values include CO2
degassing, carbonate precipitation and dissol-ution, exchange with atmospheric CO2, carbonuptake and release by aquatic organisms, oxida-tion of DOC, methanogenesis, and methaneoxidation. Correlation of variations in d13C withmajor ion chemistry (especially HCO3
2), PCO2,
redox conditions, and with other isotope tracerssuch as d34S, 87Sr/86Sr, and 14C may provideevidence for such processes (Clark and Fritz,1997; Bullen and Kendall, 1998).
5.11.3.1.2 d13C of soil CO2 and DIC
The biosphere, and particularly a number of soilprocesses, have a tremendous influence on thed13C of DIC in hydrologic systems. Soil CO2 iscomprised mainly of a mixture of atmosphericallyderived (d13C ¼ 27‰ to 28‰) and microbiallyrespired CO2. Respiration is a type of biologicoxidation of organic matter, and as such producesCO2 with approximately the same d13C value asthe organic matter (Park and Epstein, 1961);hence, areas dominated by C3 plants should havesoil CO2 with d13C values around 225‰to 230‰.
Several workers have demonstrated that diffu-sion of CO2 gas through the soil causes afractionation in the CO2 that exits from the soilsurface (Dorr and Munnich, 1980; Cerling et al.,1991; Davidson, 1995; Amundson et al., 1998; seeChapter 5.01). These workers draw an importantdistinction between soil CO2 (present in the soil)and soil respired CO2 (gas that has passed acrossthe soil surface and into the atmosphere).Simultaneous measurements of shallow soil CO2
(i.e., ,0.5 m) and soil respired CO2 show that thed13C of soil respired CO2 is often ,4‰ lower thansoil CO2 (Cerling et al., 1991; Davidson, 1995).This magnitude of fractionation is similar to whatwould be expected by diffusion processes in air(4.4‰), given the theoretical diffusion coefficientsof 12CO2 and 13CO2 (Cerling et al., 1991;Davidson, 1995).
While diffusion of CO2 across the soil-atmosphere boundary may play a dominant rolein influencing the d13C of shallow soil CO2, it isgenerally recognized that the d13C values of soilCO2 depend upon several additional factors,including PCO2
of the soil zone and of theatmosphere, depth of soil CO2 sampling, anddifferences in d13C of soil-respired CO2 fromthe decomposition of organic matter, the latterof which is occasionally observed to haveprogressively higher d13C values with increasing
Carbon, Nitrogen, and Sulfur Solute Isotopes 339
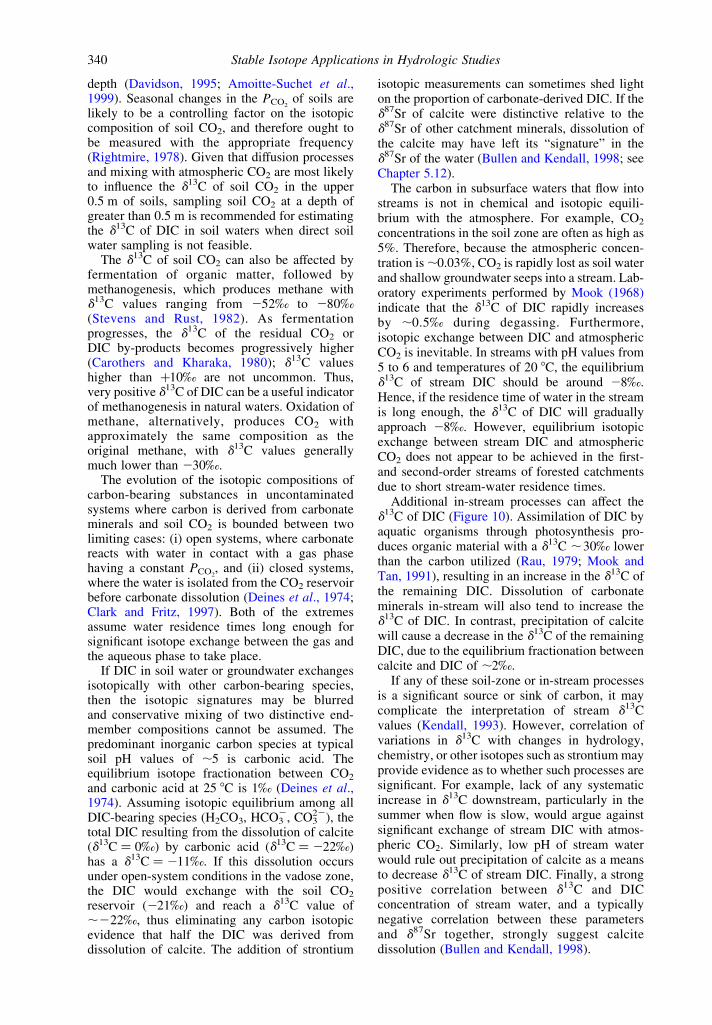
depth (Davidson, 1995; Amoitte-Suchet et al.,1999). Seasonal changes in the PCO2
of soils arelikely to be a controlling factor on the isotopiccomposition of soil CO2, and therefore ought tobe measured with the appropriate frequency(Rightmire, 1978). Given that diffusion processesand mixing with atmospheric CO2 are most likelyto influence the d13C of soil CO2 in the upper0.5 m of soils, sampling soil CO2 at a depth ofgreater than 0.5 m is recommended for estimatingthe d13C of DIC in soil waters when direct soilwater sampling is not feasible.
The d13C of soil CO2 can also be affected byfermentation of organic matter, followed bymethanogenesis, which produces methane withd13C values ranging from 252‰ to 280‰(Stevens and Rust, 1982). As fermentationprogresses, the d13C of the residual CO2 orDIC by-products becomes progressively higher(Carothers and Kharaka, 1980); d13C valueshigher than þ10‰ are not uncommon. Thus,very positive d13C of DIC can be a useful indicatorof methanogenesis in natural waters. Oxidation ofmethane, alternatively, produces CO2 withapproximately the same composition as theoriginal methane, with d13C values generallymuch lower than 230‰.
The evolution of the isotopic compositions ofcarbon-bearing substances in uncontaminatedsystems where carbon is derived from carbonateminerals and soil CO2 is bounded between twolimiting cases: (i) open systems, where carbonatereacts with water in contact with a gas phasehaving a constant PCO2
, and (ii) closed systems,where the water is isolated from the CO2 reservoirbefore carbonate dissolution (Deines et al., 1974;Clark and Fritz, 1997). Both of the extremesassume water residence times long enough forsignificant isotope exchange between the gas andthe aqueous phase to take place.
If DIC in soil water or groundwater exchangesisotopically with other carbon-bearing species,then the isotopic signatures may be blurredand conservative mixing of two distinctive end-member compositions cannot be assumed. Thepredominant inorganic carbon species at typicalsoil pH values of ,5 is carbonic acid. Theequilibrium isotope fractionation between CO2
and carbonic acid at 25 8C is 1‰ (Deines et al.,1974). Assuming isotopic equilibrium among allDIC-bearing species (H2CO3, HCO3
2, CO322), the
total DIC resulting from the dissolution of calcite(d13C ¼ 0‰) by carbonic acid (d13C ¼ 222‰)has a d13C ¼ 211‰. If this dissolution occursunder open-system conditions in the vadose zone,the DIC would exchange with the soil CO2
reservoir (221‰) and reach a d13C value of,222‰, thus eliminating any carbon isotopicevidence that half the DIC was derived fromdissolution of calcite. The addition of strontium
isotopic measurements can sometimes shed lighton the proportion of carbonate-derived DIC. If thed87Sr of calcite were distinctive relative to thed87Sr of other catchment minerals, dissolution ofthe calcite may have left its “signature” in thed87Sr of the water (Bullen and Kendall, 1998; seeChapter 5.12).
The carbon in subsurface waters that flow intostreams is not in chemical and isotopic equili-brium with the atmosphere. For example, CO2
concentrations in the soil zone are often as high as5%. Therefore, because the atmospheric concen-tration is ,0.03%, CO2 is rapidly lost as soil waterand shallow groundwater seeps into a stream. Lab-oratory experiments performed by Mook (1968)indicate that the d13C of DIC rapidly increasesby ,0.5‰ during degassing. Furthermore,isotopic exchange between DIC and atmosphericCO2 is inevitable. In streams with pH values from5 to 6 and temperatures of 20 8C, the equilibriumd13C of stream DIC should be around 28‰.Hence, if the residence time of water in the streamis long enough, the d13C of DIC will graduallyapproach 28‰. However, equilibrium isotopicexchange between stream DIC and atmosphericCO2 does not appear to be achieved in the first-and second-order streams of forested catchmentsdue to short stream-water residence times.
Additional in-stream processes can affect thed13C of DIC (Figure 10). Assimilation of DIC byaquatic organisms through photosynthesis pro-duces organic material with a d13C ,30‰ lowerthan the carbon utilized (Rau, 1979; Mook andTan, 1991), resulting in an increase in the d13C ofthe remaining DIC. Dissolution of carbonateminerals in-stream will also tend to increase thed13C of DIC. In contrast, precipitation of calcitewill cause a decrease in the d13C of the remainingDIC, due to the equilibrium fractionation betweencalcite and DIC of ,2‰.
If any of these soil-zone or in-stream processesis a significant source or sink of carbon, it maycomplicate the interpretation of stream d13Cvalues (Kendall, 1993). However, correlation ofvariations in d13C with changes in hydrology,chemistry, or other isotopes such as strontium mayprovide evidence as to whether such processes aresignificant. For example, lack of any systematicincrease in d13C downstream, particularly in thesummer when flow is slow, would argue againstsignificant exchange of stream DIC with atmos-pheric CO2. Similarly, low pH of stream waterwould rule out precipitation of calcite as a meansto decrease d13C of stream DIC. Finally, a strongpositive correlation between d13C and DICconcentration of stream water, and a typicallynegative correlation between these parametersand d87Sr together, strongly suggest calcitedissolution (Bullen and Kendall, 1998).
Stable Isotope Applications in Hydrologic Studies340
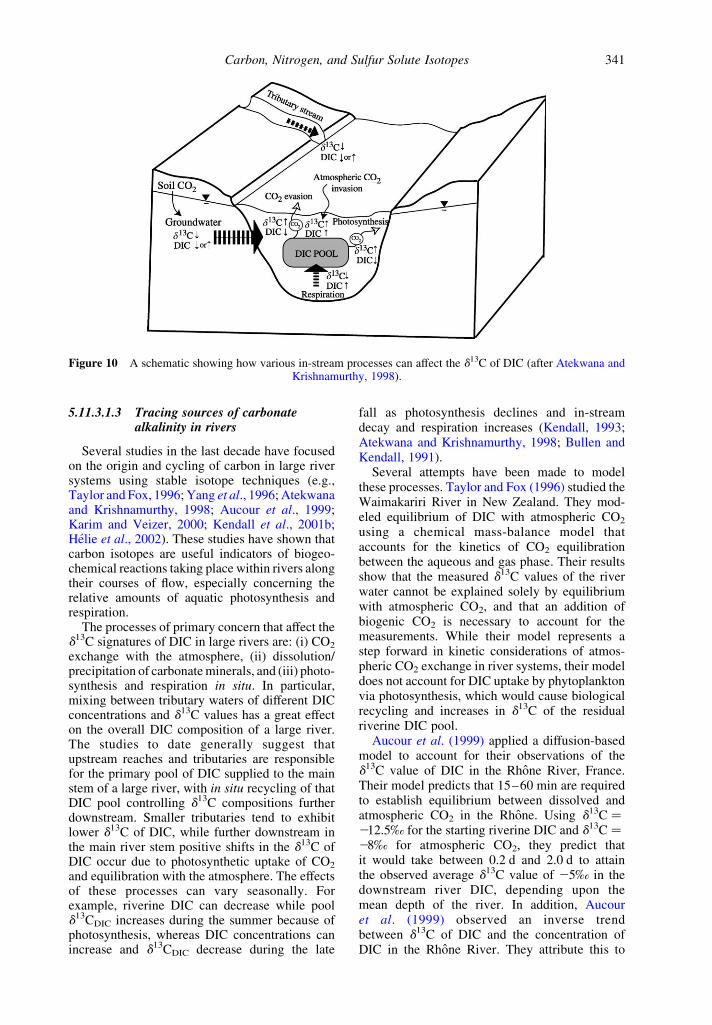
5.11.3.1.3 Tracing sources of carbonatealkalinity in rivers
Several studies in the last decade have focusedon the origin and cycling of carbon in large riversystems using stable isotope techniques (e.g.,Taylor and Fox, 1996; Yang et al., 1996; Atekwanaand Krishnamurthy, 1998; Aucour et al., 1999;Karim and Veizer, 2000; Kendall et al., 2001b;Helie et al., 2002). These studies have shown thatcarbon isotopes are useful indicators of biogeo-chemical reactions taking place within rivers alongtheir courses of flow, especially concerning therelative amounts of aquatic photosynthesis andrespiration.
The processes of primary concern that affect thed13C signatures of DIC in large rivers are: (i) CO2
exchange with the atmosphere, (ii) dissolution/precipitation of carbonate minerals, and (iii) photo-synthesis and respiration in situ. In particular,mixing between tributary waters of different DICconcentrations and d13C values has a great effecton the overall DIC composition of a large river.The studies to date generally suggest thatupstream reaches and tributaries are responsiblefor the primary pool of DIC supplied to the mainstem of a large river, with in situ recycling of thatDIC pool controlling d13C compositions furtherdownstream. Smaller tributaries tend to exhibitlower d13C of DIC, while further downstream inthe main river stem positive shifts in the d13C ofDIC occur due to photosynthetic uptake of CO2
and equilibration with the atmosphere. The effectsof these processes can vary seasonally. Forexample, riverine DIC can decrease while poold13CDIC increases during the summer because ofphotosynthesis, whereas DIC concentrations canincrease and d13CDIC decrease during the late
fall as photosynthesis declines and in-streamdecay and respiration increases (Kendall, 1993;Atekwana and Krishnamurthy, 1998; Bullen andKendall, 1991).
Several attempts have been made to modelthese processes. Taylor and Fox (1996) studied theWaimakariri River in New Zealand. They mod-eled equilibrium of DIC with atmospheric CO2
using a chemical mass-balance model thataccounts for the kinetics of CO2 equilibrationbetween the aqueous and gas phase. Their resultsshow that the measured d13C values of the riverwater cannot be explained solely by equilibriumwith atmospheric CO2, and that an addition ofbiogenic CO2 is necessary to account for themeasurements. While their model represents astep forward in kinetic considerations of atmos-pheric CO2 exchange in river systems, their modeldoes not account for DIC uptake by phytoplanktonvia photosynthesis, which would cause biologicalrecycling and increases in d13C of the residualriverine DIC pool.
Aucour et al. (1999) applied a diffusion-basedmodel to account for their observations of thed13C value of DIC in the Rhone River, France.Their model predicts that 15–60 min are requiredto establish equilibrium between dissolved andatmospheric CO2 in the Rhone. Using d13C ¼212.5‰ for the starting riverine DIC and d13C ¼28‰ for atmospheric CO2, they predict thatit would take between 0.2 d and 2.0 d to attainthe observed average d13C value of 25‰ in thedownstream river DIC, depending upon themean depth of the river. In addition, Aucouret al. (1999) observed an inverse trendbetween d13C of DIC and the concentration ofDIC in the Rhone River. They attribute this to
Figure 10 A schematic showing how various in-stream processes can affect the d13C of DIC (after Atekwana andKrishnamurthy, 1998).
Carbon, Nitrogen, and Sulfur Solute Isotopes 341
conservative mixing between the main stemRhone and its tributaries.
Weiler and Nriagu (1973), Yang et al. (1996),and Helie et al. (2002) studied the seasonalchanges in d13C values of the DIC in the St.Lawrence River system in eastern Canada. Theyfound that the Great Lakes, which are theupstream source of the St. Lawrence River, actas a strong biogeochemical buffer to the d13CDIC
value of the water in the river’s upstream reaches.However, the main stem river downstream showspronounced seasonal variability in the d13C ofDIC, with high d13C values near isotopic equili-brium with atmospheric CO2 in the summerduring low flow, and very low d13C values duringthe winter and spring high flow periods (Helieet al., 2002). Helie et al. (2002) report that thed13C of DIC in the Great Lakes outflow average20.5‰ to 21.0‰, whereas further downstreamtwo large tributaries have a strong influence on thed13C of DIC. These rivers—the Ottawa River andthe Mascouche River—exhibit much lower d13Cvalues than the main stem St. Lawrence, onaverage 28.8‰ and 212.1‰, respectively. Helieet al. (2002) conclude that during low water levelsin the summer, the Great Lakes provide nearly80% of the river flow, and the d13C of DIC reflectsthat of atmospheric equilibrium with water in theGreat Lakes. During higher flows in the otherseasons, the d13C of the downstream St. LawrenceRiver is derived from the influx of the tributaries,which provide a pool of DIC with low d13C to theriver. In addition, a striking increase in the PCO2
(in excess of atmospheric equilibrium) of the riverwater was observed during the winter months,indicating a greater proportion of groundwaterdischarge contribution to the river. In contrast,very low PCO2
values (near atmospheric equili-brium) were observed during the summer, whenphotosynthetic uptake of CO2 is at its peak.
5.11.3.1.4 Tracing sources of carbonatealkalinity in catchments
As discussed previously, the headwater tribu-taries of large river systems in temperate climateshave been shown to contain carbonate alkalinitythat has a lower d13C than in the main stem portionof the river downstream. The most likely expla-nation for this observation is that soil water and/orgroundwater with DIC with a low d13C derivedfrom terrestrial biogenic CO2 is being supplied tothe low-order streams. Mixing between tributariesand the main stem of large rivers plays a dominantrole in controlling the d13C value of DIC;biological recycling of carbon in-stream and, toa lesser extent, equilibration with atmosphericCO2 are also important.
Under favorable conditions, carbon isotopescan be used to understand the biogeochemical
reactions controlling alkalinity in watersheds(Mills, 1988; Kendall et al., 1992). Figure 11shows that Hunting Creek (in Maryland, USA)shows a strong seasonal change in alkalinity, withconcentrations greater than 600 meq L21 in thesummer and less than 400 meq L21 in the winter.The d13C values for weekly stream samples alsoshow strong seasonality, with lower values in thesummer (213‰) and higher values in the winter(25‰), inversely correlated with alkalinity.Carbonates found in fractures in the altered basaltbedrock have d13C values of ,25‰ and soil-derived CO2 is ,221‰. Therefore, the dominantreaction controlling stream DIC in the winterappears to be strong acid weathering of carbon-ates, whereas the dominant reaction in the summerappears to be carbonic acid weathering ofcarbonates (Kendall, 1993). Of course, with justd13C values the possibility that the summer d13Cvalues instead reflect approximately equal contri-butions of DIC produced by strong acid weath-ering of calcite (25‰) and carbonic acidweathering of silicates (221‰) cannot be ruledout. However, the presence of carbonate in thebedrock strongly influences weathering reactions,and the stream chemistry during the summersuggests that silicate weathering has only aminor effect.
Although variations in stream d18O duringstorm events can easily be interpreted in termsof relative contributions of “new” and “old”waters in the two catchments, the d18O data donot reveal how the water is delivered to the streamor how these flow paths change during the event.Because d13C of DIC has been shown to besensitive to differences in reactions occurringalong shallow versus deep flow paths (Kendallet al., 1992), samples were analyzed for both d13Cand d18O. During storm events, the d18O showssmall gradual changes in water sources inresponse to changes in rain intensity, in contrastto rapid oscillations in d13C. For example, duringa single three-day storm event in March 1987,d13C in both streams oscillated rapidly over a 3‰range, whereas d18O varied only gradually andless than 1‰ (Figure 12). The oscillations in d13Capparently reflect more complex changes in flowpaths, as well as mixing among waters derivedfrom various flow paths, than is apparent based ond18O alone (Kendall et al., 1992).
5.11.3.1.5 Carbon-14
The radioactive isotope of carbon, 14C, iscontinuously being produced by reaction ofcosmic ray neutrons with 14N in the atmosphereand decays with a half-life of 5,730 yr. 14Cconcentrations are usually reported as specificactivities (disintegrations per minute per gram ofcarbon relative to a standard) or as percentages of
Stable Isotope Applications in Hydrologic Studies342
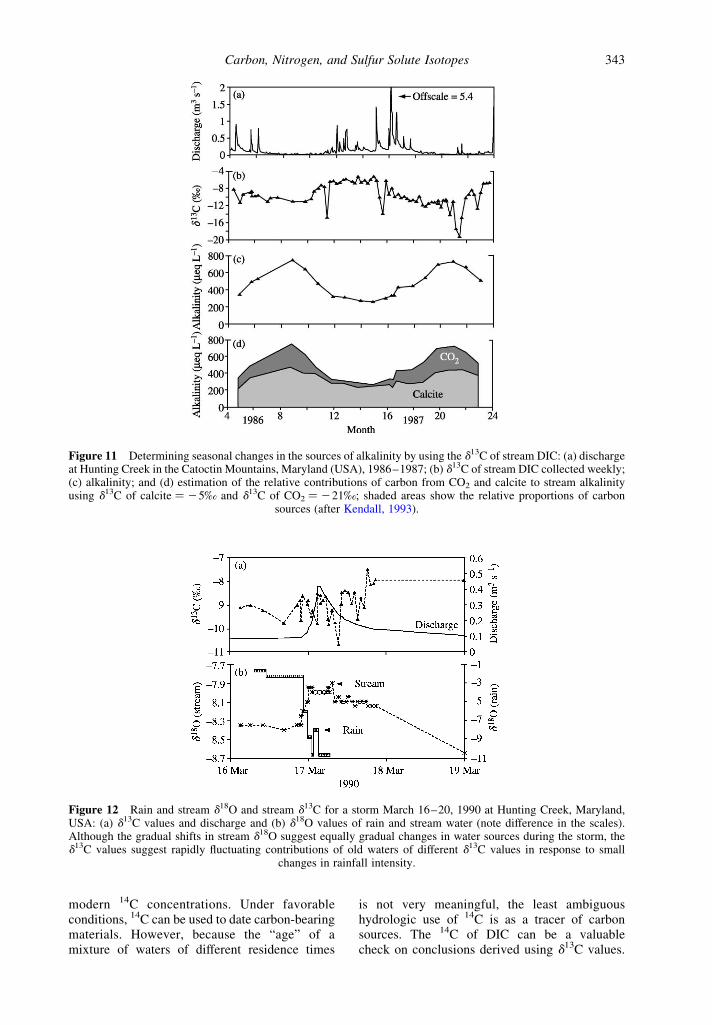
modern 14C concentrations. Under favorableconditions, 14C can be used to date carbon-bearingmaterials. However, because the “age” of amixture of waters of different residence times
is not very meaningful, the least ambiguoushydrologic use of 14C is as a tracer of carbonsources. The 14C of DIC can be a valuablecheck on conclusions derived using d13C values.
Figure 12 Rain and stream d18O and stream d13C for a storm March 16–20, 1990 at Hunting Creek, Maryland,USA: (a) d13C values and discharge and (b) d18O values of rain and stream water (note difference in the scales).Although the gradual shifts in stream d18O suggest equally gradual changes in water sources during the storm, thed13C values suggest rapidly fluctuating contributions of old waters of different d13C values in response to small
changes in rainfall intensity.
Figure 11 Determining seasonal changes in the sources of alkalinity by using the d13C of stream DIC: (a) dischargeat Hunting Creek in the Catoctin Mountains, Maryland (USA), 1986–1987; (b) d13C of stream DIC collected weekly;(c) alkalinity; and (d) estimation of the relative contributions of carbon from CO2 and calcite to stream alkalinityusing d13C of calcite ¼ 25‰ and d13C of CO2 ¼ 221‰; shaded areas show the relative proportions of carbon
sources (after Kendall, 1993).
Carbon, Nitrogen, and Sulfur Solute Isotopes 343
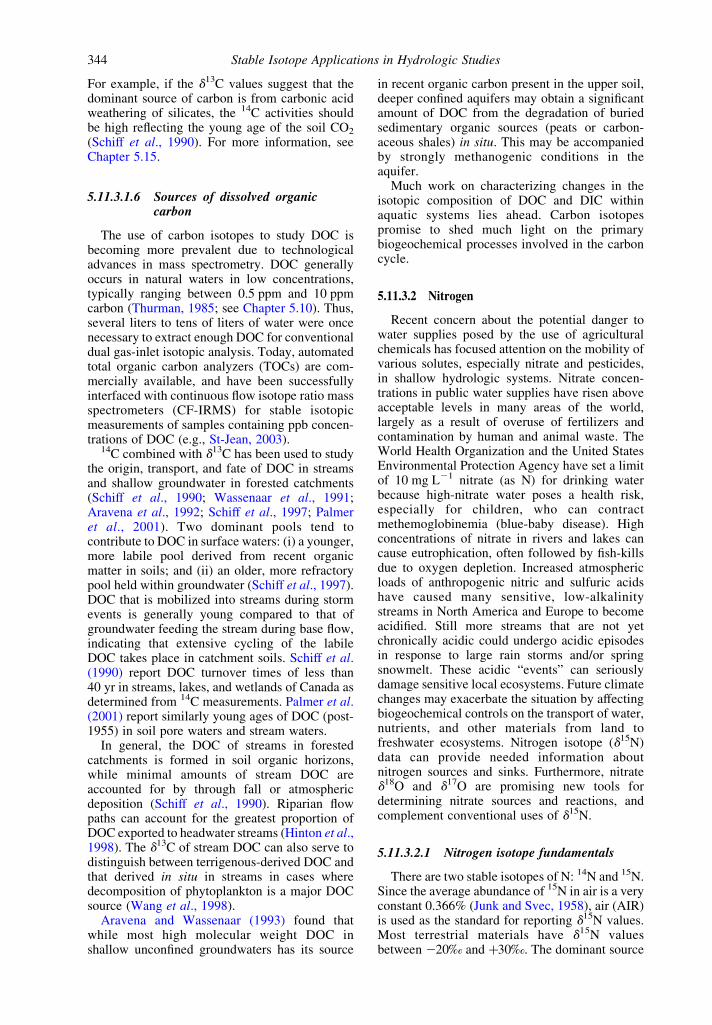
For example, if the d13C values suggest that thedominant source of carbon is from carbonic acidweathering of silicates, the 14C activities shouldbe high reflecting the young age of the soil CO2
(Schiff et al., 1990). For more information, seeChapter 5.15.
5.11.3.1.6 Sources of dissolved organiccarbon
The use of carbon isotopes to study DOC isbecoming more prevalent due to technologicaladvances in mass spectrometry. DOC generallyoccurs in natural waters in low concentrations,typically ranging between 0.5 ppm and 10 ppmcarbon (Thurman, 1985; see Chapter 5.10). Thus,several liters to tens of liters of water were oncenecessary to extract enough DOC for conventionaldual gas-inlet isotopic analysis. Today, automatedtotal organic carbon analyzers (TOCs) are com-mercially available, and have been successfullyinterfaced with continuous flow isotope ratio massspectrometers (CF-IRMS) for stable isotopicmeasurements of samples containing ppb concen-trations of DOC (e.g., St-Jean, 2003).
14C combined with d13C has been used to studythe origin, transport, and fate of DOC in streamsand shallow groundwater in forested catchments(Schiff et al., 1990; Wassenaar et al., 1991;Aravena et al., 1992; Schiff et al., 1997; Palmeret al., 2001). Two dominant pools tend tocontribute to DOC in surface waters: (i) a younger,more labile pool derived from recent organicmatter in soils; and (ii) an older, more refractorypool held within groundwater (Schiff et al., 1997).DOC that is mobilized into streams during stormevents is generally young compared to that ofgroundwater feeding the stream during base flow,indicating that extensive cycling of the labileDOC takes place in catchment soils. Schiff et al.(1990) report DOC turnover times of less than40 yr in streams, lakes, and wetlands of Canada asdetermined from 14C measurements. Palmer et al.(2001) report similarly young ages of DOC (post-1955) in soil pore waters and stream waters.
In general, the DOC of streams in forestedcatchments is formed in soil organic horizons,while minimal amounts of stream DOC areaccounted for by through fall or atmosphericdeposition (Schiff et al., 1990). Riparian flowpaths can account for the greatest proportion ofDOC exported to headwater streams (Hinton et al.,1998). The d13C of stream DOC can also serve todistinguish between terrigenous-derived DOC andthat derived in situ in streams in cases wheredecomposition of phytoplankton is a major DOCsource (Wang et al., 1998).
Aravena and Wassenaar (1993) found thatwhile most high molecular weight DOC inshallow unconfined groundwaters has its source
in recent organic carbon present in the upper soil,deeper confined aquifers may obtain a significantamount of DOC from the degradation of buriedsedimentary organic sources (peats or carbon-aceous shales) in situ. This may be accompaniedby strongly methanogenic conditions in theaquifer.
Much work on characterizing changes in theisotopic composition of DOC and DIC withinaquatic systems lies ahead. Carbon isotopespromise to shed much light on the primarybiogeochemical processes involved in the carboncycle.
5.11.3.2 Nitrogen
Recent concern about the potential danger towater supplies posed by the use of agriculturalchemicals has focused attention on the mobility ofvarious solutes, especially nitrate and pesticides,in shallow hydrologic systems. Nitrate concen-trations in public water supplies have risen aboveacceptable levels in many areas of the world,largely as a result of overuse of fertilizers andcontamination by human and animal waste. TheWorld Health Organization and the United StatesEnvironmental Protection Agency have set a limitof 10 mg L21 nitrate (as N) for drinking waterbecause high-nitrate water poses a health risk,especially for children, who can contractmethemoglobinemia (blue-baby disease). Highconcentrations of nitrate in rivers and lakes cancause eutrophication, often followed by fish-killsdue to oxygen depletion. Increased atmosphericloads of anthropogenic nitric and sulfuric acidshave caused many sensitive, low-alkalinitystreams in North America and Europe to becomeacidified. Still more streams that are not yetchronically acidic could undergo acidic episodesin response to large rain storms and/or springsnowmelt. These acidic “events” can seriouslydamage sensitive local ecosystems. Future climatechanges may exacerbate the situation by affectingbiogeochemical controls on the transport of water,nutrients, and other materials from land tofreshwater ecosystems. Nitrogen isotope (d15N)data can provide needed information aboutnitrogen sources and sinks. Furthermore, nitrated18O and d17O are promising new tools fordetermining nitrate sources and reactions, andcomplement conventional uses of d15N.
5.11.3.2.1 Nitrogen isotope fundamentals
There are two stable isotopes of N: 14N and 15N.Since the average abundance of 15N in air is a veryconstant 0.366% (Junk and Svec, 1958), air (AIR)is used as the standard for reporting d15N values.Most terrestrial materials have d15N valuesbetween 220‰ and þ30‰. The dominant source
Stable Isotope Applications in Hydrologic Studies344
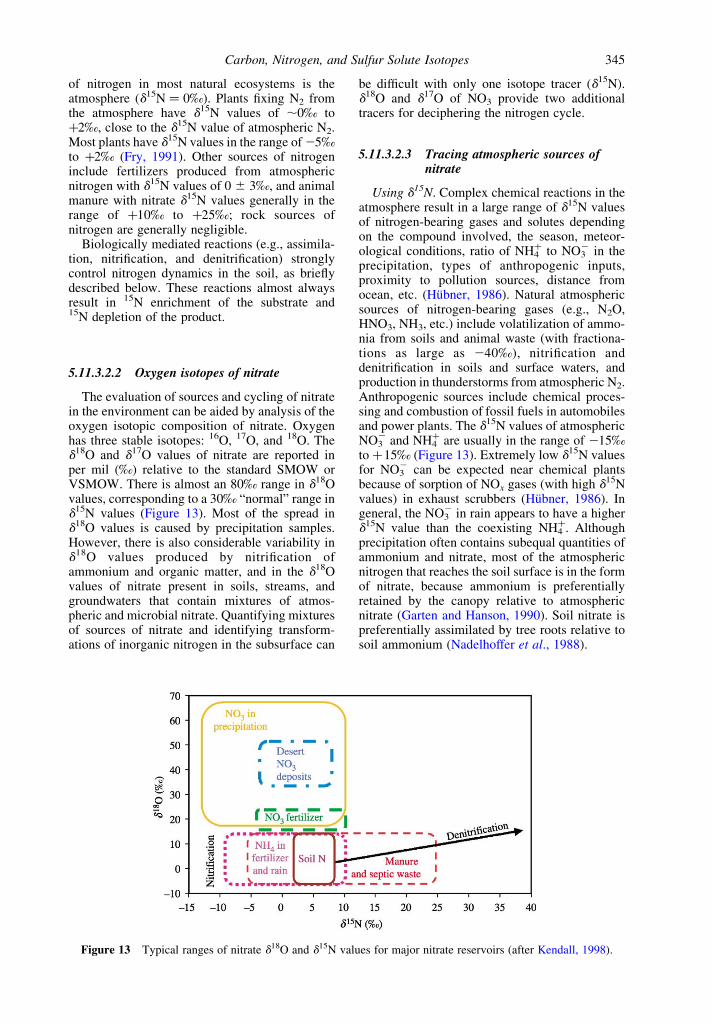
of nitrogen in most natural ecosystems is theatmosphere (d15N ¼ 0‰). Plants fixing N2 fromthe atmosphere have d15N values of ,0‰ toþ2‰, close to the d15N value of atmospheric N2.Most plants have d15N values in the range of 25‰to þ2‰ (Fry, 1991). Other sources of nitrogeninclude fertilizers produced from atmosphericnitrogen with d15N values of 0 ^ 3‰, and animalmanure with nitrate d15N values generally in therange of þ10‰ to þ25‰; rock sources ofnitrogen are generally negligible.
Biologically mediated reactions (e.g., assimila-tion, nitrification, and denitrification) stronglycontrol nitrogen dynamics in the soil, as brieflydescribed below. These reactions almost alwaysresult in 15N enrichment of the substrate and15N depletion of the product.
5.11.3.2.2 Oxygen isotopes of nitrate
The evaluation of sources and cycling of nitratein the environment can be aided by analysis of theoxygen isotopic composition of nitrate. Oxygenhas three stable isotopes: 16O, 17O, and 18O. Thed18O and d17O values of nitrate are reported inper mil (‰) relative to the standard SMOW orVSMOW. There is almost an 80‰ range in d18Ovalues, corresponding to a 30‰ “normal” range ind15N values (Figure 13). Most of the spread ind18O values is caused by precipitation samples.However, there is also considerable variability ind18O values produced by nitrification ofammonium and organic matter, and in the d18Ovalues of nitrate present in soils, streams, andgroundwaters that contain mixtures of atmos-pheric and microbial nitrate. Quantifying mixturesof sources of nitrate and identifying transform-ations of inorganic nitrogen in the subsurface can
be difficult with only one isotope tracer (d15N).d18O and d17O of NO3 provide two additionaltracers for deciphering the nitrogen cycle.
5.11.3.2.3 Tracing atmospheric sources ofnitrate
Using d15N. Complex chemical reactions in theatmosphere result in a large range of d15N valuesof nitrogen-bearing gases and solutes dependingon the compound involved, the season, meteor-ological conditions, ratio of NH4
þ to NO32 in the
precipitation, types of anthropogenic inputs,proximity to pollution sources, distance fromocean, etc. (Hubner, 1986). Natural atmosphericsources of nitrogen-bearing gases (e.g., N2O,HNO3, NH3, etc.) include volatilization of ammo-nia from soils and animal waste (with fractiona-tions as large as 240‰), nitrification anddenitrification in soils and surface waters, andproduction in thunderstorms from atmospheric N2.Anthropogenic sources include chemical proces-sing and combustion of fossil fuels in automobilesand power plants. The d15N values of atmosphericNO3
2 and NH4þ are usually in the range of 215‰
to þ15‰ (Figure 13). Extremely low d15N valuesfor NO3
2 can be expected near chemical plantsbecause of sorption of NOx gases (with high d15Nvalues) in exhaust scrubbers (Hubner, 1986). Ingeneral, the NO3
2 in rain appears to have a higherd15N value than the coexisting NH4
þ. Althoughprecipitation often contains subequal quantities ofammonium and nitrate, most of the atmosphericnitrogen that reaches the soil surface is in the formof nitrate, because ammonium is preferentiallyretained by the canopy relative to atmosphericnitrate (Garten and Hanson, 1990). Soil nitrate ispreferentially assimilated by tree roots relative tosoil ammonium (Nadelhoffer et al., 1988).
Figure 13 Typical ranges of nitrate d18O and d15N values for major nitrate reservoirs (after Kendall, 1998).
Carbon, Nitrogen, and Sulfur Solute Isotopes 345
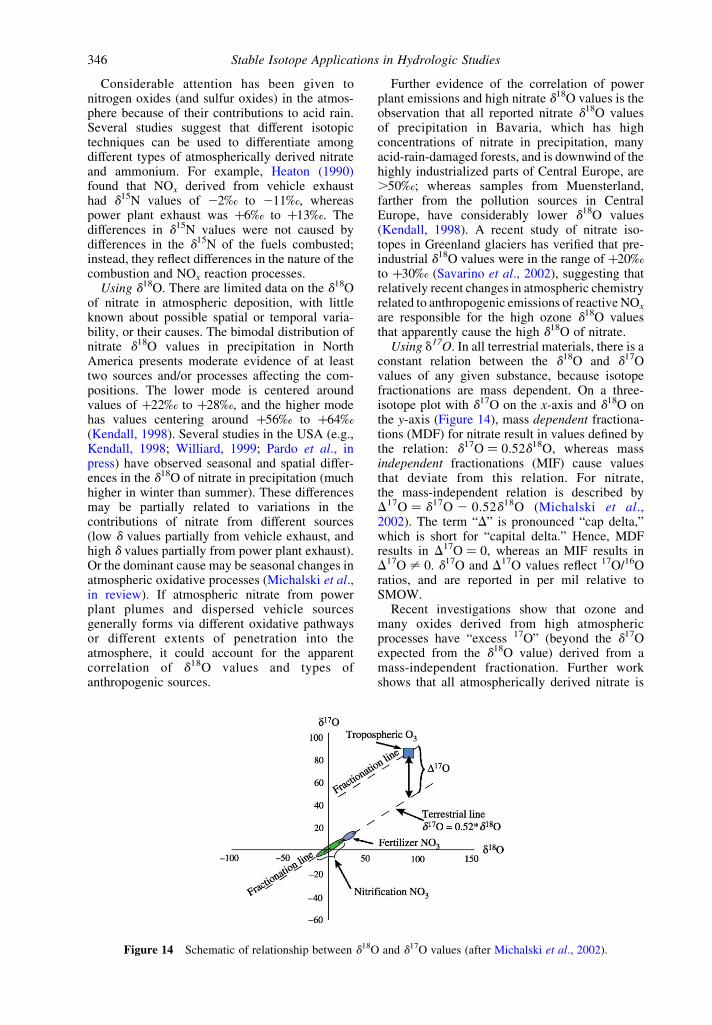
Considerable attention has been given tonitrogen oxides (and sulfur oxides) in the atmos-phere because of their contributions to acid rain.Several studies suggest that different isotopictechniques can be used to differentiate amongdifferent types of atmospherically derived nitrateand ammonium. For example, Heaton (1990)found that NOx derived from vehicle exhausthad d15N values of 22‰ to 211‰, whereaspower plant exhaust was þ6‰ to þ13‰. Thedifferences in d15N values were not caused bydifferences in the d15N of the fuels combusted;instead, they reflect differences in the nature of thecombustion and NOx reaction processes.
Using d18O. There are limited data on the d18Oof nitrate in atmospheric deposition, with littleknown about possible spatial or temporal varia-bility, or their causes. The bimodal distribution ofnitrate d18O values in precipitation in NorthAmerica presents moderate evidence of at leasttwo sources and/or processes affecting the com-positions. The lower mode is centered aroundvalues of þ22‰ to þ28‰, and the higher modehas values centering around þ56‰ to þ64‰(Kendall, 1998). Several studies in the USA (e.g.,Kendall, 1998; Williard, 1999; Pardo et al., inpress) have observed seasonal and spatial differ-ences in the d18O of nitrate in precipitation (muchhigher in winter than summer). These differencesmay be partially related to variations in thecontributions of nitrate from different sources(low d values partially from vehicle exhaust, andhigh d values partially from power plant exhaust).Or the dominant cause may be seasonal changes inatmospheric oxidative processes (Michalski et al.,in review). If atmospheric nitrate from powerplant plumes and dispersed vehicle sourcesgenerally forms via different oxidative pathwaysor different extents of penetration into theatmosphere, it could account for the apparentcorrelation of d18O values and types ofanthropogenic sources.
Further evidence of the correlation of powerplant emissions and high nitrate d18O values is theobservation that all reported nitrate d18O valuesof precipitation in Bavaria, which has highconcentrations of nitrate in precipitation, manyacid-rain-damaged forests, and is downwind of thehighly industrialized parts of Central Europe, are.50‰; whereas samples from Muensterland,farther from the pollution sources in CentralEurope, have considerably lower d18O values(Kendall, 1998). A recent study of nitrate iso-topes in Greenland glaciers has verified that pre-industrial d18O values were in the range of þ20‰to þ30‰ (Savarino et al., 2002), suggesting thatrelatively recent changes in atmospheric chemistryrelated to anthropogenic emissions of reactive NOx
are responsible for the high ozone d18O valuesthat apparently cause the high d18O of nitrate.
Using d17O. In all terrestrial materials, there is aconstant relation between the d18O and d17Ovalues of any given substance, because isotopefractionations are mass dependent. On a three-isotope plot with d17O on the x-axis and d18O onthe y-axis (Figure 14), mass dependent fractiona-tions (MDF) for nitrate result in values defined bythe relation: d17O ¼ 0.52d18O, whereas massindependent fractionations (MIF) cause valuesthat deviate from this relation. For nitrate,the mass-independent relation is described byD17O ¼ d17O 2 0.52d18O (Michalski et al.,2002). The term “D” is pronounced “cap delta,”which is short for “capital delta.” Hence, MDFresults in D17O ¼ 0, whereas an MIF results inD17O – 0. d17O and D17O values reflect 17O/16Oratios, and are reported in per mil relative toSMOW.
Recent investigations show that ozone andmany oxides derived from high atmosphericprocesses have “excess 17O” (beyond the d17Oexpected from the d18O value) derived from amass-independent fractionation. Further workshows that all atmospherically derived nitrate is
Figure 14 Schematic of relationship between d18O and d17O values (after Michalski et al., 2002).
Stable Isotope Applications in Hydrologic Studies346
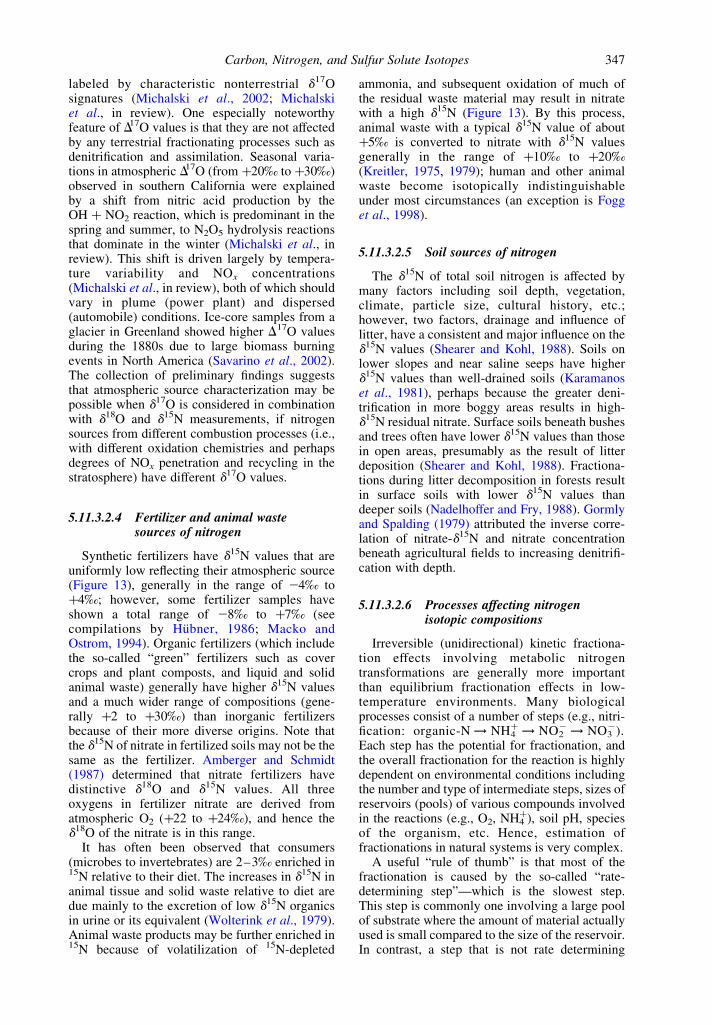
labeled by characteristic nonterrestrial d17Osignatures (Michalski et al., 2002; Michalskiet al., in review). One especially noteworthyfeature of D17O values is that they are not affectedby any terrestrial fractionating processes such asdenitrification and assimilation. Seasonal varia-tions in atmospheric D17O (from þ20‰ to þ30‰)observed in southern California were explainedby a shift from nitric acid production by theOH þ NO2 reaction, which is predominant in thespring and summer, to N2O5 hydrolysis reactionsthat dominate in the winter (Michalski et al., inreview). This shift is driven largely by tempera-ture variability and NOx concentrations(Michalski et al., in review), both of which shouldvary in plume (power plant) and dispersed(automobile) conditions. Ice-core samples from aglacier in Greenland showed higher D17O valuesduring the 1880s due to large biomass burningevents in North America (Savarino et al., 2002).The collection of preliminary findings suggeststhat atmospheric source characterization may bepossible when d17O is considered in combinationwith d18O and d15N measurements, if nitrogensources from different combustion processes (i.e.,with different oxidation chemistries and perhapsdegrees of NOx penetration and recycling in thestratosphere) have different d17O values.
5.11.3.2.4 Fertilizer and animal wastesources of nitrogen
Synthetic fertilizers have d15N values that areuniformly low reflecting their atmospheric source(Figure 13), generally in the range of 24‰ toþ4‰; however, some fertilizer samples haveshown a total range of 28‰ to þ7‰ (seecompilations by Hubner, 1986; Macko andOstrom, 1994). Organic fertilizers (which includethe so-called “green” fertilizers such as covercrops and plant composts, and liquid and solidanimal waste) generally have higher d15N valuesand a much wider range of compositions (gene-rally þ2 to þ30‰) than inorganic fertilizersbecause of their more diverse origins. Note thatthe d15N of nitrate in fertilized soils may not be thesame as the fertilizer. Amberger and Schmidt(1987) determined that nitrate fertilizers havedistinctive d18O and d15N values. All threeoxygens in fertilizer nitrate are derived fromatmospheric O2 (þ22 to þ24‰), and hence thed18O of the nitrate is in this range.
It has often been observed that consumers(microbes to invertebrates) are 2–3‰ enriched in15N relative to their diet. The increases in d15N inanimal tissue and solid waste relative to diet aredue mainly to the excretion of low d15N organicsin urine or its equivalent (Wolterink et al., 1979).Animal waste products may be further enriched in15N because of volatilization of 15N-depleted
ammonia, and subsequent oxidation of much ofthe residual waste material may result in nitratewith a high d15N (Figure 13). By this process,animal waste with a typical d15N value of aboutþ5‰ is converted to nitrate with d15N valuesgenerally in the range of þ10‰ to þ20‰(Kreitler, 1975, 1979); human and other animalwaste become isotopically indistinguishableunder most circumstances (an exception is Fogget al., 1998).
5.11.3.2.5 Soil sources of nitrogen
The d15N of total soil nitrogen is affected bymany factors including soil depth, vegetation,climate, particle size, cultural history, etc.;however, two factors, drainage and influence oflitter, have a consistent and major influence on thed15N values (Shearer and Kohl, 1988). Soils onlower slopes and near saline seeps have higherd15N values than well-drained soils (Karamanoset al., 1981), perhaps because the greater deni-trification in more boggy areas results in high-d15N residual nitrate. Surface soils beneath bushesand trees often have lower d15N values than thosein open areas, presumably as the result of litterdeposition (Shearer and Kohl, 1988). Fractiona-tions during litter decomposition in forests resultin surface soils with lower d15N values thandeeper soils (Nadelhoffer and Fry, 1988). Gormlyand Spalding (1979) attributed the inverse corre-lation of nitrate-d15N and nitrate concentrationbeneath agricultural fields to increasing denitrifi-cation with depth.
5.11.3.2.6 Processes affecting nitrogenisotopic compositions
Irreversible (unidirectional) kinetic fractiona-tion effects involving metabolic nitrogentransformations are generally more importantthan equilibrium fractionation effects in low-temperature environments. Many biologicalprocesses consist of a number of steps (e.g., nitri-fication: organic-N ! NH4
þ ! NO22 ! NO3
2).Each step has the potential for fractionation, andthe overall fractionation for the reaction is highlydependent on environmental conditions includingthe number and type of intermediate steps, sizes ofreservoirs (pools) of various compounds involvedin the reactions (e.g., O2, NH4
þ), soil pH, speciesof the organism, etc. Hence, estimation offractionations in natural systems is very complex.
A useful “rule of thumb” is that most of thefractionation is caused by the so-called “rate-determining step”—which is the slowest step.This step is commonly one involving a large poolof substrate where the amount of material actuallyused is small compared to the size of the reservoir.In contrast, a step that is not rate determining
Carbon, Nitrogen, and Sulfur Solute Isotopes 347
generally involves a small pool of some com-pound that is rapidly converted from reactant toproduct; because the compound is converted toproduct as soon as it appears, there is nofractionation at this step. The isotopic compo-sitions of reactant and product during a multistepreaction where the net fractionation is controlledby a single rate-determining step can be success-fully modeled with Rayleigh equations. For moredetails, see recent reviews by Kendall (1998),Kendall and Aravena (2000), and Bohlke (2002).
N-fixation refers to processes that convertunreactive atmospheric N2 into other forms ofnitrogen. Although the term is usually used tomean fixation by bacteria, it has also been used toinclude fixation by lightning and, more impor-tantly, by human activities (energy production,fertilizer production, and crop cultivation) thatproduce reactive nitrogen (NOx, NHy, and organicnitrogen). Fixation of atmospheric N2 commonlyproduces organic materials with d15N valuesslightly less than 0‰. A compilation by Fogeland Cifuentes (1993) indicates measured fractio-nations ranging from 23‰ to þ1‰. Becausethese values are generally lower than the valuesfor organic materials produced by other mechan-isms, low d15N values in organic matter are oftencited as evidence for N2 fixation.
Assimilation generally refers to the incorpora-tion of nitrogen-bearing compounds intoorganisms. Assimilation, like other biologicalreactions, discriminates between isotopes andgenerally favors the incorporation of 14N over 15N.Measured values for apparent fractionationscaused by assimilation by microorganisms insoils show a range of 21.6‰ to þ1‰, with anaverage of –0.52‰ (compilation by Hubner,1986). Fractionations by vascular plants show arange of 22.2‰ to þ0.5‰ and an average of20.25‰, relative to soil organic matter (Mariottiet al., 1980). Nitrogen uptake by plants in soilscauses only a small fractionation and, hence, onlyslightly alters the isotopic composition of theresidual fertilizer or soil organic matter. The d15Nof algae in rivers in the USA is generally ,4‰lower than that of the associated nitrate (Kendall,unpublished data).
Mineralization is usually defined as the pro-duction of ammonium from soil organic matter.This is sometimes called ammonification, which isa less confusing term. Mineralization usuallycauses only a small fractionation (,1‰) betweensoil organic matter and soil ammonium. Ingeneral, the d15N of soil ammonium is usuallywithin a few per mil of the composition of totalorganic nitrogen in the soil.
Nitrification is a multistep oxidation processmediated by several different autotrophic organ-isms for the purpose of deriving metabolic energy;the reactions produce acidity. In general, the
extent of fractionation is dependent on the size ofthe substrate pool (reservoir). In nitrogen-limitedsystems, the fractionations are minimal. The totalfractionation associated with nitrification dependson which step is rate determining. Because theoxidation of nitrite to nitrate is generally quanti-tative (rapid) in natural systems, this is generallynot the rate-determining step, and most of thenitrogen fractionation is probably caused by theslow oxidation of ammonium by Nitrosomonas. Insoils, overall N-nitrification fractionations havebeen estimated to range between 12‰ and 29‰(Shearer and Kohl, 1986).
Volatilization is the term commonly used forthe loss of ammonia gas from surficial soils to theatmosphere; the ammonia gas produced has alower d15N value than the residual ammonium inthe soil. Volatilization in farmlands results fromapplications of urea and manure to fields, andoccurs within piles of manure; the resultingorganic matter may have d15N values .20‰because of ammonia losses. Ammonium in preci-pitation derived from volatilazation from wastelagoons can have a distinctive low d15N value.
Denitrification is a multistep process withvarious nitrogen oxides (e.g., N2O, NO) asintermediate compounds resulting from thechemical or biologically mediated reduction ofnitrate to N2. Depending on the redox conditions,organisms will utilize different oxidized materialsas electron acceptors in the general order: O2,NO3
2, SO422. Although microbial denitrification
does not occur in the presence of significantamounts of oxygen, it can occur in anaerobicpockets within an otherwise oxygenated sedimentor water body (Koba et al., 1997).
Denitrification causes the d15N of the residualnitrate to increase exponentially as nitrate con-centrations decrease, and causes the acidity of thesystem to decrease. For example, denitrification offertilizer nitrate that originally had a distinctived15N value of þ0‰ can yield residual nitrate withmuch higher d15N values (e.g., þ15‰ to þ30‰)that are within the range of compositions expectedfor nitrate from a manure or septic-tank source.Measured enrichment factors (apparent fractiona-tions) associated with denitrification range from240‰ to 25‰; hence, the d15N of the N2 is lowerthan that of the nitrate by about these values. TheN2 produced by denitrification results in excess N2
contents in groundwater; the d15N of this N2 canprovide useful information about sources andprocesses (Vogel et al., 1981; Bohlke and Denver,1995).
5.11.3.2.7 Processes affecting the d18Oof nitrate
Nitrification. When organic nitrogen orammonium is microbially oxidized to nitrate
Stable Isotope Applications in Hydrologic Studies348
(i.e., nitrified), the three oxygens are derived fromtwo sources: H2O and dissolved O2. If the oxygen isincorporated with no fractionation, the d18O of theresulting nitrate is intermediate betweenthe compositions of the two oxygen sources.Andersson and Hooper (1983) showed thatoxidation of NH4
þ to NO22 incorporated one
atom from water and one atom from dissolvedoxygen. Work by Aleem et al. (1965) indicatesthat the additional oxygen atom incorporatedduring the oxidation of NO2
2 to NO32 originates
entirely from H2O. This combined worksuggests that the oxygen isotopic composition ofNO3
2 formed during autotrophic nitrification(NH4
þ ! NO32) would have the composition of
d18ONO3¼ 2=3d
18OH2O þ 1=3d18OO2
ð13Þ
For waters with d18O values in the normal range of225‰ to þ4‰, the d18O of soil nitrate formedfrom in situ nitrification of ammonium should bein the range of 210‰ to þ10‰, respectively(Figure 13). For highly evaporated water (þ20‰),the d18O of nitrate could be as high as aboutþ21‰ (Bohlke et al., 1997). The oxygen isotopiccomposition of dissolved O2 reflects the effects ofthree primary processes: (i) diffusion ofatmospheric oxygen (,þ23.5‰) in the subsur-face, (ii) photosynthesis—resulting in the additionof O2 with a low d18O similar to that of water, and(iii) respiration by microbes—resulting in isotopicfractionation and higher d18O values for theresidual O2.
The above model makes four critical assump-tions: (i) the proportions of oxygen from water andO2 are the same in soils as observed in laboratorycultures; (ii) there are no fractionations resultingfrom the incorporation of oxygen from water orO2 during nitrification; (iii) the d18O of water usedby the microbes is identical to that of the bulk soilwater; and (iv) the d18O of the O2 used by themicrobes is identical to that of atmospheric O2.
Many studies have used measurement of d18Oof NO3
2 in freshwater systems for assessingsources and cycling (see below). Many of themfind that the d18O of microbial NO3
2 appears to bea few per mil higher than expected for theequation and assumptions above (Kendall,1998). A variety of explanations have been offeredfor these high nitrate-d18O values: (i) nitrificationin contact with soil waters with higher-than-expected d18O values because of evaporation(Bohlke et al., 1997) or seasonal changes in raind18O (Wassenaar, 1995); (ii) changes in theproportion of oxygen from H2O and O2 sources(Aravena et al., 1993); (iii) nitrification using O2
that has a high d18O due to heterotrophicrespiration (Kendall, 1998); and (iv) nitrificationthat occurs simultaneously via both heterotrophicand autotrophic pathways (Mayer et al., 2001).At this time, the mechanisms responsible for
generating the isotopic composition of NO32 in
nature are poorly understood.Denitrification. Denitrification is the process
that poses most difficulties for simple applicationsof nitrate isotopes. Hence, for successful appli-cations of nitrate isotopes for tracing sources, it iscritical to (i) determine if denitrification hasoccurred, and, if so (ii) determine what was theinitial isotopic composition of the nitrate (which isa necessary prerequisite for later attempts todefine sources). There are several geochemicalmethods for identifying denitrification in ground-water, and distinguishing it from mixing:
(i) Geochemical evidence of a reducing envi-ronment (e.g., low dissolved O2, high H2S, etc.).
(ii) Hyperbolic versus exponential relationshipsbetween d15N and NO3
2 (i.e., mixing is ahyperbolic function, whereas denitrification isexponential). Hence, if mixing of two sources isresponsible for the curvilinear relationshipbetween d15N and NO3
2, plotting d15N versus1/NO3
2 will result in a straight line (Figure 2). Incontrast, if denitrification (or assimilation) isresponsible for the relationship, plotting d15Nversus ln NO3
2 will produce a straight line(Figure 3). Analysis of dissolved N2 (producedby the denitrification of NO3
2) for d15N to showthat there are systematic increases in the d15N ofN2 with decreases in NO3
2 and increases in thed15N of NO3
2 (e.g., a “Rayleigh equation”relationship like Figure 1).
(iii) Analysis of the NO32 for d18O as well as
d15N to see if there is a systematic increase in d18Owith increase in d15N and decrease in NO3
2,consistent with denitrification. On d18O versusd15N plots, denitrification produces lines withslopes of ,0.5 (Figure 13).
(iv) No change in D17O during a process thathas d18O and/or d15N trends characteristic ofdenitrification (if material has D17O . 0).
5.11.3.2.8 Small catchment studies
The main application of nitrate d18O has beenfor the determination of the relative contributionsof atmospheric and soil-derived sources of nitrateto shallow groundwater and small streams. Thisproblem is intractable using d15N alone because ofoverlapping compositions of soil and atmos-pherically derived nitrate, whereas these nitratesources have very distinctive nitrate d18O values(Figure 13). Durka et al. (1994) analyzed nitrate inprecipitation and spring samples from severalGerman forests for both isotopes, and found thatthe d18O of nitrate in springs was correlated withthe general health of the forest, with more healthyor limed forests showing lower d18O values closerto the composition of microbially producednitrate, and severely damaged forests showing
Carbon, Nitrogen, and Sulfur Solute Isotopes 349
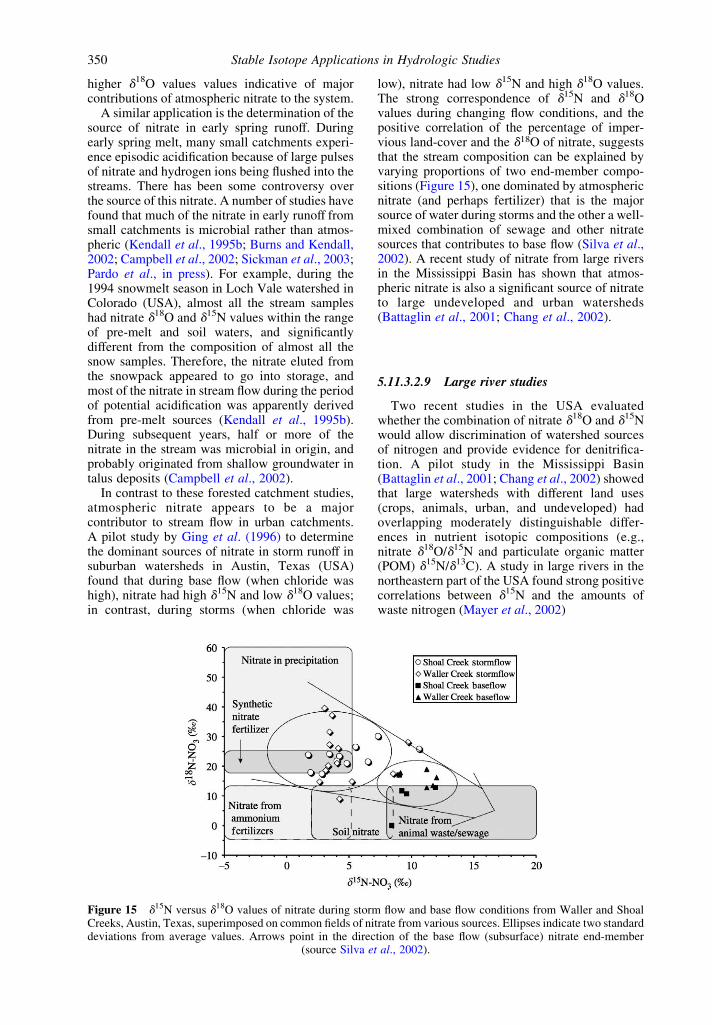
higher d18O values values indicative of majorcontributions of atmospheric nitrate to the system.
A similar application is the determination of thesource of nitrate in early spring runoff. Duringearly spring melt, many small catchments experi-ence episodic acidification because of large pulsesof nitrate and hydrogen ions being flushed into thestreams. There has been some controversy overthe source of this nitrate. A number of studies havefound that much of the nitrate in early runoff fromsmall catchments is microbial rather than atmos-pheric (Kendall et al., 1995b; Burns and Kendall,2002; Campbell et al., 2002; Sickman et al., 2003;Pardo et al., in press). For example, during the1994 snowmelt season in Loch Vale watershed inColorado (USA), almost all the stream sampleshad nitrate d18O and d15N values within the rangeof pre-melt and soil waters, and significantlydifferent from the composition of almost all thesnow samples. Therefore, the nitrate eluted fromthe snowpack appeared to go into storage, andmost of the nitrate in stream flow during the periodof potential acidification was apparently derivedfrom pre-melt sources (Kendall et al., 1995b).During subsequent years, half or more of thenitrate in the stream was microbial in origin, andprobably originated from shallow groundwater intalus deposits (Campbell et al., 2002).
In contrast to these forested catchment studies,atmospheric nitrate appears to be a majorcontributor to stream flow in urban catchments.A pilot study by Ging et al. (1996) to determinethe dominant sources of nitrate in storm runoff insuburban watersheds in Austin, Texas (USA)found that during base flow (when chloride washigh), nitrate had high d15N and low d18O values;in contrast, during storms (when chloride was
low), nitrate had low d15N and high d18O values.The strong correspondence of d15N and d18Ovalues during changing flow conditions, and thepositive correlation of the percentage of imper-vious land-cover and the d18O of nitrate, suggeststhat the stream composition can be explained byvarying proportions of two end-member compo-sitions (Figure 15), one dominated by atmosphericnitrate (and perhaps fertilizer) that is the majorsource of water during storms and the other a well-mixed combination of sewage and other nitratesources that contributes to base flow (Silva et al.,2002). A recent study of nitrate from large riversin the Mississippi Basin has shown that atmos-pheric nitrate is also a significant source of nitrateto large undeveloped and urban watersheds(Battaglin et al., 2001; Chang et al., 2002).
5.11.3.2.9 Large river studies
Two recent studies in the USA evaluatedwhether the combination of nitrate d18O and d15Nwould allow discrimination of watershed sourcesof nitrogen and provide evidence for denitrifica-tion. A pilot study in the Mississippi Basin(Battaglin et al., 2001; Chang et al., 2002) showedthat large watersheds with different land uses(crops, animals, urban, and undeveloped) hadoverlapping moderately distinguishable differ-ences in nutrient isotopic compositions (e.g.,nitrate d18O/d15N and particulate organic matter(POM) d15N/d13C). A study in large rivers in thenortheastern part of the USA found strong positivecorrelations between d15N and the amounts ofwaste nitrogen (Mayer et al., 2002)
Figure 15 d15N versus d18O values of nitrate during storm flow and base flow conditions from Waller and ShoalCreeks, Austin, Texas, superimposed on common fields of nitrate from various sources. Ellipses indicate two standarddeviations from average values. Arrows point in the direction of the base flow (subsurface) nitrate end-member
(source Silva et al., 2002).
Stable Isotope Applications in Hydrologic Studies350
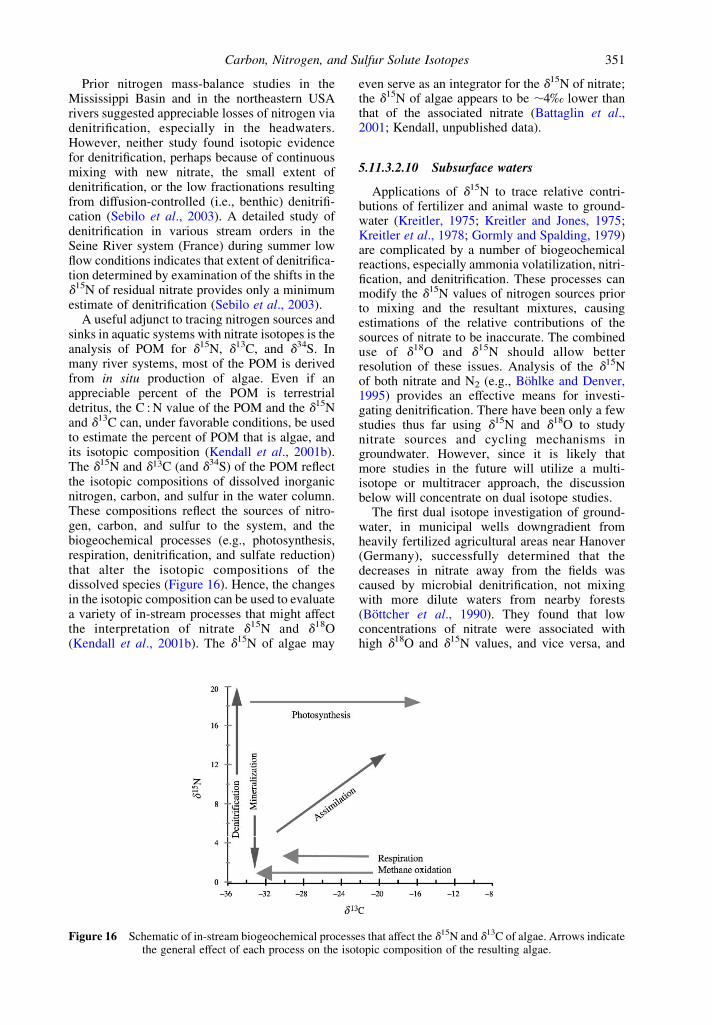
Prior nitrogen mass-balance studies in theMississippi Basin and in the northeastern USArivers suggested appreciable losses of nitrogen viadenitrification, especially in the headwaters.However, neither study found isotopic evidencefor denitrification, perhaps because of continuousmixing with new nitrate, the small extent ofdenitrification, or the low fractionations resultingfrom diffusion-controlled (i.e., benthic) denitrifi-cation (Sebilo et al., 2003). A detailed study ofdenitrification in various stream orders in theSeine River system (France) during summer lowflow conditions indicates that extent of denitrifica-tion determined by examination of the shifts in thed15N of residual nitrate provides only a minimumestimate of denitrification (Sebilo et al., 2003).
A useful adjunct to tracing nitrogen sources andsinks in aquatic systems with nitrate isotopes is theanalysis of POM for d15N, d13C, and d34S. Inmany river systems, most of the POM is derivedfrom in situ production of algae. Even if anappreciable percent of the POM is terrestrialdetritus, the C : N value of the POM and the d15Nand d13C can, under favorable conditions, be usedto estimate the percent of POM that is algae, andits isotopic composition (Kendall et al., 2001b).The d15N and d13C (and d34S) of the POM reflectthe isotopic compositions of dissolved inorganicnitrogen, carbon, and sulfur in the water column.These compositions reflect the sources of nitro-gen, carbon, and sulfur to the system, and thebiogeochemical processes (e.g., photosynthesis,respiration, denitrification, and sulfate reduction)that alter the isotopic compositions of thedissolved species (Figure 16). Hence, the changesin the isotopic composition can be used to evaluatea variety of in-stream processes that might affectthe interpretation of nitrate d15N and d18O(Kendall et al., 2001b). The d15N of algae may
even serve as an integrator for the d15N of nitrate;the d15N of algae appears to be ,4‰ lower thanthat of the associated nitrate (Battaglin et al.,2001; Kendall, unpublished data).
5.11.3.2.10 Subsurface waters
Applications of d15N to trace relative contri-butions of fertilizer and animal waste to ground-water (Kreitler, 1975; Kreitler and Jones, 1975;Kreitler et al., 1978; Gormly and Spalding, 1979)are complicated by a number of biogeochemicalreactions, especially ammonia volatilization, nitri-fication, and denitrification. These processes canmodify the d15N values of nitrogen sources priorto mixing and the resultant mixtures, causingestimations of the relative contributions of thesources of nitrate to be inaccurate. The combineduse of d18O and d15N should allow betterresolution of these issues. Analysis of the d15Nof both nitrate and N2 (e.g., Bohlke and Denver,1995) provides an effective means for investi-gating denitrification. There have been only a fewstudies thus far using d15N and d18O to studynitrate sources and cycling mechanisms ingroundwater. However, since it is likely thatmore studies in the future will utilize a multi-isotope or multitracer approach, the discussionbelow will concentrate on dual isotope studies.
The first dual isotope investigation of ground-water, in municipal wells downgradient fromheavily fertilized agricultural areas near Hanover(Germany), successfully determined that thedecreases in nitrate away from the fields wascaused by microbial denitrification, not mixingwith more dilute waters from nearby forests(Bottcher et al., 1990). They found that lowconcentrations of nitrate were associated withhigh d18O and d15N values, and vice versa, and
Figure 16 Schematic of in-stream biogeochemical processes that affect the d15N and d13C of algae. Arrows indicatethe general effect of each process on the isotopic composition of the resulting algae.
Carbon, Nitrogen, and Sulfur Solute Isotopes 351
that changes in d18O and d15N values along theflow path were linearly related, with a slope of,0.5. The linear relation between the isotopevalues and the logarithm of the fraction of residualnitrate (i.e., the data fit a Rayleigh equation)indicated that denitrification with constant enrich-ment factors for oxygen (28.0‰) and nitrogen(215.9‰) was responsible for the increases ind18O and d15N.
There have been several subsequent dualisotope fertilizer studies. The high concentrationsof NO3
2 in shallow groundwater in the Abbotsfordaquifer, British Columbia (Canada), were attri-buted to nitrification of poultry manure, withlesser amounts of ammonium fertilizers(Wassenaar, 1995). A study of denitrification ina riparian zone showed a higher slope (,0.7)for the relative fractionation of d18O to d15N(Mengis et al., 1999). Nitrate from 10 major karstsprings in Illinois during four different seasonswas found to be mainly derived from nitrogenfertilizer (Panno et al., 2001).
The applicability of d18O and d15N of nitrateand other tracers to delineate contaminant plumesderived from domestic septic systems was eval-uated by Aravena et al. (1993), in a study withinan unconfined aquifer beneath an agricultural areain Ontario (Canada). They found that d15N ofnitrate, d18O of water, and water chemistry(especially sodium) were effective for differentia-ting between the plume and native groundwater.The differences in d15N values reflect differencesin dominant nitrogen sources (human waste versusmixed fertilizer/manure). There was good delinea-tion of the plume with water-d18O values,reflecting differences in residence time of waterwithin the shallow unconfined aquifer, and thedeeper confined aquifer that supplies water to thehouse and the plume. There was no significantdifference between the d18O of nitrate in theplume and in local groundwater; the d18O valuessuggest that nitrification of ammonium, fromeither human waste or agricultural sources, is thesource of the nitrate. Another study of a septicplume determined that use of a multi-isotopeapproach (using d13C of DIC, and d18O and d34Sof sulfate in addition to nitrate d18O and d15N)provided valuable insight into the details of theprocesses affecting nitrate attenuation in ground-water (Aravena and Robertson, 1998).
5.11.3.3 Sulfur
Several important reviews of the use of stablesulfur isotopes as hydrologic and biogeochemicaltracers have been produced since the mid-1980s.Krouse and Grinenko (1991) provide a verycomprehensive evaluation of stable sulfur isotopesas tracers of natural and anthropogenic sulfur.
Krouse and Mayer (2000) present an in-depthreview and several case studies of the use ofstable sulfur and oxygen isotopes of sulfate ashydrologic tracers in groundwater. In addition,the use of sulfur isotopes for investigations ofhydrological processes in catchments has beenreviewed by Mitchell et al. (1998). Thus, whatis presented here is just a brief overview of theapplication of sulfur isotopes in hydrologicstudies.
Much of the work using sulfur isotopes insurface hydrology to date has been driven by theneed to understand the effects of atmosphericdeposition on sulfur cycling in the naturalenvironment, particularly in forest ecosystems.This is in response to increased sulfur loadings toterrestrial ecosystems from anthropogenic sulfuremissions, as sulfur is a dominant component of“acid rain.” In addition to studying ecosystemresponses to sulfur deposition from atmosphericsources, there is often a need to identify sulfursources and transformations along flow pathwaysin groundwater. Bacterially mediated sulfatereduction is one of the most widespread biogeo-chemical processes occurring in groundwatersystems. Elevated sulfate concentrations ingroundwater and production of H2S gas in aquaticsystems can be both a nuisance and a healthhazard, yet are ubiquitous. The stable isotopes ofsulfur and of oxygen in sulfate are useful tracers insuch studies (Clark and Fritz, 1997; Krouse andMayer, 2000). A more applied use of stable sulfurisotopes in terms of groundwater risk managementis for identification of arsenic contaminationsources and biological remediation efficacy oforganic pollutants.
5.11.3.3.1 Sulfur isotope fundamentals
Sulfur has four stable isotopes: 32S (95.02%),33S (0.75%), 34S (4.21%), and 36S (0.02%)(MacNamara and Thode, 1950). Stable isotopecompositions are reported as d34S, ratios of34S/32S in per mil relative to the standard CDT.The general terrestrial range is þ50‰ to 250‰,with rare values much higher or lower.
Geologic sources of sulfur include primary andsecondary sulfide minerals as well as chemicallyprecipitated sulfate minerals. In sedimentaryrocks, sulfur is often concentrated. Examplesinclude pyritic shales, evaporites, and limestonescontaining pyrite and gypsum in vugs and liningfractures. In many cases, these rocks can be boththe source of organic matter as well as sulfate forthe biogeochemical reduction of sulfate to occur.
There is a large range in d34S of sedimentarysulfide minerals, from 230‰ to þ5‰ (Migdisovet al., 1983; Strauss, 1997). Crystalline rocks ofmagmatic origin show a more narrow range,from 0‰ to þ5‰. Volcanic rocks are similar;
Stable Isotope Applications in Hydrologic Studies352
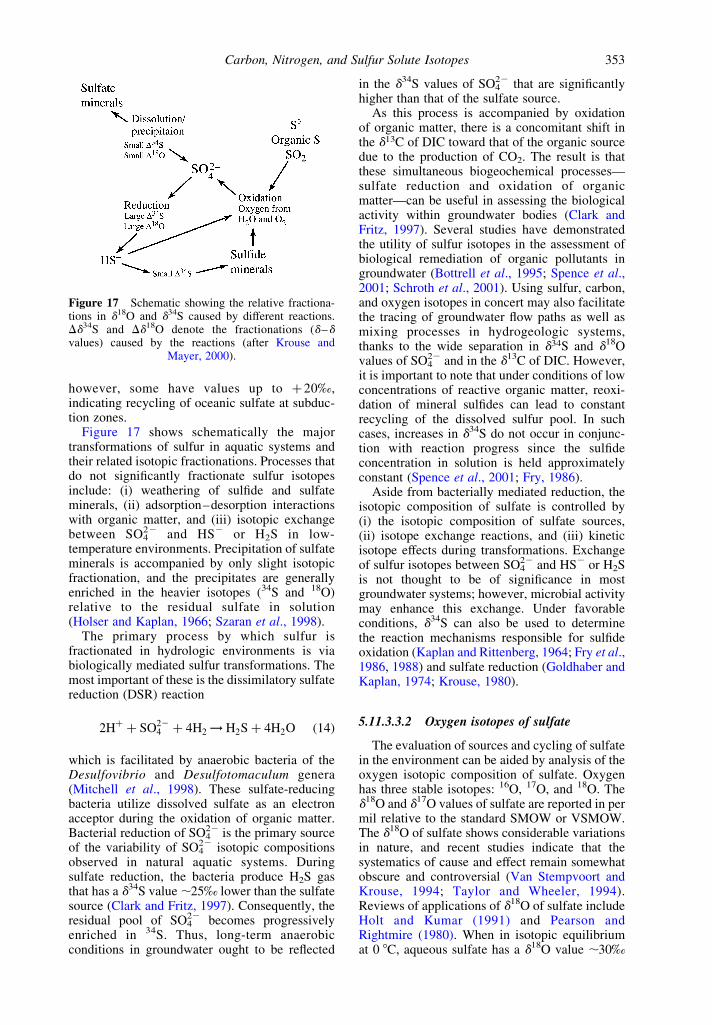
however, some have values up to þ20‰,indicating recycling of oceanic sulfate at subduc-tion zones.
Figure 17 shows schematically the majortransformations of sulfur in aquatic systems andtheir related isotopic fractionations. Processes thatdo not significantly fractionate sulfur isotopesinclude: (i) weathering of sulfide and sulfateminerals, (ii) adsorption–desorption interactionswith organic matter, and (iii) isotopic exchangebetween SO4
22 and HS2 or H2S in low-temperature environments. Precipitation of sulfateminerals is accompanied by only slight isotopicfractionation, and the precipitates are generallyenriched in the heavier isotopes (34S and 18O)relative to the residual sulfate in solution(Holser and Kaplan, 1966; Szaran et al., 1998).
The primary process by which sulfur isfractionated in hydrologic environments is viabiologically mediated sulfur transformations. Themost important of these is the dissimilatory sulfatereduction (DSR) reaction
2Hþ þ SO224 þ 4H2 ! H2S þ 4H2O ð14Þ
which is facilitated by anaerobic bacteria of theDesulfovibrio and Desulfotomaculum genera(Mitchell et al., 1998). These sulfate-reducingbacteria utilize dissolved sulfate as an electronacceptor during the oxidation of organic matter.Bacterial reduction of SO4
22 is the primary sourceof the variability of SO4
22 isotopic compositionsobserved in natural aquatic systems. Duringsulfate reduction, the bacteria produce H2S gasthat has a d34S value ,25‰ lower than the sulfatesource (Clark and Fritz, 1997). Consequently, theresidual pool of SO4
22 becomes progressivelyenriched in 34S. Thus, long-term anaerobicconditions in groundwater ought to be reflected
in the d34S values of SO422 that are significantly
higher than that of the sulfate source.As this process is accompanied by oxidation
of organic matter, there is a concomitant shift inthe d13C of DIC toward that of the organic sourcedue to the production of CO2. The result is thatthese simultaneous biogeochemical processes—sulfate reduction and oxidation of organicmatter—can be useful in assessing the biologicalactivity within groundwater bodies (Clark andFritz, 1997). Several studies have demonstratedthe utility of sulfur isotopes in the assessment ofbiological remediation of organic pollutants ingroundwater (Bottrell et al., 1995; Spence et al.,2001; Schroth et al., 2001). Using sulfur, carbon,and oxygen isotopes in concert may also facilitatethe tracing of groundwater flow paths as well asmixing processes in hydrogeologic systems,thanks to the wide separation in d34S and d18Ovalues of SO4
22 and in the d13C of DIC. However,it is important to note that under conditions of lowconcentrations of reactive organic matter, reoxi-dation of mineral sulfides can lead to constantrecycling of the dissolved sulfur pool. In suchcases, increases in d34S do not occur in conjunc-tion with reaction progress since the sulfideconcentration in solution is held approximatelyconstant (Spence et al., 2001; Fry, 1986).
Aside from bacterially mediated reduction, theisotopic composition of sulfate is controlled by(i) the isotopic composition of sulfate sources,(ii) isotope exchange reactions, and (iii) kineticisotope effects during transformations. Exchangeof sulfur isotopes between SO4
22 and HS2 or H2Sis not thought to be of significance in mostgroundwater systems; however, microbial activitymay enhance this exchange. Under favorableconditions, d34S can also be used to determinethe reaction mechanisms responsible for sulfideoxidation (Kaplan and Rittenberg, 1964; Fry et al.,1986, 1988) and sulfate reduction (Goldhaber andKaplan, 1974; Krouse, 1980).
5.11.3.3.2 Oxygen isotopes of sulfate
The evaluation of sources and cycling of sulfatein the environment can be aided by analysis of theoxygen isotopic composition of sulfate. Oxygenhas three stable isotopes: 16O, 17O, and 18O. Thed18O and d17O values of sulfate are reported in permil relative to the standard SMOW or VSMOW.The d18O of sulfate shows considerable variationsin nature, and recent studies indicate that thesystematics of cause and effect remain somewhatobscure and controversial (Van Stempvoort andKrouse, 1994; Taylor and Wheeler, 1994).Reviews of applications of d18O of sulfate includeHolt and Kumar (1991) and Pearson andRightmire (1980). When in isotopic equilibriumat 0 8C, aqueous sulfate has a d18O value ,30‰
Figure 17 Schematic showing the relative fractiona-tions in d18O and d34S caused by different reactions.Dd34S and Dd18O denote the fractionations (d–dvalues) caused by the reactions (after Krouse and
Mayer, 2000).
Carbon, Nitrogen, and Sulfur Solute Isotopes 353
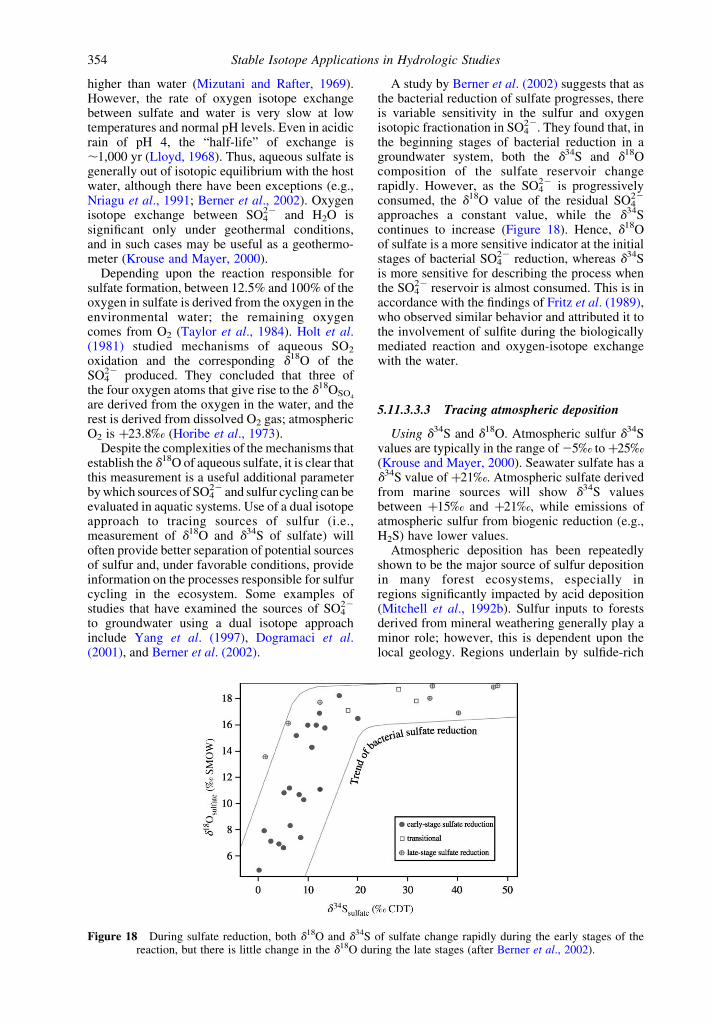
higher than water (Mizutani and Rafter, 1969).However, the rate of oxygen isotope exchangebetween sulfate and water is very slow at lowtemperatures and normal pH levels. Even in acidicrain of pH 4, the “half-life” of exchange is,1,000 yr (Lloyd, 1968). Thus, aqueous sulfate isgenerally out of isotopic equilibrium with the hostwater, although there have been exceptions (e.g.,Nriagu et al., 1991; Berner et al., 2002). Oxygenisotope exchange between SO4
22 and H2O issignificant only under geothermal conditions,and in such cases may be useful as a geothermo-meter (Krouse and Mayer, 2000).
Depending upon the reaction responsible forsulfate formation, between 12.5% and 100% of theoxygen in sulfate is derived from the oxygen in theenvironmental water; the remaining oxygencomes from O2 (Taylor et al., 1984). Holt et al.(1981) studied mechanisms of aqueous SO2
oxidation and the corresponding d18O of theSO4
22 produced. They concluded that three ofthe four oxygen atoms that give rise to the d18OSO4
are derived from the oxygen in the water, and therest is derived from dissolved O2 gas; atmosphericO2 is þ23.8‰ (Horibe et al., 1973).
Despite the complexities of the mechanisms thatestablish the d18O of aqueous sulfate, it is clear thatthis measurement is a useful additional parameterby which sources of SO4
22 and sulfur cycling can beevaluated in aquatic systems. Use of a dual isotopeapproach to tracing sources of sulfur (i.e.,measurement of d18O and d34S of sulfate) willoften provide better separation of potential sourcesof sulfur and, under favorable conditions, provideinformation on the processes responsible for sulfurcycling in the ecosystem. Some examples ofstudies that have examined the sources of SO4
22
to groundwater using a dual isotope approachinclude Yang et al. (1997), Dogramaci et al.(2001), and Berner et al. (2002).
A study by Berner et al. (2002) suggests that asthe bacterial reduction of sulfate progresses, thereis variable sensitivity in the sulfur and oxygenisotopic fractionation in SO4
22. They found that, inthe beginning stages of bacterial reduction in agroundwater system, both the d34S and d18Ocomposition of the sulfate reservoir changerapidly. However, as the SO4
22 is progressivelyconsumed, the d18O value of the residual SO4
22
approaches a constant value, while the d34Scontinues to increase (Figure 18). Hence, d18Oof sulfate is a more sensitive indicator at the initialstages of bacterial SO4
22 reduction, whereas d34Sis more sensitive for describing the process whenthe SO4
22 reservoir is almost consumed. This is inaccordance with the findings of Fritz et al. (1989),who observed similar behavior and attributed it tothe involvement of sulfite during the biologicallymediated reaction and oxygen-isotope exchangewith the water.
5.11.3.3.3 Tracing atmospheric deposition
Using d34S and d18O. Atmospheric sulfur d34Svalues are typically in the range of 25‰ to þ25‰(Krouse and Mayer, 2000). Seawater sulfate has ad34S value of þ21‰. Atmospheric sulfate derivedfrom marine sources will show d34S valuesbetween þ15‰ and þ21‰, while emissions ofatmospheric sulfur from biogenic reduction (e.g.,H2S) have lower values.
Atmospheric deposition has been repeatedlyshown to be the major source of sulfur depositionin many forest ecosystems, especially inregions significantly impacted by acid deposition(Mitchell et al., 1992b). Sulfur inputs to forestsderived from mineral weathering generally play aminor role; however, this is dependent upon thelocal geology. Regions underlain by sulfide-rich
Figure 18 During sulfate reduction, both d18O and d34S of sulfate change rapidly during the early stages of thereaction, but there is little change in the d18O during the late stages (after Berner et al., 2002).
Stable Isotope Applications in Hydrologic Studies354
shales can have mineral inputs exceeding thosederived from the atmosphere, while weathering ofore minerals and evaporites also contributes sulfur.Nriagu and Coker (1978) report that the d34S ofprecipitation in central Canada varies seasonallyfrom about þ2‰ to þ9‰, with the low valuescaused mainly by biological sulfur, whereas thehigh values reflect sulfur from fossil fuels.
The spatial distribution of d34S and the relativecontributions from marine versus continental(including anthropogenic combustion) sourcesin Newfoundland (Canada) have been monitoredby analyzing the d34S of rainfall and of lichens thatobtain all their sulfur from the atmos-phere (Wadleigh et al., 1996; Wadleigh andBlake, 1999). Wadleigh et al. (1996) report rain-water sulfate with d34S and d18O of ,þ4‰ andþ11‰, respectively, for a continental end-memberrepresentative of long-range sulfate transport. Themarine end-member has d34S ofþ21‰ and d18O ofþ9.5‰, representing sulfate in precipitationderived from sea spray. The study of epiphyticlichens (Wadleigh and Blake, 1999) yielded a“bulls-eye” d34S contour plot showing low valuesin the interior of the island that are probably relatedto anthropogenic point sources, and progressivelyhigher (more marine) values towards the coasts.These studies suggest that the study area isinfluenced by both marine (high d34S values) and
continental sources (lower d34S values), with thepossibility of anthropogenic influence from fossil-fuel powered plants.
Using d17O. Atmospheric sulfate (aerosol andrainfall) has recently been found to have a massindependent isotopic composition, with excess17O over what would have been expected based onthe d18O of sulfate (Lee et al., 2001). On a three-isotope plot with d17O on the x-axis and d18O onthe y-axis, mass-dependent fractionation (MDF)result in sulfate values defined by the relation:d17O ¼ 0.52d18O, whereas MIF causes valuesthat deviate from this relation. For sulfate, themass-independent relation is described byD17O ¼ d17O 20.52d18O (Lee et al., 2001).Hence, MDF results in D17O ¼ 0, whereas anMIF results in D17O – 0: d17O and D17O valuesreflect 17O/16O ratios, and are reported in per milrelative to SMOW.
The causes of the 17O anomalies of sulfate andother oxygen-bearing materials in the atmosphereand in extraterrestrial materials are the topic ofactive research. Aqueous-phase oxidation of S(IV)causes an MIF in sulfate only if the oxidant has anMIF oxygen isotopic composition (Lee et al.,2001). Hence, the anomalous d17O values ofatmospheric sulfate appear to be caused byinteractions with either O3 or H2O2, since thusfar they are the only known oxidants in theatmosphere with mass-independent oxygen iso-topic compositions (Johnson and Thiemens, 1997).
The discovery of the anomalous oxygenisotopic compositions of atmospheric sulfateprovides a new means for identifying sulfate ofatmospheric origin. Rainwater and aerosols fromsouthern California were found to have D17Ovalues in the range of 0‰ to þ1.5‰ (Lee et al.,2001). The average D17O of snow sulfate in theRocky Mountains (Colorado, USA) was þ1.3‰.Sulfate in ice cores, massive sulfate deposits, andDry Valley soils from various locations also haveMIF (Bao et al., 2000; Lee et al., 2001). Thereappears to be seasonality in the D17O of sulfate inprecipitation, with higher values in the winter andlower values in the summer, probably due toseasonal changes in climatic effects that favoraqueous phase S(IV) oxidation in winter relativeto summer (Lee and Thiemens, 2001).
Sulfate d17O can be used to identify the relativecontributions of atmospheric sulfate versus ter-restrial biological or geologic sources of sulfate tostreams. In the Rocky Mountains, stream-watersulfate had D17O values of þ0.2‰ to þ0.9‰(Johnson et al., 2001). Isotope mass-balancecalculations suggest that 20–40% of the sulfatewas atmospheric in origin, considerably lowerthan expected (Johnson et al., 2001). Combinedstudies using d34S, d18O, d17O, and 35S in alpinewatersheds in the Rocky Mountains show thatsulfur and oxygen cycling processes appear to bedecoupled (Kester et al., 2002), with atmosphericsulfur and oxygen having different residence timesin the catchment.
Using sulfur-35. Sulfur-35 (35S) is a naturallyproduced radioactive tracer (half-life ¼ 87 d) thatcan be used to trace the movement of atmos-pherically derived sulfate in the environment. It isformed in the atmosphere from cosmic ray spa-llation of 40Ar (Peters, 1959), and deposits on theEarth’s surface in precipitation or as dryfall.It can be used both to trace the timescalesfor movement of atmospheric sulfate throughthe hydrosphere and, in ideal cases, to trace themovement of young (,1 yr) water. It is an espe-cially useful tracer in regions away from the oceanwhere sulfate concentrations are relatively low.
The isotope was originally used by Cooper et al.(1991) to trace the movement of young sulfate in anarctic watershed. They found that sulfur depositedas precipitation is strongly adsorbed within thewatershed, and that most sulfur released to streamflow is derived from longer-term storage in soils,vegetation, or geologic materials. Further work(Michel et al., 2000) showed that 35S could be anespecially effective isotope in tracing movement ofyoung sulfate through an alpine watershed at LochVale watershed in the Rocky Mountains (Color-ado, USA). They found that ,50% of theatmospheric sulfate deposited in that watershedwas retained less than one year. This work is nowbeing expanded to include the use of the 17O
Carbon, Nitrogen, and Sulfur Solute Isotopes 355
anomaly to try to obtain a better estimate of thereal age of atmospheric sulfate leavingthe watershed (Kester et al., 2002). The isotopealso appears to be an effective tracer for sulfatecycling in small alpine lakes (Michel et al., 2002).
Sulfur-35 was also used to determine the sourceof the sulfate in stream water in a highly pollutedwatershed in the Czech Republic (Novak et al.,2003). The sulfate input to this watershed hasdecreased over the past decade because of newcontrols on sulfur emissions, but the watershedcontinues to export sulfate far in excess of theatmospheric loading at the present time. Measure-ment of 35S in runoff indicates that none of therecently deposited sulfate is exiting in the system.Apparently the atmospheric sulfate interacts withthe soil layers and consequently takes more than ayear to be removed from the watershed (Novaket al., 2003).
5.11.3.3.4 Sulfur in catchment surfacewaters
Sulfur occurs naturally in both organic andinorganic forms. In most forested catchments, thesulfur content of the catchment is largely in theorganic form stored within pools of organic matter(Mitchell et al., 1998). Carbon-bonded sulfur inorganic compounds is the dominant organic form,while sulfate is the primary form of inorganicsulfur in surface water systems. Organic sulfur isgenerally not labile; thus, fluxes of sulfur incatchments are often related solely to movementand transformation of inorganic sulfur, includingadsorption–desorption interactions with organicmatter (Mitchell et al., 1992a, 1994). Catchmentsthat contain a significant geologic component ofsulfur-bearing minerals will likely have sulfurbudgets that are dominated by weathering inputsinstead of atmospheric inputs.
Because sulfur isotope ratios are stronglyfractionated by biogeochemical processes, therehas been concern over whether d34S could be usedeffectively to separate sources of sulfur in shallowhydrological systems. Sulfur appears to be affectedby isotope fractionation processes in some catch-ments (Fuller et al., 1986; Hesslein et al., 1988;Andersson et al., 1992), but not in others (Caronet al., 1986; Stam et al., 1992). Andersson et al.(1992) explain the decreases in sulfate concen-trations and increases in d34S of stream flow duringthe summer by sulfate reduction in stagnant pools.Stam et al. (1992) suggest that the extent offractionation might be a function of water resi-dence time in the catchment, with steep catchmentsshowing less fractionation. They note thatincreases in d34S of stream sulfate during thewinter may be a result of micropore flow duringthe snow-covered period, instead of the moretypical macropore-flow characteristic of storms.
Intensive investigations of the sulfur dynamicsof forest ecosystems in the last decade can beattributed to the dominant role of sulfur as acomponent of acidic deposition. Studies inforested catchments include Fuller et al. (1986),Mitchell et al. (1989), Stam et al. (1992), andAndersson et al. (1992). Sulfur with a distinctiveisotopic composition has been used to identifypollution sources (Krouse et al., 1984), and hasbeen added as a tracer (Legge and Krouse, 1992;Mayer et al., 1992, 1993). Differences in thenatural abundances can also be used in systemswhere there is sufficient variation in the d34S ofecosystem components. Rocky Mountain lakes(USA), thought to be dominated by atmosphericsources of sulfate, have different d34S values thanlakes believed to be dominated by watershedsources of sulfate (Turk et al., 1993).
5.11.3.3.5 Sulfur in groundwater
Sulfur in groundwater is primarily in theoxidized sulfate species, SO4
22. Sulfate in ground-water can have several sources. These include: (i)dissolution of evaporite sulfate minerals such asgypsum and anhydrite, (ii) oxidation of sulfideminerals, (iii) atmospheric deposition, and (iv)mineralization of organic matter.
Production of sulfate in shallow groundwatervia the oxidation of sulfide minerals yields d34Svalues of the sulfate that are very similar to thoseof the source sulfides, because there is littleisotope fractionation during near-surface, low-temperature sulfide mineral oxidation (Toran andHarris, 1989). Although the sulfur isotopiccomposition of sulfide minerals can vary widelyin geologic materials, the isotopic compositions ofsulfur sources in a regional study area oftenfall within a narrow range (Krouse and Mayer,2000). Thus, sulfur isotopes can be useful foridentifying sources of sulfur species in ground-water as well as biogeochemical transformationsalong flow paths.
For example, d34S and d18O of SO422 was used to
assess mixing between a vertically stacked aquifersystem in contact with a salt dome located innorthern Germany (Berner et al., 2002). Two majorsulfate pools were identified based upon theirisotopic compositions: (i) SO4
22 from the dissol-ution of evaporite minerals, and (ii) SO4
22 derivedfrom atmospheric deposition and from the oxi-dation of pyrite. Using both the d34S and d18O ofthe SO4
22, zones of variable groundwater mixingand significant amounts of bacterial sulfatereduction were identified. The SO4
22 derivedfrom the dissolution of the rock salt in the highlysaline deep brine showed nearly constant d34Svalues between þ9.6‰ and 11.9‰ and d18Obetween þ9.5‰ and 12.1‰, consistent with thePermian evaporite deposits. Sulfate in near-surface
Stable Isotope Applications in Hydrologic Studies356
unconfined groundwater derived from riverinerecharge showed values more typical of meteoricsulfur mixed with oxidized sulfide minerals(d34S ¼ þ5.2‰; d18O ¼ þ8.2‰).
One complicating factor is the possibility ofsulfur recycling through subsequent oxidation–reduction of biologically reduced SO4
22. H2S gasproduced by the biological reduction of SO4
22 maybecome reoxidized, especially in near-surfaceaquifers or in mixing zones with more oxidizingwaters. The oxidation of this H2S will produce asecondary SO4
22 pool with a much lower d34S thanthe original source sulfate. This can result in adepth gradient in which higher d34S values ofsulfate are found at depth (partially reducingenvironment) while lower d34S values of sulfateare found in the more oxidizing environmentcloser to the surface or within mixing zones.
Some recent studies have shown that theidentification of arsenic-bearing sulfides andtheir contribution to arsenic loadings in ground-water and surface water used for drinking supplycan also be assessed using d34S (Sidle, 2002;Schreiber et al., 2000).
5.11.4 USE OF A MULTI-ISOTOPEAPPROACH FOR THEDETERMINATION OF FLOWPATHS AND REACTION PATHS
Flow paths are the individual runoff pathwayscontributing to surface flow in a catchment. Theseresult from runoff mechanisms that include, butare not limited to, saturation-excess overland flow,Hortonian overland flow, near-stream ground-water ridging, hill-slope subsurface flow throughthe soil matrix or macropores, and shalloworganic-layer flow. Knowledge of hydrologicflow paths in catchments is critical to thepreservation of public water supplies and theunderstanding of the transport of point and non-point-source pollutants (Peters, 1994).
Stable isotopes such as 18O and 2H are animproved alternative to traditional nonconserva-tive chemical tracers, because waters are oftenuniquely labeled by their isotopic compositions(Sklash and Farvolden, 1979; McDonnell andKendall, 1992), often allowing the separation ofwaters from different sources (e.g., new rainversus old pre-storm water). However, studieshave shown that flow paths cannot be identifiedto a high degree of certainty using d18O or d2Hdata and simple hydrograph separation tech-niques, because waters within the same flowpath can be derived from several differentsources (Ogunkoya and Jenkins, 1991). Thus,a number of plausible runoff mechanisms canbe consistent with the isotope data. The need toincorporate flow path dynamics is recognized as
a key ingredient in producing reliable chemicalmodels (Robson et al., 1992).
Reactive solute isotopes such as 13C, 34S, and87Sr can provide valuable information about flowpaths (not water sources) and reaction paths usefulfor geochemical and hydrologic modeling pre-cisely, because they can reflect the reactioncharacteristics of and taking place along specificflow paths (Bullen and Kendall, 1998). Thesereactive solute isotopes can serve as additionalthermodynamic constraints in geochemical com-puter models such as NETPATH (Plummer et al.,1991) for eliminating possible geochemicalreaction paths (Plummer et al., 1983; see Chapter5.14).
As an example, water isotopes were used todetermine the actual flow paths by which waterdischarging from Crystal Lake (Wisconsin, USA)mixed with regional groundwater and local rainrecharge while flowing across a narrow isthmusseparating the lake from Big Muskellunge Lake(Krabbenhoft et al., 1992, 1993; Bullen et al.,1996). Solute isotopes such as 87Sr and 13C, alongwith chemical data, were then used to identify thegeochemical reactions taking place along theseflow paths.
The waters flowing along mineralogicallydistinctive horizons are sometimes distinctivelylabeled by their chemical composition and by theisotopic compositions of solute isotopes such as13C, 87Sr, 34S, 15N, etc. For example, watersflowing through the soil zone often have d13Cvalues that are depleted in 13C relative to deepergroundwaters because of biogenic production ofcarbonic acid in organic soils (Kendall, 1993).These same shallow waters can also havedistinctive lead and strontium isotopic compo-sitions (Bullen and Kendall, 1998).
A multi-isotope approach can be particularlyuseful in tracing the reactions specific to a flowpath (Krabbenhoft et al., 1992, 1993). The soluteisotope tracers can be an especially powerful toolbecause they usually are affected by a smallernumber of processes than chemical constituents,making interpretation of changes in isotopiccomposition less ambiguous than the simul-taneous changes in solute concentrations(Kendall, 1993). In particular, the strengths ofone isotope may compensate for the weakness ofanother. For example, one of the concerns withusing d13C to trace carbon sources in catchmentsis that possible isotopic exchange of subsurfaceDIC with soil or atmospheric CO2 could allow thed13C of DIC to be “reset” so that the characteristic“geologic” signature of the calcite-derived carbonis lost (Kendall et al., 1992; Kendall, 1993). Sincestrontium isotopes are not affected by this kind ofexchange, the same samples can be analyzed forstrontium isotopes; if the strontium signature ofcalcite is distinctive, the correlation of changes in
Use of a Multi-isotope Approach 357
87Sr/86Sr and changes in d13C of subsurface waterscould provide evidence that calcite dissolutionwas occurring and that exchange was not aproblem (Bullen and Kendall, 1998).
If the chemical composition of waters along aspecific flow path is related to topography,mineralogy, initial water composition, and ante-cedent moisture conditions, then within a uniformsoil layer, the degree of geochemical evolution issome function of residence time. In this case, itmay be possible to link geochemical evolution ofwaters along specific flow paths to hydrologicmodels such as TOPMODEL (Beven and Kirkby,1979) by the testable assumption that residencetime—and hence degree of rock/water reaction—is primarily a function of topography. Alterna-tively, because TOPMODEL is used to predict thedifferent contributions from the different soilhorizons along the stream channel as the topo-graphic form of the hill-slope changes (Robsonet al., 1992), these predictions can be tested withappropriate isotope and chemical data. Futureadvances in watershed modeling, both concep-tually and mathematically, will require thecombined use of chemical and isotopic tracersfor calibration and validation.
5.11.5 SUMMARY AND CONCLUSIONS
The dominant use of isotopes in shallowhydrologic systems in the last few decades hasbeen to trace sources of waters and solutes.Generally, such data were evaluated with simplemixing models to determine how much water orsolute was derived from either of two (sometimesthree) constant-composition sources. The worlddoes not seem this simple anymore. With theexpansion of the field of isotope hydrology in thelast decade, made possible by the development andincreased availability of automated sample prep-aration and analysis systems for mass spec-trometers, we have documented considerableheterogeneity in the isotopic compositions ofrain, soil water, groundwater, and solute sources.In addition, hydrologists who utilize geochemicaltracers recognize that the degree of variabilityobserved is highly dependent upon the samplingfrequency, and more effort is being placed onevent-based studies with high-frequency sampling.We are still grappling with how to deal with thisheterogeneity in our hydrologic and geochemicalmodels. A major challenge is to use the variabilityas signal, not noise; the isotopes and chemistry areproviding very detailed information about sourcesand reactions in shallow systems, and the challengenow is to develop appropriate models to use thedata. In the past, much reliance was placed upon thestable isotopes of water (d18O, d2H) to reveal all ofthe information about the hydrologic processestaking place in a catchment. Today, we
acknowledge that the best approach is to combineas many tracers as possible, including solutes andsolute isotopes. This integration of chemical andisotopic data with complex hydrologic and geo-chemical models constitutes an important frontierof hydrologic research.
ACKNOWLEDGMENTS
The authors would like to thank Thomas D.Bullen, Michael G. Sklash, and Eric A. Caldwellfor their contributions to chapters that wereextensively mined to produce an early draft ofthis chapter: Kendall et al. (1995a), Bullen andKendall (1998), and Kendall and Caldwell (1998).
REFERENCES
Aleem M. I. H., Hoch G. E., and Varner J. E. (1965) Water asthe source of oxidant and reductant in bacterial chemosyn-thesis. Biochemistry 54, 869–873.
Amberger A. and Schmidt H. L. (1987) Naturliche isotopen-gehalte von nitrat als indikatoren fur dessen herkunft.Geochim. Cosmochim. Acta 51, 2699–2705.
Amoitte-Suchet P., Aubert D., Probst J. L., Gauthier-Lafaye F.,Probst A., Andreux F., and Viville D. (1999) d13C pattern ofdissolved inorganic carbon in a small granitic catchment: theStrengbach case study (Vosges mountains, France). Chem.Geol. 159, 129–145.
Amundson R., Stern L., Baisden T., and Wang Y. (1998) Theisotopic composition of soil and soil-respired CO2. Geo-derma 82, 83–114.
Andersson K. K. and Hooper A. B. (1983) O2 and H2O are eachthe source of one O in NO2 produced from NH3 byNitrosomonas: 15N–NMR evidence. FEBS Lett. 164(2),236–240.
Andersson P., Torssander P., and Ingri J. (1992) Sulphurisotope ratios in sulphate and oxygen isotopes in water froma small watershed in central Sweden. Hydrobiologia 235/236, 205–217.
Aravena R. and Robertson W. D. (1998) Use of multipleisotope tracers to evaluate denitrification in groundwater:case study of nitrate from a large-flux septic system plume.Ground Water 31, 180–186.
Aravena R. and Wassenaar L. I. (1993) Dissolved organiccarbon and methane in a regional confined aquifer,southernOntario, Canada: carbon isotope evidence for associatedsubsurface sources. Appl. Geochem. 8, 483–493.
Aravena R., Schiff S. L., Trumbore S. E., Dillon P. J., andElgood R. (1992) Evaluating dissolved inorganic carboncycling in a forested lake watershed using carbon isotopes.Radiocarbon 34(3), 636–645.
Aravena R., Evans M. L., and Cherry J. A. (1993) Stableisotopes of oxygen and nitrogen in source identification ofnitrate from septic systems. Ground Water 31, 180–186.
Atekwana E. A. and Krishnamurthy R. V. (1998) Seasonalvariations of dissolved inorganic carbon and d13C of surfacewaters: application of a modified gas evolution technique.J. Hydrol. 205, 26–278.
Aucour A., Sheppard S. M. F., Guyomar O., and Wattelet J.(1999) Use of 13C to trace origin and cycling of inorganiccarbon in the Rhone River system. Chem. Geol. 159,87–105.
Bajjali W. and Abu-Jaber N. (2001) Climatological signals ofthe paleogroundwater in Jordan. J. Hydrol. 243, 133–147.
Bao H., Campbell D. A., Bockheim J. G., and Thiemens M. H.(2000) Origins of sulphate in Antarctic dry-valley soils asdeduced from anomalous 17O compositions. Nature 407,499–502.
Stable Isotope Applications in Hydrologic Studies358
Battaglin W. A., Kendall C., Chang C. C. Y., Silva S. R., andCampbell D. H. (2001) Chemical and Isotopic Compositionof Organic and Inorganic Samples from the MississippiRiver and its Tributaries, 1997–98. USGS Water ResourcesInvestigation Report 01-4095, 57p.
Behrens H., Moser H., Oerter H., Rauert W., Stichler W.,Ambach W., and Kirchlechner P. (1979) Models for the run-off from a glaciated catchment area using measurements ofenvironmental isotope contents. In Isotope Hydrology 1978(ed. IAEA). IAEA, Vienna, pp. 829–846.
Berner Z. A., Stuben D., Leosson M. A., and Klinge H. (2002)S- and O-isotopic character of dissolved sulphate in thecover rock aquifers of a Zechstein salt dome. Appl.Geochem. 17, 1515–1528.
Beven K. J. and Kirkby M. J. (1979) A physically based,variable contributing model of basin hydrology. Hydrol. Sci.Bull. 10, 43–69.
Bishop K. H. (1991) Episodic increases in stream acidity,catchment flow pathways and hydrograph separation. PhDThesis, University Cambridge.
Bohlke J. K. (2002) Groundwater recharge and agriculturalcontamination. Hydrol. J. 10, 153–179.
Bohlke J. K. and Denver J. M. (1995) Combined use of ground-water dating, chemical, and isotopic analyses to resolve thehistory and fate of nitrate contamination in two agriculturalwatersheds, Atlantic coastal plain, Maryland. Water Resour.Res. 31, 2319–2339.
Bohlke J. K., Eriksen G. E., and Revesz K. (1997) Stableisotope evidence for an atmospheric origin of desert nitratedeposits in northern Chile and southern California USA.Isotope Geosci. 136, 135–152.
Bottcher J., Strebel O., Voerkelius S., and Schmidt H. L. (1990)Using isotope fractionation of nitrate–nitrogen and nitrate–oxygen for evaluation of microbial denitrification in a sandyaquifer. J. Hydrol. 114, 413–424.
Bottrell S. H., Hayes P. J., Bannon M., and Williams G. M.(1995) Bacterial sulfate reduction and pyrite formation in apolluted sand aquifer. Geomicrobiol. J. 13(2), 75–90.
Brinkmann R., Eichler R., Ehhalt D., and Munnich K. O.(1963) Uber den deuterium-gehalt von niederschlags-undgrundwasser. Naturwissenschaften 19, 611–612.
Bullen T. D. and Kendall C. (1991) 87Sr/86Sr and 13C as tracers ofinterstream and intrastorm variations in water flowpaths,Catoctim Mountain, MD. Trans. Am. Geophys. Union 72, 218.
Bullen T. D. and Kendall C. (1998) Tracing of weatheringreactions and water flowpaths: a multi-isotope approach. InIsotope Tracers in Catchment Hydrology (eds. C. Kendalland J. J. McDonnell). Elsevier, Amsterdam, pp. 611–646.
Bullen T. D., Krabbenhoft D. P., and Kendall C. (1996)Kinetic and mineralogic controls on the evolution of ground-water chemistry and 87Sr/86Sr in a sandy silicate aquifer,northern Wisconsin. Geochim. Cosmochim. Acta 60,1807–1821.
Burns D. A. and Kendall C. (2002) Analysis of d15N and d18Oto differentiate NO32sources in runoff at two watersheds inthe Catskill Mountains of New York. Water Resour. Res. 3814-1–14-11.
Buttle J. M. (1998) Fundamentals of small catchment hydrology.In Isotope Tracers in Catchment Hydrology (eds. C. Kendalland J. J. McDonnell). Elsevier, Amsterdam, pp. 1–49.
Buttle J. M. and Sami K. (1990) Recharge processes duringsnowmelt: an isotopic and hydrometric investigation.Hydrol. Process. 4, 343–360.
Campbell D. H., Kendall C., Chang C. C. Y., Silva S. R., andTonnessen K. A. (2002) Pathways for nitrate release from analpine watershed: determination using d15N and d18O. WaterResour. Res. 38 9-1–9-11.
Caron F. A., Tessier A., Kramer J. R., Schwarcz H. P., and ReesC. E. (1986) Sulfur and oxygen isotopes of sulfate inprecipitation and lakewater, Quebec, Canada. Appl.Geochem. 1, 601–606.
Carothers W. W. and Kharaka Y. K. (1980) Stablecarbon isotopes of HCO3
2 in oil-field waters- implications
for the origin of CO2. Geochim. Cosmochim. Acta 44,323–332.
Cerling T. E., Solomon D. K., Quade J., and Bowman J. R.(1991) On the isotopic composition of carbon in soil carbondioxide. Geochim. Cosmochim. Acta 55, 3404–3405.
Chang C. C. Y., Kendall C., Silva S. R., Battaglin W. A., andCampbell D. H. (2002) Nitrate stable isotopes: tools fordetermining nitrate sources and patterns among sites withdifferent land uses in the Mississippi Basin. Can. J. Fish.Aquat. Sci. 59 1874–1885.
Claassen H. C. and Downey J. S. (1995) A model for deuteriumand oxygen-18 isotope changes during evergreen intercep-tion of snowfall. Water Resour. Res. 31(3), 601–618.
Clark I. D. and Fritz P. (1997) Environmental Isotopes inHydrogeology. CRC Press, New York.
Cook P. and Herczeg A. L. (eds.) (2000) Environmental Tracersin Subsurface Hydrology, Kluwer Academic, Norwell, MA.
Cooper L. W., Olsen C. R., Solomon D. K., Larsen I. L., CookR. B., and Grebmeier J. M. (1991) Stable isotopes of oxygenand natural and fallout radionuclides used for tracing runoffduring snowmelt in an arctic watershed. Water Resour. Res.27, 2171–2179.
Coplen T. B. (1996) New guidelines for reporting stablehydrogen, carbon and oxygen isotope-ratio data. Geochim.Cosmochim. Acta 60, 3359–3360.
Coplen T. B. and Kendall C. (2000) Stable Hydrogen andOxygen Isotope Ratios for Selected Sites of the USGeological Survey’s Nasqan and Benchmark Surface-waterNetworks. US Geol. Surv., Open-file Report. 00-160, 424.
Coplen T. B., Herczeg A. L., and Barnes C. (2000) Isotopeengineering—using stable isotopes of the water molecule tosolve practical problems. In Environmental Tracers inSubsurface Hydrology (eds. P. Cook and A. Herzceg).Kluwer Academic, Norwell, MA, pp. 79–110.
Craig H. (1961a) Isotopic variations in meteoric waters.Science 133, 1702–1703.
Craig H. (1961b) Standard for reporting concentrations ofdeuterium and oxygen-18 in natural waters. Science 133,1833.
Criss R. E. (1999) Principles of Stable Isotope Distribution.Oxford University Press, New York, pp. 123–128.
Davidson G. R. (1995) The stable isotopic composition andmeasurement of carbon in soil CO2. Geochim. Cosmochim.Acta 59, 2485–2489.
Deak J. and Coplen T. B. (1996) Identification of Pleistoceneand Holocene groundwaters in Hungary using oxygen andhydrogen isotopic ratios. In Isotopes in Water ResourcesManagement, IAEA, Vienna, vol. 1, 438p.
Deines P. (1980) The isotopic composition of reduced organiccarbon. In Handbook of Environmental Isotope Geochem-istry (eds. P. Fritz and J. Ch. Fontes). Elsevier, Amsterdam,vol. 1, pp. 329–406.
Deines P., Langmuir D., and Harmon R. S. (1974) Stablecarbon isotope ratios and the existence of a gas phase in theevolution of carbonate ground waters. Geochim. Cosmo-chim. Acta 38, 1147–1164.
DeWalle D. R. and Swistock B. E. (1994) Differences inoxygen-18 content of throughfall and rainfall in hardwoodand coniferous forests. Hydrol. Process. 8, 75–82.
DeWalle D. R., Swistock B. R., and Sharpe W. E. (1988)Three-component tracer model for stormflow on a smallAppalachian forested catchment. J. Hydrol. 104, 301–310.
Doctor D. H. (2002) The hydrogeology of the classical karst(Kras) aquifer of southwestern Slovenia. PhD Dissertation,University of Minnesota.
Dogramaci S. S., Herczeg A. L., Schiff S. L., and Bone Y.(2001) Controls on d34S and d18O of dissolved SO4 inaquifers of the Murray Basin, Australia and their use asindicators of flow processes. Appl. Geochem. 16, 475–488.
Dorr H. and Munnich K. O. (1980) Carbon-14 and carbon-13 insoil CO2. Radiocarbon 22, 909–918.
Durka W., Schulze E. D., Gebauer G., and Voerkelius S.(1994) Effects of forest decline on uptake and leaching
References 359
of deposited nitrate determined from 15N and 18O measure-ments. Nature 372, 765–767.
Dutton A. R. and Simpkins W. W. (1989) Isotopic evidence forpaleohydrologic evolution of ground-water flowpaths,southern Great Plains, United States. Geology 17(7),653–656.
Faure G. (1986) Principles of Isotope Geology, 2nd edn. Wiley,New York, 589p.
Fogel M. L. and Cifuentes L. A. (1993) Isotope fractionationduring primary production. In Organic Geochemistry (eds.M. H. Engel and S. A. Macko). Plenum, New York,pp. 73–98.
Fogg G. E., Rolston D. E., Decker D. L., Louie D. T., andGrismer M. E. (1998) Spatial variation in nitrogen isotopevalues beneath nitrate contamination sources. Ground Water36, 418–426.
Fontes J.-C. (1981) Palaeowaters. In Stable IsotopeHydrology—Deuterium and Oxygen-18 in the WaterCycle. Technical Reports Series no. 2101. IAEA, Vienna,pp. 273–302.
Fontes J.-C., Andrews J. N., Edmunds W. M., Guerre A., andTravi Y. (1991) Paleorecharge by the Niger River (Mali)deduced from groundwater geochemistry. Water Resour.Res. 27(2), 199–214.
Fontes J.-C., Gasse F., and Andrews J. N. (1993) Climaticconditions of Holocene groundwater recharge in the Sahelzone of Africa. In Isotope Techniques in the Study of Past andCurrent Environmental Changes in the Hydrosphere and theAtmosphere. IAEA, Vienna, pp. 271–292.
Friedman I., Redfield A. C., Schoen B., and Harris J. (1964)The variation of the deuterium content of natural waters inthe hydrologic cycle. Rev. Geophys. 2, 1–124.
Fritz P. (1981) River waters. In Stable Isotope Hydrology:Deuterium and Oxygen-18 in the Water Cycle. IAEA,Vienna, pp. 177–201.
Fritz P., Basharmal G. M., Drimmie R. J., Ibsen J., and QureshiR. M. (1989) Oxygen isotope exchange between sulphateand water during bacterial reduction of sulphate. Chem.Geol. 79, 99–105.
Fry B. (1986) Stable sulphur isotopic distributions and sulphatereduction in lake-sediments of the Adirondack Mountains,New York. Biogeochemistry 2(4), 329–343.
Fry B. (1991) Stable isotope diagrams of freshwater foodwebs.Ecology 72, 2293–2297.
Fry B., Cox J., Gest H., and Hayes J. M. (1986) Discriminationbetween 34S and 32S during bacterial metabolism ofinorganic sulfur compounds. J. Bacteriol. 165, 328–330.
Fry B., Ruf W., Gest H., and Hayes J. M. (1988) Sulfur isotopeeffects associated with oxidation of sulfide by O2 in aqueoussolution. Chem. Geol. 73, 205–210.
Fuller R. D., Mitchell M. J., Krouse H. R., Syskowski B. J., andDriscoll C. T. (1986) Stable sulfur isotope ratios as a tool forinterpreting ecosystem sulfur dynamics. Water Air SoilPollut. 28, 163–171.
Garrels R. M. and Mackenzie F. T. (1971) Evolution ofSedimentary Rocks. W. W. Norton.
Garten C. T., Jr. and Hanson P. J. (1990) Foliar retention of15N-nitrate and 15N-ammonium by red maple (Acer rubrum)and white oak (Quercus alba) leaves from simulated rain.Environ. Exp. Bot. 30, 33–342.
Gat J. R. (1980) The isotopes of hydrogen and oxygen inprecipitation. In Handbook of Environmental IsotopeGeochemistry (eds. P. Fritz and J. Ch. Fontes). Elsevier,Amsterdam, pp. 21–47.
Gat J. R. and Gonfiantini R. (eds.) (1981) Stable IsotopeHydrology–Deuterium and Oxygen-18 in the Water Cycle.Technical Reports Series #210. IAEA, Vienna, 337pp.
Gat J. R. and Tzur Y. (1967) Modification of the isotopiccomposition of rainwater by processes which occur beforegroundwater recharge. Isotope Hydrol.: Proc. Symp. IAEA,Vienna, pp. 49–60.
Genereux D. P. (1998) Quantifying uncertainty in tracer-basedhydrograph separations. Water Resour. Res. 34, 915–920.
Genereux D. P. and Hemond H. F. (1990) Naturally occurringradon 222 as a tracer for stream flow generation: steady statemethodology and field example. Water Resour. Res. 26,3065–3075.
Genereux D. P. and Hooper R. P. (1998) Oxygen and hydrogenisotopes in rainfall-runoff studies. In Isotope Tracers inCatchment Hydrology (eds. C. Kendall and J. J. McDonnell).Elsevier, Amsterdam, pp. 319–346.
Genereux D. P., Hemond H. F., and Mulholland P. J. (1993)Use of radon-222 and calcium as tracers in a three-end-member mixing model for stream flow generation on thewest fork of Walker branch watershed. J. Hydrol. 142,167–211.
Ging P. B., Lee R. W., and Silva S. R. (1996) Water chemistryof Shoal Creak and Waller Creek, Austin Texas, andpotential sources of nitrate. U.S. Geological Survey WaterResources Investigations, Rep. #96-4167.
Goldhaber M. B. and Kaplan I. R. (1974) The sulphur cycle. InThe Sea (ed. E. D. Goldberg). Wiley, vol. 5, pp. 569–655.
Gormly J. R. and Spalding R. F. (1979) Sources andconcentrations of nitrate-nitrogen in ground water of theCentral Platte region, Nebraska. Ground Water 17, 291–301.
Harris D. M., McDonnell J. J., and Rodhe A. (1995)Hydrograph separation using continuous open-system iso-tope mixing. Water Resour. Res. 31, 157–171.
Heaton T. H. E. (1990) 15N/14N ratios of NOx from vehicleengines and coal-fired power stations. Tellus 42B, 304–307.
Helie J.-F., Hillaipre-Marcel C., and Rondeau B. (2002) Sea-sonal changes in the sources and fluxes of dissolvedinorganic carbon through the St. Lawrence River—isotopicand chemical constraint. Chem. Geol. 186, 117–138.
Hesslein R. H., Capel M. J., and Fox D. E. (1988) Stableisotopes in sulfate in the inputs and outputs of a Canadianwatershed. Biogeochemistry 5, 263–273.
Hewlett J. D. and Hibbert A. R. (1967) Factors affecting theresponse of small watersheds to precipitation in humid areas.Proc. 1st Int. Symp. Forest Hydrol. 275–290.
Hinton M. J., Schiff S. L., and English M. C. (1994) Examiningthe contributions of glacial till water to storm runoff usingtwo-and three-component hydrograph separations. WaterResour. Res. 30, 983–993.
Hinton M. J., Schiff S. L., and English M. C. (1998) Sourcesand flowpaths of dissolved organic carbon in two forestedwatersheds of the Precambrian Shield. Biogeochemistry 41,175–197.
Holser W. T. and Kaplan I. R. (1966) Isotope geochemistry ofsedimentary sulfates. Chem. Geol. 1, 93–135.
Holt B. D. and Kumar R. (1991) Oxygen isotope fractionationfor understanding the sulphur cycle. In Stable Isotopes:Natural and Anthropogenic Sulphur in the Environment,SCOPE 43 (Scientific Committee on Problems of theEnvironment) (eds. H. R. Krouse and V. A. Grinenko).Wiley, pp. 27–41.
Holt B. D., Cunningham P. T., and Kumar R. (1981) Oxygenisotopy of atmospheric sulfates. Environ. Sci. Tech. 15,804–808.
Hooper R. P. and Shoemaker C. A. (1986) A comparison ofchemical and isotopic hydrograph separation. Water Resour.Res. 22, 1444–1454.
Hooper R. P., Christophersen N., and Peters N. E. (1990)Modelling streamwater chemistry as a mixture of soilwaterend-members—an application to the Panolan Mountaincatchment, Georgia, USA. J. Hydrol. 116, 321–343.
Horibe Y., Shigehara K., and Takakuwa Y. (1973) Isotopeseparation factors of carbon dioxide-water system andisotopic composition of atmospheric oxygen. J. Geophys.Res. 78, 2625–2629.
Horita J. (1989) Analytical aspects of stable isotopes in brines.Chem. Geol. 79, 107–112.
Hubner H. (1986) Isotope effects of nitrogen in the soil andbiosphere. In Handbook of Environmental Isotope Geo-chemistry, 2b, The Terrestrial Environment (eds. P. Fritz andJ. C. Fontes). Elsevier, Amsterdam, pp. 361–425.
Stable Isotope Applications in Hydrologic Studies360
Johnson J. C. and Thiemens M. (1997) The isotopiccomposition of tropospheric ozone in three environments.J. Geophys. Res. 102, 25395–25404.
Johnson C. A., Mast M. A., and Kester C. L. (2001) Use of17O/16O to trace atmospherically deposited sulfate in surfacewaters: a case study in alpine watersheds in the RockyMountains. Geophys. Res. Lett. 28, 4483–4486.
Junk G. and Svec H. (1958) The absolute abundance of thenitrogen isotopes in the atmosphere and compressed gasfrom various sources. Geochim. Cosmochim. Acta 14,234–243.
Kaplan I. R. and Rittenberg S. C. (1964) Microbiologicalfractionation of sulphur isotopes. J. Gen. Microbiol. 34,195–212.
Karamanos E. E., Voroney R. P., and Rennie D. A. (1981)Variation in natural 15N abundance of central Saskatchewansoils. Soil. Sci. Soc. Am. J. 45, 826–828.
Karim A. and Veizer J. (2000) Weathering processes in theIndus River Basin: implications from riverine carbon, sulfur,oxygen and strontium isotopes. Chem. Geol. 170, 153–177.
Kendall C. (1993) Impact of Isotopic Heterogeneity in ShallowSystems on Stormflow Generation. PhD Dissertation,University of Maryland, College Park.
Kendall C. (1998) Tracing nitrogen sources and cycling incatchments. In Isotope Tracers in Catchment Hydrology(eds. C. Kendall and J. J. McDonnell). Elsevier, Amsterdam,pp. 519–576.
Kendall C. and Aravena R. (2000) Nitrate isotopes ingroundwater systems. In Environmental Tracers in Subsur-face Hydrology (eds. P. Cook and A. Herzceg). KluwerAcademic, Norwell, MA, pp. 261–298.
Kendall C. and Caldwell E. A. (1998) Fundamentals of isotopegeochemistry. In Isotope Tracers in Catchment Hydrology(eds. C. Kendall and J. J. McDonnell). Elsevier, Amsterdam,pp. 51–86.
Kendall C. and Coplen T. B. (2001) Distribution of oxygen-18and deuterium in river waters across the United States.Hydrol. Process. 15, 1363–1393.
Kendall C. and McDonnell J. J. (1993) Effect of intrastormheterogeneities of rainfall, soil water and groundwater onrunoff modelling. In Tracers in Hydrology, Int. Assoc.Hydrol. Sci. Publ. #215, July 11–23, 1993 (eds. N. E. Peterset al.) Yokohama, Japan, pp. 41–49.
Kendall C. and McDonnell J. J. (eds.) (1998) Isotope Tracers inCatchment Hydrology. Elsevier, 839pp. http://www.rcamnl.wr.usgs.gov/isoig/isopubs/itchinfo.html.
Kendall C., Mast M. A., and Rice K. C. (1992) Tracingwatershed weathering reactions with d13C. In Water–RockInteraction, Proc. 7th Int. Symp., Park City, Utah (eds. Y. K.Kharaka and A. S. Maest). Balkema, Rotterdam,pp. 569–572.
Kendall C., Sklash M. G., and Bullen T. D. (1995a) Isotopetracers of water and solute sources in catchments. In SoluteModelling in Catchment Systems (ed. S. Trudgill). Wiley,Chichester, UK, pp. 261–303.
Kendall C., Campbell D. H., Burns D. A., Shanley J. B., SilvaS. R., and Chang C. C. Y. (1995b) Tracing sources of nitratein snowmelt runoff using the oxygen and nitrogen isotopiccompositions of nitrate. In Biogeochemistry of SeasonallySnow-covered Catchments, Proc., July 3–14, 1995 (eds.K. Tonnessen, M. Williams, and M. Tranter). Int. Assoc.Hydrol. Sci., Boulder Co., pp. 339–347.
Kendall C., McDonnell J. J., and Gu W. (2001a) A look inside‘black box’ hydrograph separation models: a study at theHydrohill catchment. Hydrol. Process. 15, 1877–1902.
Kendall C., Silva S. R., and Kelly V. J. (2001b) Carbon andnitrogen isotopic compositions of particulate organic matterin four large river systems across the United States. Hydrol.Process. 15, 1301–1346.
Kennedy V. C., Kendall C., Zellweger G. W., Wyermann T. A.,and Avanzino R. A. (1986) Determination of the com-ponents of stormflow using water chemistry and environ-
mental isotopes, Mattole River Basin, California. J. Hydrol.84, 107–140.
Kester C. L., Johnson C. A., Mast M. A., Clow D. W., andMichel R. L. (2002) Tracing atmospheric sulfate through asubalpine ecosystem using 17O and 35S. EOS, Trans., AGU.83, no. 47.
Kirchner J. W., Feng X., and Neal C. (2001) Catchment-scaleadvection and dispersion as a mechanism for fractal scalingin stream tracer concentrations. J. Hydrol. 254, 82–101.
Koba K., Tokuchi N., Wada E., Nakajima T., and Iwatsubo G.(1997) Intermittent denitrification: the application of a 15Nnatural abundance method to a forested ecosystem. Geo-chim. Cosmochim. Acta 61, 5043–5050.
Krabbenhoft D. P., Bullen T. D., and Kendall C. (1992)Isotopic indicators of groundwater flow paths in a northernWisconsin aquifer. AGU Trans. 73, 191.
Krabbenhoft D. P., Bullen T. D., and Kendall C. (1993) Use ofmultiple isotope tracers as monitors of groundwater-lakeinteraction. AGU Trans. 73, 191.
Kreitler C. W. (1975) Determining the source of nitrate ingroundwater by nitrogen isotope studies: Austin, Texas,University of Texas, Austin, Bureau Econ. Geol. Rep. Inv.#83.
Kreitler C. W. (1979) Nitrogen-isotope ratio studies of soilsand groundwater nitrate from alluvial fan aquifers in Texas.J. Hydrol. 42, 147–170.
Kreitler C. W. and Jones D. C. (1975) Natural soil nitrate: thecause of the nitrate contamination of groundwater in RunnelsCounty, Texas. Ground Water 13, 53–61.
Kreitler C. W., Ragone S. E., and Katz B. G. (1978) 15N/14Nratios of ground-water nitrate, Long Island, NY. GroundWater 16, 404–409.
Krouse H. R. (1980) Sulfur isotopes in our environment.In Handbook of Environmental Isotope Geochemistry(eds. P. Fritz and J. Ch. Fontes). Elsevier, Amsterdam,pp. 435–471.
Krouse H. R. and Grinenko V. A. (eds.) (1991) Stable Isotopes:Natural and Anthropogenic Sulphur in the Environment,SCOPE 43 (Scientific Committee on Problems of theEnvironment). Wiley, UK.
Krouse H. R. and Mayer B. (2000) Sulphur and oxygenisotopes in sulphate. In Environmental Tracers in SubsurfaceHydrology (eds. P. Cook and A. Herzceg). KluwerAcademic, Norwell, MA, pp. 195–231.
Krouse H. R., Legge A., and Brown H. M. (1984) Sulphur gasemissions in the boreal forest: the West Whitecourt casestudy V: stable sulfur isotopes. Water Air Soil Pollut. 22,321–347.
Lee C. C.-W. and Thiemens M. H. (2001) Use of 17O/16O totrace atmospherically deposited sulfate in surface waters: acase study in alpine watersheds in the Rocky Mountains.Geophys. Res. Lett. 28, 4483–4486.
Lee C. C.-W., Savarino J., and Thiemens M. H. (2001) Massindependent oxygen isotopic composition of atmosphericsulfate: origin and implications for the present and pastatmosphere of Earth and Mars. Geophys. Res. Lett 28,1783–1786.
Legge A. H. and Krouse H. R. (1992) An assessment of theenvironmental fate of industrial sulphur in a temperate pineforest ecosystem (Paper 1U22B.01). In Critical Issues in theGlobal Environment, vol. 5. Ninth World Clean AirCongress Towards Year 2000.
Likens G. E., Wright R. F., Galloway J. N., and Butler T. J.(1979) Acid rain. Sci. Am. 241, 43–50.
Lloyd R. M. (1968) Oxygen isotope behavior in the sulfate-water system. J. Geophys. Res. 73, 6099–6110.
Macko S. A. and Ostrom N. E. (1994) Pollution studies usingnitrogen isotopes. In Stable Isotopes in Ecology andEnvironmental Science (eds. K. Lajtha and R. M. Michener).Blackwell, Oxford, pp. 45–62.
MacNamara J. and Thode H. G. (1950) Comparison of theisotopic composition of terrestrial and meteoritic sulfur.Phys. Rev. 78, 307–308.
References 361

Maloszewski P. and Zuber A. (1996) Lumped parametermodels for interpretation of environmental tracer data. InManual on Mathematical Models in Isotope Hydrologeology(IAEA TECHDOC 910). IAEA, Vienna, pp. 9–58.
Mariotti A., Landreau A., and Simon B. (1988) 15N isotopebiogeochemistry and natural denitrification process ingroundwater: application to the chalk aquifer of northernFrance. Geochim. Cosmochim. Acta 52, 1869–1878.
Mariotti A., Pierre D., Vedy J. C., Bruckert S., and GuillemotJ. (1980) The abundance of natural nitrogen 15 in the organicmatter of soils along an altitudinal gradient (Chablais, HauteSavoie, France). Catena 7, 293–300.
Mayer B., Fritz P., and Krouse H. R. (1992) Sulphur isotopediscrimination during sulphur transformations in aeratedforest soils. In Workshop Proceedings on Sulphur Trans-formations in Soil Ecosystems (eds. M. J. Hendry andH. R. Krouse). National Hydrology Research SymposiumNo. 11, Saskatoon, Sakatchewan, November 5–7, 1992,pp. 161–172.
Mayer B., Krouse H. R., Fritz P., Prietzel J., and Rehfuess K. E.(1993) Evaluation of biogeochemical sulfur transforma-tions in forest soils by chemical and isotope data. In Tracersin Hydrology, IAHS Publ. No. 215, pp. 65–72.
Mayer B., Bollwerk S. M., Mansfeldt T., Hutter B., and VezierJ. (2001) The oxygen isotopic composition of nitrategenerated by nitrification in acid forest floors. Geochim.Cosmochim. Acta 65(16), 2743–2756.
Mayer B., Boyer E., Goodale C., Jawoarski N., van Bremen N.,Howarth R., Seitzinger S., Billen G., Lajtha K., NadelhofferK., Van Dam D., Hetling L., Nosil M., Paustian K., andAlexander R. (2002) Sources of nitrate in rivers draining 16major watersheds in the northeastern US: isotopic con-straints. Biochemistry 57/58, 171–192.
McDonnell J. J. and Kendall C. (1992) Isotope tracers inhydrology—report to the hydrology section. EOS, Trans.,AGU 73, 260–261.
McDonnellJ.J.,BonellM.,StewartM.K.,andPearceA.J.(1990)Deuteriumvariations in stormrainfall: implications for streamhydrograph separations. Water Resour. Res. 26, 455–458.
McDonnell J. J., Stewart M. K., and Owens I. F. (1991) Effectof catchment-scale subsurface mixing on stream isotopicresponse. Water Resour. Res. 27, 3065–3073.
McDonnell J. J., Rowe L., and Stewart M. (1999) A combinedtracer-hydrometric approach to assessing the effects ofcatchment scale on water flowpaths, source and age. Int.Assoc. Hydrol. Sci. Publ. 258, 265–274.
McGlynn B., McDonnell J. J., Shanley J., and Kendall C.(1999) Riparian zone flowpath dynamics. J. Hydrol. 222,75–92.
McGlynn B., McDonnell J., Stewart M., and Seibert J. (2003) Onthe relationships between catchment scale and streamwatermean residence time. Hydrol. Process. 17, 175–181.
McGuire K. J., DeWalle D. R., and Gburek W. J. (2002)Evaluation of mean residence time in subsurface watersusing oxygen-18 fluctuations during drought conditions inthe Mid-Appalachians. J. Hydrol. 261, 132–149.
Mengis M., Schiff S. L., Harris M., English M. C., Aravena R.,Elgood R. J., and MacLean A. (1999) Multiple geochemicaland isotopic approaches for assessing ground waterNO3-elimination in a riparian zone. Ground Water 37,448–457.
Michalski G., Scott Z., Kaibling M., Thiemens M. H. Firstmeasurements and modeling of D17O in atmospheric nitrate:application for evaluation of nitrogen deposition andrelevance to paleoclimate studies. GRL (in review).
Michalski G., Savarino J., Bohlke J. K., and Thiemans M.(2002) Determination of the total oxygen isotopiccomposition of nitrate and the calibration of a Del 17Onitrate reference material. Anal. Chem. 74 4989–4993.
Michel R. L. (1989) Tritium deposition over the continentalUnited States, 1953–1983. In Atmospheric Deposition,International Association of Hydrological Sciences, Oxford,UK, pp. 109–115.
Michel R. L. (1992) Residence times in river basins asdetermined by analysis of long-term tritium records.J. Hydrol. 130, 367–378.
Michel R. L., Campbell D. H., Clow D. W., and Turk J. T.(2000) Timescales for migration of atmospherically derivedsulfate through an alpine/subalpine watershed, Loch Vale,Colorado. Water Resour. Res. 36, 27–36.
Michel R. L., Turk J. T., Campbell D. H., and Mast M. A.(2002) Use of natural 35S to trace sulphate cycling in smalllakes, Flattops wilderness area, Colorado, USA. Water AirSoil Pollut. Focus 2/2, 5–18.
Migdisov A. A., Ronov A. B., and Grinenko V. A. (1983) Thesulphur cycle in the lithosphere. In The Global Biogeochem-ical Sulphur Cycle, SCOPE 19 (eds. M. V. Ivanov and J. R.Freney). Wiley, pp. 25–95.
Mills A. L. (1988) Variations in the delta C-13 of streambicarbonate: implications for sources of alkalinity. MSThesis, George Washington University.
Mitchell M. J., Driscoll C. T., Fuller R. D., David M. B., andLikens G. E. (1989) Effect of whole-tree harvesting on thesulfur dynamics of a forest soil. Soil Sci. Soc. Am. 53,933–940.
Mitchell M. J., Burke M. K., and Shepard J. P. (1992a)Seasonal and spatial patterns of S, Ca, and N dynamics of anorthern hardwood forest ecosystem. Biogeochemistry 17,165–189.
Mitchell M. J., David M. B., and Harrison R. B. (1992b) Sulfurdynamics in forest ecosystems. In Sulfur Cycling on theContinents, SCOPE 48 (eds. R. W. Howarth, J. W. B.Stewart, and M. V. Ivanov). Wiley, pp. 215–254, Chap. 9.
Mitchell M. J., David M. B., Fernandez I. J., Fuller R. D.,Nadelhoffer K., Rustad L. E., and Stam A. C. (1994)Response of buried mineral soil-bags to three years ofexperimental acidification of a forest ecosystem. Soil Sci.Soc. Am. J. 58, 556–563.
Mitchell M. J., Krouse H. R., Mayer B., Stam A. C., and ZhangY. (1998) Use of stable isotopes in evaluating sulfurbiogeochemistry of forest ecosystems. In Isotope Tracersin Catchment Hydrology (eds. C. Kendall and J. J.McDonnell). Elsevier, Amsterdam, pp. 489–518.
Mizutani Y. and Rafter T. A. (1969) Oxygen isotopiccomposition of sulphates: Part 4. Bacterial fractionation ofoxygen isotopes in the reduction of sulphate and in theoxidation of sulphur. NZ J. Sci. 12, 60–67.
Mook W. G. (1968) Geochemistry of the stable carbon andoxygen isotopes of natural waters in the Netherlands. PhDThesis, University of Groningen, Netherlands.
Mook W. G. and Tan F. C. (1991) Stable carbon isotopes inrivers and estuaries. In Biogeochemistry of Major WorldRivers (eds. E. T. Degens, S. Kempe, and J. E. Richey).Wiley, pp. 245–264.
Nadelhoffer K. J. and Fry B. (1988) Controls on naturalnitrogen-15 and carbon-13 abundances in forest soil organicmatter. Soil Sci. Soc. Am. J. 52, 1633–1640.
Nadelhoffer K. J., Aber J. D., and Melillo J. M. (1988) Seasonalpatterns of ammonium and nitrate uptake in nine temperateforest ecosystems. Plant Soil 80, 321–335.
Novak M., Michel R. L., Prechova E., and Stepanovan M.(2003) The missing flux in a 35S budget of a smallcatchment. Water Air Soil Pollut. Focus (in press).
Nriagu J. O. and Coker R. D. (1978) Isotopic composition ofsulphur in precipitation within the Great Lakes Basin. Tellus30, 365–375.
Nriagu J. O., Rees C. E., Mekhtiyeva V. L., Yu A., Lein P.,Fritz R. J., Drimmie R. G., Pankina R. W., Robinson R. W.,and Krouse H. R. (1991) Hydrosphere. In Stable Isotopes—Natural and Anthropogenic Sulphur in the Environment,Chap. 6, SCOPE 43 (Scientific Committee on Problems ofthe Environment) (eds. H. R. Krouse and V. A. Grinenko).Wiley, UK, pp. 177–265.
Ogunkoya O. O. and Jenkins A. (1991) Analysis of runoffpathways and flow distributions using deuterium and streamchemistry. Hydrol. Process. 5, 271–282.
Stable Isotope Applications in Hydrologic Studies362
Ogunkoya O. O. and Jenkins A. (1993) Analysis of stormhydrograph and flow pathways using a three-componenthydrograph separation model. J. Hydrol. 142, 71–88.
Palmer S. M., Hope D., Billett M. F., Dawson J. J. C., andBryant C. L. (2001) Sources of organic and inorganic carbonin a headwater stream: evidence from carbon isotope studies.Biogeochemistry 52, 321–338.
Panno S. V., Hackley K. C., Hwang H. H., and Kelly W. R.(2001) Determination of the sources of nitrate contaminationin karst springs using isotopic and chemical indicators.Chem. Geol. 179, 113–128.
Pardo L. H., Kendall C., Pett-Ridge J., and Chang C. C. Y.Evaluating the source of streamwater nitrate using 15N and18O in nitrate in two watersheds in New Hampshire, Hydrol.Processes (in press).
Park R. and Epstein S. (1961) Metabolic fractionation of 13Cand 12C in plants. Plant Physiol. 36, 133–138.
Pearce A. J., Stewart M. K., and Sklash M. G. (1986) Stormrunoff generation in humid headwater catchments: 1. Wheredoes the water come from? Water Resour. Res. 22,1263–1272.
Pearson F. J. and Rightmire C. T. (1980) Sulfur and oxygenisotopes in aqueous sulfur compounds. In Handbook ofEnvironmental Isotope Geochemistry (eds. P. Fritz and J.-C.Fontes). Elsevier, Amsterdam, pp. 179–226.
Peters B. (1959) Cosmic-ray produced radioactive isotopes astracers for studying large-scale atmospheric circulation.J. Atmos. Terr. Phys. 13, 351–370.
Peters N. E. (1994) Hydrologic studies. In Biogeochemistry ofSmall Catchments: A Tool for Environmental Research,SCOPE Report 51 (eds. B. Moldan and J. Cerny). Wiley,UK, chap. 9, pp. 207–228.
Pionke H. B. and DeWalle D. R. (1992) Intra- and inter-storm18O trends for selected rainstorms in Pennsylvania. J. Hydrol.138, 131–143.
Plummer L. N., Parkhurst D. L., and Thorstenson D. C. (1983)Development of reaction models for ground-water systems.Geochim. Cosmochim. Acta 47, 665–686.
Plummer L. N., Prestemon E. C., and Parkhurst D. L. (1991)An Interactive Code (NETPATH) for Modelling NetGeochemical Reactions along a Flow Path. USGS Water-resources Inves. Report 91-4078, 227pp.
Plummer L. N., Michel R. L., Thurman E. M., and Glynn P. D.(1993) Environmental tracers for age dating young groundwater. In Regional Ground-water Quality (ed. W. M. Alley).V. N. Reinhold, New York, pp. 255–294.
Rau G. (1979) Carbon-13 depletion in a subalpine lake: carbonflow implications. Science 201, 901–902.
Rice K. C. and Hornberger G. M. (1998) Comparison ofhydrochemical traccers to estimate source contributions topeak flow in a small, forested, headwater catchment. WaterResour. Res. 34, 1755–1766.
Rightmire C. T. (1978) Seasonal variations in pCO2 and 13C ofsoil atmosphere. Water Resour. Res. 14, 691–692.
Robson A., Beven K. J., and Neal C. (1992) Towardsidentifying sources of subsurface flow: a comparison ofcomponents identified by a physically based runoff modeland those determined by chemical mixing techniques.Hydrol. Process. 6, 199–214.
Rodhe A. (1987) The origin of stream water traced by oxygen-18. PhD Thesis, Uppsala University, Department, Phys.Geogr., Div. Hydrol., Sweden. Rep Ser. A., No. 41.
Rozanski K., Araguas-Araguas L., and Gonfiantini R. (1992)Relation between long-term trends of oxygen-18 isotopecomposition of precipitation and climate. Science 258,981–985.
Salati E., Dall’Olio A., Matsui E., and Gat J. R. (1979)Recycling of water in the Amazon basin: an isotopic study.Water Resour. Res. 515(5), 1250–1258.
Savarino J., Alexander B., Michalski G. M., and ThiemensM. H. (2002) Investigation of the oxygen isotopic compo-sition of nitrate trapped in the Site A Greenland ice core.
Presented at the AGU Spring Meeting, Washington, DC.EOS, Trans., AGU.
Saxena R. K. (1986) Estimation of canopy reservoir capacityand oxygen-18 fractionation in throughfall in a pine forest.Nordic Hydrol. 17, 251–260.
Schiff S. L., Aravena R., Trumbore S. E., and Dillon P. J.(1990) Dissolved organic carbon cycling in forestedwatersheds: a carbon isotope approach. Water Resour. Res.26, 2949–2957.
Schiff S. L., Aravena R., Trumbore S. E., Hinton M. J.,Elgood R., and Dillon P. J. (1997) Export of DOC fromforested catchments on the Precambrian shield of centralOntario: clues from 13C and 14C. Biogeochemistry 36,43–65.
Schreiber M. E., Simo J. A., and Freiberg P. G. (2000)Stratigraphic and geochemical controls on naturally occur-ring arsenic in groundwater, eastern Wisconsin, USA.Hydrogeol. J. 8, 161–176.
Schroth M. H., Kleikemper J., Bollinger C., Bernasconi S. M.,and Zeyer J. (2001) In situ assessment of microbial sulfatereduction in a petroleum-contaminated aquifer using push-pull tests and stable sulfur isotope analyses. J. Contamin.Hydrol. 51, 179–195.
Sebilo M., Billen G., Grably M., and Mariotti A. (2003)Isotopic composition of nitrate-nitrogen as a marker ofriparian and benthic denitrification at the scale of the wholeSeine River system. Biogeochemistry 63, 35–51.
Shanley J. B., Kendall C., Smith T. M., Wolock D. M., andMcDonnell J. J. (2001) Controls on old and new watercontributions to stream flow at some nested catchments inVermont, USA. Hydrol. Process. 16, 589–609.
Shearer G. and Kohl D. (1986) N2 fixation in field settings,estimations based on natural 15N abundance. Austral.J. Plant Physiol. 13, 699–757.
Shearer G. and Kohl D. H. (1988) 15N method of estimating N2
fixation. In Stable Isotopes in Ecological Research (eds.P. W. Rundel, J. R. Ehleringer, and K. A. Nagy). Springer,New York, pp. 342–374.
Sickman J. Q., Leydecker A., Chang C. C. Y., Kendall C.,Melack J. M., Lucero D. M. and Schimel J. (2003)Mechansims uderlying export of N from high-elevationcatchments during seasonal transitions. Biogeochemistry 64,1–24.
Sidle W. C. (2002) 18OSO4 and 18OH2O as prospectiveindicators of elevated arsenic in the Goose River ground-watershed, Maine. Environ. Geol. 42, 350–359.
Silva S. R., Ging P. B., Lee R. W., Ebbert J. C., Tesoriero A. J.,and Inkpen E. L. (2002) Forensic applications of nitrogenand oxygen isotopes of nitrate in an urban environment.Environ. Foren. 3, 125–130.
Sklash M. G. (1990) Environmental isotope studies of stormand snowmelt runoff generation. In Process Studies inHillslope Hydrology (eds. M. G. Anderson and T. P. Burt).Wiley, UK, pp. 401–435.
Sklash M. G. and Farvolden R. N. (1979) The role ofgroundwater in storm runoff. J. Hydrol. 43, 45–65.
Sklash M. G. and Farvolden R. N. (1982) The use ofenvironmental isotopes in the study of high-runoff episodesin streams. In Isotope Studies of Hydrologic Processes (eds.E. C. Perry, Jr. and C. W. Montgomery). Northern IllinoisUniversity Press, DeKalb, Illinois, pp. 65–73.
Sklash M. G., Farvolden R. N., and Fritz P. (1976) A conceptualmodel of watershed response to rainfall, developed throughthe use of oxygen-18 as a natural tracer. Can. J. Earth Sci.13, 271–283.
Spence M. J., Bottrell S. H., Thornton S. F., and Lerner D. N.(2001) Isotopic modelling of the significance of bacterialsulphate reduction for phenol attenuation in a contaminatedaquifer. J. Contamin. Hydrol. 53, 285–304.
St-Jean G. (2003) Automated quantitative and isotopic (13C)analysis of dissolved inorganic carbon and dissolvedorganic carbon in continuous-flow using a total organic
References 363
carbon analyzer. Rapid Commun. Mass Spectrom. 17,419–428.
Stam A. C., Mitchell M. J., Krouse H. R., and Kahl J. S. (1992)Stable sulfur isotopes of sulfate in precipitation and streamsolutions in a northern hardwood watershed. Water Resour.Res. 28, 231–236.
Staniaszek P. and Halas S. (1986) Mixing effects of carbonate
dissolving waters on chemical and 13C/12C compositions.Nordic Hydrol. 17, 93–114.
Stevens C. M. and Rust F. E. (1982) The carbon isotopiccomposition of atmospheric methane. J. Geophys. Res. 87,4879–4882.
Stewart M. K. and McDonnell J. J. (1991) Modeling base flowsoil water residence times from deuterium concentration.Water Resour. Res. 27(10), 2681–2693.
Stichler W. (1987) Snowcover and snowmelt process studiesby means of environmental isotopes. In Seasonal Snow-covers: Physics, Chemistry, Hydrology (eds. H. G. Jones andW. J. Orville-Thomas). Reidel, pp. 673–726.
Strauss H. (1997) The isotopic composition of sedimentarysulfur through time. Palaeogeogr. Paleaoclimatol. Paleao-ecol. 132, 97–118.
Stute M. and Schlosser P. (2000) Atmospheric noble gases. InEnvironmental Tracers in Subsurface Hydrology (eds.P. Cook and A. Herzceg). Kluwer Academic, Dordrecht.
Sueker J. K., Ryan J. N., Kendall C., and Jarrett R. D. (2000)Determination of hydrological pathways during snowmelt foralpine/subalpine basins, Rocky Mountain National Park,Colorado. Water Resour. Res. 36, 63–75.
Swistock B. R., DeWalle D. R., and Sharpe W. E. (1989)Sources of acidic stormflow in an Appalachian headwaterstream. Water Resour. Res. 25, 2139–2147.
Szaran J., Niezgoda H., and Halas S. (1998) New determinationof oxygen and sulphur isotope fractionation between gypsumand dissolved sulphate. RMZ-mater. Geoenviron. 45,180–182.
Taylor B. E. and Wheeler M. C. (1994) Sulfur- and oxygen-isotope geochemistry of acid mine drainage in the westernUS: Field and experimental studies revisited. In Environ-mental Geochemistry of Sulfide Oxidation, ACS SymposiumSeries 550 (eds. C. N. Alpers and D. W. Blowes). AmericanChemical Society, Washington, DC, pp. 481–514.
Taylor B. E., Wheeler M. C., and Nordstrom D. K. (1984)Oxygen and sulfur compositions of sulphate in acid minedrainage: evidence for oxidation mechanisms. Nature 308,538–541.
Taylor C. B. and Fox V. J. (1996) An isotopic study of dissolvedinorganic carbon in the catchment of the Waimakariri Riverand deep ground water of the North Canterbury Plains, NewZealand. J. Hydrol. 186, 161–190.
Taylor S., Feng X., Kirchner J. W., Osterhuber R., Klaue B.,and Renshaw C. E. (2001) Isotopic evolution of aseasonal snowpack and its melt. Water Resour. Res. 37,759–769.
Thatcher L. L. (1962) The Distribution of Tritium Fallout inPrecipitation Over North America. International Associationof Hydrological Sciences (IAHS), Publication No. 7,Louvain, Belgium, pp. 48–58.
Thurman E. M. (1985) Organic Geochemistry of NaturalWaters. Martinus Nijhof, Dr W Junk Publishers, Dordrecht.
Toran L. and Harris R. F. (1989) Interpretation of sulfur andoxygen isotopes in biological and abiological sulfideoxidation. Geochim. Cosmochim. Acta 53(9), 2341–2348.
Turk J. T., Campbell D. H., and Spahr N. E. (1993) Use ofchemistry and stable sulfur isotopes to determine sources oftrends in sulfate of Colorado lakes. Water Air Soil Pollut. 67,415–431.
Unnikrishna P. V., McDonnell J. J., and Stewart M. L. (1995)Soil water isotopic residence time modelling. In Solute
Modelling in Catchment Systems (ed. S. T. Trudgill). Wiley,New York, pp. 237–260.
Van Stempvoort D. R. and Krouse H. R. (1994) Controls of 18Oin sulfate: a review of experimental data and application tospecific environments. In Environmental Geochemistry ofSulfide Oxidation, ACS Symp. Ser. 550 (eds. C. N. Alpersand D. W. Blowes). American Chemical Society,Washington, DC, pp. 446–480.
Vogel J. C., Talma A. S., and Heaton T. H. E. (1981) Gaseousnitrogen as evidence for denitrification in groundwater.J. Hydrol. 50, 191–200.
Wadleigh M. A. and Blake D. M. (1999) Tracing sources ofatmospheric sulphur using epiphytic lichens. Environ.Pollut. 106, 265–271.
Wadleigh M. A., Schwarcz H. P., and Kramer J. R. (1996)Isotopic evidence for the origin of sulphate in coastal rain.Tellus 48B, 44–59.
Wallis P. M., Hynes H. B. N., and Fritz P. (1979) Sources,transportation, and utilization of dissolved organic matter ingroundwater and streams. Sci. Ser. 100, Inland WatersDirectorate, Water Quality Branch, Ottawa, Ont.
Wang Y., Huntington T. G., Osher L. J., Wassenaar L. I.,Trumbore S. E., Amundson R. G., Harden J. G., McKnightD. M., Schiff S. L., Aiken G. R., Lyons W. B., AravenaR. O., and Baron J. S. (1998) Carbon cycling in terres-trial environments. In Isotope Tracers in Catchment Hydro-logy (eds. C. Kendall and J. J. McDonnell). Elsevier,Amsterdam, pp. 577–610.
Wassenaar L. (1995) Evaluation of the origin and fate of nitratein the Abbotsford Aquifer using the isotopes of 15N and 18Oin NO3
2. Appl. Geochem. 10, 391–405.Wassenaar L. I., Aravena R., Fritz P., and Barker J. F. (1991)
Controls on the transport and carbon isotopic composition ofdissolved organic carbon in a shallow groundwater system,Central Ontario, Canada. Chem. Geol. 87, 39–57.
Weiler R. R. and Nriagu J. O. (1973) Isotopic composition ofdissolved inorganic carbon in the Great Lakes. J. Fish. Res.Board Can. 35, 422–430.
Wels C., Cornett R. J., and Lazerte B. D. (1991) Hydrographseparation: a comparison of geochemical and isotopictracers. J. Hydrol. 122, 253–274.
Wenner D. B., Ketcham P. D., and Dowd J. F. (1991) Stableisotopic composition of waters in a small piedmontwatershed. In Geochemical Society Special PublicationNo. 3 (eds. H. P. Taylor, Jr., J. R. O’Neil, and I. R. Kaplan),pp. 195–203.
Williard K. W. J. (1999) Factors affecting stream nitrogenconcentrations from mid-appalachian forested watersheds.PhD Dissertation, Penn. State University.
Wolterink J. J., Williamson H. J., Jones D. C., Grimshaw T. W.,and Holland W. F (1979). Identifying sources of subsur-face nitrate pollution with stable nitrogen isotopes.U.S. Environmental Protection Agency, EPA-600/4-79-050,150p.
Yang C., Telmer K., and Veizer J. (1996) Chemical dynamicsof the St-Lawrence riverine system: dDH2
O, d18OH2O,
d13CDIC, d34sulfate, and dissolved 87Sr/86Sr. Geochim.Cosmochim. Acta 60(5), 851–866.
Yang W., Spencer R. J., and Krouse H. R. (1997) Stable isotopecomposition of waters and sulfate species therein, DeathValley, California, USA: implications for inflow and sulfatesources, and arid basin climate. Earth Planet. Sci. Lett. 147,69–82.
Zimmerman U., Ehhalt D., and Munnich K. O. (1967) Soil-water movement and evapotranspiration: changes in theisotopic composition of water. In Isotopes in Hydrology.IAEA, Vienna, pp. 567–584.
Published by Elsevier Ltd. Treatise on GeochemistryISBN (set): 0-08-043751-6
Volume 5; (ISBN: 0-08-044340-0); pp. 319–364
Stable Isotope Applications in Hydrologic Studies364