Stability of Whole Wheat Flour, Rolled Oats, and Brown ...
171
Brigham Young University Brigham Young University BYU ScholarsArchive BYU ScholarsArchive Theses and Dissertations 2015-12-01 Stability of Whole Wheat Flour, Rolled Oats, and Brown Rice Stability of Whole Wheat Flour, Rolled Oats, and Brown Rice During Long-Term Storage and Preparation During Long-Term Storage and Preparation Victoria Elizabeth Scott Brigham Young University Follow this and additional works at: https://scholarsarchive.byu.edu/etd Part of the Nutrition Commons BYU ScholarsArchive Citation BYU ScholarsArchive Citation Scott, Victoria Elizabeth, "Stability of Whole Wheat Flour, Rolled Oats, and Brown Rice During Long-Term Storage and Preparation" (2015). Theses and Dissertations. 6169. https://scholarsarchive.byu.edu/etd/6169 This Thesis is brought to you for free and open access by BYU ScholarsArchive. It has been accepted for inclusion in Theses and Dissertations by an authorized administrator of BYU ScholarsArchive. For more information, please contact [email protected], [email protected].
Transcript of Stability of Whole Wheat Flour, Rolled Oats, and Brown ...

Brigham Young University Brigham Young University
BYU ScholarsArchive BYU ScholarsArchive
Theses and Dissertations
2015-12-01
Stability of Whole Wheat Flour, Rolled Oats, and Brown Rice Stability of Whole Wheat Flour, Rolled Oats, and Brown Rice
During Long-Term Storage and Preparation During Long-Term Storage and Preparation
Victoria Elizabeth Scott Brigham Young University
Follow this and additional works at: https://scholarsarchive.byu.edu/etd
Part of the Nutrition Commons
BYU ScholarsArchive Citation BYU ScholarsArchive Citation Scott, Victoria Elizabeth, "Stability of Whole Wheat Flour, Rolled Oats, and Brown Rice During Long-Term Storage and Preparation" (2015). Theses and Dissertations. 6169. https://scholarsarchive.byu.edu/etd/6169
This Thesis is brought to you for free and open access by BYU ScholarsArchive. It has been accepted for inclusion in Theses and Dissertations by an authorized administrator of BYU ScholarsArchive. For more information, please contact [email protected], [email protected].

Stability of Whole Wheat Flour, Rolled Oats, and Brown Rice
During Long-Term Storage and Preparation
Victoria Elizabeth Scott
A thesis submitted to the faculty of Brigham Young University
in partial fulfillment of the requirements for the degree of
Master of Science
Michael L. Dunn, Chair Oscar A. Pike
Laura K. Jefferies
Department of Nutrition, Dietetics and Food Science
Brigham Young University
December 2015
Copyright © 2015 Victoria Elizabeth Scott
All Rights Reserved
ABSTRACT
Stability of Whole Wheat Flour, Rolled Oats, and Brown Rice During Long-Term Storage and Preparation
Victoria Elizabeth Scott Department of Nutrition, Dietetics and Food Science, BYU
Master of Science
Whole grains are an increasingly popular health food in America. However, shelf life of whole grains is compromised due to the presence of lipoxygenases in the bran and germ, which lead to rancidity and generation of oxidative byproducts. These byproducts reduce sensory quality and may have a degradative effect on vitamins in whole grain products. The purpose of this study was to determine the degree of lipid and vitamin degradation during long-term storage of three whole grains: whole wheat flour, brown rice, and rolled oats. We also examined vitamin loss after cooking to determine if oxidative byproducts had an effect on vitamins during typical household cooking. Whole wheat flour, brown rice, and rolled oats were stored for 12 months and periodically analyzed for conjugated dienes, free fatty acids, tocopherols, thiamin, and riboflavin. Whole wheat bread, steamed brown rice, and oat porridge were made from samples stored for 0 months and 12 months and were analyzed for thiamin and riboflavin.
Conjugated dienes increased significantly only in rolled oats, while tocopherols decreased significantly in whole wheat flour and rolled oats and insignificantly in brown rice. Free fatty acids increased significantly in whole wheat flour and brown rice. Thiamin and riboflavin were stable in raw stored grains and cooked products made from stored grains with the exception of brown rice, in which we observed a significant decrease in thiamin after 12-month storage and cooking. These results suggest whole wheat flour, brown rice, and rolled oats experience significant lipid and tocopherol degradation, but it does not appear to affect thiamin and riboflavin in raw stored products. Cooking appears to cause degradation of thiamin after storage of brown rice, but thiamin and riboflavin were otherwise stable in these whole grains.
Keywords: whole wheat flour, brown rice, rolled oats, whole wheat bread, thiamin, riboflavin, tocopherols, conjugated dienes, free fatty acids, storage, cooking

ACKNOWLEDGEMENTS
I would like to express my deep gratitude to Dr. Dunn who guided me through my
research. Dr. Pike—who helped with my research and interpretation of data—and Dr.
Jefferies—who assisted in much of my preparation and writing—played a large role in my
success in my graduate program. Dr. Jiping Zou was a tremendous help in my HPLC
analysis. I also appreciate the many hours of dedicated work accomplished by the
undergraduates in the lab: Josh Lehr, Jacob Foist, Mark Stout, David Bae, Nathan Camp,
Fred Bassett, Muriel Johnson, and Erin Hiatt. Finally, I’m extremely grateful for the support
of my friends and family, without whom I would not have been able to reach my academic
goals.

iv
TABLE OF CONTENTS
TITLE PAGE .................................................................................................................................................................................. i
ABSTRACT .................................................................................................................................................................................. ii
ACKNOWLEDGEMENTS ....................................................................................................................................................... iii
TABLE OF CONTENTS ........................................................................................................................................................... iv
LIST OF TABLES ...................................................................................................................................................................... vi
LIST OF FIGURES ................................................................................................................................................................... vii
INTRODUCTION ....................................................................................................................................................................... 1
MATERIALS AND METHODS ............................................................................................................................................... 2
Materials and Experimental Design ............................................................................................................................ 2
Cooking ................................................................................................................................................................................... 3
Grinding .................................................................................................................................................................................. 4
Lipid Stability ....................................................................................................................................................................... 5
Thiamin and Riboflavin .................................................................................................................................................... 5
Tocopherols .......................................................................................................................................................................... 6
Moisture .................................................................................................................................................................................. 6
Statistical Analysis .............................................................................................................................................................. 7
RESULTS AND DISCUSSION ................................................................................................................................................ 7
Moisture .................................................................................................................................................................................. 7
Conjugated Dienes and Tocopherols .......................................................................................................................... 8

v
Free Fatty Acids ................................................................................................................................................................. 10
Thiamin and Riboflavin .................................................................................................................................................. 11
CONCLUSION ........................................................................................................................................................................... 12
LITERATURE CITED ............................................................................................................................................................. 13
TABLES AND FIGURES ........................................................................................................................................................ 15
APPENDIX ................................................................................................................................................................................. 18
Extended Literature Review ........................................................................................................................................ 18
Brown Rice Processing .............................................................................................................................................. 18
Whole Wheat Processing .......................................................................................................................................... 18
Oat Processing ............................................................................................................................................................... 20
Whole Wheat Stability ............................................................................................................................................... 21
Oat Stability .................................................................................................................................................................... 22
Brown Rice Stability ................................................................................................................................................... 24
Extended Methods ............................................................................................................................................................ 26
Statistical Analysis Results ........................................................................................................................................... 37
EXTENDED LITERATURE CITED .................................................................................................................................. 162

vi
LIST OF TABLES
Table 1: Thiamin, riboflavin, and total tocopherols in raw and cooked whole grains over
storage time. .......................................................................................................................................................................... 17
vii
LIST OF FIGURES
Fig. 1: Conjugated dienes in whole grains over storage time. Like superscripts represent no
significance (p<0.05). n=2 ............................................................................................................................................. 15
Fig. 2: Free fatty acids in whole grains over storage time. Like superscripts represent no
significance (p<0.05). n=2 ............................................................................................................................................. 16

1
INTRODUCTION
Health foods, especially whole grains, have gained widespread consumer attention
over the past several years. Whole grain consumption is associated with beneficial health
effects such as reduced risk of type 2 diabetes, cardiovascular disease, and cancer. These
properties are attributed to the high content of dietary fiber, phytochemicals, and
micronutrients (McCarty 2005; Frontela et al 2011; Youn et al 2012; Liu et al 2013; Ross et
al 2013). Since USA government recommendations in the early 1990s (USDHHS and USDA
1990) to increase whole grain consumption, its consumption has steadily increased. This
has been especially true in recent years. The Whole Grains Council reported an increase of
23.4% in whole grain consumption in the USA between 2008 and 2010 (Whole Grains
Council 2013). Three of the more widely consumed whole grain products in the United
States are whole wheat flour products, rolled oats, and brown rice.
The processing of whole grains is altered to retain or add back the germ and bran,
which are commonly removed in their refined grain counterparts. Lipoxygenases are
present in whole grain bran, which cause oxygenation and subsequent oxidative
breakdown of lipids found in the endosperm. This often leads to rancidity, and therefore
reduces the shelf life of whole grains and products made from them (Suzuki et al 1999;
Heinio et al 2002; Doblado-Maldonado 2012).
As lipids degrade within whole grains, reactive oxidative byproducts are formed.
These oxidative byproducts may lead to degradation of vitamins and other bioactive
phytochemicals during extended storage (Shahidi 1997). Furthermore, typical cooking
methods introduce a combination of heat and moisture that may contribute to further

2
degradation of micronutrients in whole grain products, especially in the presence of lipid
radicals generated during storage.
Major concerns with long-term consumer storage of whole grains are whether the
products remain a good source of nutrients, retain product quality, and whether vitamins
remain sufficiently stable during cooking after storage. Several of the most prevalent
vitamins in grains are thiamin (vitamin B1), riboflavin (vitamin B2), and vitamin E (from
tocopherols). With the rising popularity of whole grains and the incorporation of whole
grain products into consumers’ diets in place of their fortified counterparts, it is important
to evaluate the stability of essential vitamins and other components of whole grains during
storage and subsequent cooking.
This study focused on lipid and vitamin stability of three commonly consumed
whole grain products, namely whole wheat flour, brown rice, and rolled oats during a 12-
month storage period. Another objective was to measure vitamins B1 and B2 in whole
wheat bread, oat porridge, and steamed brown rice made from the stored raw grains. It
was hypothesized that all grains would experience a significant increase in lipid oxidation
byproducts and a significant decrease in vitamin content over the course of twelve months
in conditions typical of household storage, and cooking after long-term storage will cause a
greater vitamin loss than cooking after short-term storage.
MATERIALS AND METHODS
Materials and Experimental Design
Whole wheat flour was provided by ConAgra Mills (Omaha, NE), long-grain brown
rice was provided by Dale Bumpers National Rice Research Center (USDA-ARS in Stuttgart,

3
AR), and rolled oats were provided by Quaker (Chicago, IL). Two lots each of whole wheat
flour, brown rice, and rolled oats were stored in the dark in a 22 (±2)˚C, 65% RH
atmosphere chamber for 12 months. Whole wheat flour and rolled oats lots consisted of
products from different production periods, and brown rice consisted of two varieties:
Wells and Dixiebelle. All samples were stored in double layer plastic bags during the 12-
month storage period. One sample from each lot was removed every four months and
stored at -80˚C until analysis. All analyses were performed in duplicate.
Each of the two lots was analyzed for free fatty acids, conjugated dienes, riboflavin,
thiamin, tocopherols as described below. Moisture was also determined to report results
on a dry weight basis. Replicate samples with a coefficient of variance (CV) greater than
8% were considered outliers and were rerun.
Replicate batches of cooked food products (whole wheat bread, rolled oat porridge,
and steamed rice) were prepared from 0 and 12 month samples from each lot, and vitamin
analyses were conducted in duplicate to assess the effect of storage on vitamin stability
during preparation. Replicate samples with a CV greater than 8% were considered outliers
and were rerun.
Cooking
All cooked samples were prepared in duplicate. Whole wheat bread was made
according to the Optimized Straight-Dough Method (AACC Method 10-10.03). Pup loaves
were made using 150 g whole wheat flour, rather than the usual 100 g, and optimal water
addition of approximately 70 mL in order to provide adequate dough texture and loaf
volume.

4
Steamed brown rice samples were prepared by combining and cooking 190 grams
of brown rice and 500 ml of water for approximately 40 minutes in a household rice cooker
(Model RA3A , Salton, Quebec, Canada). Cooking duplicates were performed in two
separate rice cookers. Samples were removed immediately after cooking for analysis.
Rolled oat porridge was cooked by bringing 500 ml of water to 100˚ C, then adding
95 grams of rolled oats and stirring moderately and constantly for five minutes. The oat
porridge was then removed from heat and allowed to stand for two minutes before
samples were chilled in a freezer to halt cooking and removed for analysis.
Grinding
Brown Rice. Brown rice (11 g) was ground in an ultra centrifugal mill (Model ZM 200,
Retsch, Düsseldorf, Germany) at 12000 rpm until all of the sample passed through the 0.5
mm sieve attachment. Analysis was performed immediately after grinding
Rolled Oats. Uncooked rolled oat samples were ground using a coffee grinder (Model
Number 80335, Hamilton Beach Fresh-Grind). Oats (11 g) were ground for 30 seconds. The
oats were sieved through a No. 40 sieve (425 microns) and the portion that did not pass
through the sieve was reground for 45 seconds. All ground portions were combined and
mixed by hand for 30 seconds to homogenize before immediate analysis.
Steamed Brown Rice and Oat Porridge. Steamed brown rice and oat porridge were frozen
with liquid nitrogen following cooking and ground in a coffee grinder, then homogenized
by stirring by hand with a metal laboratory spatula.
Whole Wheat Bread. Each whole wheat bread pup loaf was sliced following baking and
allowed to air-dry overnight, uncovered, under a laboratory hood to facilitate drying. It was

5
then ground in a coffee grinder and homogenized by stirring by hand with a metal
laboratory spatula.
Lipid Stability
Conjugated dienes (CD) and free fatty acids (FFA) were analyzed by the methods of
Rose et al (2008). Oats were analyzed using a 6-gram sample size instead of a 5-gram
sample size to acquire spectrometer readings in an acceptable range. Brown rice was
ground prior to analysis, while rolled oats were analyzed intact due to poor filtering of
ground samples. All rolled oats samples were diluted by a factor of 50 for conjugated diene
analysis and the 12-month whole wheat flour samples were diluted by a factor of 20 for
free fatty acid analysis. All other samples were analyzed using a 1:10 dilution.
Thiamin and Riboflavin
Thiamin and riboflavin were analyzed according to AOAC Method 953.17. (AOAC
2012). All samples were analyzed in duplicate. Raw brown rice and rolled oat samples
were ground prior to analysis, and cooked samples were frozen with liquid nitrogen and
ground according to the grinding methods explained above.
Following the Taka-diastase incubation step, the sample was filtered through
Whatman #541 filter paper in a Buchner funnel. The filtrate was diluted to 200 mL in a
volumetric flask. Using a laboratory syringe with a 0.2 µm membrane, 1 mL of the diluted
filtrate was reserved and deposited into an amber HPLC vial for riboflavin analysis. For
thiamin analysis, 10 mL of the diluted filtrate was transferred into a centrifuge tube and 3
mL of potassium ferricyanide/NaOH oxidizing solution and 15 mL isobutanol were added.
After agitation, the tube was centrifuged at 1200g for 4 minutes. The supernatant was

6
extracted using a laboratory syringe with a 0.2 µm membrane, and 1 mL was deposited into
an amber HPLC vial for thiamin analysis.
Thiamin and riboflavin HPLC analysis was conducted isocratically using an Agilent
1100 Series HPLC (Agilent Technologies Inc., Santa Clara, CA) with an octadecylsilyl column (150
mm x 4.60 mm, 5 μm particle size, Phenomenex Inc., Torrance, CA). A sample volume of 10 μL was
injected into the apparatus with a methanol-0.05 M sodium acetate (30:70 v/v) mobile phase, using
a 1 mL/min flow rate. A flourometric detector was used to quantify riboflavin and thiamin (in the
form of thiochrome) within the sample. Excitation and emission wavelengths of riboflavin were 422
nm and 522 nm, respectively. Thiochrome excitation and emission wavelengths were 366 nm and
435 nm, respectively. Sample concentrations were calculated using standard curves previously
determined to accurately capture the concentrations within each sample to eliminate potential
error by extrapolation.
Tocopherols
Tocopherols were measured by NP Analytical (NP Analytical Laboratories, St. Louis,
MO) using isopropanol or methanol for extraction, followed by filtering and analysis by
reverse phase HPLC with fluorescence detection. Each tocopherol isomer (α, δ, and γ) was
quantitated from working standards of known concentration injected onto the HPLC under
the same conditions.
Moisture
Moisture was measured according to AACC Air-Oven Methods (AACC Method 44-
15.02) to calculate analyte concentrations on a dry weight basis. The one-stage method
was used for the flour, oats and rice; whereas the two stage method was used for cooked
rice and oats. Cooked oats and rice were weighed, placed under a laboratory hood to dry

7
overnight, then weighed, ground, and transferred to a second dish. The samples were then
placed in a forced air oven (1600 HAFO Series, Model 1670, Sheldon Manufacturing Inc.,
Cornelius, OR), for 1 hour at 130˚C, cooled in a dessicator, and weighed to determine
moisture content.
The two-stage bread moisture method, within AACC 44.15.02, was used for the
prepared bread product. After baking, the whole wheat bread was sliced and placed under
the laboratory hood to dry overnight, then weighed, ground, placed in the forced air oven
for 1 hour at 130˚C, and weighed after desiccated cooling.
Statistical Analysis
Data were analyzed at the α=0.05 level of significance using Statistical Analysis System
software (Version 9.3 SAS Institute, Cary, NC). A mixed models analysis was used blocking on lot to
analyze differences of analyte concentrations over time. Additionally, a post-hoc Tukey analysis of
lots across time was used.
RESULTS AND DISCUSSION
Moisture
Moisture content of raw whole wheat flour was 11% ± 0.46%, raw brown rice was
15% ± 0.62%, and raw rolled oats was 10% ± 0.26%. Whole wheat bread had 39% ± 0.7%
moisture, steamed brown rice had 69% ± 3.4% moisture, and oat porridge had 83% ± 0.7%
moisture. The wider variance in steamed brown rice moisture is likely due to differences in
rice variety and differences in functionality of the two rice cookers used.

8
Conjugated Dienes and Tocopherols
There was no significant change in conjugated dienes among whole wheat flour and
brown rice samples during 12-month storage (Figure 1). However, rolled oats showed a
significant increase in conjugated dienes across the 12-month storage period. All three
whole grain products demonstrated declines in total tocopherol content, but the change
was only significant in whole wheat flour and rolled oats (Table 1).
The lack of oxidative activity, as indicated by the stable CD values over time, in
whole wheat flour and brown rice was likely due to the radical quenching activity of
tocopherols, which showed a constant decrease over time (Table 1). This was especially
evident in the whole wheat flour, where the significant disruption of wheat kernels during
milling, and the accompanying dramatic increase in surface area, would be expected to
greatly accelerate lipid oxidation. Whole wheat flour showed a 43% loss of total
tocopherols after 12 months of storage (Table 1). Presumably, the CD values and related
oxidation and rancidity would begin to increase once the tocopherols had all been oxidized.
Wennermark and Jagerstad (1992) observed similar decreases in tocopherols over a 12-
month storage period; α-tocopherol decreased by 44% while vitamin E activity was
reduced by 40% after 12 months storage.
The apparent but statistically insignificant increase in CD in brown rice in this study
differed considerably from the changes in CD noted by Sharp and Timme (1986). They
reported periods of increase followed by sharp declines in conjugated diene concentration
over a period of 9 months, with a peak in concentration around 7 months. Guraya and
Patindol (2011) reported a four-fold increase in peroxide value in stored American Basmati
and long grain brown rice before it peaked at 180 days, then decreased. The relative

9
stability to oxidation of the rice lots used in this study, compared to these previous studies,
is of interest since lipid rancidity is a principal cause of limited shelf life in brown rice
studies. Suzuki et al (1999) performed a study that confirmed the formation of hexanal,
pentanal, and pentanol levels due to the presence of lipoxygenases indigenous in rice by
comparing rice varieties containing a gene responsible for lipoxygenase formation against
a rice variety lacking this gene. Pascual et al (2013) reported a significant loss of
tocopherols in brown rice stored in polyethylene pouches during a 6-month storage period,
which resulted in a 70% loss of total tocopherols. We observed a loss of 42% of total
tocopherols over a 12-month storage period. While some oxidative activity occurred in our
samples, compared to other studies it appears there is a more complex system of oxidation
occurring in brown rice with additional factors not highlighted in this study. Further study
is needed to uncover the pattern of oxidation in various brown rice samples.
The increase in CD in rolled oats is likely a result of the low tocopherol to lipid ratio,
since oat samples had a high concentration of lipids and comparatively low concentration
of tocopherols. Additionally, the majority of tocopherols in rolled oats are α-tocopherols,
which are less effective antioxidants than other tocopherol isomers. Stored raw rolled oats
in this study showed a significant decrease in tocopherols, whereas there was lack of
significant changes in a previous study by McEwan et al (2005), which showed only a slight,
non-significant decrease in Vitamin E over a storage period of 28 years. However, the oats
in McEwan’s study were packaged in oxygen-free, hermetically sealed cans. Due to the lack
of other relevant studies, McEwan’s research provides the only comparison to the rolled
oats portion our study. Personal discussion with the author revealed that if rolled oats

10
were stored in an environment where oxygen was available to interact with the rolled oats,
tocopherols declined rapidly.
Free Fatty Acids
Free fatty acids increased significantly in whole wheat flour, but not in rolled oats or
brown rice, over the 12-month storage period (Figure 2). Brown rice did not show a
significant increase between time 0 and 12 months, though we observed a period of
significant decrease followed by a significant increase, neither of which was large in
magnitude.
The pattern of FFA accumulation in brown rice over times seems consistent with the
findings of Sharp and Timme (1986), which shows some fluctuations month-to-month with
only a slight change overall. It is possible chemical mechanisms exist within brown rice that
convert or destroy free fatty acids at a variable rate during storage depending on the grain
variety. Guraya and Patindol (2011) showed a slight overall increase in FFA in both
American Basmati and long grain brown rice, although they observed a similar pattern of
interspersed increase and decrease over 300 days of storage.
Rolled oats undergo heat treatment through steaming prior to being rolled in
manufacturing, which inactivates lipases that would cause free fatty acid production.
Therefore, we can infer this inactivation is sufficient to prevent creation and accumulation
of free fatty acids in rolled oats and explains the lack of increase in free fatty acids in this
study.

11
Thiamin and Riboflavin
Storage of raw grains did not produce a significant reduction in thiamin and
riboflavin (Table 1). McEwan et al (2005) observed a similar lack of change in thiamin in
stored rolled oats in a low oxygen environment. Among whole wheat bread and oat
porridge, riboflavin and thiamin remained stable after a 12-month storage period and
subsequent cooking. It does not appear that levels of oxidative byproducts produced during
degradation of the food matrix over time, nor application of heat during cooking, were
sufficient to affect the stability of thiamin and riboflavin in either of these products. We
expected to find greater vitamin degradation in rolled oats after cooking due to production
of free radicals during oxidation, but we did not observe this to be the case. It is possible
that tocopherol quenching of radicals stabilized the samples during cooking, or the cooking
conditions and cook times were not sufficient to produce a combined effect with potential
free radicals present, leading to insignificant degradation of thiamin and riboflavin.
However, steamed brown rice had a significant decrease in thiamin following cooking after
12-month storage, while riboflavin remained stable. This may be due to the prolonged heat
exposure during cooking in combination with oxidative byproducts or structural
degradation, since thiamin is heat-labile (Kuntz 1994). Riboflavin increased three-fold
between raw whole wheat flour and whole wheat bread, which is consistent with a study
by Batifoulier et al (2005). Batifoulier et al concluded contributions from yeast cell walls
and synthesis during fermentation were a source of additional riboflavin not originally
present in the wheat.

12
CONCLUSION
There is significant lipid degradation occurring in whole wheat flour, rolled oats,
and brown rice during 12-month storage in typical consumer packaging and storage
conditions. Tocopherols in whole wheat flour and rolled oats decrease during storage,
possibly due to quenching by oxidation. However, thiamin and riboflavin generally remain
stable during storage and subsequent cooking. Therefore, whole wheat flour, rolled oats,
and brown rice remain adequate sources of Vitamins B1 and B2 during consumer storage
over the course of one year, although some rancidity may occur. Given the relative stability
exhibited by these samples over time, compared to other studies, it is apparent that further
research might be directed to examine key factors in samples or storage conditions that
lead to such widely varying results.

13
LITERATURE CITED
AACC International. Approved Methods of Analysis, 11th Ed. Method 44-15.02. Moisture—Air-Oven Methods. Approved October 30, 1975. AACC International, St. Paul, MN, U.S.A. http://dx.doi.org/10.1094/AACCIntMethod-44-15.02
Batifoulier, F.; Verny, M. A.; Chanliaud, E.; Remesy, C.; Demigne, C., Effect of different breadmaking methods on thiamine, riboflavin and pyridoxine contents of wheat bread. Journal of Cereal Science 2005, 42 (1), 101-108.
Council, W. G. Whole Grain Consumption up 23%. http://wholegrainscouncil.org/newsroom/blog/2013/09/whole-grain-consumption-up-23.
Doblado-Maldonado, A. F.; Pike, O. A.; Sweley, J. C.; Rose, D. J., Key issues and challenges in whole wheat flour milling and storage. Journal of Cereal Science 2012, pp 119-126.
Frontela, C.; Ros, G.; Martínez, C., Phytic acid content and "in vitro" iron, calcium and zinc bioavailability in bakery products: The effect of processing. Journal of Cereal Science 2011, pp 173-179.
Guraya, H. S.; Patindol, J. A., Storage stability of flour-blasted brown rice. Cereal Chemistry 2011, pp 56-63.
Heinio, R.; Lehtinen, P.; Oksman-Caldentey, K.; Poutanen, K., Differences between sensory profiles and development of rancidity during long-term storage of native and processed oat. Cereal Chemistry 2002, 79 (3), 367-375.
Jagerstad, M.; Wennermark, B. H.; JÄGerstad, M., Breadmaking and Storage of Various Wheat Fractions Affect Vitamin E. Journal of Food Science 1992, 57 (5), 1205-1209.
Kuntz, L. A. Shelf Stability: A Question of Quality 1994. http://www.foodproductdesign.com/articles/1994/06/shelf-stability.aspx (accessed November 18, 2015).
Liu, L.; Waters, D. L. E.; Rose, T. J.; Bao, J.; King, G. J., Phospholipids in rice: Significance in grain quality and health benefits: A review. Food Chemistry 2013, pp 1133-1145.
McCarty, M. F., Magnesium may mediate the favorable impact of whole grains on insulin sensitivity by acting as a mild calcium antagonist. Medical Hypotheses 2005, pp 619-627.
McEwan, M.; Ogden, L. V.; Pike, O. A., Effects of long-term storage on sensory and nutritional quality of rolled oats. Journal of Food Science 2005, pp S453-S458.

14
Official Methods of Analysis of AOAC INTERNATIONAL (2012) 19th Ed., AOAC INTERNATIONAL, Gaithersburg, MD, USA, Official Method 953.17.
Official Methods of Analysis of AOAC INTERNATIONAL (2012) 19th Ed., AOAC INTERNATIONAL, Gaithersburg, MD, USA, Official Method 2004.05.
Pascual, C. d. S. C. I.; Massaretto, I. L.; Kawassaki, F.; Barros, R. M. C.; Noldin, J. A.; Marquez, U. M. L., Effects of parboiling, storage and cooking on the levels of tocopherols, tocotrienols and γ-oryzanol in brown rice (Oryza sativa L.). Food Research International 2013, pp 676-681.
Rose, D. J.; Ogden, L. V.; Dunn, M. L.; Pike, O. A., Enhanced lipid stability in whole wheat flour by lipase inactivation and antioxidant retention. Cereal Chemistry 2008, 85 (2), 218-223.
Ross, A. B.; Pere - Trepat, E.; Montoliu, I.; Martin, F. P. J.; Collino, S.; Moco, S.; Godin, J. P.; Cleoux, M.; Guy, P. A.; Breton, I.; Bibiloni, R.; Thorimbert, A.; Tavazzi, I.; Tornier, L.; Bebuis, A.; Bruce, S. J.; Beaumont, M.; Fay, L. B.; Kochhar, S., A whole-grain--rich diet reduces urinary excretion of markers of protein catabolism and gut microbiota metabolism in healthy men after one week.(Genomics, Protenomics, and Metabolomics)(Report)(Author abstract). The Journal of Nutrition 2013, p 766.
Shahidi F. 1997. Natural Antioxidants: An overview. p. 1-11 in Natural Antioxidants: Chemistry, Health Effects and Application. AOCS Press, Champaign, IL.
Sharp, R.; Timme, L., Effects of Storage Time, Storage Temperature, and Packaging Method on Shelf Life of Brown Rice. Cereal Chemistry 1986, 63 (3), 247-251.
Suzuki, Y.; Ise, K.; Li, C.; Honda, I.; Iwai, Y.; Matsukura, U., Volatile components in stored rice Oryza sativa (L.) of varieties with and without lipoxygenase-3 in seeds. Journal of agricultural and food chemistry 1999, p 1119.
U.S. Department of Health and Human Services and U.S. Department of Agriculture. (1990). Dietary Guidelines for Americans. Retrieved from http://health.gov/dietaryguidelines/history.htm#4
Youn, M.; Saari Csallany, A.; Gallaher, D. D., Whole grain consumption has a modest effect on the development of diabetes in the Goto–Kakisaki rat. British Journal of Nutrition 2012, pp 192-201.

15
TABLES AND FIGURES
Fig. 1: Conjugated dienes in whole grains over storage time. Like superscripts represent no significance (p<0.05). n=2

16
Fig. 2: Free fatty acids in whole grains over storage time. Like superscripts represent no significance (p<0.05). n=2

17
aStorage time of raw whole grains, before cooking. n=2, p<0.05. bSE, standard error of the mean. cNot determined Table 1: Thiamin, riboflavin, and total tocopherols in raw and cooked whole grains over storage time.
TABLE I Thiamin, riboflavin, and total tocopherols in raw and cooked whole grains over time.
Sample Storage Time
(Months)a Riboflavin (mg/100g)
Thiamin (mg/100g)
Total Tocopherols
(ppm) Whole Wheat Flour 0 0.11 0.48 13.22a
4 0.11 0.46 11.45ab 8 0.13 0.46 9.62ab
12 0.11 0.47 7.47b SEb 0.01 0.01 0.89
Brown Rice 0 0.07 0.29 4.99 4 0.07 0.24 5.21 8 0.08 0.27 4.15
12 0.08 0.26 2.87 SE 0.01 0.02 0.55
Rolled Oats 0 0.11 0.60 5.89a 4 0.12 0.58 NDc 8 0.13 0.60 4.50ab
12 0.11 0.53 3.03b SE 0.01 0.04 0.11
Whole Wheat Bread 0 0.35 0.60 NDc 12 0.35 0.64 NDc SE 0.01 0.01 NDc
Steamed Brown Rice 0 0.23 0.65a NDc 12 0.21 0.61b NDc SE 0.01 0.00 NDc
Rolled Oat Porridge 0 0.19 1.01 NDc 12 0.21 0.96 NDc
SE 0.01 0.01 NDc

18
APPENDIX
Extended Literature Review
Comparison of lipid and other nutrient contents (USDA 2015)
Grain Total Fat (g/100g) Thiamin (mg/100g) Riboflavin (mg/100g)
Whole Wheat Flour 1.95 0.297 0.188
Rolled Oats 6.52 0.46 0.155
Brown Rice 2.68 0.413 0.043
Brown Rice Processing
Brown rice is achieved by very simple processing (Kent 1983). In typical rice processing,
rice is cleaned by sieves, discs, specific gravity de-stoners, and scalperators. Equipment
specific to rice cleaning includes a bearder, which removes the beards and stems of rice.
Cleaning is followed by dehulling, in which two stone discs create an abrasive surface to
begin to remove the outer portion, the hull, which is inedible. The rice then passes through
rubber rollers to grab and shear off the hull.
Whole Wheat Processing
Whole wheat flour is a very detailed, multi-step process that requires various time-
dependent stages and types of machinery (Kent 1983). Wheat impurities that adhere to the
kernel can be removed by dry scouring coupled with aspiration. Dry scouring moves
kernels into a machine containing perforated metal or an emery-lined cylinder. Abrasion
removes superficial dirt and hairs, which are then carried away by air.

19
Impurities can also be separated by size and shape. Screens with holes of similar diameter
to the length of wheat kernels separate large impurities, whereas holes of smaller diameter
retain the wheat and remove smaller impurities. Discs and trieur cylinders utilize indented
discs to separate impurities with similar diameters to wheat. Indents that are slightly
shallower than the kernels capture small impurities, whereas indents with a sufficient
depth to accommodate only the kernels remove the large impurities. Helter-skelter or
spiral seed separators separate impurities by shape. More spherical impurities will cascade
down a spiral with greater speed and a wider diameter than the elongated wheat kernels.
Terminal velocity is exploited by aspirators, which can separate particles based on their
motion in air currents.
Conditioning brings wheat kernels to ideal moisture content, allowing for easier and more
efficient processing. Cold conditioning for the addition of 3% or less consists of addition of
cold water accompanied by continuous movement of the kernels until the water has been
absorbed. Addition of more than 3% requires stepwise addition of water with turning over
and aspiration of wheat. Wheat is allowed to sit for at least 7 hours at room temperature to
allow moisture to absorb into the interior. This process can be expedited by the addition of
surfactants or sodium bicarbonate. To shorten resting time of the wheat, warm
conditioning can be employed. Warm conditioning allows the wheat to rest at elevated
temperatures (up to 46˚C) for 1-1.5 hours. Initial heat is provided by a radiator, then wheat
is passed into a conditioning chamber where heat is provided by radiators or hot, moist air.
After heating, the wheat is passed to a cooling section to be cooled by cold air currents.
Steam conditioning is beneficial due to the rapid transfer of heat and moisture with steam.
However, the time and temperature ranges for non-destructive processing is narrower.

20
This method tends to yield higher bran and endosperm fractions than other conditioning
methods.
Milling of wheat kernels is the final step in the production of flour. Stone-milling is a more
archaic form of milling using two flat stones with grooves running from the center to the
periphery. The wheat kernels are fed into the interface by a hole in the top stone, then one
of the stones rotates, grinding the kernels to produce flour. In rollermilling, break rollers
with corrugations create a “scissor” action, breaking apart the wheat kernels. Break
grinding follows the break rollers to remove more endosperm from the bran. In the break
release step, the ground wheat is sieved and graded according to particle size. The course
fractions (semolina and middlings) are purified by removing the bran. Loaded bran (bran
with attached endosperm) moves into a scratch system, which consists of rolls with finer
corrugation that scrape the endosperm from the bran. Semolina and middlings are moved
to the reduction system; the reduction system utilizes smooth rolls to grind the course
particles into finer particles for use as flour. In whole wheat flours, the previously
separated bran fraction is added back into the flour and homogenized.
Oat Processing
Oats can be processed into a variety of products, the most common of which are oatmeal
and rolled oats (Handbook of cereal science and technology 1991). In the production of
oatmeal and rolled oats, oats are cleaned to remove extraneous matter by indented discs or
cylinders similar to that of wheat cleaning, aspirators, sieves, and electrostatic separators.
The clean oats are then stabilized to inactivate the lipase by heat treatment or acid
treatment. Kiln-drying follows stabilization. Continuous drying is utilized in kiln-drying by
introducing oats to hot air. This step introduces favorable flavor development. Kiln-drying

21
may also be done in a batch-method, where oats are heated in a pan for a set time and
temperature with constant stirring. Shelling can take place either before or after kiln-
drying. Dry-shelling occurs after kiln-drying, in which the oats are passed between large
circular stones. One stone rotates, breaking the husk off in slivers; the husk is then
separated by aspirators. Green-shelling takes place after steaming for stabilization. Oats
are impacted at high velocity at a hard plate with abrasive material, which causes the husks
to fracture and are separated by aspiration. This process, however, makes the oat more
susceptible to burning during kiln-drying. Wet-shelling is much like green-shelling, but the
oats are dampened then dried before separation, which decreases breakage and increases
efficiency. Shelling is followed by polishing, which detaches fine hairs attached to the oats,
and cutting, which yields pinhead meal. Rolled oats are produced from the pinhead meal by
cooking in a steamer and rolling between heavy rollers. The rolled oats are then dried and
then cooled. The pinhead meal may also be further ground on stones and sieved to produce
oatmeal.
Whole Wheat Stability
Doblado-Maldonado et al (2012) reviewed issues of whole wheat storage, explaining that
the shelf-life of whole-wheat flour is shorter than white flour due to the lipolytic
degradation from native lipases. Byproducts of lipid degradation often lead to decreased
sensory qualities by introducing off-odors to the product (Doblado-Maldonado et al 2012).
Another potential effect of lipid oxidation may be the indirect destruction of vitamins,
which can be degraded by free radicals and pro-oxidants – byproducts of lipid oxidation.
Nielsen and Hansen (2008) determined storage effects on hexanal in correlation with
vitamin E, a strong antioxidant, in wheat and wheat fractions. Wheat kernels were stored in

22
paper bags typical of commercial packaging at room temperature for 297 days then milled
with either a roller mill or a stone mill. Hexanal was measured immediately after milling,
which showed rapid formation directly after roller-milling, but hexanal did not continue to
form over a 22-day period in the germ fraction. This indicates an antioxidant effect that
may protect the processed wheat from further degradation over a short storage period.
Vitamin E degraded a total of 31% in roller milled whole wheat flour and 36% in stone
milled whole wheat flour over the course of 297 days, as opposed to the 50% decrease in
roller milled wheat flour. Lipoxygenase activity also decreased over the storage period in
whole wheat flour, but remained stable in wheat flour.
Jagerstad and Wennermark (1992) conducted a study on whole wheat flour fractions to
determine the change in tocopherols during 52 weeks of storage. Flour was stored in paper
bags typically used for consumer storage and stored at room temperature. A separate bag
was pulled at each sampling period. Analyses were conducted at 0, 4, 12, 26, and 52 weeks.
The α-tocopherols in whole wheat experienced 56% retention after 12 months of storage,
whereas Vitamin E had 60% retention.
Oat Stability
McEwan et al (2005) examined vitamin B-1, vitamin E, and hexanal in rolled oats in
hermetically sealed cans over a 28-year period. Vitamin E and hexanal levels were
negatively correlated, but neither was significant. While results suggest the vitamin B-1 and
vitamin E were stable over time, the most common consumer storage of rolled oats
includes sealing in paper bags or cardboard containers. Since they are not air-tight, this
provides the oxygen for lipoxygenases and will trigger the degradation of lipids.

23
Molteberg et al (1996) stored oat flour in paper bags for 42 weeks at room temperature
under light and 50% relative humidity and found significantly increased free oleic acid and
linoleic acid over the storage periods of 0, 5, 18, and 42 weeks. Free oleic acid and linoleic
acid are byproducts of lipolysis. Hexanal and 2-pentyl-furan were also discovered in
significant quantities; both compounds are volatile molecules generated by lipid oxidation.
This contests the idea that processed oats are stable, and therefore vitamins may degrade
in the environment of common consumer storage.
Heinio et al (2002) found that processed oat groats developed an increasingly musty, less
sweet, and more bitter flavor during storage. Dehulled oats were used in both raw and
processed forms. Processing included germination followed by drying with hot air over a
temperature gradient from 65-93˚C for 19 hours. Raw and processed oats were ground and
stored in closed brown paper bags without exposure to light for 12 months at 20˚C.
Samples were exposed to environmental changes in humidity. Samples were analyzed for
sensory quality, lipid composition, and volatile headspace compounds at 0, 6, 9, and 12
months of storage. Bitterness was detected in as little as one month of storage in
unprocessed oats, and it was not detected until later in processed oats. However, the
researchers found that hydrolytic deterioration of the lipids was not related to oxidative
deterioration, since the oxidation byproducts were mainly found in the polar lipid fraction,
and hydrolytic byproducts were found in the cleaving of fatty acids from triacylglycerols.
Lehto et al (2003) showed that oat has intrinsic enzymatic activity that quenches hexanal
in ground samples. Oat samples were ground and a hexanal solution containing 100 or 300
µg of hexanal per gram of oats was added in an air-tight headspace vial. The vials were
incubated at room temperature and analyzed over 0.5-4 hours. All samples showed a

24
decrease in headspace hexanal during incubation and an increase in less-volatile hexanoic
acid, which was attributed to the quenching activity of aldehyde dehydrogenase.
Brown Rice Stability
Although brown rice is minimally processed, Liu et al (2013) explained in a review of
phospholipids in rice that the phospholipid membrane can be damaged during dehusking
and milling. The breach of the phospholipid membrane exposes triacylglycerols from the
damaged bran and germ spherosomes to lipases present in the aleurone and germ tissues.
Exposure of lipids to lipases in rice significantly decreases shelf life due to the generation of
free fatty acids and subsequent lipid oxidation.
Suzuki et al (1999) performed a study that confirmed the formation of hexanal, pentanal,
and pentanol levels due to the presence of lipoxygenases indigenous in rice. Researchers
examined four rice varieties, one of which lacked the LOX-3 gene which is located in the
germ fraction and codes for lipoxygenase. All samples were stored in polyethylene bags for
up to 8 weeks at 4˚C or 35˚C. Rice lacking the LOX-3 gene showered significantly less
increase in lipolysis byproducts than in rice with the lipoxygenase mechanism still intact.
A recent study on the effects of parboiling and storage on brown rice showed significant
Vitamin E loss due to storage (Pascual et al 2013). Nine samples were randomly chosen
from 27 dehulled subsamples and stored for 6 months at room temperature in
polyethylene pouches. At the end of six months, total tocopherols in raw brown rice
decreased by 70 percent. Cooking after storage did not significantly reduce tocopherols any
further.
Sharp and Timme (1986) studied formation of FFA and conjugated diene hydroperoxide
(CDHP) in brown rice during storage. Whole rice was stored under unknown conditions for

25
8 months, then dehulled and packaged in two-ply polyethylene laminated film bags.
Storage parameters included three storage methods: heat-sealed laminated bag, heat-
sealed laminated bag sealed in a metal can, and punctured laminated bag sealed in a metal
can under vacuum; three storage temperatures: 3˚C, 22˚C, and 38˚C; and were stored for up
to 9 months, with samples analyzed every month. All brown rice samples demonstrated an
increase in FFA with period fluctuations and CDHP had periods of sharp increases
interspersed with periods of sharp decreases. FFA increased proportionally with storage
temperature, though bagged samples demonstrated less increase than the canned and
vacuumed samples.
Guraya and Patindol (2011) examined changes in free fatty acids and Peroxide Value (POV)
in various brown rice samples over 300 days. Free fatty acids increased slightly; American
Basmati brown rice had an approximately 4% increase over 300 days. POV increased in all
samples until it peaked at 180 days, followed by a rapid decline.

26
Extended Methods
FFA/CD Standard Operating Procedure
Wear nitrile gloves throughout the entire procedure. Use organic solvents in the fume hoods.
Materials: • 125 ml Erlenmeyer flasks• Glass funnels• 500 ml round bottom flasks with glass stoppers• 10 ml volumetric flasks• 15 ml screw top centrifuge test tubes• Whatman No. 1 filter paper (15 cm diameter)• Disposable plastic cuvettes• Quartz cuvette• Hexane• Isooctane (2,2,4, trimethylpentane)
Combined Method:
1. Rinse Erlenmeyer flasks and round bottom flasks with a small amount of hexanebefore use.
2. Weigh ~5 g of sample of wheat flour directly into a 125 ml Erlenmeyer flask andrecord weight exactly in lab notebook.
3. Add ~50 ml of hexane and shake at 140 rpm for 30 min on an orbital shaker.4. Allow solids to settle briefly after shaking is complete, and then decant the hexane
layer through a Whatman No. 1 filter paper into a 500 ml round bottom flask. Try toprevent any flour from leaving the 125 mL flask. When pouring, try to preventsolvent loss from the solvent dripping down the outside of the flask.
5. While capping the round bottom flasks between extractions, repeat steps 2 and 3 fora total of three extractions, pooling all extractions in the round-bottom flask.
6. Turn on the spectrophotometer so that it can warm up for ≥30 min.7. Evaporate hexane on a rotary evaporator under moderate vacuum at 40 °C.8. In the hood, redissolve the extracted lipids in exactly 10 ml of isooctane (use
volumetric pipette).9. For FFA, transfer 5 ml of the extract to a 15 ml polypropylene, screw-cap, disposable
centrifuge tube.

27
10. For CD, transfer 1 ml of the extract to a 10 ml volumetric flask, and fill to volume with isooctane.
Conjugated Dienes (Do not delay in measuring these, as they are highly unstable)
1. First blank the spectrophotometer at 233 nm using isooctane in a quartz cuvette.
Run the blank again 1 - 2 times, or until the blank value levels off. After each reading, triple rinse the cuvette with a small amount of hexane using a Pasteur pipette, and then rinse off the outer sides with hexane and wipe gently with a Kim wipe. Allow cuvette to dry completely before reading the next sample. Use only one quartz cuvette for the entire procedure and always place the cuvette in the same slot in the spectrophotometer.
2. Mix the solution contained in the 10 ml volumetric flask with a pipette. 3. Transfer solution to a quartz cuvette and read absorbance at 233 nm. 4. If the absorbance is more than 1, dilute the solution and re-measure the absorbance.
Free Fatty Acids
1. Add 1 ml of cupric-acetate-pyridine reagent while in the hood to each 2. Cap tube and shake vigorously for 1 min 3. Centrifuge on small benchtop centrifuge for 1 min 4. Remove 3 ml of the organic layer into a visible light cuvette, and read absorbance at
715 nm against a blank of isooctane 5. If the absorbance is more than 1, dilute the solution and re-measure the absorbance Cleanup
1. Using the evaporated hexane in the rotary evaporator, rinse out the round bottom
flasks. Allow the Erlenmeyer flasks containing flour to dry in the hood before dumping out the flour. Clean all glassware thoroughly with brushes and soap. Dry in forced draft oven (do not burn glassware).
Reagents Cupric Acetate Pyridine: Dissolve 5.0 g copper(II) acetate in ~60 mL water. You will likely need to warm and stir the solution on a stir plate. After the solid is dissolved, adjust the pH to 6.1 with pyridine in a fume hood. Quantitatively transfer the solution to a 100 mL volumetric flask and fill to volume with distilled water. Filter through Whatman No. 1 filter paper into an amber bottle with PTFE(Teflon)-lined cap. Can be stored up to six months.

28
Calculations 1. Calculate the conjugated diene (CD) concentration according to the following
equation:
𝑐𝑐𝐶𝐶𝐶𝐶 =A233
(𝜀𝜀 × 𝑙𝑙)
Where 𝑐𝑐CD is the CD concentration (mol/L), A233is the absorbance of the solution at 233 nm, 𝜀𝜀 is the extinction coefficient of linoleic acid hydroperoxide at 233 nm (2.525 × 10⁴ M−1 ∙ cm−1), and l is the path length of the cuvette (1 cm)
2. Calculate the CD concentration in the sample according to the following equation:
𝐶𝐶𝐶𝐶𝑠𝑠 =(𝑐𝑐𝐶𝐶𝐶𝐶 × 10 × 10 × 1000)
𝑠𝑠
Where 𝐶𝐶𝐶𝐶𝑠𝑠 is the sample CD concentration (μmol/g sample), 𝑐𝑐𝐶𝐶𝐶𝐶 is the CD concentration obtained above (mol/L), 10 is the volume of isooctane used to dissolve the extracted lipid (ml), 10 is the dilution factor, 1000 is a conversion factor from mol/L to μmol/ml, and s is the sample weight (g)
3. Quantify free fatty acids using a standard curve created with oleic acid: prepare ~10 mM oleic acid in isooctane (record exact concentration). MW of oleic acid is 282.46 g/mol, i.e., 0.0706 g oleic acid diluted to 25 ml with isooctane will give 10 mM. Dilute the prepared oleic acid solution with isooctane according to the following dilution scheme:
Standard Oleic Acid standard (ml) Isooctane (ml)
Approximate concentration
(mM) 1 1 4 2 2 2 3 4 3 3 2 6 4 4 1 8 5 5 0 10
Read absorbance of each standard at 715 nm against a blank of isooctane and create a standard curve.

29
Riboflavin and Thiamin
AOAC Method 953.17. 2003
Performed under subdued light
DAY 1
Materials:
• 250 Erlenmeyer Flask (1 per sample)• 50 or 100 mL beakers• Glass stir rods• N HCl• Octanol• M Sodium acetate• Takadiastase
Method:
1. Measure exactly 5.0 grams sample, Pour into 250 ml Erlenmeyer flask.2. Add 50 ml of 0.1 N HCl (washing down the sides of the flask), mix with a glass rod
(wetting all flour), rinse glass rod with small amount of distilled water.3. Add 0.5 ml Octanol.4. Cover with beaker and autoclave @ 121°C for 30 minutes.5. While still warm, wash sample off the sides of the flask with small amount of
distilled water.6. Cool in ice bath for 4 minutes.7. Adjust pH to 4.5 with 2.5 M Sodium Acetate. Wear gloves and goggles.8. Add 500 mg Fluka Takadiastase, swirl, wash down sides with distilled water.9. Cover in foil and incubate @ 37°C for 18 hours.
DAY 2
Materials:
• Whatman #541 filter paper• Glass funnels (long or short stem)• 200 ml volumetric flasks• 20 ml syringe• 50 ml screw cap centrifuge tubes.• 3 ml syringes• 0.2 um filters

30
• NaCl • 1 % Ferricyanide solution • 15% NaOH • Isobutanol (Isobutyl alcohol)
Method:
10. After incubation, filter the solution using Whatman #541 filter paper, and a funnel. Collect the filtrate in a 200 ml volumetric flask (covered with foil). With distilled water, triple rinse the Erlenmeyer flask, filtering each time. Using a 20 ml syringe, triple rinse the filter paper, making sure to agitate the unfiltered sample aliquot each time. Bring the flask to volume. Filter approximately one milliliter of filtrate through a 0.2 μm membrane into a darkened HPLC vial for riboflavin determination. 12. While filtering, add 2.5 g NaCl to large centrifuge tube (50 ml) and prepare the oxidizing reagent. 13. Preparing the oxidizing reagent: wear nitrile gloves throughout all oxidizing steps - Prepare (fresh, on day of use) 1% Potassium Ferricyanide. - Prepare (does not need to be prepared fresh, on the day of use) 15% NaOH. - Finally, prepare the oxidizing reagent (fresh on day of use). Use within 4 hours. 14. With foil, cover the centrifuge tube prepared with 2.5 g NaCl. 15. Add 10 ml filtered solution to the centrifuge tube. 16. Gently swirl (don’t shake) each tube until most of the salt is dissolved. (Swirl so that it takes about 1.5 minutes for the salt to dissolve) 17. While gently swirling, add 3 ml oxidizing reagent. (Add reagent all at once using pipette set for 3 ml, making sure that the stream of solution does not hit the sides of the tube). 18. Gently swirl for about 5 seconds, immediately add 15 ml Isobutanol with 5 ml pipette. 19. Cap and shake tube vigorously for 15-20 seconds. 20. Move on to the next tube. 21. After Isobutanol has been added to all tubes, shake them all for 2 minutes. 22. Centrifuge tubes at 1/4 speed for 4 minutes, or until clear supernatant can be obtained from each. 23. Filter approximately 1 ml of supernatant through 0.2 µm membrane into an amber HPLC vial for thiamine determination.

31
Reagents:
Making 0.1 N HCl:
1. In a 1000 ml volumetric flask add 8.2 ml of concentrated HCl. Bring to volume with distilled water. Can also be done by substituting 16.4 ml 1:1 diluted HCl for the concentrated HCl
2. Making 2.5 M Sodium Acetate: 3. In a 200 ml volumetric flask dissolve 68.04 g Sodium Acetate Trihydrate. Bring to
volume with distilled water. 4. Making 15% NaOH:
a. Add 15 g NaOH to a 100 ml volumetric flask. Fill to volume with distilled water.
5. Making 1% Potassium Ferricyanide: 6. In a 10 ml volumetric flask dissolve 0.1 g K3Fe(CN)6. Bring to volume with distilled
water. 7. Making Alkaline Potassium Ferricyanide (Oxidizing Reagent): 8. Add 1 ml of 1% Potassium Ferricyanide to a 25ml volumetric flask. Fill to volume
with 15% NaOH.

32
[weight of dish + sample before drying] - [weight of sample after drying] [weight of dish + sample before drying] - [weight of empty dish]
Moisture Analysis
Materials:
• Plastic petri dishes• Aluminum sample dishes
o Dry aluminum dishes in oven at 130° C for 20 minutes. After drying, placedried dishes in a desiccator. Allow to cool for approx. 15 minutes beforeusing.
• Desiccators with dry sodium sulfate
Method:
Note: Gloves should be worn throughout the entire procedure to ensure that finger prints and skin oils do not get on the dishes. Label dishes before weighing. Moisture analysis should be done in subdued lighting to ensure that future samples are not affected.
If sample contains less than 15% moisture, proceed to step 9. Otherwise, begin with step 1.
1. Label petri dishes with sample identification. Duplicate each sample.2. Weigh petri dishes with lids and record weight.3. Fill petri dishes with ~10 g of moist samples. Cover and record the weight of both
dish and sample immediately.4. Set out all samples in the fume hood. Be very careful removing the lids from the
dishes so they can dry. Make sure no sample is lost as the lid is being removed orreplaced.
5. Allow samples to sit, uncovered and undisturbed for at least one day in the hood.6. Cover samples and weigh the dish + dry sample.7. Label aluminum dishes.8. Weigh empty aluminum dish. Record weight.9. Weigh 2 grams of dried sample into an aluminum dish and record the weight of the
dish + sample.10. Place aluminum dish with sample into desiccator while other samples are being
prepared.11. Place samples in the forced draft oven and heat for 1 hour at 130° C.12. After heating, return samples to desiccator and allow to cool for approx. 15 minutes
before recording the final weight.13. To determine % moisture (for samples with less than 15% moisture):
( ) * 100

33
(100 - % Moisture loss on air drying] X (% moist. Loss on oven drying) 100
% moisture loss on air drying
14. To determine % moisture (for samples with greater than 15% moisture) +
Bottom formula taken from AACC 44-15A Eq. 3

34
OPTIMIZED STRAIGHT-DOUGH BREAD-BAKING METHOD FOR WHOLE WHEAT FLOUR
Adapted from AACC International Method 10-10.03
Apparatus
1. Mixers for doughs from 100 g flour. Pin-type mixer with recommended head speedof 100-125 rpm.
2. Cabinet for fermenting and proofing doughs, capable of maintaining constanttemperature of 40 ± 1°C (104 ± 2°F) and 80% relative humidity.
3. Sheeter for punching and sheeting before molding, with 6-in. rolls.4. Baking pans for loaves from 100 g flour having proportions of commercial pans for
1-lb loaves. Dimensions—top inside, about 14.3 × 7.9 cm (55/8 × 31/8 in.); bottomoutside, about 12.9 × 6.4 cm (51/16 × 21/2 in.); inside depth, about 5.7 cm (21/4 in.).
5. Oven. Reel or rotary, gas or electric, with level baking surfaces and capable ofmaintaining temperature of 175-210°C (350-400°F).
6. Fermentation bowls, stainless steel or plastic, with capacities of 750-800 mL and topinside diameter of about 14.76 cm (513/16 in.) for doughs from 100 g flour.
7. Thermometer.8. Timer/stopwatch, used for starting and stopping dough mixer and as alarm for
punching, panning, and oven schedules.9. Loaf volumeter, seed-displacement type.10. Balance, accurate to 0.1 g.11. Miscellaneous. Scoops, pipets (mechanical, up to 5.50 mL), beakers, etc.
Formula
Flour basis (%) Whole wheat flour 100.0 Water, distilled variable (about 56.6) Yeast, active dry 8.6 Sucrose 6.0 Salt, NaCl 1.5
Ingredient Specifications
Flour. From whole wheat. Water, distilled. Yeast, active dry. Sucrose. Finely granulated, white, commercial grade. Salt. NaCl, non-iodized, finely granulated, chemically pure. Shortening. Partially hydrogenated vegetable oils.

35
Reagents
Ingredients may be combined in dry form, but efficiency and accuracy are increased when solutions and suspensions are prepared in advance.
Preparation of sugar-salt solution and yeast suspension
These preparations provide stock solution of sugar and salt and yeast suspension of such strength that 11 mL (14.1 g) of sugar-salt solution and 30 mL of yeast suspensions contain required quantities of ingredients per 100 g flour.
1. Sugar-salt solution to give 6 g sugar and 1.5 g salt in 11 mL (14.1 g) solution. Weight 545.45 g sugar and 136.35 g NaCl and place in 1-liter volumetric flask. Add distilled water to cover solids and mix thoroughly. Continue adding water and shake until sugar and salt are dissolved and 1-liter mark is reached. Sufficient for 90 loaves. Will keep for several weeks at room temperature. Discard if cloudiness is noted.
2. Yeast suspension to give 8.6 g in 30 mL of suspension. Weigh 57.3 g active dry yeast in 250 mL beaker. Heat distilled water to 50°C (122°F). Fill beaker with hot distilled water to 100 mL mark. Mix until yeast is suspended. Continue adding hot distilled water and bring to 200 g total weight. Yeast suspension should be continually stirred slowly with a magnetic stirrer. Sufficient for 6 loaves from 100 g flour. Must be made fresh daily, immediately prior to bread-making, as bubbles and foam will form over time.
Water calculation
Water in form of stock solution added per 100 g flour:
Water (mL) 30 mL yeast suspension 21.4 11 mL sugar-salt solution 6.6
Mixing Procedure
*Loaves must bake one at a time, entering oven ½ hour after previous has left (to regularize moisture in oven).
Preheat fermentation cabinet and oven. Condition oven with 1-liter beaker full of water placed on one shelf throughout baking.
Arrange solutions as desired for dispensing into bowl. Continuously stir yeast suspension with magnetic stirrer. Adjust solutions to such temperature that when mixed with dry ingredients, and any extra water that is required, doughs will come from mixer at 39 ± 0.5°C.

36
1. Place dry ingredients (flour and shortening) into mixing bowl. Make pocket as large as feasibly possible in center of mixture for containing liquids. Then add liquids.
2. Place bowl on mixer and set automatic timer about 10 min. Mix for 6-7 min, and remove from mixing bowl.
3. Round dough by hand, keeping smooth skin on top side. Observe and record dough characteristics. Place seam side down gently in lightly greased fermentation bowl, place in fermentation cabinet, and begin fermentation schedule.
Fermentation and Punching Schedule
First punch (35 min after end of mixing)
1. Remove dough from cabinet and remove from fermentation bowl. 2. Pass through sheeter lengthwise. For doughs from 100 g flour, use 3-in. roll width
and 3/16-in. roll spacing. 3. Fold sheeted dough in half and in half again. Place folded dough, crease down, in
bowl and return to fermentation cabinet. Record dough characteristics.
Second punch/Molding and panning (17 min later)
1. Repeat steps 1-2 of first punch. 2. Roll sheeted dough by hand into a cylinder. Insert index fingers into ends of dough
cylinder, remove fingers, and roll dough into loaf shape by hand. 3. Place seam side down in lightly but thoroughly greased baking pan. Put paper label
preferably on each end of pan to identify sample. Return to fermentation cabinet.
Proofing
To proof to desired height usually requires 30 ± 2 min.
Baking
Oven temperature for loaves from 100 g flour is 175°C (350°F), and bake time is 32 min.
Scoring
1. Measure volume of loaves by rapeseed displacement 1 hr after removing form oven. 2. Place in wax or plastic bag for scoring external and internal characteristics on next
day.

37
Statistical Analysis Results
The SAS System 707 11:16 Monday, November 2, 2015
----------------------------- Analysis=CD Sample type=BR ------------------------------
The Mixed Procedure
Model Information
Data Set WORK.IN Dependent Variable Means Covariance Structure Variance Components Estimation Method REML Residual Variance Method Profile Fixed Effects SE Method Model-Based Degrees of Freedom Method Containment
Class Level Information
Class Levels Values
Lot 2 Dixiebelle Wells Month 4 0 4 8 12
Dimensions
Covariance Parameters 2 Columns in X 5 Columns in Z 2 Subjects 1 Max Obs Per Subject 8

38
Number of Observations Number of Observations Read 8 Number of Observations Used 8 Number of Observations Not Used 0 Iteration History Iteration Evaluations -2 Res Log Like Criterion 0 1 -14.43089429 1 1 -14.43089429 0.00000000 Convergence criteria met.

39
The SAS System 708 11:16 Monday, November 2, 2015 ----------------------------- Analysis=CD Sample type=BR ------------------------------ The Mixed Procedure Covariance Parameter Estimates Cov Parm Estimate Lot 0 Residual 0.000794 Fit Statistics -2 Res Log Likelihood -14.4 AIC (smaller is better) -12.4 AICC (smaller is better) -10.4 BIC (smaller is better) -13.7 Type 3 Tests of Fixed Effects Num Den Effect DF DF F Value Pr > F Month 3 3 4.54 0.1228 Least Squares Means Standard Effect Month Estimate Error DF t Value Pr > |t|

40
Month 0 0.3676 0.01992 3 18.45 0.0003 Month 4 0.3717 0.01992 3 18.66 0.0003 Month 8 0.3725 0.01992 3 18.70 0.0003 Month 12 0.4554 0.01992 3 22.86 0.0002 Differences of Least Squares Means Standard Effect Month Month Estimate Error DF t Value Pr > |t| Adjustment Adj P Month 0 4 -0.00411 0.02817 3 -0.15 0.8933 Tukey 0.9987 Month 0 8 -0.00490 0.02817 3 -0.17 0.8730 Tukey 0.9977 Month 0 12 -0.08781 0.02817 3 -3.12 0.0526 Tukey 0.1475 Month 4 8 -0.00079 0.02817 3 -0.03 0.9794 Tukey 1.0000 Month 4 12 -0.08370 0.02817 3 -2.97 0.0590 Tukey 0.1641 Month 8 12 -0.08291 0.02817 3 -2.94 0.0604 Tukey 0.1676

41
The SAS System 709 11:16 Monday, November 2, 2015 ----------------------------- Analysis=CD Sample type=RO ------------------------------ The Mixed Procedure Model Information Data Set WORK.IN Dependent Variable Means Covariance Structure Variance Components Estimation Method REML Residual Variance Method Profile Fixed Effects SE Method Model-Based Degrees of Freedom Method Containment Class Level Information Class Levels Values Lot 2 2436 27333 Month 4 0 4 8 12 Dimensions Covariance Parameters 2 Columns in X 5 Columns in Z 2 Subjects 1 Max Obs Per Subject 8 Number of Observations

42
Number of Observations Read 8 Number of Observations Used 8 Number of Observations Not Used 0 Iteration History Iteration Evaluations -2 Res Log Like Criterion 0 1 4.76939622 1 1 4.76939622 0.00000000 Convergence criteria met.

43
The SAS System 710 11:16 Monday, November 2, 2015 ----------------------------- Analysis=CD Sample type=RO ------------------------------ The Mixed Procedure Covariance Parameter Estimates Cov Parm Estimate Lot 0 Residual 0.09646 Fit Statistics -2 Res Log Likelihood 4.8 AIC (smaller is better) 6.8 AICC (smaller is better) 8.8 BIC (smaller is better) 5.5 Type 3 Tests of Fixed Effects Num Den Effect DF DF F Value Pr > F Month 3 3 12.86 0.0322 Least Squares Means Standard Effect Month Estimate Error DF t Value Pr > |t|

44
Month 0 1.6719 0.2196 3 7.61 0.0047 Month 4 1.9752 0.2196 3 8.99 0.0029 Month 8 3.0504 0.2196 3 13.89 0.0008 Month 12 3.2725 0.2196 3 14.90 0.0007 Differences of Least Squares Means Standard Effect Month Month Estimate Error DF t Value Pr > |t| Adjustment Adj P Month 0 4 -0.3033 0.3106 3 -0.98 0.4008 Tukey 0.7728 Month 0 8 -1.3785 0.3106 3 -4.44 0.0213 Tukey 0.0622 Month 0 12 -1.6006 0.3106 3 -5.15 0.0142 Tukey 0.0420 Month 4 8 -1.0752 0.3106 3 -3.46 0.0406 Tukey 0.1155 Month 4 12 -1.2973 0.3106 3 -4.18 0.0250 Tukey 0.0727 Month 8 12 -0.2221 0.3106 3 -0.72 0.5262 Tukey 0.8857

45
The SAS System 711 11:16 Monday, November 2, 2015 ----------------------------- Analysis=CD Sample type=WWF ----------------------------- The Mixed Procedure Model Information Data Set WORK.IN Dependent Variable Means Covariance Structure Variance Components Estimation Method REML Residual Variance Method Profile Fixed Effects SE Method Model-Based Degrees of Freedom Method Containment Class Level Information Class Levels Values Lot 2 106618 107579 Month 4 0 4 8 12 Dimensions Covariance Parameters 2 Columns in X 5 Columns in Z 2 Subjects 1 Max Obs Per Subject 8 Number of Observations

46
Number of Observations Read 8 Number of Observations Used 8 Number of Observations Not Used 0 Iteration History Iteration Evaluations -2 Res Log Like Criterion 0 1 -12.46266991 1 1 -12.46266991 0.00000000 Convergence criteria met.

47
The SAS System 712 11:16 Monday, November 2, 2015 ----------------------------- Analysis=CD Sample type=WWF ----------------------------- The Mixed Procedure Covariance Parameter Estimates Cov Parm Estimate Lot 0 Residual 0.001298 Fit Statistics -2 Res Log Likelihood -12.5 AIC (smaller is better) -10.5 AICC (smaller is better) -8.5 BIC (smaller is better) -11.8 Type 3 Tests of Fixed Effects Num Den Effect DF DF F Value Pr > F Month 3 3 4.98 0.1102 Least Squares Means Standard Effect Month Estimate Error DF t Value Pr > |t|

48
Month 0 0.4246 0.02548 3 16.67 0.0005 Month 4 0.3844 0.02548 3 15.09 0.0006 Month 8 0.4869 0.02548 3 19.11 0.0003 Month 12 0.5082 0.02548 3 19.95 0.0003 Differences of Least Squares Means Standard Effect Month Month Estimate Error DF t Value Pr > |t| Adjustment Adj P Month 0 4 0.04020 0.03603 3 1.12 0.3459 Tukey 0.7069 Month 0 8 -0.06228 0.03603 3 -1.73 0.1823 Tukey 0.4422 Month 0 12 -0.08359 0.03603 3 -2.32 0.1031 Tukey 0.2723 Month 4 8 -0.1025 0.03603 3 -2.84 0.0654 Tukey 0.1805 Month 4 12 -0.1238 0.03603 3 -3.44 0.0414 Tukey 0.1177 Month 8 12 -0.02131 0.03603 3 -0.59 0.5959 Tukey 0.9285

49
The SAS System 713 11:16 Monday, November 2, 2015 ----------------------------- Analysis=FFA Sample type=BR ----------------------------- The Mixed Procedure Model Information Data Set WORK.IN Dependent Variable Means Covariance Structure Variance Components Estimation Method REML Residual Variance Method Profile Fixed Effects SE Method Model-Based Degrees of Freedom Method Containment Class Level Information Class Levels Values Lot 2 Dixiebelle Wells Month 4 0 4 8 12 Dimensions Covariance Parameters 2 Columns in X 5 Columns in Z 2 Subjects 1 Max Obs Per Subject 8 Number of Observations
50
Number of Observations Read 8 Number of Observations Used 8 Number of Observations Not Used 0 Iteration History Iteration Evaluations -2 Res Log Like Criterion 0 1 -2.08652136 1 1 -2.09590234 0.00000000 Convergence criteria met.

51
The SAS System 714 11:16 Monday, November 2, 2015 ----------------------------- Analysis=FFA Sample type=BR ----------------------------- The Mixed Procedure Covariance Parameter Estimates Cov Parm Estimate Lot 0.000704 Residual 0.01667 Fit Statistics -2 Res Log Likelihood -2.1 AIC (smaller is better) 1.9 AICC (smaller is better) 13.9 BIC (smaller is better) -0.7 Type 3 Tests of Fixed Effects Num Den Effect DF DF F Value Pr > F Month 3 3 29.91 0.0098 Least Squares Means Standard Effect Month Estimate Error DF t Value Pr > |t|

52
Month 0 2.0579 0.09321 3 22.08 0.0002 Month 4 1.3151 0.09321 3 14.11 0.0008 Month 8 1.2284 0.09321 3 13.18 0.0009 Month 12 2.1992 0.09321 3 23.59 0.0002 Differences of Least Squares Means Standard Effect Month Month Estimate Error DF t Value Pr > |t| Adjustment Adj P Month 0 4 0.7428 0.1291 3 5.75 0.0104 Tukey-Kramer 0.0311 Month 0 8 0.8295 0.1291 3 6.42 0.0076 Tukey-Kramer 0.0229 Month 0 12 -0.1413 0.1291 3 -1.09 0.3537 Tukey-Kramer 0.7169 Month 4 8 0.08663 0.1291 3 0.67 0.5503 Tukey-Kramer 0.9019 Month 4 12 -0.8842 0.1291 3 -6.85 0.0064 Tukey-Kramer 0.0192 Month 8 12 -0.9708 0.1291 3 -7.52 0.0049 Tukey-Kramer 0.0147

53
The SAS System 715 11:16 Monday, November 2, 2015 ----------------------------- Analysis=FFA Sample type=RO ----------------------------- The Mixed Procedure Model Information Data Set WORK.IN Dependent Variable Means Covariance Structure Variance Components Estimation Method REML Residual Variance Method Profile Fixed Effects SE Method Model-Based Degrees of Freedom Method Containment Class Level Information Class Levels Values Lot 2 2436 27333 Month 4 0 4 8 12 Dimensions Covariance Parameters 2 Columns in X 5 Columns in Z 2 Subjects 1 Max Obs Per Subject 8 Number of Observations

54
Number of Observations Read 8 Number of Observations Used 8 Number of Observations Not Used 0 Iteration History Iteration Evaluations -2 Res Log Like Criterion 0 1 8.15296916 1 1 4.81973887 0.00000000 Convergence criteria met.

55
The SAS System 716 11:16 Monday, November 2, 2015 ----------------------------- Analysis=FFA Sample type=RO ----------------------------- The Mixed Procedure Covariance Parameter Estimates Cov Parm Estimate Lot 0.1752 Residual 0.04950 Fit Statistics -2 Res Log Likelihood 4.8 AIC (smaller is better) 8.8 AICC (smaller is better) 20.8 BIC (smaller is better) 6.2 Type 3 Tests of Fixed Effects Num Den Effect DF DF F Value Pr > F Month 3 3 9.09 0.0514 Least Squares Means Standard Effect Month Estimate Error DF t Value Pr > |t|
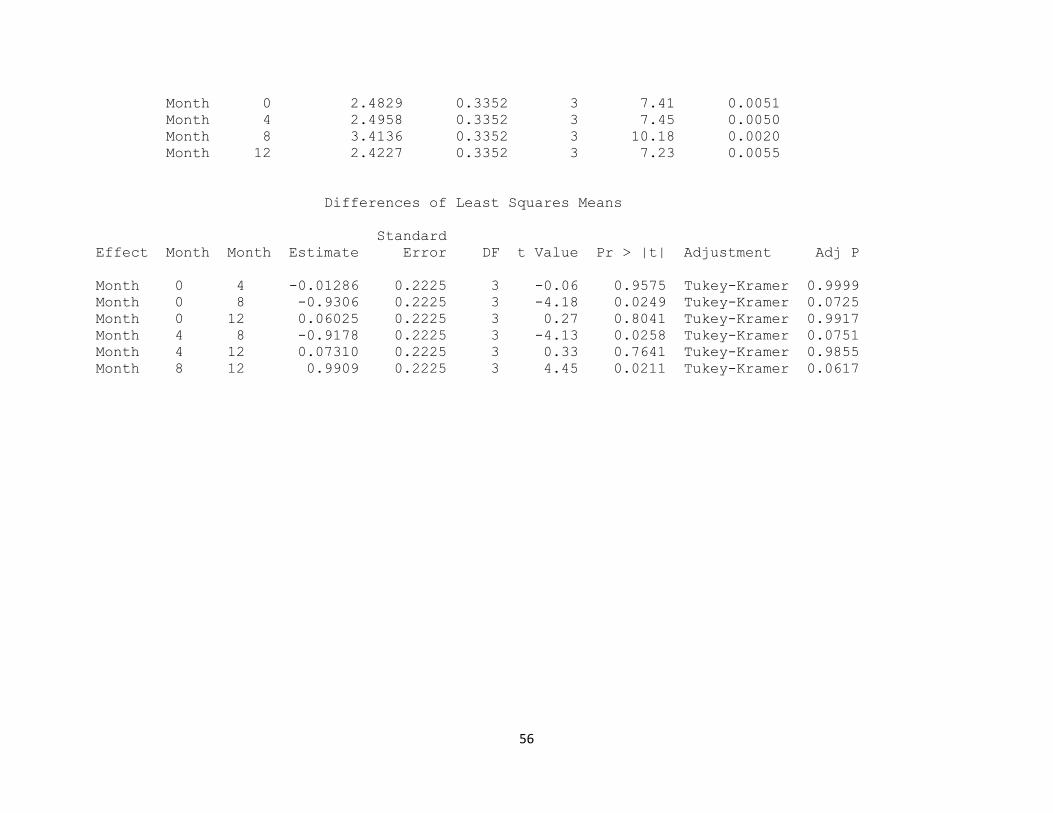
56
Month 0 2.4829 0.3352 3 7.41 0.0051 Month 4 2.4958 0.3352 3 7.45 0.0050 Month 8 3.4136 0.3352 3 10.18 0.0020 Month 12 2.4227 0.3352 3 7.23 0.0055 Differences of Least Squares Means Standard Effect Month Month Estimate Error DF t Value Pr > |t| Adjustment Adj P Month 0 4 -0.01286 0.2225 3 -0.06 0.9575 Tukey-Kramer 0.9999 Month 0 8 -0.9306 0.2225 3 -4.18 0.0249 Tukey-Kramer 0.0725 Month 0 12 0.06025 0.2225 3 0.27 0.8041 Tukey-Kramer 0.9917 Month 4 8 -0.9178 0.2225 3 -4.13 0.0258 Tukey-Kramer 0.0751 Month 4 12 0.07310 0.2225 3 0.33 0.7641 Tukey-Kramer 0.9855 Month 8 12 0.9909 0.2225 3 4.45 0.0211 Tukey-Kramer 0.0617

57
The SAS System 717 11:16 Monday, November 2, 2015 ---------------------------- Analysis=FFA Sample type=WWF ----------------------------- The Mixed Procedure Model Information Data Set WORK.IN Dependent Variable Means Covariance Structure Variance Components Estimation Method REML Residual Variance Method Profile Fixed Effects SE Method Model-Based Degrees of Freedom Method Containment Class Level Information Class Levels Values Lot 2 106618 107579 Month 4 0 4 8 12 Dimensions Covariance Parameters 2 Columns in X 5 Columns in Z 2 Subjects 1 Max Obs Per Subject 8 Number of Observations

58
Number of Observations Read 8 Number of Observations Used 8 Number of Observations Not Used 0 Iteration History Iteration Evaluations -2 Res Log Like Criterion 0 1 24.93999929 1 1 23.67164946 0.00000000 Convergence criteria met.

59
The SAS System 718 11:16 Monday, November 2, 2015 ---------------------------- Analysis=FFA Sample type=WWF ----------------------------- The Mixed Procedure Covariance Parameter Estimates Cov Parm Estimate Lot 7.7872 Residual 7.1518 Fit Statistics -2 Res Log Likelihood 23.7 AIC (smaller is better) 27.7 AICC (smaller is better) 39.7 BIC (smaller is better) 25.1 Type 3 Tests of Fixed Effects Num Den Effect DF DF F Value Pr > F Month 3 3 13.78 0.0293 Least Squares Means Standard Effect Month Estimate Error DF t Value Pr > |t|

60
Month 0 12.6297 2.7330 3 4.62 0.0191 Month 4 19.7912 2.7330 3 7.24 0.0054 Month 8 22.4364 2.7330 3 8.21 0.0038 Month 12 29.6214 2.7330 3 10.84 0.0017 Differences of Least Squares Means Standard Effect Month Month Estimate Error DF t Value Pr > |t| Adjustment Adj P Month 0 4 -7.1615 2.6743 3 -2.68 0.0752 Tukey-Kramer 0.2050 Month 0 8 -9.8067 2.6743 3 -3.67 0.0351 Tukey-Kramer 0.1006 Month 0 12 -16.9918 2.6743 3 -6.35 0.0079 Tukey-Kramer 0.0236 Month 4 8 -2.6452 2.6743 3 -0.99 0.3955 Tukey-Kramer 0.7669 Month 4 12 -9.8303 2.6743 3 -3.68 0.0349 Tukey-Kramer 0.1000 Month 8 12 -7.1851 2.6743 3 -2.69 0.0746 Tukey-Kramer 0.2036

61
The SAS System 719 11:16 Monday, November 2, 2015 ------------------------- Analysis=Riboflavin Sample type=BR -------------------------- The Mixed Procedure Model Information Data Set WORK.IN Dependent Variable Means Covariance Structure Variance Components Estimation Method REML Residual Variance Method Profile Fixed Effects SE Method Model-Based Degrees of Freedom Method Containment Class Level Information Class Levels Values Lot 2 Dixiebelle Wells Month 4 0 4 8 12 Dimensions Covariance Parameters 2 Columns in X 5 Columns in Z 2 Subjects 1 Max Obs Per Subject 8 Number of Observations

62
Number of Observations Read 8 Number of Observations Used 8 Number of Observations Not Used 0 Iteration History Iteration Evaluations -2 Res Log Like Criterion 0 1 -22.04684987 1 1 -22.04684987 0.00000000 Convergence criteria met.

63
The SAS System 720 11:16 Monday, November 2, 2015 ------------------------- Analysis=Riboflavin Sample type=BR -------------------------- The Mixed Procedure Covariance Parameter Estimates Cov Parm Estimate Lot 0 Residual 0.000118 Fit Statistics -2 Res Log Likelihood -22.0 AIC (smaller is better) -20.0 AICC (smaller is better) -18.0 BIC (smaller is better) -21.4 Type 3 Tests of Fixed Effects Num Den Effect DF DF F Value Pr > F Month 3 3 0.50 0.7109 Least Squares Means Standard Effect Month Estimate Error DF t Value Pr > |t|

64
Month 0 0.06909 0.007689 3 8.99 0.0029 Month 4 0.07059 0.007689 3 9.18 0.0027 Month 8 0.08054 0.007689 3 10.47 0.0019 Month 12 0.07713 0.007689 3 10.03 0.0021 Differences of Least Squares Means Standard Effect Month Month Estimate Error DF t Value Pr > |t| Adjustment Adj P Month 0 4 -0.00150 0.01087 3 -0.14 0.8993 Tukey 0.9989 Month 0 8 -0.01144 0.01087 3 -1.05 0.3699 Tukey 0.7370 Month 0 12 -0.00804 0.01087 3 -0.74 0.5132 Tukey 0.8762 Month 4 8 -0.00995 0.01087 3 -0.91 0.4278 Tukey 0.8013 Month 4 12 -0.00654 0.01087 3 -0.60 0.5897 Tukey 0.9252 Month 8 12 0.003403 0.01087 3 0.31 0.7748 Tukey 0.9874

65
The SAS System 721 11:16 Monday, November 2, 2015 ------------------------- Analysis=Riboflavin Sample type=RO -------------------------- The Mixed Procedure Model Information Data Set WORK.IN Dependent Variable Means Covariance Structure Variance Components Estimation Method REML Residual Variance Method Profile Fixed Effects SE Method Model-Based Degrees of Freedom Method Containment Class Level Information Class Levels Values Lot 2 2436 27333 Month 4 0 4 8 12 Dimensions Covariance Parameters 2 Columns in X 5 Columns in Z 2 Subjects 1 Max Obs Per Subject 8 Number of Observations

66
Number of Observations Read 8 Number of Observations Used 8 Number of Observations Not Used 0 Iteration History Iteration Evaluations -2 Res Log Like Criterion 0 1 -22.75459604 1 1 -22.75459604 0.00000000 Convergence criteria met.
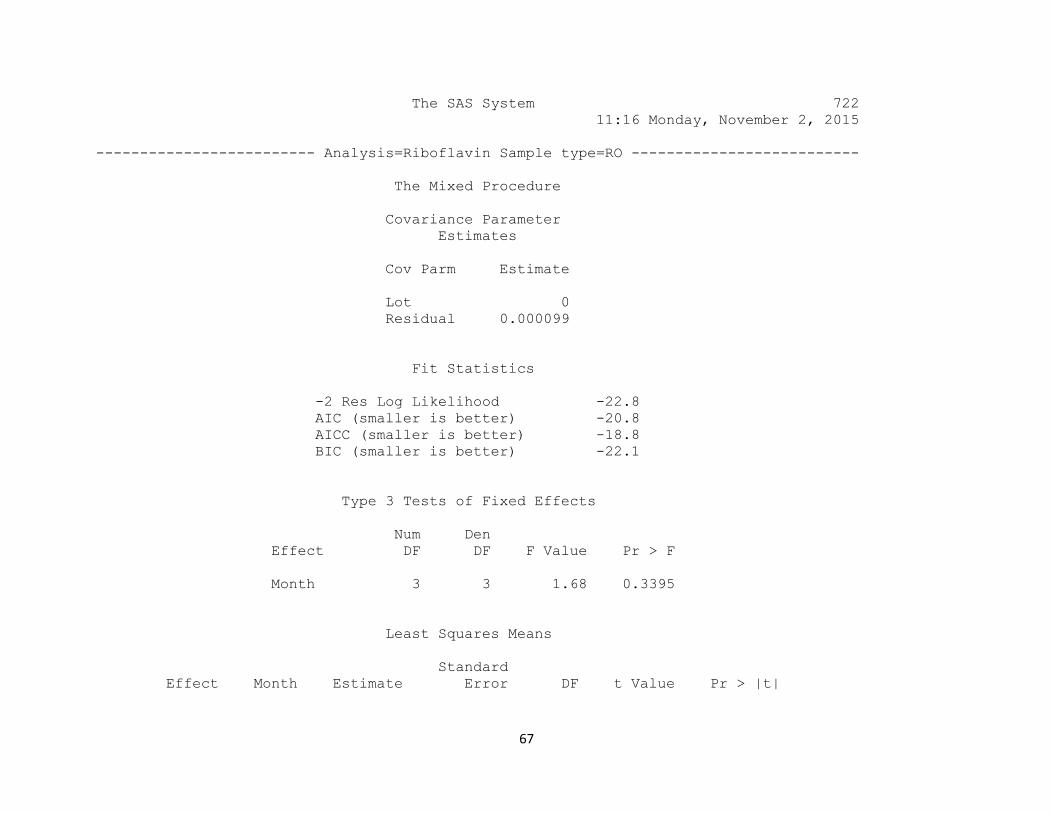
67
The SAS System 722 11:16 Monday, November 2, 2015 ------------------------- Analysis=Riboflavin Sample type=RO -------------------------- The Mixed Procedure Covariance Parameter Estimates Cov Parm Estimate Lot 0 Residual 0.000099 Fit Statistics -2 Res Log Likelihood -22.8 AIC (smaller is better) -20.8 AICC (smaller is better) -18.8 BIC (smaller is better) -22.1 Type 3 Tests of Fixed Effects Num Den Effect DF DF F Value Pr > F Month 3 3 1.68 0.3395 Least Squares Means Standard Effect Month Estimate Error DF t Value Pr > |t|

68
Month 0 0.1072 0.007038 3 15.23 0.0006 Month 4 0.1192 0.007038 3 16.94 0.0004 Month 8 0.1281 0.007038 3 18.20 0.0004 Month 12 0.1119 0.007038 3 15.89 0.0005 Differences of Least Squares Means Standard Effect Month Month Estimate Error DF t Value Pr > |t| Adjustment Adj P Month 0 4 -0.01204 0.009953 3 -1.21 0.3131 Tukey 0.6623 Month 0 8 -0.02093 0.009953 3 -2.10 0.1262 Tukey 0.3250 Month 0 12 -0.00471 0.009953 3 -0.47 0.6684 Tukey 0.9602 Month 4 8 -0.00889 0.009953 3 -0.89 0.4375 Tukey 0.8110 Month 4 12 0.007330 0.009953 3 0.74 0.5148 Tukey 0.8774 Month 8 12 0.01622 0.009953 3 1.63 0.2016 Tukey 0.4792

69
The SAS System 723 11:16 Monday, November 2, 2015 ------------------------- Analysis=Riboflavin Sample type=WWF ------------------------- The Mixed Procedure Model Information Data Set WORK.IN Dependent Variable Means Covariance Structure Variance Components Estimation Method REML Residual Variance Method Profile Fixed Effects SE Method Model-Based Degrees of Freedom Method Containment Class Level Information Class Levels Values Lot 2 106618 107579 Month 4 0 4 8 12 Dimensions Covariance Parameters 2 Columns in X 5 Columns in Z 2 Subjects 1 Max Obs Per Subject 8 Number of Observations

70
Number of Observations Read 8 Number of Observations Used 8 Number of Observations Not Used 0 Iteration History Iteration Evaluations -2 Res Log Like Criterion 0 1 -26.96031614 1 1 -26.98314546 0.00000000 Convergence criteria met.

71
The SAS System 724 11:16 Monday, November 2, 2015 ------------------------- Analysis=Riboflavin Sample type=WWF ------------------------- The Mixed Procedure Covariance Parameter Estimates Cov Parm Estimate Lot 2.218E-6 Residual 0.000032 Fit Statistics -2 Res Log Likelihood -27.0 AIC (smaller is better) -23.0 AICC (smaller is better) -11.0 BIC (smaller is better) -25.6 Type 3 Tests of Fixed Effects Num Den Effect DF DF F Value Pr > F Month 3 3 3.04 0.1928 Least Squares Means Standard Effect Month Estimate Error DF t Value Pr > |t|

72
Month 0 0.1116 0.004160 3 26.83 0.0001 Month 4 0.1111 0.004160 3 26.71 0.0001 Month 8 0.1245 0.004160 3 29.93 <.0001 Month 12 0.1092 0.004160 3 26.25 0.0001 Differences of Least Squares Means Standard Effect Month Month Estimate Error DF t Value Pr > |t| Adjustment Adj P Month 0 4 0.000528 0.005692 3 0.09 0.9319 Tukey-Kramer 0.9997 Month 0 8 -0.01288 0.005692 3 -2.26 0.1086 Tukey-Kramer 0.2852 Month 0 12 0.002452 0.005692 3 0.43 0.6957 Tukey-Kramer 0.9691 Month 4 8 -0.01341 0.005692 3 -2.36 0.0998 Tukey-Kramer 0.2646 Month 4 12 0.001924 0.005692 3 0.34 0.7576 Tukey-Kramer 0.9843 Month 8 12 0.01533 0.005692 3 2.69 0.0742 Tukey-Kramer 0.2025

73
The SAS System 725 11:16 Monday, November 2, 2015 --------------------------- Analysis=Thiamin Sample type=BR --------------------------- The Mixed Procedure Model Information Data Set WORK.IN Dependent Variable Means Covariance Structure Variance Components Estimation Method REML Residual Variance Method Profile Fixed Effects SE Method Model-Based Degrees of Freedom Method Containment Class Level Information Class Levels Values Lot 2 Dixiebelle Wells Month 4 0 4 8 12 Dimensions Covariance Parameters 2 Columns in X 5 Columns in Z 2 Subjects 1 Max Obs Per Subject 8 Number of Observations

74
Number of Observations Read 8 Number of Observations Used 8 Number of Observations Not Used 0 Iteration History Iteration Evaluations -2 Res Log Like Criterion 0 1 -14.32020259 1 1 -15.44900185 0.00000000 Convergence criteria met.

75
The SAS System 726 11:16 Monday, November 2, 2015 --------------------------- Analysis=Thiamin Sample type=BR --------------------------- The Mixed Procedure Covariance Parameter Estimates Cov Parm Estimate Lot 0.000402 Residual 0.000414 Fit Statistics -2 Res Log Likelihood -15.4 AIC (smaller is better) -11.4 AICC (smaller is better) 0.6 BIC (smaller is better) -14.1 Type 3 Tests of Fixed Effects Num Den Effect DF DF F Value Pr > F Month 3 3 2.02 0.2893 Least Squares Means Standard Effect Month Estimate Error DF t Value Pr > |t|
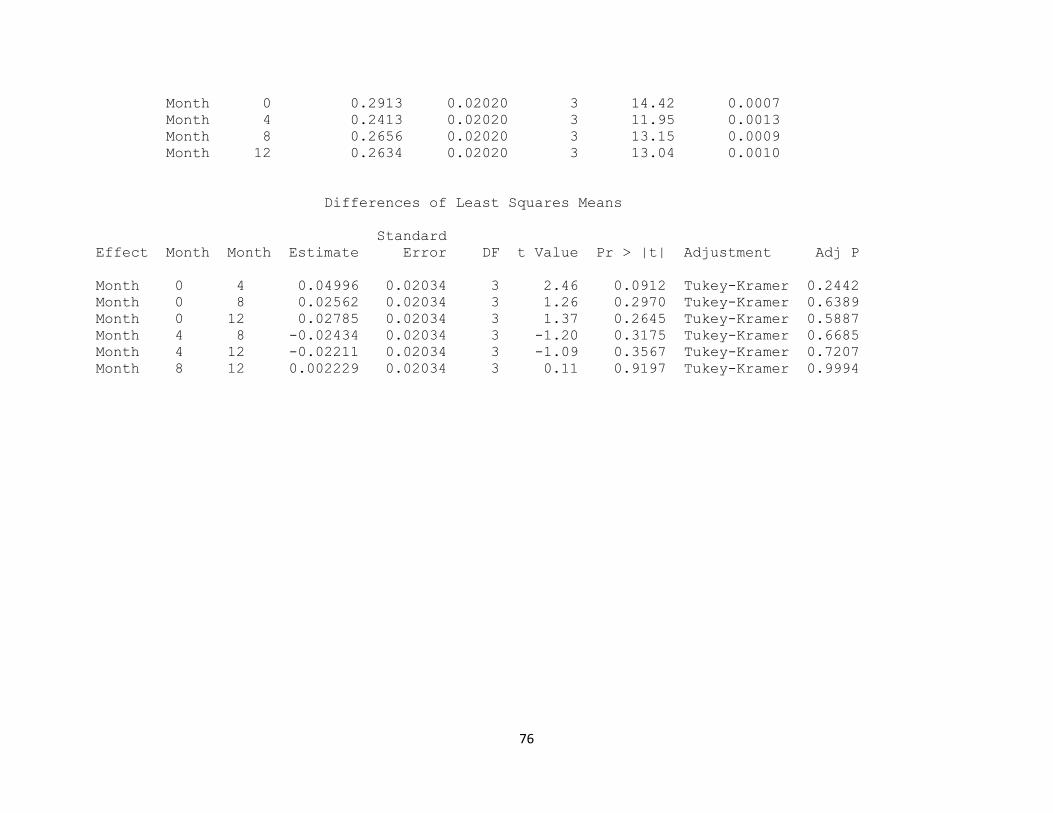
76
Month 0 0.2913 0.02020 3 14.42 0.0007 Month 4 0.2413 0.02020 3 11.95 0.0013 Month 8 0.2656 0.02020 3 13.15 0.0009 Month 12 0.2634 0.02020 3 13.04 0.0010 Differences of Least Squares Means Standard Effect Month Month Estimate Error DF t Value Pr > |t| Adjustment Adj P Month 0 4 0.04996 0.02034 3 2.46 0.0912 Tukey-Kramer 0.2442 Month 0 8 0.02562 0.02034 3 1.26 0.2970 Tukey-Kramer 0.6389 Month 0 12 0.02785 0.02034 3 1.37 0.2645 Tukey-Kramer 0.5887 Month 4 8 -0.02434 0.02034 3 -1.20 0.3175 Tukey-Kramer 0.6685 Month 4 12 -0.02211 0.02034 3 -1.09 0.3567 Tukey-Kramer 0.7207 Month 8 12 0.002229 0.02034 3 0.11 0.9197 Tukey-Kramer 0.9994

77
The SAS System 727 11:16 Monday, November 2, 2015 --------------------------- Analysis=Thiamin Sample type=RO --------------------------- The Mixed Procedure Model Information Data Set WORK.IN Dependent Variable Means Covariance Structure Variance Components Estimation Method REML Residual Variance Method Profile Fixed Effects SE Method Model-Based Degrees of Freedom Method Containment Class Level Information Class Levels Values Lot 2 2436 27333 Month 4 0 4 8 12 Dimensions Covariance Parameters 2 Columns in X 5 Columns in Z 2 Subjects 1 Max Obs Per Subject 8 Number of Observations

78
Number of Observations Read 8 Number of Observations Used 8 Number of Observations Not Used 0 Iteration History Iteration Evaluations -2 Res Log Like Criterion 0 1 -11.16535844 1 1 -11.16535844 0.00000000 Convergence criteria met.

79
The SAS System 728 11:16 Monday, November 2, 2015 --------------------------- Analysis=Thiamin Sample type=RO --------------------------- The Mixed Procedure Covariance Parameter Estimates Cov Parm Estimate Lot 0 Residual 0.001796 Fit Statistics -2 Res Log Likelihood -11.2 AIC (smaller is better) -9.2 AICC (smaller is better) -7.2 BIC (smaller is better) -10.5 Type 3 Tests of Fixed Effects Num Den Effect DF DF F Value Pr > F Month 3 3 1.26 0.4280 Least Squares Means Standard Effect Month Estimate Error DF t Value Pr > |t|

80
Month 0 0.6005 0.02996 3 20.04 0.0003 Month 4 0.5777 0.02996 3 19.28 0.0003 Month 8 0.6037 0.02996 3 20.15 0.0003 Month 12 0.5309 0.02996 3 17.72 0.0004 Differences of Least Squares Means Standard Effect Month Month Estimate Error DF t Value Pr > |t| Adjustment Adj P Month 0 4 0.02278 0.04238 3 0.54 0.6282 Tukey 0.9441 Month 0 8 -0.00319 0.04238 3 -0.08 0.9448 Tukey 0.9998 Month 0 12 0.06958 0.04238 3 1.64 0.1992 Tukey 0.4745 Month 4 8 -0.02596 0.04238 3 -0.61 0.5834 Tukey 0.9217 Month 4 12 0.04680 0.04238 3 1.10 0.3501 Tukey 0.7123 Month 8 12 0.07276 0.04238 3 1.72 0.1845 Tukey 0.4464

81
The SAS System 729 11:16 Monday, November 2, 2015 -------------------------- Analysis=Thiamin Sample type=WWF --------------------------- The Mixed Procedure Model Information Data Set WORK.IN Dependent Variable Means Covariance Structure Variance Components Estimation Method REML Residual Variance Method Profile Fixed Effects SE Method Model-Based Degrees of Freedom Method Containment Class Level Information Class Levels Values Lot 2 106618 107579 Month 4 0 4 8 12 Dimensions Covariance Parameters 2 Columns in X 5 Columns in Z 2 Subjects 1 Max Obs Per Subject 8 Number of Observations

82
Number of Observations Read 8 Number of Observations Used 8 Number of Observations Not Used 0 Iteration History Iteration Evaluations -2 Res Log Like Criterion 0 1 -22.96362137 1 1 -22.96362137 0.00000000 Convergence criteria met.

83
The SAS System 730 11:16 Monday, November 2, 2015 -------------------------- Analysis=Thiamin Sample type=WWF --------------------------- The Mixed Procedure Covariance Parameter Estimates Cov Parm Estimate Lot 0 Residual 0.000094 Fit Statistics -2 Res Log Likelihood -23.0 AIC (smaller is better) -21.0 AICC (smaller is better) -19.0 BIC (smaller is better) -22.3 Type 3 Tests of Fixed Effects Num Den Effect DF DF F Value Pr > F Month 3 3 3.36 0.1729 Least Squares Means Standard Effect Month Estimate Error DF t Value Pr > |t|

84
Month 0 0.4852 0.006857 3 70.77 <.0001 Month 4 0.4561 0.006857 3 66.52 <.0001 Month 8 0.4642 0.006857 3 67.70 <.0001 Month 12 0.4741 0.006857 3 69.14 <.0001 Differences of Least Squares Means Standard Effect Month Month Estimate Error DF t Value Pr > |t| Adjustment Adj P Month 0 4 0.02910 0.009697 3 3.00 0.0576 Tukey 0.1605 Month 0 8 0.02103 0.009697 3 2.17 0.1186 Tukey 0.3080 Month 0 12 0.01118 0.009697 3 1.15 0.3325 Tukey 0.6892 Month 4 8 -0.00808 0.009697 3 -0.83 0.4661 Tukey 0.8377 Month 4 12 -0.01792 0.009697 3 -1.85 0.1617 Tukey 0.4007 Month 8 12 -0.00985 0.009697 3 -1.02 0.3845 Tukey 0.7544

85
The SAS System 731 11:16 Monday, November 2, 2015 ------------------------- Analysis=Tocopherols Sample type=BR ------------------------- The Mixed Procedure Model Information Data Set WORK.IN Dependent Variable Means Covariance Structure Variance Components Estimation Method REML Residual Variance Method Profile Fixed Effects SE Method Model-Based Degrees of Freedom Method Containment Class Level Information Class Levels Values Lot 2 Dixiebelle Wells Month 4 0 4 8 12 Dimensions Covariance Parameters 2 Columns in X 5 Columns in Z 2 Subjects 1 Max Obs Per Subject 8 Number of Observations

86
Number of Observations Read 8 Number of Observations Used 8 Number of Observations Not Used 0 Iteration History Iteration Evaluations -2 Res Log Like Criterion 0 1 20.43450544 1 1 13.44586417 0.00000000 Convergence criteria met.

87
The SAS System 732 11:16 Monday, November 2, 2015 ------------------------- Analysis=Tocopherols Sample type=BR ------------------------- The Mixed Procedure Covariance Parameter Estimates Cov Parm Estimate Lot 4.5416 Residual 0.3018 Fit Statistics -2 Res Log Likelihood 13.4 AIC (smaller is better) 17.4 AICC (smaller is better) 29.4 BIC (smaller is better) 14.8 Type 3 Tests of Fixed Effects Num Den Effect DF DF F Value Pr > F Month 3 3 7.45 0.0666 Least Squares Means Standard Effect Month Estimate Error DF t Value Pr > |t|

88
Month 0 4.9850 1.5562 3 3.20 0.0492 Month 4 5.2125 1.5562 3 3.35 0.0441 Month 8 4.1450 1.5562 3 2.66 0.0761 Month 12 2.8700 1.5562 3 1.84 0.1623 Differences of Least Squares Means Standard Effect Month Month Estimate Error DF t Value Pr > |t| Adjustment Adj P Month 0 4 -0.2275 0.5493 3 -0.41 0.7066 Tukey-Kramer 0.9723 Month 0 8 0.8400 0.5493 3 1.53 0.2237 Tukey-Kramer 0.5195 Month 0 12 2.1150 0.5493 3 3.85 0.0309 Tukey-Kramer 0.0893 Month 4 8 1.0675 0.5493 3 1.94 0.1472 Tukey-Kramer 0.3706 Month 4 12 2.3425 0.5493 3 4.26 0.0237 Tukey-Kramer 0.0690 Month 8 12 1.2750 0.5493 3 2.32 0.1030 Tukey-Kramer 0.2721

89
The SAS System 733 11:16 Monday, November 2, 2015 ------------------------- Analysis=Tocopherols Sample type=RO ------------------------- The Mixed Procedure Model Information Data Set WORK.IN Dependent Variable Means Covariance Structure Variance Components Estimation Method REML Residual Variance Method Profile Fixed Effects SE Method Model-Based Degrees of Freedom Method Containment Class Level Information Class Levels Values Lot 2 2436 27333 Month 3 0 8 12 Dimensions Covariance Parameters 2 Columns in X 4 Columns in Z 2 Subjects 1 Max Obs Per Subject 5 Number of Observations

90
Number of Observations Read 5 Number of Observations Used 5 Number of Observations Not Used 0 Iteration History Iteration Evaluations -2 Res Log Like Criterion 0 1 -0.40518220 1 1 -1.12189626 0.00000000 Convergence criteria met.

91
The SAS System 734 11:16 Monday, November 2, 2015 ------------------------- Analysis=Tocopherols Sample type=RO ------------------------- The Mixed Procedure Covariance Parameter Estimates Cov Parm Estimate Lot 0.01710 Residual 0.006806 Fit Statistics -2 Res Log Likelihood -1.1 AIC (smaller is better) 2.9 AICC (smaller is better) 14.9 BIC (smaller is better) 0.3 Type 3 Tests of Fixed Effects Num Den Effect DF DF F Value Pr > F Month 2 1 604.14 0.0288 Least Squares Means Standard Effect Month Estimate Error DF t Value Pr > |t|

92
Month 0 5.8925 0.1093 1 53.90 0.0118 Month 8 4.4156 0.1295 1 34.09 0.0187 Month 12 3.0250 0.1093 1 27.67 0.0230 Differences of Least Squares Means Standard Effect Month Month Estimate Error DF t Value Pr > |t| Adjustment Adj P Month 0 8 1.4769 0.1078 1 13.70 0.0464 Tukey-Kramer 0.0696 Month 0 12 2.8675 0.08250 1 34.76 0.0183 Tukey-Kramer 0.0275 Month 8 12 1.3906 0.1078 1 12.90 0.0493 Tukey-Kramer 0.0739

93
The SAS System 735 11:16 Monday, November 2, 2015 ------------------------ Analysis=Tocopherols Sample type=WWF ------------------------- The Mixed Procedure Model Information Data Set WORK.IN Dependent Variable Means Covariance Structure Variance Components Estimation Method REML Residual Variance Method Profile Fixed Effects SE Method Model-Based Degrees of Freedom Method Containment Class Level Information Class Levels Values Lot 2 106618 107579 Month 4 0 4 8 12 Dimensions Covariance Parameters 2 Columns in X 5 Columns in Z 2 Subjects 1 Max Obs Per Subject 8 Number of Observations

94
Number of Observations Read 8 Number of Observations Used 8 Number of Observations Not Used 0 Iteration History Iteration Evaluations -2 Res Log Like Criterion 0 1 18.54783449 1 1 15.72234268 0.00000000 Convergence criteria met.

95
The SAS System 736 11:16 Monday, November 2, 2015 ------------------------ Analysis=Tocopherols Sample type=WWF ------------------------- The Mixed Procedure Covariance Parameter Estimates Cov Parm Estimate Lot 2.2230 Residual 0.7991 Fit Statistics -2 Res Log Likelihood 15.7 AIC (smaller is better) 19.7 AICC (smaller is better) 31.7 BIC (smaller is better) 17.1 Type 3 Tests of Fixed Effects Num Den Effect DF DF F Value Pr > F Month 3 3 15.20 0.0255 Least Squares Means Standard Effect Month Estimate Error DF t Value Pr > |t|

96
Month 0 13.2175 1.2292 3 10.75 0.0017 Month 4 11.4475 1.2292 3 9.31 0.0026 Month 8 9.6225 1.2292 3 7.83 0.0043 Month 12 7.4700 1.2292 3 6.08 0.0089 Differences of Least Squares Means Standard Effect Month Month Estimate Error DF t Value Pr > |t| Adjustment Adj P Month 0 4 1.7700 0.8939 3 1.98 0.1420 Tukey-Kramer 0.3596 Month 0 8 3.5950 0.8939 3 4.02 0.0276 Tukey-Kramer 0.0801 Month 0 12 5.7475 0.8939 3 6.43 0.0076 Tukey-Kramer 0.0229 Month 4 8 1.8250 0.8939 3 2.04 0.1338 Tukey-Kramer 0.3418 Month 4 12 3.9775 0.8939 3 4.45 0.0211 Tukey-Kramer 0.0618 Month 8 12 2.1525 0.8939 3 2.41 0.0952 Tukey-Kramer 0.2537

97
The SAS System 737 11:16 Monday, November 2, 2015 ------------------------ Analysis=a-Tocopherols Sample type=BR ------------------------ The Mixed Procedure Model Information Data Set WORK.IN Dependent Variable Means Covariance Structure Variance Components Estimation Method REML Residual Variance Method Profile Fixed Effects SE Method Model-Based Degrees of Freedom Method Containment Class Level Information Class Levels Values Lot 2 Dixiebelle Wells Month 4 0 4 8 12 Dimensions Covariance Parameters 2 Columns in X 5 Columns in Z 2 Subjects 1 Max Obs Per Subject 8 Number of Observations

98
Number of Observations Read 8 Number of Observations Used 8 Number of Observations Not Used 0 Iteration History Iteration Evaluations -2 Res Log Like Criterion 0 1 13.85150354 1 1 10.57657587 0.00000000 Convergence criteria met.

99
The SAS System 738 11:16 Monday, November 2, 2015 ------------------------ Analysis=a-Tocopherols Sample type=BR ------------------------ The Mixed Procedure Covariance Parameter Estimates Cov Parm Estimate Lot 0.7241 Residual 0.2101 Fit Statistics -2 Res Log Likelihood 10.6 AIC (smaller is better) 14.6 AICC (smaller is better) 26.6 BIC (smaller is better) 12.0 Type 3 Tests of Fixed Effects Num Den Effect DF DF F Value Pr > F Month 3 3 2.30 0.2560 Least Squares Means Standard Effect Month Estimate Error DF t Value Pr > |t|

100
Month 0 3.3225 0.6834 3 4.86 0.0166 Month 4 3.3625 0.6834 3 4.92 0.0161 Month 8 2.9075 0.6834 3 4.25 0.0238 Month 12 2.3050 0.6834 3 3.37 0.0433 Differences of Least Squares Means Standard Effect Month Month Estimate Error DF t Value Pr > |t| Adjustment Adj P Month 0 4 -0.04000 0.4583 3 -0.09 0.9360 Tukey-Kramer 0.9997 Month 0 8 0.4150 0.4583 3 0.91 0.4320 Tukey-Kramer 0.8055 Month 0 12 1.0175 0.4583 3 2.22 0.1130 Tukey-Kramer 0.2953 Month 4 8 0.4550 0.4583 3 0.99 0.3940 Tukey-Kramer 0.7652 Month 4 12 1.0575 0.4583 3 2.31 0.1043 Tukey-Kramer 0.2751 Month 8 12 0.6025 0.4583 3 1.31 0.2801 Tukey-Kramer 0.6134

101
The SAS System 739 11:16 Monday, November 2, 2015 ----------------------- Analysis=a-Tocopherols Sample type=WWF ------------------------ The Mixed Procedure Model Information Data Set WORK.IN Dependent Variable Means Covariance Structure Variance Components Estimation Method REML Residual Variance Method Profile Fixed Effects SE Method Model-Based Degrees of Freedom Method Containment Class Level Information Class Levels Values Lot 2 106618 107579 Month 4 0 4 8 12 Dimensions Covariance Parameters 2 Columns in X 5 Columns in Z 2 Subjects 1 Max Obs Per Subject 8 Number of Observations

102
Number of Observations Read 8 Number of Observations Used 8 Number of Observations Not Used 0 Iteration History Iteration Evaluations -2 Res Log Like Criterion 0 1 15.91393065 1 1 14.04585698 0.00000000 Convergence criteria met.

103
The SAS System 740 11:16 Monday, November 2, 2015 ----------------------- Analysis=a-Tocopherols Sample type=WWF ------------------------ The Mixed Procedure Covariance Parameter Estimates Cov Parm Estimate Lot 0.9736 Residual 0.5908 Fit Statistics -2 Res Log Likelihood 14.0 AIC (smaller is better) 18.0 AICC (smaller is better) 30.0 BIC (smaller is better) 15.4 Type 3 Tests of Fixed Effects Num Den Effect DF DF F Value Pr > F Month 3 3 8.48 0.0563 Least Squares Means Standard Effect Month Estimate Error DF t Value Pr > |t|

104
Month 0 7.5275 0.8844 3 8.51 0.0034 Month 4 7.5525 0.8844 3 8.54 0.0034 Month 8 5.9900 0.8844 3 6.77 0.0066 Month 12 4.2150 0.8844 3 4.77 0.0175 Differences of Least Squares Means Standard Effect Month Month Estimate Error DF t Value Pr > |t| Adjustment Adj P Month 0 4 -0.02500 0.7686 3 -0.03 0.9761 Tukey-Kramer 1.0000 Month 0 8 1.5375 0.7686 3 2.00 0.1393 Tukey-Kramer 0.3536 Month 0 12 3.3125 0.7686 3 4.31 0.0230 Tukey-Kramer 0.0672 Month 4 8 1.5625 0.7686 3 2.03 0.1350 Tukey-Kramer 0.3443 Month 4 12 3.3375 0.7686 3 4.34 0.0225 Tukey-Kramer 0.0659 Month 8 12 1.7750 0.7686 3 2.31 0.1041 Tukey-Kramer 0.2746

105
The SAS System 741 11:16 Monday, November 2, 2015 ------------------------------------- Analysis=CD ------------------------------------- The Mixed Procedure Model Information Data Set WORK.IN Dependent Variable Means Covariance Structure Variance Components Estimation Method REML Residual Variance Method Profile Fixed Effects SE Method Model-Based Degrees of Freedom Method Containment Class Level Information Class Levels Values Lot 6 106618 107579 2436 27333 Dixiebelle Wells Sample_type 3 BR RO WWF Month 4 0 4 8 12 Dimensions Covariance Parameters 2 Columns in X 20 Columns in Z 6 Subjects 1 Max Obs Per Subject 24

106
Number of Observations Number of Observations Read 24 Number of Observations Used 24 Number of Observations Not Used 0 Iteration History Iteration Evaluations -2 Res Log Like Criterion 0 1 1.38233122 1 1 1.38233122 0.00000000 Convergence criteria met.

107
The SAS System 742 11:16 Monday, November 2, 2015 ------------------------------------- Analysis=CD ------------------------------------- The Mixed Procedure Covariance Parameter Estimates Cov Parm Estimate Lot 0 Residual 0.03285 Fit Statistics -2 Res Log Likelihood 1.4 AIC (smaller is better) 3.4 AICC (smaller is better) 3.8 BIC (smaller is better) 3.2 Type 3 Tests of Fixed Effects Num Den Effect DF DF F Value Pr > F Month 3 9 15.32 0.0007 Sample_type 2 9 348.43 <.0001 Sample_type*Month 6 9 11.37 0.0009 Least Squares Means Sample Standard

108
Effect type Month Estimate Error DF t Value Pr > |t| Sample_type*Month BR 0 0.3676 0.1282 9 2.87 0.0185 Sample_type*Month BR 4 0.3717 0.1282 9 2.90 0.0176 Sample_type*Month BR 8 0.3725 0.1282 9 2.91 0.0174 Sample_type*Month BR 12 0.4554 0.1282 9 3.55 0.0062 Sample_type*Month RO 0 1.6719 0.1282 9 13.05 <.0001 Sample_type*Month RO 4 1.9752 0.1282 9 15.41 <.0001 Sample_type*Month RO 8 3.0504 0.1282 9 23.80 <.0001 Sample_type*Month RO 12 3.2725 0.1282 9 25.53 <.0001 Sample_type*Month WWF 0 0.4246 0.1282 9 3.31 0.0090 Sample_type*Month WWF 4 0.3844 0.1282 9 3.00 0.0150 Sample_type*Month WWF 8 0.4869 0.1282 9 3.80 0.0042 Sample_type*Month WWF 12 0.5082 0.1282 9 3.97 0.0033

109
The SAS System 743 11:16 Monday, November 2, 2015 ------------------------------------ Analysis=FFA ------------------------------------- The Mixed Procedure Model Information Data Set WORK.IN Dependent Variable Means Covariance Structure Variance Components Estimation Method REML Residual Variance Method Profile Fixed Effects SE Method Model-Based Degrees of Freedom Method Containment Class Level Information Class Levels Values Lot 6 106618 107579 2436 27333 Dixiebelle Wells Sample_type 3 BR RO WWF Month 4 0 4 8 12 Dimensions Covariance Parameters 2 Columns in X 20 Columns in Z 6 Subjects 1 Max Obs Per Subject 24

110
Number of Observations Number of Observations Read 24 Number of Observations Used 24 Number of Observations Not Used 0 Iteration History Iteration Evaluations -2 Res Log Like Criterion 0 1 61.82958019 1 1 57.97420292 0.00000000 Convergence criteria met.

111
The SAS System 744 11:16 Monday, November 2, 2015 ------------------------------------ Analysis=FFA ------------------------------------- The Mixed Procedure Covariance Parameter Estimates Cov Parm Estimate Lot 2.6544 Residual 2.4060 Fit Statistics -2 Res Log Likelihood 58.0 AIC (smaller is better) 62.0 AICC (smaller is better) 63.3 BIC (smaller is better) 61.6 Type 3 Tests of Fixed Effects Num Den Effect DF DF F Value Pr > F Month 3 9 14.03 0.0010 Sample_type 2 9 73.43 <.0001 Sample_type*Month 6 9 13.67 0.0005 Least Squares Means Sample Standard

112
Effect type Month Estimate Error DF t Value Pr > |t| Sample_type*Month BR 0 2.0579 1.5907 9 1.29 0.2280 Sample_type*Month BR 4 1.3151 1.5907 9 0.83 0.4298 Sample_type*Month BR 8 1.2284 1.5907 9 0.77 0.4597 Sample_type*Month BR 12 2.1992 1.5907 9 1.38 0.2001 Sample_type*Month RO 0 2.4829 1.5907 9 1.56 0.1530 Sample_type*Month RO 4 2.4958 1.5907 9 1.57 0.1511 Sample_type*Month RO 8 3.4136 1.5907 9 2.15 0.0604 Sample_type*Month RO 12 2.4227 1.5907 9 1.52 0.1621 Sample_type*Month WWF 0 12.6297 1.5907 9 7.94 <.0001 Sample_type*Month WWF 4 19.7912 1.5907 9 12.44 <.0001 Sample_type*Month WWF 8 22.4364 1.5907 9 14.11 <.0001 Sample_type*Month WWF 12 29.6214 1.5907 9 18.62 <.0001

113
The SAS System 745 11:16 Monday, November 2, 2015 --------------------------------- Analysis=Riboflavin --------------------------------- The Mixed Procedure Model Information Data Set WORK.IN Dependent Variable Means Covariance Structure Variance Components Estimation Method REML Residual Variance Method Profile Fixed Effects SE Method Model-Based Degrees of Freedom Method Containment Class Level Information Class Levels Values Lot 6 106618 107579 2436 27333 Dixiebelle Wells Sample_type 3 BR RO WWF Month 4 0 4 8 12 Dimensions Covariance Parameters 2 Columns in X 20 Columns in Z 6 Subjects 1 Max Obs Per Subject 24

114
Number of Observations Number of Observations Read 24 Number of Observations Used 24 Number of Observations Not Used 0 Iteration History Iteration Evaluations -2 Res Log Like Criterion 0 1 -70.24703460 1 1 -70.24703460 0.00000000 Convergence criteria met.

115
The SAS System 746 11:16 Monday, November 2, 2015 --------------------------------- Analysis=Riboflavin --------------------------------- The Mixed Procedure Covariance Parameter Estimates Cov Parm Estimate Lot 0 Residual 0.000084 Fit Statistics -2 Res Log Likelihood -70.2 AIC (smaller is better) -68.2 AICC (smaller is better) -67.8 BIC (smaller is better) -68.5 Type 3 Tests of Fixed Effects Num Den Effect DF DF F Value Pr > F Month 3 9 3.04 0.0854 Sample_type 2 9 53.55 <.0001 Sample_type*Month 6 9 0.41 0.8555 Least Squares Means Sample Standard

116
Effect type Month Estimate Error DF t Value Pr > |t| Sample_type*Month BR 0 0.06909 0.006480 9 10.66 <.0001 Sample_type*Month BR 4 0.07059 0.006480 9 10.89 <.0001 Sample_type*Month BR 8 0.08054 0.006480 9 12.43 <.0001 Sample_type*Month BR 12 0.07713 0.006480 9 11.90 <.0001 Sample_type*Month RO 0 0.1072 0.006480 9 16.54 <.0001 Sample_type*Month RO 4 0.1192 0.006480 9 18.40 <.0001 Sample_type*Month RO 8 0.1281 0.006480 9 19.77 <.0001 Sample_type*Month RO 12 0.1119 0.006480 9 17.26 <.0001 Sample_type*Month WWF 0 0.1116 0.006480 9 17.23 <.0001 Sample_type*Month WWF 4 0.1111 0.006480 9 17.15 <.0001 Sample_type*Month WWF 8 0.1245 0.006480 9 19.22 <.0001 Sample_type*Month WWF 12 0.1092 0.006480 9 16.85 <.0001

117
The SAS System 747 11:16 Monday, November 2, 2015 ---------------------------------- Analysis=Thiamin ----------------------------------- The Mixed Procedure Model Information Data Set WORK.IN Dependent Variable Means Covariance Structure Variance Components Estimation Method REML Residual Variance Method Profile Fixed Effects SE Method Model-Based Degrees of Freedom Method Containment Class Level Information Class Levels Values Lot 6 106618 107579 2436 27333 Dixiebelle Wells Sample_type 3 BR RO WWF Month 4 0 4 8 12 Dimensions Covariance Parameters 2 Columns in X 20 Columns in Z 6 Subjects 1 Max Obs Per Subject 24

118
Number of Observations Number of Observations Read 24 Number of Observations Used 24 Number of Observations Not Used 0 Iteration History Iteration Evaluations -2 Res Log Like Criterion 0 1 -41.75962334 1 1 -41.75962334 0.00000000 Convergence criteria met.

119
The SAS System 748 11:16 Monday, November 2, 2015 ---------------------------------- Analysis=Thiamin ----------------------------------- The Mixed Procedure Covariance Parameter Estimates Cov Parm Estimate Lot 0 Residual 0.000902 Fit Statistics -2 Res Log Likelihood -41.8 AIC (smaller is better) -39.8 AICC (smaller is better) -39.4 BIC (smaller is better) -40.0 Type 3 Tests of Fixed Effects Num Den Effect DF DF F Value Pr > F Month 3 9 1.96 0.1913 Sample_type 2 9 223.82 <.0001 Sample_type*Month 6 9 0.91 0.5281 Least Squares Means Sample Standard

120
Effect type Month Estimate Error DF t Value Pr > |t| Sample_type*Month BR 0 0.2913 0.02124 9 13.72 <.0001 Sample_type*Month BR 4 0.2413 0.02124 9 11.36 <.0001 Sample_type*Month BR 8 0.2656 0.02124 9 12.51 <.0001 Sample_type*Month BR 12 0.2634 0.02124 9 12.40 <.0001 Sample_type*Month RO 0 0.6005 0.02124 9 28.28 <.0001 Sample_type*Month RO 4 0.5777 0.02124 9 27.21 <.0001 Sample_type*Month RO 8 0.6037 0.02124 9 28.43 <.0001 Sample_type*Month RO 12 0.5309 0.02124 9 25.00 <.0001 Sample_type*Month WWF 0 0.4852 0.02124 9 22.85 <.0001 Sample_type*Month WWF 4 0.4561 0.02124 9 21.48 <.0001 Sample_type*Month WWF 8 0.4642 0.02124 9 21.86 <.0001 Sample_type*Month WWF 12 0.4741 0.02124 9 22.32 <.0001

121
The SAS System 749 11:16 Monday, November 2, 2015 -------------------------------- Analysis=Tocopherols --------------------------------- The Mixed Procedure Model Information Data Set WORK.IN Dependent Variable Means Covariance Structure Variance Components Estimation Method REML Residual Variance Method Profile Fixed Effects SE Method Model-Based Degrees of Freedom Method Containment Class Level Information Class Levels Values Lot 6 106618 107579 2436 27333 Dixiebelle Wells Sample_type 3 BR RO WWF Month 4 0 4 8 12 Dimensions Covariance Parameters 2 Columns in X 19 Columns in Z 6 Subjects 1 Max Obs Per Subject 21

122
Number of Observations Number of Observations Read 21 Number of Observations Used 21 Number of Observations Not Used 0 Iteration History Iteration Evaluations -2 Res Log Like Criterion 0 1 46.78722291 1 3 40.21850511 0.00009784 2 2 38.50788475 0.00032010 3 2 37.12233073 0.00073591 4 2 36.28271361 0.02705600 5 2 36.24216498 0.00803725

123
The SAS System 750 11:16 Monday, November 2, 2015 -------------------------------- Analysis=Tocopherols --------------------------------- The Mixed Procedure Iteration History Iteration Evaluations -2 Res Log Like Criterion 6 1 36.15727983 0.00100010 7 1 36.14762312 0.00002092 8 1 36.14743457 0.00000001 9 1 36.14743448 0.00000000 Convergence criteria met. Covariance Parameter Estimates Cov Parm Estimate Lot 2.2727 Residual 0.4696 Fit Statistics -2 Res Log Likelihood 36.1 AIC (smaller is better) 40.1 AICC (smaller is better) 41.9 BIC (smaller is better) 39.7
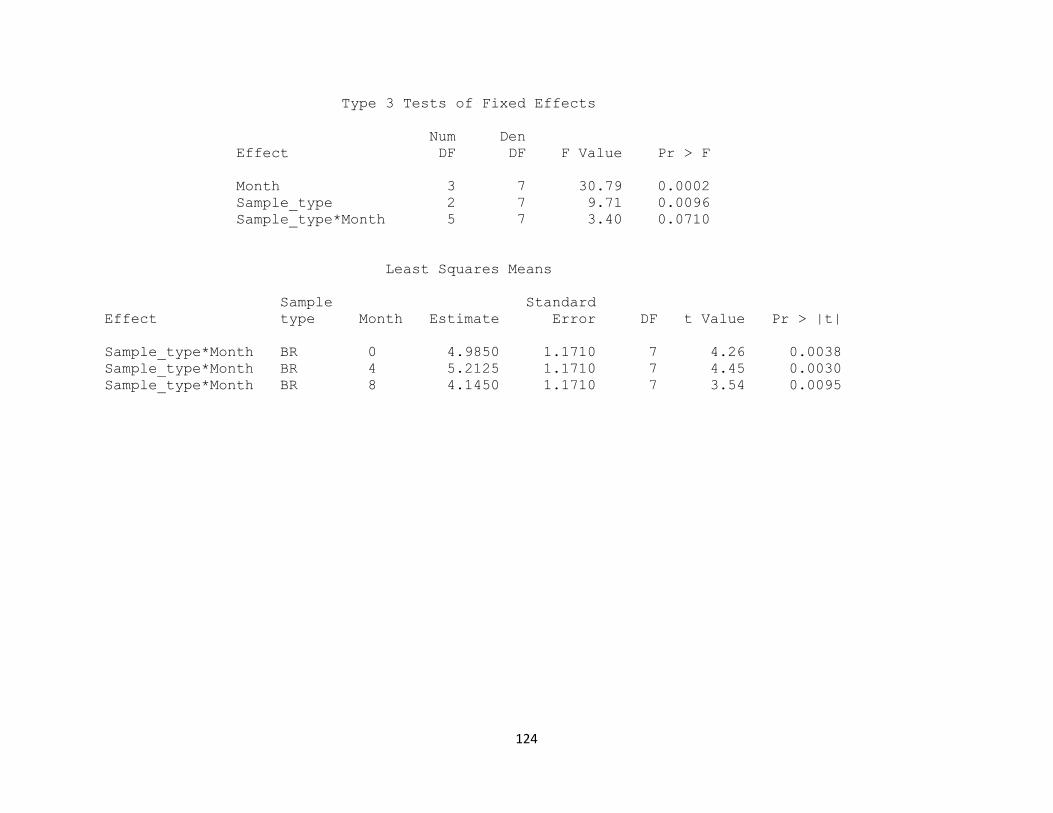
124
Type 3 Tests of Fixed Effects Num Den Effect DF DF F Value Pr > F Month 3 7 30.79 0.0002 Sample_type 2 7 9.71 0.0096 Sample_type*Month 5 7 3.40 0.0710 Least Squares Means Sample Standard Effect type Month Estimate Error DF t Value Pr > |t| Sample_type*Month BR 0 4.9850 1.1710 7 4.26 0.0038 Sample_type*Month BR 4 5.2125 1.1710 7 4.45 0.0030 Sample_type*Month BR 8 4.1450 1.1710 7 3.54 0.0095

125
The SAS System 751 11:16 Monday, November 2, 2015 -------------------------------- Analysis=Tocopherols --------------------------------- The Mixed Procedure Least Squares Means Sample Standard Effect type Month Estimate Error DF t Value Pr > |t| Sample_type*Month BR 12 2.8700 1.1710 7 2.45 0.0440 Sample_type*Month RO 0 5.8925 1.1710 7 5.03 0.0015 Sample_type*Month RO 8 4.4082 1.3086 7 3.37 0.0119 Sample_type*Month RO 12 3.0250 1.1710 7 2.58 0.0363 Sample_type*Month WWF 0 13.2175 1.1710 7 11.29 <.0001 Sample_type*Month WWF 4 11.4475 1.1710 7 9.78 <.0001 Sample_type*Month WWF 8 9.6225 1.1710 7 8.22 <.0001 Sample_type*Month WWF 12 7.4700 1.1710 7 6.38 0.0004

126
The SAS System 752 11:16 Monday, November 2, 2015 ------------------------------- Analysis=a-Tocopherols -------------------------------- The Mixed Procedure Model Information Data Set WORK.IN Dependent Variable Means Covariance Structure Variance Components Estimation Method REML Residual Variance Method Profile Fixed Effects SE Method Model-Based Degrees of Freedom Method Containment Class Level Information Class Levels Values Lot 4 106618 107579 Dixiebelle Wells Sample_type 2 BR WWF Month 4 0 4 8 12 Dimensions Covariance Parameters 2 Columns in X 15 Columns in Z 4 Subjects 1 Max Obs Per Subject 16 Number of Observations

127
Number of Observations Read 16 Number of Observations Used 16 Number of Observations Not Used 0 Iteration History Iteration Evaluations -2 Res Log Like Criterion 0 1 30.02839085 1 1 25.42445984 0.00000000 Convergence criteria met.

128
The SAS System 753 11:16 Monday, November 2, 2015 ------------------------------- Analysis=a-Tocopherols -------------------------------- The Mixed Procedure Covariance Parameter Estimates Cov Parm Estimate Lot 0.8488 Residual 0.4004 Fit Statistics -2 Res Log Likelihood 25.4 AIC (smaller is better) 29.4 AICC (smaller is better) 31.8 BIC (smaller is better) 28.2 Type 3 Tests of Fixed Effects Num Den Effect DF DF F Value Pr > F Month 3 6 10.74 0.0079 Sample_type 1 6 11.80 0.0139 Sample_type*Month 3 6 2.98 0.1182 Least Squares Means Sample Standard

129
Effect type Month Estimate Error DF t Value Pr > |t| Sample_type*Month BR 0 3.3225 0.7903 6 4.20 0.0057 Sample_type*Month BR 4 3.3625 0.7903 6 4.25 0.0054 Sample_type*Month BR 8 2.9075 0.7903 6 3.68 0.0103 Sample_type*Month BR 12 2.3050 0.7903 6 2.92 0.0268 Sample_type*Month WWF 0 7.5275 0.7903 6 9.52 <.0001 Sample_type*Month WWF 4 7.5525 0.7903 6 9.56 <.0001 Sample_type*Month WWF 8 5.9900 0.7903 6 7.58 0.0003 Sample_type*Month WWF 12 4.2150 0.7903 6 5.33 0.0018

130
Analysis for cooked data 27 13:39 Wednesday, November 18, 2015 ------------------------- Analysis=Riboflavin Sample type=BR -------------------------- The Mixed Procedure Model Information Data Set WORK.IN1 Dependent Variable Means Covariance Structure Variance Components Estimation Method REML Residual Variance Method Profile Fixed Effects SE Method Model-Based Degrees of Freedom Method Containment Class Level Information Class Levels Values Lot 2 Dixiebelle Wells Month 2 0 12 Dimensions Covariance Parameters 2 Columns in X 3 Columns in Z 2 Subjects 1 Max Obs per Subject 4 Number of Observations

131
Number of Observations Read 4 Number of Observations Used 4 Number of Observations Not Used 0 Iteration History Iteration Evaluations -2 Res Log Like Criterion 0 1 -10.43822213 1 1 -10.44278083 0.00000000 Convergence criteria met.

132
Analysis for cooked data 28 13:39 Wednesday, November 18, 2015 ------------------------- Analysis=Riboflavin Sample type=BR -------------------------- The Mixed Procedure Covariance Parameter Estimates Cov Parm Estimate Lot 0.000011 Residual 0.000148 Fit Statistics -2 Res Log Likelihood -10.4 AIC (Smaller is Better) -6.4 AICC (Smaller is Better) 5.6 BIC (Smaller is Better) -9.1 Type 3 Tests of Fixed Effects Num Den Effect DF DF F Value Pr > F Month 1 1 3.48 0.3133 Least Squares Means Standard Effect Month Estimate Error DF t Value Pr > |t|

133
Month 0 0.2295 0.008901 1 25.79 0.0247 Month 12 0.2069 0.008901 1 23.24 0.0274 Differences of Least Squares Means Standard Effect Month Month Estimate Error DF t Value Pr > |t| Adjustment Adj P Month 0 12 0.02267 0.01216 1 1.87 0.3133 Tukey-Kramer 0.3133

134
Analysis for cooked data 29 13:39 Wednesday, November 18, 2015 ------------------------- Analysis=Riboflavin Sample type=RO -------------------------- The Mixed Procedure Model Information Data Set WORK.IN1 Dependent Variable Means Covariance Structure Variance Components Estimation Method REML Residual Variance Method Profile Fixed Effects SE Method Model-Based Degrees of Freedom Method Containment Class Level Information Class Levels Values Lot 2 2436 27333 Month 2 0 12 Dimensions Covariance Parameters 2 Columns in X 3 Columns in Z 2 Subjects 1 Max Obs per Subject 4 Number of Observations

135
Number of Observations Read 4 Number of Observations Used 4 Number of Observations Not Used 0 Iteration History Iteration Evaluations -2 Res Log Like Criterion 0 1 -9.69434554 1 1 -9.90274713 0.00000000 Convergence criteria met.

136
Analysis for cooked data 30 13:39 Wednesday, November 18, 2015 ------------------------- Analysis=Riboflavin Sample type=RO -------------------------- The Mixed Procedure Covariance Parameter Estimates Cov Parm Estimate Lot 0.000100 Residual 0.000130 Fit Statistics -2 Res Log Likelihood -9.9 AIC (Smaller is Better) -5.9 AICC (Smaller is Better) 6.1 BIC (Smaller is Better) -8.5 Type 3 Tests of Fixed Effects Num Den Effect DF DF F Value Pr > F Month 1 1 3.34 0.3189 Least Squares Means Standard Effect Month Estimate Error DF t Value Pr > |t|

137
Month 0 0.1928 0.01072 1 17.99 0.0354 Month 12 0.2136 0.01072 1 19.93 0.0319 Differences of Least Squares Means Standard Effect Month Month Estimate Error DF t Value Pr > |t| Adjustment Adj P Month 0 12 -0.02084 0.01141 1 -1.83 0.3189 Tukey-Kramer 0.3189

138
Analysis for cooked data 31 13:39 Wednesday, November 18, 2015 ------------------------- Analysis=Riboflavin Sample type=WWF ------------------------- The Mixed Procedure Model Information Data Set WORK.IN1 Dependent Variable Means Covariance Structure Variance Components Estimation Method REML Residual Variance Method Profile Fixed Effects SE Method Model-Based Degrees of Freedom Method Containment Class Level Information Class Levels Values Lot 2 106618 107579 Month 2 0 12 Dimensions Covariance Parameters 2 Columns in X 3 Columns in Z 2 Subjects 1 Max Obs per Subject 4 Number of Observations

139
Number of Observations Read 4 Number of Observations Used 4 Number of Observations Not Used 0 Iteration History Iteration Evaluations -2 Res Log Like Criterion 0 1 -11.06211138 1 1 -12.09089838 0.00000000 Convergence criteria met.

140
Analysis for cooked data 32 13:39 Wednesday, November 18, 2015 ------------------------- Analysis=Riboflavin Sample type=WWF ------------------------- The Mixed Procedure Covariance Parameter Estimates Cov Parm Estimate Lot 0.000093 Residual 0.000023 Fit Statistics -2 Res Log Likelihood -12.1 AIC (Smaller is Better) -8.1 AICC (Smaller is Better) 3.9 BIC (Smaller is Better) -10.7 Type 3 Tests of Fixed Effects Num Den Effect DF DF F Value Pr > F Month 1 1 1.21 0.4692 Least Squares Means Standard Effect Month Estimate Error DF t Value Pr > |t|

141
Month 0 0.3530 0.007615 1 46.36 0.0137 Month 12 0.3477 0.007615 1 45.66 0.0139 Differences of Least Squares Means Standard Effect Month Month Estimate Error DF t Value Pr > |t| Adjustment Adj P Month 0 12 0.005285 0.004797 1 1.10 0.4692 Tukey-Kramer 0.4692

142
Analysis for cooked data 33 13:39 Wednesday, November 18, 2015 --------------------------- Analysis=Thiamin Sample type=BR --------------------------- The Mixed Procedure Model Information Data Set WORK.IN1 Dependent Variable Means Covariance Structure Variance Components Estimation Method REML Residual Variance Method Profile Fixed Effects SE Method Model-Based Degrees of Freedom Method Containment Class Level Information Class Levels Values Lot 2 Dixiebelle Wells Month 2 0 12 Dimensions Covariance Parameters 2 Columns in X 3 Columns in Z 2 Subjects 1 Max Obs per Subject 4 Number of Observations

143
Number of Observations Read 4 Number of Observations Used 4 Number of Observations Not Used 0 Iteration History Iteration Evaluations -2 Res Log Like Criterion 0 1 0.56640492 1 1 -7.09960489 0.00000000 Convergence criteria met.

144
Analysis for cooked data 34 13:39 Wednesday, November 18, 2015 --------------------------- Analysis=Thiamin Sample type=BR --------------------------- The Mixed Procedure Covariance Parameter Estimates Cov Parm Estimate Lot 0.03885 Residual 9.103E-6 Fit Statistics -2 Res Log Likelihood -7.1 AIC (Smaller is Better) -3.1 AICC (Smaller is Better) 8.9 BIC (Smaller is Better) -5.7 Type 3 Tests of Fixed Effects Num Den Effect DF DF F Value Pr > F Month 1 1 174.93 0.0480 Least Squares Means Standard Effect Month Estimate Error DF t Value Pr > |t|

145
Month 0 0.6446 0.1394 1 4.62 0.1356 Month 12 0.6046 0.1394 1 4.34 0.1442 Differences of Least Squares Means Standard Effect Month Month Estimate Error DF t Value Pr > |t| Adjustment Adj P Month 0 12 0.03991 0.003017 1 13.23 0.0480 Tukey-Kramer 0.0480

146
Analysis for cooked data 35 13:39 Wednesday, November 18, 2015 --------------------------- Analysis=Thiamin Sample type=RO --------------------------- The Mixed Procedure Model Information Data Set WORK.IN1 Dependent Variable Means Covariance Structure Variance Components Estimation Method REML Residual Variance Method Profile Fixed Effects SE Method Model-Based Degrees of Freedom Method Containment Class Level Information Class Levels Values Lot 2 2436 27333 Month 2 0 12 Dimensions Covariance Parameters 2 Columns in X 3 Columns in Z 2 Subjects 1 Max Obs per Subject 4 Number of Observations

147
Number of Observations Read 4 Number of Observations Used 4 Number of Observations Not Used 0 Iteration History Iteration Evaluations -2 Res Log Like Criterion 0 1 -3.37670634 1 1 -5.98770571 0.00000000 Convergence criteria met.

148
Analysis for cooked data 36 13:39 Wednesday, November 18, 2015 --------------------------- Analysis=Thiamin Sample type=RO --------------------------- The Mixed Procedure Covariance Parameter Estimates Cov Parm Estimate Lot 0.005208 Residual 0.000203 Fit Statistics -2 Res Log Likelihood -6.0 AIC (Smaller is Better) -2.0 AICC (Smaller is Better) 10.0 BIC (Smaller is Better) -4.6 Type 3 Tests of Fixed Effects Num Den Effect DF DF F Value Pr > F Month 1 1 10.51 0.1904 Least Squares Means Standard Effect Month Estimate Error DF t Value Pr > |t|
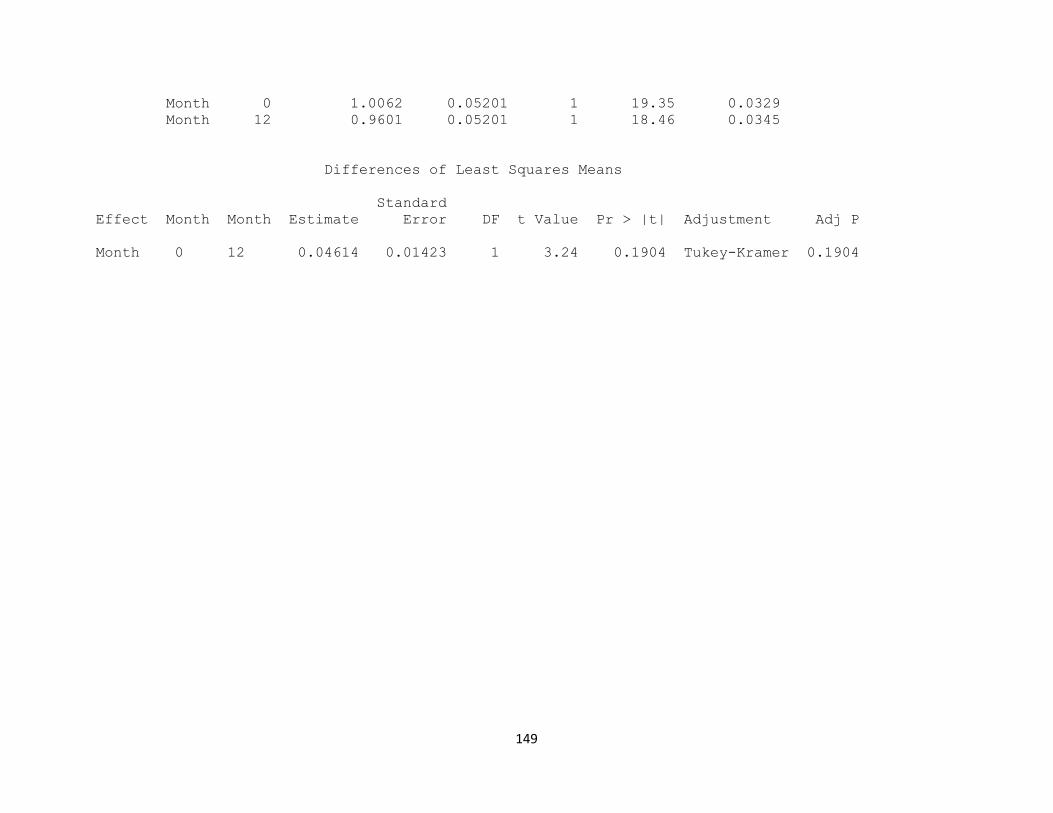
149
Month 0 1.0062 0.05201 1 19.35 0.0329 Month 12 0.9601 0.05201 1 18.46 0.0345 Differences of Least Squares Means Standard Effect Month Month Estimate Error DF t Value Pr > |t| Adjustment Adj P Month 0 12 0.04614 0.01423 1 3.24 0.1904 Tukey-Kramer 0.1904

150
Analysis for cooked data 37 13:39 Wednesday, November 18, 2015 -------------------------- Analysis=Thiamin Sample type=WWF --------------------------- The Mixed Procedure Model Information Data Set WORK.IN1 Dependent Variable Means Covariance Structure Variance Components Estimation Method REML Residual Variance Method Profile Fixed Effects SE Method Model-Based Degrees of Freedom Method Containment Class Level Information Class Levels Values Lot 2 106618 107579 Month 2 0 12 Dimensions Covariance Parameters 2 Columns in X 3 Columns in Z 2 Subjects 1 Max Obs per Subject 4 Number of Observations

151
Number of Observations Read 4 Number of Observations Used 4 Number of Observations Not Used 0 Iteration History Iteration Evaluations -2 Res Log Like Criterion 0 1 -11.67153170 1 1 -11.67153170 0.00000000 Convergence criteria met.

152
Analysis for cooked data 38 13:39 Wednesday, November 18, 2015 -------------------------- Analysis=Thiamin Sample type=WWF --------------------------- The Mixed Procedure Covariance Parameter Estimates Cov Parm Estimate Lot 0 Residual 0.000086 Fit Statistics -2 Res Log Likelihood -11.7 AIC (Smaller is Better) -9.7 AICC (Smaller is Better) -5.7 BIC (Smaller is Better) -11.0 Type 3 Tests of Fixed Effects Num Den Effect DF DF F Value Pr > F Month 1 1 13.13 0.1714 Least Squares Means Standard Effect Month Estimate Error DF t Value Pr > |t|

153
Month 0 0.6010 0.006539 1 91.91 0.0069 Month 12 0.6345 0.006539 1 97.04 0.0066 Differences of Least Squares Means Standard Effect Month Month Estimate Error DF t Value Pr > |t| Adjustment Adj P Month 0 12 -0.03350 0.009248 1 -3.62 0.1714 Tukey 0.1714

154
Analysis for cooked data 39 13:39 Wednesday, November 18, 2015 --------------------------------- Analysis=Riboflavin --------------------------------- The Mixed Procedure Model Information Data Set WORK.IN1 Dependent Variable Means Covariance Structure Variance Components Estimation Method REML Residual Variance Method Profile Fixed Effects SE Method Model-Based Degrees of Freedom Method Containment Class Level Information Class Levels Values Lot 6 106618 107579 2436 27333 Dixiebelle Wells Sample_type 3 BR RO WWF Month 2 0 12 Dimensions Covariance Parameters 2 Columns in X 12 Columns in Z 6 Subjects 1 Max Obs per Subject 12

155
Number of Observations Number of Observations Read 12 Number of Observations Used 12 Number of Observations Not Used 0 Iteration History Iteration Evaluations -2 Res Log Like Criterion 0 1 -30.96021426 1 1 -31.49261158 0.00000000 Convergence criteria met.

156
Analysis for cooked data 40 13:39 Wednesday, November 18, 2015 --------------------------------- Analysis=Riboflavin --------------------------------- The Mixed Procedure Covariance Parameter Estimates Cov Parm Estimate Lot 0.000068 Residual 0.000100 Fit Statistics -2 Res Log Likelihood -31.5 AIC (Smaller is Better) -27.5 AICC (Smaller is Better) -23.5 BIC (Smaller is Better) -27.9 Type 3 Tests of Fixed Effects Num Den Effect DF DF F Value Pr > F Month 1 3 0.17 0.7092 Sample_type 2 3 111.23 0.0015 Sample_type*Month 2 3 4.78 0.1167 Least Squares Means Sample Standard

157
Effect type Month Estimate Error DF t Value Pr > |t| Sample_type*Month BR 0 0.2295 0.009167 3 25.04 0.0001 Sample_type*Month BR 12 0.2069 0.009167 3 22.57 0.0002 Sample_type*Month RO 0 0.1928 0.009167 3 21.03 0.0002 Sample_type*Month RO 12 0.2136 0.009167 3 23.31 0.0002 Sample_type*Month WWF 0 0.3530 0.009167 3 38.51 <.0001 Sample_type*Month WWF 12 0.3477 0.009167 3 37.93 <.0001

158
Analysis for cooked data 41 13:39 Wednesday, November 18, 2015 ---------------------------------- Analysis=Thiamin ----------------------------------- The Mixed Procedure Model Information Data Set WORK.IN1 Dependent Variable Means Covariance Structure Variance Components Estimation Method REML Residual Variance Method Profile Fixed Effects SE Method Model-Based Degrees of Freedom Method Containment Class Level Information Class Levels Values Lot 6 106618 107579 2436 27333 Dixiebelle Wells Sample_type 3 BR RO WWF Month 2 0 12 Dimensions Covariance Parameters 2 Columns in X 12 Columns in Z 6 Subjects 1 Max Obs per Subject 12

159
Number of Observations Number of Observations Read 12 Number of Observations Used 12 Number of Observations Not Used 0 Iteration History Iteration Evaluations -2 Res Log Like Criterion 0 1 -4.09871100 1 1 -16.99408474 0.00000000 Convergence criteria met.

160
Analysis for cooked data 42 13:39 Wednesday, November 18, 2015 ---------------------------------- Analysis=Thiamin ----------------------------------- The Mixed Procedure Covariance Parameter Estimates Cov Parm Estimate Lot 0.01468 Residual 0.000101 Fit Statistics -2 Res Log Likelihood -17.0 AIC (Smaller is Better) -13.0 AICC (Smaller is Better) -9.0 BIC (Smaller is Better) -13.4 Type 3 Tests of Fixed Effects Num Den Effect DF DF F Value Pr > F Month 1 3 9.13 0.0567 Sample_type 2 3 5.93 0.0907 Sample_type*Month 2 3 19.46 0.0191 Least Squares Means Sample Standard

161
Effect type Month Estimate Error DF t Value Pr > |t| Sample_type*Month BR 0 0.6446 0.08598 3 7.50 0.0049 Sample_type*Month BR 12 0.6046 0.08598 3 7.03 0.0059 Sample_type*Month RO 0 1.0062 0.08598 3 11.70 0.0013 Sample_type*Month RO 12 0.9601 0.08598 3 11.17 0.0015 Sample_type*Month WWF 0 0.6010 0.08598 3 6.99 0.0060 Sample_type*Month WWF 12 0.6345 0.08598 3 7.38 0.0051

162
EXTENDED LITERATURE CITED
AACC International. Approved Methods of Analysis, 11th Ed. Method 44-15.02. Moisture—Air-Oven Methods. Approved October 30, 1975. AACC International, St. Paul, MN, U.S.A. http://dx.doi.org/10.1094/AACCIntMethod-44-15.02
Doblado-Maldonado, A. F.; Pike, O. A.; Sweley, J. C.; Rose, D. J., Key issues and challenges in whole wheat flour milling and storage. Journal of Cereal Science 2012, pp 119-126.
Guraya, H. S.; Patindol, J. A., Storage stability of flour-blasted brown rice. Cereal Chemistry 2011, pp 56-63.
Handbook of cereal science and technology. New York: Marcel Dekker: 1991; Vol. 41.
Heinio, R.; Lehtinen, P.; Oksman-Caldentey, K.; Poutanen, K., Differences between sensory profiles and development of rancidity during long-term storage of native and processed oat. Cereal Chemistry 2002, 79 (3), 367-375.
Jagerstad, M.; Wennermark, B. H.; JÄGerstad, M., Breadmaking and Storage of Various Wheat Fractions Affect Vitamin E. Journal of Food Science 1992, 57 (5), 1205-1209.
Kent, N. L., Technology of cereals : an introduction for students of food science and agriculture. Oxford Oxfordshire; New York: Pergamon: 1983; Vol. 3rd ed.
Kwon DY, Rhee JS. 1986. A simple and rapid colorimetric method for determination of free fatty acids for lipase assay. J Am Oil Chem Soc 63:89-92.
Lehto, S.; Laakso, S.; Lehtinen, P., Enzymatic oxidation of hexanal by oat. Journal of Cereal Science 2003, pp 199-203.
Liu, L.; Waters, D. L. E.; Rose, T. J.; Bao, J.; King, G. J., Phospholipids in rice: Significance in grain quality and health benefits: A review. Food Chemistry 2013, pp 1133-1145.
McEwan, M.; Ogden, L. V.; Pike, O. A., Effects of long-term storage on sensory and nutritional quality of rolled oats. Journal of Food Science 2005, pp S453-S458.
Molteberg, E. L.; Bjørge, J. M.; Nilsson, A.; Magnus, E. M., Sensory and chemical studies of lipid oxidation in raw and heat-treated oat flours. Cereal Chemistry 1996, pp 579-587.
Nielsen, M. M.; Hansen, Å., Stability of vitamin E in wheat flour and whole wheat flour during storage. Cereal Chemistry 2008, pp 716-720.
Official Methods of Analysis of AOAC INTERNATIONAL (2012) 19th Ed., AOAC INTERNATIONAL, Gaithersburg, MD, USA, Official Method 953.17.

163
Official Methods of Analysis of AOAC INTERNATIONAL (2012) 19th Ed., AOAC INTERNATIONAL, Gaithersburg, MD, USA, Official Method 2004.05.
Pascual, C. d. S. C. I.; Massaretto, I. L.; Kawassaki, F.; Barros, R. M. C.; Noldin, J. A.; Marquez, U. M. L., Effects of parboiling, storage and cooking on the levels of tocopherols, tocotrienols and γ-oryzanol in brown rice (Oryza sativa L.). Food Research International 2013, pp 676-681.
Pegg RJ. 2001. Determination of conjugated dienes and trienes. In: Wrotstad RE, editor-in-chief. Current protocols in food analytical chemistry. New York: John Wiley & Sons, Inc. p. D2.1.1-3.
Sharp, R.; Timme, L., Effects of Storage Time, Storage Temperature, and Packaging Method on Shelf Life of Brown Rice. Cereal Chemistry 1986, 63 (3), 247-251.
Suzuki, Y.; Ise, K.; Li, C.; Honda, I.; Iwai, Y.; Matsukura, U., Volatile components in stored rice Oryza sativa (L.) of varieties with and without lipoxygenase-3 in seeds. Journal of agricultural and food chemistry 1999, p 1119.
USDA National Nutrient Database for Standard Reference Release 28. 2015.


![HEALTHY EATING WORKSHOP - Welcome to NYC.gov...Whole grain rolled oats, sugar, flavored fruit pieces (dehydrated apples [treated with sodium sulfite to promote color retention], artificial](https://static.fdocuments.net/doc/165x107/5f295d17fe4ebd2bab74c460/healthy-eating-workshop-welcome-to-nycgov-whole-grain-rolled-oats-sugar.jpg)