Special Section: Cancer in the Oldest Old · Special Section: Cancer in the Oldest Old Introduction...
15
Cancer Facts & Figures 2019 29 Special Section: Cancer in the Oldest Old Introduction Adults ages 85 and older are the fastest-growing population group in the US. Sometimes referred to as the “oldest old,” the number of adults ages 85+ is expected to nearly triple from 6.4 million in 2016 to 19.0 million by 2060 ( Figure S1 ). 1 The growth of the older population is primarily fueled by increasing life expectancy because of declines in all cause mortality due to less smoking and improvements in treatment. However, the obesity epidemic and persistent socioeconomic inequalities threaten to slow this progress. 2-4 In addition, the delay in smoking cessation among women is expected to narrow the current gender gap. For example, by 2030, remaining life expectancy at age 65 is projected to increase to 20 and 22 years in men and women, respectively, up from 18 and 21 years in 2010. 4 As a result of the longer life expectancy in women than men, women outnumber men in the oldest age group. In 2016, there were 4.2 million women compared to 2.2 million men ages 85 and older, or 186 women for every 100 men. Cancer risk increases with age, peaking in men and women in their 80s ( Figure S2 ). The rapidly growing older population will increase demand for cancer care in this population, which will have a substantial impact on health care resource allocation. Diagnosis and treatment of cancer at older ages are often complicated by preexisting medical conditions (comorbidities), cognitive impairment, frailty, and other factors. 5 Screening is not recommended because current evidence suggests that the harms outweigh the benefits for adults older than 75 years of age. As a result, cancers in this age group are often more advanced than those diagnosed at earlier ages. Relatively little is known about the complex health Source: US Census Bureau, Population Progections 2017-2060. 1 ©2019, American Cancer Society, Inc., Surveillance Research Figure S1. Age Distribution of US Population in Millions: 2016 versus 2060 Male Female Male Female 2016 2060 82 15 10 5 0 5 10 15 0-4 5-9 10-14 15-19 20-24 25-29 30-34 35-39 40-44 45-49 50-54 55-59 60-64 65-69 70-74 75-79 80-84 85-89 90-94 95-99 100+ 15 10 5 0 5 10 15 0-4 5-9 10-14 15-19 20-24 25-29 30-34 35-39 40-44 45-49 50-54 55-59 60-64 65-69 70-74 75-79 80-84 85-89 90-94 95-99 100+ Population (in millions)
Transcript of Special Section: Cancer in the Oldest Old · Special Section: Cancer in the Oldest Old Introduction...

Cancer Facts & Figures 2019 29
Special Section: Cancer in the Oldest OldIntroductionAdults ages 85 and older are the fastest-growing population group in the US. Sometimes referred to as the “oldest old,” the number of adults ages 85+ is expected to nearly triple from 6.4 million in 2016 to 19.0 million by 2060 (Figure S1).1 The growth of the older population is primarily fueled by increasing life expectancy because of declines in all cause mortality due to less smoking and improvements in treatment. However, the obesity epidemic and persistent socioeconomic inequalities threaten to slow this progress.2-4 In addition, the delay in smoking cessation among women is expected to narrow the current gender gap. For example, by 2030, remaining life expectancy at age 65 is projected to increase to 20 and 22 years in men and women, respectively, up from 18 and 21 years in 2010.4 As a result of the longer life expectancy in women than men, women outnumber men
in the oldest age group. In 2016, there were 4.2 million women compared to 2.2 million men ages 85 and older, or 186 women for every 100 men.
Cancer risk increases with age, peaking in men and women in their 80s (Figure S2). The rapidly growing older population will increase demand for cancer care in this population, which will have a substantial impact on health care resource allocation. Diagnosis and treatment of cancer at older ages are often complicated by preexisting medical conditions (comorbidities), cognitive impairment, frailty, and other factors.5 Screening is not recommended because current evidence suggests that the harms outweigh the benefits for adults older than 75 years of age. As a result, cancers in this age group are often more advanced than those diagnosed at earlier ages. Relatively little is known about the complex health
Source: US Census Bureau, Population Progections 2017-2060.1
©2019, American Cancer Society, Inc., Surveillance Research
Figure S1. Age Distribution of US Population in Millions: 2016 versus 2060
Male Female Male Female
2016 2060
82
15 10 5 0 5 10 15
0-4
5-9
10-14
15-19
20-24
25-29
30-34
35-39
40-44
45-49
50-54
55-59
60-64
65-69
70-74
75-79
80-84
85-89
90-94
95-99
100+
15 10 5 0 5 10 15
0-4
5-9
10-14
15-19
20-24
25-29
30-34
35-39
40-44
45-49
50-54
55-59
60-64
65-69
70-74
75-79
80-84
85-89
90-94
95-99
100+
Population (in millions)

30 Cancer Facts & Figures 2019
care needs of older cancer patients due to the limited representation of this population in clinical research.6, 7 This special section profiles cancer in the oldest old in the US, including data on incidence, mortality, survival, and treatment, and discusses some of the unique challenges affecting these patients.
How many new cases and deaths are expected to occur among persons 85 and older in 2019?People ages 85 and older represent 8% of all new cancer diagnoses, translating to about 140,690 cases in 2019 (61,830 male and 78,860 female). Cancer is the second-leading cause of death, following heart disease, in this population, with about 103,250 cancer deaths expected in 2019 (49,040 male and 54,210 female), accounting for 17% of all cancer deaths.
How many cancer survivors are ages 85 and older?As of January 1, 2019, an estimated 1,944,280 adults ages 85 and older were alive with a history of cancer, representing one-third of all men and one-fourth of all women in this age group in the United States.8 The oldest old are the fastest-growing group of cancer survivors, with nearly 4.7 million cancer survivors ages 85 and older expected by 2040.8
What is the risk of developing or dying of cancer at age 85?Among adults age 85 without a history of a cancer, the risk of a cancer diagnosis in their remaining lifetime is 16.4%, or 1-in-6, for men and 12.8%, or 1-in-8, for women. The remaining lifetime risk of cancer death for all adults age 85 is 14.4% (or 1-in-7) for men and 9.6% (or 1-in-10) for women.
Overall cancer risk increases with age until approximately ages 80-84 in women and 85-89 in men (Figure S2), reflecting lifetime accumulation of exposures (e.g., cigarette smoking, excess body weight, alcohol consumption) and genetic mutations.9, 10 Reasons for the subsequent decline in risk are unclear,11-13 but may reflect lower genetic susceptibility or exposure to carcinogens, as well as consequences of the natural aging process that inhibit tumor growth.14-17 For example, one theory suggests that cellular senescence, a stage associated with aging when cells (including cancer cells) lose their ability to divide, may protect against cancer formation.10, 14 Another theory is that the age-dependent reshaping of the immune system (increases in certain T-cells and natural killer cells) creates a hostile environment for cancer growth.17 However, lower incidence rates in the oldest age groups may also be the result of undetected cancer related to less intensive use of screening and diagnostic testing,
Sources: Surveillance, Epidemiology, and End Results (SEER) program, 18 SEER registries, custom data (2000-2015).
©2019, American Cancer Society, Inc., Surveillance Research
Figure S2. Average Annual Incidence Rates and Case Distribution by Age, US, 2011-2015
Male % cases
Female % cases
Male incidence rate
Female incidence rate
Inci
den
ce r
ate
per
10
0,0
00
Perc
ent
of
tota
l cas
es, b
y se
x
0
5
10
15
20
0
500
1000
1500
2000
2500
3000
95+90-9485-8980-8475-7970-7465-6960-6455-5950-5445-4940-4435-3930-3425-2920-2415-1910-145-91-4<1
Age at diagnosis
Cancer Facts & Figures 2019 31
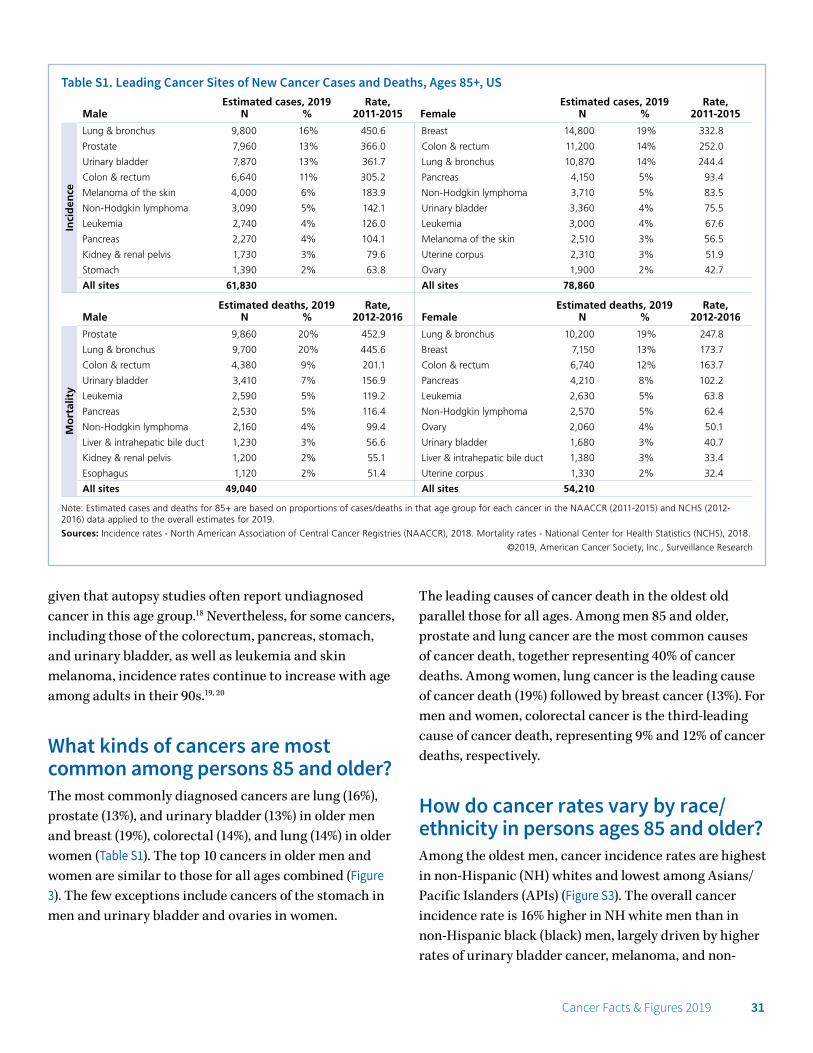
given that autopsy studies often report undiagnosed cancer in this age group.18 Nevertheless, for some cancers, including those of the colorectum, pancreas, stomach, and urinary bladder, as well as leukemia and skin melanoma, incidence rates continue to increase with age among adults in their 90s.19, 20
What kinds of cancers are most common among persons 85 and older?The most commonly diagnosed cancers are lung (16%), prostate (13%), and urinary bladder (13%) in older men and breast (19%), colorectal (14%), and lung (14%) in older women (Table S1). The top 10 cancers in older men and women are similar to those for all ages combined (Figure 3). The few exceptions include cancers of the stomach in men and urinary bladder and ovaries in women.
The leading causes of cancer death in the oldest old parallel those for all ages. Among men 85 and older, prostate and lung cancer are the most common causes of cancer death, together representing 40% of cancer deaths. Among women, lung cancer is the leading cause of cancer death (19%) followed by breast cancer (13%). For men and women, colorectal cancer is the third-leading cause of cancer death, representing 9% and 12% of cancer deaths, respectively.
How do cancer rates vary by race/ethnicity in persons ages 85 and older?Among the oldest men, cancer incidence rates are highest in non-Hispanic (NH) whites and lowest among Asians/Pacific Islanders (APIs) (Figure S3). The overall cancer incidence rate is 16% higher in NH white men than in non-Hispanic black (black) men, largely driven by higher rates of urinary bladder cancer, melanoma, and non-
Table S1. Leading Cancer Sites of New Cancer Cases and Deaths, Ages 85+, US
MaleEstimated cases, 2019
N %Rate,
2011-2015 FemaleEstimated cases, 2019
N %Rate,
2011-2015
Inci
den
ce
Lung & bronchus 9,800 16% 450.6 Breast 14,800 19% 332.8
Prostate 7,960 13% 366.0 Colon & rectum 11,200 14% 252.0
Urinary bladder 7,870 13% 361.7 Lung & bronchus 10,870 14% 244.4
Colon & rectum 6,640 11% 305.2 Pancreas 4,150 5% 93.4
Melanoma of the skin 4,000 6% 183.9 Non-Hodgkin lymphoma 3,710 5% 83.5
Non-Hodgkin lymphoma 3,090 5% 142.1 Urinary bladder 3,360 4% 75.5
Leukemia 2,740 4% 126.0 Leukemia 3,000 4% 67.6
Pancreas 2,270 4% 104.1 Melanoma of the skin 2,510 3% 56.5
Kidney & renal pelvis 1,730 3% 79.6 Uterine corpus 2,310 3% 51.9
Stomach 1,390 2% 63.8 Ovary 1,900 2% 42.7
All sites 61,830 All sites 78,860
MaleEstimated deaths, 2019
N %Rate,
2012-2016 FemaleEstimated deaths, 2019
N %Rate,
2012-2016
Mo
rtal
ity
Prostate 9,860 20% 452.9 Lung & bronchus 10,200 19% 247.8
Lung & bronchus 9,700 20% 445.6 Breast 7,150 13% 173.7
Colon & rectum 4,380 9% 201.1 Colon & rectum 6,740 12% 163.7
Urinary bladder 3,410 7% 156.9 Pancreas 4,210 8% 102.2
Leukemia 2,590 5% 119.2 Leukemia 2,630 5% 63.8
Pancreas 2,530 5% 116.4 Non-Hodgkin lymphoma 2,570 5% 62.4
Non-Hodgkin lymphoma 2,160 4% 99.4 Ovary 2,060 4% 50.1
Liver & intrahepatic bile duct 1,230 3% 56.6 Urinary bladder 1,680 3% 40.7
Kidney & renal pelvis 1,200 2% 55.1 Liver & intrahepatic bile duct 1,380 3% 33.4
Esophagus 1,120 2% 51.4 Uterine corpus 1,330 2% 32.4
All sites 49,040 All sites 54,210
Note: Estimated cases and deaths for 85+ are based on proportions of cases/deaths in that age group for each cancer in the NAACCR (2011-2015) and NCHS (2012-2016) data applied to the overall estimates for 2019.
Sources: Incidence rates - North American Association of Central Cancer Registries (NAACCR), 2018. Mortality rates - National Center for Health Statistics (NCHS), 2018.
©2019, American Cancer Society, Inc., Surveillance Research

32 Cancer Facts & Figures 2019
Hodgkin lymphoma. This is in contrast to younger men and men of all ages combined, among whom rates are higher in blacks than whites. For example, compared to NH white men, rates among black men are 30% higher in ages 50-64. Among the oldest women, American Indians/Alaska Natives (AIANs) have the highest cancer incidence rate, reflecting their high burden of lung and colorectal cancers.
Cancer mortality patterns differ from those for incidence, especially in men. Despite a lower incidence rate than white men, black men have a 5% higher cancer mortality rate (Figure S3). Recent studies have demonstrated that racial/ethnic disparities in stage at diagnosis and survival persist for older cancer patients.21, 22 Although racial differences in stage at diagnosis are generally
smaller than observed in the general population, survival differences are striking. For example, 5-year relative survival for both local- and regional-stage lung cancer patients ages 85 years and older was 3 times higher in whites compared to blacks.22 This disparity may reflect inequalities in access to and receipt of quality health care, as well as differences in the burden of comorbidities.23-25 Despite universal access to health care, some costs of cancer care are not fully covered by Medicare and can be burdensome for older cancer patients with limited, fixed income.26 Importantly, racial/ethnic minority population growth will lead to increasing diversity in the 85 and older age group over the next several decades, with the proportion of NH whites declining from 84% in 2012 to 61% in 2060.27, 28
How has the occurrence of cancer in ages 85 and older varied over time?Incidence trends Overall cancer incidence rates have decreased in the oldest men since about 1990 (Figure S4), with an acceleration in the decline since 2007, largely reflecting the sharp declines in cancers of the prostate and colorectum, and more recently, lung (Figure S5, Table S2). The lung cancer pattern differs in older men compared to younger men; incidence rates peaked in the 2000s among men 85+ compared to a peak in the 1980s among men ages 65 to 84. The delayed decline in the oldest men reflects generational differences in smoking patterns. The generation of men born in 1920 (who entered the 85+ age group in 2005) had the highest smoking rate of any birth cohort, with peak smoking prevalence exceeding 70% during the 1950s.29 As younger generations with lower smoking rates enter the oldest age group, lung cancer rates in this age group will continue to decline.
In contrast, the decline in prostate cancer incidence rates has been more rapid in men 85+ compared to younger men. Prior to 2009, prostate cancer was the most common cancer in men 85 and older, but rates are now similar to urinary bladder cancer, the third-leading cancer in this age group. This is because of rapid declines in prostate cancer incidence, likely reflecting a shift toward detection at earlier ages through PSA testing.
NH: Non-Hispanic. Asians/Pacific Islanders and American Indians/Alaska Natives exclude persons of Hispanic ethnicity. Rates for American Indians/Alaska Natives based on cases/deaths in Contract Health Service Delivery Area counties.Sources: Incidence – NAACCR, 2018. Mortality – NCHS, 2018.
©2019, American Cancer Society, Inc., Surveillance Research
Rat
e p
er 1
00,
00
0R
ate
per
10
0,0
00
Figure S3. Cancer Incidence and Mortality Rates among Adults 85+ by Race/Ethnicity, US, 2011-2016
0
500
1000
1500
2000
2500
3000
FemaleMale
0
500
1000
1500
2000
2500
3000
FemaleMale
NH white NH black HispanicAsian/Pacific Islander American Indian/Alaska Native
Mortality, 2012-2016
Incidence, 2011-2015

Cancer Facts & Figures 2019 33
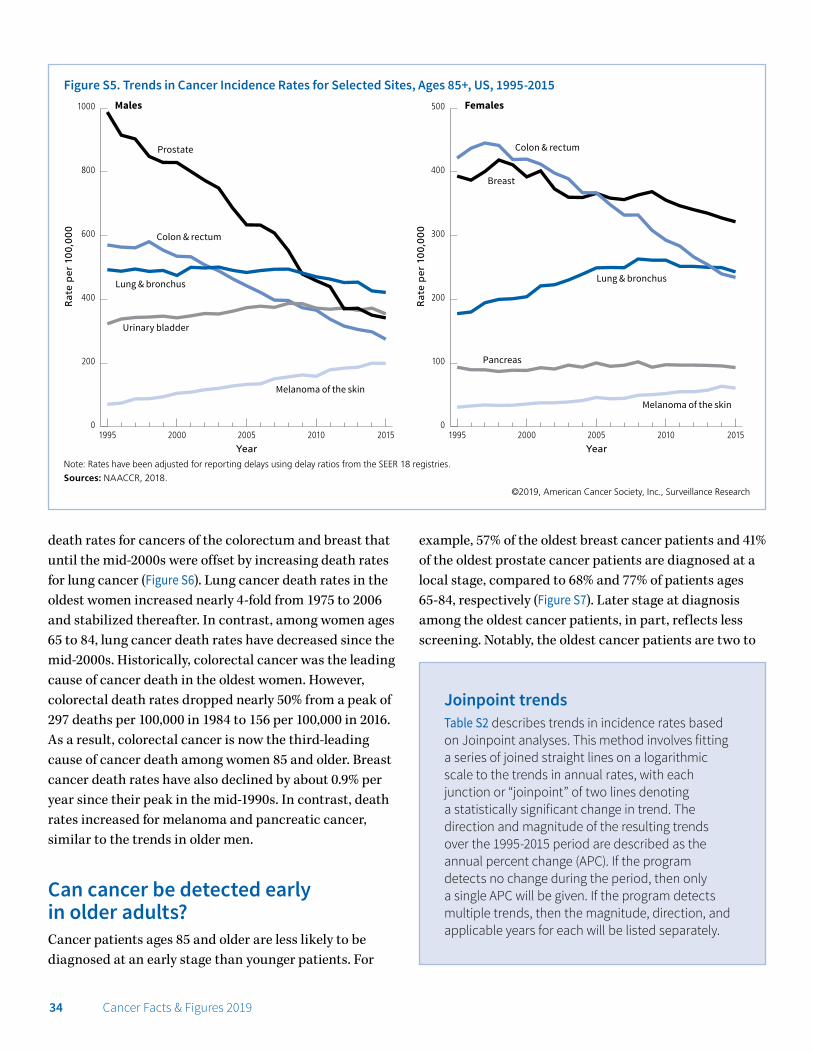
The decrease in colorectal cancer incidence rates since 2000 has been similar among men 65 to 84 years of age and those ages 85 and older. Melanoma incidence rates, on the other hand, have increased more rapidly over the past several decades in the oldest men (4.3% per year during 2002-2015), which is thought to be due to excessive sun exposure among children during the first half of the 20th century.30 Melanoma is predicted to become the second most commonly diagnosed cancer among men 85 and older by 2030.31
Among women 85 and older, overall cancer incidence rates peaked around 1990 before subsequently decreasing (Figure S4), with an acceleration in the decline in 2009 largely reflecting declines in breast and colorectal cancers (Figure S5, Table S2). Although breast cancer rates have increased slightly among women ages 65 to 84 years since 2004, rates have continued to decline in the oldest age group (2.1% per year since 2009). Breast cancer surpassed colorectal cancer in 2005 as the most commonly diagnosed cancer in the oldest women due to faster declines in colorectal cancer rates. Lung cancer incidence rates
increased more rapidly in older versus younger women from 1995 to the mid-2000s but are now declining at a similar pace in both groups. Although pancreatic cancer rates continue to increase in women ages 65 to 84, rates have leveled off in women 85+ since 2008. Similar to men, melanoma rates have increased rapidly (3.7% per year during 1995-2015) among the oldest women.
Mortality trendsCancer death rates peaked in men 85+ in the mid-1990s and have declined by 1.4% per over the past decade (Figure S4). The spike and subsequent decline in overall mortality rates largely reflect trends in prostate cancer (Figure S6). The prostate cancer death rate in men increased sharply until 1993, then dropped precipitously until plateauing during 2014-2016 at a slightly lower rate than observed in 1975. Among men 65 to 84 years, the increase was much smaller, but the subsequent decline was larger, and as a result, rates are now much lower than they were in 1975. Reasons for the sharp increase in prostate cancer death rates in the oldest men are not known, but are thought to be due to mislabeling of deaths from other causes as prostate cancer on death certificates because of the rapid rise in disease prevalence following the introduction of widespread PSA testing.32 The subsequent decline in rates may result from earlier detection and improvements in treatment for advanced disease, but it remains unclear why rates have recently plateaued.33
Declines in death rates for lung and colorectal cancers are similar to incidence patterns over the past 2 decades (Figure S5). Notably, urinary bladder cancer death rates have increased in the oldest men by 1% per year from 2000 to 2016, whereas rates have declined in men ages 65 to 84 since the late 1970s. Reasons for the divergent pattern are not known, but may reflect increasing incidence rates through 2008 that were limited to the oldest men. Death rates have also increased for pancreatic cancer (0.3% per year since 1975), while melanoma rates increased by 3.3% annually until stabilizing in 2009.
Among the oldest women, death rates increased until the early 2000s and have subsequently declined by 0.8% per year (Figure S4). The overall pattern reflects decreasing
Sources: Incidence – SEER 9 registries, 2018. Mortality – NCHS, 2018.
©2019, American Cancer Society, Inc., Surveillance Research
Rat
e p
er 1
00,
00
0
Figure S4. Trends in Cancer Incidence and Death Rates by Sex, Ages 85+, US, 1975 to 2016
Male, incidence
Male, mortality
Female, mortality
Female, incidence
Year
0
500
1000
1500
2000
2500
3000
3500
4000
4500
201520102005200019951990198519801975
34 Cancer Facts & Figures 2019
death rates for cancers of the colorectum and breast that until the mid-2000s were offset by increasing death rates for lung cancer (Figure S6). Lung cancer death rates in the oldest women increased nearly 4-fold from 1975 to 2006 and stabilized thereafter. In contrast, among women ages 65 to 84, lung cancer death rates have decreased since the mid-2000s. Historically, colorectal cancer was the leading cause of cancer death in the oldest women. However, colorectal death rates dropped nearly 50% from a peak of 297 deaths per 100,000 in 1984 to 156 per 100,000 in 2016. As a result, colorectal cancer is now the third-leading cause of cancer death among women 85 and older. Breast cancer death rates have also declined by about 0.9% per year since their peak in the mid-1990s. In contrast, death rates increased for melanoma and pancreatic cancer, similar to the trends in older men.
Can cancer be detected early in older adults?Cancer patients ages 85 and older are less likely to be diagnosed at an early stage than younger patients. For
example, 57% of the oldest breast cancer patients and 41% of the oldest prostate cancer patients are diagnosed at a local stage, compared to 68% and 77% of patients ages 65-84, respectively (Figure S7). Later stage at diagnosis among the oldest cancer patients, in part, reflects less screening. Notably, the oldest cancer patients are two to
Note: Rates have been adjusted for reporting delays using delay ratios from the SEER 18 registries.
Sources: NAACCR, 2018.
©2019, American Cancer Society, Inc., Surveillance Research
Rat
e p
er 1
00,
00
0
Rat
e p
er 1
00,
00
0
Figure S5. Trends in Cancer Incidence Rates for Selected Sites, Ages 85+, US, 1995-2015Males Females
0
200
400
600
800
1000
201520102005200019950
100
200
300
400
500
20152010200520001995
Year Year
Melanoma of the skin
Urinary bladder
Colon & rectum
Lung & bronchus
Prostate
Breast
Colon & rectum
Lung & bronchus
Melanoma of the skin
Pancreas
Joinpoint trendsTable S2 describes trends in incidence rates based on Joinpoint analyses. This method involves fitting a series of joined straight lines on a logarithmic scale to the trends in annual rates, with each junction or “joinpoint” of two lines denoting a statistically significant change in trend. The direction and magnitude of the resulting trends over the 1995-2015 period are described as the annual percent change (APC). If the program detects no change during the period, then only a single APC will be given. If the program detects multiple trends, then the magnitude, direction, and applicable years for each will be listed separately.

Cancer Facts & Figures 2019 35
four times more likely to be diagnosed with unstaged cancer than patients ages 65-84 (Figure S7). This may be due to the inability or undesirability of some older patients to undergo complete diagnostic testing due to other health conditions. However, staging information is important for the provision of appropriate treatment.
Routine cancer screening is generally not recommended for those ages 85+ due to the higher prevalence of serious medical conditions, diminished life expectancy, and limited evidence of benefit, partly because this population has not been included in clinical trials
evaluating screening. For most in this age group, the small potential benefit of extending life is likely to be outweighed by the possible harms of screening, which are more common with increasing age. Harms include the need for additional tests; emotional stress; overdiagnosis, which may lead to overtreatment; and procedure-related risks.34, 35 Older adults are more likely to experience overdiagnosis due to higher rates of indolent tumors and competing mortality risks.36 In addition, one study found that following a screening colonoscopy, adults 85+ were more than twice as likely to experience a serious gastrointestinal event, such as perforation or bleeding,
Table S2. Joinpoint Trends in Cancer Incidence Rates for Selected Sites in Two Age Groups, US, 1995-2015Trend 1 Trend 2 Trend 3 Trend 4
Years APC Years APC Years APC Years APC
MALES
Colon & rectum
65-84 1995-2000 0.0 2000-2015 -4.2*
85+ 1995-2000 -0.5 2000-2015 -4.4*
Lung & bronchus
65-84 1995-2008 -1.2* 2008-2015 -2.8*
85+ 1995-2008 0.0 2008-2015 -2.1*
Melanoma of the skin
65-84 1995-2000 5.5* 2000-2015 3.4*
85+ 1995-2002 7.4* 2002-2015 4.3*
Prostate
65-84 1995-2001 0.9 2001-2004 -5.7 2004-2007 2.0 2007-2015 -6.7*
85+ 1995-2003 -3.0* 2003-2015 -6.7*
Urinary bladder
65-84 1995-1998 1.9* 1998-2005 0.2 2005-2013 -0.9* 2013-2015 -3.3*
85+ 1995-2008 1.2* 2008-2015 -0.9*
FEMALES
Breast
65-84 1995-1999 1.6* 1999-2004 -2.7* 2004-2015 0.8*
85+ 1995-1999 1.9* 1999-2003 -3.6* 2003-2009 0.1 2009-2015 -2.1*
Colon & rectum
65-84 1995-1998 1.5* 1998-2005 -2.7* 2005-2015 -4.3*
85+ 1995-1998 1.7 1998-2008 -3.0* 2008-2015 -5.0*
Lung & bronchus
65-84 1995-1997 2.4* 1997-2007 1.1* 2007-2015 -1.2*
85+ 1995-2008 3.0* 2008-2015 -1.2*
Melanoma of the skin
65-84 1995-2000 5.1* 2000-2015 3.1*
85+ 1995-2015 3.7*
Pancreas
65-84 1995-2015 0.8*
85+ 1995-2008 0.8* 2008-2015 -0.7
*Indicates trend is significantly different from zero, p<0.05. Note: Rates have been adjusted for reporting delays using delay ratios from the SEER 18 registries.
Source: NAACCR, 2018.
©2019, American Cancer Society, Inc., Surveillance Research

36 Cancer Facts & Figures 2019
compared to adults ages 66-69 (12 versus 5 events per 1,000 colonoscopies, respectively).37 Moreover, the benefits of screening are accrued over time. It is estimated that there is a 10-year delay to save 1 life per 1,000 people screened for breast or colorectal cancer, and an even greater delay for prostate cancer.34, 38 As a result, the benefit of screening is substantially reduced in those with limited life expectancy.
While most guidelines generally recommend against cancer screening in those with less than a 10-year life expectancy, differences across organizations can complicate decisions for patients and their providers. For breast cancer screening, the American Cancer Society recommends mammography for all women with a life expectancy of at least 10 years.39 The US Preventive Services Task Force (USPSTF) also endorses individualized breast cancer screening decisions, but highlights the lack of evidence for screening in women over 75.40, 41 Both of these organizations recommend against screening for colorectal cancer after age 75.39, 42 While the American Cancer Society guidelines recommend an informed
decision-making process to guide prostate cancer testing in men with at least a 10-year life expectancy, the USPSTF recommends against PSA testing in men 70 and older.43 Cervical cancer screening is not recommended after age 65 in women who have adequate prior screening, and the upper age limit for lung cancer screening among heavy and former longtime smokers is age 80.44, 45 The American Geriatrics Society, on the other hand, has a general recommendation to consider life expectancy and the risks of testing, overdiagnosis, and overtreatment in screening decisions of older patients.46 In addition, Medicare generally covers cancer screenings without an upper age limit or other restrictions.
Although research has shown that the benefit of screening is dependent on sufficient life expectancy, accurately assessing life expectancy and communicating this information to patients can be challenging. Mortality indexes that incorporate comorbid conditions and functional status along with age can help clinicians estimate life expectancy.47 However, a recent study of adults ages 65 and older reported that although older
Sources: NCHS, 2018.
©2019, American Cancer Society, Inc., Surveillance Research
Rat
e p
er 1
00,
00
0
Rat
e p
er 1
00,
00
0
Figure S6. Trends in Cancer Death Rates for Selected Sites, Ages 85+, US, 1975-2016
Males Females
0
100
200
300
400
500
600
700
800
900
2015201020052000199519901985198019750
50
100
150
200
250
300
350
201520102005200019951990198519801975
Breast
Prostate
Pancreas
Pancreas
Urinary bladderUrinary bladder
Melanoma of the skinMelanoma of the skin
Colon & rectum
Colon & rectum
Lung & bronchus
Lung & bronchus
Year Year

Cancer Facts & Figures 2019 37
adults were amenable to using age and health status in the context of discussing screening cessation, there were concerns with discussions focused on life expectancy.48 Another study found that patients prefer clinicians to frame the decision to stop screening in terms of prioritizing other health issues.49
Nevertheless, data from the National Health Interview Survey indicate unexpectedly high rates of screening in adults ages 85 and older (Table S3). In 2015, more than one-third of women 85 and older reported receiving a mammogram in the previous two years and 18% reported receiving recent cervical cancer screening tests. More than half of adults ages 85+ reported receiving either a stool screening test in the past year or a sigmoidoscopy or colonoscopy in the past five or 10 years, respectively. Nearly 30% of men in this age group reported receiving a PSA test in the past year.
What percentage of people ages 85 and older survive cancer? Cancer survival rates decline with age, and patients 85 and older have the lowest relative survival of any age group.50 Relative survival is the proportion of people who are alive for a designated time after a cancer diagnosis divided by the proportion of people of similar age, race, etc. expected to be alive in the absence of cancer based on normal life expectancy. Five-year relative survival rates for the top five cancers in men and women ages 85+ and 65-84 are shown in Figure S8. In both age groups, relative survival approaches 100% for early-stage breast and prostate cancers, and is 95% for in situ urinary bladder cancer. However survival is 35% lower (in absolute terms) in adults 85+ than in ages 65-84 for regional-stage prostate cancer and 20-23% lower for local-stage lung and bladder cancers. For breast and colorectal cancers, age-related disparities are largest for
Note: Cases reported through autopsy only were excluded.Source: NAACCR, 2018.
©2019, American Cancer Society, Inc., Surveillance Research
Perc
ent
Perc
ent
Figure S7. Stage Distribution (%) for Selected Cancers in Two Age Groups, US, 2008-201465-84 85+
4134 34 31
19 17
7
18 21 2317 16
47 45
9
22
68
57
23
77
41
9 94 5
19
35 35
4943
7 5 54 410
38
23
6 73
13
0
20
40
60
80
100
UnstagedDistantRegionalLocalized0
20
40
60
80
100
UnstagedDistantRegionalLocalized0
20
40
60
80
100
UnstagedDistantRegionalLocalized
0
20
40
60
80
100
UnstagedDistantRegionalLocalized0
20
40
60
80
100
UnstagedDistantRegionalLocalizedIn situ
Breast (female)
Prostate Urinary bladder
10 13 12
30
48
35 34
18
0
20
40
60
80
100
UnstagedDistantRegionalLocalized
Pancreas
Colon & rectum Lung & bronchus

38 Cancer Facts & Figures 2019
local- and regional-stage disease. Poorer survival in the oldest cancer patients in part reflects the numerous treatment challenges (discussed in the next section). In addition, research suggests that older adults may be less willing to sacrifice quality of life and tolerate treatment toxicities to extend survival.51 Studies suggest that older patients have benefited less than younger patients from recent advances in cancer treatment.52 One recent study found smaller improvements in survival for older cancer patients from 1990 to 2009 for six leading cancers has resulted in widening age-related disparities.52
How is cancer treated in adults 85 and older?The oldest old cancer patients are less likely to receive surgical treatment than patients ages 65-84 for each of the most common cancers (Figure S9). The most striking difference is observed for breast cancer; 89% of patients 65-84 years of age receive surgery, compared to just 65% of those 85+. Other studies have found that older breast cancer patients are less likely to receive guideline concordant care, even after accounting for patient comorbidities.53, 54
Although National Comprehensive Cancer Network guidelines do not recommend less intensive therapy for any patient with potentially curable cancer, studies have shown that older patients often receive little or no treatment.36, 55, 56 This is partly because cancer-directed therapy is not appropriate for some older patients because the benefit of prolonged survival does not
outweigh potential adverse effects and impact on quality of life. In addition, for many older patients, death may be more likely to occur from other causes.57, 58
Age alone does not predict life expectancy, physical function, or the ability to tolerate treatment. A large body of research is currently focused on developing tools that will enable clinicians to evaluate the functional age of patients as part of the treatment decision-making process. The Geriatric Assessment (GA) is a multidimensional, multidisciplinary tool that can be used to evaluate medical, psychosocial, and functional capabilities in older adults. Studies have shown that the GA can identify previously unknown health problems and predict treatment toxicities and overall survival in cancer patients.59 Although the GA can help guide appropriate treatment, it requires significant time and resources to implement.60, 61 A panel of geriatric oncology experts recommended the use of the GA in cancer patients 75 years of age and older, and more recently, the American Society of Clinical Oncology recommended use of the GA in patients 65 and older who are receiving chemotherapy.62, 63 Nevertheless, additional research is needed to determine effectiveness and best practices for the use of the GA in older cancer patients.60
Biomarkers, including markers of chronic inflammation (e.g. C-reactive protein and plasma interleukin 6 levels) and coagulation (e.g. d-dimer, sVCAM), as well as commonly measured laboratory blood values (hemoglobin and albumin) are being investigated for their potential to aid in the assessment of functional age and frailty, and their ability to predict mortality.61, 64, 65 Although these markers are easily obtained through routine bloodwork, they require careful interpretation because they can be produced by cancer itself and thus may be most useful in patients who have had their tumor surgically removed. Potential age-related biomarkers under investigation that are not produced by tumors, including telomere length and p16 levels, are associated with cellular senescence (when cells stop dividing) and require more specialized analysis.64
Treating cancer patients ages 85+ is complex due to the higher likelihood of other health conditions, declines in health associated with aging, and the dearth of data
Table S3. Screening Prevalence (%) among Adults 85+, US, 2015Breast Mammography in the past 2 years 34
Cervix Pap test within the past 3 years 18
Colon & rectum Stool test or endoscopy* 52
Men 60
Women 47
Prostate PSA test† in the past 1 year 29
Note: Estimates do not distinguish between examinations for screening and diagnosis. PSA: prostate-specific antigen test. *Either a fecal occult blood test or fecal immunochemical test within the past year, sigmoidoscopy within the past five years, or a colonoscopy within the past 10 years. †Among those with no reported prior diagnosis of prostate cancer.
Source: NCHS, National Health Interview Survey, 2015.
©2019, American Cancer Society, Inc., Surveillance Research

Cancer Facts & Figures 2019 39
about cancer treatment in this age group. Nearly half (47%) of cancer patients 85 and older have serious medical conditions that would require adjustment of cancer treatment.8 Most studies have found that cancer patients with comorbidities are less likely to receive curative treatment.66 This in part reflects concerns about increased risks of death from these other health issues as well as treatment side effects, including exacerbating coexisting conditions and drug interactions. One study found that 39% of cancer patients over 80 were taking five or more medications including their cancer drugs.67 In addition, age-associated physiologic changes, such as declines in liver and kidney function, can affect drug metabolism and influence therapeutic benefit and risk of adverse effects.68, 69 Much remains unknown about the intersection of side effects of cancer therapies and age-related declines, such as cognitive impairment, in older patients.70, 71 Finally, clinicians have inadequate evidence on which to base treatment decisions in older
cancer patients because of extremely limited representation in clinical trials.72, 73 As a result, it is difficult to predict tolerance and response to therapies, as well as their influence on other health conditions or medications.7 The Institute of Medicine report, Delivering High-Quality Cancer Care: Charting a New Course for a System in Crisis, highlighted the critical need of improving the evidence-base for treating older adults with cancer.74 Although several recent trials focusing on older patients have been successful, accrual rates remain low.
What unique challenges do older people with cancer face? Although research on the cancer survivor experience in the oldest old population is limited, some studies suggest higher rates of depression, distress, and anxiety.75, 76 Furthermore, cancer and its treatment often accelerate the aging process by further reducing physical
0
20
40
60
80
100
DistantRegionalLocalizedIn situAll stages0
20
40
60
80
100
DistantRegionalLocalizedAll stages
0
20
40
60
80
100
DistantRegionalLocalizedAll stages0
20
40
60
80
100
DistantRegionalLocalizedAll stages0
20
40
60
80
100
DistantRegionalLocalizedAll stages
Source: SEER 18 registries, 2018.
©2019, American Cancer Society, Inc., Surveillance Research
Perc
ent
Perc
ent
Figure S8. Five-year Relative Survival for Selected Cancers in Two Age Groups, US, 2008-201465-84 85+
64
50
88
78
68
59
115
16
52
8
3226
14
4 2
90
80
>99
99
77
>99
30
>99 >99
65
19
95
76
95
69
46
4
34
23
4
61
>99
83
64
2215
Breast (female)
Prostate Urinary bladder
0
20
40
60
80
100
DistantRegionalLocalizedAll stages
5 2 2
24
92 1
9
Pancreas
Colon & rectum Lung & bronchus

40 Cancer Facts & Figures 2019
functioning, especially among older survivors with multiple additional chronic conditions.77 Nevertheless, some survivors in this age group remain resilient. Physical activity, maintaining a healthy weight, and subjective happiness serve as protective factors against physical functioning decline among older cancer survivors.77 Recommendations for physical activity in the oldest old should be individualized to optimize participation, safety, and efficacy. Older cancer survivors can also benefit from programs that encourage smoking cessation, weight management, and social support.78
ResourcesAmerican Federation for Aging Research www.afar.org
The mission of this national nonprofit organization is to support and advance healthy aging through biomedical research.
American Society of Clinical Oncology (ASCO) www.asco.org/practice-guidelines/cancer-care-initiatives/geriatric-oncology
Source: SEER 18 registries, 2018.
©2019, American Cancer Society, Inc., Surveillance Research
Percent
Figure S9. Receipt of Surgical Treatment for Selected Cancers in Two Age Groups, US, 2011-2015
65-84 85+
10%
1%5%
1%5%
22%6%
3%
3%
2%
1%3%
4%
10%
19%
18%30%
14%
14%
12%8%
18%31%
30%
65%
64%81%
75%
78%
68%68%
91%85%
85%
83%
89%
0 20 40 60 80 100
Unknown
Surgery
No surgery
Unknown
Surgery
No surgery
Unknown
Surgery
No surgery
Unknown
Surgery
No surgery
Unknown
Surgery
No surgery
Unknown
Surgery
No surgery
Brea
st (f
emal
e)Co
lon
& re
ctum
Lung
& b
ronc
hus
Panc
reas
Pros
tate
Urin
ary
blad
der

Cancer Facts & Figures 2019 41
ASCO has compiled the most practice-changing, cutting-edge research and clinical guidelines in geriatric oncology, along with effective tools, assessments, and other resources for clinicians, patients, and caregivers.
Cancer and Resource Aging Group www.mycarg.org
The Cancer and Aging Research Group aims to improve the care of older adults with cancer through research collaborations and clinical trials. Their website also provides a wealth of information and resources for older adults including guidance on nutrition, safety, and emotional support.
International Society of Geriatric Oncology www.siog.org
The International Society of Geriatric Oncology is a multidisciplinary team of oncology and geriatrics physicians, along with allied health professionals, collaborating to address the rising public health challenges related to aging and cancer to foster the development of health professionals in the field of geriatric oncology and optimize treatment for older adults with cancer worldwide.
National Institute on Aging (NIA) www.nia.nih.gov
As one of the 27 institutes and centers of the National Institutes of Health, the National Institute on Aging leads the federal government in conducting and supporting research on aging and the health and well-being of older people by seeking to understand the nature of aging and the aging process, and diseases and conditions associated with growing older, in order to extend healthy, active years of life.
References1. Projected 5-Year Age Groups and Sex Composition: Main Projections Series for the United States, 2017-2060. U.S. Census Bureau, Population Division: Washington, DC.2. Preston SH, Vierboom YC, Stokes A. The role of obesity in exceptionally slow US mortality improvement. Proc Natl Acad Sci U S A. 2018;115: 957-961.3. Crimmins EM, Preston SH, Cohen B (Eds). Explaining Divergent Levels of Longevity in High-Income Countries. National Research Council Panel on Understanding Divergent Trends in Longevity in High-Income Countries. Washington, DC: National Academies Press; 2011.4. Kontis V, Bennett JE, Mathers CD, Li G, Foreman K, Ezzati M. Future life expectancy in 35 industrialised countries: projections with a Bayesian model ensemble. Lancet. 2017;389: 1323-1335.5. Williams GR, Mackenzie A, Magnuson A, et al. Comorbidity in older adults with cancer. J Geriatr Oncol. 2016;7: 249-257.6. Bernard MA, Clayton JA, Lauer MS. Inclusion Across the Lifespan: NIH Policy for Clinical Research. JAMA. 2018.7. Hurria A, Levit LA, Dale W, et al. Improving the Evidence Base for Treating Older Adults With Cancer: American Society of Clinical Oncology Statement. J Clin Oncol. 2015;33: 3826-3833.8. Bluethmann SM, Mariotto AB, Rowland JH. Anticipating the “Silver Tsunami”: Prevalence Trajectories and Comorbidity Burden among Older Cancer Survivors in the United States. Cancer Epidemiol Biomarkers Prev. 2016;25: 1029-1036.9. White MC, Holman DM, Boehm JE, Peipins LA, Grossman M, Henley SJ. Age and cancer risk: a potentially modifiable relationship. Am J Prev Med. 2014;46: S7-15.10. Falandry C, Bonnefoy M, Freyer G, Gilson ED. Biology of cancer and aging: a complex association with cellular senescence. J Clin Oncol. 2014;32: 2604-2610.11. Hanson HA, Smith KR, Stroup AM, Harrell CD. An age-period-cohort analysis of cancer incidence among the oldest old, Utah 1973-2002. Popul Stud (Camb). 2015;69: 7-22.12. Harding C, Pompei F, Wilson R. Peak and decline in cancer incidence, mortality, and prevalence at old ages. Cancer. 2012;118: 1371-1386.13. Joseph SC, Delcastilo E, Loukas M, Osiro SD. Common cancers in centenarians. Med Sci Monit. 2014;20: 18-23.14. Macieira-Coelho A. Cancers and the concept of cell senescence. Biogerontology. 2010;11: 211-227.15. Pompei F, Polkanov M, Wilson R. Age distribution of cancer in mice: the incidence turnover at old age. Toxicol Ind Health. 2001;17: 7-16.16. Campisi J. Aging, cellular senescence, and cancer. Annu Rev Physiol. 2013;75: 685-705.17. Bonafe M, Barbi C, Storci G, et al. What studies on human longevity tell us about the risk for cancer in the oldest old: data and hypotheses on the genetics and immunology of centenarians. Exp Gerontol. 2002;37: 1263-1271.18. Pavlidis N, Stanta G, Audisio RA. Cancer prevalence and mortality in centenarians: a systematic review. Crit Rev Oncol Hematol. 2012;83: 145-152.

42 Cancer Facts & Figures 2019
19. Miller B, Feuer E, Altekruse SD. Cancer Incidence Patterns in the Oldest Ages Using Expanded Age Categories from SEER Registry Data and the 2010 Census Population. J Registry Manag. 2017;44: 130-135.20. Thakkar JP, McCarthy BJ, Villano JD. Age-specific cancer incidence rates increase through the oldest age groups. Am J Med Sci. 2014;348: 65-70.21. Krok-Schoen JL, Adams IK, Baltic RD, Fisher JL. Ethnic disparities in cancer incidence and survival among the oldest old in the United States. Ethn Health. 2017: 1-14.22. Krok-Schoen JL, Fisher JL, Baltic RD, Paskett ED. White-Black Differences in Cancer Incidence, Stage at Diagnosis, and Survival among Adults Aged 85 Years and Older in the United States. Cancer Epidemiol Biomarkers Prev. 2016;25: 1517-1523.23. Siegel RL, Jemal A, Wender RC, Gansler T, Ma J, Brawley OW. An assessment of progress in cancer control. CA Cancer J Clin. 2018;68: 329-339.24. O’Keefe EB, Meltzer JP, Bethea TN. Health disparities and cancer: racial disparities in cancer mortality in the United States, 2000-2010. Front Public Health. 2015;3: 51.25. Morris AM, Rhoads KF, Stain SC, Birkmeyer JD. Understanding racial disparities in cancer treatment and outcomes. J Am Colleg Surg. 2010;211: 105-113.26. Shih YT, Xu Y, Liu L, Smieliauskas FD. Rising Prices of Targeted Oral Anticancer Medications and Associated Financial Burden on Medicare Beneficiaries. J Clin Oncol. 2017;35: 2482-2489.27. Colby SL, Ortman JM. Projections of the size and composition of the US population: 2014 to 2060. Current Population Reports, P25-1143. U.S. Census Bureau, Washington, DC, 2014.28. United States Census Bureau. Race and Hispanic origin by selected age groups. Projections for the United States: 2017-2060, Table 6, 2018.29. Holford TR, Levy DT, McKay LA, et al. Patterns of birth cohort-specific smoking histories, 1965-2009. Am J Prev Med. 2014;46: e31-37.30. Autier P, Koechlin A, Boniol M. The forthcoming inexorable decline of cutaneous melanoma mortality in light-skinned populations. Eur J Cancer. 2015;51: 869-878.31. Gundrun JD, Go RS. Cancer in the oldest old in the United States: Current statistics and projections. J Geriatr Oncol. 2012;3: 299-306.32. Feuer EJ, Merrill RM, Hankey BF. Cancer surveillance series: Interpreting trends in prostate cancer – Part II: Cause of death misclassification and the recent rise and fall in prostate cancer mortality. J Natl Cancer Inst. 1999; 91:1025-1032.33. Negoita S, Feuer EJ, Mariotto A, et al. Annual Report to the Nation on the Status of Cancer, part II: Recent changes in prostate cancer trends and disease characteristics. Cancer. 2018;124: 2801-2814.34. Lee KT, Harris RP, Schoenborn NL. Individualized Approach to Cancer Screening in Older Adults. Clin Geriatr Med. 2018;34: 11-23.35. Braithwaite D, Demb J, Henderson LM. Optimal breast cancer screening strategies for older women: current perspectives. Clin Interv Aging. 2016;11: 111-125.36. Schonberg MA, Marcantonio ER, Li D, Silliman RA, Ngo L, McCarthy EP. Breast cancer among the oldest old: tumor characteristics, treatment choices, and survival. J Clin Oncol. 2010;28: 2038-2045.
37. Warren JL, Klabunde CN, Mariotto AB, et al. Adverse events after outpatient colonoscopy in the Medicare population. Ann Intern Med. 2009;150: 849-857, W152.38. Lee SJ, Boscardin WJ, Stijacic-Cenzer I, Conell-Price J, O’Brien S, Walter LC. Time lag to benefit after screening for breast and colorectal cancer: meta-analysis of survival data from the United States, Sweden, United Kingdom, and Denmark. BMJ. 2013;346: e8441.39. Smith RA, Andrews KS, Brooks D, et al. Cancer screening in the United States, 2018: A review of current American Cancer Society guidelines and current issues in cancer screening. CA Cancer J Clin. 2018;68: 297-316.40. Eckstrom E, Feeny DH, Walter LC, Perdue LA, Whitlock EP. Individualizing cancer screening in older adults: a narrative review and framework for future research. J Gen Intern Med. 2013;28: 292-298.41. Siu AL, Force USPST. Screening for Breast Cancer: U.S. Preventive Services Task Force Recommendation Statement. Ann Intern Med. 2016;164: 279-296.42. Bibbins-Domingo K, Grossman DC, Curry SJ, et al. Screening for Colorectal Cancer: US Preventive Services Task Force Recommendation Statement. JAMA. 2016;315: 2564-2575.43. Grossman DC, Curry SJ, Owens DK, et al. Screening for Prostate Cancer: US Preventive Services Task Force Recommendation Statement. JAMA. 2018;319: 1901-1913.44. Moyer VA. Screening for lung cancer: U.S. Preventive Services Task Force recommendation statement. Ann Intern Med. 2014;160: 330-338.45. Curry SJ, Krist AH, Owens DK, et al. Screening for Cervical Cancer: US Preventive Services Task Force Recommendation Statement. JAMA. 2018;320: 674-686.46. American Geriatrics Society. Ten Things Clinicians and Patients Should Question. Available from URL: http://www.choosingwisely.org/societies/american-geriatrics-society/ Accessed September 25, 2018.47. Yourman LC, Lee SJ, Schonberg MA, Widera EW, Smith AK. Prognostic indices for older adults: a systematic review. JAMA. 2012;307: 182-192.48. Schoenborn NL, Lee K, Pollack CE, et al. Older Adults’ Views and Communication Preferences About Cancer Screening Cessation. JAMA Intern Med. 2017;177: 1121-1128.49. Schoenborn NL, Janssen EM, Boyd CM, Bridges JFP, Wolff AC, Pollack CE. Preferred Clinician Communication About Stopping Cancer Screening Among Older US Adults: Results From a National Survey. JAMA Oncol. 2018;4: 1126-1128.50. Noone AM, Howlader N, Krapcho M, et al. SEER Cancer Statistics Review, 1975-2015. http://seer.cancer.gov/csr/1975_2015/, based on November 2017 SEER data submission, posted to the SEER web site, April 2018. Bethesda, MD: National Cancer Institute, 2018.51. Yellen SB, Cella DF, Leslie WT. Age and clinical decision making in oncology patients. J Natl Cancer Instit. 1994;86: 1766-1770.52. Zeng C, Wen W, Morgans AK, Pao W, Shu XO, Zheng WD. Disparities by Race, Age, and Sex in the Improvement of Survival for Major Cancers: Results From the National Cancer Institute Surveillance, Epidemiology, and End Results (SEER) Program in the United States, 1990 to 2010. JAMA Oncol. 2015;1: 88-96.

Cancer Facts & Figures 2019 43
53. LeMasters TJ, Madhavan SS, Sambamoorthi U, Vyas AM. Disparities in the Initial Local Treatment of Older Women with Early-Stage Breast Cancer: A Population-Based Study. J Womens Health (Larchmt). 2017;26: 735-744.54. Giordano SH, Hortobagyi GN, Kau SW, Theriault RL, Bondy MD. Breast cancer treatment guidelines in older women. J Clin Oncol. 2005;23: 783-791.55. LeMasters T, Madhavan SS, Sambamoorthi U, Hazard-Jenkins HW, Kelly KM, Long D. Receipt of Guideline-Concordant Care Among Older Women With Stage I-III Breast Cancer: A Population-Based Study. J Natl Compr Canc Netw. 2018;16: 703-710.56. Fang P, He W, Gomez DR, et al. Influence of Age on Guideline-Concordant Cancer Care for Elderly Patients in the United States. Int J Radiat Oncol Biol Phys. 2017;98: 748-757.57. Edwards BK, Noone AM, Mariotto AB, et al. Annual Report to the Nation on the status of cancer, 1975-2010, featuring prevalence of comorbidity and impact on survival among persons with lung, colorectal, breast, or prostate cancer. Cancer. 2014;120: 1290-1314.58. Jorgensen TL, Hallas J, Friis S, Herrstedt JD. Comorbidity in elderly cancer patients in relation to overall and cancer-specific mortality. Br J Cancer. 2012;106: 1353-1360.59. Kenis C, Baitar A, Decoster L, et al. The added value of geriatric screening and assessment for predicting overall survival in older patients with cancer. Cancer. 2018.60. Wildiers H, Heeren P, Puts M, et al. International Society of Geriatric Oncology consensus on geriatric assessment in older patients with cancer. J Clin Oncol. 2014;32: 2595-2603.61. Pallis AG, Hatse S, Brouwers B, et al. Evaluating the physiological reserves of older patients with cancer: the value of potential biomarkers of aging? J Geriatr Oncol. 2014;5: 204-218.62. Mohile SG, Velarde C, Hurria A, et al. Geriatric Assessment-Guided Care Processes for Older Adults: A Delphi Consensus of Geriatric Oncology Experts. J Natl Compr Canc Netw. 2015;13: 1120-1130.63. Mohile SG, Dale W, Somerfield MR, et al. Practical Assessment and Management of Vulnerabilities in Older Patients Receiving Chemotherapy: ASCO Guideline for Geriatric Oncology. J Clin Oncol. 2018;36: 2326-2347.64. Li D, de Glas NA, Hurria A. Cancer and Aging: General Principles, Biology, and Geriatric Assessment. Clin Geriatr Med. 2016;32: 1-15.65. Baitar A, Kenis C, Decoster L, et al. The prognostic value of 3 commonly measured blood parameters and geriatric assessment to predict overall survival in addition to clinical information in older patients with cancer. Cancer. 2018;124: 3764-3775.66. Sarfati D, Koczwara B, Jackson C. The impact of comorbidity on cancer and its treatment. CA Cancer J Clin. 2016;66: 337-350.67. Hersh LR, Beldowski K, Hajjar ER. Polypharmacy in the Geriatric Oncology Population. Curr Oncol Rep. 2017;19: 73.68. Nightingale G, Schwartz R, Kachur E, et al. Clinical pharmacology of oncology agents in older adults: A comprehensive review of how chronologic and functional age can influence treatment-related effects. J Geriatr Oncol. 2018.69. Jaul E, Barron J. Age-Related Diseases and Clinical and Public Health Implications for the 85 Years Old and Over Population. Front Public Health. 2017;5: 335.
70. Mandelblatt JS, Hurria A, McDonald BC, et al. Cognitive effects of cancer and its treatments at the intersection of aging: what do we know; what do we need to know? Semin Oncol. 2013;40: 709-725.71. Loh KP, Janelsins MC, Mohile SG, et al. Chemotherapy-related cognitive impairment in older patients with cancer. J Geriatr Oncol. 2016;7: 270-280.72. Hurria A, Dale W, Mooney M, et al. Designing therapeutic clinical trials for older and frail adults with cancer: U13 conference recommendations. J Clin Oncol. 2014;32: 2587-2594.73. Muss HD. Cancer in the elderly: a societal perspective from the United States. Clin Oncol (R Coll Radiol). 2009;21: 92-98.74. Institute of Medicine. Delivering high quality cancer care: Charting a new course for a system in crisis. Washington, DC: National Academies Press, 2013.75. Cohen M. Depression, anxiety, and somatic symptoms in older cancer patients: a comparison across age groups. Psychooncology. 2014;23: 151-157.76. Goldzweig G, Baider L, Rottenberg Y, Andritsch E, Jacobs JM. Is age a risk factor for depression among the oldest old with cancer? J Geriatr Oncol. 2018;9: 476-481.77. Weaver KE, Leach CR, Leng X, et al. Physical Functioning among Women 80 Years of Age and Older With and Without a Cancer History. J Gerontol A Biol Sci Med Sci. 2016;71 Suppl 1: S23-30.78. Bluethmann SM, Sciamanna CN, Winkels RM, Sturgeon KM, Schmitz KH. Healthy Living After Cancer Treatment: Considerations for Clinical and Community Practice. Am J Lifestyle Med. 2018;12: 215-219.