Ageing, Health and Life Satisfaction of the Oldest Old: An …ftp.iza.org/dp4053.pdf · IZA DP No....
40
IZA DP No. 4053 Ageing, Health and Life Satisfaction of the Oldest Old: An Analysis for Germany Wencke Gwozdz Alfonso Sousa-Poza DISCUSSION PAPER SERIES Forschungsinstitut zur Zukunft der Arbeit Institute for the Study of Labor March 2009
Transcript of Ageing, Health and Life Satisfaction of the Oldest Old: An …ftp.iza.org/dp4053.pdf · IZA DP No....
IZA DP No. 4053
Ageing, Health and Life Satisfaction of theOldest Old: An Analysis for Germany
Wencke GwozdzAlfonso Sousa-Poza
DI
SC
US
SI
ON
P
AP
ER
S
ER
IE
S
Forschungsinstitut
zur Zukunft der Arbeit
Institute for the Study
of Labor
March 2009
Ageing, Health and Life Satisfaction of the
Oldest Old: An Analysis for Germany
Wencke Gwozdz University of Hohenheim
and Copenhagen Business School
Alfonso Sousa-Poza
University of Hohenheim and IZA
Discussion Paper No. 4053 March 2009
IZA
P.O. Box 7240 53072 Bonn
Germany
Phone: +49-228-3894-0 Fax: +49-228-3894-180
E-mail: [email protected]
Any opinions expressed here are those of the author(s) and not those of IZA. Research published in this series may include views on policy, but the institute itself takes no institutional policy positions. The Institute for the Study of Labor (IZA) in Bonn is a local and virtual international research center and a place of communication between science, politics and business. IZA is an independent nonprofit organization supported by Deutsche Post Foundation. The center is associated with the University of Bonn and offers a stimulating research environment through its international network, workshops and conferences, data service, project support, research visits and doctoral program. IZA engages in (i) original and internationally competitive research in all fields of labor economics, (ii) development of policy concepts, and (iii) dissemination of research results and concepts to the interested public. IZA Discussion Papers often represent preliminary work and are circulated to encourage discussion. Citation of such a paper should account for its provisional character. A revised version may be available directly from the author.
IZA Discussion Paper No. 4053 March 2009
ABSTRACT
Ageing, Health and Life Satisfaction of the Oldest Old: An Analysis for Germany*
This analysis uses data from the German Socio-Economic Panel (GSOEP) and the Survey on Health, Ageing and Retirement in Europe (SHARE) to assess the effect of ageing and health on the life satisfaction of the oldest old (defined as 75 and older). We observe a U-shaped relationship between age and levels of life satisfaction for individuals aged between 16 and approximately 65. Thereafter, life satisfaction declines rapidly and the lowest absolute levels of life satisfaction are recorded for the oldest old. This decline is primarily attributable to low levels of perceived health. Once cohort effects are also controlled for, life satisfaction remains relatively constant across the lifespan. JEL Classification: I18, I19, J28 Keywords: life satisfaction, health, oldest old Corresponding author: Alfonso Sousa-Poza University of Hohenheim Institute for Household and Consumer Economics Fruwirthstr. 48 D-70599 Stuttgart Germany E-mail: [email protected]
* The data used in this publication were made available by the German Institute for Economic Research (DIW), Berlin, and through release 2 of SHARE 2004. The SHARE data collection was funded primarily by the European Commission through the fifth framework programme. Additional funding came from the U.S. National Institute on Ageing. Further support by the European Commission through the sixth framework program is gratefully acknowledged. For methodological details, see Börsch-Supan and Jürges (2005). This paper has been presented at the 8th International Socio-Economic Panel User Conference in Berlin (July 9-11, 2008), XXII Annual Conference of the European Society for Population Economics in London (June 19-21, 2008) and at the Spring Conference of the DGH in Muenster (April 3-6, 2008). The authors would like to thank the participants of these conferences as well as David Bell, Rainer Hufnagel, Andrew Oswald, Yu Zhu and Justina Fischer for valuable comments and discussions.
1. Introduction
Perhaps one of the most remarkable demographic developments in modern times is the
progressive demographic ageing of the older population itself. In virtually all countries, the
most elderly of the older generation (often referred to as the “oldest old”) is growing faster
than its younger segment. Indeed, according to United Nations Population Division (2002)
projections, the average annual growth rate of persons aged 80 years or over (3.8 percent) is
currently twice as high as the growth rate of the population over 60 years of age. Moreover,
the proportion of those older than 80 is projected to increase almost fourfold over the next 50
years to 4.1 percent in 2050. Currently, in Germany, about 6 million inhabitants are over the
age of 75 (7.1 percent of the population), a figure projected to increase to over 13 million
(18.6 percent of the population) by 2050.
This dramatic increase in the proportion of the oldest old1 has been matched in recent years
by extensive gerontological and medical research on the quality of life (QOL) in this specific
age group (for overviews, see Baltes and Smith, 2003; Walker, 2005). Among the several
QOL domains and models, two have received considerable attention (Walker, 2005): (i)
subjective social indicators of life satisfaction and psychological well-being (e.g. Suzman et
al., 1992; Veenhoven, 1999; Clarke et al., 2000) and (ii) health and functioning (e.g. Beamont
and Kenealy, 2004; Deeg et al., 2000). As Smith (2001) points out, if the most elderly are to
live their final years in dignity, understanding the relationship between health and (subjective)
well-being in old age is of great socio-political importance. QOL research has also flourished
in the field of economics over the past two decades (for an overview, see Frey and Stutzer,
2002), yet, to our knowledge, no investigation has focused on the fastest growing segment of
most populations – the oldest old.
1 Even though several definitions exist for the “oldest old” or “fourth age”, this paper adheres to a
population-based definition of the most elderly in which the transition between the third and fourth age is defined as the chronological age at which 50 percent of the birth cohort are no longer alive. In developed countries, this transition takes place at around 75 years of age (Baltes and Smith, 2003).
2
The primary aim of this paper is to analyse life satisfaction among the oldest old. In doing so,
we must take two points into account: first, when trying to assess and interpret the
developments of life satisfaction among the oldest old, researchers should adopt a life-
course perspective (something seldom done in the vast gerontological literature). Only
comparing changes in life satisfaction during the different stages can produce a genuine
understanding and notion of the levels and changes in life satisfaction among the oldest old.
In addition, a longitudinal analysis is particularly useful in that it can reveal the effect that
belonging to a certain cohort may have on life satisfaction. Hence, we implement the
innovative approach suggested by Clark (2007), which allows identification of pure cohort
effects and ageing effects on life satisfaction.
Our results indicate that (ceteris paribus) life satisfaction among the oldest old remains
relatively constant. However, interestingly, in Germany, life satisfaction remains quite
constant not only in this age group but also across the entire lifecycle. Only among the oldest
of the oldest old (i.e. individuals above the age of 85 years) is there a rapid decline in life
satisfaction. Thus, as Baltes and Smith (2003) put it, “healthy and successful aging has its
age limits”: life satisfaction in old age is assumed to be inevitably affected by health. A
second point to take into account, therefore, is that any analysis of life satisfaction among the
oldest old must recognize the important role of health status. As explained by Smith et al.
(2002, p. 719), “[p]roposals that subjective well-being may decline in old age (especially
among the oldest old) are derived from research documenting the accumulation of
debilitating health conditions, functional impairments, and personal losses during old age
[…]. It is suggested that the increased risk of frailty, loss of functional capacity, and poor
health during the period of very old age […] may place constraints on life satisfaction and
overwhelm individuals to such a degree that they moderate their expression of well-being”.
Hence, we analyse a dataset containing not only information on life satisfaction among the
oldest old but also very detailed subjective and objective health measures.
3
To our knowledge, this paper, which uses representative longitudinal data from the German
Socio-Economic Panel (GSOEP) combined with representative and objective health
information on the oldest old from the Survey of Health, Ageing and Retirement in Europe
(SHARE), represents one of the first explicit examinations of the subjective well-being and
health of the oldest old in Germany The paper proceeds as follows: Section 2 reviews the
relevant research, section 3 outlines the data and methodology, and section 4 presents the
results. Section 5 concludes the paper.
2. Relevant Research
The relationship between age and life satisfaction
Many studies in economics have observed a U-shaped relationship between age and life
satisfaction, with the curve minimum falling between the mid-30s and mid-40s (for overviews,
see Frey and Stutzer, 2002; Easterlin, 2006). This U-shape could be either a true ageing
effect (i.e. it may reflect the different events individuals experience over the life cycle) or it
may simply be a cohort effect arising from unobserved individual heterogeneity. As regards
this latter, based on panel data from the first 14 waves of the British Household Panel, Clark
(2007) identifies a robust U-shaped relationship even after controlling for individual
heterogeneity (see also Clark and Oswald, 2006). Likewise, in their recent study using 1972–
2006 data from the U.S. General Social Survey and 1976–2002 data from Eurobarometers,
Blanchflower and Oswald (2008) show that, even after they controlled for cohort effects,
happiness is indeed U-shaped throughout the life course. In contrast, based on data from the
World Gallup Poll, Deaton (2007) finds that, internationally, age has an inconsistent relation
with happiness: the U-shape is found only in rich English-speaking countries. The author
therefore argues that period or cohort effects are specific to countries or groups of countries.
4
He does not, however, report any covariates, thereby making it difficult to compare his
results with those of other studies.
Life satisfaction is generally assumed and expected to decline in older age, most notably as
health conditions deteriorate. In reality, the general finding of the large body of gerontological
literature on the relationship between age and life satisfaction is that there is no age-related
decline in life satisfaction (Larson, 1978; Herzog and Rodgers, 1981; Horley and Lavery,
1995; Diener and Suh, 1997; Smith et al., 1999). Nevertheless, based on German Socio-
Economic Panel (GSOEP) data for individuals born between 1924 and 1936 (i.e.
respondents who reached 60 within the measurement period of 1984–1999), Schilling (2005)
finds that, in general, there is an overlay of age- and cohort-related decline in the trajectories
of life satisfaction for individuals in young-old age and that once cohort effects are controlled
for, a decline in life satisfaction is observable across old age. Likewise, drawing on data from
the Survey of Health and Living Status of the Elderly in Taiwan, Chen’s (2001) study of the
aging process and life satisfaction concludes that not only the age effect but also cohort
experiences have an impact on life satisfaction. This finding is, to a certain extent, supported
by Mroczek and Spiro’s (2005) analysis (based on longitudinal data from the Veterans Affairs
Normative Aging Study) of age and cohort effects among male war veterans, which shows
not only that life satisfaction peaks at around 65 years but also that impending death is
associated with a decline in life satisfaction that is not attributable to (self-rated) physical
health. Nevertheless, as in many other studies in gerontology and social psychology,
samples are often not representative and generalizations are thus difficult to make.
5
The effect of health on life satisfaction
A relatively large body of geronotological and medical literature examines the effect of health
on the life satisfaction of the oldest old.2 For example, based on data from the Swedish
OCTO twin study, Berg et al. (2006) examine the relationship between health-related factors
and life satisfaction among individuals 80 and above. They show that objective health
measures have no significant effect on life satisfaction, whereas perceived health has a
moderate effect. Indeed, once health is controlled for, age has no impact on life satisfaction.
Likewise, Borg et al. (2006), using data from the European Study of Ageing Well 2001/02 for
522 Swedish individuals aged 65–89 with reduced self-care capacity, find that poor overall
self-reported health has the strongest explanatory power for life satisfaction.
To specifically assess the effect that health-related behaviours have on life satisfaction, Inal
et al. (2007) examine the institutionalization of 133 Turkish individuals aged 60–90 and show
that activities which enhance health (e.g. regular physical and leisure time activities) are
significantly related to life satisfaction. Similarly, using three samples of elderly people in
London and Essex, Bowling and Farquhar (1996) demonstrate that subjective health and
functional ability are strong predictors of life satisfaction. Specifically, their study analyses
individuals who were aged 85 and over in 1987 on whom they also conducted a follow-up
study in 1990. Their results indicate that life satisfaction remained relatively constant
between 1987 and 1990. Two more recent analyses of life satisfaction among the oldest old
in China (Li, 2005; Chen and Short, 2008) use two waves of the Chinese Longitudinal
Healthy Longevity Survey, whose every wave includes over 5,000 people above 80 years.
Both studies show perceived health to be a very strong predictor of life satisfaction among
the most elderly.
2 This section reviews some recent research on the relationship between health and life satisfaction:
older studies include Markides and Martin (1979), Kushman and Lane (1980), Usui et al. (1985), and Waters et al. (1989).
6
One of the few longitudinal surveys of elderly people, the Berlin Aging Study – begun in 1993
for psychological, sociological and medical research purposes and conducted bi-annually
ever since – focuses on a sample of approximately 500 individuals from the West Berlin
population aged 70 and older. Three studies that use these data to analyze the relationship
between life satisfaction and health among the elderly (Kunzmann et al., 2000; Smith, 2001;
Smith et al., 2002) show that the subjective self-assessment of health is a more powerful
predictor of well-being than objective measures. They also find an age-related decline in life
satisfaction, especially among the oldest old.
An overview of recent studies that address the relationship between ageing, health and life
satisfaction is given in table 1.
------------------------------------------------------------
Insert table 1 around here
------------------------------------------------------------
As the table shows, among the numerous factors identified as affecting the life satisfaction of
the most elderly, health plays a highly prominent role. However, nearly all studies reporting a
relationship between health and measures of subjective well-being use cross-sectional data,
meaning that they fail to control for unobserved individual heterogeneity (see Fischer and
Sousa-Poza, 2008).
7
3. Data and Methodology
Longitudinal analysis of data from the German Socio-Economic Panel (GSOEP)
Our longitudinal analysis is based on data from the German Socio-Economic Panel
(GSOEP), begun in 1984 and repeated annually, which collects individual data for a
representative sample of private households and persons in Germany from respondents
aged 16 and above.3 Specifically, we use samples of the waves from 1994 to 2006 and
concentrate primarily on individuals aged 75 and older4 that live in both private households
and institutions (e.g. homes for the elderly or nursing homes). Because of entry into and exit
from the panel, the dataset is unbalanced, with an average of 4.2 observations for each of
the 3,315 respondents over the 13 years.
The core questions that the survey asks annually cover a broad range of topics, including
demographic aspects, qualifications, economic resources, housing, household production,
health, basic orientations and satisfaction with life. This latter is measured by participant
responses to a single item that asks about “satisfaction with life in general” and is scaled
from 0 (completely dissatisfied) to 10 (completely satisfied). According to Veenhoven (1996),
such single item measure, are generally as reliable and valid as multi-item measures.5
We use these GSOEP data to address two primary topics: (i) the relationship between age
and life satisfaction across the entire life cycle and (ii) the relationship between perceived
health and life satisfaction among the oldest old.
3 Detailed information can be found in Haisken-DeNew and Frick (2005). 4 We do not use the waves before 1994 because in 1993, as well as in 1991 and earlier, one of the
most important variables in our analyses, the self-rated current health status, was not included in the dataset. Likewise, before 1992, other important information was also unavailable; for example, number of doctor visits or whether the individual needed help coping with daily activities. Thus, we excluded these years.
5 With regards to reliability estimates of the GSOEP satisfaction item, see Landua (1993), Schräpler (1995) and Schilling (2003).
8
(i) Age and life satisfaction across the life cycle
To analyze the relationship between life satisfaction and age across the life cycle, we follow
Clark (2007) by first estimating a standard OLS life-satisfaction equation that includes age
and age-squared, as well as a number of controls such as marital status, labour force status,
number of children and education. We include respondents aged between 16 and 94, which
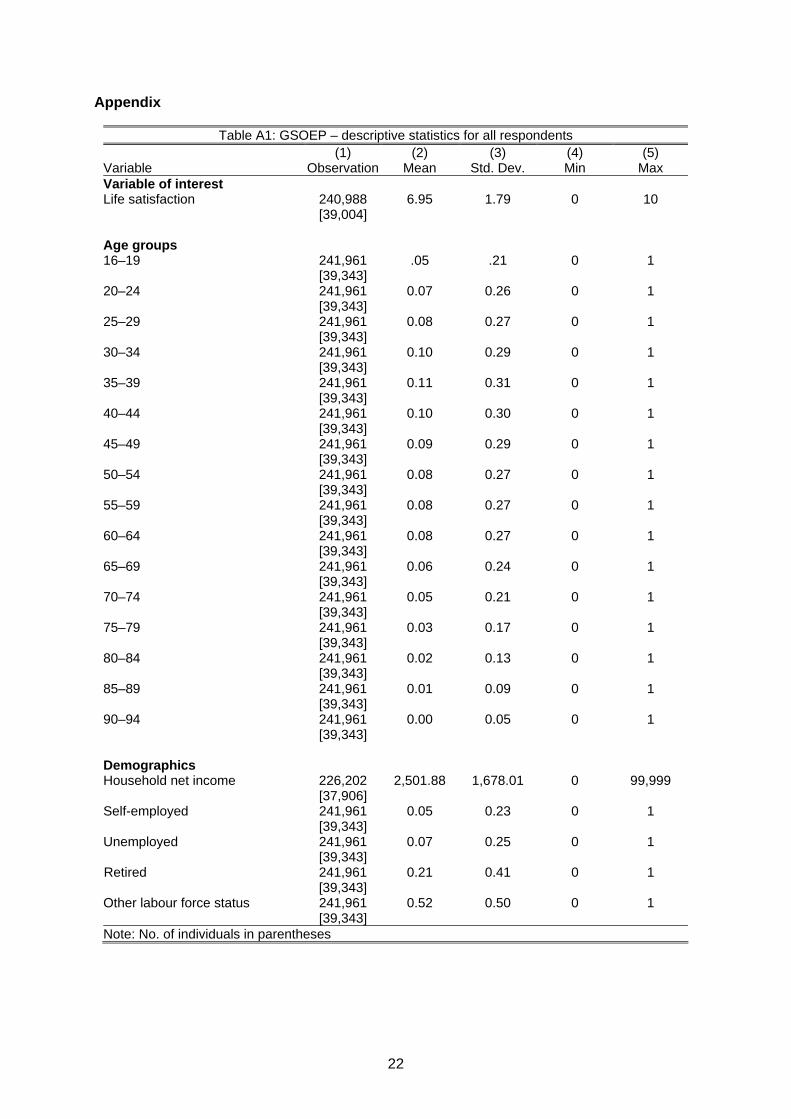
results in about 241,000 observations and 39,000 individuals (see appendix table A1 for the
descriptive statistics). We then estimate two models by cross-sectional analysis, the first a
parsimonious one that only incorporates the different age groups (16 age dummies) and a
second that includes all the controls as well as regional and wave dummies. Our reference
category is the youngest age group (16–19). In a second step, we compare these cross-
sectional results with the results of a panel analysis that accounts for unobservable
heterogeneity. First, we estimate the following model:
i i i i iLS A X H (1)
where LSi is the life satisfaction of an individual and the vector Ai displays the age groups.
Next, we estimate different models using different sets of control variables described by the
vector Xi, and/ or the self-rated current health status denoted by Hi.
(ii) Perceived health and life satisfaction among the oldest old
Besides comprehensive socio-economic and demographic control variables, the GSOEP
data include self-reported information about an individual’s health status. The first health
variable of interest, health satisfaction, is measured by the single item “How satisfied are you
with your health?”, which is scaled from 0 (completely dissatisfied) to 10 (completely
satisfied). The second refers to self-rated current health status, measured by responses to
9
the question “How would you describe your current health?”, ranked on a five-point scale
from 1 (bad) to 5 (very good). Further information on individual health status includes the
number of annual doctor visits, number of overnight hospital stays within the last year and
disability status. Besides controlling for health limitations in performing daily chores, the
model also includes a number of variables that capture impediments in everyday life, such as
climbing stairs, shopping, getting out of bed, dressing or housekeeping.
We also include several additional control variables that have been associated with life
satisfaction among the elderly; namely, subjective indicators that reflect individuals’
perceptions of their current living standard (e.g. self-rated satisfaction with their dwelling,
household income and standard of living), the death of a partner within the last year, moving
into an nursing institution or home for the elderly, time spent on daily activities (e.g. errands,
housework, repairs and gardening), physical activities and assistance received at home.
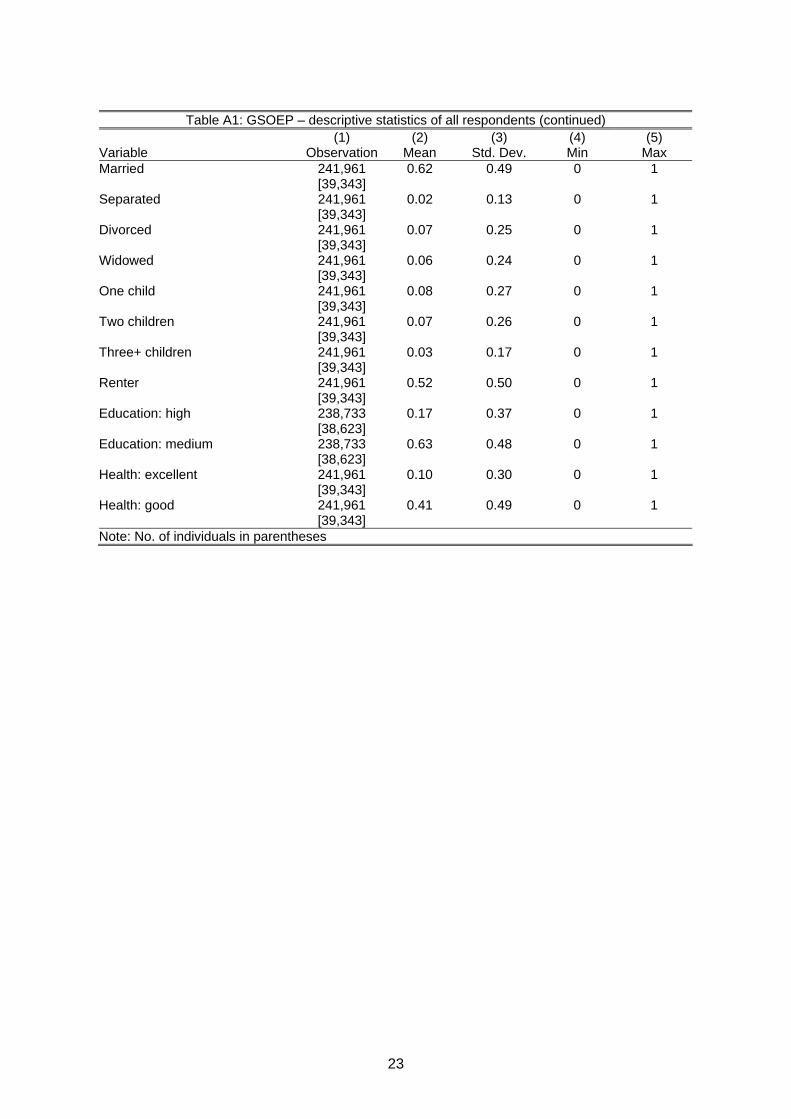
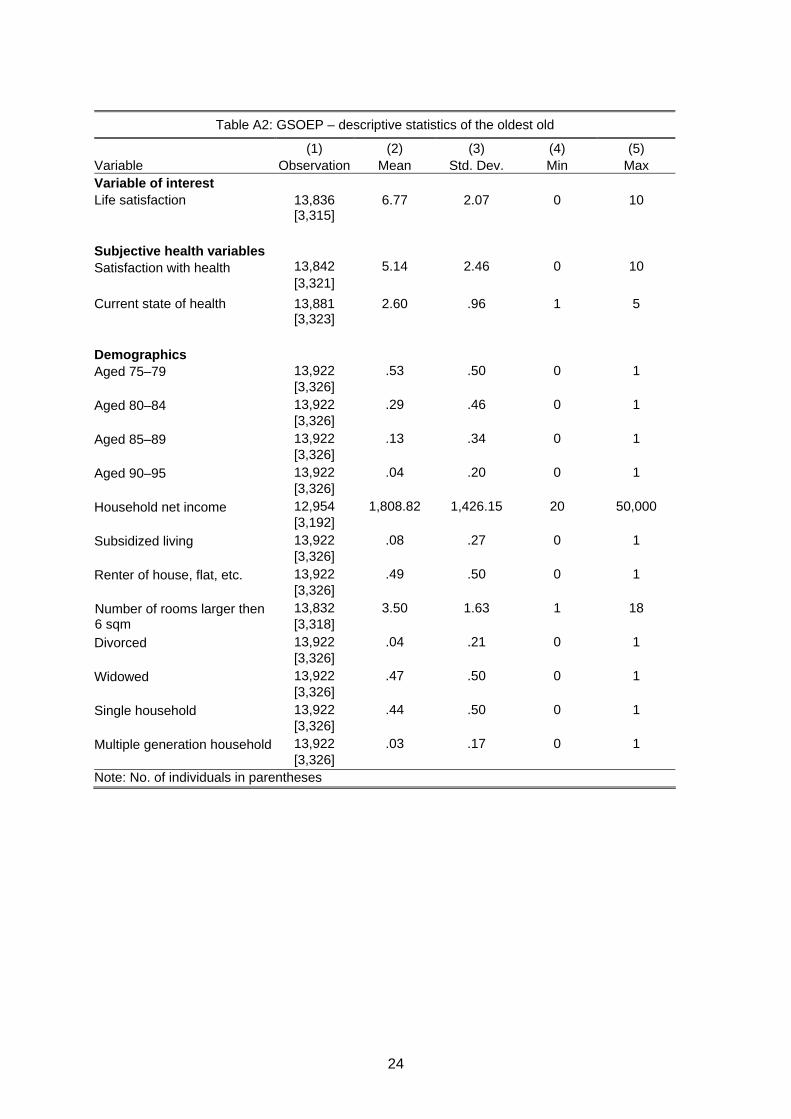
Descriptive statistics, as well as definitions of the health and age-specific variables used, are
given in appendix table A2.
To control for unobservable individual characteristics that are constant over time, we
estimate the following fixed-effects model:
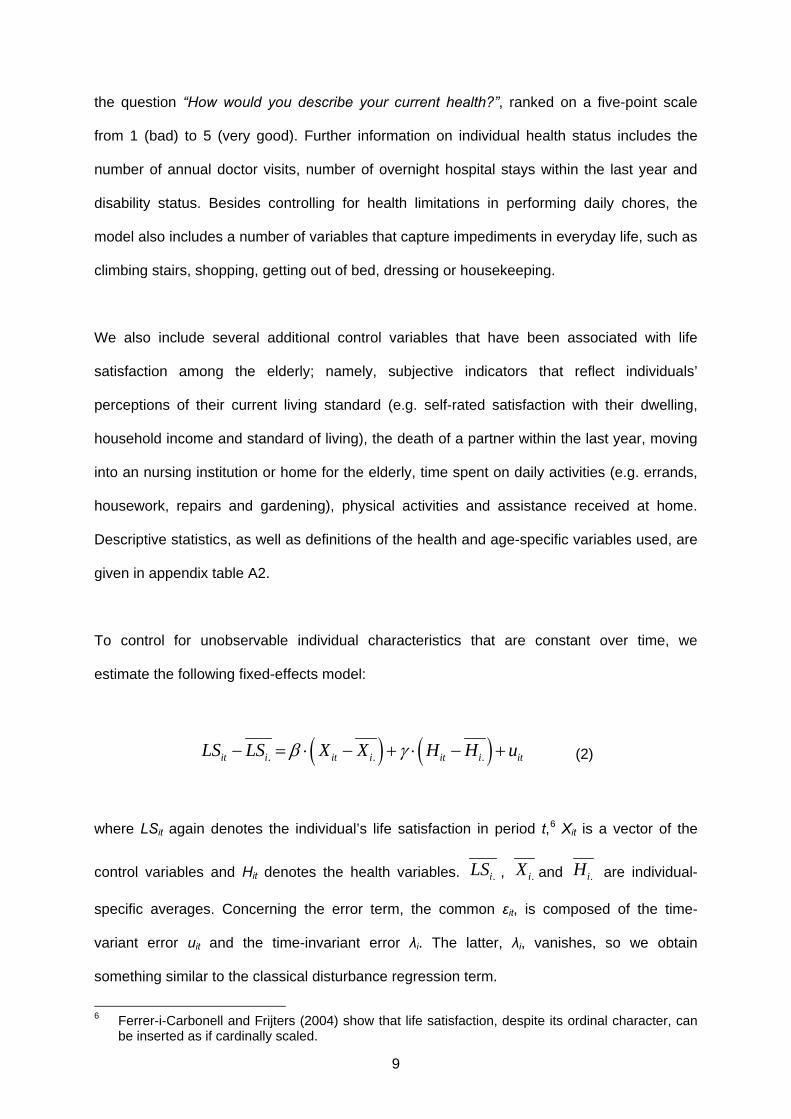
. . .it i it i it i itLS LS X X H H u (2)
where LSit again denotes the individual’s life satisfaction in period t,6 Xit is a vector of the
control variables and Hit denotes the health variables. .iLS , .iX and .iH are individual-
specific averages. Concerning the error term, the common εit, is composed of the time-
variant error uit and the time-invariant error λi. The latter, λi, vanishes, so we obtain
something similar to the classical disturbance regression term.
6 Ferrer-i-Carbonell and Frijters (2004) show that life satisfaction, despite its ordinal character, can
be inserted as if cardinally scaled.
10
The individual effects not only capture affectivity but also socio-demographic characteristics
that are time invariant; for example, gender and (especially among the oldest old) education,
labour force status or number of children. We also introduce time-variant control variables
into this model, including age, household income, housing characteristics and death of a
partner.7 Thus, as previously mentioned, we estimate a number of models with different sets
of controls.
Cross-sectional analysis of data from the Survey of Health, Ageing and Retirement in
Europe (SHARE)
The 2004 SHARE data provides comprehensive cross-sectional information about people’s
physical and mental health, as well as demographic aspects. Focused on individuals aged 50
and above, this survey is geared to the research interests of the U.S. Health and Retirement
Study (HRS) and covers 12 countries. In our German sample, we analyse responses from
3,008 individuals, 487 of whom are among the oldest old (i.e. aged 75 and older).
The main purpose of analysing these data is that it allows us to assess the extent to which
objective health variables influence life satisfaction. Doing so is particularly important
because, first, health plays a central role in the QOL of the oldest old and, second, subjective
health measures are generally believed to be inadequate predictors of objective health (e.g.
Jürges, 2007).8 SHARE, in contrast to GSOEP and virtually all longitudinal panels, offers a
rich source of data on objective health. In SHARE, the life satisfaction question asks “How
satisfied are you with your life in general?” and is scaled from 1 (very dissatisfied) to 4 (very
7 Further information, including the regional and time dummies, is provided in appendix table A2. 8 According to Jürges (2007), Germans largely underrate their true health status.
11
satisfied).9 The self-reported health measure asks respondents to rate their health on a five-
point scale from 1 (poor) to 5 (excellent).
The broad range of objective health data includes information about severe illnesses
experienced by the respondent, such as heart problems, high blood pressure and high
cholesterol, stroke and diabetes. These data thus produce 15 dummy variables that capture
the chronic conditions diagnosed. Our objective health data also includes responses to one
question about treatment for depression. Further information on these variables, as well as
our control variables, is provided in appendix table A3.
For these data, we estimate the following OLS regression:
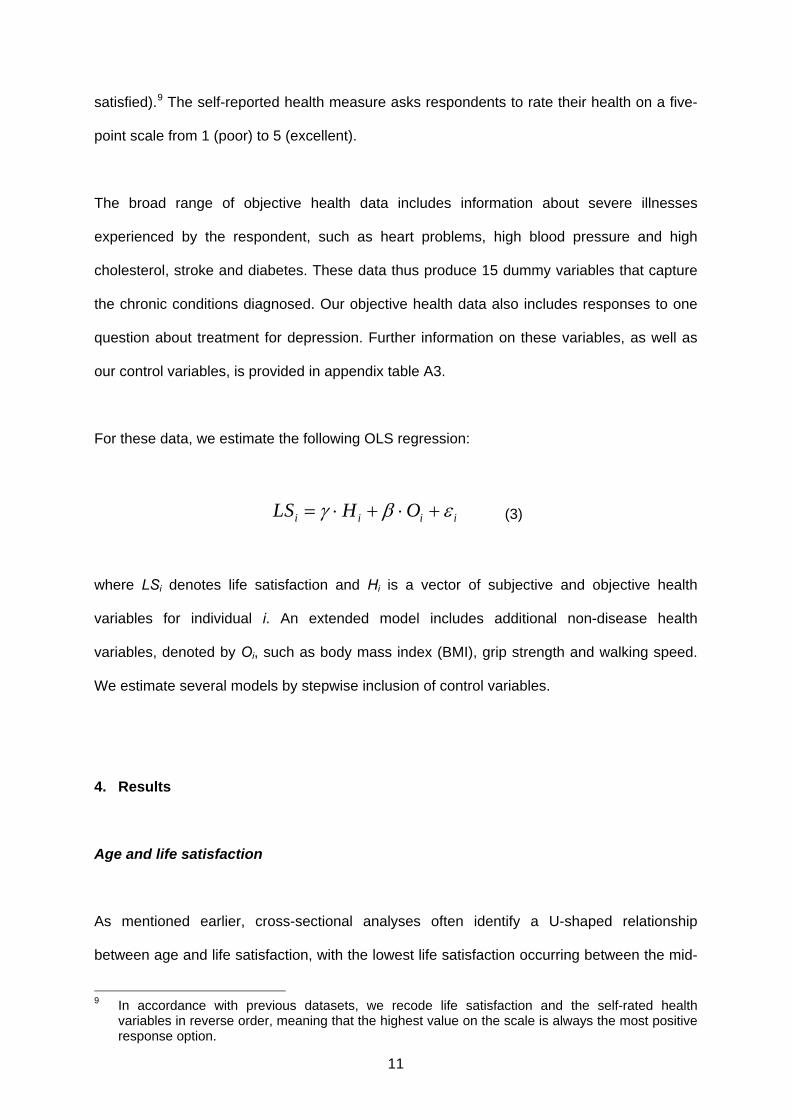
i i i iLS H O (3)
where LSi denotes life satisfaction and Hi is a vector of subjective and objective health
variables for individual i. An extended model includes additional non-disease health
variables, denoted by Oi, such as body mass index (BMI), grip strength and walking speed.
We estimate several models by stepwise inclusion of control variables.
4. Results
Age and life satisfaction
As mentioned earlier, cross-sectional analyses often identify a U-shaped relationship
between age and life satisfaction, with the lowest life satisfaction occurring between the mid-
9 In accordance with previous datasets, we recode life satisfaction and the self-rated health
variables in reverse order, meaning that the highest value on the scale is always the most positive response option.
12
30s and mid-40s. This finding may be interpreted in one of two ways: either the U-shape may
reflect a cohort effect or individuals may adapt with age to their strengths and weaknesses so
that life satisfaction increases with age. According to Clark (2007), this pure age effect can
be distinguished from a fixed cohort effect by controlling for unobserved individual fixed
effects in panel data.
We therefore replicate Clark’s (2007) study using the German data but extend the sample to
include all age categories (i.e. including the oldest old).10 Because our sample includes every
available test person, it contains a total of 222,501 observations and 39,343 respondents
aged from 16 to 94 years. In a first step, we conduct a cross-sectional analysis using an
ordinary linear regression for the pooled GSOEP data for 1994 to 2006. The results, shown
in appendix table A4, correspond closely to those in Clark (2007): we observe a U-shaped
age profile with its minimum at age 41.2 years.
In the next step, we estimate our individual fixed-effects model. To allow for a more flexible
relationship between age and life satisfaction, we create age groups at five-year intervals to
produce 16 age groups, of which the youngest (from 16–19 years) is our reference category.
As in Clark (2007), we first estimate three different regression analyses with life satisfaction
as the dependent and age groups as the independent variables: an ordinary linear
regression without any controls; an ordinary linear regression including all the control
variables of the former cross-sectional analysis; and the fixed-effects model, which also
includes all controls.
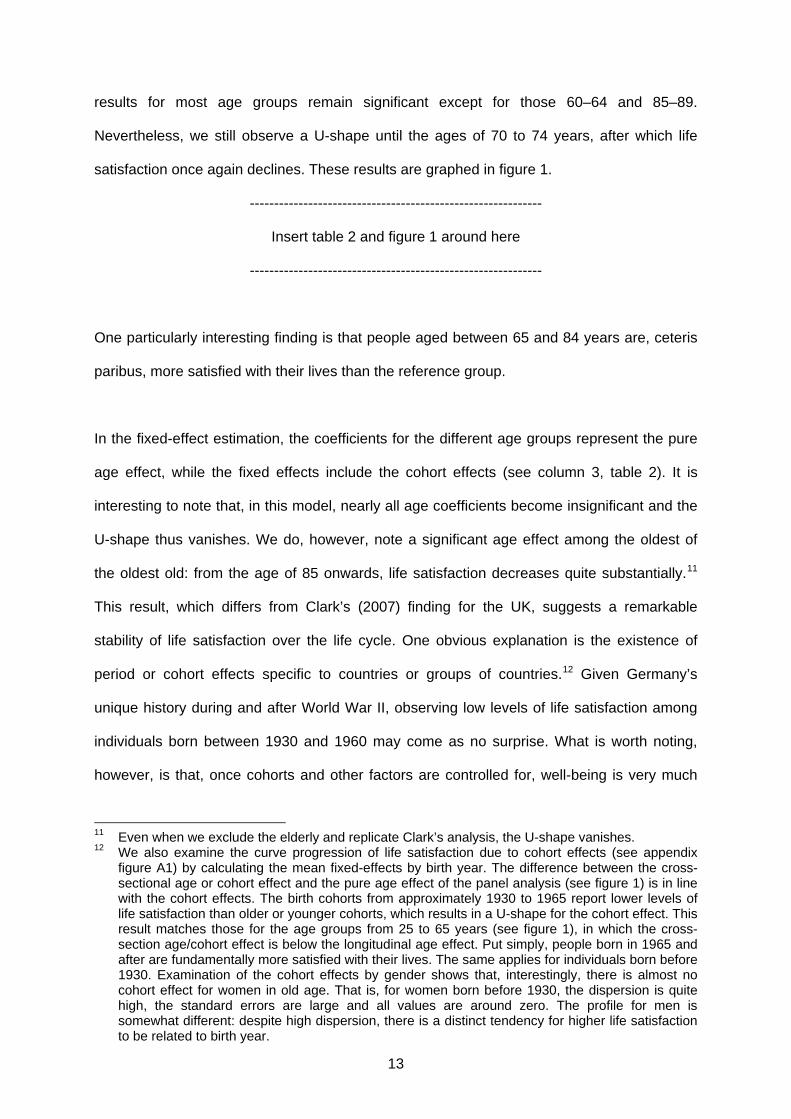
Column 1, table 2 shows the results of the regression without any controls. All age dummies
are significant and reproduce the U-shape up to the 70–74 age group. Thereafter, life
satisfaction declines and reaches its lowest level with the oldest group (90–94 years). When
all control variables (including regional and wave dummies) are taken into account, the
10 Clark (2007) analyzes individuals between the ages of 16 and 64.
13
results for most age groups remain significant except for those 60–64 and 85–89.
Nevertheless, we still observe a U-shape until the ages of 70 to 74 years, after which life
satisfaction once again declines. These results are graphed in figure 1.
------------------------------------------------------------
Insert table 2 and figure 1 around here
------------------------------------------------------------
One particularly interesting finding is that people aged between 65 and 84 years are, ceteris
paribus, more satisfied with their lives than the reference group.
In the fixed-effect estimation, the coefficients for the different age groups represent the pure
age effect, while the fixed effects include the cohort effects (see column 3, table 2). It is
interesting to note that, in this model, nearly all age coefficients become insignificant and the
U-shape thus vanishes. We do, however, note a significant age effect among the oldest of
the oldest old: from the age of 85 onwards, life satisfaction decreases quite substantially.11
This result, which differs from Clark’s (2007) finding for the UK, suggests a remarkable
stability of life satisfaction over the life cycle. One obvious explanation is the existence of
period or cohort effects specific to countries or groups of countries.12 Given Germany’s
unique history during and after World War II, observing low levels of life satisfaction among
individuals born between 1930 and 1960 may come as no surprise. What is worth noting,
however, is that, once cohorts and other factors are controlled for, well-being is very much
11 Even when we exclude the elderly and replicate Clark’s analysis, the U-shape vanishes. 12 We also examine the curve progression of life satisfaction due to cohort effects (see appendix
figure A1) by calculating the mean fixed-effects by birth year. The difference between the cross-sectional age or cohort effect and the pure age effect of the panel analysis (see figure 1) is in line with the cohort effects. The birth cohorts from approximately 1930 to 1965 report lower levels of life satisfaction than older or younger cohorts, which results in a U-shape for the cohort effect. This result matches those for the age groups from 25 to 65 years (see figure 1), in which the cross-section age/cohort effect is below the longitudinal age effect. Put simply, people born in 1965 and after are fundamentally more satisfied with their lives. The same applies for individuals born before 1930. Examination of the cohort effects by gender shows that, interestingly, there is almost no cohort effect for women in old age. That is, for women born before 1930, the dispersion is quite high, the standard errors are large and all values are around zero. The profile for men is somewhat different: despite high dispersion, there is a distinct tendency for higher life satisfaction to be related to birth year.
14
constant over the life cycle; that is, with the exception of the oldest of the oldest old, there
seems to be little ageing effect. A recent paper for Germany (Van Landeghem, 2008) reports
a similar result: once cohorts were included, the U-shape vanished. Moreover, as in our
results depicted in table 2, Van Landeghem (2008) identified an increase in well-being after
mid-life, an observation also found in studies based on the British Household Panel (see
Clark, 2007).
Overall, as shown in figure 1, once we control for cohorts and several explanatory variables,
life satisfaction remains remarkably constant across the life course. One issue of particular
interest, however, is the extent to which deteriorating health in old age can explain the low
absolute levels of life satisfaction among the older generations. Hence, the final column of
table 2 presents the estimation results after only age and perceived health status are
controlled for. As the figure shows, controlling only for age and subjective health status shifts
the life-satisfaction curve upwards, indicating that lower levels of perceived health among
older generations are an important determinant of life satisfaction. However, and as pointed
out by Bowling and Farquhar (1996), the influence of health perceptions may still confound
any association because individuals with lower levels of life satisfaction may be more likely to
perceive their health as worse than it is. Therefore, the next section examines how both
objective and subjective measures of health status affect life satisfaction among the oldest
old.
Health and life satisfaction among the oldest old
Table 3 illustrates the decline in self-rated health status and satisfaction with the actual
health state, both of which measures correlate strongly with life satisfaction.13 As the table
shows, on average, the older the individual, the greater the decline in subjective health
13 The correlation between life satisfaction and the self-rated health status is 0.538, while that
between life and health satisfaction is 0.494. Both are highly significant.
15
measures. Likewise, with age, housework, dressing alone or getting in and out of bed
become progressively more difficult. Nevertheless, interestingly, there is no age-related
change with respect to the more objective health measures like annual doctor visits or
overnight hospital stays.
------------------------------------------------------------
Insert table 3 around here
------------------------------------------------------------
The descriptive statistics for life satisfaction and the prevalence of health problems among
the youngest and oldest old, both based on SHARE data, are given in table 4. Although life
satisfaction in this sample remains remarkably stable,14 differences in health status for these
two groups are striking: serious health problems like heart attacks, strokes, diabetes,
arthritis, Parkinson’s and cataracts are much more likely among the oldest old. More
specifically, over 20 percent of respondents had experienced a heart attack, 20 percent had
cataracts, 18 percent had diabetes and 18 percent suffered from arthritis. Self-rated health
among the oldest old was also significantly lower than among the young old.
------------------------------------------------------------
Insert table 4 around here
------------------------------------------------------------
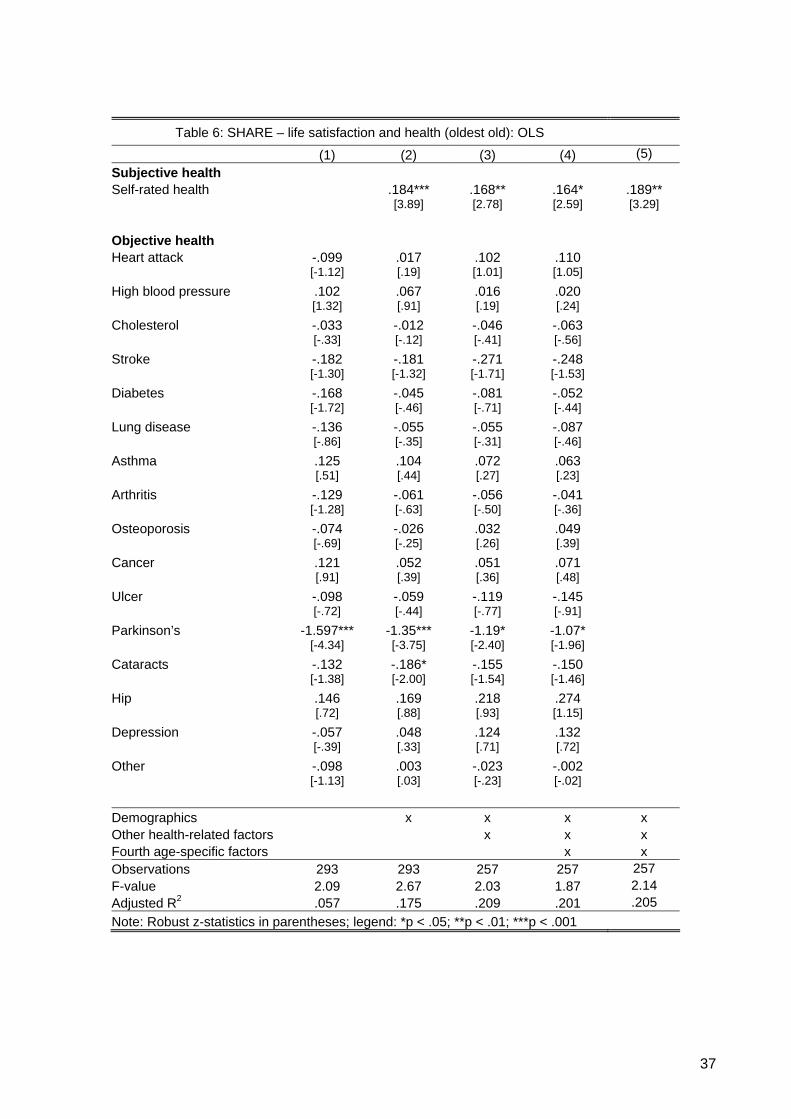
Tables 5 and 6 present the estimations for the life-satisfaction regressions, including those
for objective and subjective health measures. Table 5 uses panel data from GSOEP, in
which only subjective measure are available, and reports the estimates for a fixed-effects
14 Although there does appear to be a decline in life satisfaction among the oldest of the oldest old
(i.e. individuals older than 85), the sample size in this group is too small for any significant conclusion to be drawn.
16
model. The strong positive effect of subjective health measures is particularly noteworthy: a
one-level higher self-rated health status increases life satisfaction by 0.473 (in model 1).
Moreover, independent of the model, the coefficients of both measures remain large and
highly significant, even though, as expected, their size does decline with additional controls.15
Table 6 presents the results of the cross-sectional analysis based on the SHARE data.
Interestingly, objective health does not generally affect the life satisfaction of the oldest old
with one noteworthy exception – Parkinson’s disease – an illness that often leads to severe
loss of independence. Thus, even though other acute health conditions like heart attacks and
strokes may also result in lost independence and have severe negative health implications,
the gradual detrimental effect of Parkinson’s has a particularly strong effect on life
satisfaction. In contrast, the effect of subjective health on life satisfaction is significant in all
specifications.
This finding that objective, as opposed to subjective, health has no strong effect on life
satisfaction is in line with the results of a number of gerontological studies (e.g. Berg et al.,
2006, Smith et al., 2002). Smith et al. (2002) provide one possible explanation for this
somewhat surprising result; namely, that subjective well-being is strongly influenced by social
participation. In addition, physical health (as measured by our objective health measures)
may only indirectly and with a time lag affect functional health (vision, hearing, physical
mobility), which in turn strongly influences social participation. Alternatively, Berg et al.
(2006) argue that the rather weak association between objective health and subjective well-
being may be explained by adjusted expectations and aspirations in old age: “as morbidity
and disability are common in late life, with health-related impairments, prospects on health
and functioning are lower. A plausible life satisfaction in old age may become more
15 We are also able to show that controlling for unobservable characteristics substantially reduces
health’s effect on life satisfaction. Thus, although the results in table 5 correspond well to the vast cross-sectional research conducted in gerontology and related fields, we show that failing to control for unobservable individual heterogeneity substantially inflates the effect of perceived health on life satisfaction among this population.
17
dependent on other factors including changing preferences about what really matters in old
age” (Berg et al., 2006, p. 262).
------------------------------------------------------------
Insert tables 5 and 6 around here
------------------------------------------------------------
5. Summary and Conclusions
This analysis, based on data from 13 waves of the German Socio-Economic Panel (GSOEP)
and the Survey of Health, Ageing and Retirement in Europe (SHARE), examines ageing,
health and life satisfaction among the oldest old in Germany (i.e. individuals aged 75 and
older). Of particular interest is the relationship between age and life satisfaction across the
lifespan and the role that both perceived and objective health status plays in the life
satisfaction of this population.
When analysing absolute levels of life satisfaction, we observe a U-shaped relationship
between age and life satisfaction for individuals aged between 16 and approximately 65
years. From this age onwards, however, life satisfaction declines rapidly and the lowest
absolute levels of life satisfaction are recorded for the oldest old. Indeed, our analysis
indicates that this rapid decline in life satisfaction is primarily attributable to low levels of
perceived health. Our findings thus confirm that life satisfaction among the oldest old is
significantly affected by perceived health status. Interestingly however, as already shown in a
few gerontological studies, despite major exposure to serious health problems like heart
attacks, strokes, diabetes, arthritis, Parkinson’s, and cataracts, life satisfaction among the
oldest old does not generally depend on their objective health status.
18
Our life-cycle analysis also reveals distinctly lower levels of life satisfaction among cohorts
born around the 1960s, which suggests that, in Germany, the oft-cited U-shaped relationship
between age and life satisfaction may be driven by a cohort effect. Given Germany’s unique
history during and after World War II, observing lower levels of life satisfaction among
individuals born between 1930 and 1960 may come as no surprise and could explain why
Germany deviates in this regard from the norm (as shown in Blanchflower and Oswald,
2008). Overall, however, once we control for unobserved individual heterogeneity, our results
show that life satisfaction remains remarkably constant across the lifespan, even among the
oldest old. Only among the oldest of the oldest old (individuals over 85) is there a significant
decline in life satisfaction.
Three possible explanations come to mind for this “stability despite loss paradox” (Kunzmann
et al., 2000) or “satisfaction paradox” (see Walker, 2005). First, this phenomenon can
perhaps be explained by the ability of older individuals to adapt to worsening conditions.
Second, older individuals may be comparing themselves primarily with individuals in their
own age cohort (Kapteyn et al., 1980) who are worse off. Related to this latter explanation is
the possibility of sample selection: happy people may live longer. If this is the case – for
which there appears to be some evidence (e.g. Danner et al., 2001) – then the oldest old
analysed here may per se be happier with life. Disentangling these three possible reasons,
although not a simple task, offers a promising avenue for future research.
19
References:
Baltes, M.M. & Smith, J. (2003). New Frontiers in the Future of Aging: From Successful Aging of the Young Old to the Dilemma of the Fourth Age. In: Gerontology, 49, 123–135.
Beaumont, J.G. & Kenealy, P.M. (2004). Quality of Life – Perceptions and Comparisons in
Healthy Old Age. In: Ageing and Society, 24, 755–769. Berg, A.I., Hassing, L.B., MCClearn, G.E. & Johansson, B. (2006). What Matters for Life
Satisfaction in the Oldest-old? In: Aging & Mental Health, 10(3), 257–264. Blanchflower, D.G. & Oswald, A.J. (2008). Is Well-being U-shaped over the Life Cycle? In:
Social Science & Medicine (forthcoming). Borg, C., Hallberg, I.R. & Blomquist, K. (2006). Life Satisfaction among Older People (65+)
with Reduced Self-care Capacity: the Relationship to Social, Health, and Financial Aspects. In: Journal of Clinical Nursing, 15, 607–618.
Börsch-Supan, A. & Jürges, H. (eds.) (2005). The Survey of Health, Ageing and Retirement
in Europe – Methodology. Mannheim Research Institute for the Economics of Aging, University of Mannheim.
Bowling, A. & Farquhar, M. (1996). Associations with Changes in Life Satisfaction among
Three Samples of Elderly People Living at Home. In: International Journal of Geriatric Psychiatry, 11, 1077–1087.
Brief, A.P., Burke, M.J., George, J.M., Robinson, B.R. & Webster, J. (1988). Should Negative
Affectivity Remain an Unmeasured Variable in the Study of Job Stress? In: Journal of Applied Psychology, 73, 193–198.
Chen, C. (2001). Aging and Life Satisfaction. In: Social indicators Research, 54, 57–79. Chen, F. & Short, S.E. (2008). Household Context and Subjective Well-being among the
Oldest-old in China. In: Journal of Family Issues. (Forthcoming). Clark, A.E. (2007). Born to be Mild? Cohort Effects Don’t (Fully) Explain Why Well-being is U-
shaped in Age. IZA Working Paper No. 3170. Clark, A.E. & Oswald, A.J. (2006). The Curved Relationship between Subjective Well-Being
and Age. Paris-Jourdan Sciences Economiques, Discussion Paper No. 2006-29. Clarke, P.J., Marshall, V.W., Ryff, C.D. & Rosenthal, C.J. (2000). Well-being in Canadian
Seniors: Findings from the Canadian Study of Health and Aging. In: Canadian Journal of Aging, 19, 139–159.
Danner, D.D., Snowdown, D.A. & Friesen, W.V. (2001). Positive Emotions in Early Life and
Longevity: Findings from the Nun Study. In: Journal of Personality and Social Psychology, 80, 804–813.
Deaton, A. (2007). Income, Aging, Health and Well-being around the World: Evidence from
the Gallup World Poll. NBER Working Papers 13317. Deeg, D.J.H., Bosscher, R.J. Broese van Groenau, M.I., Horn, L.M. & Jonker, C. (2000)
(eds). Ouder Worden in Nederland. Thela Thesis, Amsterdam.
20
Diener, E. & Suh, E.M. (1997). Age and Subjective Well-being: An International Analysis. Annual Review of Gerontology and Geriatrics, 17, 304–324.
Easterlin, R. (2006). Life Cycle Happiness and Its Sources: Intersections of Psychology,
Economics, and Demograhpy. In: Journal of Economic Psychology, 27, 463-482 Ferrer-i-Carbonell, A. & Frijters, P. (2004). How Important Is Methodology for the Estimates
of the Determinants of Happiness? In: Economic Journal, 114, 641–659. Fischer, J.A.V., & Sousa-Poza, A. (2008). Job Satisfaction and Health: An Analysis using
Panel Data and Objective Health Measures. In: Health Economics (forthcoming). Frey, B.S. & Stutzer, A. (2002). Happiness and Economics. Princeton and Oxford, Princeton
University Press. Haisken-DeNew, J.P. & Frick, J.R. (2005) (eds). DTC – Desktop Companion to the German
Socio-economic Panel (SOEP): Version 8.0. Berlin, Deutsches Institut für Wirtschaftsforschung.
Herzog, A.R. & Rodgers, W.L. (1981). Age and Satisfaction: Data from Several Large
Surveys. In: Research on Aging, 3, 142–165. Horley, J. & Lavery, J.J. (1995). Subjective Well-being and Age. In: Social Indicators
Research, 34, 275–282. Inal, S., Subasi, F., Ay, S.M. & Hayran, O. (2007). The Link between Health-related
Behaviours and Life Satisfaction in Elderly Individuals Who Prefer Institutional Living. In: BMC Health Services Research, 7, 30–37.
Jürges, H. (2007). True Health vs. Response Styles: Exploring Cross-country Differences in
Self-reported Health. In: Health Economics, 16, 163–178. Kapteyn, A., Wansbeek, T. & Buyze, J. (1980). The Dynamics of Preference Formation. In:
Journal of Economic Behavior and Organization, 1, 123–157. Kunzmann, U, Little, T.D. & Smith, J. (2000). Is Age-related Stability of Subjective Well-being
a Paradox? Cross-sectional and Longitudinal Evidence from the Berlin Aging Study. In: Psychology and Aging, 15(3), 511–526.
Kushman, J. & Lane, S. (1980). A Multivariate Analysis of Factors Affecting Perceived Life
Satisfaction and Psychological Well-being among the Elderly. In: Social Science Quarterly, 61, 264–277.
Landua D (1993) Veränderungen von Zufriedenheitsangaben in Panelbefragungen: Eine
Analyse über nicht beabsichtigte Effekte der Längsschnittdesigns. In: Kölner Zeitschrift für Soziologie und Sozialpsychologie, 45, 553–571.
Larson, R. (1978). Thirty Years of Research on the Subjective Well-being of Older
Americans. In: Journal of Gerontology, 33, 109–125. Li, Q. (2005). Subjective Well-being and Mortality in Chinese Oldest Old. MPIDR Working
Paper WP 2005–011. Markides, K.S. & Martin, H.W. (1979). A Causal Model of Life Satisfaction among the Elderly.
In: Journals of Gerontology, 34(1), 86–93.
21
Meeks, S. & Murrell, S.A. (2001). Contribution of Education to Health and Life Satisfaction in Older Adults Mediated by Negative Affect. In: Journal of Aging and Health, 13, 92–119.
Mroczek, D.K. & Spiro, A. (2005). Change in Life Satisfaction during Adulthood: Findings
from the Veterans Affairs Normative Aging Study. In: Journal of Personality and Social Psychology, 88(1), 189–202.
Schilling, O.K. (2003). Längsschnittliche Analysen zur Entwicklung der Zufriedenheit im
höheren Lebensalter. Doctoral dissertation, University of Heidelberg. http://www.ub.uni-heidelberg.de/archiv/4578
Schilling, O.K. (2005). Cohort- and Age-related Decline in Elder’s Life Satisfaction: Is There
Really a Paradox? In: European Journal of Aging, 2, 254–263. Schräpler, J.P. (1995). Die Schätzung von Reliabilität und Stabilität der
Zufriedenheitsangaben im Sozio-oekonomischen Panel. Ruhr University Bochum, Faculty for the Social Sciences, Discussion Paper 95–13.
Smith, J. (2001). Well-being and Health from Age 70 to 100: Findings from the Berlin Aging
Study. In: European Review, 9(4), 461–477. Smith, J., Borchelt, M., Maier, H. & Jopp, D. (2002). Health and Well-being in the Young Old
and Oldest Old. In: Journal of Social Issues, 58(4), 715–732. Smith, J., Fleeson, W., Geiselmann, B., Settersten, R. & Kunzmann, U. (1999). Sources of
Well-being in Very Old Age. In: Baltes, P.B. & Mayer, K.U. (eds). The Berlin Aging Study: Aging from 70 to 100. New York, Cambridge University Press, 450–471.
Suzman, R.M., Willis, D.P. & Manton, K.G. (1992). The Oldest Old. New York, Oxford
University Press. United Nations Population Division (2002). World Population Ageing 1950–2050. In:
Population and Development Review, 28(4), 814–815. Usui, W. M., Thomas, J. K. & Durig, K. R. (1985). Socioeconomic Comparisons and Life
Satisfaction of Elderly Adults. In: Journal of Gerontology, 40, 110–114. Van Landeghem, B. (2008). Human Well-Being over the Life Cycle: Longitudinal Evidence
from a 20-Year Panel. LICOS Discussion Paper No. 213/2008. Veenhoven, R. (1996). Developments in Satisfaction Research. In: Social Indicators
Research, 37, 1–46. Veenhoven, R. (1999). Quality-of-Life in Individualistic Society. In: Social Indicators
Research, 48, 157–186. Walker, A. (2005). A European Perspective on Quality of Life in Old Age. In. European
Journal of Ageing, 2, 2–12. Waters, W. E., Heikinen, E. & Dontas, A. S. (1989). Health, Lifestyles and Services for the
Elderly. Public Health in Europe No. 29. World Health Organisation, Copenhagen. Watson, D., Clark, L.A. & Carey, G. (1988). Positive and Negative Affect and Their Relation
to Anxiety and Depressive Disorders. In: Journal of Abnormal Psychology, 97, 346–353.
22
Appendix
Table A1: GSOEP – descriptive statistics for all respondents (1) (2) (3) (4) (5) Variable Observation Mean Std. Dev. Min Max Variable of interest Life satisfaction 240,988 6.95 1.79 0 10 [39,004] Age groups 16–19 241,961 .05 .21 0 1 [39,343] 20–24 241,961 0.07 0.26 0 1 [39,343] 25–29 241,961 0.08 0.27 0 1 [39,343] 30–34 241,961 0.10 0.29 0 1 [39,343] 35–39 241,961 0.11 0.31 0 1 [39,343] 40–44 241,961 0.10 0.30 0 1 [39,343] 45–49 241,961 0.09 0.29 0 1 [39,343] 50–54 241,961 0.08 0.27 0 1 [39,343] 55–59 241,961 0.08 0.27 0 1 [39,343] 60–64 241,961 0.08 0.27 0 1 [39,343] 65–69 241,961 0.06 0.24 0 1 [39,343] 70–74 241,961 0.05 0.21 0 1 [39,343] 75–79 241,961 0.03 0.17 0 1 [39,343] 80–84 241,961 0.02 0.13 0 1 [39,343] 85–89 241,961 0.01 0.09 0 1 [39,343] 90–94 241,961 0.00 0.05 0 1 [39,343] Demographics Household net income 226,202 2,501.88 1,678.01 0 99,999 [37,906] Self-employed 241,961 0.05 0.23 0 1 [39,343] Unemployed 241,961 0.07 0.25 0 1 [39,343]
241,961 0.21 0.41 0 1 Retired [39,343]
Other labour force status 241,961 0.52 0.50 0 1 [39,343] Note: No. of individuals in parentheses
23
Table A1: GSOEP – descriptive statistics of all respondents (continued)
(1) (2) (3) (4) (5) Variable Observation Mean Std. Dev. Min Max Married 241,961 0.62 0.49 0 1 [39,343] Separated 241,961 0.02 0.13 0 1 [39,343] Divorced 241,961 0.07 0.25 0 1 [39,343] Widowed 241,961 0.06 0.24 0 1 [39,343] One child 241,961 0.08 0.27 0 1 [39,343] Two children 241,961 0.07 0.26 0 1 [39,343] Three+ children 241,961 0.03 0.17 0 1 [39,343] Renter 241,961 0.52 0.50 0 1 [39,343] Education: high 238,733 0.17 0.37 0 1 [38,623] Education: medium 238,733 0.63 0.48 0 1 [38,623] Health: excellent 241,961 0.10 0.30 0 1 [39,343] Health: good 241,961 0.41 0.49 0 1 [39,343] Note: No. of individuals in parentheses
24
Table A2: GSOEP – descriptive statistics of the oldest old
(1) (2) (3) (4) (5) Variable Observation Mean Std. Dev. Min Max Variable of interest Life satisfaction 13,836 6.77 2.07 0 10 [3,315] Subjective health variables Satisfaction with health 13,842 5.14 2.46 0 10
[3,321]
Current state of health 13,881 2.60 .96 1 5 [3,323] Demographics Aged 75–79 13,922 .53 .50 0 1 [3,326] Aged 80–84 13,922 .29 .46 0 1 [3,326] Aged 85–89 13,922 .13 .34 0 1 [3,326] Aged 90–95 13,922 .04 .20 0 1 [3,326] Household net income 12,954 1,808.82 1,426.15 20 50,000 [3,192] Subsidized living 13,922 .08 .27 0 1 [3,326] Renter of house, flat, etc. 13,922 .49 .50 0 1 [3,326]
13,832 3.50 1.63 1 18 Number of rooms larger then 6 sqm [3,318] Divorced 13,922 .04 .21 0 1 [3,326] Widowed 13,922 .47 .50 0 1 [3,326] Single household 13,922 .44 .50 0 1 [3,326] Multiple generation household 13,922 .03 .17 0 1 [3,326] Note: No. of individuals in parentheses
25
Table A2: GSOEP – descriptive statistics of the oldest old (continued)
(1) (2) (3) (4) (5) Variable Observation Mean Std. Dev. Min Max
Health-related factors 13,922 .27 .45 0 1
Trouble climbing stairs [3,326] 13,907 .12 .32 0 1 Housework difficult
alone [3,325] 13,907 .14 .34 0 1 Need help with
shopping [3,325] 13,907 .03 .18 0 1 Difficulty getting in/out
of bed [3,325] 13,907 .09 .28 0 1 Difficulty dressing
alone [3,325] 13,716 .75 .94 0 4 Frequency of sport or
exercise [3,323] 13,915 17.69 21.49 0 360 Annual doctor visits [3,312]
Nights in hospital 13,872 .23 .42 0 1 [3,321]
13,816 .28 .45 0 1 Disabled status
[3,316]
Fourth age-specific factors 13,922 .02 .15 0 1 Lives in a home for the
elderly [3,326] Partner died last year 13,922 .00 .05 0 1 [3,326]
13,384 1.13 .91 0 10 Hours per week: errands [3,265]
13,469 2.18 1.68 0 12 Hours per week: housework [3,275]
13,047 .82 1.26 0 14 Hours per week: repairs, gardening [3,240]
13,922 .19 .39 0 1 Person requiring help present in household [3,326]
Subjective measures 13,745 1.22 .67 0 2 Worries: economic
development [3,304] Worries: finances 13,712 .58 .67 0 2 [3,301] Worries: environment 13,710 1.05 .64 0 2 [3,304] Worries: peace 13,753 1.32 .72 0 2 [3,308] Satisfaction: dwelling 13,718 8.13 1.99 0 10 [3,306] Satisfaction: income 13,676 6.97 2.15 0 10
[3,303] 13,276 7.43 1.84 0 10 Satisfaction: standard
of living [3,230] Note: No. of individuals in parentheses
26
Table A3: SHARE – descriptive statistics of all respondents
(1) (2) (3) (4) (5) Variable Observation Mean Std. Dev. Min Max
Variable of interest Life satisfaction 1,840 3.19 .64 1 4 Self-rated health 2,943 2.80 .97 1 5 Disease Heart attack 2,940 .11 .32 0 1 High blood pressure 2,940 .36 .48 0 1
Cholesterol 2,940 .18 .39 0 1 Stroke 2,940 .04 .19 0 1 Diabetes 2,940 .11 .31 0 1 Lung disease 2,940 .05 .21 0 1 Asthma 2,940 .03 .18 0 1 Arthritis 2,940 .12 .32 0 1 Osteoporosis 2,940 .07 .26 0 1 Cancer 2,940 .06 .24 0 1 Ulcer 2,940 .06 .23 0 1 Parkinson’s 2,940 .01 .07 0 1 Cataracts 2,940 .06 .24 0 1 Hip 2,940 .02 .13 0 1 Depression 2,943 .11 .31 0 1 Other 2,940 .19 .39 0 1 Demographics Aged 50–54 2,943 .19 .39 0 1 Aged 55–59 2,943 .15 .36 0 1 Aged 60–64 2,943 .19 .40 0 1 Aged 65–69 2,943 .19 .39 0 1 Aged 70–74 2,943 .11 .31 0 1 Aged 75–79 2,943 .09 .29 0 1 Aged 80–84 2,943 .05 .22 0 1 Aged 85–89 2,943 .01 .11 0 1 Aged 90–94 2,943 .01 .09 0 1 Aged 95–100 2,943 .00 .03 0 1 Retired 2,943 .52 .50 0 1 Employed 2,943 .29 .46 0 1 Unemployed 2,943 .05 .22 0 1 Permanently sick/disabled
2,943 .03 .16 0 1
Other labour force status 2,943 .11 .31 0 1 No child 2,943 .14 .35 0 1 One child 2,943 .25 .43 0 1 Two children 2,943 .36 .48 0 1 Three+ children 2,943 .26 .44 0 1 Education: low 2,943 .18 .38 0 1 Education: medium 2,943 .56 .50 0 1 Education: high 2,943 .25 .43 0 1 Urban 2,943 .17 .37 0 1 Suburban 2,943 .11 .32 0 1 Town 2,943 .41 .49 0 1 Rural 2,943 .30 .46 0 1
27
Table A3: SHARE – descriptive statistics of all respondents (continued)
(1) (2) (3) (4) (5)
Variable Observation Mean Std. Dev. Min Max Household gross net income
2,943 46,924.24 48,077.28 0 411,913.2
Number of rooms 2,943 4.04 1.63 1 12 Renter 2,943 .26 .44 0 1 Married 2,943 .75 .43 0 1 Separated 2,943 .01 .10 0 1 Divorced 2,943 .06 .24 0 1
Single household 2,943 .05 .22 0 1 Widowed 2,943 .12 .33 0 1 Health-related problems Low walking speed 2,943 .01 .16 0 1 Low grip strength 2,943 .30 .46 0 1 No grip 2,943 .04 .20 0 1 BMI <20 2,943 .03 .16 0 1 BMI 25–30 2,943 .45 .50 0 1 BMI >30 2,943 .17 .38 0 1 Annual doctor visits 2,943 7.71 10.70 0 98 Nights in hospital 2,943 2.51 10.87 0 280 Difficulties with… Walking 100 metres 2,939 .09 .29 0 1 Sitting 2,939 .13 .33 0 1 Getting up from a chair 2,939 .20 .40 0 1 Climbing several stairs 2,939 .24 .42 0 1 Climbing one stair 2,939 .08 .27 0 1 Kneeling 2,939 .31 .46 0 1 Reaching or extending arms above shoulder 2,939 .09 .29 0 1 Pulling large objects 2,939 .14 .34 0 1 Weights over 5 kilos 2,939 .12 .32 0 1 Picking up a small coin 2,939 .03 .16 0 1 Dressing 2,939 .06 .23 0 1 Walking across a room 2,939 .02 .13 0 1 Bathing 2,939 .05 .21 0 1 Eating 2,939 .02 .12 0 1 Getting in or out of bed 2,939 .03 .17 0 1 Using the toilet 2,939 .02 .14 0 1 Using a map 2,939 .06 .24 0 1 Preparing a meal 2,939 .03 .17 0 1 Shopping 2,939 .05 .22 0 1 Telephone 2,939 .01 .11 0 1 Taking medications 2,939 .02 .13 0 1 Working around house, garden 2,939 .08 .27 0 1 Managing money 2,939 .02 .15 0 1
28
Table A3: SHARE – descriptive statistics of all respondents (continued)
(1) (2) (3) (4) (5)
Variable Observation Mean Std. Dev. Min Max
Fourth age-related
No. limitations in ADLs 2,943 .16 .64 0 5
No. limitations in IADLs 2,943 .14 .60 0 5
Help activities 2,943 .11 .32 0 1
Partner died (last 5 years) 2,943 .03 .17 0 1
Moderate activities 2,939 1,47 .90 1 4
Vigorous sport 2,943 2,34 1,31 0 4 Lives in home for the elderly 2,943 .01 .10 0 1 Home care (domestic tasks) 2,943 .01 .12 0 1
Meals-on-wheels 2,943 .01 .11 0 1
Home care (nursing care) 2,943 .01 .11 0 1
29
Table A4: GSOEP – effects on life satisfaction
Life Satisfaction
Age -.032*** [-19.50]
Age²/100 .039*** [22.27]
Household net income .000*** [23.53]
Self-employed -.101*** [-5.49]
Unemployed -.881*** [-45.91]
Retired .028 [1.55]
Labour force status: other .059*** [5.37]
Male -.094*** [-13.19]
Married .170*** [14.75]
Married, but separated -.442*** [-13.14]
Divorced -.169*** [-9.36]
Widowed -.067*** [-3.20]
One child -.093*** [-7.17]
Two children -.129*** [-9.99]
Three children -.202*** [-10.05]
Renter -.220*** [-28.46]
Education: high .141*** [13.67]
Education: medium .080*** [9.86]
Health status: excellent 1.660*** [137.74]
Health status: good 1.060*** [139.48]
Constant 7.110*** [24.80]
Year dummies YES Region dummies YES Observations 222,501 Note: Robust t-statistics in parentheses Legend: *p < .05; **p < .01; ***p < .001 Estimated age of minimum life satisfaction:
41.2
30
Figure A1: GSOEP – life Satisfaction: Fixed Effects by Birth Year
31
Table 1: Recent research on life satisfaction, health and ageing
Study Data Age groups
Results
Berg et al. (2006) OCTO-Twin Study (1991) 80+ as opposed to subjective health measures, objective health measures do not affect life satisfaction
Borg et al. (2006) European Study of Ageing Well (2001/2002)
65-89 negative effect of subjective health on life satisfaction
Bowling and Farquhar (1996) Three samples of elderly people in London and Essex (1987-1990)
85+ subjective health is a strong predictor of life satisfaction
Blanchflower and Oswald (2008) US GSS (1972-2006)
/ Eurobarometers (1976-2002)
all U-shaped relationship between life satisfaction and age
Chen (2001) Survey of Health and Living Status
of the Elderly in Taiwan (1989 & 1993)
60+ life satisfaction decreases with old age
Chen and Short (2008) Determinants of Healthy Longevity in China (DHLC) Survey (1998/2000)
80+ positive effect of subjective health on life satisfaction
Clark (2007) BHPS (1991-2004) 16-64 U-shaped relationship between life satisfaction and age
Deaton (2007) World Gallup Poll (2006) all age has an inconsistent relation with happiness (analysis does not, however, include covariates)
Inal et al. (2007) sample of 133 institutionalized Turkish individuals
65+ activities that enhance health are significantly related to life satisfaction
Li (2005) Chinese Longitudinal Healthy Longevity Survey (2000/2002)
80+ perceived health is a strong predictor of life satisfaction
Mroczek and Spiro (2005) Veterans Affairs Normative
Ageing Study (1978-1999)
40-85 SWB rises into the person’s early 60s, and then declines
Schilling (2005) GSOEP (1984-1999) 45-90 decline in life satisfaction from 60 onwards
Smith et al. (2002) Berlin Aging Study (1993-2000) 70+ subjective health is a more powerful predictor of well-being than objective measures
32
Table 2: GSOEP – life satisfaction by age group
No controls Demographic controls
Demographic controls plus
individual fixed effects
Self-rated current health status
Age 20–24 -.282*** -.251*** -.125*** -.220*** [-14.16] [-12.33] [-5.39] [-11.69]
Age 25–29 -.341*** -.337*** -.048 -.230*** [-17.51] [-15.27] [-1.43] [-12.52]
Age 30–34 -.403*** -.433*** -.030 -.289*** [-21.19] [-18.55] [-.68] [-16.13]
Age 35–39 -.495*** -.511*** -.019 -.345*** [-26.23] [-21.4] [-.35] [-19.37]
Age 40–44 -.599*** -.555*** -.012 -.396*** [-31.28] [-23] [-.22] [-21.98]
Age 45–49 -.677*** -.571*** -.015 -.428*** [-34.3] [-23.12] [-.42] [-23.00]
Age 50–54 -.686*** -.49*** -.031 -.369*** [-33.66] [-19.25] [-.26] [-19.27]
Age 55–59 -.64*** -.298*** .061 -.287*** [-31.33] [-11.5] [.8] [-14.91]
Age 60–64 -.494*** -.036 .210* -.130*** [-24.35] [-1.3] [2.38] [-6.77]
Age 65–69 -.443*** .135*** .242* -.035 [-20.98] [4.37] [2.51] [-1.76]
Age 70–74 -.472*** .182*** .163 -.024 [-19.79] [5.48] [1.56] [-1.05]
Age 75–79 -.559*** .171*** .026 -.076** [-20.18] [4.68] [.27] [-2.94]
Age 80–84 -.703*** .110* -.152 -.151*** [-19.44] [2.51] [-1.11] [-4.56]
Age 85–89 -.89*** -.0128 -.369* -.283*** [-16.4] [-.21] [-2.4] [-5.78]
Age 90–94 -1.270*** -.362*** -.864*** -.600*** [-12.46] [-3.36] [-4.56] [-6.58]
Constant 7.45*** 6.85*** 5.87*** 5.974*** [482.78] [24.20] [8.21] [300.17]
Regional dummies x x
Wave dummies x x Note: Robust t-statistics in parentheses Legend: *p < .05; **p < .01; ***p < .001 Regressions in columns 2 and 3 include all control variables from table A3, except age and age-squared.
33
Figure 1: GSOEP – life Satisfaction and Age
Note: 95% confidence interval shown for panel regression
34
Table 3: GSOEP – development of health-related factors with aging by mean value Subjective Impediments in daily life related to... Objective health measures
Age Life
satisfaction Health status
Health satisfaction
Climbing stairs
House-work Shopping
Getting in/out of bed Dressing
Nights in
hospital
Annual doctor visits Disability
75 6.888 2.736 5.330 .233 .055 .064 .020 .042 .207 16.597 .272 [.05] [.02] [.06] [.01] [.01] [.01] [.00] [.00] [.01] [.48] [.01]
76 6.939 2.707 5.162 .258 .059 .073 .017 .040 .202 16.246 .283 [.05] [.02] [.06] [.01] [.01] [.01] [.00] [.00] [.01] [.46] [.01]
77 6.907 2.665 5.061 .243 .070 .085 .020 .050 .209 17.897 .286 [.05] [.02] [.07] [.01] [.01] [.01] [.00] [.01] [.01] [.62] [.01]
78 6.819 2.625 4.921 .261 .069 .091 .019 .046 .228 16.864 .301 [.05] [.02] [.07] [.01] [.01] [.01] [.00] [.01] [.01] [.55] [.01]
79 6.851 2.629 4.957 .260 .091 .118 .020 .070 .227 17.241 .298 [.05] [.03] [.07] [.01] [.01] [.01] [.00] [.01] [.01] [.66] [.01]
80 6.801 2.587 4.927 .255 .103 .124 .022 .077 .252 17.875 .285 [.06] [.03] [.08] [.01] [.01] [.01] [.00] [.01] [.01] [.72] [.01]
81 6.679 2.535 4.802 .290 .132 .140 .033 .085 .235 17.329 .285 [.07] [.03] [.08] [.01] [.01] [.01] [.01] [.01] [.01] [.65] [.01]
82 6.770 2.564 4.741 .258 .142 .159 .047 .099 .239 16.838 .289 [.07] [.03] [.09] [.01] [.01] [.01] [.01] [.01] [.01] [.64] [.02]
83 6.715 2.432 4.556 .276 .151 .176 .032 .095 .246 17.400 .286 [.08] [.04] [.10] [.02] [.01] [.01] [.01] [.01] [.02] [.67] [.02]
84 6.670 2.532 4.614 .241 .135 .176 .031 .090 .246 16.616 .283 [.09] [.04] [.11] [.02] [.01] [.02] [.01] [.01] [.02] [.69] [.02]
85 6.723 2.506 4.589 .238 .167 .207 .040 .108 .215 16.326 .233 [.09] [.04] [.12] [.02] [.02] [.02] [.01] [.01] [.02] [.82] [.02]
86 6.558 2.466 4.657 .215 .187 .206 .053 .130 .240 18.409 .226 [.10] [.05] [.13] [.02] [.02] [.02] [.01] [.02] [.02] [1.04] [.02]
87 6.597 2.479 4.716 .230 .224 .224 .062 .143 .258 17.632 .219 [.12] [.05] [.15] [.02] [.02] [.02] [.01] [.02] [.02] [1.07] [.02]
88 6.404 2.382 4.234 .212 .243 .255 .075 .181 .219 18.093 .230 [.12] [.06] [.15] [.02] [.02] [.02] [.01] [.02] [.02] [1.17] [.02]
89 6.431 2.402 4.500 .233 .277 .281 .096 .219 .215 17.389 .237 [.14] [.06] [.17] [.03] [.03] [.03] [.02] [.03] [.03] [1.32] [.03]
90 6.389 2.371 4.340 .297 .329 .338 .116 .266 .250 15.792 .203 [.16] [.07] [.19] [.03] [.03] [.03] [.02] [.03] [.03] [1.05] [.03]
91 6.110 2.314 4.337 .253 .352 .388 .133 .309 .265 17.446 .227 [.10] [.08] [.22] [.03] [.04] [.04] [.03] [.04] [.03] [1.38] [.03]
92 6.336 2.413 4.254 .289 .407 .451 .115 .310 .286 15.754 .171 [.236] [.10] [.28] [.04] [.05] [.05] [.03] [.04] [.04] [1.61] [.04]
93 5.953 2.217 4.115 .287 .460 .494 .126 .402 .230 17.609 .244 [.25] [.10] [.27] [.05] [.05] [.05] [.04] [.05] [.05] [2.06] [.05]
94 6.105 2.130 3.895 .246 .393 .429 .196 .375 .140 15.649 .263 [.31] [.14] [.38] [.06] [.07] [.07] [.05] [.07] [.05] [2.08] [.06]
Note: Standard deviation in parentheses
35
Table 4: SHARE – comparison of health and life satisfaction between the young old (50-74) and
the oldest old (75+)
Disease Young old Oldest old T-test
(p value) Heart attack .091 .222 -8.37 (.000) High blood pressure .341 .448 -4.47
(.000) Cholesterol .181 .193 -.63 (.531) Stroke .031 .080 -5.12 (.000)
Diabetes .097 .183 -5.52 (.000) Lung disease .041 .080 -3.74 (.000) Asthma .032 .031 .016 (.872) Arthritis .105 .181 -4.77 (.000) Osteoporosis .059 .136 -6.05 (.000) Cancer .057 .084 -2.32 (.021) Ulcer .051 .088 -3.29 (.001) Parkinson’s .004 .010 -1.75 (.080) Cataracts .037 .199 -13.85 (.000) Hip .011 .041 -4.73 (.000) Depression .110 .086 1.53 (.127) Other .182 .222 -2.02 (.044) Health-related problems Low walking speed .003 .068 -11.55 (.000)
Low grip strength .255 .548 -13.24 (.000)
No grip ~ .028 .119 -9.23 (.000)
BMI <20 .024 .037 -1.70 (.090)
BMI 25-30 .451 .429 .89 (.373)
BMI >30 .178 .158 1.05 (.293)
Self-rated health 2.910 2.222 14.77 (.000)
Life satisfaction 3.198 3.154 1.10 (.272)
No. of observations 2456 487 Note. No. of observations differ for life satisfaction (young old: 1,547; oldest old: 293)
36
Table 5: GSOEP – life satisfaction and health (oldest old): fixed-effects model using GSOEP data
(1) (2) (3) (4) (5) Health status .384*** .383*** .345*** .323*** .287***
[14.22] [13.59] [12.23] [11.13] [10.07]
[.331-.437] [.328-.438] [.290-.401] [.266-.380] [.231-.343] Health satisfaction .206*** .198*** .185*** .189*** .146***
[18.18] [16.69] [15.64] [15.47] [11.57]
[.184-.282] [.174-.221] [.162-.208] [.165-.213] [.121-.171]
F-Test 48.65 28.93 25.18 26.38 30.40 (p-value) (.000) (.000) (.000) (.000) (.000)
Demographics x x x x Health-related factors x x x Fourth age-specific factors x x Subjective measures x Wave dummies x x x x x Regional dummies x x x x x
Observations 13,807 12,515 12,407 11,560 10,830 No. of individuals 3,313 3,105 3,095 3,009 2,891 Hausman Chi2 535.89 535.62 564.39 2,669.73 321.43 (p-value) (.000) (.000) (.000) (.000) (.000)
Rho .665 .688 .696 .751 .663 Note: Robust t-statistics and 95%-confidence intervals in parentheses Legend: *p < .05; **p < .01; ***p < .001
37
Table 6: SHARE – life satisfaction and health (oldest old): OLS
(1) (2) (3) (4) (5)
Subjective health Self-rated health .184*** .168** .164* .189** [3.89] [2.78] [2.59] [3.29]
Objective health Heart attack -.099 .017 .102 .110
[-1.12] [.19] [1.01] [1.05]
High blood pressure .102 .067 .016 .020 [1.32] [.91] [.19] [.24]
Cholesterol -.033 -.012 -.046 -.063 [-.33] [-.12] [-.41] [-.56]
Stroke -.182 -.181 -.271 -.248 [-1.30] [-1.32] [-1.71] [-1.53]
Diabetes -.168 -.045 -.081 -.052 [-1.72] [-.46] [-.71] [-.44]
Lung disease -.136 -.055 -.055 -.087 [-.86] [-.35] [-.31] [-.46]
Asthma .125 .104 .072 .063 [.51] [.44] [.27] [.23]
Arthritis -.129 -.061 -.056 -.041 [-1.28] [-.63] [-.50] [-.36]
Osteoporosis -.074 -.026 .032 .049 [-.69] [-.25] [.26] [.39]
Cancer .121 .052 .051 .071 [.91] [.39] [.36] [.48]
Ulcer -.098 -.059 -.119 -.145 [-.72] [-.44] [-.77] [-.91]
Parkinson’s -1.597*** -1.35*** -1.19* -1.07* [-4.34] [-3.75] [-2.40] [-1.96]
Cataracts -.132 -.186* -.155 -.150 [-1.38] [-2.00] [-1.54] [-1.46]
Hip .146 .169 .218 .274 [.72] [.88] [.93] [1.15]
Depression -.057 .048 .124 .132 [-.39] [.33] [.71] [.72]
Other -.098 .003 -.023 -.002 [-1.13] [.03] [-.23] [-.02]
Demographics x x x x Other health-related factors x x x Fourth age-specific factors x x Observations 293 293 257 257 257 F-value 2.09 2.67 2.03 1.87 2.14 Adjusted R2 .057 .175 .209 .201 .205
Note: Robust z-statistics in parentheses; legend: *p < .05; **p < .01; ***p < .001