Spatial Patterns in Gold Deposits for the Bendigo …158588/Powerpoint_6_5.pdf · Geology of...
75
Spatial Patterns in Gold Deposits for the Bendigo-Ballarat Region Victoria, Australia All images and text are Copyright © 2005 by Larry Robinson PowerPoint 6-5
Transcript of Spatial Patterns in Gold Deposits for the Bendigo …158588/Powerpoint_6_5.pdf · Geology of...
Spatial Patterns in Gold Deposits for the Bendigo-Ballarat Region
Victoria, Australia
All images and text are Copyright © 2005 by Larry Robinson
PowerPoint 6-5

Prepared as part of:
The Spatial and Temporal Distribution of theMetal Mineralisation in Eastern Australia
and the Relationship of the Observed Patternsto Giant Ore Deposits
byLarry Robinson
A thesis submitted for the degree of
PhD
2006
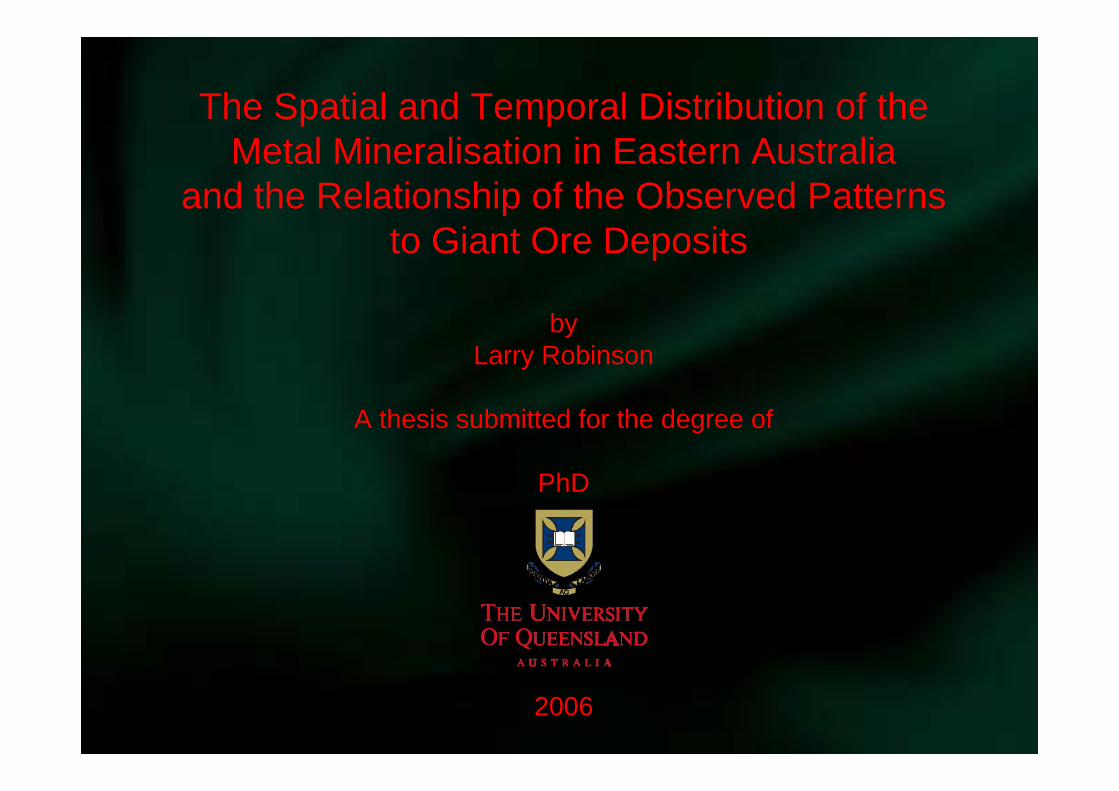
Geology of Southeastern Australia,The Lachlan Fold Belt1
Between 1851 and 1895, the Bendigo-Ballarat Goldfields produced more gold than any other goldfield in the entire world. The Bendigo-Ballarat area has produced ~2,000 tonnes of gold.
Patterns within patterns.
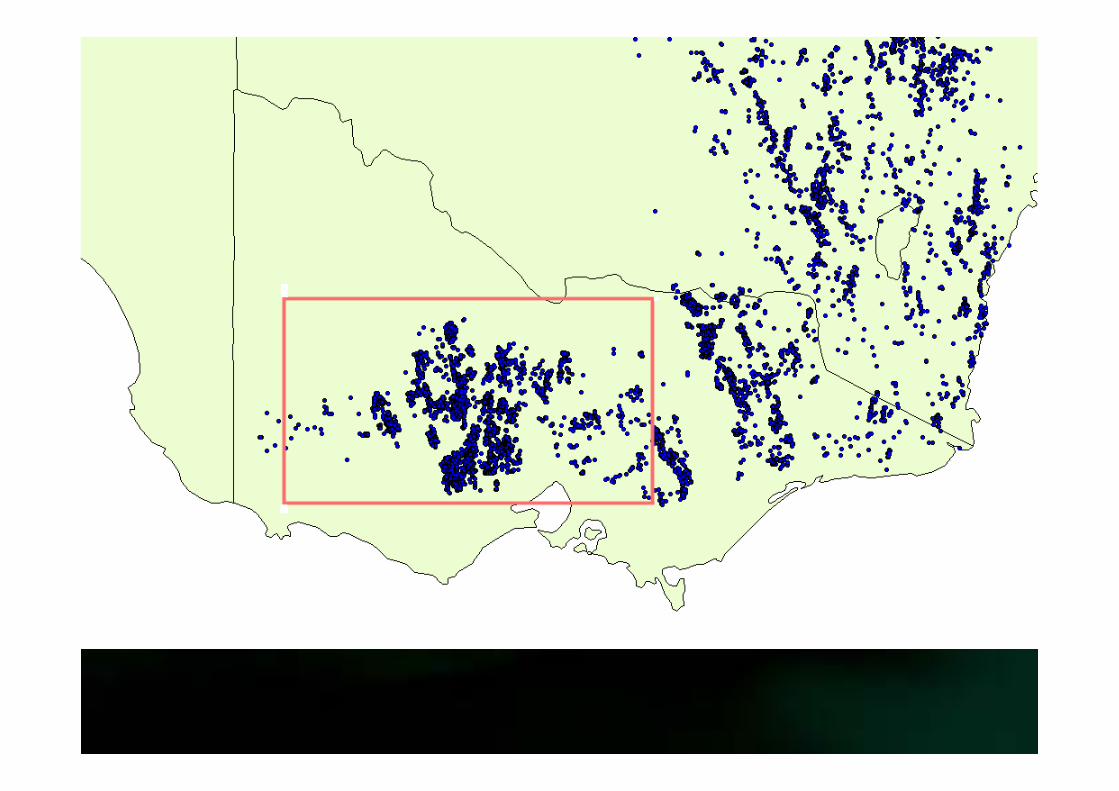
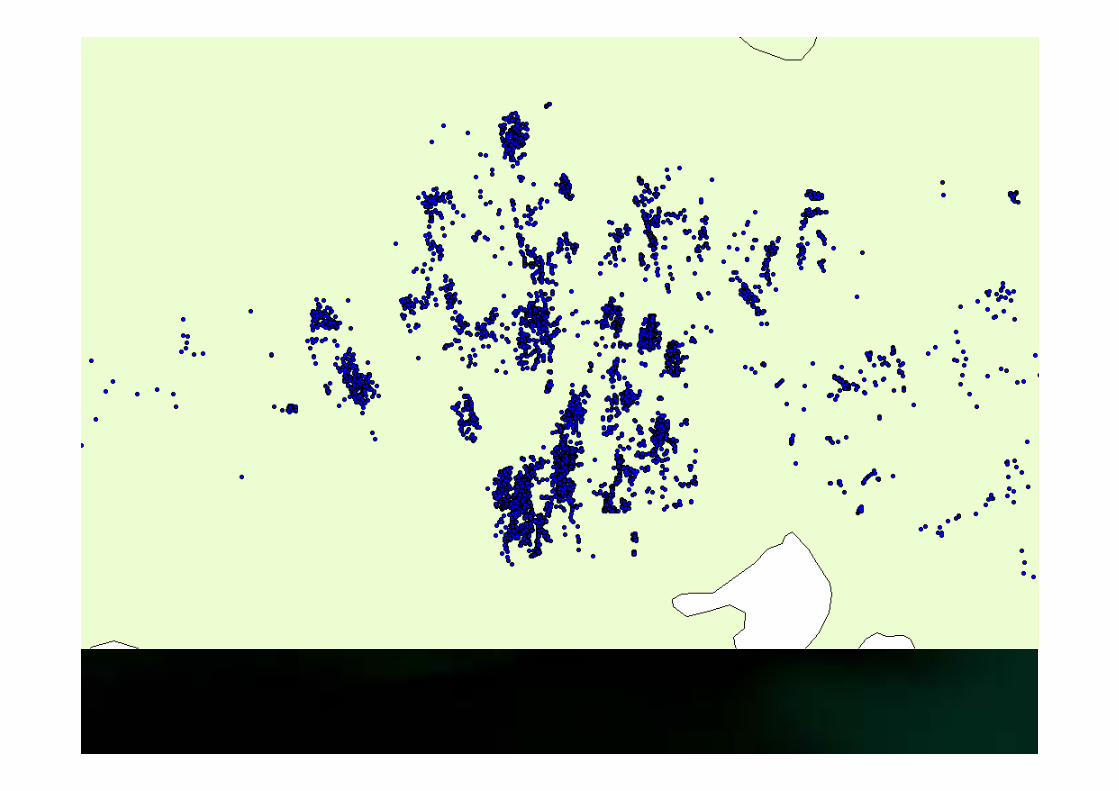
There are clusters within clusters for the gold deposits of southeastern Australia.
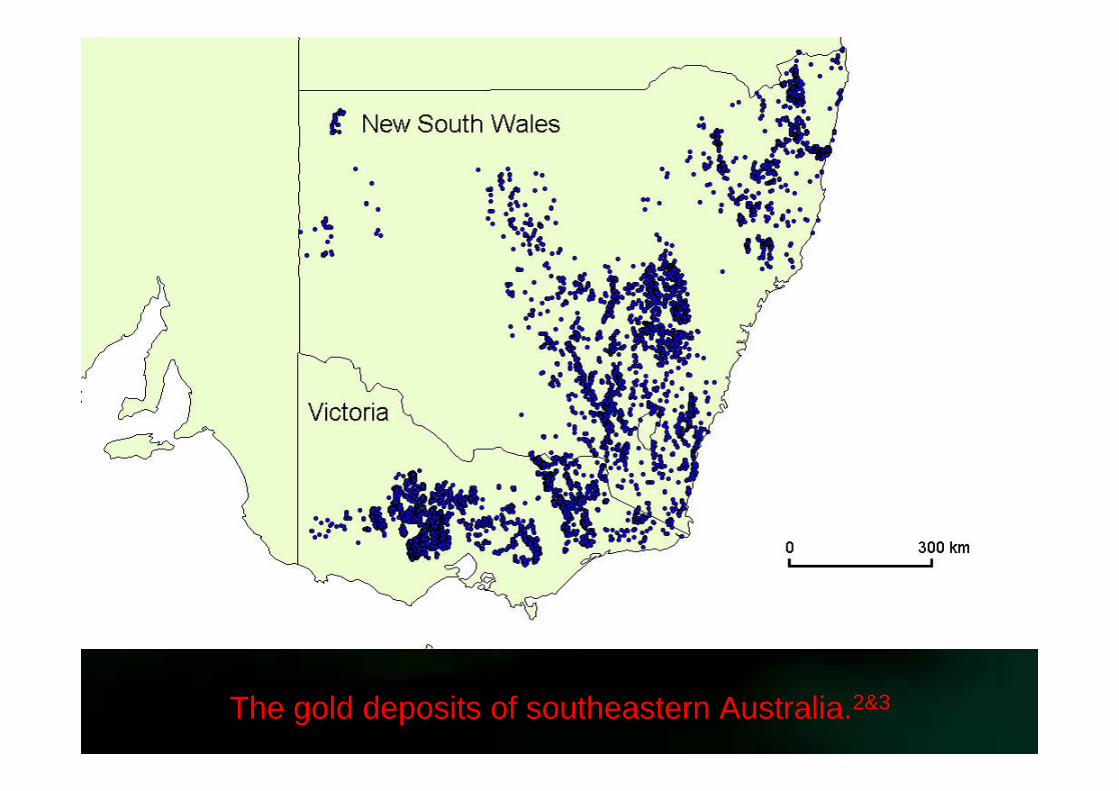
The gold deposits of southeastern Australia.2&3


Pattern Recognition using a Clustering Algorithm
The AUTOCLUST AlgorithmThe approach automatically extracts boundaries based on Voronoi modellingand Delaunay Diagrams.
Parameters are not specified by users in the automatic clustering.
All clustering operations takes place on the Delaunay Diagram where data points become vertices and edges connect pairs of points to model spatial proximity.
Estivill-Castro & Lee (2000)2
The AUTOCLUST Algorithm
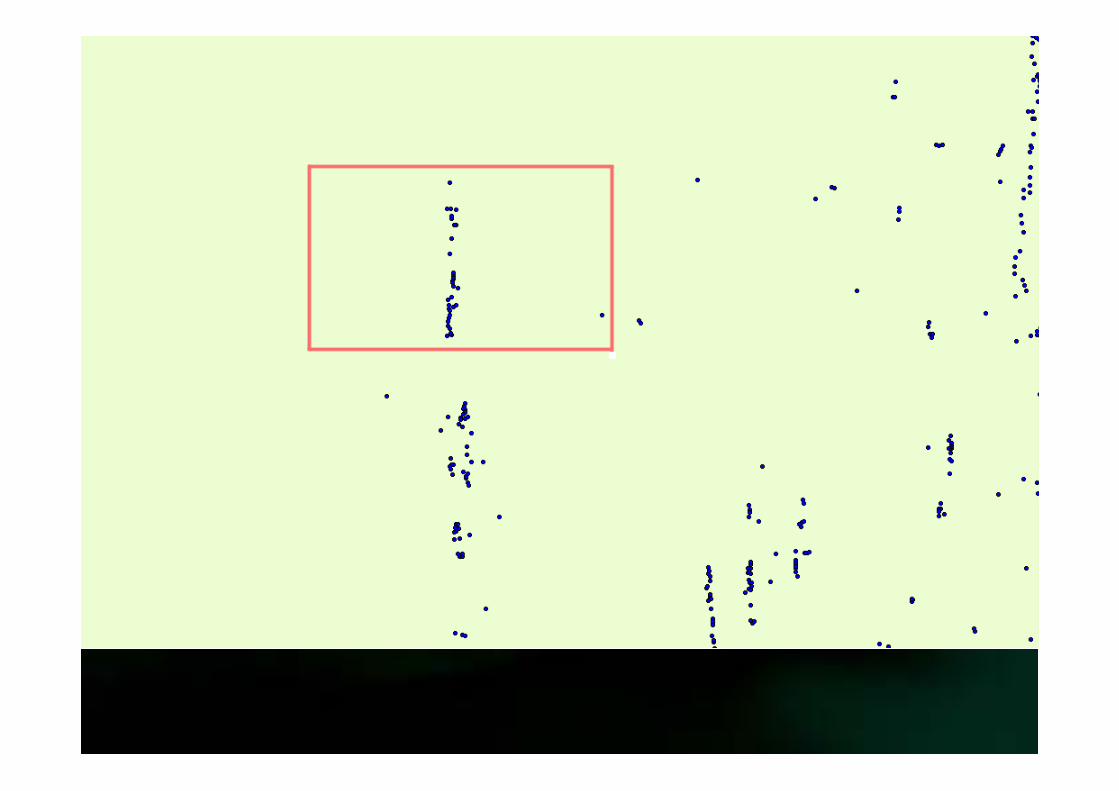
The m value shown in the following slides designates the lengths of edges, in units of the standard deviation away from the Global Mean, which are included in a single cluster. The Global Mean is determined from edges in the entire data set.
The noise index of a point (p) is the ratio - Local Mean / Global Mean - where, Local Mean is determined from the mean of points with edges incident to that point (p). The noise index is a measure of the deviation of any single point from proximal points. The mean of edges incident to noise tends to be significantly greater than the Global Mean.

The m value can be used as an exploration tool.Larger values of m causes relatively close clusters to merge into the same cluster.
Smaller values of m result in clusters with more homogeneous lengths of edges.
Smaller values of m identifies relatively high-density clusters and homogeneous clusters, but declares relatively sparse clusters asnoise and heterogeneous clusters as potential outliers.
The user may reduce the value of m to find breakable or vulnerable regions in clusters where they are about to split.
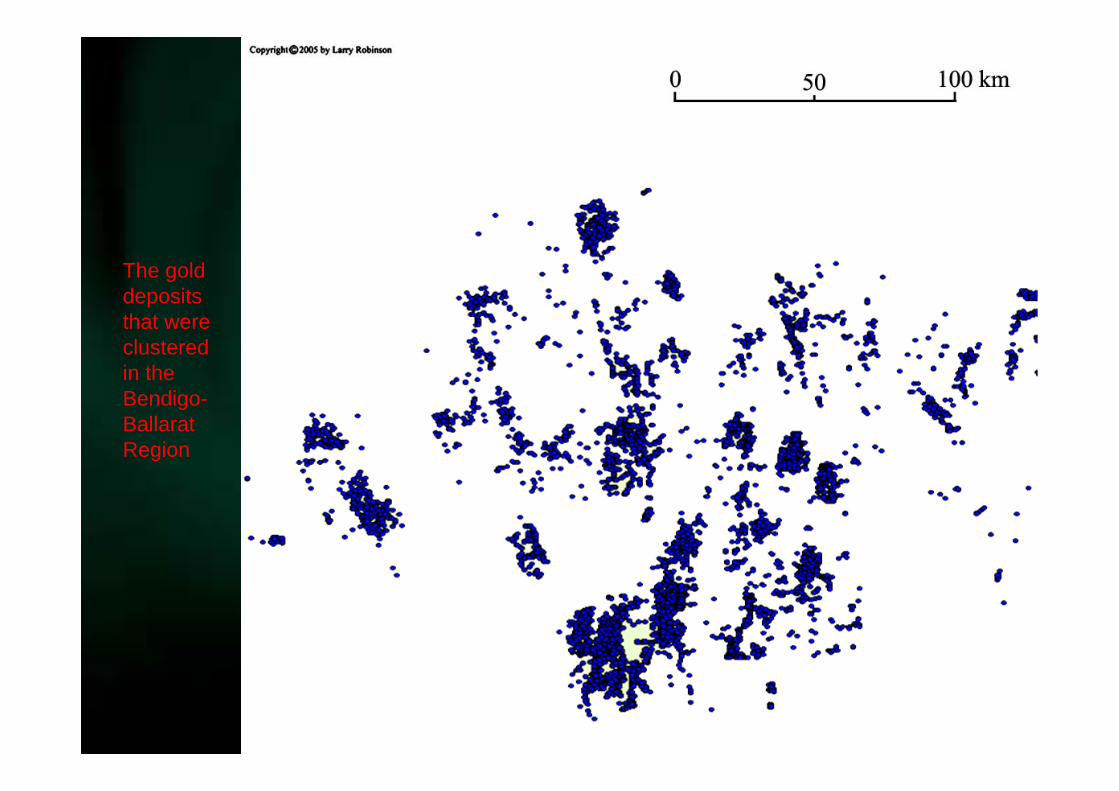
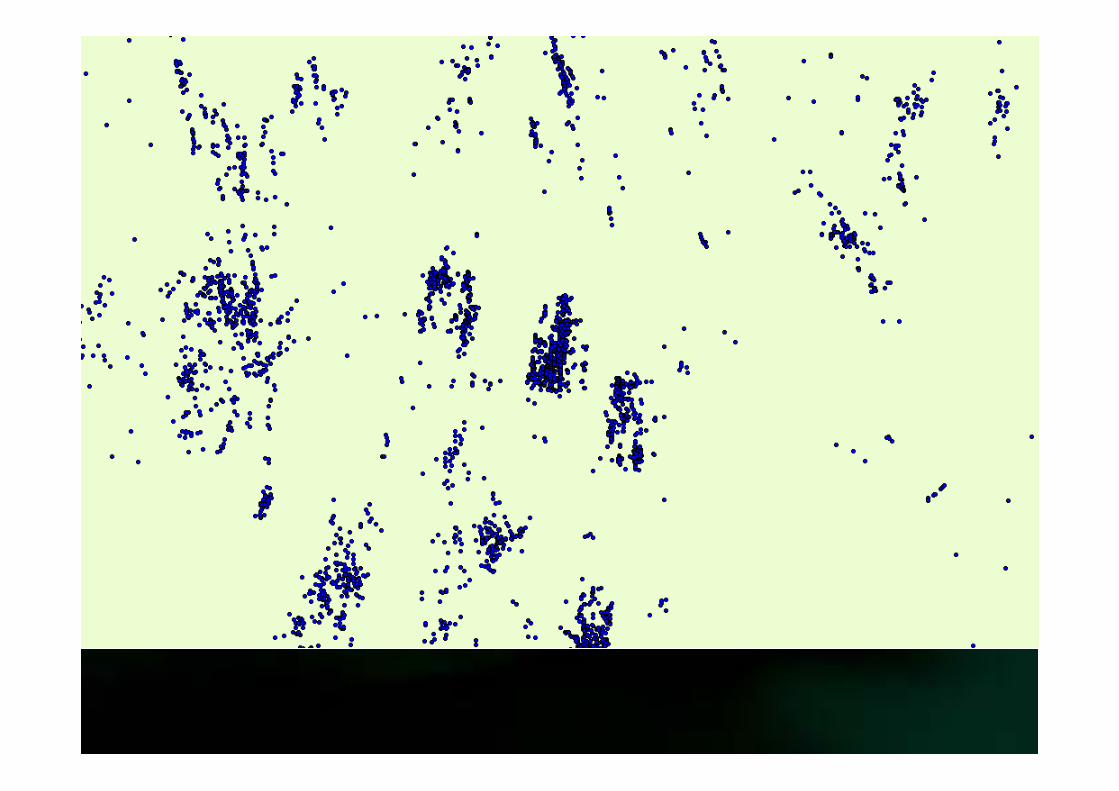
The gold deposits that were clustered in the Bendigo-Ballarat Region
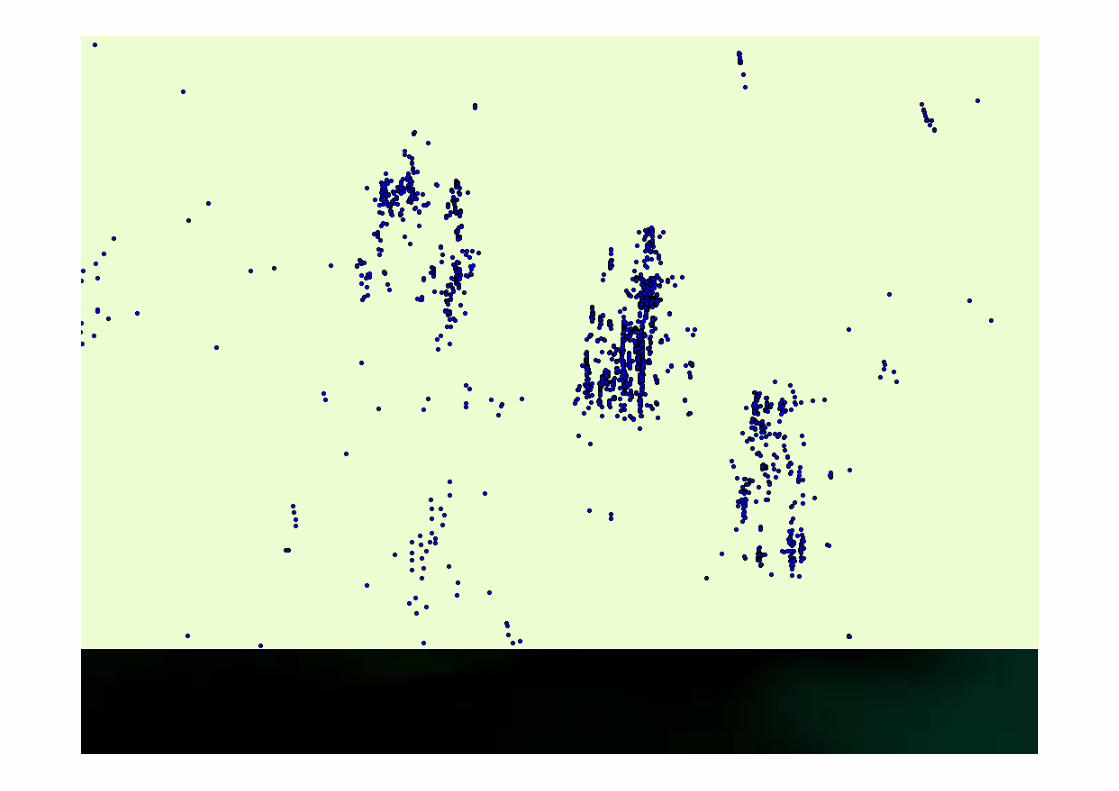
The following images show Polygonization of gold deposits in the Bendigo-Ballarat region at various mvalues with 0% noise.
These images progress at a predetermined timing from m = 0.8 to m = 4.0.
Implementing the AUTOCLUST Algorithm

m = 0.8

m = 0.9
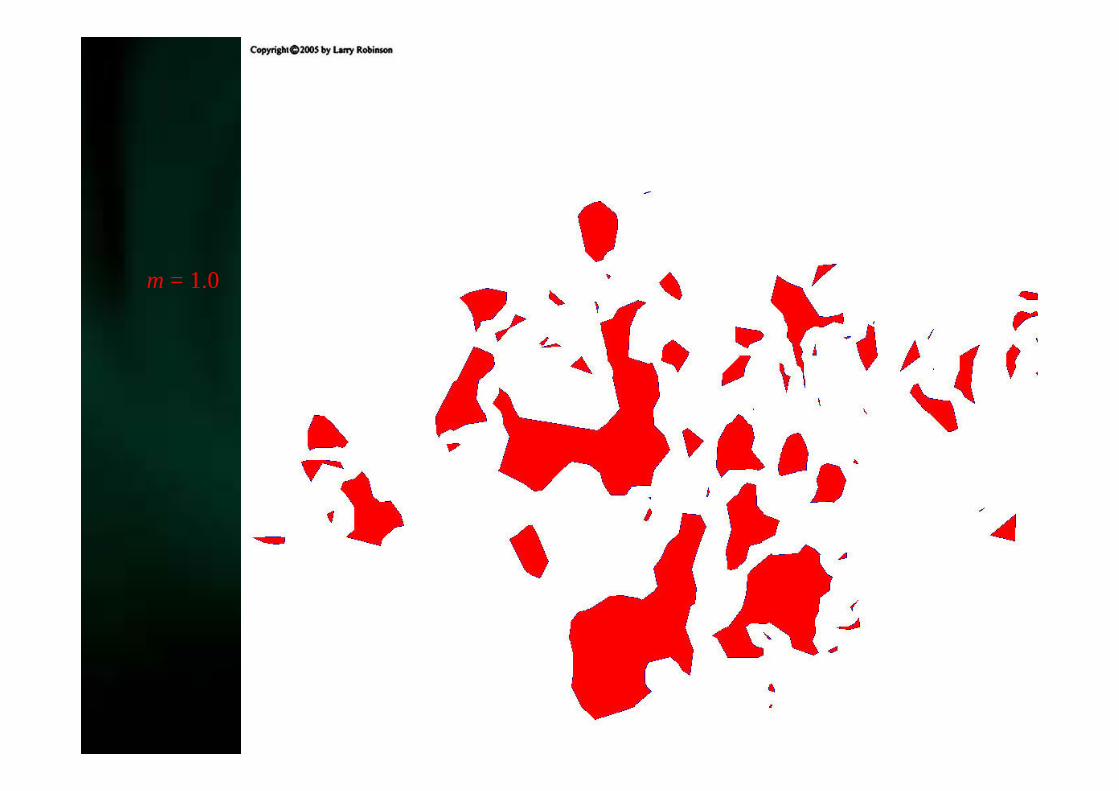
m = 1.0
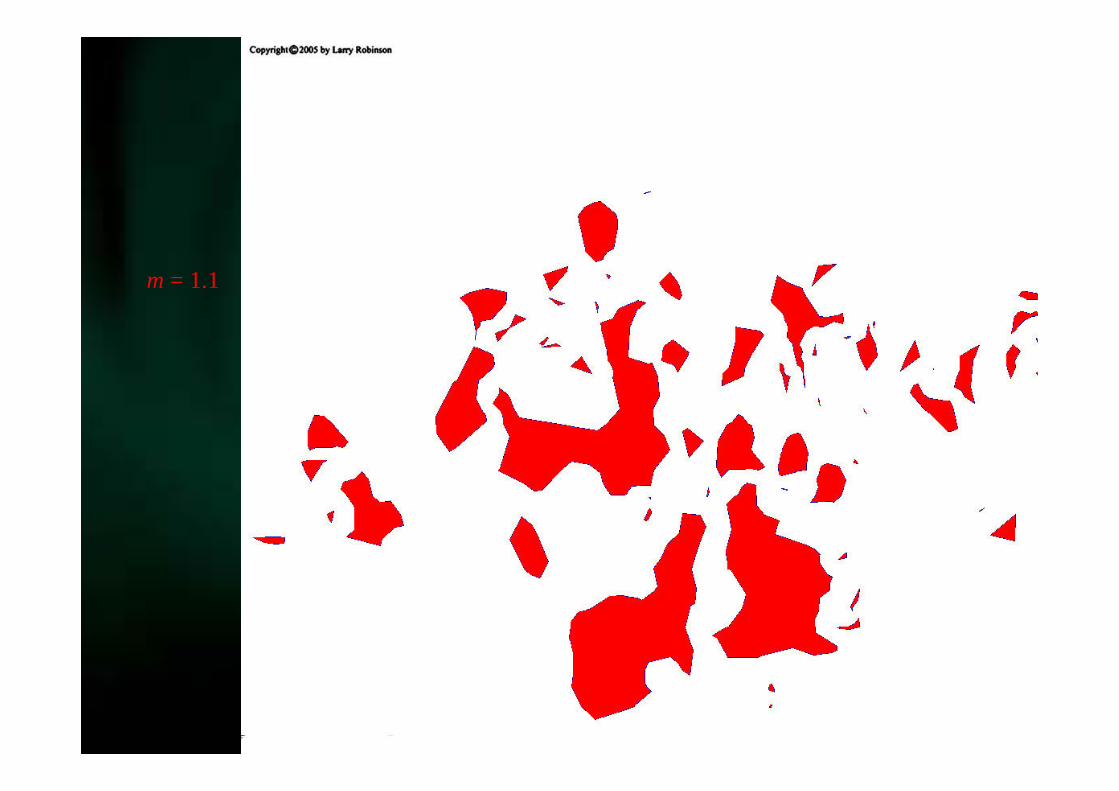
m = 1.1

m = 1.2

m = 1.3

m = 1.4
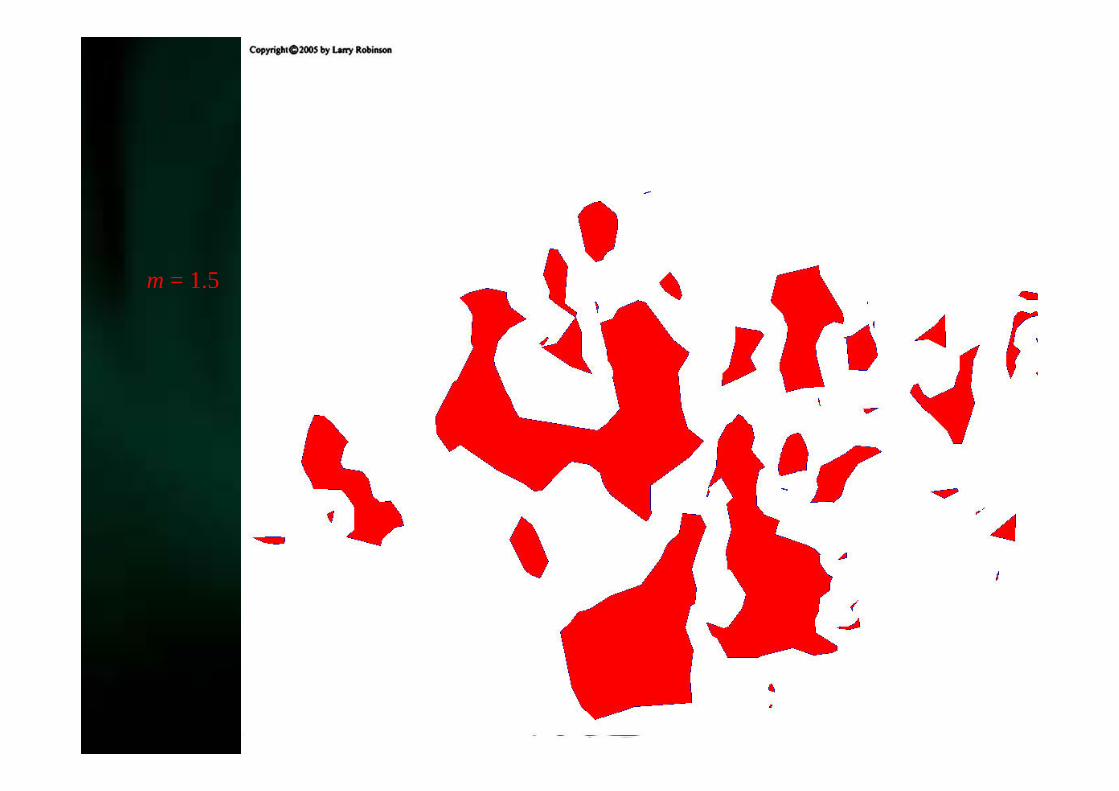
m = 1.5

m = 1.6
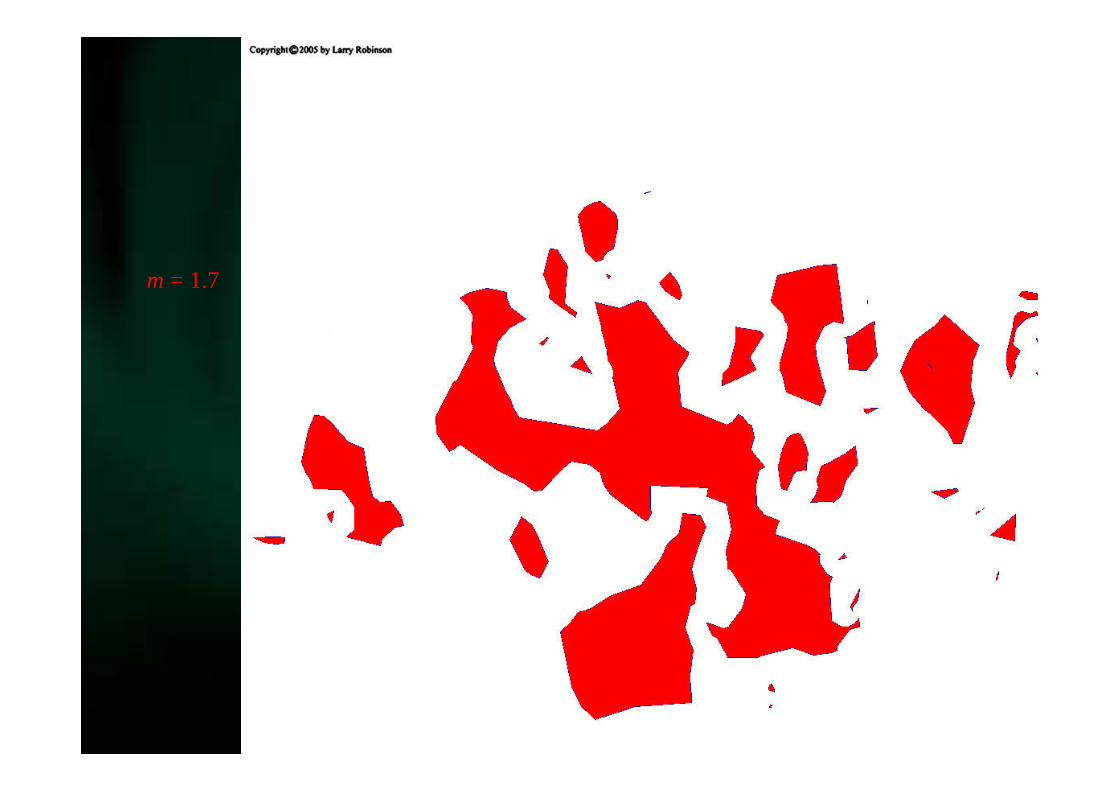
m = 1.7

m = 1.8
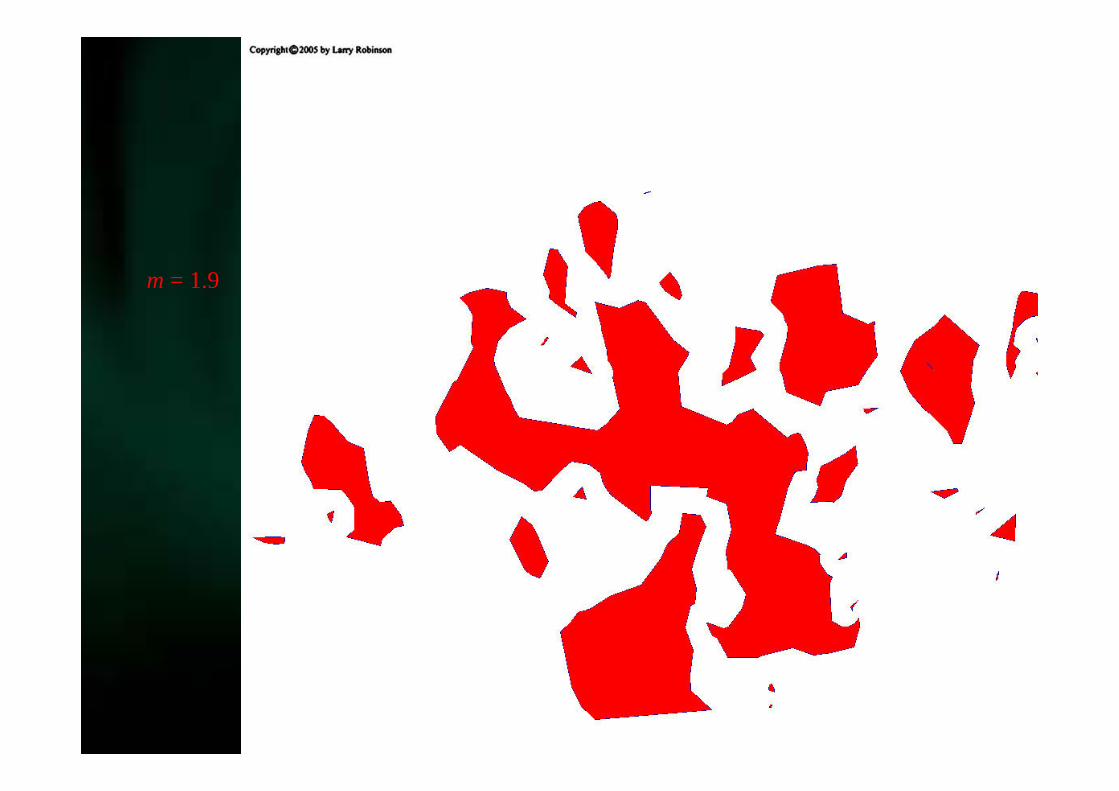
m = 1.9

m = 2.0
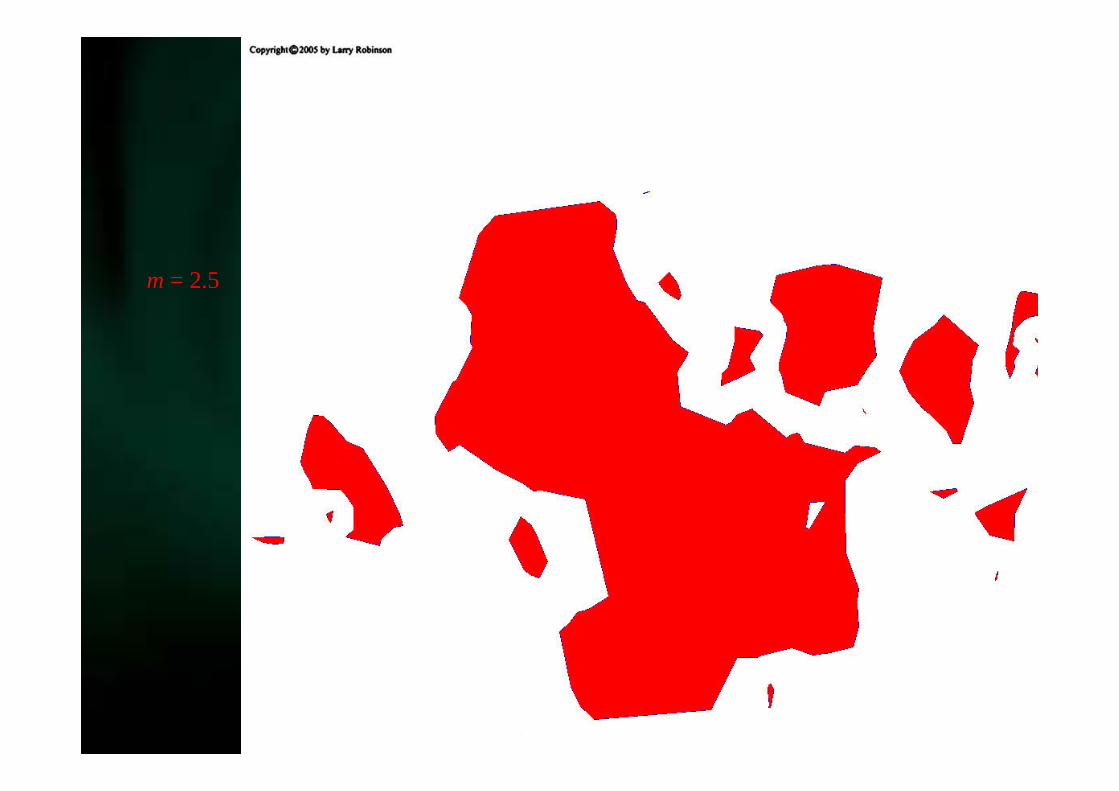
m = 2.5

m = 3.0

m = 3.5
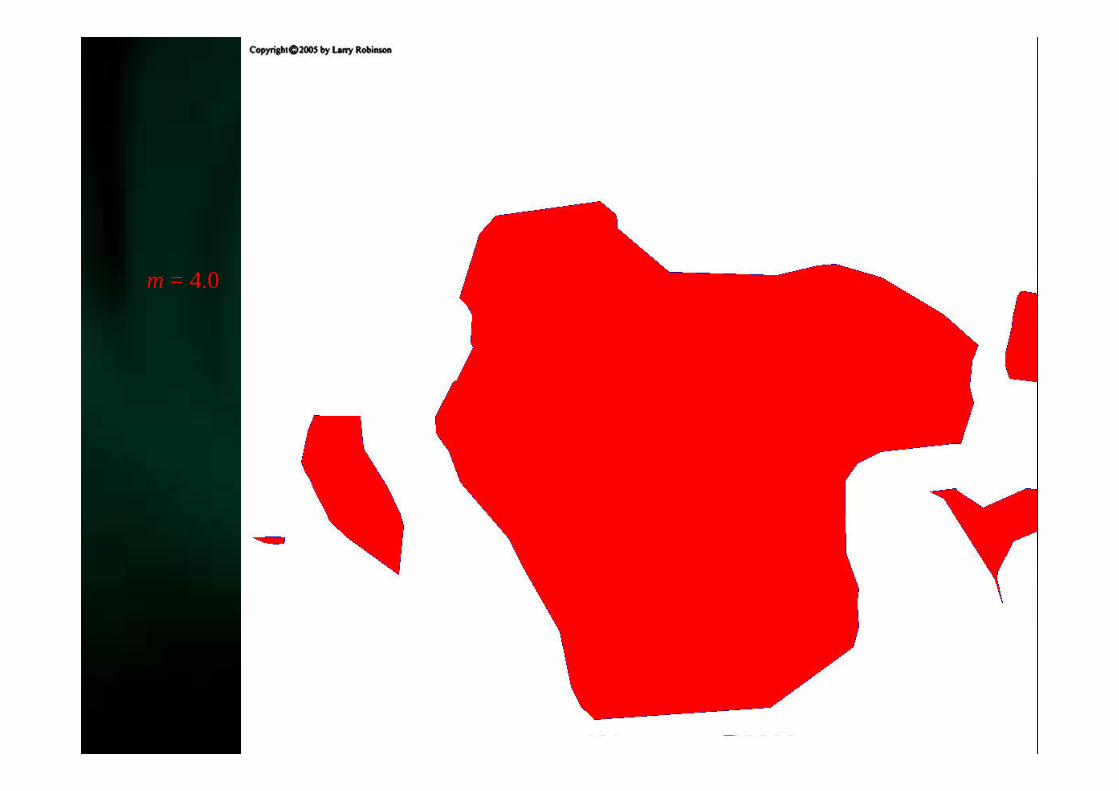
m = 4.0

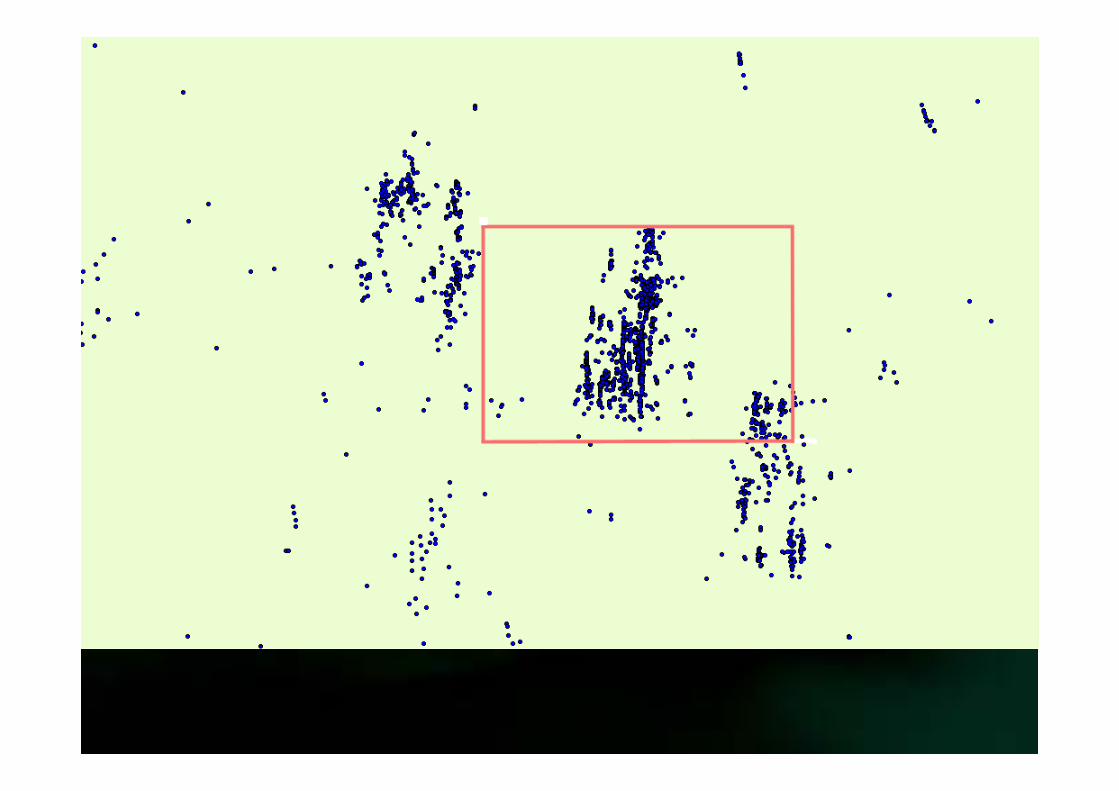
Using the AUTOCLUST algorithm there is an optimum m value for clustering, after which information is actually lost.
The optimum clustering for the Bendigo-Ballarat region is m = 1.1.
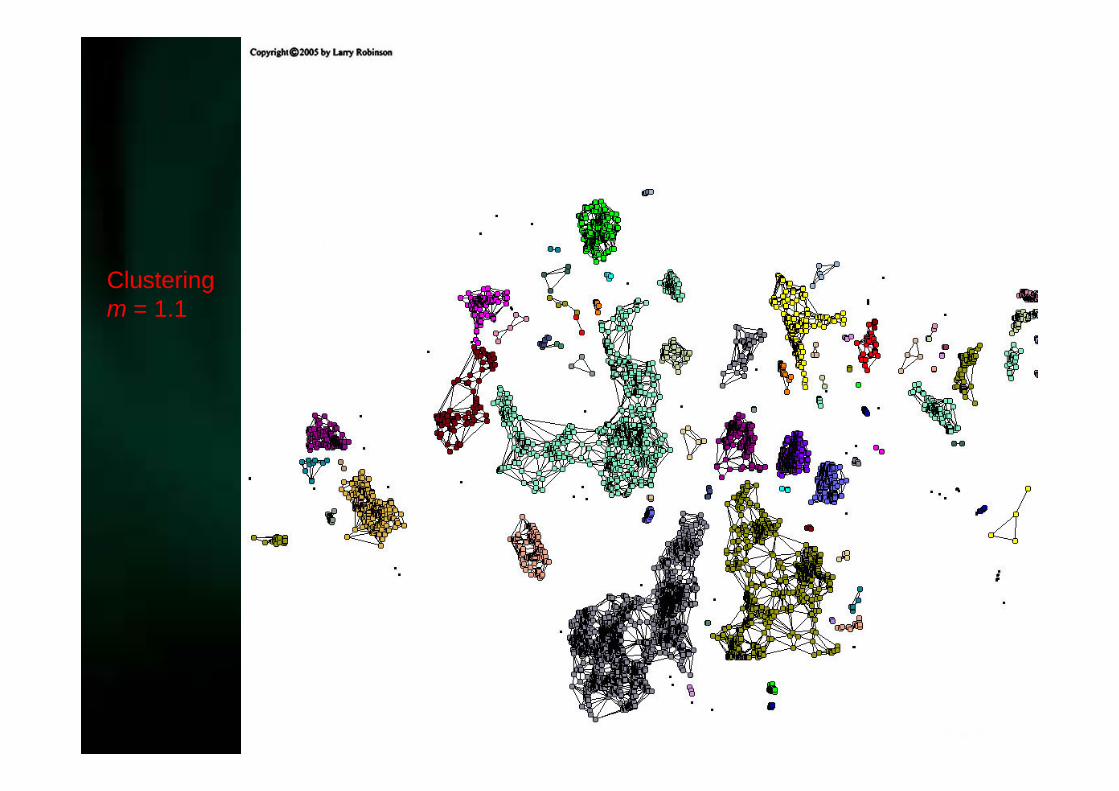
Clusteringm = 1.1
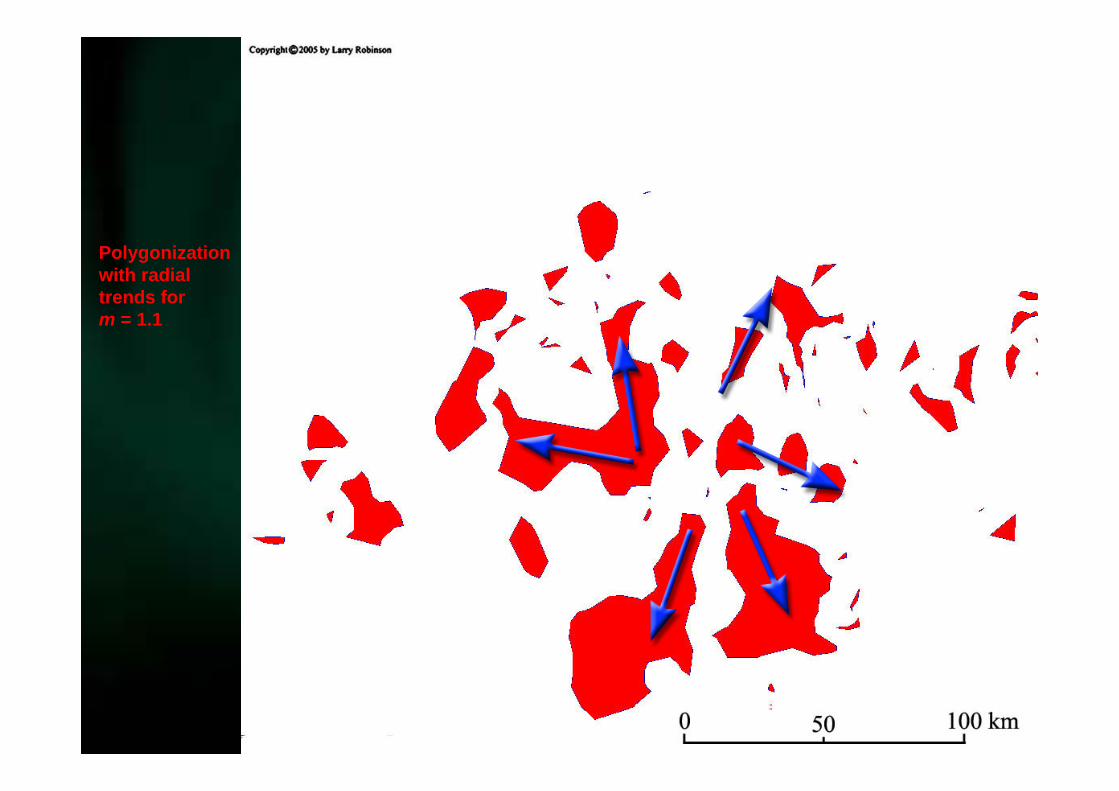
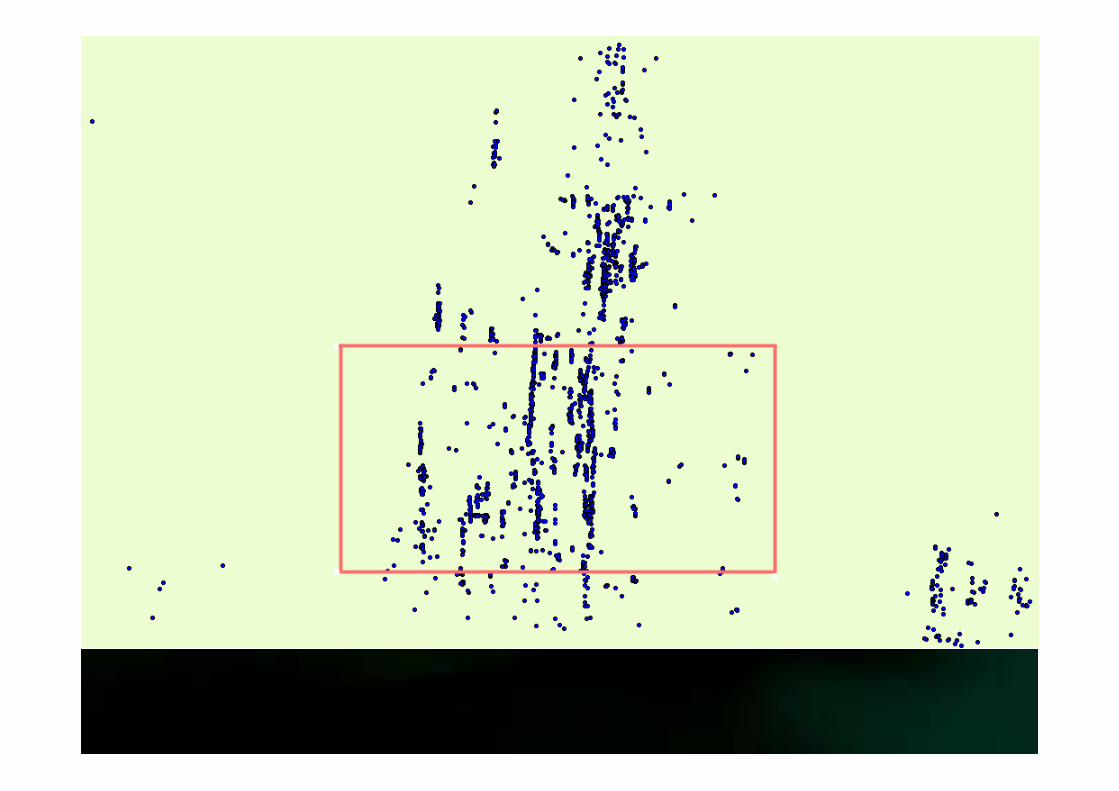
Polygonization with radial trends for m = 1.1
Note that there are NO gold deposits at the very centre of the radial pattern.
This is a characteristic of many, if not most, of the ~80 km diameter clusters in southeastern Australia.

The Giant and Major Gold Deposits3

However, for the Bendigo-Ballarat region this appears not to be the case.
Generally the giant and major gold deposits in southeastern Australia occur proximal to the empty centre, with the small deposits occurring primarily in the radial zones.
The explanation may be in the very shape of the radial patterns in this region.
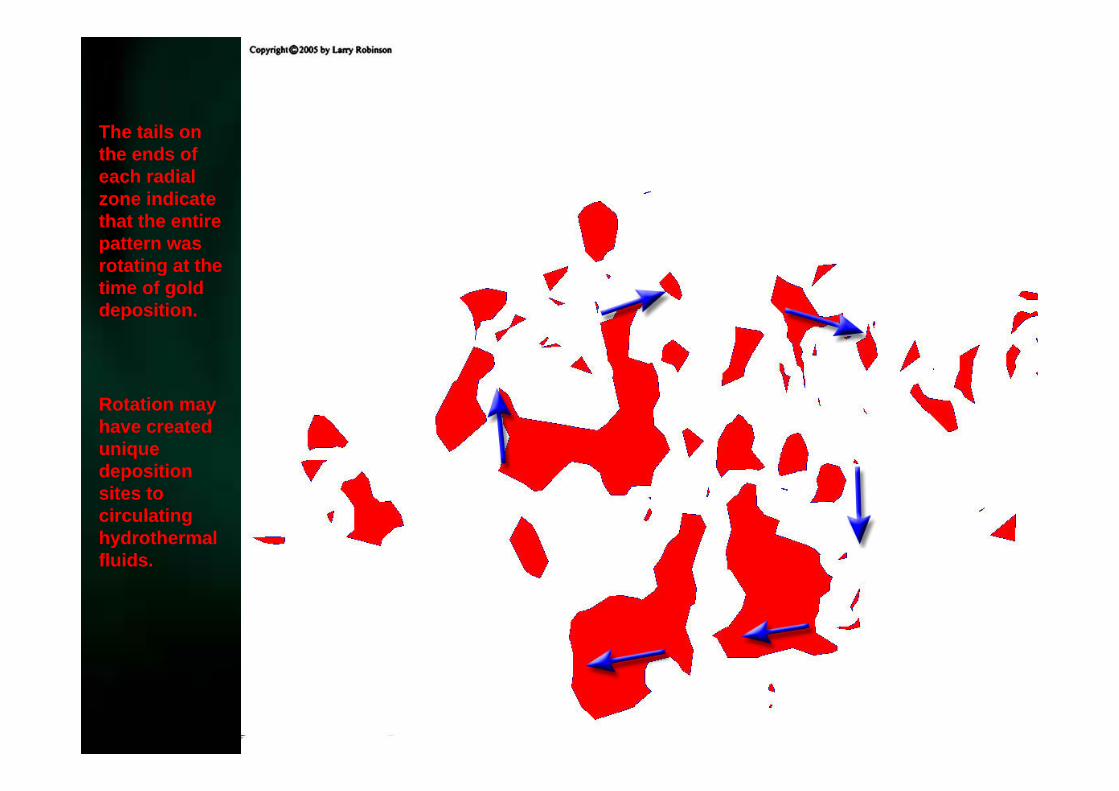
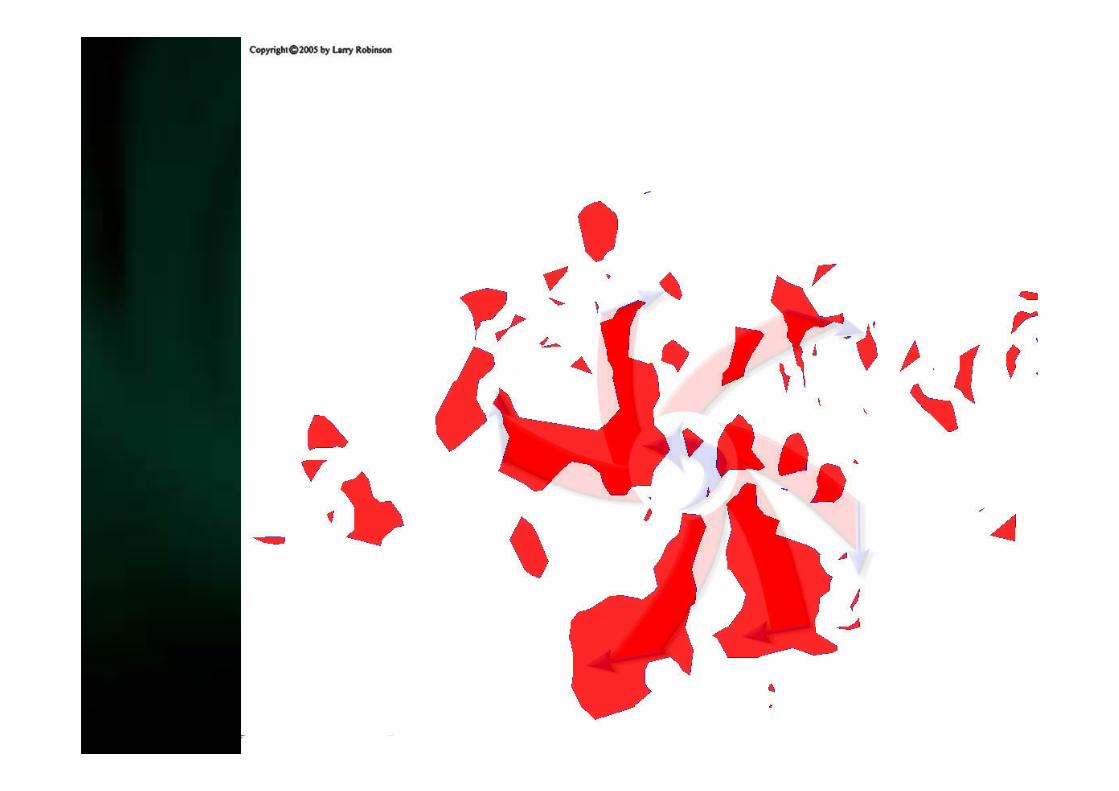
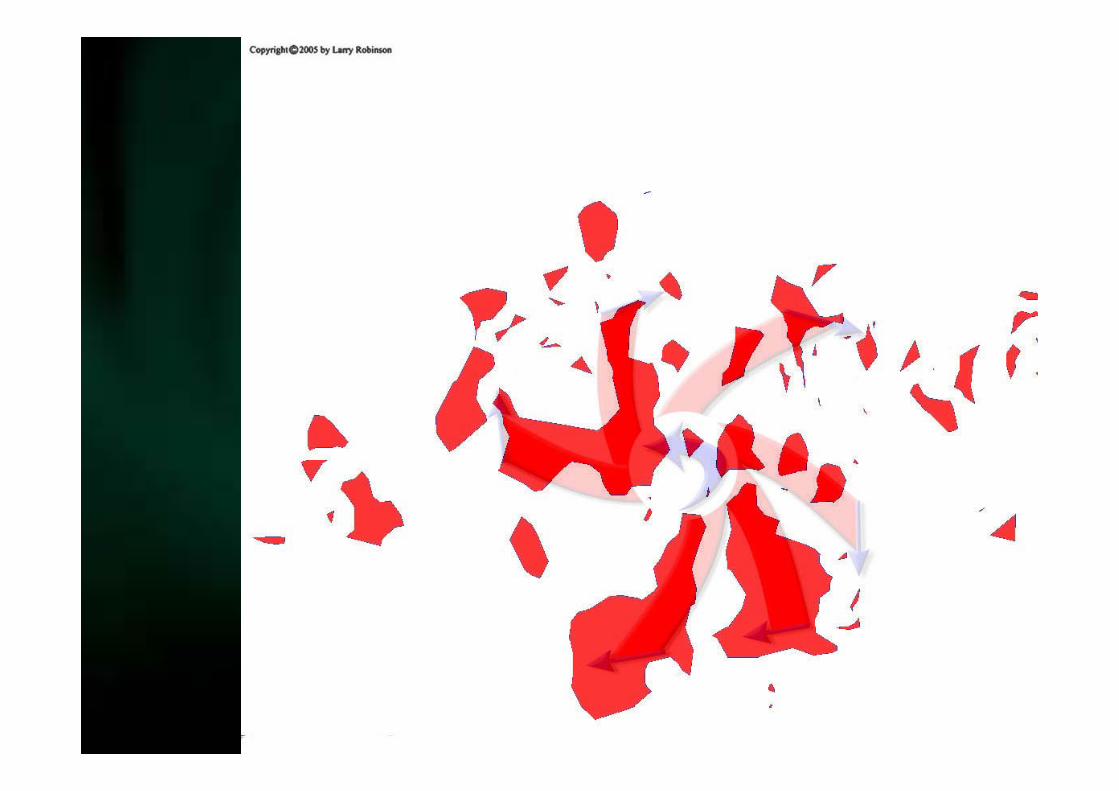
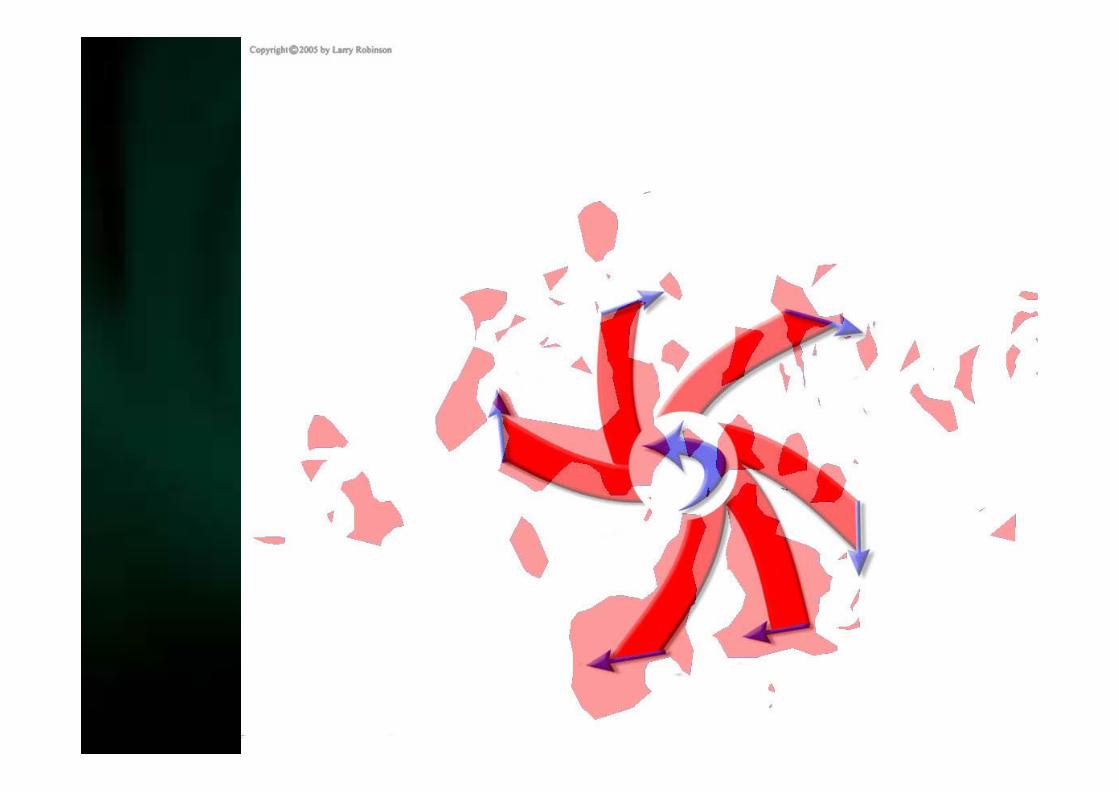
The tails on the ends of each radial zone indicate that the entire pattern was rotating at the time of gold deposition.
Rotation may have created unique deposition sites to circulating hydrothermal fluids.
The following timed sequences shows, diagrammatically, the proposed anticlockwise rotation created by Coriolis forces for the southern hemisphere.
Both Meyerhoff5 and O’Driscoll6 suggest that vortices, similar to those seen in the Earth’s atmosphere, can exist in the mantle.


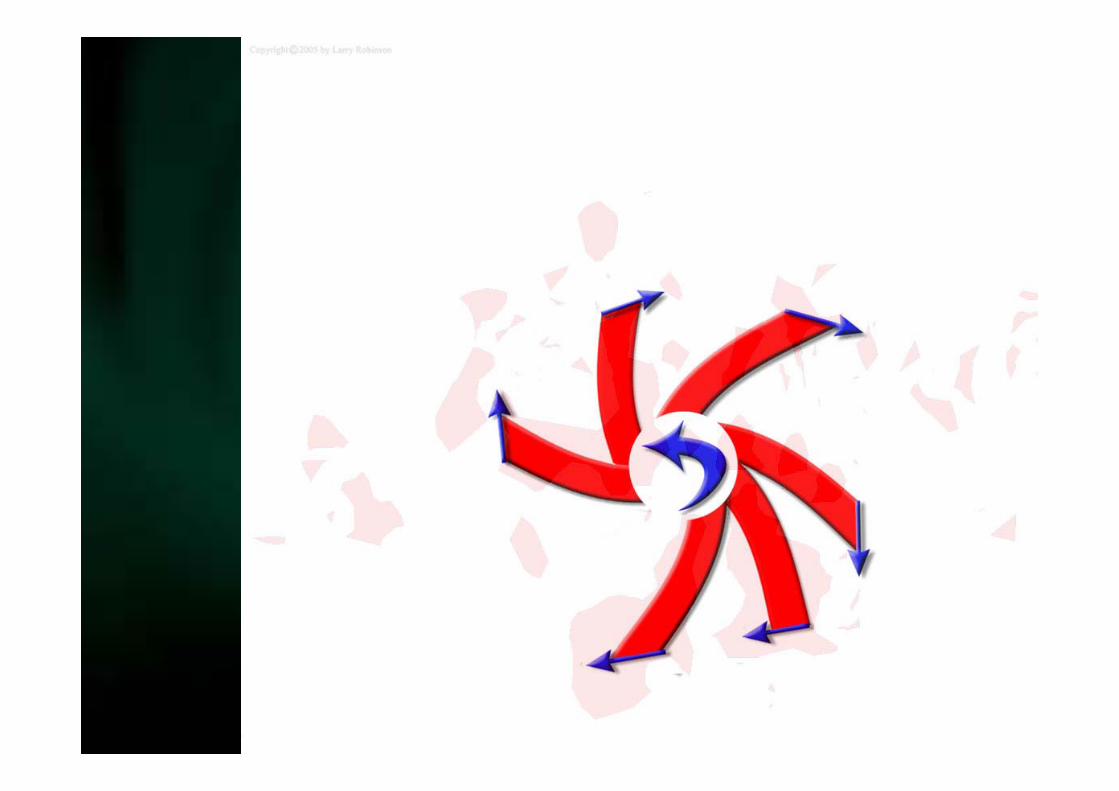

The Bendigo-Ballarat Model

There is evidence that the entire Lachlan Fold Belt is rotating in an anticlockwise motion due to Coriolis forces in the southern hemisphere.
The evidence is in the geology of the Bathurst Granites.

Granites in The Lachlan Fold Belt
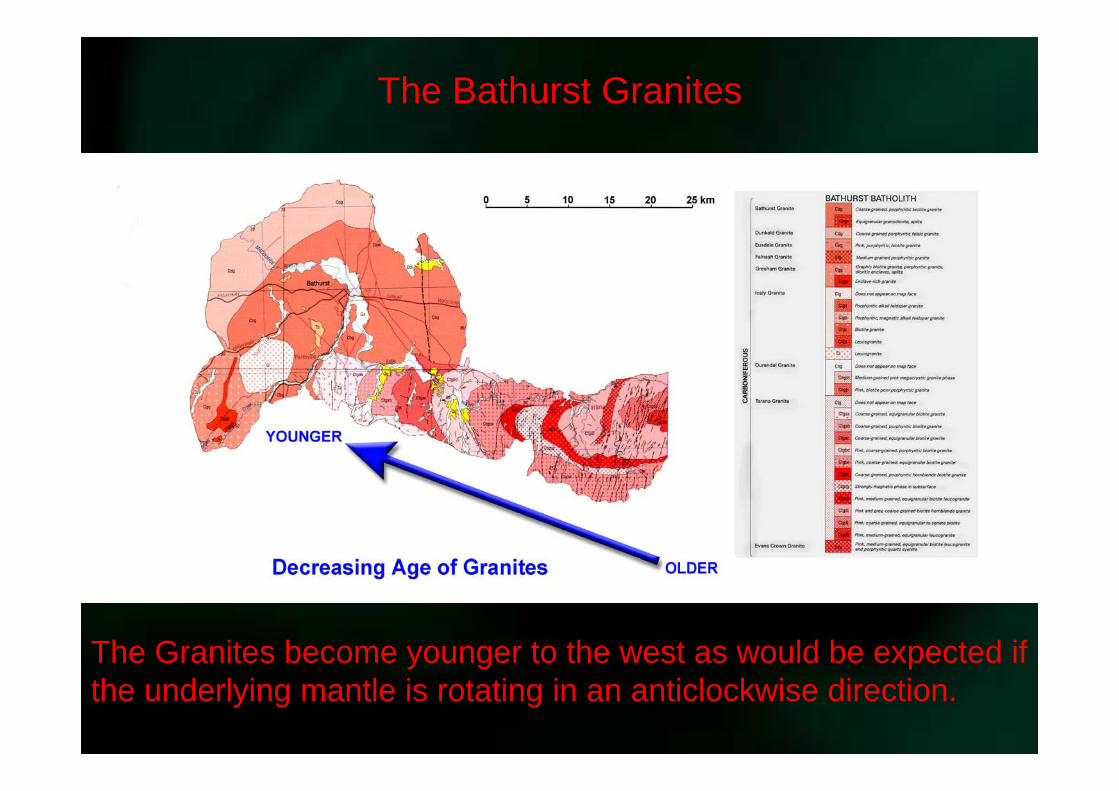
The Granites become younger to the west as would be expected if the underlying mantle is rotating in an anticlockwise direction.
The Bathurst Granites

See PowerPoint 6-11 Macro-Scale Patterns in Eastern Australia using Binary Slices of Gravity Data for further details on the Lachlan Fold Belt.

Thank YouThe End

References
1. AGSO Geology Map of Australia, 1982
2. New South Wales Mineral Exploration Data Package, 2004, Sydney, New South Wales Department of Mineral Resources, Australia, 1 CD-ROM.
3. Victoria Geoscientific Data CD, April 2003, Geological Survey of Victoria, Australia, 2 CD-ROM.
4. Estivill-Castro, V. and I. Lee. AUTOCLUST: Automatic Clustering via Boundary Extraction for Massive Point-data Sets. In Proceedings of the 5th International Conference on Geocomputation, 2000. to appear. Extended version is available at http://www.cs.newcastle.edu.au/Dept/techrep.html as a technical report.
5. Meyerhoff, A. A., Taner, I., Morris, A. E. L., Agocs, W. B., Kamen, K. M., Bhat, M. I., Smoot, N. C., Choi, D. R., and Hull, D. M., 1996, Surge tectonics; a new hypothesis of global geodynamics: Dordrecht, Netherlands, Kluwer, 323 p. .
6. O'Driscoll, E. S. T., 1992, Elusive trails in the basement labyrinth, in Rickard, -. M. J., and et al., eds., Basement tectonics 9: Australia and other regions. Proc. conference, Canberra, 1990, Kluwer, p. 123-148..