Soya ni Pesa - bscmsc.pps.wur.nl
73
Putting Nitrogen Fixation to Work for Smallholder Farmers in Africa MSc. Internship report PPS-70424 MSc Internship Plant Production Systems Soya ni Pesa Frederik van der Bom Reg. nr. 851017092120 Supervisor: Ken Giller Examiner: Linus Franke May 2013
Transcript of Soya ni Pesa - bscmsc.pps.wur.nl

Putting Nitrogen Fixation to Work for
Smallholder Farmers in Africa
MSc. Internship report
PPS-70424 MSc Internship Plant Production Systems
Soya ni Pesa
Frederik van der Bom
Reg. nr. 851017092120
Supervisor: Ken Giller
Examiner: Linus Franke
May 2013

Frederik van der Bom
Plant Production Systems - PPS 70424
2
MS
c.
I
nt
er
ns
hi
p
Re
po
rt
–
N
2A
fr
ic
a
|
So
ya
N
i
Pe
sa

3 Table of Contents
MS
c.
I
nt
er
ns
hi
p
Re
po
rt
–
N
2A
fr
ic
a
|
So
ya
N
i
Pe
sa
Table of Contents
Table of Contents ............................................................................................................................. 3
Chapter 1. Introduction ..................................................................................................................... 7
N2Africa ....................................................................................................................................... 7
Soya ni Pesa .................................................................................................................................. 7
Background .................................................................................................................................. 8
Internship objectives ................................................................................................................... 10
Outline ........................................................................................................................................ 11
Chapter 2. Project locations ............................................................................................................ 13
Caritas Njombe ........................................................................................................................... 15
Caritas Songea ............................................................................................................................ 16
Chapter 3. Findings ........................................................................................................................ 19
Farmer selection ......................................................................................................................... 19
Soybean history .......................................................................................................................... 19
Farming systems ......................................................................................................................... 20
Project timing ............................................................................................................................. 20
Inoculants ................................................................................................................................... 20
FEO functioning ......................................................................................................................... 21
Field size measurements ............................................................................................................. 22
Travel .......................................................................................................................................... 22
Weather ...................................................................................................................................... 22
Chapter 4. Nodulation assessment of demo plots of soybean (Glycine max) in the Soya Ni Pesa
project in the Southern Highlands of Tanzania. ............................................................................. 25
Abstract ...................................................................................................................................... 25
Introduction ................................................................................................................................ 25
Materials and Methods ............................................................................................................... 25
Nodule assessment .................................................................................................................. 26
Results ........................................................................................................................................ 28
Frederik van der Bom
Plant Production Systems - PPS 70424
4
MS
c.
I
nt
er
ns
hi
p
Re
po
rt
–
N
2A
fr
ic
a
|
So
ya
N
i
Pe
sa
Discussion .................................................................................................................................. 28
Final comments .......................................................................................................................... 31
Chapter 5. Germination of two lots of Soybean (Glycine max cv. Uyole soya-1) used in the Soya
Ni Pesa project in the Southern highlands of Tanzania. ................................................................ 33
Abstract ...................................................................................................................................... 33
Introduction ................................................................................................................................ 33
Uyole soya-1 .......................................................................................................................... 34
Materials and Methods ............................................................................................................... 34
Results ........................................................................................................................................ 35
Discussion .................................................................................................................................. 35
Final comments .......................................................................................................................... 36
Chapter 6. Plant stands of soybean (Glycine max) in farmers’ fields in the Soya Ni Pesa project in
the Southern Highlands of Tanzania. ............................................................................................. 39
Abstract ...................................................................................................................................... 39
Introduction ................................................................................................................................ 39
Materials and Methods ............................................................................................................... 39
Results ........................................................................................................................................ 40
Discussion .................................................................................................................................. 41
Final comments .......................................................................................................................... 42
Chapter 7. Characteristics of farmers in the villages of Ikondo and Nyave in Njombe region in the
Southern Highlands of Tanzania. ................................................................................................... 45
Abstract ...................................................................................................................................... 45
Introduction ................................................................................................................................ 45
Materials and Methods ............................................................................................................... 46
Site description ....................................................................................................................... 46
Selecting households .............................................................................................................. 46
Data collection ....................................................................................................................... 47
Results ........................................................................................................................................ 47
A. Demographic information .............................................................................................. 47

5 Table of Contents
MS
c.
I
nt
er
ns
hi
p
Re
po
rt
–
N
2A
fr
ic
a
|
So
ya
N
i
Pe
sa
B. Income ............................................................................................................................ 47
C. Labour ............................................................................................................................ 49
D. Livestock ownership ....................................................................................................... 49
E. Land use.......................................................................................................................... 49
F. Crop production .............................................................................................................. 51
G. Nutrition ......................................................................................................................... 53
Discussion .................................................................................................................................. 54
Final comments .......................................................................................................................... 55
Chapter 8. Challenges and opportunities ........................................................................................ 57
Market ........................................................................................................................................ 57
Storage ........................................................................................................................................ 57
Inoculants ................................................................................................................................... 57
Demo plots ................................................................................................................................. 58
Field measurements .................................................................................................................... 58
Transport .................................................................................................................................... 58
FEOs ........................................................................................................................................... 58
Office location ............................................................................................................................ 59
Costs and returns ........................................................................................................................ 59
References ...................................................................................................................................... 60
Appendices ..................................................................................................................................... 63

Frederik van der Bom
Plant Production Systems - PPS 70424
6
MS
c.
I
nt
er
ns
hi
p
Re
po
rt
–
N
2A
fr
ic
a
|
So
ya
N
i
Pe
sa

7 Chapter 1. Introduction
MS
c.
I
nt
er
ns
hi
p
Re
po
rt
–
N
2A
fr
ic
a
|
So
ya
N
i
Pe
sa
Chapter 1. Introduction
This academic report was written in fulfilment of the academic requirements pertaining to
guidelines for an Internship in the Plant Production Systems chair group (PPS) at Wageningen
UR. The internship was carried out under the auspices of the N2Africa project and took place in
the Southern Highlands Tanzania with the Catholic Relief Services (CRS) project of Soya Ni Pesa
(SnP).
N2Africa
N2Africa is a large scale, science research project focused on putting nitrogen fixation to work for
smallholder farmers growing legume crops in Africa (N2Africa, no date). The project is funded
by “The Bill & Melinda Gates Foundation” and 'The Howard G. Buffet Foundation' through a
grant to Plant Production Systems, Wageningen University, who lead the project together with
CIAT-TSBF, IITA and many partners in the Democratic Republic of Congo, Ghana, Kenya,
Malawi, Mozambique, Nigeria, Rwanda and Zimbabwe. Currently, new partnerships are
established in Ethiopia, Uganda, Tanzania, Liberia and Sierra Leone.
The project directly links the atmospheric reserves of nitrogen to the protein and nitrogen needs of
poor African farmers. It aims to improve farm household welfare by raising the average yields of
grain legumes by 954 kg/ha in four legumes (groundnut, cowpea, soybean, and common bean)
and to increase average biological nitrogen fixation (BNF) by 46 kg/ha. Goals to be achieved at
the end of the 4-year project are to:
identify niches for targeting nitrogen fixing legumes
test multi-purpose legumes to provide food, animal feed, and improved soil fertility
promote the adoption of improved legume varieties
support the development of inoculum production capacity through collaboration with
private sector partners
develop and strengthen capacity for legumes research and technology dissemination
deliver improved varieties of legumes and inoculant technologies to more than 225,000
smallholder farmers in eight countries of sub-Saharan Africa.
Soya ni Pesa
The Soya ni Pesa (Soybean is Money) project is an initiative to strengthen the soybean value
chain in Tanzania’s Southern Agricultural Growth Corridor (SAGCOT), by working with

Frederik van der Bom
Plant Production Systems - PPS 70424
8
MS
c.
I
nt
er
ns
hi
p
Re
po
rt
–
N
2A
fr
ic
a
|
So
ya
N
i
Pe
sa
smallholder farmers and integrating them with markets. During the four years of the project CRS
invests United States Department of Agriculture (USDA) funds to increase the production of
soybean from 3,500 MT per year to 11,000 MT and to support a total of up to 11,250 local
farmers in the process. The project will upgrade the feed component of the Tanzanian poultry
sector, with special attention to building a competitive supply of soybean for oil and meal
production.
The two main objectives are:
to increase agricultural productivity in the egg and soybean value chains by
demonstrating improved production techniques, facilitating access to improved seed, and
linking agricultural producers to financial services and agro-dealer networks
to expand trade of agricultural products in the egg and soybean value chains by training
agricultural producer groups, facilitating access to storage facilities, and linking
agricultural producers to markets and market information.
These objectives will be achieved by ten major interventions/activities (Figure 1).
Background
Low and declining soil fertility is widely recognized as a major constraint limiting smallholder
farming systems in sub-Saharan Africa (FAO, 2012, Okalebo et al., 2006). In many areas low soil
fertility is the result of continuous cropping, minimal use of fertilizers and a shift away from the
traditional systems that included fallow, which allowed the soil to recover from several years of
cropping (Smaling et al., 1997). Restoration and maintaining soil fertility therefore is a major
challenge to ensure food security. Conventional methods to increase soil fertility are the use of
fertilizers and manure, but use by smallholders is often restricted due to high costs, unreliable
returns, lack of credit, market access etc. (Sanchez, 2002). In the past governments periodically
ran successful fertilizer and seed subsidy programs, but these are unsustainable in the long run
because of the high costs involved (Sanchez et al., 1997). Moreover, removal of such subsidies
caused fertilizer prices to surge in relation to the prices of crops.
Alternatively, many legumes can nodulate and fix atmospheric nitrogen abundantly by the
symbiotic association between the crop and soil bacteria (rhizobia) (Giller, 2001). Nodulated
legumes have the potential to fulfil their demand for nitrogen by fixation and, as a result, can
influence the nitrogen balance of the soil (Hardarson and Atkins, 2003). Thus, growing legumes
may increase availability of nitrogen to accompanying or succeeding crops and intensification of
nitrogen-fixing legumes may provide an agronomic and economically sustainable alternative

9 Chapter 1. Introduction
MS
c.
I
nt
er
ns
hi
p
Re
po
rt
–
N
2A
fr
ic
a
|
So
ya
N
i
Pe
sa
(Kaschuk et al., 2006). At the same time sustainability will be improved by the diversification of
the cereal dominated rotations.
Figure 1 SnP framework for interventions and results.
Frederik van der Bom
Plant Production Systems - PPS 70424
10
MS
c.
I
nt
er
ns
hi
p
Re
po
rt
–
N
2A
fr
ic
a
|
So
ya
N
i
Pe
sa
Besides their potential to contribute to soil fertility grain legumes are often valued as being the
“meat for the poor” because of their high protein content and the low prices of pulses compared
with meat (Kaizzi et al., 2012). They complement other foods such as maize by which they can
play an essential role in human nutrition. Furthermore, while addressing the nutritional security
of the households legumes can also provide opportunities for farmers to improve their income
(Giller et al., 2011).
Internship objectives
The objective was to observe and collect data as a ‘fly-on-the-wall’ in order to better understand
the SnP project and its challenges. Apart from initially getting acquainted with the project and the
people involved, the internship activities can be divided over three main activities, during which
data was collected:
1. Work closely with a Field Extension Officer (FEO) at the village level; meet with and talk
to actors and farmers involved in the project.
2. Walk along with the officers at the regional level; understand the project from the
perspective of the local organisations.
3. Field visits, workshops, trainings with the SnP agricultural officer from Dar es Salaam;
field measurements, data collection, training of FEO’s and volunteers, monitoring
progress.
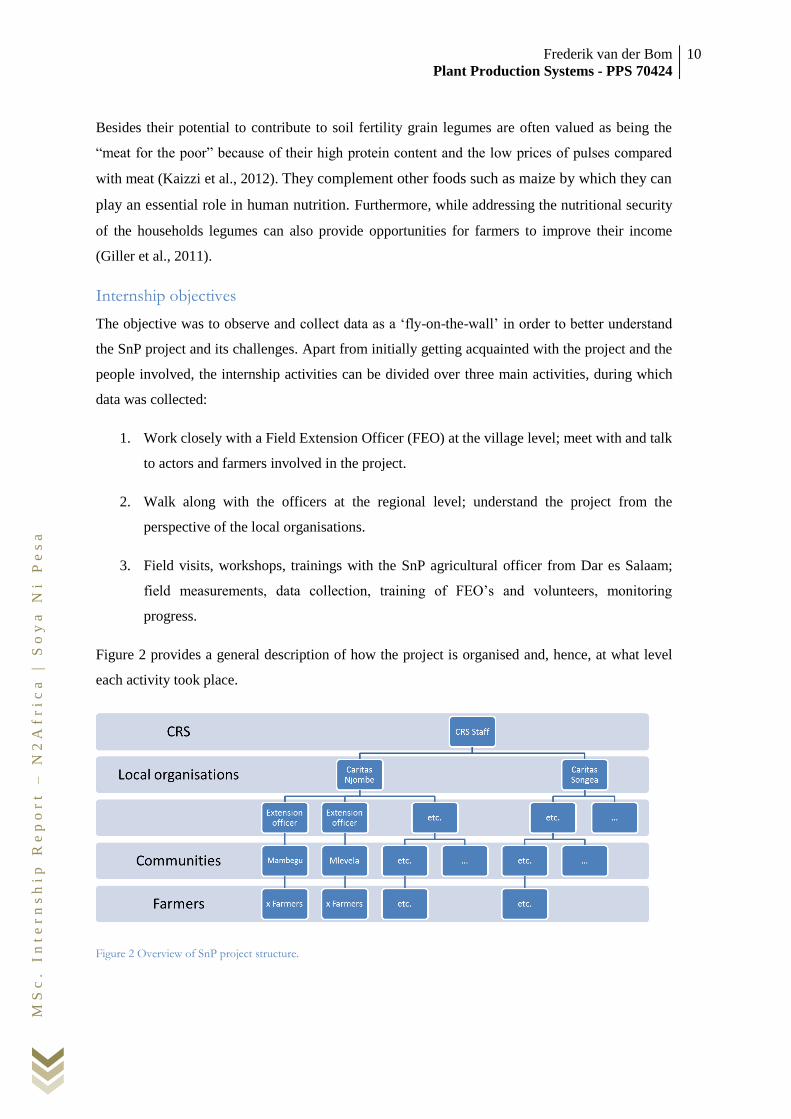
Figure 2 provides a general description of how the project is organised and, hence, at what level
each activity took place.
Figure 2 Overview of SnP project structure.

11 Chapter 1. Introduction
MS
c.
I
nt
er
ns
hi
p
Re
po
rt
–
N
2A
fr
ic
a
|
So
ya
N
i
Pe
sa
Outline
The following chapters were written to provide an overview of all experiences and findings. First
Chapter 2 further explains about the project and describes the projects locations. Then, Chapter 3
describes some of the main findings. After, Chapters 4 – 7 present a series of short papers on the
collected data, each supplemented with some final comments. Chapter 8 provides an overview of
the challenges and opportunities. Finally, a reflection is added after the Appendices.

Frederik van der Bom
Plant Production Systems - PPS 70424
12
MS
c.
I
nt
er
ns
hi
p
Re
po
rt
–
N
2A
fr
ic
a
|
So
ya
N
i
Pe
sa
13 Chapter 2. Project locations
MS
c.
I
nt
er
ns
hi
p
Re
po
rt
–
N
2A
fr
ic
a
|
So
ya
N
i
Pe
sa
Chapter 2. Project locations
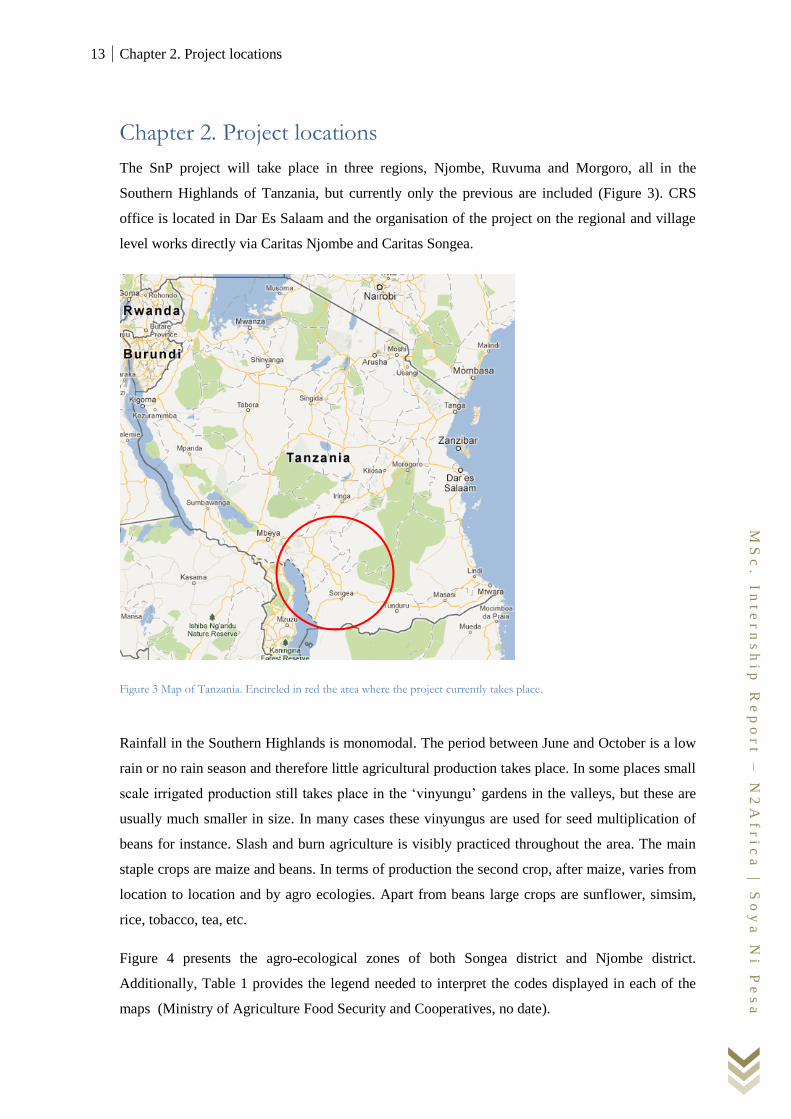
The SnP project will take place in three regions, Njombe, Ruvuma and Morgoro, all in the
Southern Highlands of Tanzania, but currently only the previous are included (Figure 3). CRS
office is located in Dar Es Salaam and the organisation of the project on the regional and village
level works directly via Caritas Njombe and Caritas Songea.
Figure 3 Map of Tanzania. Encircled in red the area where the project currently takes place.
Rainfall in the Southern Highlands is monomodal. The period between June and October is a low
rain or no rain season and therefore little agricultural production takes place. In some places small
scale irrigated production still takes place in the ‘vinyungu’ gardens in the valleys, but these are
usually much smaller in size. In many cases these vinyungus are used for seed multiplication of
beans for instance. Slash and burn agriculture is visibly practiced throughout the area. The main
staple crops are maize and beans. In terms of production the second crop, after maize, varies from
location to location and by agro ecologies. Apart from beans large crops are sunflower, simsim,
rice, tobacco, tea, etc.
Figure 4 presents the agro-ecological zones of both Songea district and Njombe district.
Additionally, Table 1 provides the legend needed to interpret the codes displayed in each of the
maps (Ministry of Agriculture Food Security and Cooperatives, no date).

Frederik van der Bom
Plant Production Systems - PPS 70424
14
MS
c.
I
nt
er
ns
hi
p
Re
po
rt
–
N
2A
fr
ic
a
|
So
ya
N
i
Pe
sa
Figure 4 Agro-ecological maps of Songea district (top) and Njombe distric (bottom) (Based on Ministry of Agriculture Food Security and Cooperatives, no date).

15 Chapter 2. Project locations
MS
c.
I
nt
er
ns
hi
p
Re
po
rt
–
N
2A
fr
ic
a
|
So
ya
N
i
Pe
sa
Table 1 Description of the Agro Ecological Zones of Songea districs and Njombe district as presented in Figure 4 (Based on Ministry of Agriculture Food Security and Cooperatives, no date).
Caritas Njombe
Njombe district inhabits over 420,000 people in approximately 99,000 households and consists of
a total of 25 wards (Tanzania National Website, no date). Currently the villages of Ikondo,
Mambegu, Mlevela and Nyave are included in SnP, in which a total of 112 households participate
(Figure 5).
An interesting other project also ran via Caritas Njombe, in collaboration with Heifer
international. Families received a heifer and became donors themselves as they passed the next

Frederik van der Bom
Plant Production Systems - PPS 70424
16
MS
c.
I
nt
er
ns
hi
p
Re
po
rt
–
N
2A
fr
ic
a
|
So
ya
N
i
Pe
sa
generation to other families in need. This project ended recently, but there are still many
households waiting in line, interested to participate. Subsequently, some villages were already
well known and, hence, the choice to start the SnP project in the current villages was influenced
by this history.
Figure 5 The villages in Njombe region that are currently included in the SnP project. For each village the number of households that are in the project is given. Total number of households: 112.
Caritas Songea
In Ruvuma region SnP is organised via Caritas Songea. The project includes the districts of
Songea Rural (pop. 148,000; 32,000 households) and Namtumbo (pop. 185,000; 33,000
households) (Tanzania National Website, no date) .
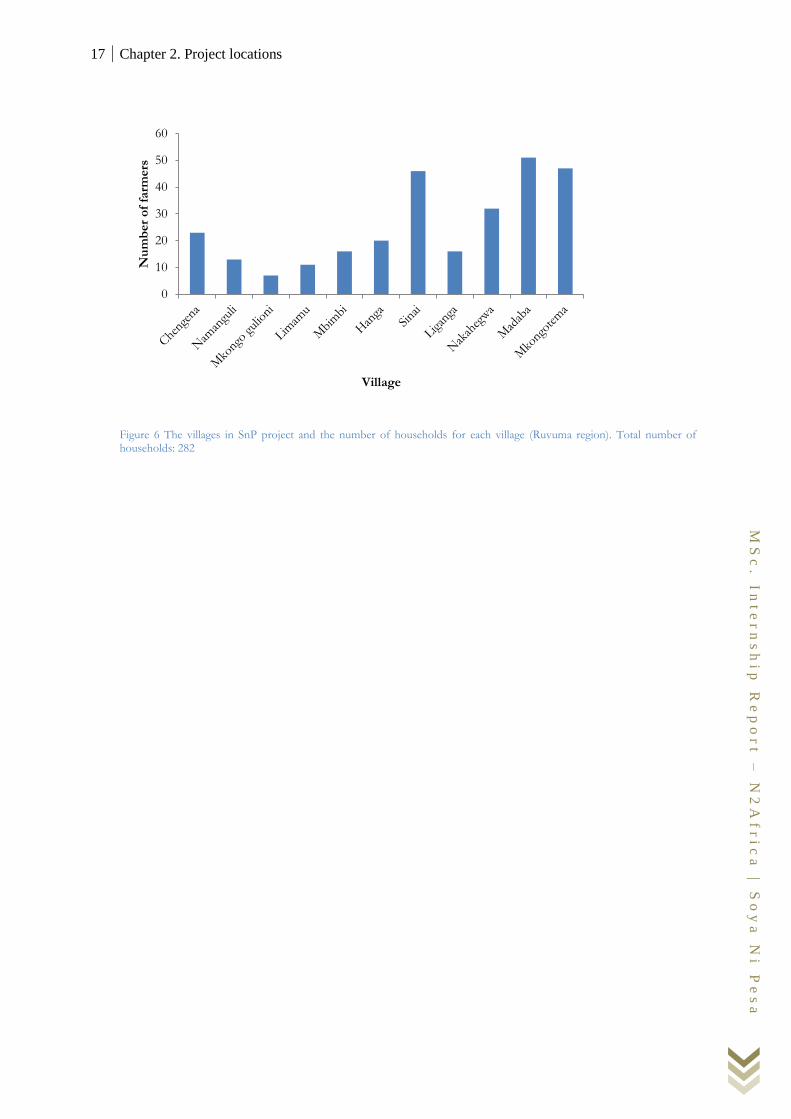
A total of 282 households from the villages of Chengena, Namanguli, Mkongo gulioni, Limamu,
Hanga, Mbimbi, Sinai (Namtumbo district), Liganga, Nakahegwa, Madaba, Mkongotema
(Songea Rural district) are included (Figure 6). This number is meant to increase to 2752 in the
following season and up to 4065 by the third year. By then 14 villages should be included in
Namtumbo, and 13 in Songea Rural.
0
5
10
15
20
25
30
35
40
mambegu Mlevela Ikondo Nyave
Nu
mer
of
farm
ers
Village
17 Chapter 2. Project locations
MS
c.
I
nt
er
ns
hi
p
Re
po
rt
–
N
2A
fr
ic
a
|
So
ya
N
i
Pe
sa
Figure 6 The villages in SnP project and the number of households for each village (Ruvuma region). Total number of households: 282
0
10
20
30
40
50
60N
um
ber
of
farm
ers
Village

Frederik van der Bom
Plant Production Systems - PPS 70424
18
MS
c.
I
nt
er
ns
hi
p
Re
po
rt
–
N
2A
fr
ic
a
|
So
ya
N
i
Pe
sa

19 Chapter 3. Findings
MS
c.
I
nt
er
ns
hi
p
Re
po
rt
–
N
2A
fr
ic
a
|
So
ya
N
i
Pe
sa
Chapter 3. Findings
When I arrived in Tanzania I spent the first day in the CRS office in Dar es Salaam to get
familiarised with the project, the planning for the next days, etc. The day after I travelled to
Njombe, from where I was transferred to Ikondo to spend some time with the local Field
Extension Officer for Ikondo and Nyave. After several weeks I returned to Njombe to grasp some
of the project on the regional office level and joined on visits to each of the villages. Finally I
joined Lembris Laiser, the SnP agricultural officer, on a series of field visits, demonstrations and
workshops in both Njombe and Songea.
Overall most time was spent on: 1. Walking along and talking to farmers; and 2. Measurements in
the field. This chapter presents a selection of findings I believe to be noteworthy. Several other
findings will be presented in Chapters 4-7 and will therefore not be further described here.
Farmer selection
In Ikondo and Nyave soybean cropping takes place in groups that were originally
established by CEFA (an Italian development organisation in Ikondo) for a project in
sunflower production. They were formed by approaching some already known women to
become group leader and by having them find interested group members. Hence, the
groups were designed to boost women empowerment. CEFA was open to also introduce
soybean production so the groups were approached for growing soybean as well. In all
other villages soya is grown independently. The farmers that are currently in the project in
Mambegu and Mlevela were already known by Caritas Njombe from the heifer project
briefly mentioned in Chapter 2.
Soybean history
Soybean is a crop that is already known amongst farmers, especially in Ruvuma region.
In many locations farmers have a history of growing a local soybean variety, or in fact
still are. In Ikondo soybean was introduced several years ago, but the buyer pulled out of
the project after a conflict with local government. Hence, the market for soybean
disappeared abruptly. Farmers do not have any knowledge about other functions of
soybean and had no choice but to burn their harvests. As a result farmers are very
reserved about growing soybean. To convince them CEFA offered the groups to use
CEFA lands instead of their own. In Songea too soybean was introduced multiple times,
but the projects were never really backed up. As a result farmers have a lack of trust and
plant the SnP crop on marginal lands.

Frederik van der Bom
Plant Production Systems - PPS 70424
20
MS
c.
I
nt
er
ns
hi
p
Re
po
rt
–
N
2A
fr
ic
a
|
So
ya
N
i
Pe
sa
Farming systems
In all locations farmers typically use a rotation system with two major crops: maize and
beans, sometimes in combination with fallowing. One exception is the
(relay)intercropping system that was observed in Mambegu, where farmers generally
grew maize, beans and cowpea. First beans are harvested, then maize and finally the
cowpea, that use the maize stalks to climb due to their vining habit.
In addition, the improved heifers from the Heifer project briefly mentioned in Chapter 2
(in Mambegu and Mlevela, Njombe district) were kept in a zero-grazing system, whereas
local breeds graze on communal lands.
Project timing
The late launch of SnP showed up in an appearance of a somewhat chaotic project
organisation. For instance, in Ikondo, groups had cultivated their land in December but
the seeds had not yet been supplied. Moreover, distribution was further delayed because
transport to the villages became impossible because of heavy rains: roads were simply too
muddy. By the time the seeds finally arrived, weeds had regrown and lands had to be
prepared for a second time, yet farmers were now active in undertaking other activities.
Likewise, the inoculants arrived late. As a result, project staff often seems to be one step
late with many tasks and are mostly busy fixing things, rather than moving forward to a
next phase.
Inoculants
Knowledge about inoculants is inadequate. The information provided in the workshop
about Rhizobium only partly reached its audience. Possibly this was a result of too much
information that was to be taken up in one go. Furthermore, the text on the bags that were
distributed is written in Czech, which is clearly not spoken by anyone in the project. This
was due to the emergency ordering of the inoculant by N2Africa, so any ‘on the shelf’
product could be sourced. Consequently some important information did not reach the
farmers.
The inoculant was supplied in bags of 2.5 kg whereas the majority of farmers plants less
than 10 kg of seeds. Therefore they only require a maximum of 40 grams, or, often, less
than that. Distribution takes place by taking little quantities from the 2.5 kg bags and
handing them out it in a piece of paper, matchbox, plastic bag etc., thereby completely
missing sterility considerations and the need to plant within 1-2 days. Furthermore, it is

21 Chapter 3. Findings
MS
c.
I
nt
er
ns
hi
p
Re
po
rt
–
N
2A
fr
ic
a
|
So
ya
N
i
Pe
sa
likely that the inoculant is stored by the farmer between time of distribution and time of
planting. Both may lead to Rhizobium dying off, thus a failing product.
Farmers in Namanguli explained that a local research station (ARI Uyole) already
introduced Rhizobium at the beginning of the previous season. When some of the fields
became diseased and/or showed high mortality farmers feared the product to be toxic.
Now, the majority of farmers did not use inoculant this season, even though they have
received them. What is striking is that originally this information did not reach the Caritas
FEO and/or the SnP project staff.
FEO functioning
It seems there is a considerable gap between FEOs and farmers in the majority of villages.
While visiting many villages with Lembris it became apparent that most FEOs are
struggling in both the documentation of farmer data and communicating project
knowledge to farmers. The tools they were supplied with in order to support them in their
work, such as a handbook, are little made use of.
Although it is improving, on the regional scale there is still a lack of knowledge about and
controlling of FEO activities. Many issues did not come to light until Lembris and I
started visiting the fields. We went through great lengths to gather simple data such as the
quantity of seeds sown, date sown and date weeded. Furthermore, documentation of any
activities such as new or improved practice/agronomic advice or meetings with farmers
was usually absent.
In addition reliability of information provided forms a major factor of concern. One of the
most striking stories is a FEO who presented field size data that soon turned out to be the
result of cross multiplication: field size (acres) = kg of seeds received × acres per kg of
seeds (based on recommended spacing).
In Ruvuma region Caritas ended up recruiting 15 helper farmers, who received a two-day-
training, in order to ensure that at least the main tasks of FEOs were to be completed. This
turned out to be a very effective way of gathering important data, but it ignored the more
fundamental problem which is that the FEOs did not fully do or understand their tasks.
On top of that it places local farmers in a position where they financially compensated by
the project. This is not necessarily a problem, but I believe caution is advised because it
may raise some (long term) financial expectations.

Frederik van der Bom
Plant Production Systems - PPS 70424
22
MS
c.
I
nt
er
ns
hi
p
Re
po
rt
–
N
2A
fr
ic
a
|
So
ya
N
i
Pe
sa
Field size measurements
In many locations field measurements were not completed or often were imprecise.
Common methods used to measure fields were the counting of steps, sticks, pieces of
string, etc. In some cases it was shown that field size had been overestimated up to 20%.
After a thorough inspection it was concluded that a substantial part of the area of soybean
that had originally been recorded had to be written off because it had never existed.
Travel
Transport forms a major obstruction for the FEOs to successfully fulfil their tasks. In both
Njombe and Ruvuma region I discovered that several FEOs had only seen some fields
once, up to months earlier. I do not attribute these facts to a lack of transport options only,
because I believe attitude plays a major part. Nevertheless, while staying in Ikondo I
repeatedly experienced having to spend considerable time on travel and, moreover,
arranging a mode of transport. In particular travel to and from Nyave, over 20 kilometers
from Ikondo was a constant challenge. It was not uncommon to be waiting at least half a
day for transport. As a result several planned meetings were missed and had to be
rescheduled. The lack of signal for mobile communication further exacerbated the issue
because any delays could not be communicated.
Weather
Farmers in Songea Rural indicated drought at time of sowing and/or time of flowering
have influenced crop performance. Rainfall data from two sources (ARI Uyole substation
based in Namtumbo and Caritas advisor based in Songera Rural) also suggest a lack of
rains during this period (Figure 7).

23 Chapter 3. Findings
MS
c.
I
nt
er
ns
hi
p
Re
po
rt
–
N
2A
fr
ic
a
|
So
ya
N
i
Pe
sa
Figure 7 Accumulated rainfall data collected by a Caritas advisor in Songea rural.
0
50
100
150
200
250
300
350
400
450
500
1-dec 31-dec 30-jan 1-mrt
Accu
mu
late
d r
ain
fall
(m
m)
Date
Frederik van der Bom
Plant Production Systems - PPS 70424
24
MS
c.
I
nt
er
ns
hi
p
Re
po
rt
–
N
2A
fr
ic
a
|
So
ya
N
i
Pe
sa

25 Chapter 4. Nodulation assessment of demo plots of soybean (Glycine max) in the
Soya Ni Pesa project in the Southern Highlands of Tanzania.
MS
c.
I
nt
er
ns
hi
p
Re
po
rt
–
N
2A
fr
ic
a
|
So
ya
N
i
Pe
sa
Chapter 4. Nodulation assessment of demo plots of soybean
(Glycine max) in the Soya Ni Pesa project in the Southern
Highlands of Tanzania.
Abstract
Within the Soya Ni Pesa (SnP) project demonstration plots were formed with the goal of
demonstrating a set of improved soybean production techniques to local farmers. Six well-
established plots were selected and nodulation was scored and recorded for each plot. Results
showed nodulation to be significantly greater with (Brady)rhizobial inoculation, alone and in
combination with 120 kg DAP ha-1
. A combined application of inoculant and P fertilizer may be
most profitable, but more research is needed to confirm. Furthermore, additional soil sampling
may provide more insight in environmental constraints. Finally, it is believed that, when well
taken care of, the demo plots provide a powerful tool to convince farmers to change their
management.
Introduction
As part of a program to upgrade the Tanzanian poultry feed sector the Soya Ni Pesa project (SnP)
aims to increase the production of soybean (Glycine max) in the Southern Highlands of Tanzania.
Up to 11,250 farmers will be supported in the four year project with the objective of increasing
agricultural productivity, diversifying outputs, increasing smallholder incomes and improving soil
fertility.
Several demonstration plots were established (Figure 8) with the goal of demonstrating improved
soybean production techniques to local farmers. In principle where targeted groups are located
within ten kilometres of one another, CRS intended to establish one demonstration plot for every
three to four producer groups. Where groups are not located within ten kilometres of one another,
one demonstration plot was to be established for each group. Field extension workers can work
from these plots to explain to farmers the types of technology options they can use. Nodulation
assessment was executed for reliable demo plots that included inoculation as a treatment.
Materials and Methods
SnP recommended spacing for soya production is 0.45 m inter-row and 0.05 m intra-row. Hence,
demonstration plots were established to display this spacing, adjacent to conventional farmers’
spacing, which provided a tool to compare different management options. Accordingly, when

Frederik van der Bom
Plant Production Systems - PPS 70424
26
MS
c.
I
nt
er
ns
hi
p
Re
po
rt
–
N
2A
fr
ic
a
|
So
ya
N
i
Pe
sa
farmers observe and realize what practice is the best one they may decide to adopt their
management in the next season. Besides spacing, several other treatments were also presented:
1. Control (no treatment)
2. DAP
3. inoculation
4. DAP + inoculation
5. Minjingu Rock Phosphate
6. Minjingu Rock Phosphate + inoculation
The actual presented management options varied largely for each location. For instance, due to
late arrival of the inoculants not all demo plots included the inoculation treatment. Similarly,
Minjingu Rock Phosphate was not included in many demonstration plots in Ruvuma region. All
plots were planted with the projects’ variety: Uyole soya-1.
Figure 8 Example of a demonstration plot (Picture take at Chengena village, Namtumbo). In the front an uninoculated plot of soya. In the back inoculated soya + DAP (120 kg ha-1).
Nodule assessment
Only well-established demo plots were selected for nodulation assessment. Criteria for this
selection were 1. reliable demo plot formation (treatment design and establishment, same date of

27 Chapter 4. Nodulation assessment of demo plots of soybean (Glycine max) in the
Soya Ni Pesa project in the Southern Highlands of Tanzania.
MS
c.
I
nt
er
ns
hi
p
Re
po
rt
–
N
2A
fr
ic
a
|
So
ya
N
i
Pe
sa
planting, record keeping) and 2. proper management (preparation, weeding). In practice this
meant six plots in Ruvuma region were selected of which their formation was closely supervised
by CRS. Figure 9 provides a graphical representation of the plot design and their included
treatments. Minjingu Rock Phosphate was not included in any of these specific plots.
Figure 9 Graphical representation of plot design. Note that the locations of each fertilizer treatment were randomized within each spacing type. Amounts of DAP equal to 120 kg ha-1 and inoculation rate of 4 g kg-1 of seed.
Nodulation was scored and recorded for each plot, based on the system devised for soybean in the
N2Africa project (Figure 10). Three plants were randomly selected from each plot at time of
flowering and dug up in such a way that the root system and nodules were recovered. The scores
from all plants were added and then divided by three to obtain a mean nodule score. A mean
nodule score of: 4 - 5 represents excellent nodulation; excellent potential for nitrogen fixation 3 -
4 represents good nodulation; good potential for fixation 2 - 3 represents fair nodulation; nitrogen
fixation may not be sufficient to supply the N demand of the crop. 0 - 2 represents poor
nodulation, little or no nitrogen fixation.
All the data were subjected to Analysis of Variance (ANOVA) using the ANOVA Procedure of
Genstat version 15 and differences among the treatment means compared using Fisher’s Protected
LSD test at 5% probability level.

Frederik van der Bom
Plant Production Systems - PPS 70424
28
MS
c.
I
nt
er
ns
hi
p
Re
po
rt
–
N
2A
fr
ic
a
|
So
ya
N
i
Pe
sa
Figure 10 Diagrammatic representation of the visual classification criteria used to evaluate the root system of soybean. Nodule score is judged by the number of effective nodules in the system (From N2Africa, 2012)
Results
Overall nodulation of soybean was poor for the control treatments at all sites (Table 2).
Nodulation was significantly greater with (Brady)rhizobial inoculation, whether alone or in
combination with 120 kg DAP ha-1
. Application of 120 kg DAP ha-1
also increased the number of
nodules. At Mkongotema and Sinai nodulation was particularly poor even in combination with
inoculation.
Table 2 Average nodule score of soybean under different technologies at six demo plots in SnP project.
Location
Treatmenta Chengena Namanguli Mkongotema Madaba Sinai Nakahegwa Mean
0 1.00 0.17 0.00 0.00 0.00 0.33 0.25a DAP 1.67 1.17 0.17 2.17 0.50 0.50 1.03b Inoculation 2.83 2.17 0.67 2.00 0.50 2.00 1.69bc DAP + Inoculation 3.17 2.83 0.67 2.71 0.67 1.67 1.95c
P<0.001,Standard Error=0.376 for the means a Treatments 0=Control (no treatment), DAP= 120 kg DAP ha-1, Inoculation = 4 g inoculant kg-1 of seed
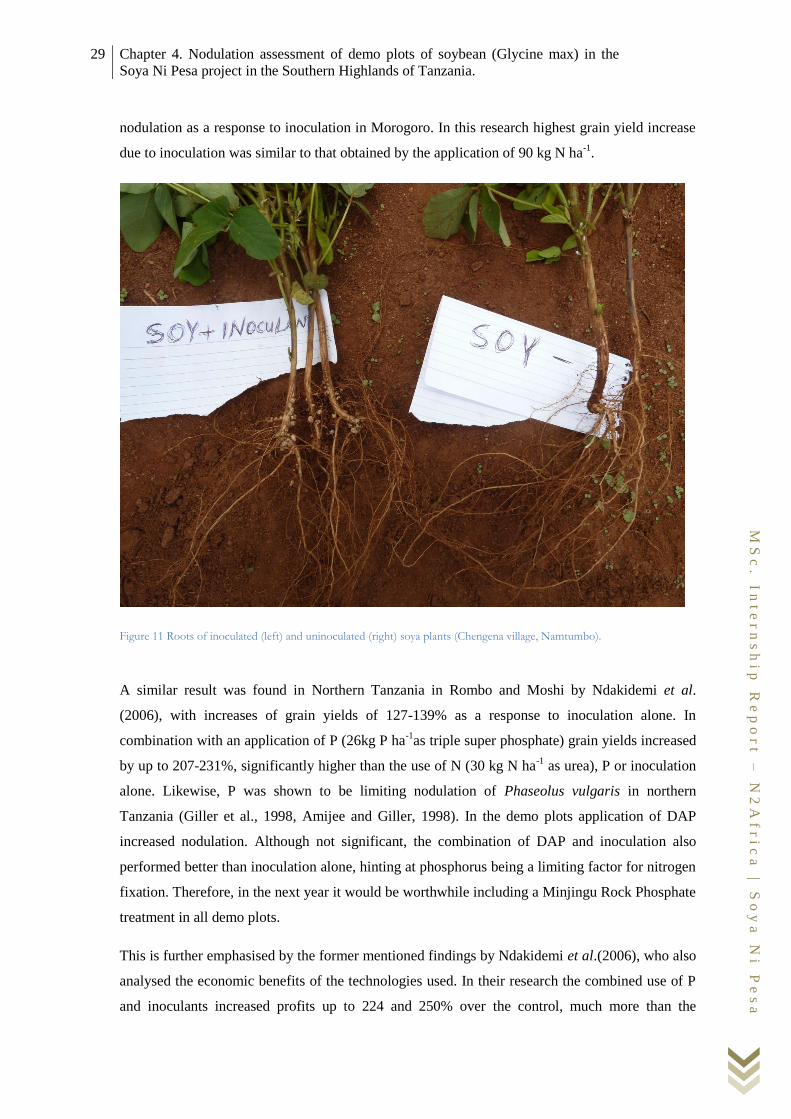
Discussion
Inoculation with Bradyrhizobium increased nodulation of soybean at all sites, revealing
population of indigenous rhizobia which could nodulate soybean was not sufficient (Figure 11).
This outcome is consistent with findings by Chowdhury et al.(1983), who found an increase of
29 Chapter 4. Nodulation assessment of demo plots of soybean (Glycine max) in the
Soya Ni Pesa project in the Southern Highlands of Tanzania.
MS
c.
I
nt
er
ns
hi
p
Re
po
rt
–
N
2A
fr
ic
a
|
So
ya
N
i
Pe
sa
nodulation as a response to inoculation in Morogoro. In this research highest grain yield increase
due to inoculation was similar to that obtained by the application of 90 kg N ha-1
.
Figure 11 Roots of inoculated (left) and uninoculated (right) soya plants (Chengena village, Namtumbo).
A similar result was found in Northern Tanzania in Rombo and Moshi by Ndakidemi et al.
(2006), with increases of grain yields of 127-139% as a response to inoculation alone. In
combination with an application of P (26kg P ha-1
as triple super phosphate) grain yields increased
by up to 207-231%, significantly higher than the use of N (30 kg N ha-1
as urea), P or inoculation
alone. Likewise, P was shown to be limiting nodulation of Phaseolus vulgaris in northern
Tanzania (Giller et al., 1998, Amijee and Giller, 1998). In the demo plots application of DAP
increased nodulation. Although not significant, the combination of DAP and inoculation also
performed better than inoculation alone, hinting at phosphorus being a limiting factor for nitrogen
fixation. Therefore, in the next year it would be worthwhile including a Minjingu Rock Phosphate
treatment in all demo plots.
This is further emphasised by the former mentioned findings by Ndakidemi et al.(2006), who also
analysed the economic benefits of the technologies used. In their research the combined use of P
and inoculants increased profits up to 224 and 250% over the control, much more than the

Frederik van der Bom
Plant Production Systems - PPS 70424
30
MS
c.
I
nt
er
ns
hi
p
Re
po
rt
–
N
2A
fr
ic
a
|
So
ya
N
i
Pe
sa
increase by the use of mineral N (79-87%), P (45-73%) or inoculation (140-153%) alone. Hence,
the simple use of inoculants has the potential of improving resource poor farmers’ lives, and the
importance of promoting its use should not be underestimated.
In Mkongotema and Sinai the response to inoculation was small. For both these locations field
observations revealed a green and vigorous crop, regardless of treatment. Therefore, local
circumstances were likely to sufficient to support crops growth and the soil was probably high in
nitrogen, which is commonly known to depress nodulation when available in high amounts
(Giller, 2001).
Soil analysis indicates soils are deficient in K in southern Tanzania (Smithson et al., 1993). No
potassium treatments were included nor were soil samples taken for these demonstration plots so
it is unclear if this matter also plays a role here. Similarly, soil acidity is known to reduce the
survival of rhizobia in soil, inhibit nodulation and N2-fixation and, leads to P fixation and
increases aluminium toxicity and calcium deficiency (Giller, 2001, Hungria and Vargas, 2000).
Subsequently, taking soil samples may increase the understanding of the soils in question and
could lead to a better diagnosis of their corresponding issues. In turn the knowledge of these
environmental constraints will provide a tool to better support local farmers in their production.
Figure 12 Demo plot visit with local farmers at Madaba village.

31 Chapter 4. Nodulation assessment of demo plots of soybean (Glycine max) in the
Soya Ni Pesa project in the Southern Highlands of Tanzania.
MS
c.
I
nt
er
ns
hi
p
Re
po
rt
–
N
2A
fr
ic
a
|
So
ya
N
i
Pe
sa
Finally, while visiting these six demo plots alongside farmers it was clear that farmers’ attitudes
towards these plots were overall very positive. Several farmers indicated the plots convinced them
to adapt their management for the next season and increase plant density for instance (Figure 12).
This may well rub off on neighbouring farmer in the years to come. However, it seems this
attitude will stand or fall with the credibility of the plot in question, because farmers’ responses
were clearly more meagre at plots that were compromised in some way. In Ikondo for instance
plot size was reduced and did just not have the same glow of professionalism. Hence, establishing
and enforcing well maintained plots, and eye for detail will improve the outcome. On top of that
the initial investment in taking good care of a demo plot may lighten the job of the extension
agents in the long term, because the management options in the plots will sell themselves.
Final comments
The six demonstration plots we did the measurements at were established with CRS supervision.
The Minjingu treatment was not included because the P only treatment was not considered:
farmer attitudes towards Minjingu is that it is a fertilizer that does not work, or only works in a
next season. Essentially they one on one compare it to DAP. Hopefully our conversations, some
papers I supplied and this report will increase some of the understanding of a potential
combination of inoculation and Minjingu, rather than the view of it being an inferior fertilizer.
I feel the core problem is a lack of understanding of the legume-Rhizobium symbiosis. Talking to
various people makes me realise the CRS staff training in December was simply too much to
comprehend – saturation of taking up information. Especially the field agents do not seem to
possess the knowledge of what inoculation is about, apart from a general picture of it being
beneficial for crop growth.
Similarly I believe the essence of the demonstration plots – the tool to make farmers see what is
possible – really just does not seem to have landed (until just now, hopefully). Field extension
workers have just been planting them because they were instructed to do so. As a result, apart
from the ones implemented under the supervision of CRS, all demo plots are poorly done. Just a
few examples: lack of labelling or even no administration at all which treatment is which; no
demarcation pegs making it hard to differentiate which plot ends where; seeds scorched by wrong
application of fertilizer; treatments planted at a weeks’ time difference; plots divided over two
locations; no weeding or partly weeding; very tiny plots of only a few rows, etc. Some real
encouragement is needed for extension workers to understand that taking some extra care will
really benefit the project, and also ease their job in the long run, hence, why it is important to
make these plots work.

Frederik van der Bom
Plant Production Systems - PPS 70424
32
MS
c.
I
nt
er
ns
hi
p
Re
po
rt
–
N
2A
fr
ic
a
|
So
ya
N
i
Pe
sa
The first demonstrations in Ikondo were poorly implemented. It appeared there had been little eye
for detail and the plot in question was compromised in size. I think this may have spilled over to
the FEO’s in the whole region of Njombe. All plots in the region of Njombe made an impression
of poor implementation.

33 Chapter 5. Germination of two lots of Soybean (Glycine max cv. Uyole soya-1) used
in the Soya Ni Pesa project in the Southern highlands of Tanzania.
MS
c.
I
nt
er
ns
hi
p
Re
po
rt
–
N
2A
fr
ic
a
|
So
ya
N
i
Pe
sa
Chapter 5. Germination of two lots of Soybean (Glycine max
cv. Uyole soya-1) used in the Soya Ni Pesa project in the
Southern highlands of Tanzania.
Abstract
Observations in farmers’ fields in the Soya Ni Pesa project (SnP) raised suspicion about seed
viability. To investigate whether seed germination may have been a factor influencing plant
emergence seeds were subjected to a germination test under controlled conditions. Two seed lots
used in SnP were collected from farmers and germination was tested under controlled conditions
in the laboratory and in a pot experiment in a greenhouse. Average viability was 49.6 % and 2.9%
for lot no’s. 10811TAN208 and 10506TAN149 respectively. Both laboratory tests of seed lot no.
10506TAN149 showed severe fungal infection. This result, accompanied with a lack of
germination in the greenhouse experiment, suggests this seed lot to be of inferior quality and a
likely explanation for poor field performance. It is recommended to collect field data on what
locations were planted to which lot number, and to check if poorly established fields correspond
to this issue of seed viability.
Introduction
Observations in farmers’ fields in the Soya Ni Pesa project (SnP) revealed a large variability of
establishment between different locations. Several farmers indicated the SnP variety (Uyole1)
displayed poor emergence and raised questions about seed quality, size and/or variety
performance. Moreover, some farmers mentioned they were willing to participate in the project in
future years, but suggested SnP to leave their variety at the office. They would prefer to grow
their own, local, variety instead. A particular field in Hanga village, seeded with both Uyole soya-
1 and a local variety revealed a well-established local variety but a poorly established Uyole soya-
1 (Figure 13). The grower clarified both varieties had been planted on the same day, by the same
person and essentially had received the exact same treatment, consequently variety being the only
factorin this ‘experiment’. Albeit lacking of replication, in combination with the observations in
the project and farmers’ opinion this raised suspicion about seed viability. To investigate whether
seed germination may have been a factor influencing plant emergence seeds were subjected to a
germination test under controlled conditions.

Frederik van der Bom
Plant Production Systems - PPS 70424
34
MS
c.
I
nt
er
ns
hi
p
Re
po
rt
–
N
2A
fr
ic
a
|
So
ya
N
i
Pe
sa
Figure 13 A field in Hanga village, with a well-established local variety (left) but a poorly established Uyole soya-1 (right).
Uyole soya-1
Uyole soya-1 was released in 2004 by the Southern Highland Zone Agricultural Research
Institute (ARI Uyole). It is reported that at ARI Uyole, soybean yield is between 2 and 3.6 tonnes
per hectare while under farmers’ condition yields average at 1.5 to 1.8 tonnes per hectare
(Malema, 2005). In SnP the seeds were supplied by ASA (Agricultural Seed Agency), a semi-
autonomous body under the Ministry of Agriculture, Food Security and Cooperatives. The
Agency was launched in 2006 and took over the responsibilities that were performed by the Seed
Unit of the Ministry of Agriculture Food Security and Cooperatives and is aimed at ensuring
availability of high quality agricultural seeds to farmers at affordable price. The project was
supplied with three different certified seed lots (Table 3).
Table 3 Seed lots used in the SnP project and certified germination according to TOSCI (Official Seed Certification Agency, both under ministry of Agriculture, Food Security and Cooperatives ).
Seed lot no. Certified germination (%)
10506TAN149 88 10811TAN208 84 20144TAN197 99
Materials and Methods
Two out of three seed lots could be retrieved from farmers. Each lot was tested in a Petri dish (20
seeds dish-1
) under controlled, sterile conditions in the laboratory (light, 34°C) and in a pot
experiment (15 seeds pot-1
) in the greenhouse. Both tests were duplicated, resulting in a total of
four tests per seed lot. After one week germination percentage was recorded for each replication
in the laboratory and emergence was recorded for the pot experiment.

35 Chapter 5. Germination of two lots of Soybean (Glycine max cv. Uyole soya-1) used
in the Soya Ni Pesa project in the Southern highlands of Tanzania.
MS
c.
I
nt
er
ns
hi
p
Re
po
rt
–
N
2A
fr
ic
a
|
So
ya
N
i
Pe
sa
Results
Table 4 shows the average percentages for each test, plus the combined averages of the two
experiments, summarized as viability. The results show that for Lot no.10811TAN208 over 50 per
cent of seeds were not viable. In the case of lot no. 10506TAN149 that number was even as high
as 97.1%.
Table 4 Average percentages of the two experiments. Viability defined as the average of both experiments.
Lot no. Petri dish Greenhouse pot Viability 10811TAN208 52.5 46.7 49.6 10506TAN149 2.5 3.3 2.9
P<0.001, LSD=10.23 for viability
A very clear observation in the Petri dish experiment was the presence of mould in both
replications of lot no. 10506TAN149, whereas none could be seen in 10811TAN208 (Figure 14).
Figure 14 Germination in petri dish. On the left lot no. 10506TAN149 displayed a heavy presence of mould, whereas lot no. 10811TAN208 (on the right) did not.
Discussion
Germination percentages as indicated by certification were largely overestimated compared to
those found in the laboratory (Table 5). Assuming the certified seeds were tested in a proper
manner storage conditions may provide an explanation of what may have influenced these
percentages to change over time.
Table 5 Differences in germination between TOSCI certification and measurements in the lab.
Seed lot no. Certified germination Measured germination Difference
(%) (%)
10506TAN149 88 2.5 -85.5 10811TAN208 84 52.5 -31.5
Because both replications were affected by mould in the case of lot no. 10506TAN149 and
because this was not the case for lot no. 10811TAN208, it is justified to conclude that the fungus

Frederik van der Bom
Plant Production Systems - PPS 70424
36
MS
c.
I
nt
er
ns
hi
p
Re
po
rt
–
N
2A
fr
ic
a
|
So
ya
N
i
Pe
sa
must have been seed borne. As the germination percentages found in the laboratory largely
coincided with the emergence found in the greenhouse pot experiment (Figure 15) it can be
assumed that the fungal presence had a detrimental effect on emergence. This be the case it is
likely to have affected emergence in farmers’ fields as well.
Figure 15 Result of the greenhouse experiment. On the left seed lot 10811TAN208 displayed an emergence of 46.7%. On the right only one emerged seed on lot no 10506TAN149
In any case, seed viability will likely have had an effect on crop performance in farmers’ fields.
Therefore it can be concluded that farmers’ complaints about seed quality was just. Poorer yields
may be expected for farmers who planted poor viable seeds, particularly those who planted lot no.
10506TAN149. Consequently, when measuring crop performance and yields it is advised to take
into account which seed lot farmers have planted. Data on fields’ plant stand and kg of seeds
planted was already collected so if data on which seed lot was planted is collected presumptions
on seed quality can be verified against the results of this experiment.
Lessons need to be drawn out of this experience. For a successful project it is vital for the farmers
to have faith in the competence of the project staff and the products (seeds) they supply. Field
observations suggest that, at least in some locations, Uyole soya-1 may be a high yielding variety
(many pods per plant), possibly able to outcompete the local varieties in terms of yields.
However, poor quality seeds will dismiss these positive characteristics because farmers are likely
to opt for their old, trusted varieties. Ensuring high quality seeds will therefore be of key
importance for the project to be successful.
Final comments
During my stay in Tanzania, after expressing some concerns, I was informally explained, by some
fellow concerned colleagues within the project, that I should not be surprised if I would observe
more issues with seed quality in the field: there were already some doubts about seed quality. I

37 Chapter 5. Germination of two lots of Soybean (Glycine max cv. Uyole soya-1) used
in the Soya Ni Pesa project in the Southern highlands of Tanzania.
MS
c.
I
nt
er
ns
hi
p
Re
po
rt
–
N
2A
fr
ic
a
|
So
ya
N
i
Pe
sa
came to know that when the seeds were received from ASA they were supposed to be sorted by
lot number, but ASA casual workers had mixed the seed lots three days before delivery. In other
words, there is no way to say if lot 10506TAN149 was really 10506TAN149. It is fairly certain
that at least a part of the seeds were produced in the 2011 production season, and have been sitting
in store for 18 months.
My instincts say this will have a major negative impact on the farmer’s attitude towards the
project if similar problems arise in the second season (and, hence, on the success of the project as
a whole). Already farmers were raising questions everywhere I have visited. It is absolutely
critical to fix this before seed distribution for the next season, and even then a lot of work will be
needed for farmers to gain back trust. I understand that N2Africa is assisting introduction of elite
germplasm and seed multiplication under irrigation ready for the next season.

Frederik van der Bom
Plant Production Systems - PPS 70424
38
MS
c.
I
nt
er
ns
hi
p
Re
po
rt
–
N
2A
fr
ic
a
|
So
ya
N
i
Pe
sa

39 Chapter 6. Plant stands of soybean (Glycine max) in farmers’ fields in the Soya Ni
Pesa project in the Southern Highlands of Tanzania.
MS
c.
I
nt
er
ns
hi
p
Re
po
rt
–
N
2A
fr
ic
a
|
So
ya
N
i
Pe
sa
Chapter 6. Plant stands of soybean (Glycine max) in farmers’
fields in the Soya Ni Pesa project in the Southern Highlands
of Tanzania.
Abstract
Soybean plant stand was measured in 70 fields across Ikondo, Mambegu, Mlevela (Njombe) and
Mkongotema (Songea), all part of the Soya Ni Pesa (SnP) project, which aims to increase
smallholder incomes and improve soil fertility in the Southern Highlands of Tanzania. According
to recommended spacing a plant stand of 444,000 plants per hectare is advised, however, farmers
do not always follow recommendations. The number of plants in five 5 m × 5 m quadrats per field
was counted and the average number of plants per quadrat was used to calculate field plant stand
on a per hectare basis. It was found that plant stand was far less dense than the recommended
spacing for all fields. Hence, in the following years there will still be a strong need to further
convince farmers.
Introduction
In the four year Soya Ni Pesa (SnP) project, CRS aims to increase smallholder incomes and
improve soil fertility in the Southern Highlands of Tanzania by increasing the production of
soybean (Glycine max). SnP will target up to 11,250 farmers, who will be supported by
demonstrating improved production techniques, establishment of a seed system, linking them to
markets etc.
Farmers are encouraged to plants at a spacing of 0.45 m inter-row and 0.05 m intra-row (over
444,000 plants per hectare), which is stimulated by words and is demonstrated in demo plots as
well. However, experiences while talking to farmers showed that farmers’ attitudes toward the
recommended population is that the distance between plants is far too small. It was frequently
suggested that planting this close may impede plant growth. Furthermore, observations in the field
showed that farmers underestimated the spacing they are planting at.
Materials and Methods
Plant stand was measured in 70 project fields across Ikondo, Mambegu, Mlevela (Njombe) and
Mkongotema (Ruvuma) by counting the amount of plants in five 5 m × 5 m quadrats per field.
The average number of plants per quadrat was used to calculate field plant stand on a per hectare
basis.

Frederik van der Bom
Plant Production Systems - PPS 70424
40
MS
c.
I
nt
er
ns
hi
p
Re
po
rt
–
N
2A
fr
ic
a
|
So
ya
N
i
Pe
sa
Results
On average establishment was only 125,000 plants ha-1
(Figure 16). The median indicates half of
the fields had a plant stand of smaller than 110000 plants per ha-1
. The largest number of plants
per hectare (288,000) was found in Mkongotema (Songea rural), whereas the minimum, 19000
plants ha-1
was found in Mlevela.
Figure 16 frequency distribution of soybean plant stand density in four villages in the SnP project (plants per hectare).
The boxplots in Figure 17 show the distribution of the measurements on a per village basis.
Usually farmers planted seeds in rows, but some observations also include the broadcasting of
seeds. For all villages the smallest observation amounted to less than 50,000 plants per ha-1
. The
lowest planting density was found in Mlevela, 19,000 plants ha-1
. In Ikondo and Mambegu even
the largest recorded densities were less than 125,000 plants ha-1
. Although on average plant stands
in Mkongotema and Mlevela were larger, with respectively 288,000 and 256,000 plants ha-1
here
too the densest recorded plant stand was well below the recommended density of 444,000 plants
ha-1
.

41 Chapter 6. Plant stands of soybean (Glycine max) in farmers’ fields in the Soya Ni
Pesa project in the Southern Highlands of Tanzania.
MS
c.
I
nt
er
ns
hi
p
Re
po
rt
–
N
2A
fr
ic
a
|
So
ya
N
i
Pe
sa
Figure 17 Distribution of soybean plant stand observations for each village.
Discussion
Clearly the achieved plant stand was very far off from what is desired in all of the measured
locations. The median of 110,200 plants ha-1
represents a plant stand of approximately one quarter
of the recommended population. Hence, in over half of all the measured fields the amount of
plants would need to be quadrupled at the least to achieve recommended density. In the worst case
the amount of plants would even have to be increased 23-fold. Even the largest observation of
288,000 plants ha-1
, measured in Mkongotema, was smaller than two thirds of the recommended
population.
The germination issue described in Chapter 5 had a large impact, but does not fully explain the
result. As mentioned, some discussions with famers revealed that the distance between plants in
the recommended population was perceived by many farmers as far too small. In some cases we
found farmers had planted in very sparse rows (>80 cm between rows) or at large distances
between plants (up to 25 cm). Farmer attitude therefore was clearly also of influence.
It is interesting to witness the differences in distribution between the villages. It is difficult to
explain what may have caused these. One option could be the history of soybean in the area and
hence familiarity with the crop. Differences between farmers may be explained by timing of
planting (amount of other activities at time of planting), workload (amount planted), farmer
attitude, experience, gender, differences between field agents or other factors. Whatever the case
may be, if it can be explained why some farmers are more likely to plant higher densities than

Frederik van der Bom
Plant Production Systems - PPS 70424
42
MS
c.
I
nt
er
ns
hi
p
Re
po
rt
–
N
2A
fr
ic
a
|
So
ya
N
i
Pe
sa
their neighbours and/or how these were persuaded, a tool might be developed to better target the
ones that were not.
The situation in Ikondo was slightly dissimilar to the other three villages. In here soybean is
grown collectively in groups and on CEFA lands. As a result field sizes were relatively large and
the number of measurements small. Furthermore, the history of soybean cropping in Ruvuma
region may explain why Mkongotema shows a different distribution. In the area of Mambegu
farmers also had some history of soybean growing and most farmers indicated they preferred a
planting density of 50 cm × 20 cm, with 2 seeds per hole (200,000 plants hectare-1
). It is very
interesting that the data shows that none of these farmers have achieved this desired plant stand.
Final comments
The data collected by these field measurements indicates there is still a lot of work to be done in
order to have farmers adopt the technologies that are promoted within the project. Still, this is
only the first year of four. My experiences while talking to farmers is that, in locations where the
demo plots were well established, farmers better appreciate the recommended density by actually
seeing it. In fact, several farmers indicated they intended to use the recommended planting density
in the following season. Therefore I am hopeful this technology will spread in the years to come.
Moreover, when farmers start planting in this way, the technology may spread to neighbouring
farmers directly without the need for demo plots.
Apart from the need to convince farmers of the recommended densities, I have noticed that in
many cases farmers planted at a density that ‘feels right’, or assume a certain distance between
plants without actually measuring. This often resulted in the fact that the distances between plants
were somewhat larger than they actually believe or intended. Hence, often a farmer believes the
achieved plant stand approaches his or her desired density, when in reality it is certainly not. On
some locations we have taken the time to visualize this by measuring and calculating the achieved
density together. In all cases farmers were surprised because they had believed to have planted
accurately at their desired density.
I remember one location distinctly where, after measuring, we discussed the achieved density. We
calculated the amount of land needed for the same amount of plants under recommended spacing.
The conclusion that this farmer’s crop could have been planted in an area of only one sixth the
size clearly had a major impact on his perception. He immediately acknowledged that he could
save a lot of land and labour by planting closer. I think in this case the well-established demo plot
in combination with making visible what this would mean for his own management turned out to
be a very powerful way of convincing him.

43 Chapter 6. Plant stands of soybean (Glycine max) in farmers’ fields in the Soya Ni
Pesa project in the Southern Highlands of Tanzania.
MS
c.
I
nt
er
ns
hi
p
Re
po
rt
–
N
2A
fr
ic
a
|
So
ya
N
i
Pe
sa
The optimal spacing could differ depending on farmer endowment however and would be related
to what factor is scarcest. In the previous example the farmer in question was limited in land and
labour, but for a farmer with abundant land and labour the price of seeds may be the limiting
factor. In this case it could be sensible to plant sparsely to maximise yield per plant and hence
maximise returns to seed.
Finally, I do not believe that growing on communal lands in groups as done in Ikondo is an
effective production method. I think collective ownership (and being paid a share of the total
output) may cause a decline in productivity compared to private ownership, and in fact may even
be an incentive to hold back the working effort by relying on fellow group members instead. To
illustrate, after China introduced its household responsibility system as part of its reform path
more than thirty years ago, the shift from collective farming to small-scale individual farming
caused dramatic gains in technical efficiency with small losses in scale efficiency (Rozelle and
Swinnen, 2004). A similar process could be observed in Vietnam a few years later. Many of these
gains in technical efficiency are generally attributed to property rights. Of course this example is
not from a location in the same region, but I believe it to be a fundamental issue, related to human
nature. Moreover, while visiting some fields in Ikondo we observed most fields had not been
weeded. When questioning the status of the fields several farmers indicated they had been
prioritizing the crops in their private fields first.

Frederik van der Bom
Plant Production Systems - PPS 70424
44
MS
c.
I
nt
er
ns
hi
p
Re
po
rt
–
N
2A
fr
ic
a
|
So
ya
N
i
Pe
sa

45 Chapter 7. Characteristics of farmers in the villages of Ikondo and Nyave in Njombe
region in the Southern Highlands of Tanzania.
MS
c.
I
nt
er
ns
hi
p
Re
po
rt
–
N
2A
fr
ic
a
|
So
ya
N
i
Pe
sa
Chapter 7. Characteristics of farmers in the villages of Ikondo
and Nyave in Njombe region in the Southern Highlands of
Tanzania.
Abstract
Within N2Africa a baseline survey is used to characterise the socio-economic situation of farm
households. The information collected enables the identification of socio-ecological niches based
on which the appropriate legume/rhizobium combination can be identified for a given type of
farm. Matching a legume genotype with the right socio-ecological niche is necessary for high
productivity, improved yield and enhanced farmer income. The villages of Ikondo and Nyave are
targeted by the SnP project. Fields and farmers were visited, which has resulted in the set of
characteristics presented in this report. Finally the survey as a tool is briefly discussed in the end
of this paper.
Introduction
N2Africa is a large scale research and development project focused on putting nitrogen fixation to
work for smallholder farmers growing legume crops. The project works in 13 countries in Africa:
Ghana, Nigeria, DRC, Rwanda, Kenya, Malawi, Zimbabwe and Mozambique in the original
project with an extension of the project in Sierra Leone, Liberia, Ethiopia, Uganda and Tanzania
in 2011/2012. In Tanzania a direct link was established with the CRS project ‘Soya ni Pesa’
(SnP), which started at the end of 2012 in the Southern Highlands of Tanzania. SnP aims to
increase the production of soybean (Glycine max) in order to raise incomes of up to 11,250
smallholder farmers.
Within N2Africa a baseline survey is used to rapidly characterise the socio-economic situation of
farm households, and to evaluate current legume management practices. This information is also
necessary to assess the project’s impact over several years’ time. Because the action sites for
project intervention have been classified according to agro-ecological potential and in terms of
market access, the baseline survey enables the identification of the socio-ecological niches that
are used to identify the legume/rhizobium combination that is appropriate for a given type of
farm. Matching a legume genotype with the right socio-ecological niche is necessary for high
productivity, improved yield and enhanced farmer income (Ojiem et al., 2007).
According to the SnP action plan a baseline survey was intended to take place in the project’s
mandate areas during the first weeks of February. When the survey was delayed it was decided to

Frederik van der Bom
Plant Production Systems - PPS 70424
46
MS
c.
I
nt
er
ns
hi
p
Re
po
rt
–
N
2A
fr
ic
a
|
So
ya
N
i
Pe
sa
gather and record as much information as possible while staying with the SnP field extension
worker in the village of Ikondo, Njombe district. Fields and farmers were visited in the villages of
Ikondo and Nyave and farmers, officials and development workers were interviewed.
Materials and Methods
Site description
The villages of Ikondo and Nyave are targeted by the SnP project and supported by the same field
extension worker. Ikondo, the largest village of the kata (ward), houses a total of 4011 people in
618 households, whereas Nyave houses 1026 people in 178 households (2010 census). Figure 16
provides an overview of the basic layout of the kata. Ikondo consists of seven neighbourhoods,
whereas in Nyave households are more or less scattered along a long-stretched road crossing over
the hills.
Figure 18 Map of the kata of Ikondo (Photo taken at the village office of Ikondo).
Selecting households
When selecting households, there is a risk that the choice of households is biased towards better-
off farmers. Nevertheless, because of a lack of demographic information it was difficult to
prevent. Based on observations it was hypothesised that farmers, part of the same socio-ecological
niche, tended to cluster in the same neighbourhood. Therefore it was aimed to map the
characteristics of at least five households in each neighbourhood. Part of the farmers spoken to
were selected from the list of participants in the SnP projects, but the goal was to also include

47 Chapter 7. Characteristics of farmers in the villages of Ikondo and Nyave in Njombe
region in the Southern Highlands of Tanzania.
MS
c.
I
nt
er
ns
hi
p
Re
po
rt
–
N
2A
fr
ic
a
|
So
ya
N
i
Pe
sa
farmers that dropped out of the project at an earlier stage. Furthermore, the village executive
officer of Ikondo was able to provide some names farmers in neighbourhoods that were not yet
included in the SnP project. This has resulted in a complete dataset of characteristics of a total of
39 households, with a minimum of three households from each of the neighbourhoods in Ikondo.
Data collection
Data was collected in accordance with a baseline survey used in N2Africa (Appendix I), which
focuses on the key indicators for the project. The information gathered can be divided into topics:
A. Demographic information:
B. Income: source of income, importance of farming, wealth indicators
C. Labour: hiring of labour, for which crops, cost
D. Livestock ownership
E. Land use
F. Crop production: cultivation of legumes and to a lesser extent of other crops
G. Legume utilization and nutrition: consumption in general and of legumes, used of haulms
Results
A. Demographic information
On average, 5.41 persons lived in a household. Children make up a large part of the population, as
55% of the household members were younger than 16 years old. Most of the households’ heads
are male, 92%.
All the households were members of a community organisation: CEFA, an Italian NGO, has been
present in the village of Ikondo for decades and has a dominant impact on the villages in the area.
They are involved in projects aimed at sustainable development in rural areas, particular aimed at
agriculture, livestock (milk), energy, water and social participation, education and hygiene. 13%
of the households indicated an additional affiliation, targeting farming activities, finances, orphan
education or water.
In 69% of the households primary school was the highest schooling level completed in the
household. Secondary school accounted for 28% of the answers. The remaining three per cent
indicated they had completed college.
B. Income
A total of 87% of the households indicated cropping was the primary source of income, followed
by off-farm labour (10%). The largest secondary source of income was livestock keeping (41%),

Frederik van der Bom
Plant Production Systems - PPS 70424
48
MS
c.
I
nt
er
ns
hi
p
Re
po
rt
–
N
2A
fr
ic
a
|
So
ya
N
i
Pe
sa
although a larger proportion of the households, 46%, indicated they did not have a secondary
source of income at all.
Farming was the dominant source of cash income (Table 6). In 62% of the cases all cash income
was generated on the farm, followed by the category of most income generated from farming
(21%). Only three per cent of the households indicated all cash income came from off-farm
sources. About half-half and more income generated from off-farm activities accounted for 5%
and 10% respectively.
Two categories most mentioned as an income generating activity outside farming were
construction/carpentry and working for the government (teaching, army, health service, extension
work), each accounting for 27% of the cases. Cooking and alcohol production both generated an
income in 14% of the cases. Finally, a job at CEFA (9%), renting out oxen (5%) and clothes
repairing (5%) were also indicated.
Table 6 Portions of cash income in the household coming from farm activities and from off-farm sources.
Class All income
from Farming Three-quarter from farming
Half from farming, half from off-farm
Three-quarter from off farm
All income from off-farm
% of households
61.5 20.5 5.1 10.3 2.6
Table 7 provides a list of what items were indicated to be the two most expensive goods in the
household. The two most indicated possessions were a radio (43.6%) and a bicycle (25.6%).
Three households indicated they only owned basic needs, two indicated a piece of furniture as
primary item and one indicated a cooking pot. Clustered these households form 15.4% of the
respondents, which could be considered to the fraction of households with the smallest amount of
resources.
Table 7 List of possessions indicated to be the most expensive goods in the household and the number of respondents who indicated these as the primary or secondary item (n=39).
Item Primary Secondary Total % of households Alcohol drum 2 0 2 5.1 Bicycle 5 5 10 25.6 Bucket 0 1 1 2.6 Car 0 1 1 2.6 Computer 2 0 2 5.1 Cooking pot 1 0 1 2.6 Engine 1 0 1 2.6 Furniture (table, chair) 2 2 4 10.3 Milling machine 1 0 1 2.6 Motorcycle 3 1 4 10.3 Phone 1 10 11 28.2 Radio 12 5 17 43.6 Satellite dish 1 0 1 2.6 Saw 0 1 1 2.6 Sewing machine 1 0 1 2.6 TV 4 3 7 17.9 Typing machine 0 1 1 2.6 Only basic needs 3 9 - 7.7

49 Chapter 7. Characteristics of farmers in the villages of Ikondo and Nyave in Njombe
region in the Southern Highlands of Tanzania.
MS
c.
I
nt
er
ns
hi
p
Re
po
rt
–
N
2A
fr
ic
a
|
So
ya
N
i
Pe
sa
C. Labour
28% of the interviewed households indicated family members worked on other people’s land for
cash or food. Conversely, 74% of the interviewed households indicated to hire labour for crop
production or processing. Hired labour was applied in beans, finger millet, maize, tea, sunflower
and in tree plantations (Table 8). None of the households had grown soybean in the previous
season.
Table 8 Percentage of times hired labour is allocated to a specific crop (n=29).
Crop % Beans 79.3 Finger millet 3.4 Maize 79.3 Tea 3.4 Tree plantation 6.9 Sunflower 6.9
D. Livestock ownership
97% of the households owned livestock. None of the households took care of other people’s
livestock. Most households owned chicken (Table 9). Goats and pigs were popular large livestock
species. Only few farmers owned cows or oxen. The average number of chicken and guinea pigs
is high, partly related to a few farmers who owned up to 60 chickens or 50 guinea pigs.
Table 9 Ownership of different livestock types and the average number of each type of aminals owned per household.
Type % households Average number Cattle 2.6 3.0 Dairy cows 2.6 3.0 Oxen 7.7 3.0 Goats 30.8 4.8 Pigs 41.0 3.3 Chicken 87.2 14.2 Guinea pigs 23.1 19.2 Beehives 5.1 2.0
E. Land use
On average households had 2.85 ha available for arable farming (Figure 19). The available land
varied between 0.8 ha and 8 ha with over 74% of farmers cultivating between one and four
hectares. These areas are based on farmers’ estimates as actual field sizes were not measured.

Frederik van der Bom
Plant Production Systems - PPS 70424
50
MS
c.
I
nt
er
ns
hi
p
Re
po
rt
–
N
2A
fr
ic
a
|
So
ya
N
i
Pe
sa
Figure 19 Distribution of land available to households for farming (% of households within a given category of landholding size).
Two out of three households indicated they left land fallow during the cropping season. The vast
majority of farmers that left land fallow, 73.1%, usually did so for one year (Table 10), although
almost a quarter indicated not to cultivate their land two years.
Table 10 The number of years land is left fallow.
years % 1 73.1 2 23.1 3 0.0 4 3.8
Maize and beans were typically the dominant crops in all farming systems (Table 11). Almost
85% of the households solely included a combination of the two in their rotation scheme.
Table 11 Crop rotation schemes. Start of rotation indicated to be the first season after fallow.
Crop 1st crop 2nd crop 3rd crop 4th crop Beans 51.3 41 2.6 0 Chickpea 0 0 0 2.6 Groundnut 2.6 0 2.6 0 Maize 41 51.3 2.6 0 Onion 0
2.6 0
Sunflower 0 2.6 5.1 0 Wheat 0 0 0 2.6 Nonea 0 5.1 84.6 94.9 Hired landb 5.1 0 0 0 aNo rotation of no 3rd or 4th crop included in the rotation scheme bFarmers that indicated to hire new land each year and hence do not use a rotation.
0
5
10
15
20
25
30
35P
erc
en
tag
e o
f h
ou
seh
old
s
Total available area for cropping

51 Chapter 7. Characteristics of farmers in the villages of Ikondo and Nyave in Njombe
region in the Southern Highlands of Tanzania.
MS
c.
I
nt
er
ns
hi
p
Re
po
rt
–
N
2A
fr
ic
a
|
So
ya
N
i
Pe
sa
A third of all farmers indicated not to own any land with plantation trees (Figure 20Error!
Reference source not found.). Over half of all households owned less than one hectare. The
largest area with plantation trees was equal to 2.4 hectares. Only 7.7% of all households had
access to a pasture or common grounds for grazing and 38.5% had access to wood lots or forest
lands.
Figure 20 Amount of land owned with plantation trees (% of households within a given category).
F. Crop production
As could already be observed in Table 11 crop production is mostly limited to maize and beans
(Table 12), although about one fifth of the households were also growing sunflower in at least a
small part of their fields. As can be seen in Figure 21 the amount of land sown with sunflower
was always less than one hectare, and even smaller than half an hectare in 62,5% of all cases,
whereas areas of maize and bean both went up to over 2,5 hectares. The average areas planted to
each crop were 0.98 ha in the case of maize, 1.0 ha for bean and 0.4ha for sunflower. All fields
were planted in monoculture. It can be concluded that bean was virtually the only legume that is
grown in the two villages, by almost all farmers.
Table 12 Percentage of households growing a specific crop (2013 season).
Crop % Beans 97.44 Finger Millet 5.13 Maize 100.00 Potato 2.56 Sunflower 20.51
0.0
5.0
10.0
15.0
20.0
25.0
30.0
Perc
en
tag
e o
f h
ou
seh
old
s
Area owned with plantation trees

Frederik van der Bom
Plant Production Systems - PPS 70424
52
MS
c.
I
nt
er
ns
hi
p
Re
po
rt
–
N
2A
fr
ic
a
|
So
ya
N
i
Pe
sa
Figure 21 Area of land planted to maize, bean and sunflower (% of households within a given category).
Table 13 provides an overview of the varieties of maize, bean and sunflower grown in the villages
of Ikondo and Nyave, and the percentage of households that indicated they were growing these
varieties. As can be seen 43.6% of all households grew the local variety of maize on at least part
of their land. In the case of beans only 7.9% of all farmers indicated they were growing a local
variety. Most farmers were growing the variety called ‘Soya’, which actually consists of two
cultivars: ‘Soya ndefu’ (tall/semi- climbing) and ‘Soya fupi’ (short/bush). Unfortunately these
could not be distinguished at the time of data collection. Finally, three out of four sunflower
farmers were growing Black Record, a variety recommended by CEFA.
.0
10.0
20.0
30.0
40.0
50.0
60.0
70.0P
erc
en
tag
e o
f h
ou
seh
old
s
Area planted to each crop (ha)
Maize
Bean
Sunflower

53 Chapter 7. Characteristics of farmers in the villages of Ikondo and Nyave in Njombe
region in the Southern Highlands of Tanzania.
MS
c.
I
nt
er
ns
hi
p
Re
po
rt
–
N
2A
fr
ic
a
|
So
ya
N
i
Pe
sa
Table 13 The varieties of maize, bean and sunflower grown in the villages of Ikondo and Nyave, and the percentage of households growing them.
Variety % Maize
DK8053 2.6 Hybrid (not specified) 23.1 Local 43.6 Pannar691 7.7 UH628 2.6 UH6303 23.1
Bean Kigoma 13.2
Local 7.9 Msusu 2.6 Muhanga 18.4 Rosekoko 5.3 Salundi 31.6 Sewolo 13.2 Soya 78.9
Sunflower Black Record 75.0
Local 25.0
Many farmers used some form of organic inputs for the cultivation of their crops, usually by
incorporating the remains of the previous cropping season (Table 14). Only few farmers used
mineral fertiliser (DAP) in maize or beans.
Table 14 The use of organic and mineral fertilisers in maize, bean and sunflower (% of households using).
Input type Maize Bean Sunflower Average Farmyard manure 10.3 2.6 0.0 4.3 Incorporate remains 51.3 26.3 75.0 50.9 Slash/Burn 35.9 60.5 25.0 40.5 Mineral fertilizer 2.6a 2.6a 0.0 0.0 aAll farmers indicated they used DAP
In approximately two out of three families both husband and wife took care of the crops (Table
15). No differences could be distinguished between Maize and beans.
Table 15 Crop management (% of who is taking care in the household).
Manager Maize Bean Sunflower Average Both 64.1 63.2 75.0 67.4 Husband 25.6 23.7 12.5 20.6 Wife 10.3 13.2 12.5 12.0
G. Nutrition
Of all households 85% indicated they had grown legumes in the previous season (all beans). On
average about one quarter (25.2%) was kept for seeds or consumed within the household. In the
majority of cases, leftovers in the field were incorporated in the next season (39.5%), burned

Frederik van der Bom
Plant Production Systems - PPS 70424
54
MS
c.
I
nt
er
ns
hi
p
Re
po
rt
–
N
2A
fr
ic
a
|
So
ya
N
i
Pe
sa
(28.9%) or a combination of the two (2.6%) (Table 16). Sometimes haulms were used as feed for
livestock (15.8%). Finally, 10.5% of the households indicated remains were simply left in the
field, usually related to the fact that land was hired for one year.
Table 16 Use of legume haulms (% of haulms used for a given purpose).
Haulm use % Burn 28.9 Feed 15.8 Home garden 2.6 Incorporate next year 39.5 Leave in field 10.5 Partly burn, partly Incorporate 2.6
Table 17 provides a list of items that were indicated to be the most important foods consumed in
the household. Beans and mboga (leaf vegetable) were very popular ingredients, usually eaten as
a side dish with maize (Ugali). Meat was mentioned by 59% of the households. Other popular
non-legume food items include banana, cassava, potato and rice. 5% of the households indicated
food shortage was a problem once every so many years.
Table 17 Most important foods in household nutrition.
Item % Avocado 5.1 Banana 76.9 Beans 94.9 Cabbage 2.6 Cassava 46.2 Egg 2.6 Finger millet 2.6 Fruit 7.7 Maize 100.0 Mboga (Leaf vegetable) 79.5 Meat 59.0 Pineapple 2.6 Potato 33.3 Rice 53.8 Tomato 2.6 Yams 2.6
Discussion
Sampling should always be done randomly but as mentioned in materials and methods because of
a lack of demographic information it was difficult to prevent bias. By collecting the characteristics
of at least five households in each neighbourhood, and including both participants and non-
participants of the SnP project it was aimed to minimize this bias. Nevertheless, given that the
method of data collection some bias will always be inevitable.
No GPS data of homesteads were collected, because there was no GPS available. Field sizes were
also not physically measured. It is likely that in some cases farmers may not have been able to
accurately estimate the exact size of their fields or simply did not know the exact size of their

55 Chapter 7. Characteristics of farmers in the villages of Ikondo and Nyave in Njombe
region in the Southern Highlands of Tanzania.
MS
c.
I
nt
er
ns
hi
p
Re
po
rt
–
N
2A
fr
ic
a
|
So
ya
N
i
Pe
sa
fields. Furthermore, sometimes it was observed that farmers did not include hired land when they
were asked how much land was available for cropping. In these cases, after discussing the areas
allocated to crops it would become clear more land was being used that originally indicated as
being available. Finally, in addition, for various reasons farmers may also just note willing to
accurately share size of their fields. Follow-up studies such as a more detailed farm
characterisation could provide more reliable information and make up for some weaknesses
caused by the way this data was collected.
Final comments
The data collected in the N2Africa baseline survey provides a powerful tool to identify farm types
and categorise farmers based on resource endowments. While talking to farmers it became very
apparent that wealth can be a major influence on what choices are made and how a farm is
managed. A general impression for instance was that better off farmers tend to be able to hire
more labour and cultivate a larger variety of crops than farmers with little resources. An even
more obvious observation would be that poor farmers that only have a very small area available
for cropping simply do not fallow because with not cropping a shortage of food would be
imminent.
A more thorough classification of farmers in the whole SnP project could result in a rich database
of information that may help to categorise the farmers targeted in the project. In turn a custom
approach could be developed to better target each category and promote the appropriate
technologies. Finally, all the collected data could help assessing the impact of technologies
towards the end of the project.

Frederik van der Bom
Plant Production Systems - PPS 70424
56
MS
c.
I
nt
er
ns
hi
p
Re
po
rt
–
N
2A
fr
ic
a
|
So
ya
N
i
Pe
sa

57 Chapter 8. Challenges and opportunities
MS
c.
I
nt
er
ns
hi
p
Re
po
rt
–
N
2A
fr
ic
a
|
So
ya
N
i
Pe
sa
Chapter 8. Challenges and opportunities
Currently a lot of maize and bean production takes place in the target areas. Maize is
clearly the number one crop and judging from farmers opinions it seems unlikely that it
will be replaced. At this moment soybean is therefore more likely to compete with bean
and sunflower. The price difference between bean and soybean, yields and cost of
production, will be important factors for farmers in their decision to cultivate either crop.
Furthermore, bean is also an important food crop for household consumption.
Market
The potential risk should be small enough or the potential profits large enough for farmers
to venture into soybean production. With the history of failing markets, market linking
will be essential for farmers’ trust and the market for soybean would need likely to be
larger than the one for beans. Hence, the marketing side of the project will have a major
impact on the response of farmers for the next year.
The price of bean in Ikondo and Nyave is usually between 15.000 and 22.000 TZSH per
debe (1 debe = 20 kg). Because of difficulties of transporting their harvest themselves,
farmers are at the mercy of middlemen who tend to buy at low prices (or buy pre-harvest
at an even lower price) and make large profits by selling in the city. Farmer income would
greatly benefit from cutting out these middlemen.
Storage
The price of beans tends to increase with time after harvest. Therefore initial storage
before marketing the produce could be an opportunity for increasing profitability. CEFA
indicated they would be interested in starting cooperatives for this purpose in Ikondo, but
they will be backing out of Ikondo by the end of 2013 and are therefore focussed on
sustainability of the current projects.
Inoculants
The workshop about inoculants provided lots of valuable information, but it seems not all
of the information reached its audience. Some basic knowledge about the product and
how to handle it is vital when supporting local farmers. A rethink on how to ensure
effective communication.

Frederik van der Bom
Plant Production Systems - PPS 70424
58
MS
c.
I
nt
er
ns
hi
p
Re
po
rt
–
N
2A
fr
ic
a
|
So
ya
N
i
Pe
sa
Distribution in 2.5 kg bags comes with contamination risk related to the further dividing
into smaller portions that are distributed to farmers. Small sterile packages of for instance
40 g could instantly solve the sterility concerns related to the distribution.
Demo plots
Demo plots are clearly a strong tool to visualise proposed management and to convince
farmers, but only if they are set up properly. There is an absolute need of a better
understanding and higher sense of conviction to set all of them properly next time. This
may also improve FEO efficiency in convincing and supporting local farmers, as they will
be backed up with visual evidence to support their claims. A Minjingu rock phosphate
treatment with and without the combination with inoculation still provides opportunities
to further explore local management options.
Field measurements
Fields measurements have been a drama but can be improved easily. There are powerful
gps tools that allow very accurate area measurements, just by walking around a field. A
gps tool was supplied in fact, but in the form of a usb-stick. This is not practical because
it demands to be used in combination with a laptop that would have to be carried around
the field. A tool in the form of a pda could likely solve all field measurement problems.
Not only would the collected data be more reliable, collecting it can be done in a fraction
of the time that is currently spent on it. This would be especially interesting with the
number of fields in the project increasing substantially in the next seasons.
Transport
The FEOs cannot be expected to travel over 40 km a day and do a good job if they are not
provided with some reliable availability of a mode of transport. The continuously
returning problem of arranging and waiting for a motorcycle is clearly a burden and
reduces motivation. FEO approach toward the issue is worrisome however. A more
proactive attitude needs to be stimulated.
FEOs
FEOs were supplied with the tools and information to support them in their tasks and they
receive a lot of freedom to fill in their jobs. However, it seems a higher awareness of what
is expected is still needed. Lembris’ work corrected many of the issues not addressed or
observed by FEOs, but this will become infeasible as the project expands. Therefore there
is an absolute need for improvement. Possibly their job needs a stricter form of protocol.

59 Chapter 8. Challenges and opportunities
MS
c.
I
nt
er
ns
hi
p
Re
po
rt
–
N
2A
fr
ic
a
|
So
ya
N
i
Pe
sa
For instance, supply them with a modem and demand a weekly status update and
schedule.
Most data that is collected is still provided in hard copy, where in fact all FEOs were
supplied with a brand new computer. They did not get a computer to play games (during a
meeting!) and it is justified to demand the supplied software and tools to be used, and
reporting to be shared digitally. This would also greatly improve Lembris' work. Visiting
villages to chase every FEO for their data, checking the validity and hiring farmer
volunteers will become unfeasible with more than the current 300 farmers.
Administrative capacity and work ethics are of far higher importance than for instance a
degree in agriculture. Some relevant knowledge can be picked up in the field, and issues
such as disease can easily be addressed by communicating with or sending in an
agricultural expert from elsewhere in the project. The volunteers in Ruvuma essentially
did a better job in collecting field data than their (educated) FEOs, i.e. hire motivated and
innovative people, rather than people with a degree.
It is striking that a farmer volunteer in Ruvuma was able to extensively document 27
locations/households in a matter of a week, whereas a full-time FEO was unable to do this
in a far longer timeframe. The lack of interest in fieldwork is concerning. The impression
is that the FEOs expected to become manager and have trouble coping with the realities
of an everyday job. There is an absolute need to improve and support their work ethics.
Office location
The main activities take place in the Southern Highlands, but CRS office is located in Dar
es Salaam. A lot of costs are involved in flying and driving back and forth. It would make
more sense to have an office location in Songea for instance, the region where most
farmers are located. This would also improve communication with the local partner
organizations.
Costs and returns
Collection of data on costs of labour, inputs etc. and comparing different management
options can result in an accurate set of tools to provide different farmers with different
endowments with a custom advice.

Frederik van der Bom
Plant Production Systems - PPS 70424
60
MS
c.
I
nt
er
ns
hi
p
Re
po
rt
–
N
2A
fr
ic
a
|
So
ya
N
i
Pe
sa
References
Amijee, F. & Giller, K. E. (1998) Environmental constraints to nodulation and nitrogen fixation
of Phaseolus vulgaris L. in Tanzania. I. A survey of soil fertility, root nodulation and
multi-locational responses to Rhizobium inoculation. African Crop Science journal, 6,
159-169.
Chowdhury, M. S., Msumali, G. P. & Malekela, G. P. (1983) Need for Seasonal Inoculation of
Soybeans with Rhizobia at Morogoro, Tanzania. Biological Agriculture & Horticulture,
1, 219-228.
FAO (2012) Land Degradation. SOLAW Thematic Report.
Giller, K. E. (2001) Nitrogen fixation in tropical cropping systems. CAB Int, Wallingford.
Giller, K. E., Amijee, F., Brodrick, S. J. & Edje, O. T. (1998) Environmental constraints to
nodulation and nitrogen fixation of Phaseolus vulgaris L. in Tanzania. II. Response to N
and P fertilizers and inoculation with Rhizobium. African Crop Science journal, 6, 171-
178.
Giller, K. E., Murwira, M. S., Dhliwayo, D. K. C., Mafongoya, P. L. & Mpepereki, S. (2011)
Soyabeans and sustainable agriculture in Southern Africa. International Journal of
Agricultural Sustainability, 9, 50-58.
Hardarson, G. & Atkins, C. (2003) Optimising biological N2 fixation by legumes in farming
systems. Plant and Soil, 252, 41-54.
Hungria, M. & Vargas, M. A. T. (2000) Environmental factors affecting N2 fixation in grain
legumes in the tropics, with an emphasis on Brazil. Field Crops Research, 65, 151-164.
Kaizzi, K. C., Byalebeka, J., Semalulu, O., Alou, I. N., Zimwanguyizza, W., Nansamba, A.,
Odama, E., Musinguzi, P., Ebanyat, P., Hyuha, T., Kasharu, A. K. & Wortmann, C. S.
(2012) Optimizing smallholder returns to fertilizer use: Bean, soybean and groundnut.
Field Crops Research, 127, 109-119.

61 References
MS
c.
I
nt
er
ns
hi
p
Re
po
rt
–
N
2A
fr
ic
a
|
So
ya
N
i
Pe
sa
Kaschuk, G., Hungria, M., Andrade, D. S. & Campo, R. J. (2006) Genetic diversity of rhizobia
associated with common bean (Phaseolus vulgaris L.) grown under no-tillage and
conventional systems in Southern Brazil. Applied Soil Ecology, 32, 210-220.
Malema, B. A. (2005) Soya bean production and utilization in Tanzania. (eds H. S. Laswai, F. A.
Myaka & G. Kirenga). Ministry of Agriculture, Food security and Cooperatives, Crop
Development Division, Crop Promotion Services (CPS).
Ministry of Agriculture Food Security and Cooperatives (no date) Tanzania agroecological zones.
N2Africa (2012) Training modules for CRS Staff. Module 7.
N2Africa (no date) N2Africa.org.
Ndakidemi, P. A., Dakora, F. D., Nkonya, E. M., Ringo, D. & Mansoor, H. (2006) Yield and
economic benefits of common bean (Phaseolus vulgaris) and soybean (Glycine max)
inoculation in northern Tanzania. Australian Journal of Experimental Agriculture, 46,
571-577.
Ojiem, J. O., Vanlauwe, B., De Ridder, N. & Giller, K. E. (2007) Niche-based assessment of
contributions of legumes to the nitrogen economy of Western Kenya smallholder farms.
Plant and Soil, 292, 119-135.
Okalebo, J. R., Othieno, C. O., Woomer, P. L., Karanja, N. K., Semoka, J. R. M., Bekunda, M.
A., Mugendi, D. N., Muasya, R. M., Bationo, A. & Mukhwana, E. J. (2006) Available
technologies to replenish soil fertility in East Africa. Nutrient Cycling in Agroecosystems,
76, 153-170.
Rozelle, S. & Swinnen, J. F. M. (2004) Success and Failure of Reform: Insights from the
Transition of Agriculture. Journal of Economic Literature, 42, 404-456.
Sanchez, P. A. (2002) Soil fertility and hunger in Africa. Science, 295, 2019-2020.
Sanchez, P. A., Shepherd, K. D., Soule, M., Place, F., Mokwunye, A., Buresh, R., Kwesiga, F.,
Izac, A.-M., Ndiritu, C. & Woomer, P. (1997) Soil fertility replenishment in Africa: An

Frederik van der Bom
Plant Production Systems - PPS 70424
62
MS
c.
I
nt
er
ns
hi
p
Re
po
rt
–
N
2A
fr
ic
a
|
So
ya
N
i
Pe
sa
investment in natural resource capital. In R.J. Buresh et al. (ed.) Replenishing soil fertility
in Africa. SSSA Spec. Pub. 51. SSSA, Madison, WI, 1-46.
Smaling, E., Nandwa, S. & Janssen, B. (1997) Soil fertility in Africa is at stake. In R.J. Buresh et
al. (ed.) Replenishing soil fertility in Africa. SSSA Spec. Publ. 51. SSSA, Madison,WI, 47-
61.
Smithson, J., Edje, O. & Giller, K. (1993) Diagnosis and correction of soil nutrient problems of
common bean ( Phaseolus vulgaris) in the Usambara Mountains of Tanzania. The Journal
of Agricultural Science KW -, 120, 233-240.
Tanzania National Website (no date) 2002 Population and Housing Census General Report.

63 Appendices
MS
c.
I
nt
er
ns
hi
p
Re
po
rt
–
N
2A
fr
ic
a
|
So
ya
N
i
Pe
sa
Appendices
Figure 22 Road map of Njombe.
Figure 23 Road map of Songea.

Frederik van der Bom
Plant Production Systems - PPS 70424
64
MS
c.
I
nt
er
ns
hi
p
Re
po
rt
–
N
2A
fr
ic
a
|
So
ya
N
i
Pe
sa
Analysis of variance
Variate: Average_nodule_score Source of variation d.f. s.s. m.s. v.r. F pr. Location stratum 5 21.1570 4.2314 5.08 Location.*Units* stratum Spacing 1 0.8578 0.8578 1.03 0.317 treatment 3 20.8488 6.9496 8.34 <.001 Spacing.treatment 3 2.9761 0.9920 1.19 0.327 Residual 35 29.1636 0.8332 Total 47 75.0033
Tables of means
Variate: Average_nodule_score Grand mean 1.23 Spacing Farmer Recommended 1.36 1.10 treatment 0 DAP DAP+I I 0.25 1.03 1.95 1.69 Spacing treatment 0 DAP DAP+I I Farmer 0.33 0.78 2.35 2.00 Recommended 0.17 1.28 1.56 1.39
Standard errors of differences of means
Table Spacing treatment Spacing treatment rep. 24 12 6 d.f. 35 35 35 s.e.d. 0.264 0.373 0.527

65 Appendices
MS
c.
I
nt
er
ns
hi
p
Re
po
rt
–
N
2A
fr
ic
a
|
So
ya
N
i
Pe
sa
Analysis of variance
Variate: Germination_percentage Source of variation d.f. s.s. m.s. v.r. F pr. Method stratum 1 12.50 12.50 0.39 Method.*Units* stratum Lot_no 1 4355.56 4355.56 137.54 <.001 Residual 5 158.33 31.67 Total 7 4526.39
Tables of means
Variate: Germination_percentage Grand mean 26.2 Lot_no 149 208 2.9 49.6
Standard errors of differences of means
Table Lot_no rep. 4 d.f. 5 s.e.d. 3.98
Least significant differences of means (5% level)
Table Lot_no rep. 4 d.f. 5 l.s.d. 10.23

Frederik van der Bom
Plant Production Systems - PPS 70424
66
MS
c.
I
nt
er
ns
hi
p
Re
po
rt
–
N
2A
fr
ic
a
|
So
ya
N
i
Pe
sa
N2Africa Baseline Survey
Date of interview: _____/______/2012
Country: ___________________
Enumerator: ________________________
Action site (District/County/…): __________________
Village: _____________________
Homestead coordinates (decimal degrees)
Latitude: _____________ Longitude:______________ Altitude: _____________
Introduction
Introduce yourself and the N2Africa project. Explain the purpose of the survey and assure the
interviewee of the confidentiality. Please check if the farmer has any questions at this time.
A. Demographic information
A.1.Name of respondent: _________________________________
A.2. Total number of adults and children in the household
Adults: _________ Children (16 years or younger):__________
A.3. Gender of the household head: Male____ / Female____
A.3. Is anyone in your household affiliated to a community organisation? Yes/ No
If yes, please fill the table below:
Name of the organisation Purpose/objective of the organisation
1.
2.
3.
A.4. What is the highest schooling level completed by a person in the household (tick)?
1. Primary: ________ 2. Secondary:_________
3. Post-secondary: __________ 4. College / University:__________
5. Informal / other:__________ 6. None:_______

67 Appendices
MS
c.
I
nt
er
ns
hi
p
Re
po
rt
–
N
2A
fr
ic
a
|
So
ya
N
i
Pe
sa
B. Income
B.1. What is the most important source of household income (please tick):
1) Cropping _____ 2) Livestock ____ 3) Trade ____
4) Off-farm income ____ 5) Remittances ____
6) Other (specify): _________________________
B.2. Can you estimate the portion of the cash income in your household coming from farm
activities and from off-farm sources? Choose what best describes your situation:
Tick
1) All income from farming
2) Most from farming, a small part from off-farm sources
3) About half-half from farming and off-farm
4) More from off-farm sources and less from farming
5) No Income from farming, all from off-farm sources
B.3. Please specify any income generating activities outside farming:
________________________________________________________
B.4. What are the two most expensive goods in the household (e.g. radio, bicycle, car,…)?
1.___________________________ 2.___________________________
C. Labour
C.1. Do you or your family members work on other people’s land for cash or food? 1)
Yes______ 2) No______
C.2. Do you or your family members hire labour to work on your farm?
1) Yes ___ 2) No ___
If yes, indicate in which crops hired labour is used:
____________________________________

Frederik van der Bom
Plant Production Systems - PPS 70424
68
MS
c.
I
nt
er
ns
hi
p
Re
po
rt
–
N
2A
fr
ic
a
|
So
ya
N
i
Pe
sa
D. Livestock ownership
Please indicate the number of livestock owned or taken care off in the household
Owned Cared for, but not
owned
Owned
Cattle (total) Chicken
Dairy cows Guinea fowls
Oxen Guinea pigs
Sheep Rabbits
Goats Bees
Donkeys Other (specify)
_____________
Pigs
E. Land use
E.1. Total amount of arable land available for cropping, including fallow land, but excluding
plantations and grazing land (indicate ha or acres): ______________
E.2. Do you leave land fallow during the cropping season?
1) Yes:____ 2) No:______
If yes, how long is a field typically left fallow (years): ____________
E.3. Please describe one or two typical crop rotations, starting for instance when land has been
cleared / burned for planting after a fallow period
Rotation 1
Principle crop Second crop Third crop
Season 1
Season 2
Season 3
Season 4
Rotation 2
Principle crop Second crop Third crop
Season 1
Season 2
Season 3
Season 4

69 Appendices
MS
c.
I
nt
er
ns
hi
p
Re
po
rt
–
N
2A
fr
ic
a
|
So
ya
N
i
Pe
sa
E.4. How much land do you own with plantation trees (indicate ha or acres)? _______________
E.5. Do you have access to pastures for grazing? 1) Yes____ 2) No____
E.6. Do you have access to wood lots / forest land? 1) Yes_____ 2) No____
F. Crop production
Please fill the table below for the main arable and plantation crops grown on the farm (exclude
small vegetable gardens etc.)
Crop Area with
this crop
(ha or
acres)
Variety Animal
manure
applied
(Yes/No)?
Other organic
input applied? If
yes, specify type
Mineral fertiliser
applied? If yes,
specify type
Who manages
the crop (wife,
husband, both
husband and wive,
other)? Cowpea
Groundnut
Soybean
Other legume
(specify)
__________
Cassava
Rice
Banana
Rubber
Palm oil
Maize
Other non-
legume crop
(specify)
__________
Other non-
legume crop
(specify)
__________

Frederik van der Bom
Plant Production Systems - PPS 70424
70
MS
c.
I
nt
er
ns
hi
p
Re
po
rt
–
N
2A
fr
ic
a
|
So
ya
N
i
Pe
sa
G. Legume Utilisation& Nutrition
G.1. Use of legume grain
How do you use legume grain?
Type of legume Total production in the
most recent season
(kg)
Amount used in the
household for
consumption / seed (kg)
Amount used for sale
(kg)
1
2
3
4
5
G.2.Use of legume haulms
How do you use legume haulms (E.g. as feed for own livestock, sale to other people,
incorporation in the soil at planting, burned in the field, etc.)
Type of legume How are the haulms used?
1
2
3
4
5
G.3. Nutrition
What are the most important food items consumed in your household?
1. 4.
2. 5.
3. 6.
Is food availability in the household ever not sufficient to satisfy demand of all members?
Yes/No
Please, thank the respondent for her/his time. Check if the farmer has any questions
at this time.

71 Appendices
MS
c.
I
nt
er
ns
hi
p
Re
po
rt
–
N
2A
fr
ic
a
|
So
ya
N
i
Pe
sa
ATTACHMENT E PERFORMANCE INDICATORS
Activity Indicator Target for
2013 Target for
2014 Target for
2015 Target for
2016
Demonstrate Improved Egg Production Techniques
Number of chicken coop demonstrations established
25 45 30 0
Number of chicken production units formed
625 1,125 750 0
Number of field agents trained in best practices for egg production
10 18 12 0
Number of individual chicken coops built
625 1,025 750 0
Number of women trained through demonstration chicken coops
650 1070 780
Demonstrate Improved Soybean Production Techniques
Number of farmers who receive training through demonstration plots
2,250 4,500 4,500 0
Number of soybean demonstration plots established
30 60 60 0
Establish Soybean Seed System
Number of farmers trained in quality seed production
2,250 4,500 4,500 0
Number of partial value coupons distributed to farmers
1,500 3,000 3,000 0
Volume (KG) of certified seed procured for seed production
10,000 20,000 30,000 0
Volume (KG) of seed produced by farmers for subsequent season
100,000 200,000 300,000 300,000
Facilitate Access to Storage Facilities
Number of storage facilities renovated
45 90 90 0
Percent of farmers groups accessing storage
50 50 50 50
Volume (MT) of storage space made available
2,500 5,000 5,000 5,000
Form and Train Savings and Internal Lending Communities
Number of Community Field Agents certified as Private Service Providers
34 8 8 0
Number of Community Field Agents trained
38 10 10 0
Number of Producer groups formed
60 120 120 0
Number of SILC groups formed 200 300 400 0
Link Farmers to Agro-dealer Networks
Number of agro-dealer networks identified and strengthened
4 4 4 0
Number of farmer groups receiving services from agro-dealers
60 120 120 0
Link Farmers to Existing Financial Opportunities
Dollar value of loans facilitated
25,000 50,000 50,000 100,000
Number of loans accessed by farmers
375 750 750 1,500
Link Farmers to Number of farmer groups 0 60 120 120

Frederik van der Bom
Plant Production Systems - PPS 70424
72
MS
c.
I
nt
er
ns
hi
p
Re
po
rt
–
N
2A
fr
ic
a
|
So
ya
N
i
Pe
sa
Market Information accessing market information
Link Farmers to Markets
Number of associations formed 0 6 12 12
Number of producer groups selling directly to formal buyers
0 60 120 120
Number of producer groups using radio and/or print advertisements to market their products
0 60 120 120
Number of written agreements between farmer groups and buyers
0 60 120 120
Train Producer Groups in Farm Management Skills
Number of farmers trained in marketing and agro-enterprise development, innovation, and sustainable production
2,250 4,500 4,500 0
Number of producer groups trained in developing business plans
60 120 120 0
Number of groups trained in developing natural resource management plans
60 120 120 150
Number of groups trained in improving quality of their produce
60 120 120 150
Result Indicator Baseline Final Target
Increased Agricultural Productivity
Percentage increase in volume of soybean harvested per hectare (yield) tba
TBD 30
Number of eggs produced by target chicken production units
TBD 13,600,000
Number of individuals benefiting directly from USDA-funded interventions
0 13,750
Number of women benefiting directly from USDA-funded interventions
0 4,750
Increased use of Improved Agricultural Techniques and Technologies
Number of hectares under improved techniques or technologies as a result of USDA assistance
TBD 22,500
Number of farmers and others who have applied new techniques or technologies as a result of USDA assistance
TBD 11,250
Increased Availability of Improved Inputs
Volume (MT) of soybean seed supplied to farmers
TBD 60
Volume (MT) of soybean seed produced by farmers
TBD 600
Number of farmers who received day-old chicks for egg production
TBD 2,500
Improved Infrastructure to Support On-Farm Production
Number of improved chicken coops built TBD 2,500
Increased Use of Financial Services
Number of farmers and others receiving financial services as a result of USDA assistance
TBD 3,375
Number of loans disbursed to farmers and others as a result of USDA assistance
TBD 6,800
Value of agricultural and rural loans provided with USDA assistance
TBD 225,000

73 Appendices
MS
c.
I
nt
er
ns
hi
p
Re
po
rt
–
N
2A
fr
ic
a
|
So
ya
N
i
Pe
sa
Increased Knowledge by Farmers of Improved Agricultural Techniques and Technologies
Number of farmers and others who have received training on improved agricultural techniques and technologies as a result of USDA assistance
TBD 11,250
Number of farmers who have knowledge about improved agricultural techniques and technologies
TBD 11,250
Improved Farm Management (Operations, Financial)
Number of farmers and others who have applied improved farm management practices (i.e. governance, administration, or financial management)
TBD 11,250
Improved Knowledge Regarding Farm Management
Number of farmers and others who have received training on improved farm management practices (i.e. governance, administration, or financial management) as a result of USDA assistance
TBD 11,250
Number of farmers demonstrating improved knowledge regarding farm management as a result of USDA assistance
TBD 9,000
Increased Access to Improved Market Information
Number of farmers who have access to at least one source of current agricultural market information
TBD 18,750
Expanded Trade of Agricultural Products (Domestic, Regional, and International)
Volume of trade (MT) in soybeans TBD 11,000
Volume of trade (number) in eggs TBD 10,600,000
Improved Quality of Post Production Agricultural Products
Volume of soybeans (MT) meeting buyer
standards TBD 11,000
Volume of eggs (number) meeting buyer
standards TBD 10,600,000
Increased Use of Improved Post Production Processing and Handling Practices
Percent of farmers that report using one or more improved post-production processing practice(s)
TBD 75
Improved Post-Harvest Infrastructure
Total increase in installed storage capacity (MT dry or cold storage) as a result of USDA assistance
TBD 750
Increased Access to Markets to Sell Agricultural Products
Number of distinct markets to which soybeans are sold
TBD 4
Number of distinct markets to which eggs are sold
TBD 96
Number of farmers bulking and selling produce
TBD 7,500
Improved Marketing of Agricultural Products
Percent of groups that use at least two forms of media to advertise their products (print, radio, etc.)
TBD 75
Improved Linkages Between Buyers and Sellers
Number of agreements signed (contracts, MOU, etc.) between buyers and sellers
TBD 7,500