South Africa: March 2015 tourism and migration statistics · Statistics South Africa P0351 Tourism...
23
170 Thabo Sehume Street, Pretoria 0002, Private Bag X44, Pretoria 0001, South Africa Tel: +27 12 310 8911, Fax: +27 12 321 7381, www.statssa.gov.za, [email protected] Statistical release P0351 Tourism and Migration March 2015 Embargoed until: 29 June 2015 14:30 Enquiries: Forthcoming issue: Expected release date: User Information Services April 2015 30 July 2015 Tel.: (012) 310 8600 / 4892 / 8390
Transcript of South Africa: March 2015 tourism and migration statistics · Statistics South Africa P0351 Tourism...

170 Thabo Sehume Street, Pretoria 0002, Private Bag X44, Pretoria 0001, South Africa Tel: +27 12 310 8911, Fax: +27 12 321 7381, www.statssa.gov.za, [email protected]
Statistical release P0351
Tourism and Migration
March 2015
Embargoed until:29 June 2015
14:30 Enquiries: Forthcoming issue: Expected release date:
User Information Services April 2015 30 July 2015 Tel.: (012) 310 8600 / 4892 / 8390
Statistics South Africa P0351
Tourism and migration, March 2015
1
Contents
Preface .................................................................................................................................................................... 2
1. Key findings .............................................................................................................................................. 3
1.1 Travellers .................................................................................................................................................... 3
1.1.1 Number of travellers ................................................................................................................................... 3
1.1.2 Mode of travel ............................................................................................................................................. 3
1.2 Tourists ....................................................................................................................................................... 4
1.2.1 Mode of travel ............................................................................................................................................. 4
1.2.2 Regional and national distribution............................................................................................................... 4
1.2.3 Purpose of visit ........................................................................................................................................... 5
1.2.4 Sex and age distribution ............................................................................................................................. 5
2. Figures ....................................................................................................................................................... 6
Figure 1 – Number of tourists from the ten leading overseas countries in March 2014 and March 2015 ................... 6
Figure 2 – Number of tourists from the ten leading Southern African Development Community (SADC)
countries in March 2014 and March 2015 .................................................................................................. 6
Figure 3 – Number of tourists from the ten leading ‘other’ African countries in March 2014 and March 2015 ........... 7
3. Tables ......................................................................................................................................................... 8
Table 1 – Number of South African residents and foreign travellers by travel direction ............................................ 8
Table 2 – Number of South African residents and foreign travellers by travel direction and mode of travel ............. 9
Table 3 – Number of tourists by country of residence and mode of travel ............................................................... 10
Table 4 – Number of tourists by country of residence and purpose of visit .............................................................. 14
Table 5 – Number of tourists from overseas, SADC and ‘other’ African regions by sex and age group ................. 18
4. Explanatory notes ................................................................................................................................... 19
4.1 Introduction ............................................................................................................................................... 19
4.2 Purpose of the statistical release .............................................................................................................. 19
4.3 Scope and coverage ................................................................................................................................. 19
4.4 Data .......................................................................................................................................................... 19
4.5 Limitations ................................................................................................................................................. 20
4.6 Definitions of terms ................................................................................................................................... 20
4.6.1 Definitions used by the United Nations World Tourism Organisation (UNWTO) ..................................... 20
4.6.2 Definitions used specifically in this release .............................................................................................. 20
4.7 Symbols used ........................................................................................................................................... 21
5. General information ................................................................................................................................ 21
Statistics South Africa P0351
Tourism and migration, March 2015
2
Preface This monthly statistical release provides information on South African residents and foreign travellers who entered
or left South Africa in March 2015. Specific focus is on foreign tourists who entered the country during this month.
The tourists are classified by region and country of residence. Details of their mode of travel; purpose of visit; and
age and sex distribution are also provided.
PJ Lehohla
Statistician-General
Statistics South Africa P0351
Tourism and migration, March 2015
3
1. Key findings
1.1 Travellers
1.1.1 Number of travellers
The routine data collected by the Department of Home Affairs’ (DHA) immigration officers at the ports of entry into
South Africa show that a total of 3 217 754 travellers (arrivals and departures) passed through South African ports
of entry in March 2015. As presented in Table 1 on page 8, these travellers were made up of 794 917 South
African residents and 2 422 837 foreign travellers. A further breakdown of the figures for South African residents
indicates that there were 384 922 arrivals, 409 260 departures and 735 travellers in transit. The corresponding
volume for foreign arrivals, departures and transit travellers was 1 235 571, 1 127 979 and 59 287 respectively.
A comparison between the movements in March 2014 and March 2015 indicates that the volumes of arrivals
increased for both South African residents and foreign travellers. While volumes of departures increased for South
African residents, they decreased for foreign travellers. Travellers in transit increased for both South African
residents and foreign travellers. The volume of arrivals for South African residents increased by 3,7% (from
371 169 in March 2014 to 384 922 in March 2015) while departures increased by 2,6% (from 398 947 in March
2014 to 409 260 in March 2015), and South African residents in transit increased by 36,6% (from 538 in March
2014 to 735 in March 2015). Foreign arrivals increased by 0,6% (from 1 227 853 in March 2014 to 1 235 571 in
March 2015), but departures decreased by 3,4% (from 1 167 962 in March 2014 to 1 127 979 in March 2015).
Foreign travellers in transit increased by 18,6% (from 49 972 in March 2014 to 59 287 in March 2015).
A comparison between the movements in February 2015 and March 2015 indicates that the volume of arrivals,
departures and travellers in transit increased for both South African residents and foreign travellers. The volume of
arrivals for South African residents increased by 18,8% (from 324 107 in February 2015 to 384 922 in March 2015),
departures increased by 25,7% (from 325 697 in February 2015 to 409 260 in March 2015) and South African
residents in transit increased by 35,1% (from 544 in February 2015 to 735 in March 2015). Foreign arrivals
increased by 9,0% (from 1 133 411 in February 2015 to 1 235 571 in March 2015), foreign departures increased by
11,7% (from 1 009 555 in February 2015 to 1 127 979 in March 2015), and foreign travellers in transit increased by
25,6% (from 47 194 in February 2015 to 59 287 in March 2015).
Detailed information on the departure of travellers is not available in the movement control system. Data on the
purpose of travel and the number of days South African residents intend to spend or spent abroad are not collected
by the DHA. Hence, it is not possible to categorise South African residents as tourists and non-tourists. However,
some data are available on foreign arrivals for this categorisation.
As presented in Table 1, in March 2015, 85 931 (7,0%) of foreign arrivals were classified as non-visitors while
1 149 640 (93,0%) were classified as visitors. The visitors were categorised into three groups:
i. Arrivals only – comprising visitors who entered the country in March 2015 but did not depart in March 2015
[265 068 (23,1%)];
ii. Single trips – visitors who came once in March 2015 and left in March 2015 [439 257 (38,2%)]; and
iii. Multiple trips – visitors who came and left more than once in March 2015 [445 315 (38,7%)].
Visitors were further grouped as same-day visitors and overnight visitors (tourists). In March 2015, there were
416 399 (36,2%) same-day visitors and 733 241 (63,8%) tourists. Between March 2014 and March 2015, the
volume of same-day visitors increased by 0,6% (from 413 711 in March 2014 to 416 399 in March 2015) while the
volume of tourists decreased by 2,5% (from 751 816 in March 2014 to 733 241 in March 2015). Likewise, between
February 2015 and March 2015, the volume of same-day visitors increased by 10,8% (from 375 938 in February
2015 to 416 399 in March 2015) and tourists increased by 7,6% (from 681 216 in February 2015 to 733 241 in
March 2015).
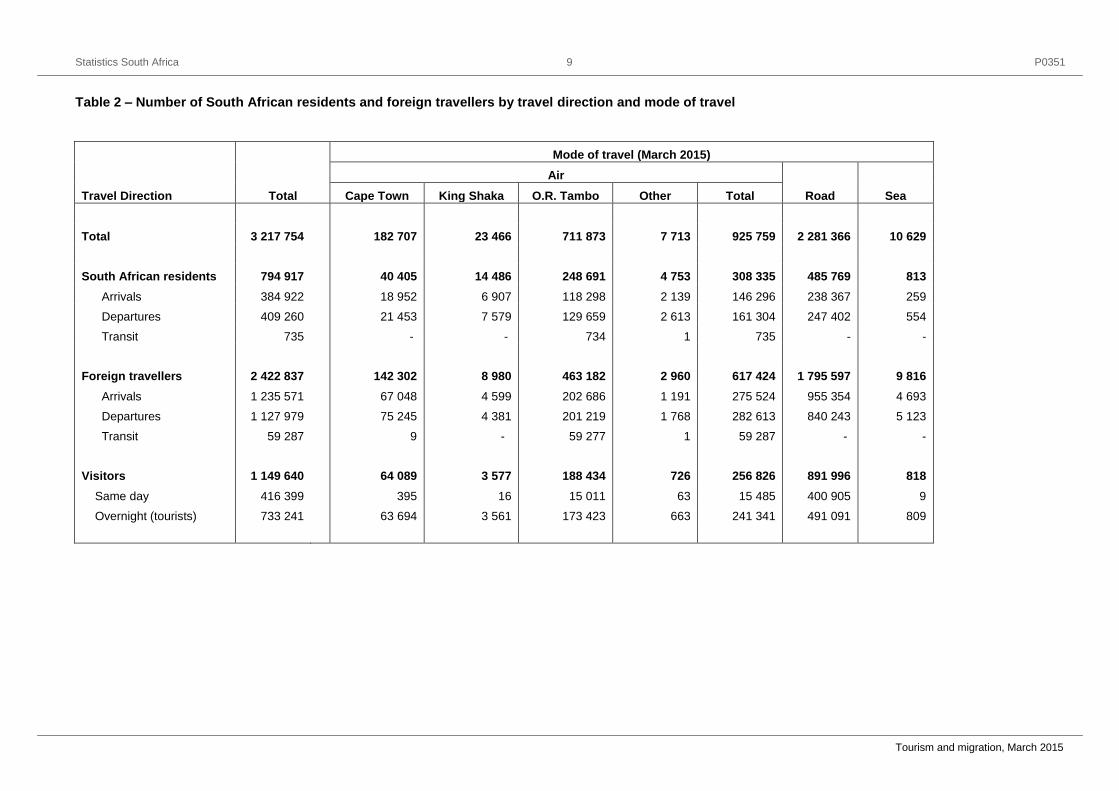
1.1.2 Mode of travel
Data presented in Table 2 on page 9 show that in March 2015, road transport was the most common mode of
travel used by 2 281 366 (70,9%) out of the 3 217 754 travellers. The total number of travellers who used air
Statistics South Africa P0351
Tourism and migration, March 2015
4
transport was 925 759 (28,8%). The arrivals data for South African residents show that 146 296 (38,0%) came by
air and 238 367 (61,9%) came by road. For departures, 161 304 (39,4%) and 247 402 (60,5%) used air and road
transport respectively. All South African travellers in transit used air transport (735).
In the case of foreign travellers, 275 524 (22,3%) arrived by air while 955 354 (77,3%) came by road. When
departing South Africa, 282 613 (25,1%) foreign travellers left by air whilst 840 243 (74,5%) left by road. All
travellers in transit, (59 287) used air transport. Table 2 further shows that an overwhelming majority [400 905 (96,
3%)] of same-day visitors arrived in the country by road. Only 15 485 (3,7%) of same-day visitors flew into the
country. Data on tourists show that 491 091 (67,0%) used road transport while 241 341 (32,9%) came by air.
1.2 Tourists
1.2.1 Mode of travel
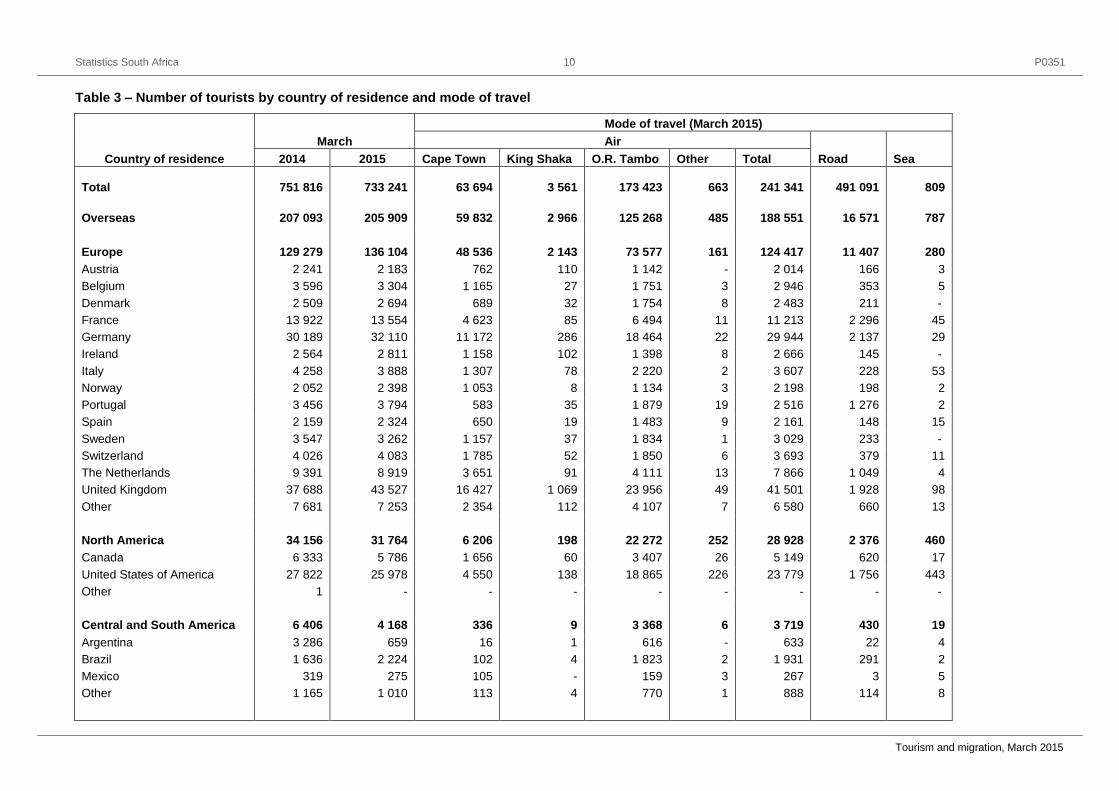
The country of residence of tourists is used to categorise them according to their respective countries and regions.
Information on the specific region and country of residence of the tourists and the mode of travel used to enter
South Africa is provided in Table 3 on page 10. In March 2015, 188 551 (91,6%) of overseas tourists arrived in the
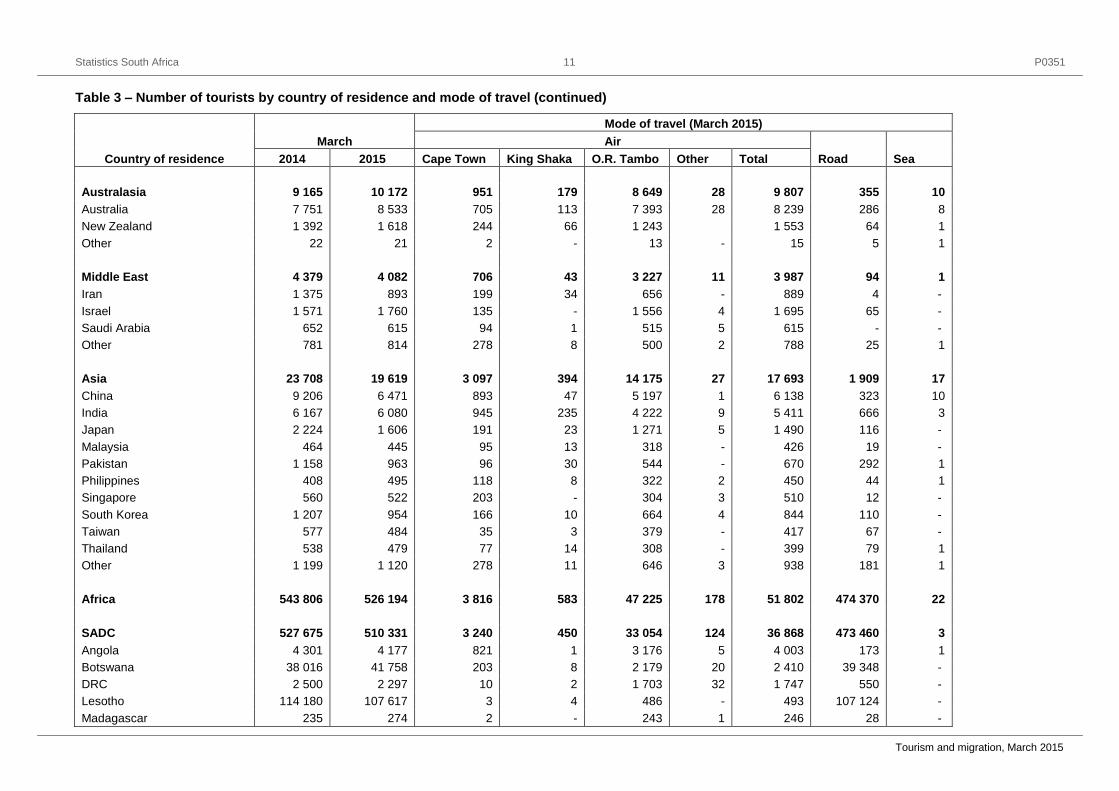
country by air whilst 16 571 (8,0%) came in by road. This is in contrast to the number of tourists from the Southern
African Development Community (SADC) countries who came into South Africa predominantly by road [473 460
(92,8%)]. Only 36 868 (7,2%) tourists from the SADC countries came in by air. The number of tourists who came
into South Africa by air from ‘other’ African countries was 14 934 (94,1%); with 910 (5,7%) using road transport.
1.2.2 Regional and national distribution
In March 2015, the distribution of overseas tourists was as follows; Europe, 136 104 (66,1%); North America,
31 764 (15,4%); Asia, 19 619 (9,5%); Australasia, 10 172 (4,9%); Central and South America, 4 168 (2,0%); and
Middle East, 4 082 (2,0%).
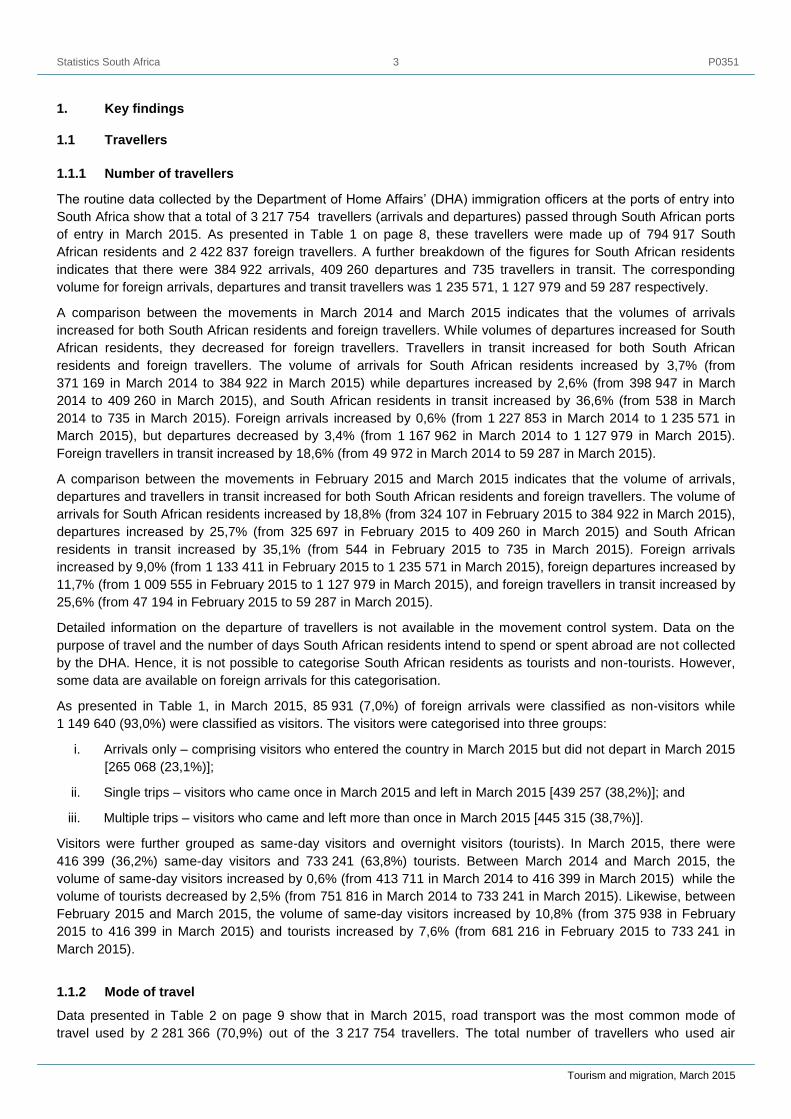
Data presented in Figure 1 on page 6 indicate that the United Kingdom (UK), 43 527 (21,1%); Germany, 32 110
(15,6%); United States of America (USA), 25 978 (12,6%); France, 13 554 (6,6%); The Netherlands, 8 919 (4,3%);
Australia, 8 533 (4,1%); China, 6 471 (3,1%); India, 6 080 (3,0%); Canada, 5 786 (2,8%) and Switzerland, 4 083
(2,0%) were the ten leading overseas countries visiting South Africa in March 2015. Tourists from these ten
countries constituted 75,3% of all tourists from overseas countries. A comparison between movements in March
2014 and March 2015 shows that the number of tourists increased in the UK, Australia, Germany and Switzerland
and decreased in the other six countries (China, Canada, USA, The Netherlands, France and India). The UK had
the highest increase of 15,5% (from 37 688 tourists in March 2014 to 43 527 in March 2015) while China had the
largest decrease of 29,7% (from 9 206 tourists in March 2014 to 6 471 in March 2015).
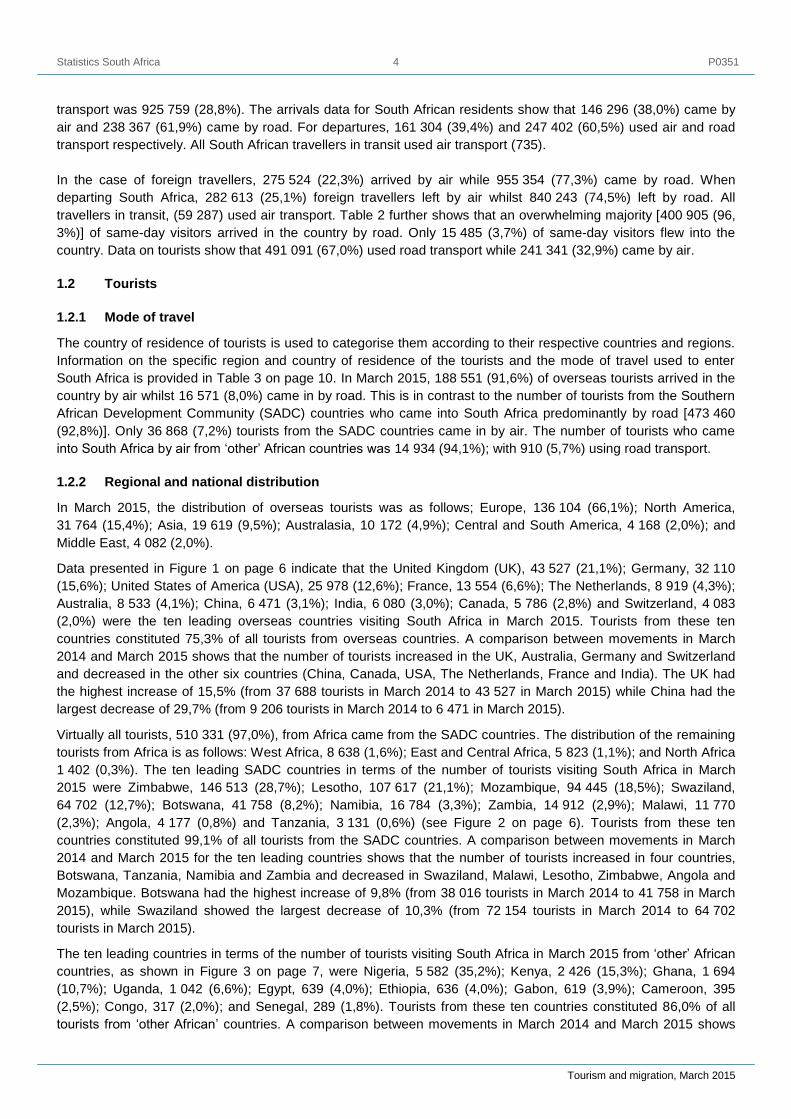
Virtually all tourists, 510 331 (97,0%), from Africa came from the SADC countries. The distribution of the remaining
tourists from Africa is as follows: West Africa, 8 638 (1,6%); East and Central Africa, 5 823 (1,1%); and North Africa
1 402 (0,3%). The ten leading SADC countries in terms of the number of tourists visiting South Africa in March
2015 were Zimbabwe, 146 513 (28,7%); Lesotho, 107 617 (21,1%); Mozambique, 94 445 (18,5%); Swaziland,
64 702 (12,7%); Botswana, 41 758 (8,2%); Namibia, 16 784 (3,3%); Zambia, 14 912 (2,9%); Malawi, 11 770
(2,3%); Angola, 4 177 (0,8%) and Tanzania, 3 131 (0,6%) (see Figure 2 on page 6). Tourists from these ten
countries constituted 99,1% of all tourists from the SADC countries. A comparison between movements in March
2014 and March 2015 for the ten leading countries shows that the number of tourists increased in four countries,
Botswana, Tanzania, Namibia and Zambia and decreased in Swaziland, Malawi, Lesotho, Zimbabwe, Angola and
Mozambique. Botswana had the highest increase of 9,8% (from 38 016 tourists in March 2014 to 41 758 in March
2015), while Swaziland showed the largest decrease of 10,3% (from 72 154 tourists in March 2014 to 64 702
tourists in March 2015).
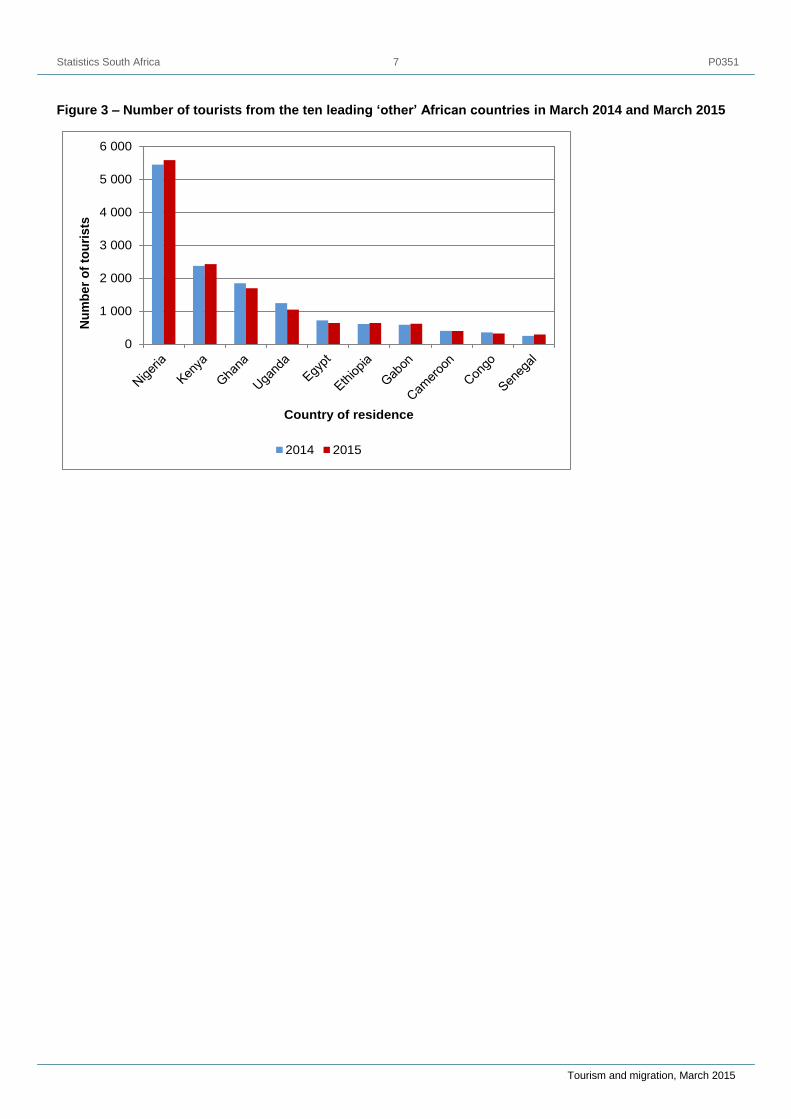
The ten leading countries in terms of the number of tourists visiting South Africa in March 2015 from ‘other’ African
countries, as shown in Figure 3 on page 7, were Nigeria, 5 582 (35,2%); Kenya, 2 426 (15,3%); Ghana, 1 694
(10,7%); Uganda, 1 042 (6,6%); Egypt, 639 (4,0%); Ethiopia, 636 (4,0%); Gabon, 619 (3,9%); Cameroon, 395
(2,5%); Congo, 317 (2,0%); and Senegal, 289 (1,8%). Tourists from these ten countries constituted 86,0% of all
tourists from ‘other African’ countries. A comparison between movements in March 2014 and March 2015 shows
Statistics South Africa P0351
Tourism and migration, March 2015
5
that of these ten leading ‘other African’ countries, the number of tourists increased in five countries, (Senegal,
Gabon, Ethiopia, Nigeria and Kenya) and decreased in the other five (Uganda, Egypt, Congo, Ghana and
Cameroon). Senegal had the highest increase of 17,5% (from 246 tourists in March 2014 to 289 in March 2015)
while Uganda showed the largest decrease of 16,2% (from 1 243 tourists in March 2014 to 1 042 in March 2015).
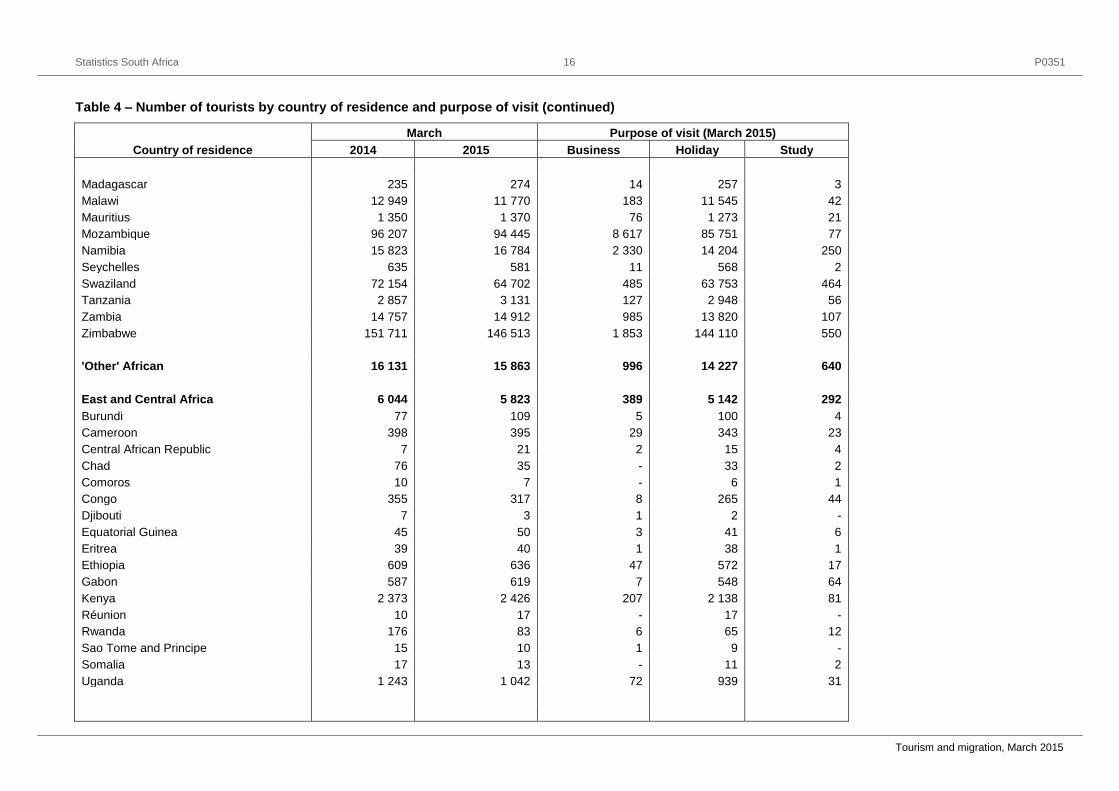
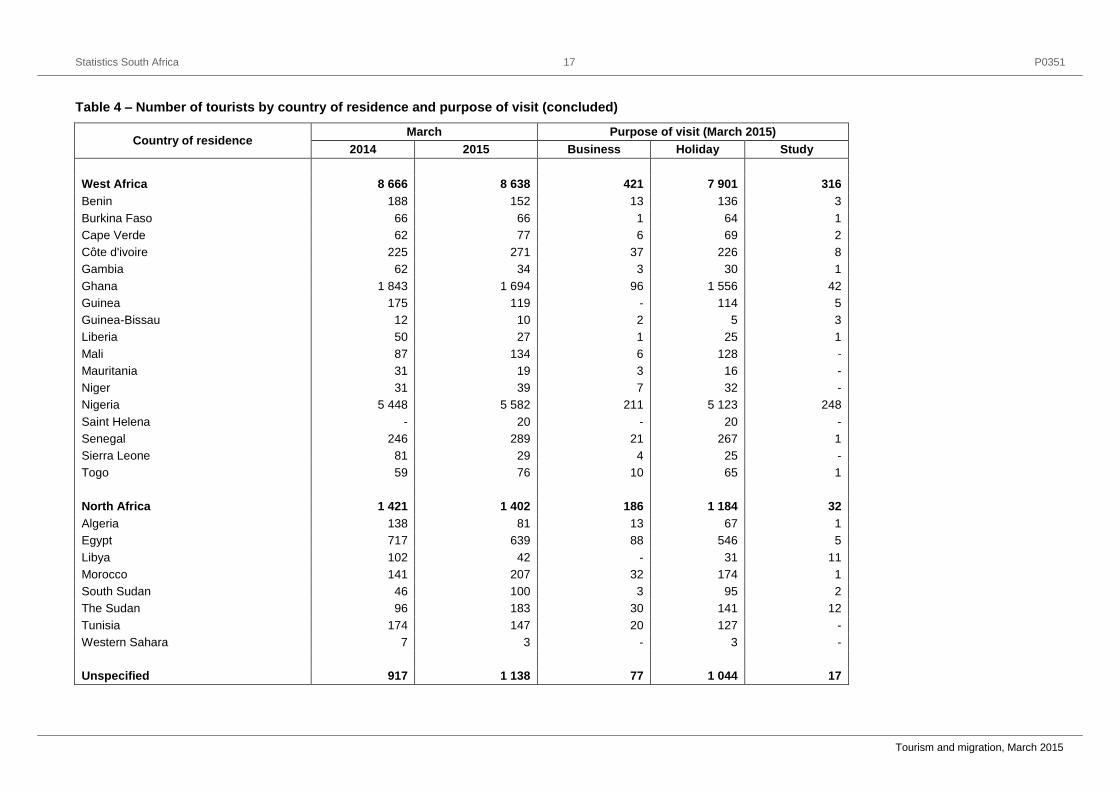
1.2.3 Purpose of visit
As observed from data shown in Table 4 on page 14, in March 2015, the majority of tourists, 702 709 (95,8%),
were in South Africa for holidays compared to 26 324 (3,6%) and 4 208 (0,6%) who were in South Africa for
business and for study purposes respectively. A detailed analysis reveals that of all the tourists from each of the
overseas regions, at least 91,0% came to South Africa for holidays. A total of 9 842 (96,8%) tourists from
Australasia; 4 029 (96,7%) from Central and South America; 30 617 (96,4%) from North America; 130 464 (95,9%)
from Europe; 3 816 (93,5%) from the Middle East and 17 862 (91,0%) from Asia were in South Africa for holidays.
Asia (8,1%) and the Middle East (5,8%) had the highest proportions of tourists who came to South Africa for
business. Asia had a higher proportion (0,8%) of student tourists compared to other overseas regions.
The majority of African tourists, 505 035 (96,0%) came to South Africa for holidays. However, there were
differences between tourists from the SADC countries and ‘other’ African countries namely:
Whereas 490 808 (96,2%) of tourists from the SADC countries were on holiday; 14 227 (89,7%) of tourists
from ‘other’ African countries came for the same purpose. Data on the regions of ‘other’ African countries
show that tourists on holidays constituted 91,5% (7 901); 88,3% (5 142) and 84,5% (1 184) for West Africa;
East and Central Africa and North Africa respectively.
Business persons constituted 6,3% (996) of tourists from ‘other’ African countries and 3,3% (16 701) from
the SADC countries. North Africa had the highest proportion, 13,3% (186) of its tourists in South Africa who
came for business purposes.
Students made up 4,0% (640) of tourists from ‘other’ African countries compared with 0,6% (2 822) from
the SADC countries. East and Central Africa had the highest proportion, 5,0% (292) of student tourists in
South Africa.
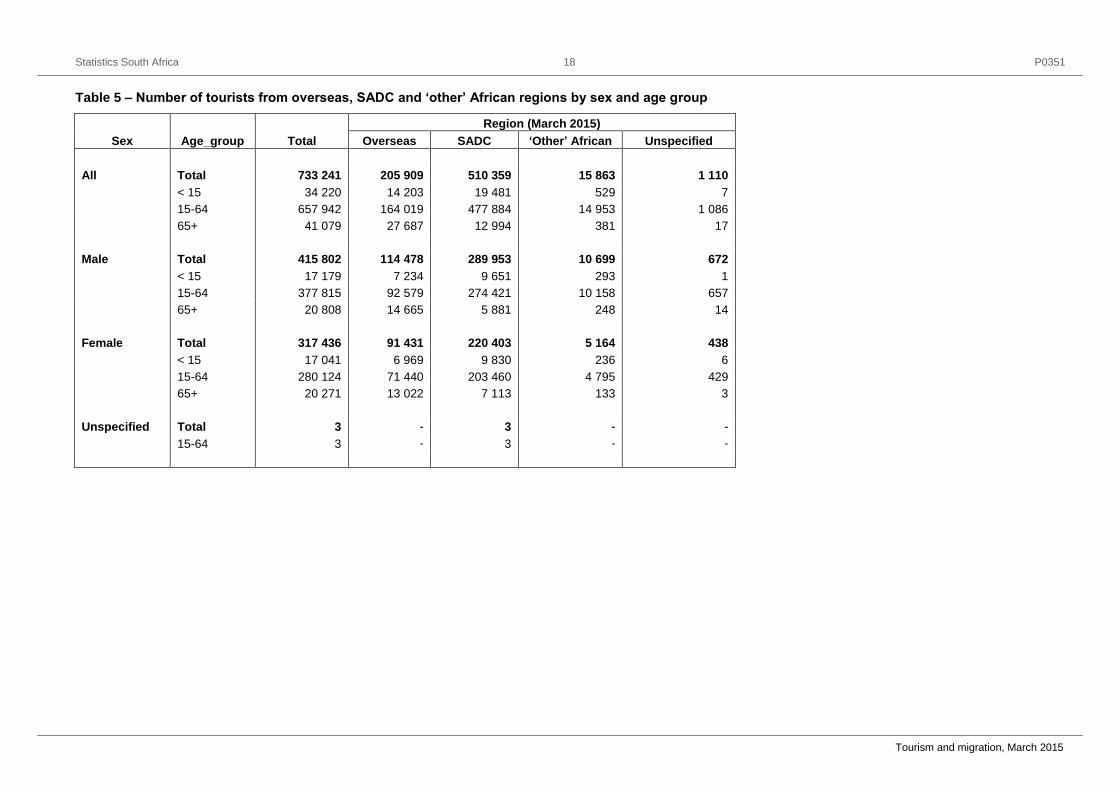
1.2.4 Sex and age distribution
Table 5 on page 18 shows that in March 2015, there were 415 802 (56,7%) male and 317 436 (43,3%) female
tourists. Overseas tourists were made up of 114 478 (55,6%) male tourists and 91 431 (44,4%) female tourists.
There were 289 953 (56,8%) male and 220 403 (43,2%) female tourists from the SADC countries. Tourists from
‘other’ African countries were made up of 10 699 (67,4%) male and 5 164 (32,6%) female tourists.
The ages of the tourists were categorised into three broad groups: those younger than 15 years, 15 to 64 years,
and 65 years and older. The overall results presented in Table 5 show that 34 220 (4,7%) tourists were aged less
than 15 years; 657 942 (89,7%) were aged between 15 and 64 years; and 41 079 (5,6%) were aged 65 years and
older.
Taking the regions of residence into consideration, the results further show that 164 019 (79,7%) of overseas
tourists were aged between 15 and 64 years compared with 477 884 (93,6%) and 14 953 (94,3%) of tourists in the
same age range from the SADC countries and ‘other’ African countries respectively. The proportion of tourists aged
less than 15 years, was slightly higher among tourists from overseas countries 6,9% (14 203) than among tourists
from SADC countries, 3,8% (19 481) and those from ‘other ‘ African countries, 3,3% (529).
A comparison of the three regions shows relatively higher proportions of the elderly among both male and female
tourists from overseas. Tourists aged 65 years and older comprised 12,8% (14 665) of male tourists and 14,2%
(13 022) of female tourists. This is in contrast to the pattern observed among tourists from the other two regions
where tourists aged 65 years and older comprised less than 4,0% of both male and female tourists. From the
SADC countries elderly tourists made up 2,0% (5 881) and 3,2% (7 113) of male and female tourists respectively;
while in ‘other African’ countries elderly tourists made up 2,3% (248) and 2,6% (133) of male and female tourists
respectively.
Statistics South Africa P0351
Tourism and migration, March 2015
6
2. Figures
Figure 1 – Number of tourists from the ten leading overseas countries in March 2014 and March 2015
0
5 000
10 000
15 000
20 000
25 000
30 000
35 000
40 000
45 000
50 000
Nu
mb
er
of
tou
ris
ts
Country of residence
2014 2015
Figure 2 – Number of tourists from the ten leading Southern African Development Community (SADC) countries in March 2014 and March 2015
0
20 000
40 000
60 000
80 000
100 000
120 000
140 000
160 000
Nu
mb
er
of
tou
ris
ts
Country of residence
2014 2015
Statistics South Africa P0351
Tourism and migration, March 2015
7
Figure 3 – Number of tourists from the ten leading ‘other’ African countries in March 2014 and March 2015
0
1 000
2 000
3 000
4 000
5 000
6 000
Nu
mb
er
of
tou
ris
ts
Country of residence
2014 2015

Statistics South Africa P0351
Tourism and migration, March 2015
8
3. Tables
Table 1 – Number of South African residents and foreign travellers by travel direction
Travel direction
March February March % Change % Change
2014 2015 2015 February 2015 – March 2015 March 2014 – March 2015
Total 3 216 441 2 840 508 3 217 754 13,3 0,04
South African residents 770 654 650 348 794 917 22,2 3,1
Arrivals 371 169 324 107 384 922 18,8 3,7
Departures 398 947 325 697 409 260 25,7 2,6
Transit 538 544 735 35,1 36,6
Foreign travellers 2 445 787 2 190 160 2 422 837 10,6 -0,9
Arrivals 1 227 853 1 133 411 1 235 571 9,0 0,6
Departures 1 167 962 1 009 555 1 127 979 11,7 -3,4 Transit 49 972 47 194 59 287 25,6 18,6
Foreign arrivals 1 227 853 1 133 411 1 235 571 9,0 0,6
Non-visitors 62 326 76 257 85 931 12,7 37,9
Visitors 1 165 527 1 057 154 1 149 640 8,7 -1,4
Visitors 1 165 527 1 057 154 1 149 640 8,7 -1,4
Arrivals only 333 391 307 187 265 068 -13,7 -20,5
Single trips 453 890 433 281 439 257 1,4 -3,2
Multiple trips 378 246 316 686 445 315 40,6 17,7
Visitors 1 165 527 1 057 154 1 149 640 8,7 -1,4
Same day 413 711 375 938 416 399 10,8 0,6
Overnight (tourists) 751 816 681 216 733 241 7,6 -2,5
Statistics South Africa P0351
Tourism and migration, March 2015
9
Table 2 – Number of South African residents and foreign travellers by travel direction and mode of travel
Travel Direction Total
Mode of travel (March 2015)
Air
Road Sea Cape Town King Shaka O.R. Tambo Other Total
Total 3 217 754 182 707 23 466 711 873 7 713 925 759 2 281 366 10 629
South African residents 794 917 40 405 14 486 248 691 4 753 308 335 485 769 813
Arrivals 384 922 18 952 6 907 118 298 2 139 146 296 238 367 259
Departures 409 260 21 453 7 579 129 659 2 613 161 304 247 402 554
Transit 735 - - 734 1 735 - -
Foreign travellers 2 422 837 142 302 8 980 463 182 2 960 617 424 1 795 597 9 816
Arrivals 1 235 571 67 048 4 599 202 686 1 191 275 524 955 354 4 693
Departures 1 127 979 75 245 4 381 201 219 1 768 282 613 840 243 5 123
Transit 59 287 9 - 59 277 1 59 287 - -
Visitors 1 149 640 64 089 3 577 188 434 726 256 826 891 996 818
Same day 416 399 395 16 15 011 63 15 485 400 905 9
Overnight (tourists) 733 241 63 694 3 561 173 423 663 241 341 491 091 809
Statistics South Africa P0351
Tourism and migration, March 2015
10
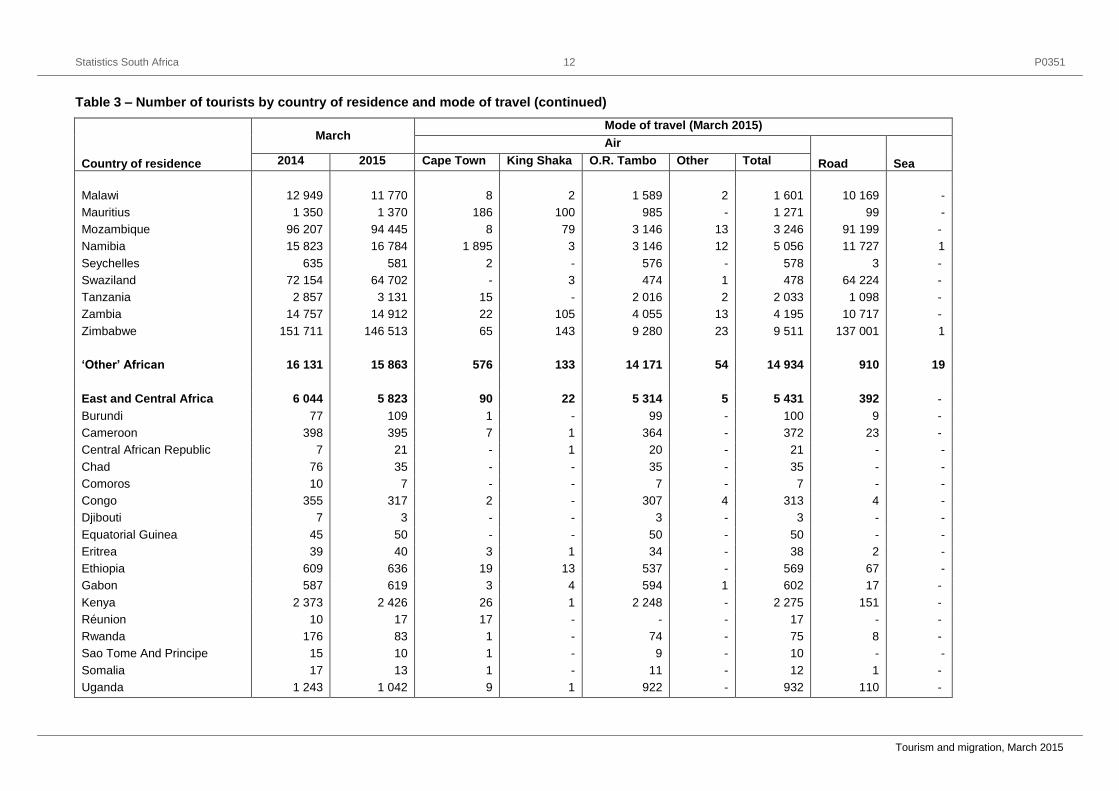
Table 3 – Number of tourists by country of residence and mode of travel
Country of residence
March
Mode of travel (March 2015)
Air
2014 2015 Cape Town King Shaka O.R. Tambo Other Total Road Sea
Total
751 816
733 241
63 694
3 561
173 423
663
241 341
491 091
809
Overseas 207 093 205 909 59 832 2 966 125 268 485 188 551 16 571 787
Europe 129 279 136 104 48 536 2 143 73 577 161 124 417 11 407 280
Austria 2 241 2 183 762 110 1 142 - 2 014 166 3
Belgium 3 596 3 304 1 165 27 1 751 3 2 946 353 5
Denmark 2 509 2 694 689 32 1 754 8 2 483 211 -
France 13 922 13 554 4 623 85 6 494 11 11 213 2 296 45
Germany 30 189 32 110 11 172 286 18 464 22 29 944 2 137 29
Ireland 2 564 2 811 1 158 102 1 398 8 2 666 145 -
Italy 4 258 3 888 1 307 78 2 220 2 3 607 228 53
Norway 2 052 2 398 1 053 8 1 134 3 2 198 198 2
Portugal 3 456 3 794 583 35 1 879 19 2 516 1 276 2
Spain 2 159 2 324 650 19 1 483 9 2 161 148 15
Sweden 3 547 3 262 1 157 37 1 834 1 3 029 233 -
Switzerland 4 026 4 083 1 785 52 1 850 6 3 693 379 11
The Netherlands 9 391 8 919 3 651 91 4 111 13 7 866 1 049 4
United Kingdom 37 688 43 527 16 427 1 069 23 956 49 41 501 1 928 98
Other 7 681 7 253 2 354 112 4 107 7 6 580 660 13
North America 34 156 31 764 6 206 198 22 272 252 28 928 2 376 460
Canada 6 333 5 786 1 656 60 3 407 26 5 149 620 17
United States of America 27 822 25 978 4 550 138 18 865 226 23 779 1 756 443
Other 1 - - - - - - - -
Central and South America 6 406 4 168 336 9 3 368 6 3 719 430 19
Argentina 3 286 659 16 1 616 - 633 22 4
Brazil 1 636 2 224 102 4 1 823 2 1 931 291 2
Mexico 319 275 105 - 159 3 267 3 5
Other 1 165 1 010 113 4 770 1 888 114 8
Statistics South Africa P0351
Tourism and migration, March 2015
11
Table 3 – Number of tourists by country of residence and mode of travel (continued)
Country of residence
March
Mode of travel (March 2015)
Air
2014 2015 Cape Town King Shaka O.R. Tambo Other Total Road Sea
Australasia 9 165 10 172 951 179 8 649 28 9 807 355 10
Australia 7 751 8 533 705 113 7 393 28 8 239 286 8
New Zealand 1 392 1 618 244 66 1 243
1 553 64 1
Other 22 21 2 - 13 - 15 5 1
Middle East 4 379 4 082 706 43 3 227 11 3 987 94 1
Iran 1 375 893 199 34 656 - 889 4 -
Israel 1 571 1 760 135 - 1 556 4 1 695 65 -
Saudi Arabia 652 615 94 1 515 5 615 - -
Other 781 814 278 8 500 2 788 25 1
Asia 23 708 19 619 3 097 394 14 175 27 17 693 1 909 17
China 9 206 6 471 893 47 5 197 1 6 138 323 10
India 6 167 6 080 945 235 4 222 9 5 411 666 3
Japan 2 224 1 606 191 23 1 271 5 1 490 116 -
Malaysia 464 445 95 13 318 - 426 19 -
Pakistan 1 158 963 96 30 544 - 670 292 1
Philippines 408 495 118 8 322 2 450 44 1
Singapore 560 522 203 - 304 3 510 12 -
South Korea 1 207 954 166 10 664 4 844 110 -
Taiwan 577 484 35 3 379 - 417 67 -
Thailand 538 479 77 14 308 - 399 79 1
Other 1 199 1 120 278 11 646 3 938 181 1
Africa 543 806 526 194 3 816 583 47 225 178 51 802 474 370 22
SADC 527 675 510 331 3 240 450 33 054 124 36 868 473 460 3
Angola 4 301 4 177 821 1 3 176 5 4 003 173 1
Botswana 38 016 41 758 203 8 2 179 20 2 410 39 348 -
DRC 2 500 2 297 10 2 1 703 32 1 747 550 -
Lesotho 114 180 107 617 3 4 486 - 493 107 124 -
Madagascar 235 274 2 - 243 1 246 28 -
Statistics South Africa P0351
Tourism and migration, March 2015
12
Table 3 – Number of tourists by country of residence and mode of travel (continued)
Country of residence
March Mode of travel (March 2015)
Air
2014 2015 Cape Town King Shaka O.R. Tambo Other Total Road Sea
Malawi 12 949 11 770 8 2 1 589 2 1 601 10 169 -
Mauritius 1 350 1 370 186 100 985 - 1 271 99 -
Mozambique 96 207 94 445 8 79 3 146 13 3 246 91 199 -
Namibia 15 823 16 784 1 895 3 3 146 12 5 056 11 727 1
Seychelles 635 581 2 - 576 - 578 3 -
Swaziland 72 154 64 702 - 3 474 1 478 64 224 -
Tanzania 2 857 3 131 15 - 2 016 2 2 033 1 098 -
Zambia 14 757 14 912 22 105 4 055 13 4 195 10 717 -
Zimbabwe 151 711 146 513 65 143 9 280 23 9 511 137 001 1
‘Other’ African 16 131 15 863 576 133 14 171 54 14 934 910 19
East and Central Africa 6 044 5 823 90 22 5 314 5 5 431 392 -
Burundi 77 109 1 - 99 - 100 9 -
Cameroon 398 395 7 1 364 - 372 23 -
Central African Republic 7 21 - 1 20 - 21 - -
Chad 76 35 - - 35 - 35 - -
Comoros 10 7 - - 7 - 7 - -
Congo 355 317 2 - 307 4 313 4 -
Djibouti 7 3 - - 3 - 3 - -
Equatorial Guinea 45 50 - - 50 - 50 - -
Eritrea 39 40 3 1 34 - 38 2 -
Ethiopia 609 636 19 13 537 - 569 67 -
Gabon 587 619 3 4 594 1 602 17 -
Kenya 2 373 2 426 26 1 2 248 - 2 275 151 -
Réunion 10 17 17 - - - 17 - -
Rwanda 176 83 1 - 74 - 75 8 -
Sao Tome And Principe 15 10 1 - 9 - 10 - -
Somalia 17 13 1 - 11 - 12 1 -
Uganda 1 243 1 042 9 1 922 - 932 110 -
Statistics South Africa P0351
Tourism and migration, March 2015
13
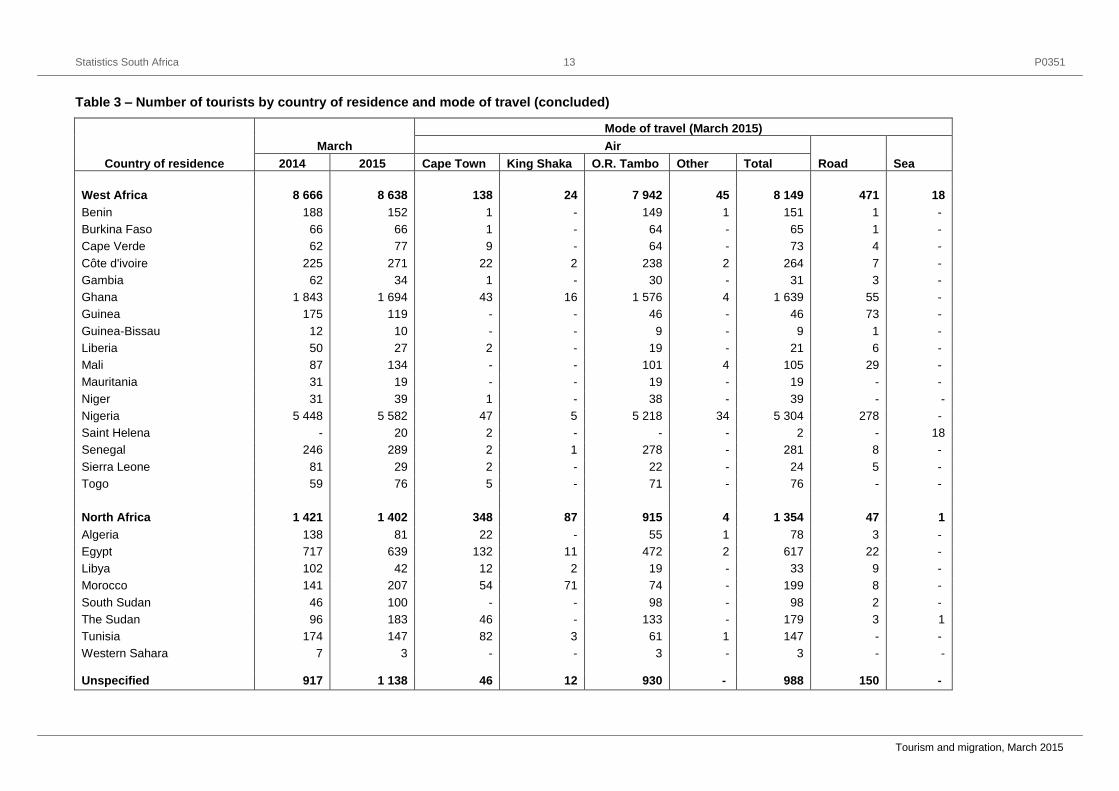
Table 3 – Number of tourists by country of residence and mode of travel (concluded)
Country of residence
March
Mode of travel (March 2015)
Air
2014 2015 Cape Town King Shaka O.R. Tambo Other Total Road Sea
West Africa 8 666 8 638 138 24 7 942 45 8 149 471 18
Benin 188 152 1 - 149 1 151 1 -
Burkina Faso 66 66 1 - 64 - 65 1 -
Cape Verde 62 77 9 - 64 - 73 4 -
Côte d'ivoire 225 271 22 2 238 2 264 7 -
Gambia 62 34 1 - 30 - 31 3 -
Ghana 1 843 1 694 43 16 1 576 4 1 639 55 -
Guinea 175 119 - - 46 - 46 73 -
Guinea-Bissau 12 10 - - 9 - 9 1 -
Liberia 50 27 2 - 19 - 21 6 -
Mali 87 134 - - 101 4 105 29 -
Mauritania 31 19 - - 19 - 19 - -
Niger 31 39 1 - 38 - 39 - -
Nigeria 5 448 5 582 47 5 5 218 34 5 304 278 -
Saint Helena - 20 2 - - - 2 - 18
Senegal 246 289 2 1 278 - 281 8 -
Sierra Leone 81 29 2 - 22 - 24 5 -
Togo 59 76 5 - 71 - 76 - -
North Africa 1 421 1 402 348 87 915 4 1 354 47 1
Algeria 138 81 22 - 55 1 78 3 -
Egypt 717 639 132 11 472 2 617 22 -
Libya 102 42 12 2 19 - 33 9 -
Morocco 141 207 54 71 74 - 199 8 -
South Sudan 46 100 - - 98 - 98 2 -
The Sudan 96 183 46 - 133 - 179 3 1
Tunisia 174 147 82 3 61 1 147 - -
Western Sahara 7 3 - - 3 - 3 - -
Unspecified 917 1 138 46 12 930 - 988 150 -
Statistics South Africa P0351
Tourism and migration, March 2015
14
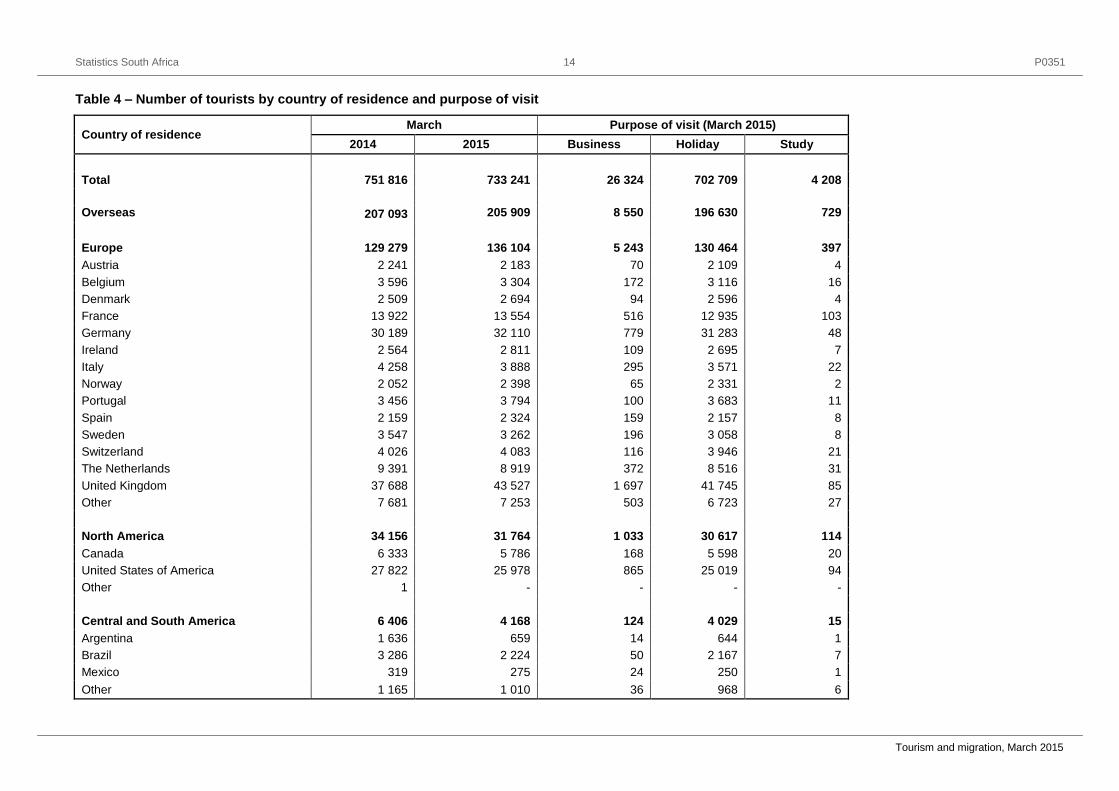
Table 4 – Number of tourists by country of residence and purpose of visit
Country of residence March Purpose of visit (March 2015)
2014 2015 Business Holiday Study
Total 751 816 733 241 26 324 702 709 4 208
Overseas
205 909
8 550
196 630
729 207 093
Europe 129 279 136 104 5 243 130 464 397
Austria 2 241 2 183 70 2 109 4
Belgium 3 596 3 304 172 3 116 16
Denmark 2 509 2 694 94 2 596 4
France 13 922 13 554 516 12 935 103
Germany 30 189 32 110 779 31 283 48
Ireland 2 564 2 811 109 2 695 7
Italy 4 258 3 888 295 3 571 22
Norway 2 052 2 398 65 2 331 2
Portugal 3 456 3 794 100 3 683 11
Spain 2 159 2 324 159 2 157 8
Sweden 3 547 3 262 196 3 058 8
Switzerland 4 026 4 083 116 3 946 21
The Netherlands 9 391 8 919 372 8 516 31
United Kingdom 37 688 43 527 1 697 41 745 85
Other 7 681 7 253 503 6 723 27
North America 34 156 31 764 1 033 30 617 114
Canada 6 333 5 786 168 5 598 20
United States of America 27 822 25 978 865 25 019 94
Other 1 - - - -
Central and South America 6 406 4 168 124 4 029 15
Argentina 1 636 659 14 644 1
Brazil 3 286 2 224 50 2 167 7
Mexico 319 275 24 250 1
Other 1 165 1 010 36 968 6
Statistics South Africa P0351
Tourism and migration, March 2015
15
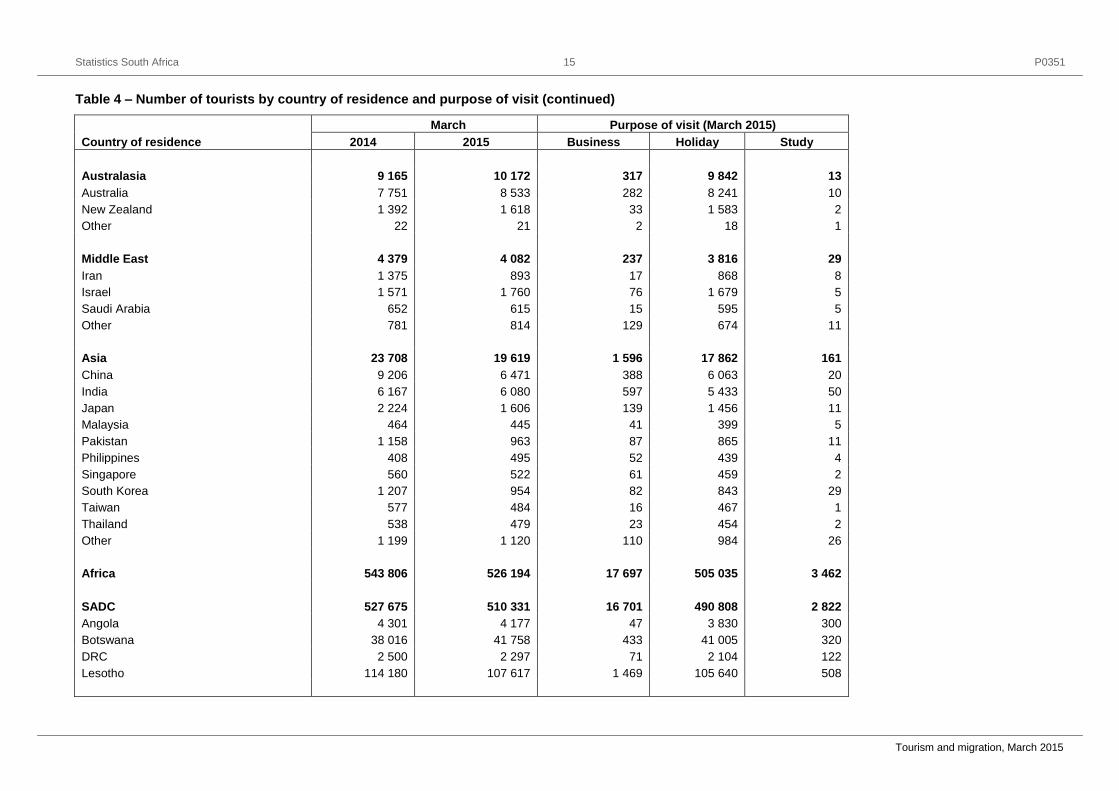
Table 4 – Number of tourists by country of residence and purpose of visit (continued)
Country of residence
March Purpose of visit (March 2015)
2014 2015 Business Holiday Study
Australasia 9 165 10 172 317 9 842 13
Australia 7 751 8 533 282 8 241 10
New Zealand 1 392 1 618 33 1 583 2
Other 22 21 2 18 1
Middle East 4 379 4 082 237 3 816 29
Iran 1 375 893 17 868 8
Israel 1 571 1 760 76 1 679 5
Saudi Arabia 652 615 15 595 5
Other 781 814 129 674 11
Asia 23 708 19 619 1 596 17 862 161
China 9 206 6 471 388 6 063 20
India 6 167 6 080 597 5 433 50
Japan 2 224 1 606 139 1 456 11
Malaysia 464 445 41 399 5
Pakistan 1 158 963 87 865 11
Philippines 408 495 52 439 4
Singapore 560 522 61 459 2
South Korea 1 207 954 82 843 29
Taiwan 577 484 16 467 1
Thailand 538 479 23 454 2
Other 1 199 1 120 110 984 26
Africa 543 806 526 194 17 697 505 035 3 462
SADC 527 675 510 331 16 701 490 808 2 822
Angola 4 301 4 177 47 3 830 300
Botswana 38 016 41 758 433 41 005 320
DRC 2 500 2 297 71 2 104 122
Lesotho 114 180 107 617 1 469 105 640 508
Statistics South Africa P0351
Tourism and migration, March 2015
16
Table 4 – Number of tourists by country of residence and purpose of visit (continued)
Country of residence
March Purpose of visit (March 2015)
2014 2015 Business Holiday Study
Madagascar 235 274 14 257 3
Malawi 12 949 11 770 183 11 545 42
Mauritius 1 350 1 370 76 1 273 21
Mozambique 96 207 94 445 8 617 85 751 77
Namibia 15 823 16 784 2 330 14 204 250
Seychelles 635 581 11 568 2
Swaziland 72 154 64 702 485 63 753 464
Tanzania 2 857 3 131 127 2 948 56
Zambia 14 757 14 912 985 13 820 107
Zimbabwe 151 711 146 513 1 853 144 110 550
'Other' African 16 131 15 863 996 14 227 640
East and Central Africa 6 044 5 823 389 5 142 292
Burundi 77 109 5 100 4
Cameroon 398 395 29 343 23
Central African Republic 7 21 2 15 4
Chad 76 35 - 33 2
Comoros 10 7 - 6 1
Congo 355 317 8 265 44
Djibouti 7 3 1 2 -
Equatorial Guinea 45 50 3 41 6
Eritrea 39 40 1 38 1
Ethiopia 609 636 47 572 17
Gabon 587 619 7 548 64
Kenya 2 373 2 426 207 2 138 81
Réunion 10 17 - 17 -
Rwanda 176 83 6 65 12
Sao Tome and Principe 15 10 1 9 -
Somalia 17 13 - 11 2
Uganda 1 243 1 042 72 939 31
Statistics South Africa P0351
Tourism and migration, March 2015
17
Table 4 – Number of tourists by country of residence and purpose of visit (concluded)
Country of residence March Purpose of visit (March 2015)
2014 2015 Business Holiday Study
West Africa 8 666 8 638 421 7 901 316
Benin 188 152 13 136 3
Burkina Faso 66 66 1 64 1
Cape Verde 62 77 6 69 2
Côte d'ivoire 225 271 37 226 8
Gambia 62 34 3 30 1
Ghana 1 843 1 694 96 1 556 42
Guinea 175 119 - 114 5
Guinea-Bissau 12 10 2 5 3
Liberia 50 27 1 25 1
Mali 87 134 6 128 -
Mauritania 31 19 3 16 -
Niger 31 39 7 32 -
Nigeria 5 448 5 582 211 5 123 248
Saint Helena - 20 - 20 -
Senegal 246 289 21 267 1
Sierra Leone 81 29 4 25 -
Togo 59 76 10 65 1
North Africa 1 421 1 402 186 1 184 32
Algeria 138 81 13 67 1
Egypt 717 639 88 546 5
Libya 102 42 - 31 11
Morocco 141 207 32 174 1
South Sudan 46 100 3 95 2
The Sudan 96 183 30 141 12
Tunisia 174 147 20 127 -
Western Sahara 7 3 - 3 -
Unspecified 917 1 138 77 1 044 17
Statistics South Africa P0351
Tourism and migration, March 2015
18
Table 5 – Number of tourists from overseas, SADC and ‘other’ African regions by sex and age group
Sex Age_group Total
Region (March 2015)
Overseas SADC ‘Other’ African Unspecified
All Total 733 241 205 909 510 359 15 863 1 110
< 15 34 220 14 203 19 481 529 7
15-64 657 942 164 019 477 884 14 953 1 086
65+ 41 079 27 687 12 994 381 17
Male Total 415 802 114 478 289 953 10 699 672
< 15 17 179 7 234 9 651 293 1
15-64 377 815 92 579 274 421 10 158 657
65+ 20 808 14 665 5 881 248 14
Female Total 317 436 91 431 220 403 5 164 438
< 15 17 041 6 969 9 830 236 6
15-64 280 124 71 440 203 460 4 795 429
65+ 20 271 13 022 7 113 133 3
Unspecified Total 3 - 3 - -
15-64 3 - 3 - -
Statistics South Africa P0351
Tourism and migration, March 2015
19
4. Explanatory notes
NOTICE TO USERS
Statistics South Africa has made changes in the Tourism and Migration statistical release starting from the January
2014 statistics. This change has become necessary as a result of the implementation of the new Movement Control
System (e-MCS) at the country’s ports of entry. Currently the new system (e-MCS) is operational at over 80% of
the country’s ports of entry. The system roll-out is expected to be finalised by end of 2015/16. The change affects
the identification of Transit Travellers that are currently categorised under Direction instead of Purpose of
Movement. The revision, Table 1 and Table 2 in the release now include a category for Transit while all tables
reporting on tourists exclude transit travellers.
4.1 Introduction
Legal movements across South African borders as well as legal immigration into South Africa fall under the
jurisdiction of the Department of Home Affairs (DHA). Statistics South Africa (Stats SA) then processes, analyses
and publishes this information.
Administrative data sources from the DHA, that is, information from all the country’s ports of entry and applications
for permanent residence, constitute the only comprehensive source of information on foreign arrivals and
departures, documented immigrants and emigrants. The information from this source of data provides the best
national coverage (both in terms of space and time) of the population movements of South African residents and
foreign travellers. The data can be used for the following:
To estimate, monitor and understand salient characteristics of foreign travellers and volumes of South
African residents travelling outside South Africa.
To provide information that can be used to (a) assess the extent of government’s progress in strengthening
bilateral political and economic relations by assessing the number of international tourist arrivals; and (b)
benchmark surveys focusing on demand for local tourism services by foreign travellers.
4.2 Purpose of the statistical release
This release reports on arrivals, departures and transit travellers of South African residents and foreign travellers.
Detailed information on the age and sex distribution; mode of travel; national and regional distribution; and purpose
of travel of overnight visitors or tourists are also provided.
4.3 Scope and coverage
The release covers data collected by DHA officials on travellers who entered the Republic of South Africa (RSA)
through all the air, land and sea ports of entry.
4.4 Data
Information published in this release is based on data obtained from the following data sources within the DHA:
Data routinely collected by immigration officers at all road, air and sea entry ports on all travellers (South
African residents and foreign travellers) arriving into or departing from South Africa are captured into the
DHA’s population Movement Control System (MCS). The counts/statistics relate to the number of individual
movements, rather than to the number of people. Hence, the multiple movements of individual people
during the calendar month are each counted separately. Generally the data are collected directly from
travel documents either by scanning or capturing onto the port’s electronic database. No forms or cards are
used (except in rare occasions when the capturing system is down) to collect information from travellers.
Individual ports regularly transmit data onto the national database at the head office of the DHA.
Statistics South Africa P0351
Tourism and migration, March 2015
20
Stats SA downloads the data covering a particular calendar month from the DHA database.
As part of data interrogation, data from the O.R. Tambo International Airport, which has the highest volume
of travellers, are compared with passenger statistics from the Airport Company of South Africa (ACSA). As
expected, in any specific month, an increase in the volume of passengers reported by ACSA has been
accompanied by an increase in the volume of travellers recorded by DHA. A similar pattern was also
observed when the volume of travellers decreased. However, the volume of passengers recorded by ACSA
is generally higher than that of the DHA. In March 2015, the DHA data was 0,5% lower than that of ACSA.
4.5 Limitations
The information on the total number of arrivals and departures of South African residents is collected from the
scanning of passports. However, data are not collected from passengers on country visited; country of final
destination, the duration of stay; intended duration of stay and purpose of visit. With this limitation, it is impossible
to identify the number of tourists from the data on South African residents.
4.6 Definitions of terms
4.6.1 Definitions used by the United Nations World Tourism Organisation (UNWTO)
Traveller is someone who moves between different geographical locations for any purpose and any duration.
Visitor refers to any person travelling to a place other than that of his/her usual environment for less than 12 months
and whose main purpose of the trip is other than the exercise of an activity remunerated from within the place visited.
Same-day visitor is a visitor who visits a place for less than one night.
Tourist (overnight visitor) is a visitor who stays at least one night in collective or private accommodation in the
place visited.
Tourism comprises the activities of persons travelling to, and staying in places outside their usual environment, for
not more than one consecutive year, for leisure, business and other purposes. The usual environment of a person
consists of a certain area around his/her place of residence, plus all other places he/she frequently visits.
4.6.2 Definitions used specifically in this release
South African resident refers to either a South African citizen or a non-South African citizen with a South African
permanent residence permit.
Foreign traveller refers to a traveller who is not a South African citizen or permanent resident.
Region refers to the following country classification:
– Overseas: Europe, North America, Central and South America, Australasia, the Middle East and Asia.
– Africa: SADC and ‘other’ Africa (East and Central Africa, West Africa and North Africa).
Country refers to individual countries within a region. The country of residence is used. The country of residence
should not be confused with the country from which the visitor travelled.
Africa refers to all the countries in Africa (both mainland and island countries).
SADC refers to the fourteen countries, excluding South Africa, which belongs to the Southern African Development
Community.
‘Other’ African refers to all non SADC African countries.
Overseas refers to all countries outside Africa.
Trip refers to the arrival and departure of a visitor in a specified month.
Statistics South Africa P0351
Tourism and migration, March 2015
21
4.7 Symbols used
- = nil
< = less than
5. General information
Stats SA publishes approximately 300 different statistical releases each year. It is not economically viable to
produce them in more than one of South Africa's eleven official languages. Since the releases are used
extensively, not only locally but also by international economic and social-scientific communities, Stats SA releases
are published in English.
Stats SA has copyright on this publication. Users may apply the information as they wish, provided that they
acknowledge Stats SA as the source of the basic data wherever they process, apply, utilise, publish or distribute
the data; and also that they specify that the relevant application and analysis (where applicable) result from their
own processing of the data.
Advance release calendar
An advance release calendar is disseminated www.statssa.gov.za
Stats SA products
A complete set of Stats SA publications is available at the Stats SA Library and the following libraries:
National Library of South Africa, Pretoria Division
National Library of South Africa, Cape Town Division
Natal Society Library, Pietermaritzburg
Library of Parliament, Cape Town
Bloemfontein Public Library
Johannesburg Public Library
Eastern Cape Library Services, King William’s Town
Central Regional Library, Polokwane
Central Reference Library, Mbombela
Central Reference Collection, Kimberley
Central Reference Library, Mafikeng
Stats SA also provides a subscription service.
Electronic services
A large range of data are available via online services, diskette and computer printouts. For more details about our
electronic data, contact user information services.
You can visit us on the Internet at www.statssa.gov.za
Statistics South Africa P0351
Tourism and migration, March 2015
22
Enquiries
Telephone: (012) 310 8600/ 8390/ 8351/ 4892/ 8496/ 8095 (user information services)
(012) 310 8601 (technical enquiries)
(012) 310 8161 (orders)
(012) 310 4883/4885/8018 (library)
Fax: (012) 310 8500/ 8495 (user information services)
(012) 310 6937 (technical enquiries)
Email: [email protected] (technical enquiries)
[email protected] (user information services)
[email protected] (orders)
Postal address: Private Bag X44, Pretoria, 0001
Produced by Stats SA