Tourism and Migration - statssa.gov.za
24
170 Thabo Sehume Street, Pretoria 0002, Private Bag X44, Pretoria 0001, South Africa Tel: +27 12 310 8911, Fax: +27 12 321 7381, www.statssa.gov.za, [email protected] Statistical release P0351 Tourism and Migration January 2016 Embargoed until: 04 April 2016 13:00 Enquiries: Forthcoming issue: Expected release date: User Information Services February 2016 25 April 2016 Tel.: (012) 310 8600 / 4892 / 8390
Transcript of Tourism and Migration - statssa.gov.za

170 Thabo Sehume Street, Pretoria 0002, Private Bag X44, Pretoria 0001, South Africa Tel: +27 12 310 8911, Fax: +27 12 321 7381, www.statssa.gov.za, [email protected]
Statistical release P0351
Tourism and Migration
January 2016
Embargoed until:04 April 2016
13:00 Enquiries: Forthcoming issue: Expected release date:
User Information Services February 2016 25 April 2016 Tel.: (012) 310 8600 / 4892 / 8390

Statistics South Africa P0351
Tourism and migration, January 2016
1
Contents
Preface .................................................................................................................................................................... 2
1. Key findings .............................................................................................................................................. 3
1.1 Travellers .................................................................................................................................................... 3
1.1.1 Number of travellers ................................................................................................................................... 3
1.1.2 Mode of travel ............................................................................................................................................. 4
1.2 Tourists ....................................................................................................................................................... 4
1.2.1 Mode of travel ............................................................................................................................................. 4
1.2.2 Regional and national distribution............................................................................................................... 4
1.2.3 Purpose of visit ........................................................................................................................................... 5
1.2.4 Sex and age distribution ............................................................................................................................. 5
2. Figures ....................................................................................................................................................... 7
Figure 1 – Number of tourists from the ten leading overseas countries in January 2015 and January 2016 ............. 7
Figure 2 – Number of tourists from the ten leading Southern African Development Community (SADC)
countries in January 2015 and January 2016 ............................................................................................. 7
Figure 3 – Number of tourists from the ten leading ‘other’ African countries in January 2015 and January
2016 ............................................................................................................................................................ 8
3. Tables ......................................................................................................................................................... 9
Table 1 – Number of South African residents and foreign travellers by travel direction ............................................ 9
Table 2 – Number of South African residents and foreign travellers by travel direction and mode of travel ........... 10
Table 3 – Number of tourists by country of residence and mode of travel ............................................................... 11
Table 4 – Number of tourists by country of residence and purpose of visit .............................................................. 15
Table 5 – Number of tourists from overseas, SADC and ‘other’ African regions by sex and age group ................. 19
4. Explanatory notes ................................................................................................................................... 20
4.1 Introduction ............................................................................................................................................... 20
4.2 Purpose of the statistical release .............................................................................................................. 20
4.3 Scope and coverage ................................................................................................................................. 20
4.4 Data .......................................................................................................................................................... 20
4.5 Limitations ................................................................................................................................................. 21
4.6 Definition of terms ..................................................................................................................................... 21
4.6.1 Definitions used by the United Nations World Tourism Organisation (UNWTO) ..................................... 21
4.6.2 Definitions used specifically in this release .............................................................................................. 21
4.7 Symbols used ........................................................................................................................................... 22
5. General information ................................................................................................................................ 22

Statistics South Africa P0351
Tourism and migration, January 2016
2
Preface This monthly statistical release provides information on South African residents and foreign travellers who entered
or left South Africa in January 2016. Specific focus is on foreign tourists who entered the country during this month.
The tourists are classified by region and country of residence. Details of their mode of travel; purpose of visit; and
age and sex distribution are also provided.
PJ Lehohla
Statistician-General

Statistics South Africa P0351
Tourism and migration, January 2016
3
1. Key findings
1.1 Travellers
1.1.1 Number of travellers
The routine data collected by the Department of Home Affairs’ (DHA) immigration officers at the ports of entry into
South Africa show that a total of 3 814 331 travellers (arrivals, departures and transits) passed through South
African ports of entry in January 2016. As presented in Table 1 on page 9, these travellers were made up of
976 667 South African residents and 2 837 664 foreign travellers. A further breakdown of the figures for South
African residents indicates that there were 584 653 arrivals, 391 185 departures and 829 travellers in transit. The
corresponding volume for foreign arrivals, departures and transit travellers was 1 558 854, 1 220 540 and 58 270
respectively.
A comparison between the movements in January 2015 and January 2016 indicates that the volume of arrivals
decreased for South African residents but increased for foreign travellers. Departures and transits increased for
both South African residents and foreign travellers. For South African residents, the volume of arrivals decreased
by 1,6% (from 593 988 in January 2015 to 584 653 in January 2016), departures increased by 0,1% (from 390 686
in January 2015 to 391 185 in January 2016), and transits increased by 20,5% (from 688 in January 2015 to 829 in
January 2016). For foreign travellers, arrivals increased by 11,4% (from 1 399 328 in January 2015 to 1 558 854 in
January 2016), departures increased by 8,5% (from 1 124 873 in January 2015 to 1 220 540 in January 2016), and
transits increased by 2,7% (from 56 742 in January 2015 to 58 270 in January 2016).
A comparison between the movements in December 2015 and January 2016 indicates that the volume of arrivals
increased for both South African residents and foreign travellers, while departures and transits decreased for both.
The volume of arrivals for South African residents increased by 9,3% (from 534 979 in December 2015 to 584 653
in January 2016); departures decreased by 46,1% (from 726 210 in December 2015 to 391 185 in January 2016);
and transits decreased by 3,4% (from 858 in December 2015 to 829 in January 2016). For foreign travellers, the
volume of arrivals increased by 0,7% (from 1 547 900 in December 2015 to 1 558 854 in January 2016);
departures decreased by 21,2% (from 1 549 157 in December 2015 to 1 220 540 in January 2016); and transits
decreased by 5,5% (from 61 673 in December 2015 to 58 270 in January 2016).
Detailed information on the departure of travellers is not available in the movement control system. Data on the
purpose of travel and the number of days South African residents intend to spend or spent abroad are not collected
by the DHA. Hence, it is not possible to categorise South African residents as tourists or non-tourists. However,
some data are available on foreign arrivals for this categorisation.
As presented in Table 1, in January 2016, 117 369 (7,5%) of foreign arrivals were classified as non-visitors while
1 441 485 (92,5%) were classified as visitors. The visitors were categorised into three groups:
i. Arrivals only – comprising visitors who entered the country in January 2016 but did not depart in January
2016 [497 274 (34,5%)];
ii. Single trips – visitors who came to South Africa once in January 2016 and left in January 2016 [429 745
(29,8%)]; and
iii. Multiple trips – visitors who came to and left South Africa more than once in January 2016 [514 466
(35,7%)].
Visitors were further grouped as same-day visitors and overnight visitors (tourists). In January 2016, there were
428 844 (29,8%) same-day visitors and 1 012 641 (70,2%) tourists. Between January 2015 and January 2016, the
volume of same-day visitors increased by 2,2% (from 419 537 in January 2015 to 428 844 in January 2016) and
that of tourists increased by 15,4% (from 877 715 in January 2015 to 1 012 641 in January 2016). Between
December 2015 and January 2016, the volume of same-day visitors decreased by 22,0% (from 550 118 in
December 2015 to 428 844 in January 2016), and tourists increased by 13,4% (from to 892 720 in December 2015
to 1 012 641 in January 2016).

Statistics South Africa P0351
Tourism and migration, January 2016
4
1.1.2 Mode of travel
Data presented in Table 2 on page 10 show that in January 2016, road transport was the most common mode of
travel used by 2 786 051 (73,0%) of the 3 814 331 travellers. The total number of travellers who used air transport
was 1 006 591 (26,4%). Compared to use of air and land transport, a much smaller number of travellers, 21 689
(0,6%) used sea transport. The arrivals data for South African residents show that 212 173 (36,3%) came by air,
370 223 (63,3%) came by road and 2 257 (0,4%) arrived by sea. For departures, 149 955 (38,3%) used air,
237 720 (60,8%) used road and 3 510 (0,9%) left by sea transport. All travellers in transit (829) used air transport.
In the case of foreign travellers, 284 053 (18,2%) arrived by air, 1 266 420 (81,2%) came by road and 8 381 (0,5%)
arrived by sea. When departing South Africa, 301 311 (24,7%) foreign travellers left by air, 911 688 (74,7%) left by
road and 7 541 (0,6%) left by sea. All travellers in transit (58 270) used air transport. Table 2 further shows that an
overwhelming majority [413 019 (96,3%)] of same-day visitors arrived in the country by road. Only 15 617 (3,6%) of
same-day visitors flew into the country. Data on tourists show that 765 410 (75,6%) used road transport, 244 657
(24,2%) came by air and 2 574 (0,3%) arrived by sea.
1.2 Tourists
1.2.1 Mode of travel
The country of residence of tourists is used to categorise them according to their respective countries and regions.
Information on the specific region and country of residence of the tourists and the mode of travel used to enter
South Africa is provided in Table 3 on page 11. In January 2016, 192 003 (89,3%) of overseas tourists arrived in
the country by air, whilst 20 353 (9,5%) came in by road and 2 547 (1,2%) arrived by sea. This is in contrast to the
number of tourists from the Southern African Development Community (SADC) countries who came into South
Africa predominantly by road [743 624 (95,1%)]. Only 38 372 (4,9%) tourists from SADC countries came in by air
and 6 (less than 0,1%) came by sea. The number of tourists who came into South Africa by air from 'other' African
countries was 13 739 (91,3%), with 1 288 (8,6%) using road transport and 21 (0,1%) using sea transport.
1.2.2 Regional and national distribution
In January 2016, the distribution of overseas tourists was as follows: Europe, 144 130 (67,1%); North America,
26 962 (12,5%); Asia, 25 002 (11,6%); Australasia, 10 011 (4,7%); Central and South America, 5 332 (2,5%), and
Middle East, 3 466 (1,6%).
Data presented in Figure 1 on page 7 indicate that the United Kingdom (UK), 46 264 (21,5%); Germany, 28 944
(13,5%); United States of America (USA), 21 786 (10,1%); The Netherlands, 11 980 (5,6%); France, 11 728
(5,5%); China, 9 406 (4,4%); Australia, 8 508 (4,0%); India, 6 638 (3,1%); Sweden, 5 625 (2,6%); and Switzerland,
5 424 (2,5%) were the ten leading overseas countries visiting South Africa in January 2016. Tourists from these ten
countries constituted 72,7% of all tourists from overseas countries. A comparison between movements in January
2015 and January 2016 shows that the number of tourists increased for all of the ten leading overseas countries.
China had the largest increase of 92,5% (from 4 885 tourists in January 2015 to 9 406 in January 2016), while
Switzerland had the lowest increase of 2,0% (from 5 320 tourists in January 2015 to 5 424 in January 2016).
Virtually all tourists from Africa, 782 002 (98,1%), came from the SADC countries. The distribution of the remaining
tourists from Africa is as follows: West Africa, 7 849 (1,0%); East and Central Africa, 5 812 (0,7%); and North Africa
1 387 (0,2%). The ten leading SADC countries in terms of the number of tourists visiting South Africa in January
2016 were Zimbabwe, 250 514 (32,0%); Lesotho, 209 403 (26,8%); Mozambique, 145 775 (18,6%); Swaziland,
75 176 (9,6%); Botswana, 44 458 (5,7%); Namibia, 17 033 (2,2%); Zambia, 13 758 (1,8%); Malawi, 12 282 (1,6%);
Angola, 5 565 (0,7%) and Tanzania, 2 968 (0,4%) (see Figure 2 on page 7). Tourists from these ten countries
constituted 99,4% of all tourists from the SADC countries. A comparison between movements in January 2015 and
January 2016 for the ten leading SADC countries shows that the number of tourists decreased for two of the ten
leading countries (Malawi and Angola), and increased for the rest. Malawi showed the largest decrease of 15,4%
(from 14 519 tourists in January 2015 to 12 282 tourists in January 2016), while Lesotho showed the largest
increase of 33,7% (from 156 571 tourists in January 2015 to 209 403 tourists in January 2016).
The ten leading countries in terms of the number of tourists visiting South Africa in January 2016 from 'other'
African countries, as shown in Figure 3 on page 8, were: Nigeria, 5 381 (35,8%); Kenya, 2 097 (13,9%); Ghana,
Statistics South Africa P0351
Tourism and migration, January 2016
5
1 398 (9,3%); Uganda, 1 147 (7,6%); Gabon, 780 (5,2%); Egypt, 779 (5,2%); Cameroon, 632 (4,2%); Ethiopia, 450
(3,0%); Congo, 317 (2,1%) and Côte d’Ivoire, 230 (1,5%). Tourists from these ten countries constituted 87,8% of all
tourists from ‘other’ African countries. A comparison between movements in January 2015 and January 2016
shows that the number of tourists increased for five of the ten leading countries (Côte d’Ivoire, Nigeria, Gabon,
Egypt and Uganda), and decreased for the other five (Congo, Ghana, Ethiopia, Cameroon and Kenya). Côte
d’Ivoire had the largest increase of 27,1% (from 181 tourists in January 2015 to 230 in January 2016), while Congo
had the largest decrease of 21,5% (from 404 tourists in January 2015 to 317 in January 2016).
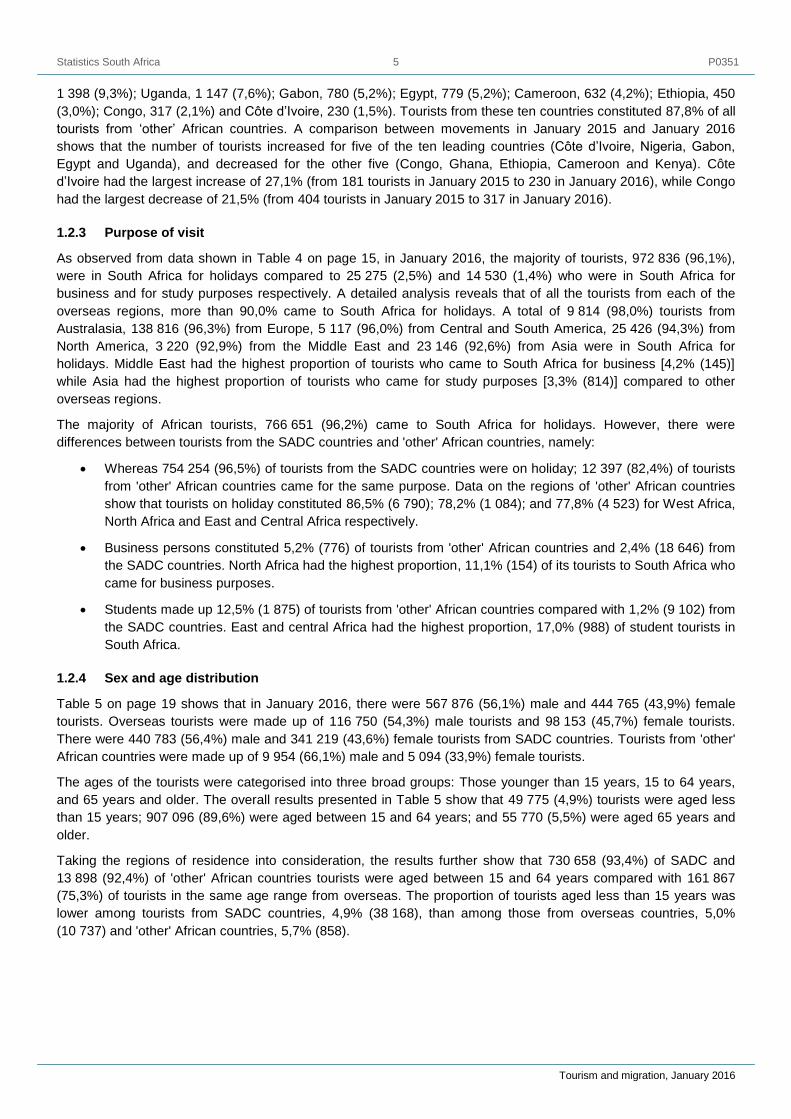
1.2.3 Purpose of visit
As observed from data shown in Table 4 on page 15, in January 2016, the majority of tourists, 972 836 (96,1%),
were in South Africa for holidays compared to 25 275 (2,5%) and 14 530 (1,4%) who were in South Africa for
business and for study purposes respectively. A detailed analysis reveals that of all the tourists from each of the
overseas regions, more than 90,0% came to South Africa for holidays. A total of 9 814 (98,0%) tourists from
Australasia, 138 816 (96,3%) from Europe, 5 117 (96,0%) from Central and South America, 25 426 (94,3%) from
North America, 3 220 (92,9%) from the Middle East and 23 146 (92,6%) from Asia were in South Africa for
holidays. Middle East had the highest proportion of tourists who came to South Africa for business [4,2% (145)]
while Asia had the highest proportion of tourists who came for study purposes [3,3% (814)] compared to other
overseas regions.
The majority of African tourists, 766 651 (96,2%) came to South Africa for holidays. However, there were
differences between tourists from the SADC countries and 'other' African countries, namely:
Whereas 754 254 (96,5%) of tourists from the SADC countries were on holiday; 12 397 (82,4%) of tourists
from 'other' African countries came for the same purpose. Data on the regions of 'other' African countries
show that tourists on holiday constituted 86,5% (6 790); 78,2% (1 084); and 77,8% (4 523) for West Africa,
North Africa and East and Central Africa respectively.
Business persons constituted 5,2% (776) of tourists from 'other' African countries and 2,4% (18 646) from
the SADC countries. North Africa had the highest proportion, 11,1% (154) of its tourists to South Africa who
came for business purposes.
Students made up 12,5% (1 875) of tourists from 'other' African countries compared with 1,2% (9 102) from
the SADC countries. East and central Africa had the highest proportion, 17,0% (988) of student tourists in
South Africa.
1.2.4 Sex and age distribution
Table 5 on page 19 shows that in January 2016, there were 567 876 (56,1%) male and 444 765 (43,9%) female
tourists. Overseas tourists were made up of 116 750 (54,3%) male tourists and 98 153 (45,7%) female tourists.
There were 440 783 (56,4%) male and 341 219 (43,6%) female tourists from SADC countries. Tourists from 'other'
African countries were made up of 9 954 (66,1%) male and 5 094 (33,9%) female tourists.
The ages of the tourists were categorised into three broad groups: Those younger than 15 years, 15 to 64 years,
and 65 years and older. The overall results presented in Table 5 show that 49 775 (4,9%) tourists were aged less
than 15 years; 907 096 (89,6%) were aged between 15 and 64 years; and 55 770 (5,5%) were aged 65 years and
older.
Taking the regions of residence into consideration, the results further show that 730 658 (93,4%) of SADC and
13 898 (92,4%) of 'other' African countries tourists were aged between 15 and 64 years compared with 161 867
(75,3%) of tourists in the same age range from overseas. The proportion of tourists aged less than 15 years was
lower among tourists from SADC countries, 4,9% (38 168), than among those from overseas countries, 5,0%
(10 737) and 'other' African countries, 5,7% (858).

Statistics South Africa P0351
Tourism and migration, January 2016
6
A comparison of the three regions shows relatively higher proportions of the elderly among both male and female
tourists from overseas. Tourists aged 65 years and older comprised 19,4% (22 637) of male tourists and 20,0%
(19 662) of female tourists from overseas. This is in contrast to the pattern observed among tourists from the other
two regions where tourists aged 65 years and older comprised less than 3,0% of both male and female tourists.
From the SADC countries elderly tourists made up 1,4% (5 962) and 2,1% (7 214) of male and female tourists
respectively; while in 'other' African countries elderly tourists made up 1,5% (151) and 2,8% (141) of male and
female tourists respectively.

Statistics South Africa P0351
Tourism and migration, January 2016
7
2. Figures
Figure 1 – Number of tourists from the ten leading overseas countries in January 2015 and January 2016
05 000
10 00015 00020 00025 00030 00035 00040 00045 00050 000
Nu
mb
er
of
tou
ris
ts
Country of residence
2015 2016
Figure 2 – Number of tourists from the ten leading Southern African Development Community (SADC) countries in January 2015 and January 2016
0
50 000
100 000
150 000
200 000
250 000
300 000
Nu
mb
er
of
tou
ris
ts
Country of residence
2015 2016

Statistics South Africa P0351
Tourism and migration, January 2016
8
Figure 3 – Number of tourists from the ten leading 'other' African countries in January 2015 and January 2016
0
1 000
2 000
3 000
4 000
5 000
6 000
Nu
mb
er
of
tou
ris
ts
Country of residence
2015 2016

Statistics South Africa P0351
Tourism and migration, January 2016
9
3. Tables
Table 1 – Number of South African residents and foreign travellers by travel direction
Travel Direction January December January % Change % Change
2015 2015 2016 Dec 2015 - Jan 2016 Jan 2015 - Jan 2016
Total 3 566 305 4 420 777 3 814 331 -13,7% 7,0%
South African residents 985 362 1 262 047 976 667 -22,6% -0,9%
Arrivals 593 988 534 979 584 653 9,3% -1,6%
Departures 390 686 726 210 391 185 -46,1% 0,1%
Transit 688 858 829 -3,4% 20,5%
Foreign travellers 2 580 943 3 158 730 2 837 664 -10,2% 9,9%
Arrivals 1 399 328 1 547 900 1 558 854 0,7% 11,4%
Departures 1 124 873 1 549 157 1 220 540 -21,2% 8,5%
Transit 56 742 61 673 58 270 -5,5% 2,7%
Foreign arrivals 1 399 328 1 547 900 1 558 854 0,7% 11,4%
Non-visitors 102 076 105 062 117 369 11,7% 15,0%
Visitors 1 297 252 1 442 838 1 441 485 -0,1% 11,1%
Visitors 1 297 252 1 442 838 1 441 485 -0,1% 11,1%
Arrivals only 436 818 328 456 497 274 51,4% 13,8%
Single trips 416 685 546 371 429 745 -21,3% 3,1%
Multiple trips 443 749 568 011 514 466 -9,4% 15,9%
Visitors 1 297 252 1 442 838 1 441 485 -0,1% 11,1%
Same day 419 537 550 118 428 844 -22,0% 2,2%
Overnight (tourists) 877 715 892 720 1 012 641 13,4% 15,4%

Statistics South Africa P0351
Tourism and migration, January 2016
10
Table 2 – Number of South African residents and foreign travellers by travel direction and mode of travel
Travel direction Total
Air
Road Sea Cape Town King Shaka O. R. Tambo Other Airports Total
Total 3 814 331 197 789 30 450 773 273 5 079 1 006 591 2 786 051 21 689
South African residents 976 667 46 766 20 113 293 051 3 027 362 957 607 943 5 767
Arrivals 584 653 27 287 11 925 171 443 1 518 212 173 370 223 2 257
Departures 391 185 19 478 8 188 120 780 1 509 149 955 237 720 3 510
Transit 829 1 - 828 - 829 - -
Foreign travellers 2 837 664 151 023 10 337 480 222 2 052 643 634 2 178 108 15 922
Arrivals 1 558 854 75 100 4 372 203 686 895 284 053 1 266 420 8 381
Departures 1 220 540 75 852 5 965 218 337 1 157 301 311 911 688 7 541
Transit 58 270 71 - 58 199 - 58 270 - -
Visitors 1 441 485 70 797 3 086 185 753 638 260 274 1 178 429 2 782
Same day 428 844 414 10 15 107 86 15 617 413 019 208
Tourist 1 012 641 70 383 3 076 170 646 552 244 657 765 410 2 574

Statistics South Africa P0351
Tourism and migration, January 2016
11
Table 3 – Number of tourists by country of residence and mode of travel
Country of residence January Air (January 2016) (January 2016)
2015 2016 Cape Town King Shaka O.R. Tambo Other Total Road Sea
Total 877 712 1 012 641 70 383 3 076 170 646 552 244 657 765 410 2 574
Overseas 184 864 214 903 65 832 2 582 123 202 387 192 003 20 353 2 547
Europe 127 260 144 130 55 883 1 846 71 492 159 129 380 13 102 1 648
Austria 2 792 2 902 1 164 92 1 402 - 2 658 226 18
Belgium 3 465 3 749 1 448 18 1 909 3 3 378 363 8
Denmark 3 279 3 413 1 145 26 1 983 6 3 160 250 3
France 10 534 11 728 3 886 127 5 959 2 9 974 1 741 13
Germany 23 792 28 944 12 893 214 12 792 27 25 926 2 399 619
Ireland 2 547 2 708 1 165 68 1 284 5 2 522 178 8
Italy 3 981 4 617 1 548 93 2 432 6 4 079 536 2
Norway 2 066 2 022 878 20 905 4 1 807 192 23
Portugal 3 784 3 529 436 27 1 682 3 2 148 1 377 4
Spain 1 779 2 074 524 36 1 242 21 1 823 248 3
Sweden 4 988 5 625 2 437 74 2 611 6 5 128 491 6
Switzerland 5 320 5 424 2 564 65 2 318 16 4 963 445 16
The Netherlands 10 960 11 980 5 168 58 5 181 4 10 411 1 536 33
UK 39 776 46 264 17 538 816 24 641 49 43 044 2 343 877
Other 8 197 9 151 3 089 112 5 151 7 8 359 777 15
North America 24 219 26 962 5 545 191 18 465 121 24 322 2 469 171
Canada 4 632 5 176 1 527 30 3 010 8 4 575 552 49
USA 19 587 21 786 4 018 161 15 455 113 19 747 1 917 122
Central and South America 4 914 5 332 322 11 4 432 25 4 790 539 3
Argentina 586 1 082 36 2 996 - 1 034 48 -
Brazil 3 127 2 870 165 4 2 318 6 2 493 376 1
Mexico 166 272 32 2 219 10 263 8 1
Other 1 035 1 108 89 3 899 9 1 000 107 1

Statistics South Africa P0351
Tourism and migration, January 2016
12
Table 3 – Number of tourists by country of residence and mode of travel (continued)
Country of residence January Air (January 2016) (January 2016)
2015 2016 Cape Town King Shaka O.R. Tambo Other Total Road Sea
Australasia 8 650 10 011 1 070 152 7 790 49 9 061 920 30
Australia 7 354 8 508 898 115 6 674 38 7 725 755 28
New Zealand 1 277 1 494 171 37 1 108 11 1 327 165 2
Other 19 9 1 - 8 - 9 - -
Middle East 2 653 3 466 609 28 2 574 14 3 225 241 -
Iran 146 226 53 12 149 - 214 12 -
Israel 1 326 1 812 130 5 1 513 1 1 649 163 -
Saudi Arabia 514 621 146 - 463 12 621 - -
Other 667 807 280 11 449 1 741 66 -
Asia 17 168 25 002 2 403 354 18 449 19 21 225 3 082 695
Bangladesh 407 399 27 2 190 - 219 180 -
China 4 885 9 406 657 69 8 248 - 8 974 429 3
India 6 010 6 638 595 152 4 960 8 5 715 919 4
Japan 1 228 2 579 266 27 1 153 3 1 449 494 636
Malaysia 407 413 76 13 281 - 370 40 3
Pakistan 1 016 1 157 49 35 561 - 645 512 -
Philippines 362 394 47 10 259 4 320 42 32
South Korea 1 306 2 187 419 14 1 581 - 2 014 172 1
Taiwan 381 408 29 3 301 - 333 75 -
Thailand 451 389 53 13 300 - 366 19 4
Other 715 1 032 185 16 615 4 820 200 12
Africa 692 035 797 050 4 524 494 46 928 165 52 111 744 912 27
SADC 678 068 782 002 3 948 408 33 868 148 38 372 743 624 6
Angola 6 292 5 565 1 587 - 3 668 - 5 255 310 -
Botswana 36 141 44 458 199 - 1 649 44 1 892 42 566 -
DRC 2 513 2 493 16 9 1 990 1 2 016 477 -
Lesotho 156 571 209 403 7 2 334 2 345 209 058 -

Statistics South Africa P0351
Tourism and migration, January 2016
13
Table 3 – Number of tourists by country of residence and mode of travel (continued)
Country of residence January Air (January 2016) (January 2016)
2015 2016 Cape Town King Shaka O.R. Tambo Other Total Road Sea
Madagascar 224 204 1 - 199 - 200 4 -
Malawi 14 519 12 282 10 2 1 712 18 1 742 10 540 -
Mauritius 1 466 1 753 329 68 1 193 - 1 590 162 1
Mozambique 136 272 145 775 3 64 4 002 12 4 081 141 693 1
Namibia 16 352 17 033 1 675 - 2 568 8 4 251 12 779 3
Seychelles 321 620 - - 609 - 609 11 -
Swaziland 71 376 75 176 3 - 395 3 401 74 774 1
Tanzania 2 834 2 968 5 2 1 852 - 1 859 1 109 -
Zambia 12 334 13 758 28 112 3 168 10 3 318 10 440 -
Zimbabwe 220 853 250 514 85 149 10 529 50 10 813 239 701 -
'Other' African 13 967 15 048 576 86 13 060 17 13 739 1 288 21
East and Central Africa 5 750 5 812 158 25 5 087 8 5 278 534 -
Burundi 77 80 2 1 68 - 71 9 -
Cameroon 651 632 21 1 571 - 593 39 -
Central African Republic 6 23 - - 23 - 23 - -
Chad 21 12 - 1 11 - 12 - -
Comoros 14 9 - - 8 - 8 1 -
Congo 404 317 17 - 296 - 313 4 -
Djibouti 2 4 - - 4 - 4 - -
Equatorial Guinea 70 45 1 - 42 2 45 - -
Eritrea 37 64 5 2 53 - 60 4 -
Ethiopia 470 450 38 17 293 - 348 102 -
Gabon 646 780 11 - 756 6 773 7 -
Kenya 2 109 2 097 32 2 1 846 - 1 880 217 -
Réunion 7 21 20 - - - 20 1 -
Rwanda 113 104 5 - 92 - 97 7 -
São Tomé and Príncipe 7 6 1 - 4 - 5 1 -
Somalia 9 21 1 - 15 - 16 5 -
Uganda 1 107 1 147 4 1 1 005 - 1 010 137 -

Statistics South Africa P0351
Tourism and migration, January 2016
14
Table 3 – Number of tourists by country of residence and mode of travel (concluded)
Country of residence January Air (January 2016) (January 2016)
2015 2016 Cape Town King Shaka O.R. Tambo Other Total Road Sea
West Africa 6 874 7 849 120 23 6 979 9 7 131 697 21
Benin 158 181 2 - 165 1 168 13 -
Burkina Faso 97 46 6 - 39 - 45 1 -
Cape Verde Island 72 38 9 - 24 - 33 5 -
Côte d’Ivoire 181 230 1 - 221 - 222 8 -
Gambia 36 29 - - 28 - 28 1 -
Ghana 1 515 1 398 14 4 1 221 - 1 239 159 -
Guinea 116 153 1 - 76 - 77 76 -
Guinea-Bissau 5 14 1 - 12 - 13 1 -
Liberia 15 42 - - 38 - 38 4 -
Mali 63 72 2 1 45 - 48 24 -
Mauritania 15 2 - - 1 - 1 1 -
Niger 9 15 1 - 14 - 15 - -
Nigeria 4 322 5 381 69 18 4 900 7 4 994 387 -
Saint Helena 14 21 - - - - - - 21
Senegal 161 140 10 - 124 1 135 5 -
Sierra Leone 35 53 2 - 41 - 43 10 -
Togo 60 34 2 - 30 - 32 2 -
North Africa 1 343 1 387 298 38 994 - 1 330 57 -
Algeria 231 103 19 3 75 - 97 6 -
Egypt 667 779 193 11 548 - 752 27 -
Libya 77 75 19 10 39 - 68 7 -
Morocco 121 108 19 2 79 - 100 8 -
South Sudan 70 70 3 - 64 - 67 3 -
The Sudan 109 161 28 10 118 - 156 5 -
Tunisia 65 91 17 2 71 - 90 1 -
Western Sahara 3 - - - - - - - -
Unspecified 813 688 27 - 516 - 543 145 -

Statistics South Africa P0351
Tourism and migration, January 2016
15
Table 4 – Number of tourists by country of residence and purpose of visit
Country of residence January Purpose of visit (January 2016)
2015 2016 Business Holiday Study
Total 877 712 1 012 641 25 275 972 836 14 530
Overseas 184 864 214 903 5 812 205 539 3 552
Europe 127 260 144 130 3 675 138 816 1 639
Austria 2 792 2 902 56 2 829 17
Belgium 3 465 3 749 89 3 574 86
Denmark 3 279 3 413 67 3 326 20
France 10 534 11 728 335 11 175 218
Germany 23 792 28 944 675 27 936 333
Ireland 2 547 2 708 87 2 588 33
Italy 3 981 4 617 187 4 357 73
Norway 2 066 2 022 41 1 924 57
Portugal 3 784 3 529 62 3 403 64
Spain 1 779 2 074 103 1 916 55
Sweden 4 988 5 625 127 5 457 41
Switzerland 5 320 5 424 60 5 317 47
The Netherlands 10 960 11 980 257 11 601 122
UK 39 776 46 264 1 177 44 744 343
Other 8 197 9 151 352 8 669 130
North America 24 219 26 962 711 25 426 825
Canada 4 632 5 176 127 4 990 59
USA 19 587 21 786 584 20 436 766
Central and South America 4 914 5 332 89 5 117 126
Argentina 586 1 082 14 1 055 13
Brazil 3 127 2 870 33 2 794 43
Mexico 166 272 17 240 15
Other 1 035 1 108 25 1 028 55

Statistics South Africa P0351
Tourism and migration, January 2016
16
Table 4 – Number of tourists by country of residence and purpose of visit (continued)
Country of residence January Purpose of visit (January 2016)
2015 2016 Business Holiday Study
Australasia 8 650 10 011 150 9 814 47
Australia 7 354 8 508 126 8 349 33
New Zealand 1 277 1 494 24 1 458 12
Other 19 9 - 7 2
Middle East 2 653 3 466 145 3 220 101
Iran 146 226 5 191 30
Israel 1 326 1 812 54 1 748 10
Saudi Arabia 514 621 16 587 18
Other 667 807 70 694 43
Asia 17 168 25 002 1 042 23 146 814
Bangladesh 407 399 17 369 13
China 4 885 9 406 278 9 013 115
India 6 010 6 638 452 5 919 267
Japan 1 228 2 579 113 2 440 26
Malaysia 407 413 15 354 44
Pakistan 1 016 1 157 44 1 053 60
Philippines 362 394 9 364 21
South Korea 1 306 2 187 36 1 967 184
Taiwan 381 408 11 384 13
Thailand 451 389 15 362 12
Other 715 1 032 52 921 59
Africa 692 035 797 050 19 422 766 651 10 977
SADC 678 068 782 002 18 646 754 254 9 102
Angola 6 292 5 565 40 4 500 1 025
Botswana 36 141 44 458 492 43 334 632
DRC 2 513 2 493 86 1 906 501
Lesotho 156 571 209 403 3 145 205 607 651

Statistics South Africa P0351
Tourism and migration, January 2016
17
Table 4 – Number of tourists by country of residence and purpose of visit (continued)
Country of residence January Purpose of visit (January 2016)
2015 2016 Business Holiday Study
Madagascar 224 204 8 170 26
Malawi 14 519 12 282 185 11 861 236
Mauritius 1 466 1 753 66 1 470 217
Mozambique 136 272 145 775 9 249 136 267 259
Namibia 16 352 17 033 1 649 13 688 1 696
Seychelles 321 620 8 590 22
Swaziland 71 376 75 176 619 73 599 958
Tanzania 2 834 2 968 90 2 591 287
Zambia 12 334 13 758 871 12 524 363
Zimbabwe 220 853 250 514 2 138 246 147 2 229
'Other' African 13 967 15 048 776 12 397 1 875
East and Central Africa 5 750 5 812 301 4 523 988
Burundi 77 80 4 62 14
Cameroon 651 632 26 472 134
Central African Republic 6 23 - 19 4
Chad 21 12 2 8 2
Comoros 14 9 - 8 1
Congo 404 317 5 203 109
Djibouti 2 4 - 3 1
Equatorial Guinea 70 45 - 28 17
Eritrea 37 64 2 60 2
Ethiopia 470 450 39 372 39
Gabon 646 780 3 580 197
Kenya 2 109 2 097 170 1 614 313
Réunion 7 21 - 21 -
Rwanda 113 104 3 73 28
São Tomé and Príncipe 7 6 1 5 -
Somalia 9 21 1 20 -
Uganda 1 107 1 147 45 975 127

Statistics South Africa P0351
Tourism and migration, January 2016
18
Table 4 – Number of tourists by country of residence and purpose of visit (concluded)
Country of residence
January Purpose of visit (January 2016)
2015 2016 Business Holiday Study
West Africa 6 874 7 849 321 6 790 738
Benin 158 181 3 163 15
Burkina Faso 97 46 2 41 3
Cape Verde Island 72 38 - 37 1
Côte d’Ivoire 181 230 14 192 24
Gambia 36 29 2 24 3
Ghana 1 515 1 398 82 1 201 115
Guinea 116 153 3 144 6
Guinea-Bissau 5 14 - 10 4
Liberia 15 42 2 36 4
Mali 63 72 5 63 4
Mauritania 15 2 - 2 -
Niger 9 15 3 11 1
Nigeria 4 322 5 381 180 4 659 542
Saint Helena 14 21 - 21 -
Senegal 161 140 20 113 7
Sierra Leone 35 53 1 47 5
Togo 60 34 4 26 4
North Africa 1 343 1 387 154 1 084 149
Algeria 231 103 19 74 10
Egypt 667 779 97 643 39
Libya 77 75 - 52 23
Morocco 121 108 14 88 6
South Sudan 70 70 1 54 15
The Sudan 109 161 10 101 50
Tunisia 65 91 13 72 6
Western Sahara 3 - - - -
Unspecified 813 688 41 646 1

Statistics South Africa P0351
Tourism and migration, January 2016
19
Table 5 – Number of tourists from overseas, SADC and 'other' African regions by sex and age group
Sex Age group January Region (January 2016)
2015 2016 Overseas SADC 'Other' African Unspecified
All Total 877 712 1 012 641 214 903 782 002 15 048 688
0-14 47 166 49 775 10 737 38 168 858 12
15-64 783 663 907 096 161 867 730 658 13 898 673
65+ 46 883 55 770 42 299 13 176 292 3
Male Total 504 516 567 876 116 750 440 783 9 954 389
0-14 23 662 24 671 5 472 18 760 430 9
15-64 456 638 514 452 88 641 416 061 9 373 377
65+ 24 216 28 753 22 637 5 962 151 3
Female Total 373 193 444 765 98 153 341 219 5 094 299
0-14 23 504 25 104 5 265 19 408 428 3
15-64 327 022 392 644 73 226 314 597 4 525 296
65+ 22 667 27 017 19 662 7 214 141 -

Statistics South Africa P0351
Tourism and migration, January 2016
20
5. Explanatory notes
NOTICE TO USERS
Statistics South Africa (Stats SA) has made changes in the Tourism and Migration statistical release starting from
the January 2014 statistics. This change has become necessary as a result of the implementation of the new
Movement Control System (e-MCS) at the country’s ports of entry. Currently the new system (e-MCS) is
operational at over 80% of the country’s ports of entry. The system roll-out is expected to be finalised by the end of
2015/16 financial year. The change affects the identification of Transit Travellers that are currently categorised
under Direction instead of Purpose of Movement. The revision, Table 1 and Table 2 in the release now include a
category for Transit while all tables reporting on tourists exclude transit travellers.
5.1 Introduction
Legal movements across South African borders as well as legal immigration into South Africa fall under the
jurisdiction of the Department of Home Affairs (DHA), Stats SA then processes, analyses and publishes this
information.
Administrative data sources from the DHA, that is, information from all the country’s ports of entry and applications
for permanent residence, constitute the only comprehensive source of information on foreign arrivals and
departures, documented immigrants and emigrants. The information from this source of data provides the best
national coverage (both in terms of space and time) of the population movements of South African residents and
foreign travellers. The data can be used for the following:
To estimate, monitor and understand salient characteristics of foreign travellers and volumes of South
African residents travelling outside South Africa.
To provide information that can be used to (a) assess the extent of government’s progress in strengthening
bilateral political and economic relations by assessing the number of international tourist arrivals; and (b)
benchmark surveys focusing on demand for local tourism services by foreign travellers.
5.2 Purpose of the statistical release
This release reports on arrivals, departures and transit travellers of South African residents and foreign travellers.
Detailed information on the age and sex distribution; mode of travel; national and regional distribution; and purpose
of travel of overnight visitors or tourists are also provided.
5.3 Scope and coverage
The release covers data collected by DHA officials on travellers who entered the Republic of South Africa (RSA)
through all the air, land and sea ports of entry.
5.4 Data
Information published in this release is based on data obtained from the following data sources within the DHA:
Data routinely collected by immigration officers at all road, air and sea entry ports on all travellers (South
African residents and foreign travellers) arriving into or departing from South Africa are captured into the
DHA’s population Movement Control System (MCS). The counts/statistics relate to the number of individual
movements, rather than to the number of people. Hence, the multiple movements of individual people
during the calendar month are each counted separately. Generally the data are collected directly from
travel documents either by scanning or capturing onto the port’s electronic database. No forms or cards are
used (except in rare occasions when the capturing system is down) to collect information from travellers.
Individual ports regularly transmit data onto the national database at the head office of the DHA
Stats SA receives downloaded data covering a particular calendar month from the DHA.

Statistics South Africa P0351
Tourism and migration, January 2016
21
As part of data interrogation, data from the O.R. Tambo International Airport, which has the highest volume
of travellers, are compared with passenger statistics from the Airport Company of South Africa (ACSA). As
expected, in any specific month, an increase in the volume of passengers reported by ACSA is
accompanied by an increase in the volume of travellers recorded by DHA. A similar pattern has been also
observed when the volume of travellers decreased. In January 2016, the DHA data was 2,5% higher than
that of ACSA.
5.5 Limitations
Due to technical problems at the data source not all required information could be captured in some of the months.
Hence some information was missed on individuals or even countries affecting the volume of tourists from such
countries. For example, the purpose of visit information that is used to determine whether a traveller is a visitor or
non-visitor, was not recorded for travellers from Tanzania in November and December 2014. Therefore it was not
possible to determine the number of tourists from the country during that period. This does not mean that there
were no tourists from such countries but rather their volume could not be determined. Likewise either low or no
numbers were observed from countries such as South Korea and Taiwan.
The information on the total number of arrivals and departures of South African residents is collected from the
scanning of passports. However, data are not collected from passengers on country visited; country of final
destination, the duration of stay; intended duration of stay and purpose of visit. With this limitation, it is impossible
to identify the number of tourists from the data on South African residents.
5.6 Definitions of terms
5.6.1 Definitions used by the United Nations World Tourism Organisation (UNWTO)
Traveller is someone who moves between different geographical locations for any purpose and any duration.
Visitor refers to any person travelling to a place other than that of his/her usual environment for less than 12 months
and whose main purpose of the trip is other than the exercise of an activity remunerated from within the place visited.
Same-day visitor is a visitor who visits a place for less than one night.
Tourist (overnight visitor) is a visitor who stays at least one night in collective or private accommodation in the
place visited.
Tourism comprises the activities of persons travelling to, and staying in places outside their usual environment, for
not more than one consecutive year, for leisure, business and other purposes. The usual environment of a person
consists of a certain area around his/her place of residence, plus all other places he/she frequently visits.
5.6.2 Definitions used specifically in this release
South African resident refers to either a South African citizen or a non-South African citizen with a South African
permanent residence permit.
Foreign traveller refers to a traveller who is not a South African citizen or permanent resident.
Region refers to the following country classification:
– Overseas: Europe, North America, Central and South America, Australasia, the Middle East and Asia.
– Africa: SADC and ‘other’ Africa (East and Central Africa, West Africa and North Africa).
Country refers to individual countries within a region. The country of residence is used. The country of residence
should not be confused with the country from which the visitor travelled.
Africa refers to all the countries in Africa (both mainland and island countries).
SADC refers to the fourteen countries, excluding South Africa, which belong to the Southern African Development
Community.
‘Other’ African refers to all non SADC African countries.

Statistics South Africa P0351
Tourism and migration, January 2016
22
Overseas refers to all countries outside Africa.
Trip refers to the arrival and departure of a visitor in a specified month.
5.7 Symbols used
- = nil
< = less than
6. General information
Stats SA publishes approximately 300 different statistical releases each year. It is not economically viable to
produce them in more than one of South Africa's eleven official languages, since the releases are used extensively,
not only locally but also by international economic and social-scientific communities. Stats SA releases are
published in English.
Stats SA has copyright on this publication. Users may apply the information as they wish, provided that they
acknowledge Stats SA as the source of the basic data wherever they process, apply, utilise, publish or distribute
the data; and also that they specify that the relevant application and analysis (where applicable) result from their
own processing of the data.
Advance release calendar
An advance release calendar is disseminated at www.statssa.gov.za
Stats SA products
A complete set of Stats SA publications is available at the Stats SA Library and the following libraries:
National Library of South Africa, Pretoria Division
National Library of South Africa, Cape Town Division
Natal Society Library, Pietermaritzburg
Library of Parliament, Cape Town
Bloemfontein Public Library
Johannesburg Public Library
Eastern Cape Library Services, King William’s Town
Central Regional Library, Polokwane
Central Reference Library, Mbombela
Central Reference Collection, Kimberley
Central Reference Library, Mafikeng
Stats SA also provides a subscription service.

Statistics South Africa P0351
Tourism and migration, January 2016
23
Electronic services
A large range of data are available via online services, diskette and computer printouts. For more details about our
electronic data, contact user information services.
You can visit us on the Internet at www.statssa.gov.za
Enquiries
Telephone: (012) 310 8600/ 8390/ 8351/ 4892/ 8496/ 8095 (user information services)
(012) 336 0251 (technical enquiries)
(012) 310 8161 (orders)
(012) 310 4883/4885/8018 (library)
Fax: (012) 310 8500/ 8495 (user information services)
(012) 310 6937 (technical enquiries)
Email: [email protected] (technical enquiries)
[email protected] (user information services)
[email protected] (orders)
Postal address: Private Bag X44, Pretoria, 0001
Produced by Stats SA