SOCIAL AND ECONOMIC DIMENSIONS OF AN AGING POPULATION … · SEDAP A PROGRAM FOR RESEARCH ON SOCIAL...
36
SEDAP A PROGRAM FOR RESEARCH ON SOCIAL AND ECONOMIC DIMENSIONS OF AN AGING POPULATION An Evaluation of the Working Income Tax Benefit William Scarth Lei Tang SEDAP Research Paper No. 220
-
Upload
doankhuong -
Category
Documents
-
view
215 -
download
0
Transcript of SOCIAL AND ECONOMIC DIMENSIONS OF AN AGING POPULATION … · SEDAP A PROGRAM FOR RESEARCH ON SOCIAL...
S E D A PA PROGRAM FOR RESEARCH ON
SOCIAL AND ECONOMICDIMENSIONS OF AN AGING
POPULATION
An Evaluation of the Working Income Tax Benefit
William ScarthLei Tang
SEDAP Research Paper No. 220
For further information about SEDAP and other papers in this series, see our web site: http://socserv.mcmaster.ca/sedap
Requests for further information may be addressed to:Secretary, SEDAP Research Program
Kenneth Taylor Hall, Room 426McMaster University
Hamilton, Ontario, CanadaL8S 4M4
FAX: 905 521 8232e-mail: [email protected]
August 2007
The Program for Research on Social and Economic Dimensions of an Aging Population (SEDAP) is aninterdisciplinary research program centred at McMaster University with co-investigators at seventeen otheruniversities in Canada and abroad. The SEDAP Research Paper series provides a vehicle for distributingthe results of studies undertaken by those associated with the program. Authors take full responsibility forall expressions of opinion. SEDAP has been supported by the Social Sciences and Humanities ResearchCouncil since 1999, under the terms of its Major Collaborative Research Initiatives Program. Additionalfinancial or other support is provided by the Canadian Institute for Health Information, the CanadianInstitute of Actuaries, Citizenship and Immigration Canada, Indian and Northern Affairs Canada, ICES:Institute for Clinical Evaluative Sciences, IZA: Forschungsinstitut zur Zukunft der Arbeit GmbH (Institutefor the Study of Labour), SFI: The Danish National Institute of Social Research, Social DevelopmentCanada, Statistics Canada, and participating universities in Canada (McMaster, Calgary, Carleton,Memorial, Montréal, New Brunswick, Queen’s, Regina, Toronto, UBC, Victoria, Waterloo, Western, andYork) and abroad (Copenhagen, New South Wales, University College London).
This paper is cross-classified as No. 424 in the McMaster University QSEP Research Report Series.
An Evaluation of the Working Income Tax Benefit
William ScarthLei Tang
SEDAP Research Paper No. 220
1
An Evaluation of the Working Income Tax Benefit
by
William Scarth and Lei Tang* McMaster University
Abstract: The federal government has implemented an earned income tax credit – what it has called the Working Income Tax Benefit – in the 2007 Budget. Edmund Phelps has argued that the earned income tax credit in the United States should be replaced with an employment subsidy. This paper assesses the importance of Phelps’ concern, and related issues, for Canada. This debate is important for two reasons: the plight of those blocked by the "welfare wall" is dire, and the entire community has an interest in lower structural unemployment in an environment that involves an aging population and an accompanying labour shortage. Keywords: earned income tax credit, employment subsidy, open economy JEL Classifications: I38, J38, E25, F41 Résumé : Le gouvernement fédéral a mis en place un crédit d’impôt sur les revenus salariaux – qu’il a nommé Prestation fiscale pour le revenu gagné – dans le Budget de 2007. Edmund Phelps a soutenu que le crédit d’impôt sur les revenus salariaux aux États-Unis devrait être remplacé par une subvention à l’emploi. Cette étude évalue l’importance de la question soulevée par Phelps et des questions relatives à celle-ci dans le contexte du Canada. Le débat est important pour deux raisons: la condition de ceux qui se retrouvent dans l’impasse créé par le « mur du bien-être social » est très préoccupante, et la communauté entière a intérêt à réduire le niveau du chômage structurel dans un environnement caractérisé par le vieillissement de la population et la pénurie résultante de la main-d’œuvre. *Department of Economics, McMaster University, Hamilton, Ontario, L8S 4M4. Please address correspondence to William Scarth ([email protected]). We are indebted to the editor, an associate editor, and two referees for helpful comments. Financial support from two sources (the Faculty of Social Science Experiential Education Internship Program and the SEDAP Research Program) is also gratefully acknowledged.
2
An Evaluation of the Working Income Tax Benefit
1. Introduction
The federal government’s Budget Plan of 2007 contained a detailed discussion of
the “welfare wall” – the fact that social assistance recipients face such significant
financial barriers to paid employment that their after-tax-and-transfer-receipt resources
can actually fall as they move into the workforce (pages 78-81). While some progress has
been made in recent years by lowering the welfare wall for families with children, the
government has now begun to address this problem more generally by introducing a
Working Income Tax Benefit for all low-income Canadians. The annual funding starts at
$500 million, and the program's scope is to increase to $1 billion annually soon.
It is interesting that – as the Canadian government is taking steps to catch up to its
American counterpart on this front (the United States has had an earned income tax credit
for 30 years) – there have been calls for disbanding the earned income tax credit program
there. For example, Nobel laureate Edmund Phelps (1997) makes the case for replacing
the earned income tax credit with an employment subsidy. In Phelps’ proposal, firms
would receive a per-person subsidy that would cover a fraction of the wage paid to each
low-income employee. As Phelps argues (1997, pages 88, 132-134), with a subsidy to
employers, the general level of low-skill wages would be bid up, so that even individuals
not covered by the program would be helped. With the earned income tax credit given to
employees, on the other hand, there is downward pressure on the pre-tax level of low-
skill wage rates, so individuals not covered by the program are hurt.
3
This paper has two purposes: first, to evaluate the relevance of Phelps’ concerns
for Canada, and second, to assess the likely impact of Finance Canada’s specific
initiative, by reporting some simulation results. The model that has been used to generate
these results is outlined in sections 2 and 3 (and is listed formally in the Appendix). The
results are discussed in sections 4 and 5, and concluding remarks are offered in section 6.
2. A Framework for Evaluating Broadly Available Earned-Income-Tax-Credit and
Employment-Subsidy Programs
Several features are important for our model to be taken seriously as a vehicle for
illuminating policy options for Canada. First, the production process in the model must
allow skilled labour to be distinguished from unskilled labour, since the government
initiatives under study apply only to the latter. For this reason, in the basic version of our
analysis we define capital very broadly – to include both physical equipment and human
capital (skilled labour). We report on a sensitivity test that treats these two forms of
capital differently in the Appendix.
The second desirable feature of a model is that it respects the “globalization”
constraint that confronts small open economies such as Canada. Owners of capital can
and do relocate the employment of their factors of production to achieve the most
favourable after-tax yield. If the domestic government raises taxes on capitalists or
skilled individuals to finance initiatives that are intended to provide support for those on
lower incomes, skilled labour and physical capital can leave the country. We expect that
this international reallocation of skilled labour and capital proceeds up to the point that
after-tax yields have returned to their pre-policy levels. Our model is consistent with this
4
constraint, since the supply of broadly defined capital is assumed to be perfectly elastic at
the level of the after-tax yield that is available elsewhere. On the other hand, since the
unskilled are not mobile internationally, a fixed supply of such individuals is specified.
A third important feature of the model is that there is involuntary unemployment
among the unskilled. This is necessary for two reasons – the model needs to be realistic
and there must be a subset of the population that does not benefit from the policies that
we are examining (limited as they are for those who are in work). To address Phelps’
concern, we need to focus on how the policies affect those who remain out of work.
Further, it is desirable that this unemployment depend on market incentives in a standard
fashion. After all, the underlying appeal of both the earned income tax credit and
employment subsidies is that they try to create desirable market incentives – not
undesirable ones (that lead individuals to stay unemployed). We satisfy this objective in
the model by including the simplest version of efficiency-wage theory (Summers 1988).
Given that firms are unable to perfectly monitor individual worker effort, but they want
to induce a high level of worker motivation and productivity, firms pay a wage that is
above the competitive level by the profit-maximizing amount. In the model, it is this
increase in the general level of the unskilled wage that causes unemployment to persist in
full equilibrium. There is no unemployment in the skilled labour market, since firms
encounter no motivation problem among those who have “good jobs”.
The fourth important feature of the model is the government budget constraint.
This relationship makes explicit how the government is paying for either contemplated
initiative that is intended to alleviate part of the welfare-wall problem.
5
The final prerequisite for an appealing analysis is that it be both optimization-
based (so that it is acceptable to mainstream professional economists) and that it be
simplified and highly aggregative (so that it can be understood independently by the
many non-economists who are involved in this policy debate).
The nine-equation system that is outlined in the remainder of this section of the
paper defines a model that meets all the prerequisites just mentioned. For those who are
interested, there is an Appendix that formally lists the equations, but the main text of the
paper can be read without reference to the Appendix.
The input-output function is standard; output is higher if the employment of either
broadly defined capital or unskilled labour is higher. Other things equal, more of one
input raises output, but – given diminishing returns – by ever smaller amounts as the
other input becomes relatively scarce. The most common specific relationship that
embodies this feature is the Cobb-Douglas production function, which we assume. There
is one key parameter in this relationship, which defines the share of income going to each
factor, and we consider two assumptions when choosing a numerical value for this
parameter.
Initially we focus on the broad question raised by Phelps: should the government
provide support to those on low incomes through an initiative that operates on the
demand-side, or one that operates on the supply-side, of the labour market? That is,
should the government offer a subsidy to firms for employing low-skilled individuals, or
should it offer an earned income tax credit directly to those receiving low incomes? We
consider this question by comparing situations that involve a fully developed
commitment to one policy or the other. Specifically, we assume that each government
6
policy has been expanded so that all households that fall below the average income level
qualify for support. We assume that there are two equal-sized groups in the population –
one “rich” and the other “poor”. The rich derive income in two ways, by renting out the
physical capital that they own, and by working. Since these individuals have human
capital, they receive the skilled wage rate. The “poor” have no capital; as a result – other
than employment-insurance receipts – their income is employment earnings, and they are
paid the unskilled wage. We assume that all three factors of production (physical capital,
skilled labour and unskilled labour) each receive one-third of the total income that is
created in the production process. Since, as noted, we assume that there are equal
numbers of skilled and unskilled individuals, the "rich” receive two-thirds of national
income. As noted, for simplicity, we assume that human capital and physical capital can
be lumped together, and we specify a two-factor input-output function, with the
exponents of broadly defined capital and unskilled labour being fractions a and (1 – a).
For realistic illustrative simulations, we calibrate by setting a equal to two-thirds.
As explained in the appendix, we consider an alternative definition of the
production process that separates the two forms of capital. This alternative specification
yields very similar results.
The modeling strategy that we have just outlined is appealing if we wish to
investigate the relative appeal of the two broad approaches to a thorough-going attack on
income inequality. That is, our initial simulations focus on outcomes that can be expected
after each policy has been expanded to the point that its coverage extends to all those at
the lower end of the economic ladder. Of course, at the current level of funding, Canada’s
Working Income Tax Benefit does not cover anything like this proportion of the

7
population. Thus, after comparing the alternative approaches to the general problem of
income inequality, we adjust the model to make it more suitable for assessing the limited
initiative that the government has introduced at this time. These alterations, which
include a very different value for the income-share parameter, a, are discussed in section
3 below.
Firms choose the employment levels of the two inputs to maximize profits, and –
in the initial set of reported simulations – they also choose the level of wages they pay
their unskilled workers with the same objective in mind. Profits equal sales revenue
(output) minus the rental payments made to the owners of the two factors – “capital”
(machines and skilled workers) and unskilled workers. Firms do not get to choose the
rental rate they pay for the internationally mobile inputs (skilled labour and capital) since
this level of remuneration is determined in international markets by what these factors
can receive elsewhere. Firms’ factor-demand functions are standard; they hire each of the
factors up to the point that its marginal product is just equal to the rental payment that
firms must pay to employ that input. The fact that firms find it profitable to use a “high”
unskilled wage policy to induce higher productivity from its unskilled employees results
in unemployment. The level of structural unemployment depends on five parameters. The
higher is the workers’ aversion-to-effort parameter, the income-tax rate, and the
employment-insurance generosity parameter, the higher is the unemployment rate; while
the higher is the earned-income-tax-credit and employment subsidy parameter, the lower
is the unemployment rate. In the numerical simulations, all these policy parameters are
set to realistic values, and the aversion-to-effort parameter is chosen to generate an initial
unemployment rate for the entire nation of 6 percent.
8
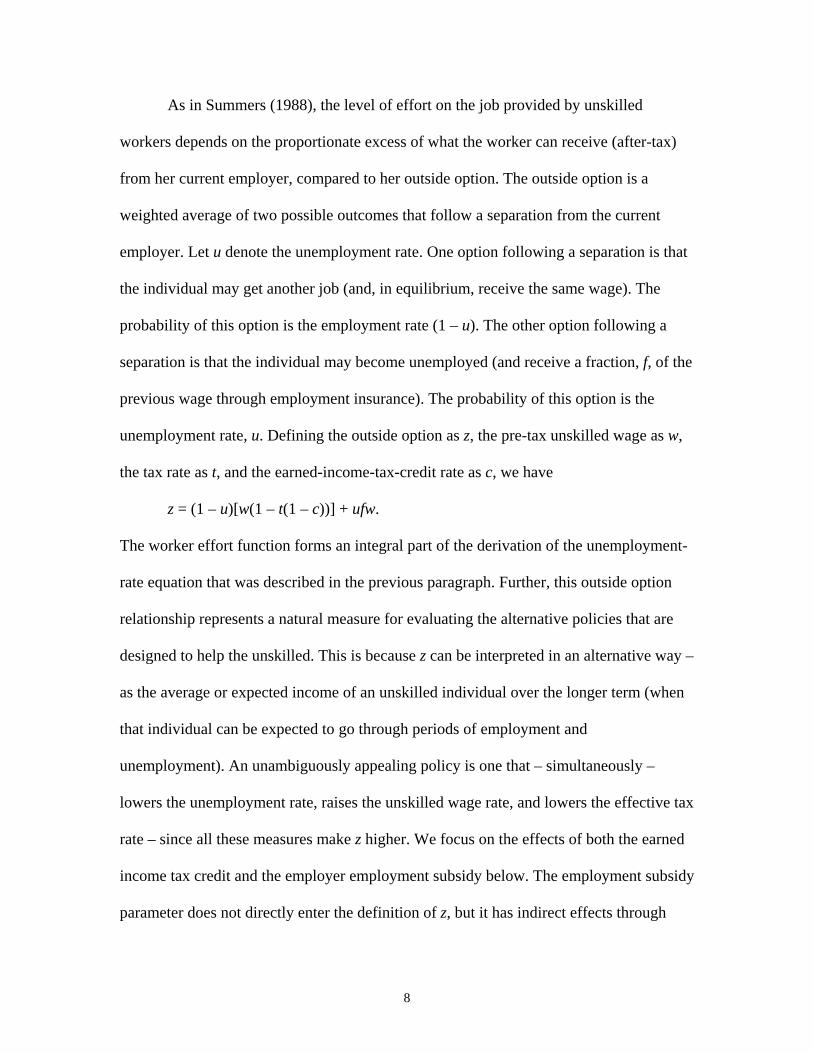
As in Summers (1988), the level of effort on the job provided by unskilled
workers depends on the proportionate excess of what the worker can receive (after-tax)
from her current employer, compared to her outside option. The outside option is a
weighted average of two possible outcomes that follow a separation from the current
employer. Let u denote the unemployment rate. One option following a separation is that
the individual may get another job (and, in equilibrium, receive the same wage). The
probability of this option is the employment rate (1 – u). The other option following a
separation is that the individual may become unemployed (and receive a fraction, f, of the
previous wage through employment insurance). The probability of this option is the
unemployment rate, u. Defining the outside option as z, the pre-tax unskilled wage as w,
the tax rate as t, and the earned-income-tax-credit rate as c, we have
z = (1 – u)[w(1 – t(1 – c))] + ufw.
The worker effort function forms an integral part of the derivation of the unemployment-
rate equation that was described in the previous paragraph. Further, this outside option
relationship represents a natural measure for evaluating the alternative policies that are
designed to help the unskilled. This is because z can be interpreted in an alternative way –
as the average or expected income of an unskilled individual over the longer term (when
that individual can be expected to go through periods of employment and
unemployment). An unambiguously appealing policy is one that – simultaneously –
lowers the unemployment rate, raises the unskilled wage rate, and lowers the effective tax
rate – since all these measures make z higher. We focus on the effects of both the earned
income tax credit and the employer employment subsidy below. The employment subsidy
parameter does not directly enter the definition of z, but it has indirect effects through
9
some of the other variables, since this policy does affect the wage rate, the unemployment
rate, and (depending on how it is financed) the tax rate.
For the initial set of experiments, the number of unskilled individuals who choose
to be in the labour force is fixed (at unity). As a result, the number of unskilled that are
employed is one minus the unemployment rate. The number of citizens who are skilled is
fixed as well, but the proportion that choose to work in the domestic economy is
determined within the model. These individuals have the option of receiving the domestic
skilled wage, r, and then paying tax rate, t, on that wage income, or of receiving an after-
tax wage of r* in the rest of the world. One of the equations in the model is r(1 – t) = r*,
which stipulates that once the domestic government sets the tax rate, the domestic skilled
wage is determined by this equation. Since we are treating physical capital in exactly the
same manner as workers with human capital (skilled labour), the same relationship that
connects domestic and foreign skilled-labour wage rates pins down the domestic interest
rate as well. In short, this relationship imposes the globalization constraint. The taxes that
are nominally levied on the “rich” (owners of all mobile factors of production) are passed
on to the “poor” (immobile unskilled individuals), since increases in the domestic tax rate
simply raise the pre-tax rates of return received by the “rich” mobile factor owners. Note
that, because of this perfect-mobility specification, it is impossible for any domestic
government policy to affect the skilled individuals or the capitalists at all. One of two
things happens whenever the incomes of these individuals are threatened. Either these
individuals are “compensated” by the adjustment in their pre-tax return that is just
necessary (if they stay employing their factor domestically), or they move without cost to
the rest of the world (and receive there exactly what they had been receiving
10
domestically). As a result, we know that these individuals are indifferent to all policies
we examine. That is why we can focus exclusively on the policy-induced effect on the
average income of the unskilled individuals (the z measure discussed above).
Finally, the government budget constraint states that the uses of government funds
(spending on programs that have no direct effect on labour markets, the employment
subsidy payments, and employment insurance) equal the sources of government funds
(the net-of-credit taxes on all earned incomes). Only the unskilled qualify for the tax
credit, and it is only when firms hire the unskilled that they qualify for the employment
subsidy. Initially, it is assumed that there is no working income tax benefit and no
employment subsidy, but that there is an untaxed employment insurance payment given
to the unemployed – equal to one-third of the pre-tax unskilled wage. The ratio of other
program spending to GDP is set at 20%, and the proportional income tax rate is set to
balance the budget.
3. A Framework for Evaluating a Narrowly-Targeted Earned-Income-Tax-Credit
Policy
The second set of simulations that we report focuses specifically on a personal
income tax cut that is offered to particularly poor households. Several alterations to the
model are made to reflect the fact that the government’s Working Income Tax Benefit is
a narrowly targeted program. Specifically, with the new policy, if a family receives more
than about $15,000 annually, the size of that household’s tax break begins to be phased
out. Once an annual income of about $22,000 is reached the household is too “rich” to
qualify at all. Clearly, this initiative is not designed to affect 50% of the population.
11
Further, at these low income levels, it is likely that many individuals would be earning no
more than the minimum wage. With a binding minimum wage, firms cannot choose the
profit-maximizing wage. Thus, for the second set of reported simulations, we alter the
model so that the minimum-wage constraint is binding for all the “poor.” We assume that
this targeted group represents only 10%, not 50% of the population, and – to reflect the
estimated Canadian Lorenz curve – we assume that this bottom 10% of the population
receives 2% of national income.
A second alteration to the model concerns the labour-force-participation
behaviour of the poor. In our assessment of widely available low-income-support
programs, we simplified the model by assuming that the aggregate wage elasticity of
labour supply is zero. This is an entirely reasonable assumption on empirical grounds.
But for an analysis that restricts the low-income group to the very poor, the zero labour-
supply elasticity assumption is less appealing. Indeed, Finance Canada is hoping that
some individuals may be tempted to join the labour force as a result of the Working
Income Tax Benefit. To allow for this possibility, we consider values for the labour
supply elasticity that range between zero and one in the simulations that concern the
targeted-to-very-poor earned income tax credit. With a variable participation rate (that is,
when p is not fixed at unity), the index of the poor's material welfare becomes .pzv =
The final alteration in the model that is used to simulate the government’s limited
initiative is that it is financed either by an increase in the tax on the rich, or by a cut in
government spending. In either case, the amount involved involves the proportion of
GDP that reflects the funding the federal government has actually earmarked for the
Working Income Tax Benefit.
12
In the simulations it is assumed that all poor individuals benefit (and to the same
extent) from the program. As noted above, the actual policy involves both phase-in and
phase-out ranges of income, within which individuals and families receive only partial
benefit. Unfortunately, if the model were adjusted to allow for this feature in a thorough
manner, we would have to allow for an entire range of differing abilities within the low-
skilled portion of the population. Such a re-specification would raise the level of
complexity of the analysis, and detract from our intended focus – which is on open-
economy macroeconomic effects. Existing research has focused on partial-equilibrium
analyses of labour market behaviour, and on the associated micro empirical work. Our
strategy has been to highlight some important issues that have received less attention, and
to accomplish this goal in a transparent fashion we need to use a highly aggregative
framework. Nevertheless, we have constructed the model in a way that makes
heterogeneity across agents of limited concern.
The worker-effort function (which is taken directly from Summers (1988)) and
the labour-force-participation-rate function both involve a constant-elasticity feature.
This property implies that the aggregate labour-supply responses are the same no matter
how the individual responses are distributed across individual poor households. As a
result, even though we have not allowed some individuals to have their tax breaks
reduced through phase-in or phase-out considerations, the simulations still provide the
appropriate aggregate outcomes. This is true as long as we impose (as we do) that the
government in the model provides the same total amount of tax relief as does the actual
government policy, and as long as these constant-elasticity functional forms reflect actual
behaviour. Of course, despite the fact that these functional forms are entirely standard, it
13
is possible that they do not. But even if this is the case, we know the direction of the bias
that might be involved in our simulations, since they would then represent the maximum
possible effects of the policy. And if our functional form assumptions are reasonably
applicable to the “real world,” this “upward bias” in our estimated effects is likely to be
quite small.
Some upward bias may remain, however, since we have assumed a 100% “take-
up” rate among potential beneficiaries of the policy. In actual fact, incomplete awareness
of programs such as the Working Income Tax Benefit often results in less than a 100%
utilization of the program by individuals. Our simulations involve the assumption that the
government responds to this possibility by expanding the program so that all the
designated funds are, in fact, spent. If this assumption about the government’s response to
incomplete take-up rates is accurate, then there is no reason to suspect a significant
upward bias in our simulations.
4. Simulation Results: Broadly Available Low-Income Support Initiatives
As noted above, we discuss our results in two stages. We begin with the broadly
based initiatives that are made available to all low-income individuals – assumed to be
50% of the population. In this setting, the emphasis is on comparing an earned income
tax credit to alternative approaches to supporting the working poor. Following this
discussion, in section 5, we focus on a Working Income Tax Benefit that is targeted to a
much smaller, quite poor, segment of the population.
For the broadly available initiatives, five simulations are reported. First, we
introduce an earned income tax credit for the unskilled – as big an initiative that is
14
possible after the overall income tax rate (that is applied to earned incomes, net of any
allowed credit, of all factor owners) is raised by one percentage point. Second, we
introduce an employer employment subsidy for firms that hire unskilled individuals –
again, as much as can be done with an increase in the general income tax rate of one
percentage point.
Some readers may prefer to consider financing these initiatives by cutting other
program spending, or by using some of the room in the budget that would emerge as the
government’s interest payment obligations shrink following a policy of debt reduction.
For example, the Canadian government is expected to receive a “fiscal dividend” of about
4% of GDP as the debt-to-GDP ratio falls from its peak in the early 1990s to its 20%-by-
2020 target. Still other readers may think that it might be better to dispense with either
initiative, and simply use such new room in the government’s budget to finance a general
tax cut. Such a policy would lead to more capital and skilled labour entering the country.
With more complementary factors of production to work with, unskilled labour would be
more productive, so pre-tax wages would increase. As a result, the unskilled would
benefit, and perhaps by an even greater amount than with either an earned income tax
credit or an employment subsidy. To ensure that we present results that will be of interest
to readers who have any of these possible prior views, we report three further
simulations. We cut other programs by one percentage point of GDP, and use the
proceeds to finance three possible initiatives – the creation of an earned income tax
credit, the creation of an employment subsidy, or the provision of a general tax cut.
As explained above, none of the policies affect the net position of the “rich” (the
skilled individuals or the capitalists). Thus, we focus on the material welfare of the
15
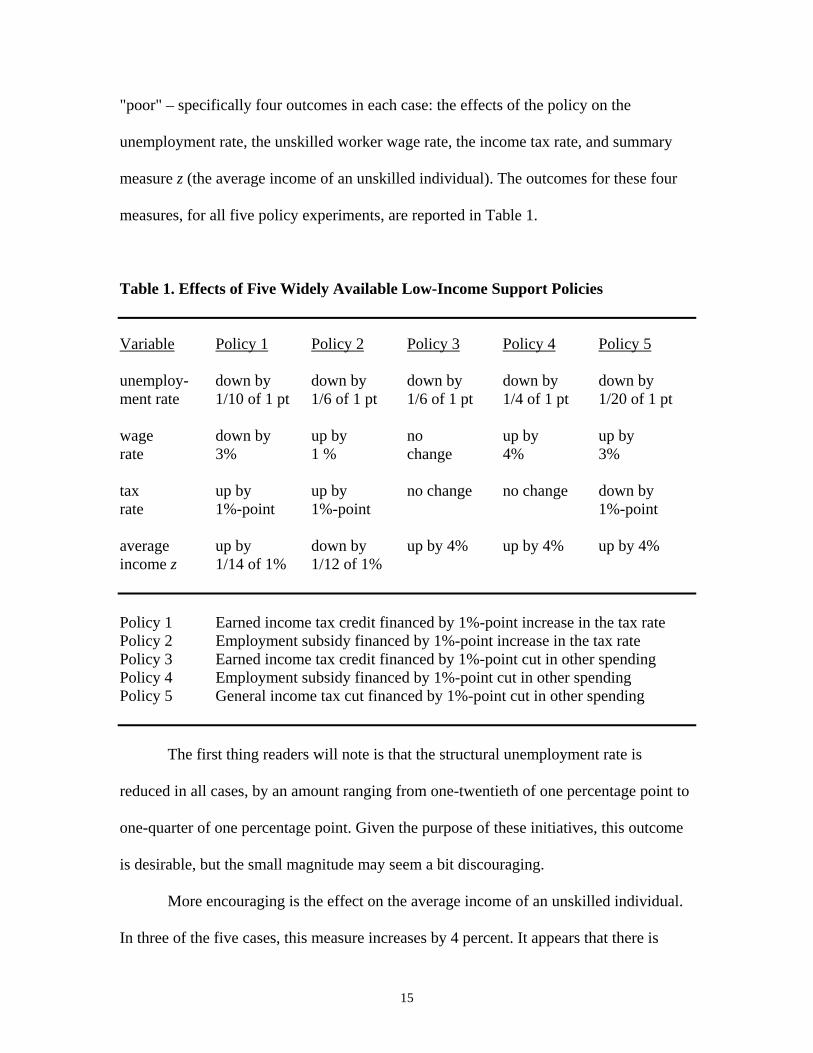
"poor" – specifically four outcomes in each case: the effects of the policy on the
unemployment rate, the unskilled worker wage rate, the income tax rate, and summary
measure z (the average income of an unskilled individual). The outcomes for these four
measures, for all five policy experiments, are reported in Table 1.
Table 1. Effects of Five Widely Available Low-Income Support Policies
Variable Policy 1 Policy 2 Policy 3 Policy 4 Policy 5
unemploy- down by down by down by down by down by ment rate 1/10 of 1 pt 1/6 of 1 pt 1/6 of 1 pt 1/4 of 1 pt 1/20 of 1 pt wage down by up by no up by up by rate 3% 1 % change 4% 3% tax up by up by no change no change down by rate 1%-point 1%-point 1%-point average up by down by up by 4% up by 4% up by 4% income z 1/14 of 1% 1/12 of 1% Policy 1 Earned income tax credit financed by 1%-point increase in the tax rate Policy 2 Employment subsidy financed by 1%-point increase in the tax rate Policy 3 Earned income tax credit financed by 1%-point cut in other spending Policy 4 Employment subsidy financed by 1%-point cut in other spending Policy 5 General income tax cut financed by 1%-point cut in other spending
The first thing readers will note is that the structural unemployment rate is
reduced in all cases, by an amount ranging from one-twentieth of one percentage point to
one-quarter of one percentage point. Given the purpose of these initiatives, this outcome
is desirable, but the small magnitude may seem a bit discouraging.
More encouraging is the effect on the average income of an unskilled individual.
In three of the five cases, this measure increases by 4 percent. It appears that there is

16
nothing to choose between the three initiatives on this score. What is important is
whether the initiatives are financed by a tax increase or a spending cut. Tax increases hurt
the unskilled both directly and indirectly. The indirect effect follows from the fact that
tax increases induce skilled individuals and capitalists to shift their factors to employment
opportunities outside the country. With less of these complementary factors to work with
in the domestic economy, the unskilled are less productive, and this development puts
downward pressure on their market wage. With the earned income tax credit, a 3 percent
fall in wages results. Overall, with this policy, there are four competing effects on the
economic welfare of the unskilled. They are helped by the lower unemployment rate and
by the tax credit, but they are hurt by the lower pre-tax wage and by the higher tax rate to
which the tax credit applies. The formal model is required to assess the relative
magnitude of these four effects, and – as indicated in column 1 of Table 1 – we find that
the four effects just about exactly cancel off. There is a very small rise in the average
income measure of the unskilled, but for all intents and purposes, no noticeable change.
There are also competing effects with the employment subsidy. As Phelps has
argued – other things equal – the subsidy raises the unskilled wage, so, in this case, we
expect two favourable effects: higher wages and lower unemployment. But the
unfavourable development – the higher tax rate – generates two undesirable outcomes.
First, workers lose disposable income directly (through the higher tax), and – other things
equal – there is downward pressure on their pre-tax wage (given that these individuals
have less capital to work with). As already discussed, with the complementary inputs
(skilled labour and physical capital) being less available (after the higher taxes have
“pushed” some these factors out of the country) unskilled labour is less productive, so it
17
commands a lower wage. Phelps’s analysis did not consider this indirect negative effect,
since his “closed economy” analysis abstracts from this “globalization” constraint. We
see, in the “Policy 2” column in Table 1, that this effect is important, but it is not the
dominant one; on balance, the unskilled wage does rise – but by only a small amount (1
percent). As a result, the outcome which Phelps has stressed as an important feature of
his proposal is much weaker than he expects it to be, and – overall – the average (after-
tax) income level of the unskilled actually falls by a small amount. All in all, when
financed by higher taxes, neither the earned income tax credit nor the employment
subsidy receives any significant support from our analysis.
Readers may be puzzled as to why the average income of an unskilled individual
falls slightly with the employment subsidy (Policy 2 in Table 1), while this summary
measure increases slightly with the earned income tax credit (Policy 1 in Table 1). Given
that the pre-tax wage rises more, and that the unemployment rate falls more, with the
employment subsidy, why is it this policy that is slightly worse for the unskilled? This
outcome emerges because the tax rate that applies with the employment subsidy, t, is
bigger than the tax rate that confronts individuals who receive an earned income tax
credit, t(1 – c).
A different overall conclusion is warranted when the initiatives are financed by
reallocating expenditures away from interest payments on the debt or from cutting other
program spending (Policies 3, 4 and 5 in Table 1). In these cases, the average income of
the unskilled measure rises by an impressive 4 percent. The main reason for this
difference in results is that – in this case, with no increase in taxes – mobile capital is not
induced to leave the country. Unskilled workers do not suffer the same loss in
18
productivity that was central to the earlier results, so in this case, their wages increase. In
addition, a significant reduction in the unemployment rate accompanies both the earned
income tax credit and the employment subsidy, so the analysis supports the proposition
that either of these initiatives dominates a standard tax cut.
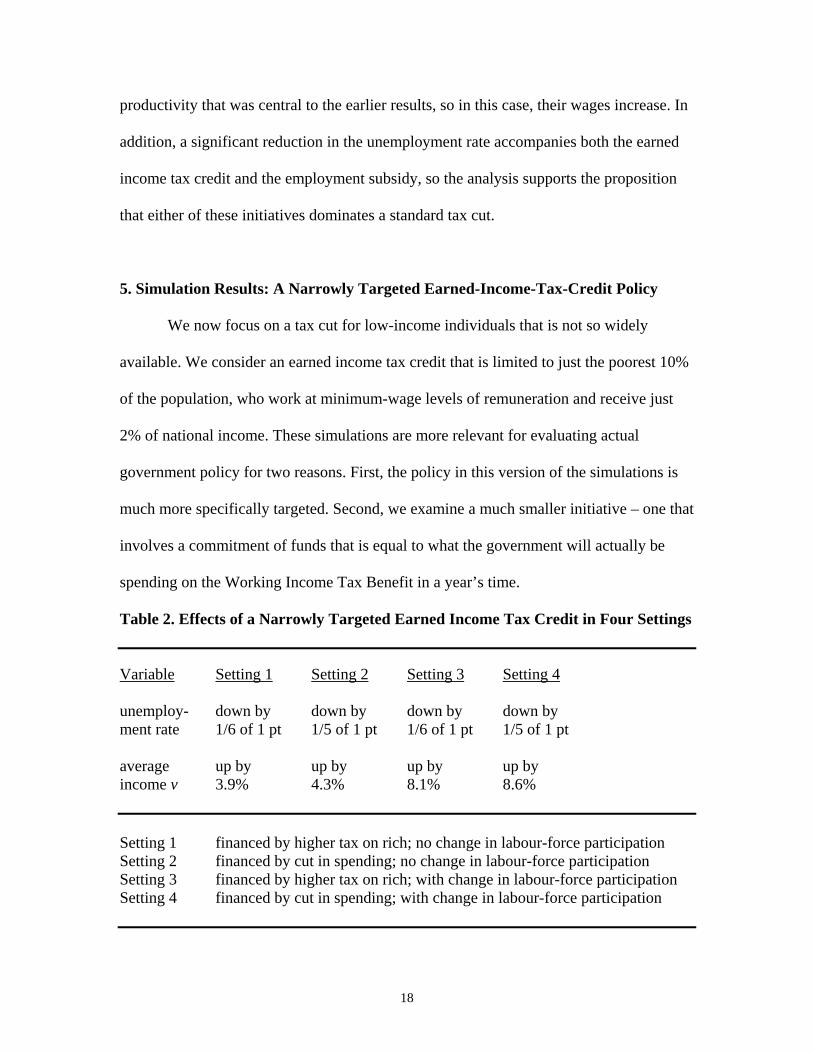
5. Simulation Results: A Narrowly Targeted Earned-Income-Tax-Credit Policy
We now focus on a tax cut for low-income individuals that is not so widely
available. We consider an earned income tax credit that is limited to just the poorest 10%
of the population, who work at minimum-wage levels of remuneration and receive just
2% of national income. These simulations are more relevant for evaluating actual
government policy for two reasons. First, the policy in this version of the simulations is
much more specifically targeted. Second, we examine a much smaller initiative – one that
involves a commitment of funds that is equal to what the government will actually be
spending on the Working Income Tax Benefit in a year’s time.
Table 2. Effects of a Narrowly Targeted Earned Income Tax Credit in Four Settings
Variable Setting 1 Setting 2 Setting 3 Setting 4
unemploy- down by down by down by down by ment rate 1/6 of 1 pt 1/5 of 1 pt 1/6 of 1 pt 1/5 of 1 pt average up by up by up by up by income v 3.9% 4.3% 8.1% 8.6% Setting 1 financed by higher tax on rich; no change in labour-force participation Setting 2 financed by cut in spending; no change in labour-force participation Setting 3 financed by higher tax on rich; with change in labour-force participation Setting 4 financed by cut in spending; with change in labour-force participation
19
We report four sets of outcomes in Table 2. There are two financing options (the
tax break for the poor is financed either by a tax increase on the rich or by a cut in other
program spending) and we report results both with and without a change in labour-force
participation. With no change in labour force participation, and when the initiative is
financed by a higher tax on the rich, we find that the earned income tax credit cuts the
nation’s unemployment rate by one-sixth of one percentage point, and it raises the
average income of the poor households by 3.9%. Compared to the more widely available
initiative financed by higher taxes that was discussed in section 4 (Policy 1 in Table 1),
this effect on average income is certainly more substantial. And, as above, we find even
more impressive results when the initiative is financed without a tax increase on the rich.
In this case, without the loss in labour productivity stemming from some capital
relocating to the rest of the world, the average income indicator for the poor rises by
4.3% (Setting 2 in Table 2). So the narrowly targeted Working Income Tax Benefit can
be particularly helpful if it is financed out of the fiscal dividend that accompanies the
ongoing debt reduction program.
Even more encouraging results emerge when we allow the policy to lead to
increased labour-force participation. With a labour-supply elasticity of unity, the increase
in a poor individual’s average income is even bigger – over 8% (Settings 3 and 4 in Table
2). The bottom line is that there is strong support for this initiative when it is narrowly
targeted. Readers may have expected this outcome, since targeting the initiative to just
the very poor means smaller overall revenue needs, and a smaller increase in the tax on
capital means less capital leaving the country. Further, with the minimum-wage
constraint, the increased willingness to work cannot put downward pressure on the pre-
20
tax wage rate (so Phelps’ main critique cannot apply). Nevertheless, these considerations
are only two of the several effects that interact within the full macroeconomic framework,
so detailed simulations were needed. It is reassuring that the results are consistent with
existing partial-equilibrium analyses such as Eissa and Nichols (2005) and Neumark and
Wascher (2007) – studies suggesting that important benefits for some particular low-
income groups can be attributed to the earned income tax credit in the United States.
6. Conclusions
Overall, our analysis supports three conclusions. First, the government should
finance its attack on the “welfare wall” by reserving some of the “fiscal dividend” for this
initiative. Initially, it should decide how much of the new room in its budget (that is
emerging as interest payments on the debt shrink) is to be devoted to attacking the
“welfare wall.” It should then declare that this part of the fiscal dividend is unavailable
for spending increases in other areas, or for general tax cuts. Our second conclusion is
that, as long as this bold earmarking of funds is imposed, either the earned income tax
credit, or the alternative that Phelps prefers (employment subsidies) can be implemented
– with essentially the same effects to be expected. The third conclusion that follows from
our analysis is that – despite the modest size of the government’s current commitment to
the Working Income Tax Benefit – we can expect a worthwhile increase in the living
standards of the targeted subset of the working poor.
21
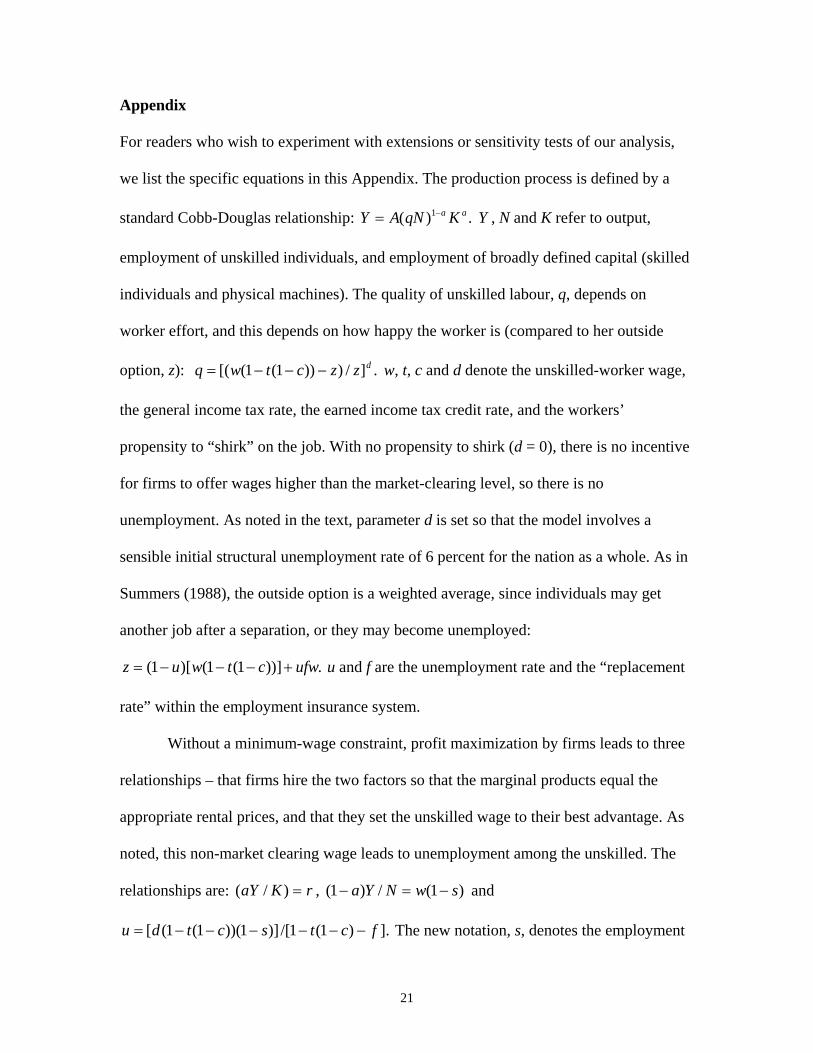
Appendix
For readers who wish to experiment with extensions or sensitivity tests of our analysis,
we list the specific equations in this Appendix. The production process is defined by a
standard Cobb-Douglas relationship: .)( 1 aa KqNAY −= Y , N and K refer to output,
employment of unskilled individuals, and employment of broadly defined capital (skilled
individuals and physical machines). The quality of unskilled labour, q, depends on
worker effort, and this depends on how happy the worker is (compared to her outside
option, z): .]/)))1(1([( dzzctwq −−−= w, t, c and d denote the unskilled-worker wage,
the general income tax rate, the earned income tax credit rate, and the workers’
propensity to “shirk” on the job. With no propensity to shirk (d = 0), there is no incentive
for firms to offer wages higher than the market-clearing level, so there is no
unemployment. As noted in the text, parameter d is set so that the model involves a
sensible initial structural unemployment rate of 6 percent for the nation as a whole. As in
Summers (1988), the outside option is a weighted average, since individuals may get
another job after a separation, or they may become unemployed:
.))]1(1()[1( ufwctwuz +−−−= u and f are the unemployment rate and the “replacement
rate” within the employment insurance system.
Without a minimum-wage constraint, profit maximization by firms leads to three
relationships – that firms hire the two factors so that the marginal products equal the
appropriate rental prices, and that they set the unskilled wage to their best advantage. As
noted, this non-market clearing wage leads to unemployment among the unskilled. The
relationships are: rKaY =)/( , )1(/)1( swNYa −=− and
].)1(1/[)]1))(1(1([ fctsctdu −−−−−−= The new notation, s, denotes the employment
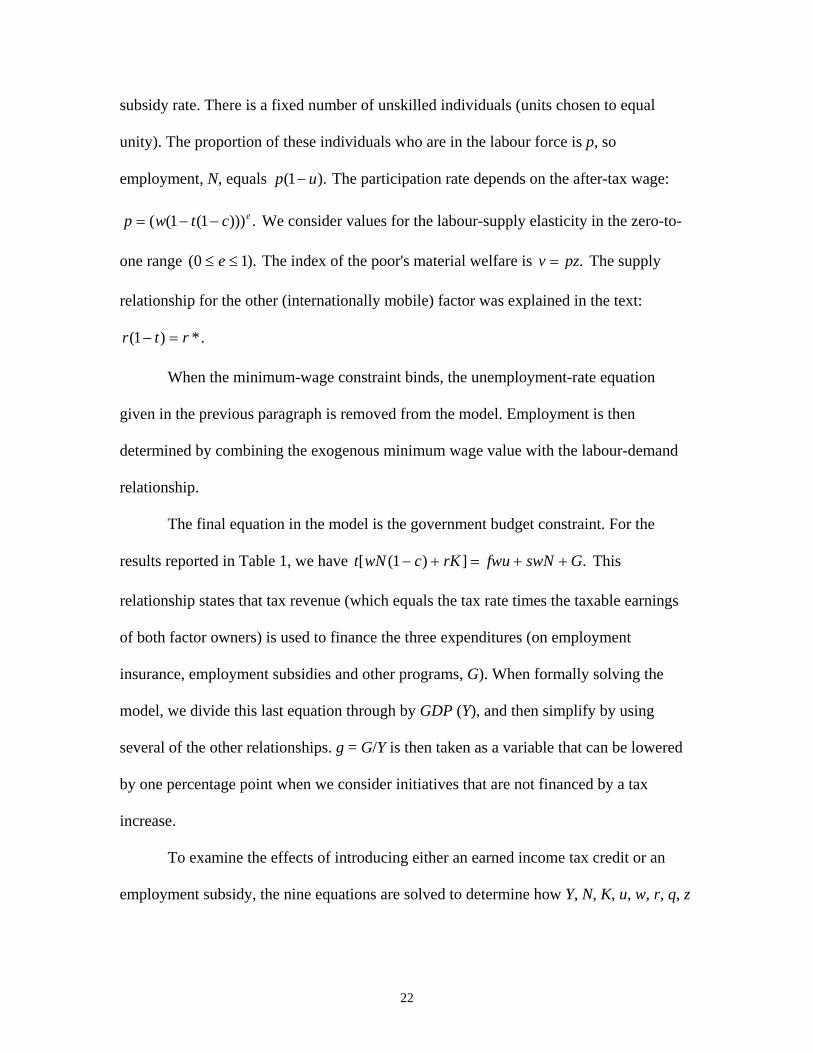
22
subsidy rate. There is a fixed number of unskilled individuals (units chosen to equal
unity). The proportion of these individuals who are in the labour force is p, so
employment, N, equals ).1( up − The participation rate depends on the after-tax wage:
.)))1(1(( ectwp −−= We consider values for the labour-supply elasticity in the zero-to-
one range ).10( ≤≤ e The index of the poor's material welfare is .pzv = The supply
relationship for the other (internationally mobile) factor was explained in the text:
*)1( rtr =− .
When the minimum-wage constraint binds, the unemployment-rate equation
given in the previous paragraph is removed from the model. Employment is then
determined by combining the exogenous minimum wage value with the labour-demand
relationship.
The final equation in the model is the government budget constraint. For the
results reported in Table 1, we have .])1([ GswNfwurKcwNt ++=+− This
relationship states that tax revenue (which equals the tax rate times the taxable earnings
of both factor owners) is used to finance the three expenditures (on employment
insurance, employment subsidies and other programs, G). When formally solving the
model, we divide this last equation through by GDP (Y), and then simplify by using
several of the other relationships. g = G/Y is then taken as a variable that can be lowered
by one percentage point when we consider initiatives that are not financed by a tax
increase.
To examine the effects of introducing either an earned income tax credit or an
employment subsidy, the nine equations are solved to determine how Y, N, K, u, w, r, q, z
23
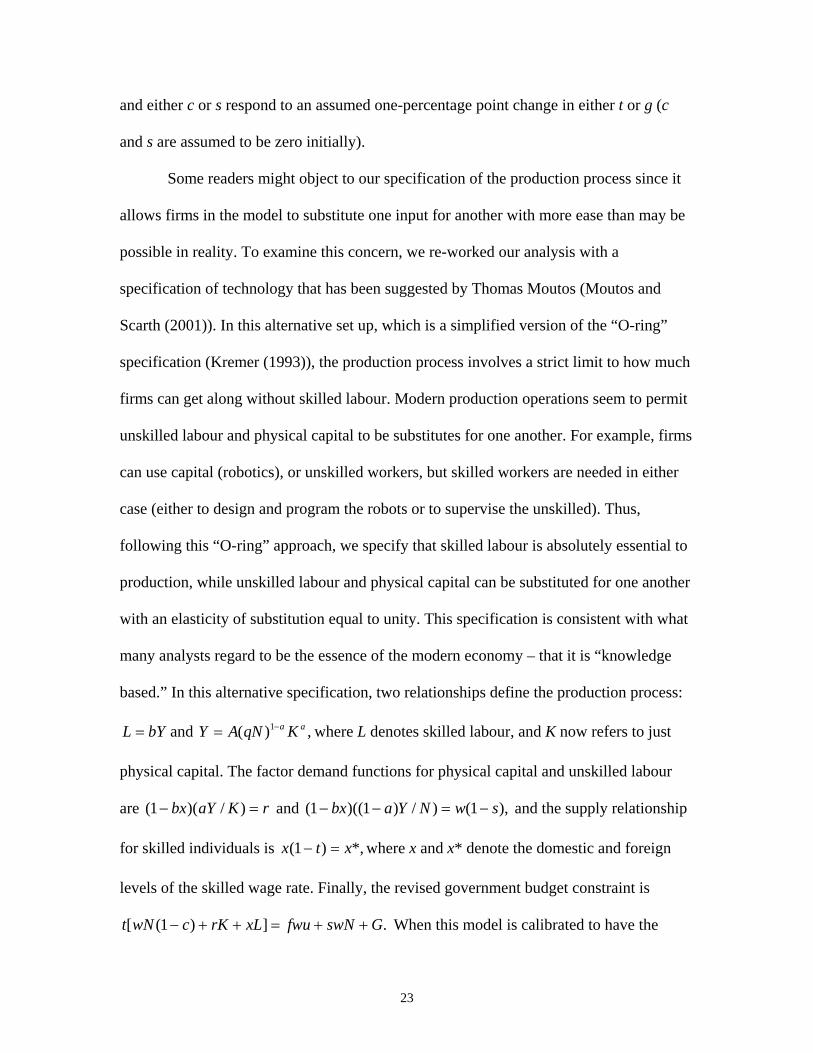
and either c or s respond to an assumed one-percentage point change in either t or g (c
and s are assumed to be zero initially).
Some readers might object to our specification of the production process since it
allows firms in the model to substitute one input for another with more ease than may be
possible in reality. To examine this concern, we re-worked our analysis with a
specification of technology that has been suggested by Thomas Moutos (Moutos and
Scarth (2001)). In this alternative set up, which is a simplified version of the “O-ring”
specification (Kremer (1993)), the production process involves a strict limit to how much
firms can get along without skilled labour. Modern production operations seem to permit
unskilled labour and physical capital to be substitutes for one another. For example, firms
can use capital (robotics), or unskilled workers, but skilled workers are needed in either
case (either to design and program the robots or to supervise the unskilled). Thus,
following this “O-ring” approach, we specify that skilled labour is absolutely essential to
production, while unskilled labour and physical capital can be substituted for one another
with an elasticity of substitution equal to unity. This specification is consistent with what
many analysts regard to be the essence of the modern economy – that it is “knowledge
based.” In this alternative specification, two relationships define the production process:
bYL = and ,)( 1 aa KqNAY −= where L denotes skilled labour, and K now refers to just
physical capital. The factor demand functions for physical capital and unskilled labour
are rKaYbx =− )/)(1( and ),1()/)1)((1( swNYabx −=−− and the supply relationship
for skilled individuals is *,)1( xtx =− where x and x* denote the domestic and foreign
levels of the skilled wage rate. Finally, the revised government budget constraint is
.])1([ GswNfwuxLrKcwNt ++=++− When this model is calibrated to have the

24
same initial distribution of income as in the basic model, all results are very similar.
Thus, our conclusions remain appropriate in the face of this sensitivity test.
When the focus shifts to a tax cut for a more targeted (smaller) group of low-
income individuals, we define two different tax rates, so the government budget
constraint is revised: .GswNfwuhrKtwN ++=+ We cut t by just the amount that
involves the government losing 0.00067 of one percentage point of GDP from its revenue
sources. We do so since the government has earmarked $1 billion annually to the
Working Income Tax Benefit and GDP is roughly $1.5 trillion. As a result, these
simulations are intended to reflect the actual government initiative. In the model, this
revenue loss in financed in two ways (either by an increase in h (the income tax rate
levied on the rich) or by a cut in the program spending rate, g, that involves the same
revenue implications).
Calibration concerning income shares varies depending on whether the low-
income support policies are broadly available or not. In the former case, as explained in
the text, we set a = 0.67. To appreciate that this calibration is reasonable, it is useful to
consider the equality between capital’s marginal product and its market yield. With the
pre-policy yield set at 12%, the a = 0.67 assumption implies that the capital/output ratio
is 5.5. If capital referred to just physical capital, we would judge this ratio to be about
double what is appropriate for the Canadian economy. But we follow Mankiw, Romer
and Weil (1992) who assume a Cobb-Douglas exponent of one-third for both physical
and human capital. Thus, our more broadly defined capital/output ratio should be double
the usual number that is associated with just physical capital. Another way of
appreciating the applicability of our calibration is to focus on unemployment. With
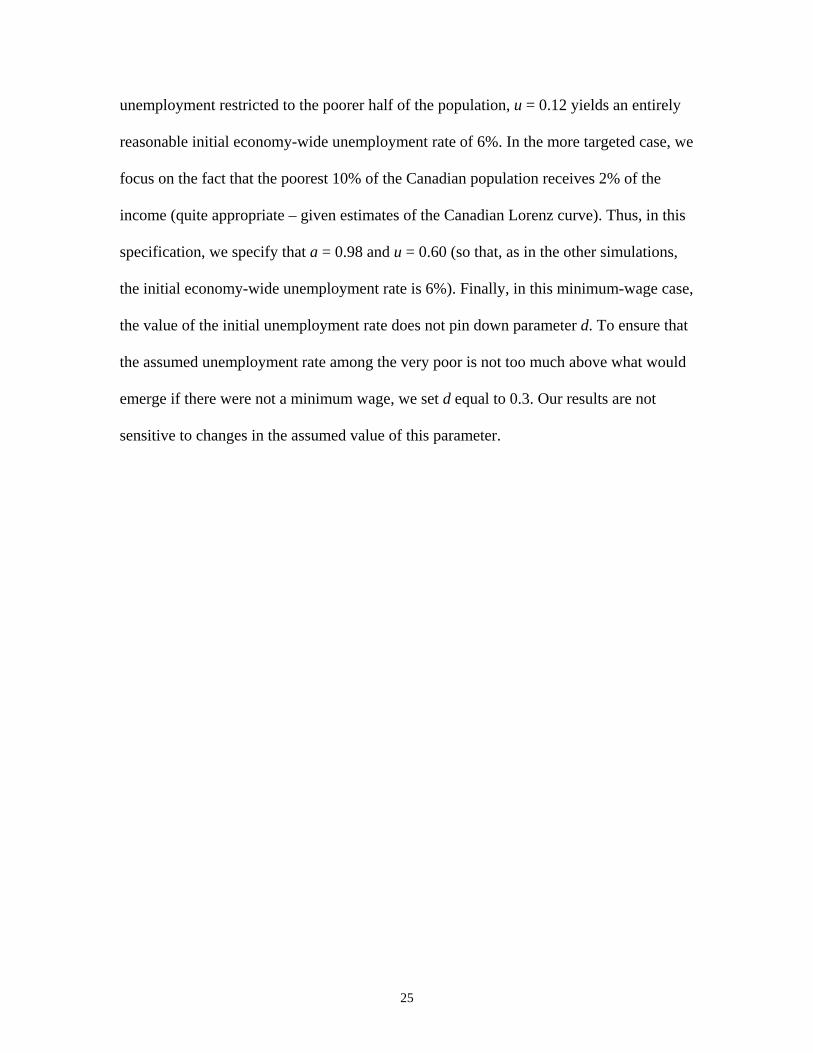
25
unemployment restricted to the poorer half of the population, u = 0.12 yields an entirely
reasonable initial economy-wide unemployment rate of 6%. In the more targeted case, we
focus on the fact that the poorest 10% of the Canadian population receives 2% of the
income (quite appropriate – given estimates of the Canadian Lorenz curve). Thus, in this
specification, we specify that a = 0.98 and u = 0.60 (so that, as in the other simulations,
the initial economy-wide unemployment rate is 6%). Finally, in this minimum-wage case,
the value of the initial unemployment rate does not pin down parameter d. To ensure that
the assumed unemployment rate among the very poor is not too much above what would
emerge if there were not a minimum wage, we set d equal to 0.3. Our results are not
sensitive to changes in the assumed value of this parameter.
26
References
Eissa and Nichols (2005), “Tax-Transfer Policy and Labor-Market Outcomes,”
American Economic Review 95, 88-93.
Finance Canada (2007), The Budget Plan: Aspire to a Stronger, Safer, Better
Canada.
Kremer, M. (1993), “The O-Ring Theory of Economic Development,” Quarterly
Journal of Economics 108, 551-575.
Mankiw, G., D. Romer and D. Weil (1992), “A Contribution to the Empirics of
Economic Growth,” Quarterly Journal of Economics 88, 407-437.
Moutos, T. and W. Scarth (2001), “Some Macroeconomic Consequences of Basic
Income and Employment Subsidies,” presented at a CESIfo conference on Labor Market
Institutions and Public Regulation.
Neumark and Wascher (2007), “Minimum Wages, the Earned Income Tax Credit,
and Employment: Evidence from the Post-Welfare-Reform Era,” NBER Working Paper
12915.
Phelps, E. S. (1997), Rewarding Work: How to Restore Participation and Self-
Support to Free Enterprise (Cambridge Mass.: Harvard University Press).
Summers, L. H. (1988), “Relative Wages, Efficiency Wages and Keynesian
Unemployment,” The American Economic Review Papers and Proceedings 78, 383-388.
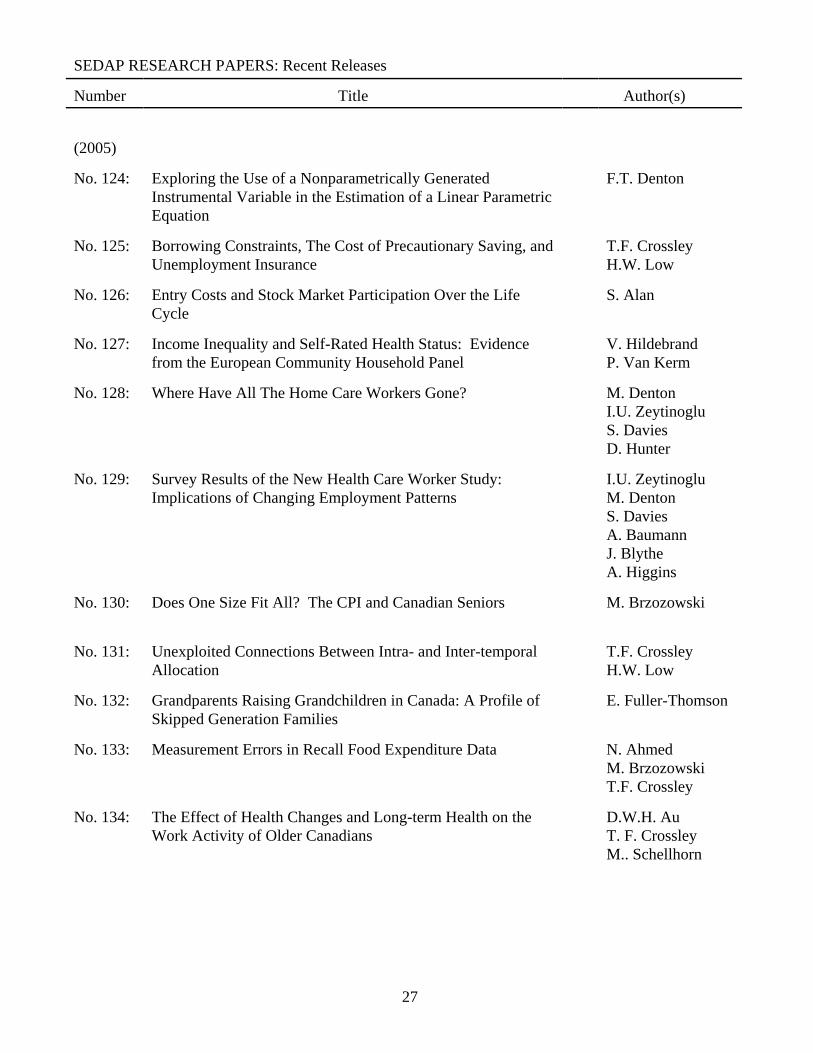
SEDAP RESEARCH PAPERS: Recent Releases
Number Title Author(s)
27
(2005)
No. 124: Exploring the Use of a Nonparametrically GeneratedInstrumental Variable in the Estimation of a Linear ParametricEquation
F.T. Denton
No. 125: Borrowing Constraints, The Cost of Precautionary Saving, andUnemployment Insurance
T.F. CrossleyH.W. Low
No. 126: Entry Costs and Stock Market Participation Over the LifeCycle
S. Alan
No. 127: Income Inequality and Self-Rated Health Status: Evidencefrom the European Community Household Panel
V. HildebrandP. Van Kerm
No. 128: Where Have All The Home Care Workers Gone? M. DentonI.U. ZeytinogluS. DaviesD. Hunter
No. 129: Survey Results of the New Health Care Worker Study: Implications of Changing Employment Patterns
I.U. ZeytinogluM. DentonS. DaviesA. BaumannJ. BlytheA. Higgins
No. 130: Does One Size Fit All? The CPI and Canadian Seniors M. Brzozowski
No. 131: Unexploited Connections Between Intra- and Inter-temporalAllocation
T.F. CrossleyH.W. Low
No. 132: Grandparents Raising Grandchildren in Canada: A Profile ofSkipped Generation Families
E. Fuller-Thomson
No. 133: Measurement Errors in Recall Food Expenditure Data N. AhmedM. BrzozowskiT.F. Crossley
No. 134: The Effect of Health Changes and Long-term Health on theWork Activity of Older Canadians
D.W.H. AuT. F. CrossleyM.. Schellhorn

SEDAP RESEARCH PAPERS: Recent Releases
Number Title Author(s)
28
No. 135: Population Aging and the Macroeconomy: Explorations in theUse of Immigration as an Instrument of Control
F. T. DentonB. G. Spencer
No. 136: Users and Suppliers of Physician Services: A Tale of TwoPopulations
F.T. DentonA. GafniB.G. Spencer
No. 137: MEDS-D USERS’ MANUAL F.T. Denton C.H. Feaver B.G.. Spencer
No. 138: MEDS-E USERS’ MANUAL F.T. Denton C.H. Feaver B.G. Spencer
No. 139: Socioeconomic Influences on the Health of Older Canadians: Estimates Based on Two Longitudinal Surveys(Revised Version of No. 112)
N.J. BuckleyF.T. DentonA.L. RobbB.G. Spencer
No. 140: Developing New Strategies to Support Future Caregivers ofthe Aged in Canada: Projections of Need and their PolicyImplications
J. KeefeJ. LégaréY. Carrière
No. 141: Les Premiers Baby-Boomers Québécois font-ils une MeilleurePréparation Financière à la Retraite que leurs Parents?Revenu, Patrimoine, Protection en Matière de Pensions etFacteurs Démographiques
L. MoJ. Légaré
No. 142: Welfare Restructuring without Partisan Cooperation:The Role of Party Collusion in Blame Avoidance
M. Hering
No. 143: Ethnicity and Health: An Analysis of Physical HealthDifferences across Twenty-one Ethnocultural Groups inCanada
S. PrusZ. Lin
No. 144: The Health Behaviours of Immigrants and Native-Born Peoplein Canada
J.T. McDonald
No. 145: Ethnicity, Immigration and Cancer Screening: Evidence forCanadian Women
J.T. McDonaldS. Kennedy
No. 146: Population Aging in Canada: Software for Exploring theImplications for the Labour Force and the Productive Capacityof the Economy
F.T. Denton C.H. Feaver B.G. Spencer
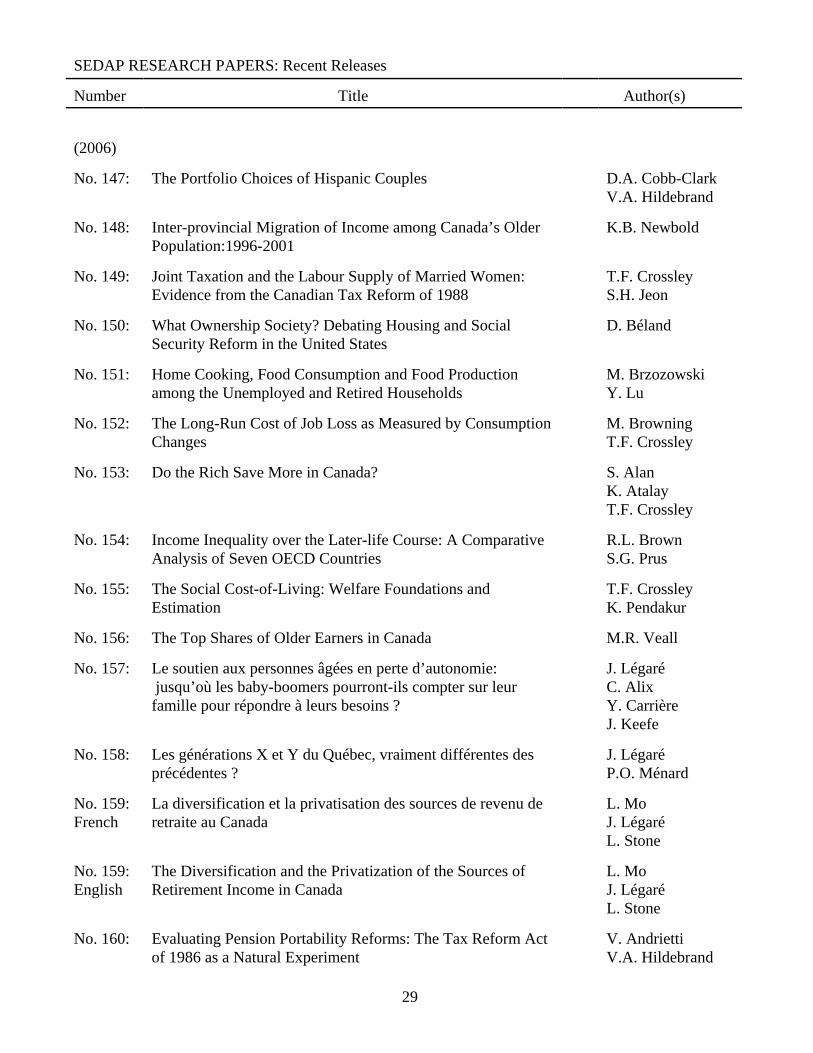
SEDAP RESEARCH PAPERS: Recent Releases
Number Title Author(s)
29
(2006)
No. 147: The Portfolio Choices of Hispanic Couples D.A. Cobb-ClarkV.A. Hildebrand
No. 148: Inter-provincial Migration of Income among Canada’s OlderPopulation:1996-2001
K.B. Newbold
No. 149: Joint Taxation and the Labour Supply of Married Women:Evidence from the Canadian Tax Reform of 1988
T.F. CrossleyS.H. Jeon
No. 150: What Ownership Society? Debating Housing and SocialSecurity Reform in the United States
D. Béland
No. 151: Home Cooking, Food Consumption and Food Productionamong the Unemployed and Retired Households
M. BrzozowskiY. Lu
No. 152: The Long-Run Cost of Job Loss as Measured by ConsumptionChanges
M. BrowningT.F. Crossley
No. 153: Do the Rich Save More in Canada? S. AlanK. AtalayT.F. Crossley
No. 154: Income Inequality over the Later-life Course: A ComparativeAnalysis of Seven OECD Countries
R.L. BrownS.G. Prus
No. 155: The Social Cost-of-Living: Welfare Foundations andEstimation
T.F. CrossleyK. Pendakur
No. 156: The Top Shares of Older Earners in Canada M.R. Veall
No. 157: Le soutien aux personnes âgées en perte d’autonomie: jusqu’où les baby-boomers pourront-ils compter sur leurfamille pour répondre à leurs besoins ?
J. LégaréC. AlixY. CarrièreJ. Keefe
No. 158: Les générations X et Y du Québec, vraiment différentes desprécédentes ?
J. LégaréP.O. Ménard
No. 159:French
La diversification et la privatisation des sources de revenu deretraite au Canada
L. MoJ. LégaréL. Stone
No. 159:English
The Diversification and the Privatization of the Sources ofRetirement Income in Canada
L. MoJ. LégaréL. Stone
No. 160: Evaluating Pension Portability Reforms: The Tax Reform Actof 1986 as a Natural Experiment
V. AndriettiV.A. Hildebrand
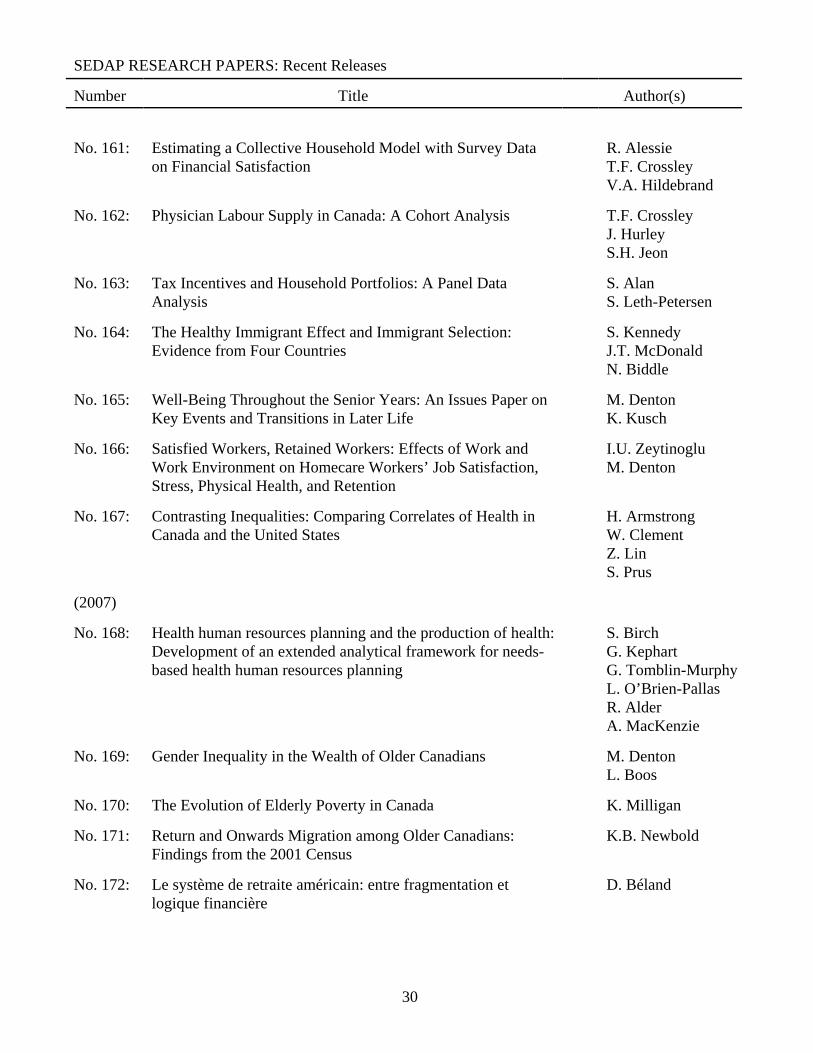
SEDAP RESEARCH PAPERS: Recent Releases
Number Title Author(s)
30
No. 161: Estimating a Collective Household Model with Survey Dataon Financial Satisfaction
R. AlessieT.F. CrossleyV.A. Hildebrand
No. 162: Physician Labour Supply in Canada: A Cohort Analysis T.F. CrossleyJ. HurleyS.H. Jeon
No. 163: Tax Incentives and Household Portfolios: A Panel DataAnalysis
S. AlanS. Leth-Petersen
No. 164: The Healthy Immigrant Effect and Immigrant Selection:Evidence from Four Countries
S. KennedyJ.T. McDonaldN. Biddle
No. 165: Well-Being Throughout the Senior Years: An Issues Paper onKey Events and Transitions in Later Life
M. DentonK. Kusch
No. 166: Satisfied Workers, Retained Workers: Effects of Work andWork Environment on Homecare Workers’ Job Satisfaction,Stress, Physical Health, and Retention
I.U. ZeytinogluM. Denton
No. 167: Contrasting Inequalities: Comparing Correlates of Health inCanada and the United States
H. ArmstrongW. ClementZ. LinS. Prus
(2007)
No. 168: Health human resources planning and the production of health:Development of an extended analytical framework for needs-based health human resources planning
S. BirchG. KephartG. Tomblin-MurphyL. O’Brien-PallasR. AlderA. MacKenzie
No. 169: Gender Inequality in the Wealth of Older Canadians M. DentonL. Boos
No. 170: The Evolution of Elderly Poverty in Canada K. Milligan
No. 171: Return and Onwards Migration among Older Canadians:Findings from the 2001 Census
K.B. Newbold
No. 172: Le système de retraite américain: entre fragmentation etlogique financière
D. Béland
SEDAP RESEARCH PAPERS: Recent Releases
Number Title Author(s)
31
No. 173: Entrepreneurship, Liquidity Constraints and Start-up Costs R. FonsecaP.-C. MichaudT. Sopraseuth
No. 174: How did the Elimination of the Earnings Test above theNormal Retirement Age affect Retirement Expectations?
P.-C. MichaudA. van Soest
No. 175: The SES Health Gradient on Both Sides of the Atlantic J. BanksM. MarmotZ. OldfieldJ.P. Smith
No. 176: Pension Provision and Retirement Saving: Lessons from theUnited Kingdom
R. DisneyC. EmmersonM. Wakefield
No. 177: Retirement Saving in Australia G. BarrettY.-P. Tseng
No. 178: The Health Services Use Among Older Canadians in Ruraland Urban Areas
H. CondeJ.T. McDonald
No. 179: Older Workers and On-the-Job Training in Canada:Evidence from the WES data
I.U. ZeytinogluG.B. CookeK. Harry
No. 180: Private Pensions and Income Security in Old Age:An Uncertain Future – Conference Report
M. HeringM. Kpessa
No. 181: Age, SES, and Health: A Population Level Analysis of HealthInequalitites over the Life Course
S. Prus
No. 182: Ethnic Inequality in Canada: Economic and HealthDimensions
E.M. GeeK.M. KobayashiS.G. Prus
No. 183: Home and Mortgage Ownership of the Dutch Elderly:Explaining Cohort, Time and Age Effects
A. van der SchorsR.J.M. AlessieM. Mastrogiacomo
No. 184: A Comparative Analysis of the Nativity Wealth Gap T.K. BauerD.A. Cobb-ClarkV. HildebrandM. Sinning
No. 185: Cross-Country Variation in Obesity Patterns among OlderAmericans and Europeans
P.C. MichaudA. van SoestT. Andreyeva
SEDAP RESEARCH PAPERS: Recent Releases
Number Title Author(s)
32
No. 186: Which Canadian Seniors Are Below the Low-IncomeMeasure?
M.R. Veall
No. 187: Policy Areas Impinging on Elderly Transportation Mobility:An Explanation with Ontario, Canada as Example
R. MercadoA. PáezK. B. Newbold
No. 188: The Integration of Occupational Pension Regulations: Lessonsfor Canada
M. HeringM. Kpessa
No. 189: Psychosocial resources and social health inequalities inFrance: Exploratory findings from a general population survey
F. JusotM. GrignonP. Dourgnon
No. 190: Health-Care Utilization in Canada: 25 Years of Evidence L.J. CurtisW.J. MacMinn
No. 191: Health Status of On and Off-reserve Aboriginal Peoples:Analysis of the Aboriginal Peoples Survey
L.J. Curtis
No. 192: On the Sensitivity of Aggregate Productivity Growth Rates toNoisy Measurement
F.T. Denton
No. 193: Initial Destination Choices of Skilled-worker Immigrants fromSouth Asia to Canada: Assessment of the Relative Importanceof Explanatory Factors
L. XuK.L. Liaw
No. 194: Problematic Post-Landing Interprovincial Migration of theImmigrants in Canada: From 1980-83 through 1992-95
L. XuK.L. Liaw
No. 195: Inter-CMA Migration of the Immigrants in Canada: 1991-1996 and 1996-2001
L. Xu
No. 196: Characterization and Explanation of the 1996-2001 Inter-CMA Migration of the Second Generation in Canada
L. Xu
No. 197: Transitions out of and back to employment among older menand women in the UK
D. Haardt
No. 198: Older couples’ labour market reactions to family disruptions D. Haardt
No. 199: The Adequacy of Retirement Savings: Subjective SurveyReports by Retired Canadians
S. AlanK. AtalayT.F. Crossley
No. 200: Underfunding of Defined Benefit Pension Plans and BenefitGuarantee Insurance - An Overview of Theory and Empirics
M. Jametti
No. 201: Effects of ‘authorized generics’ on Canadian drug prices P. Grootendorst
SEDAP RESEARCH PAPERS: Recent Releases
Number Title Author(s)
33
No. 202: When Bad Things Happen to Good People: The EconomicConsequences of Retiring to Caregive
P.L. McDonaldT. SussmanP. Donahue
No. 203: Relatively Inaccessible Abundance: Reflections on U.S.Health Care
I.L. Bourgeault
No. 204: Professional Work in Health Care Organizations: TheStructural Influences of Patients in French, Canadian andAmerican Hospitals
I.L. BourgeaultI. SainsaulieuP. KhokherK. Hirschkorn
No. 205: Who Minds the Gate? Comparing the role of non physicianproviders in the primary care division of labour in Canada &the U.S.
I.L. Bourgeault
No. 206: Immigration, Ethnicity and Cancer in U.S. Women J.T. McDonaldJ. Neily
No. 207: Ordinary Least Squares Bias and Bias Corrections for iidSamples
L. Magee
No. 208: The Roles of Ethnicity and Language Acculturation inDetermining the Interprovincial Migration Propensities inCanada: from the Late 1970s to the Late 1990s
X. MaK.L. Liaw
No. 209: Aging, Gender and Neighbourhood Determinants of DistanceTraveled: A Multilevel Analysis in the Hamilton CMA
R. MercadoA. Páez
No. 210: La préparation financière à la retraite des premiers boomers :une comparaison Québec-Ontario
L. MoJ. Légaré
No. 211: Explaining the Health Gap between Canadian- and Foreign-Born Older Adults: Findings from the 2000/2001 CanadianCommunity Health Survey
K.M. KobayashiS. Prus
No. 212: “Midlife Crises”: Understanding the Changing Nature ofRelationships in Middle Age Canadian Families
K.M. Kobayashi
No. 213: A Note on Income Distribution and Growth W. Scarth
No. 214: Is Foreign-Owned Capital a Bad Thing to Tax? W. Scarth
No. 215: A review of instrumental variables estimation in the appliedhealth sciences
P. Grootendorst
No. 216: The Impact of Immigration on the Labour Market Outcomesof Native-born Canadians
J. Tu

SEDAP RESEARCH PAPERS: Recent Releases
Number Title Author(s)
34
No. 217: Caregiver Employment Status and Time to Institutionalizationof Persons with Dementia
M. OremusP. Raina
No. 218: The Use of Behaviour and Mood Medications by Care-recipients in Dementia and Caregiver Depression andPerceived Overall Health
M. OremusH. YazdiP. Raina
No. 219: Looking for Private Information in Self-Assessed Health J. BanksT. CrossleyS. Goshev
No. 220: An Evaluation of the Working Income Tax Benefit W. ScarthL. Tang