SOCIAL AND ECONOMIC DIMENSIONS OF AN AGING POPULATION · PDF file · 2017-06-03The...
50
SEDAP A PROGRAM FOR RESEARCH ON SOCIAL AND ECONOMIC DIMENSIONS OF AN AGING POPULATION The Recent Evolution of Retirement Patterns in Canada Pierre Lefebvre Philip Merrigan Pierre-Carl Michaud SEDAP Research Paper No. 287
-
Upload
truongtuyen -
Category
Documents
-
view
213 -
download
1
Transcript of SOCIAL AND ECONOMIC DIMENSIONS OF AN AGING POPULATION · PDF file · 2017-06-03The...

S E D A PA PROGRAM FOR RESEARCH ON
SOCIAL AND ECONOMICDIMENSIONS OF AN AGING
POPULATION
The Recent Evolution of Retirement Patterns in Canada
Pierre LefebvrePhilip Merrigan
Pierre-Carl Michaud
SEDAP Research Paper No. 287

For further information about SEDAP and other papers in this series, see our web site: http://socserv.mcmaster.ca/sedap
Requests for further information may be addressed to:Secretary, SEDAP Research Program
Kenneth Taylor Hall, Room 426McMaster University
Hamilton, Ontario, Canada, L8S 4M4FAX: 905 521 8232 e-mail: [email protected]
September 2011
The Program for Research on Social and Economic Dimensions of an Aging Population (SEDAP) is aninterdisciplinary research program centred at McMaster University with co-investigators at seventeen otheruniversities in Canada and abroad. The SEDAP Research Paper series provides a vehicle for distributingthe results of studies undertaken by those associated with the program. Authors take full responsibility forall expressions of opinion. SEDAP has been supported by the Social Sciences and Humanities ResearchCouncil since 1999, under the terms of its Major Collaborative Research Initiatives Program. Additionalfinancial or other support is provided by the Canadian Institute for Health Information, the CanadianInstitute of Actuaries, Citizenship and Immigration Canada, Indian and Northern Affairs Canada, ICES:Institute for Clinical Evaluative Sciences, IZA: Forschungsinstitut zur Zukunft der Arbeit GmbH (Institutefor the Study of Labour), SFI: The Danish National Institute of Social Research, Social DevelopmentCanada, Statistics Canada, and participating universities in Canada (McMaster, Calgary, Carleton,Memorial, Montréal, New Brunswick, Queen’s, Regina, Toronto, UBC, Victoria, Waterloo, Western, andYork) and abroad (Copenhagen, New South Wales, University College London).
The Recent Evolution of Retirement Patterns in Canada
Pierre LefebvrePhilip Merrigan
Pierre-Carl Michaud
SEDAP Research Paper No. 287

The Recent Evolution of Retirement Patterns in Canada∗
September 2011
Pierre Lefebvre, Philip Merrigan and Pierre-Carl Michaud Department of Economics
School of Management Université du Québec à Montréal
Abstract: Using data from three waves of the General Social Survey on retirement and older workers (1994, 2002 and 2007), we document the evolution of retirement patterns over the last three decades. We combined the analysis of retirement ages of actual retirees with data on expected retirement ages of current workers to create a longer perspective on changes in retirement behaviour in Canada. We also investigate trends in work after retirement. Our findings are in line with findings from other countries. There is an upward trend in retirement ages which likely started around year 2000 for cohorts born after 1945. This trend contrasts with the slow decline in retirement ages observed prior to the end of the millennium. While the downward trend was likely due to factors such as the offering of early retirement programs in private firms, the upward trend is likely to be caused by a wider variety of sources, including better health, less pervasive defined benefit pensions and in general less generous pensions.
∗ This Report was prepared for Human Resources and Skills Development Canada (Contract No. 9110-10-007/00). This analysis is based on Statistics Canada's General Social Surveys (GSS) on retirement of 1994, 2002 and 2007 restricted-access Micro Data Files, which contain anonymized data collected in the GSS’s available at the Québec Inter-university Centre for Social Statistics (QICSS), one of the Canadian Research Data Centres. All computations on these micro-data were prepared by the authors who assume the responsibility for the use and interpretation of these data. We thank two anonymous referees for their comments, critics and suggestions.

The Recent Evolution of Retirement Patterns in Canada Résumé: Dans cet article, nous utilisons trois vagues de l'enquête sociale générale du Canada (ESG) (1994, 2002, 2007) pour documenter l'évolution des comportements de retraite au cours des trois dernières décennies. Nous combinons une analyse des âges de retraite des retraités dans chacune des vagues avec une analyse des âges de retraite anticipés chez les travailleurs pour obtenir une vue d'ensemble de l'évaluation passée et future de ces comportements. Nous analysons aussi la tendance au niveau du travail après la retraite. Nous trouvons une tendance très similaire à celle observée dans d'autres pays. Nous observons une tendance à la hausse de l'âge de la retraite, et une augmentation de retraités qui retourne au travail. Cette débuté au tournant du millénaire pour les générations nées après 1945. Ceci contraste avec la lourde tendance à la baisse observée dans les années 1980 et 1990. Alors que la tendance à la baisse a certainement beaucoup à voir avec l'offre de généreux programmes de retraite anticipée, la tendance récente à la hausse à plusieurs explications telles qu’une meilleure santé et une baisse du nombre de travailleurs couvert par des régimes traditionnels de retraite. Key Words: Retirement, aging, older workers, expectations JEL Classification: J26

The Recent Evolution of Retirement Patterns in Canada
2
1 Introduction
In this paper, we study the decisions and expectations concerning retirement from the labour market and their evolution over the last three decades in Canada using comparable data sets so as to provide consistent inter-temporal comparisons. Canadians now live longer and in better health than former generations which, ceteris paribus, should make them more likely to work for a longer period of time. However, they also face a different pension landscape, with fewer covered by employer pensions. Also, the last 2 decades produced a shift among those covered from defined benefit to defined contribution pensions.1 In addition, the under-funding of many pension plans implies greater retirement income uncertainty for current workers. Finally, many individuals also face a labour market with careers characterized by more job transitions and shorter tenures. Given that those changes are relatively recent (they occurred mostly in the last two decades), we propose to study the evolution of retirement patterns using surveys conducted from 1994 to 2007. Our research design takes full advantage of the prospective and retrospective features of Canadian surveys on retirement at hand.
Retirement patterns can be studied in a number of ways: analyzing retirement ages of current retirees, or the expected retirement ages of current workers or the labour force participation rates of the elderly or of the retired. We study each with surveys conducted over roughly a 15 year period. This allows us to obtain a picture of past and future retirement patterns over a much longer period since several retirees at a point in time have retired long before the survey and workers in the surveys will retire in the future. This research project has the following specific objectives: 1. Document, using three waves of the General Social Survey (GSS 1994, 2002 and
2007), the trends of retirement ages (among retirees) and retirement expectations (among workers), stratifying by gender and socio-economic groups.
2. Study the reasons why individuals retire from the labour force 3. Conduct a retrospective analysis of the determinants of retirement ages using
duration/hazard models incorporating financial measures as well as retirees’ characteristics at time of surveys.
4. Perform a prospective regression analysis of retirement age expectations, among those currently working using some of the same determinants explaining the exit from the work force as well as other explanatory variables.
5. Study the reasons why some retirees return to work and trends in the labour force participation of the once-retired. Analyze the main factors that influence an individual’s choice of labour force participation following retirement.
6. From the trends and estimations’ analyses trace the future landscape of retirement behaviour in Canada, and highlight some points relevant for public policy.
The sections of the report are as follows: Section 2 reviews prior research evidence and
methods. Section 3 presents the data sets and samples used. Section 4 analyses for the
1 In the case of Canadian defined contribution plans, a study by Statistics Canada staff (Gougeon, 2009) indicates that between 1991 and 2006, defined contribution (DC) plan membership almost doubled, increasing by 93%; during the same period, defined benefit (DB) plan membership declined by 4%. Although pension coverage of employees increased a little (5%), the coverage rate dipped by 19% over the same period, in particular for men. DC plan coverage has changed almost exclusively in the private sector.

The Recent Evolution of Retirement Patterns in Canada
3
“retiree” samples trends in actual retirement ages and reasons for retirement. Determinants of actual retirement ages are estimated by period with duration models. Reasons for retirement are also analysed by period and gender. Section 5 conducts the same type of analyses for the expected retirement age of the sample of workers. Section 6 examines the return to work decision after retirement. Section 7 uses some of the preceding results to present what could be the future landscape of retirement behaviour in Canada, as well as some policy implications.

The Recent Evolution of Retirement Patterns in Canada
4
2. Review of Studies and Research Methods
Over the last century, the average age of retirement of Canadians has steadily declined. But in the last decade, the proportion of older workers in the labour force (those aged 55 to 64) has considerably risen particularly for women (Marchall and Ferrao, 2007). Moreover, Canadians expect to retire later than they did in the recent past (Schellenberg and Ostrovsky, 2008; Gomez and Gunderson, 2009). Importantly for public policy, a significant proportion of non-retired Canadians aged 45 to 59 are uncertain about their retirement plans and concerned about the adequacy of their financial preparation (Schellender, 2004, Shellenberg and Ostrovsky, 2008). On the other hand, the 2008 and 2009 Labour Force Surveys show a significant proportion of early retirees (those aged less than 60), particularly in Québec (Dorion, 2011): in Québec 45% retire before 60 compared to 33% in Ontario and 25% in the West; these recent retirees in Québec are largely those with a higher education, having worked full-time, having accumulated long job tenures, and from the public sector. Also, a vast majority of workers take up Canada and Québec Pension Plan (C/QPP) benefits before the age of 65, with an increasing proportion starting to collect them at age 60 (Wannell, 2007a). Finally, research in this area has shown that retirement is not an all-or nothing choice as many return to the workforce after retiring (Wannell, 2007b; Maestas, 2010; Hébert and Luang, 2008). In this case, retirement is simply changing jobs given that a pension will be available after leaving the job.
The determinants of the decision to retire are numerous (Lumbsdaine and Mitchell, 1999). They are best understood within the context of a life-cycle model where individuals compare the expected utility of retirement and that of continuing to work. Within that framework, financial incentives embedded in retirement programs influence retirement decisions. Not only the level of retirement benefits but also how these accrue with age and contributions to a pension plan affect these forward looking decisions. Most retirement programs “tax” work at older ages by providing actuarially unfair adjustments to benefits when retirement is postponed and by taxing work while claiming pensions (Gruber and Wise, 2004; Baker, Gruber and Milligan, 2003 for Canada). According to Milligan and Schirle (2006), the actuarial adjustment in the Canada/Québec pension plan does not sufficiently compensate for foregone year of earnings. Hence, it provides some disincentive to work longer. Defined benefit private pensions provide similar incentives, with large disincentives at particular ages surrounding the “normal retirement age” and early retirement windows which allow workers to leave the workforce with little or no penalty for early withdrawal (Stock and Wise, 1990). The level of earnings and expectations of earnings growth provide both income and substitution effects which affect optimal retirement in different directions. Finally, the availability of other savings, in particular private savings accumulated in the form of RRSPs create an income effect lowering optimal retirement age. In a Canadian context, Schirle (2010) estimates large effects of employer pensions on retirement.
Over the last 20 years, the Canadian public retirement programs have seen very few changes (except the increases of RRSPs ceilings). On the other hand, there has been a gradual shift towards defined contribution pensions. For those who stayed on defined benefit pensions, the increased labour market mobility observed in recent decades may have resulted in more job transitions which may have increased the need to work longer in order to maintain the same standard of living.

The Recent Evolution of Retirement Patterns in Canada
5
But retirement is not only a function of financial incentives. Health may also play an important role. Health shocks can lower the marginal utility of consumption (or increase the marginal utility of leisure) and/or decrease potential earnings. Both of these effects can induce early retirement. There has been a general compression of morbidity and increase in the general mobility of the population in most industrialized countries which should make the population better adapted to work longer. The increase in longevity witnessed over the last 50 years would also seem to induce delayed retirement as consumption will need to be financed over a longer period. However, some research has shown that more acute health shocks, including those affecting a spouse may increase significantly the retirement chances of elderly workers and that this increase in the baseline retirement probability may not be affected by eligibility to early exit programs and persists even after accounting for selection due to the take-up of disability pension (Datta Gupta and Larsen, 2007).
A number of studies have tested and found housing wealth effects on the consumption of goods and services. The last decade has demonstrated that significant real increases in housing wealth can occur over a relatively short period of time. History suggests that real housing wealth can also decline for significant periods of time. Changes in housing prices may affect the timing of retirement. Nonetheless, American evidence suggests that older households are found to have a very low marginal propensity to consume goods and services out of housing wealth (Venti and Wise, 2000). The empirical relationship between housing wealth and retirement is of interest because housing constitutes a large fraction of the assets of the typical Canadian family, and could therefore be an important source of wealth effects on labour supply. Changes in housing wealth should be expected to have an effect on consumption similar to other changes in permanent income. Standard life-cycle consumption theory predicts that permanent unanticipated shocks to wealth should result in an adjustment of consumption of goods and services as well as leisure. Assuming well-functioning capital markets, greater wealth should increase an individual’s consumption of normal goods and services, as well as his or her consumption of leisure, which we assume to be a normal good. Individuals may access increased housing wealth through financial products such as home equity loans or reverse mortgages. They may also access this wealth through informal borrowing markets.
Workplace characteristics may also be an important determinant of retirement. An unpleasant job increases the disutility of work which would tend to favour earlier withdrawal from the labour force. Stressful jobs (negative stress) may also induce workers to quit earlier. In the absence of constraints in hours worked, a simple life-cycle model of retirement decision making would yield a smooth transition to retirement, i.e. there is little need to change from positive hours to zero in any given period if preferences are continuous (Gustman and Steinmeier, 1986). Hence, flexibility in terms of hours and scheduling can be an important determinant of retirement (Hurd and McGarry, 2002).
Finally, retirement decisions are likely to be the result of joint decision making at the household level. This was recognized for example in Hurd (1990), Gustman and Steinmeier (2000) and Michaud and Vermeulen (2011). These authors recognize that apart from sharing a joint budget constraint and thus similar incentives, spousal preferences may be complements in leisure and spouses may have similar tastes for leisure and consumption.

The Recent Evolution of Retirement Patterns in Canada
6
Both realizations and expectations of the retirement age are useful in assessing the determinants of retirement. A burgeoning literature has used subjective expectations to study retirement expectations (reviewed in Hurd, 2009). For example, Chan, Stevens, and Huff (2004) study with panel data the evolution of subjective retirement expectations and the effect of pension incentives on those expectations. Most analysis of the determinants of retirement uses longitudinal data which throws light on transitions in and out of the labour market in the later-stages of the life-cycle. Earlier studies used duration analysis techniques based on retrospective information on the retirement age of retirees (reviewed in Lazear, 1986).
An increase in retirement ages has been witnessed in many countries over the past 10 years (Maestas and Zissimopoulos, 2010). For example, Blau and Goldstein (2009) study the recent evolution of the retirement age in the U.S. and conclude that recent changes in Social Security, along with the increase in the labour force participation rates of females and increasing education of the population can explain a large part of the recent increase in labour force participation. On the other hand, they also witness an increase in the labour force participation of men over the last 10 years. After accounting for a number of factors, they find that this uptake is likely the result of a change in the composition of the working age population towards more educated retirees (who tend to retire later). Schirle (2008) studies the possibility that, trough complementarily in leisure, the increase in female labour force attachment has lead to an increase in the labour force participation of older men. She finds compelling evidence that this may explain from one third to one half of the recent increase in labour force participation of older men in Canada, Britain and the United States.
Schellenberg and Ostrosvsky (2008) look at retirement expectations in the 2002 and 2007 GSS as well as with the 1991 Survey of Aging and Independence. They document a general increase in the probability to delay retirement. Gomez and Gunderson (2009) consider retirement expectations in the 1994 and 2002 waves of the GSS and attempt to decompose changes in retirement expectations in changes in preference/constraints and changes in composition. Preference/constraint shifts are inferred from changes in the relationship between covariates and the expected retirement age (coefficients from regressions). They find an increase of 4 years in the expected retirement age, which they attribute mostly to changes in preferences/constraints. Indeed, as found by Gruber and Milligan (2003), retirement incentives appear to have a strong effect on retirement behaviour in Canada.

The Recent Evolution of Retirement Patterns in Canada
7
3. Data and Construction of Samples
We use the three General Social Surveys conducted by Statistics Canada since the early 1990 and whose dominant theme is retirement. The GSS-1994, titled “Education, Work and Retirement” surveyed 11,876 respondents but only 5,745 of them (representing almost 900,000 Canadians) were aged 45 years of more. The GSS-2002, titled “Aging and Social Support” surveyed 24,855 respondents (representing 11,113,000 Canadians) aged 45 years or more. The GSS-2007, titled “Family, Social Support and Retirement Survey,” surveyed 23,373 individuals aged 45 or more (representing almost 13 millions Canadians). The next GSS on retirement should probably be conducted in 2012.
3.1 GSS Samples
For each of the three GSS’s we construct three different samples excluding individuals who report having never worked: • A sample of retirees composed of individuals who have worked at some point in their
life-cycle, declaring that they have retired at least once and are not working or looking for work at the time of the survey, in order to understand the process of retirement. In order to make inferences on the average retirement age but also the survival profile of workers from that sample, we choose an age cut-off such that the majority of workers in this sample have retired. From a preliminary analysis of the sample, the age of 68 was chosen as a reasonable cut-off. We thus select respondents aged 68 to 80 in each GSS. This implies that these retirees are from cohorts born between 1914 and 1926 in the 1994 wave, 1922 to 1934 in the 2002 wave, and 1927 to 1939 in the 2007 wave. Thus they form a sample of individuals having reached the age of 65 sometime between 1979 and 2004.
• A sample of workers who are currently employed and have never retired in order to
analyse retirement expectations. Following the same reasoning as for retirees, we selected an age, 54, at which most workers are still working and analyzed the expectations of retirement ages beyond that age. Given that in the last two GSS retirement surveys, respondents are aged 45 or more, this sample is composed of respondents aged 45 to 54. These cohorts were born between 1940 and 1949 in the 1994 wave, 1948 and 1957 in the 2002 wave and between 1953 and 1962 in the 2007 wave. Thus they will reach age 65 at any time between 2005 and 2027.
Taken together, these two samples allow to study actual and prospective retirement
behaviour of cohorts reaching age 65 at some time between the 1979 and 2027. Finally, we consider a third sample to study the behaviour of those who have retired but may return to work after retirement. • A sample of ever retired. This sample is different from the first retiree sample as there
is no age cut-off and we include both those who have retired and are still retired and those who have retired but are working after retirement at the time of the survey.

The Recent Evolution of Retirement Patterns in Canada
8
3.2 Variables
We constructed different groups of variables that are similar across the surveys: 1. Demographic characteristics (gender, family status, age, province, number of children, education and immigration status). 2. Labour force characteristics (labour force status, occupation, sector of activity, employee status). 3. Age of retirement and reasons to retire. 4. Expected age of retirement, plans to retire. 5. Health status. 6. Household income class and dwelling ownership. 7. Indicators of a pension plan or receipt of a pension. 8. Work after retirement and reasons for working after retirement. 9. Reasons for retirement. We “appended” the “cleaned” GSS’s and conducted a series of analyses based on the samples defined above and the relevant variables constructed for the objectives pursued. The results are presented in sections 4 to 6.2
It must be noted that although the GSS is rich in demographic information and information about actual retirement behaviour, it has little information that would allow the construction of precise financial incentive measures for private and public pensions. This is because past earnings are not known in the dataset and characteristics of private pension plans are also unknown. For example, we do not know the normal and early retirement ages for pension plans and the actuarial penalties for early withdrawal. These are features of plans which provide strong incentives to either continue or withdraw (Stock and Wise, 1991). Although there is no heterogeneity in rules for Canada and Québec pension plans (CPP/QPP), and thus the rules are known, we do not have earnings histories of respondents in order to construct financial incentive measures. These would need to be imputed from available information which would ultimately rely on controls we already used for separately in the regressions.3 Hence, when doing regressions, we rely on crude measures of private pension take-up, current income (for workers) and some indicators of wealth. We also include in some regressions dummy variables for eligibility to CPP/QPP.
3.3 The 2008 Survey of Older Workers (SOW)
After examining data from the 2008 Survey of Older Workers (SOW) also conducted (from October to November 2008) by Statistics Canada, with a sub-sample of the dwellings in the Labour Force Survey (LFS) sample, we decided not to use the SOW for three reasons. The selection criteria is considerably different than for the GSS and very particular: all members of the household aged 50 to 75 who were either still working or who had retired within the last 24 months were selected. The SOW (10,034 respondents from 50 to 74 years, representing 5,253,000 Canadians) includes some interesting financial variables to examine retirement behaviours (having an Occupational Pension Plan, Other Private Savings and Investments, a Registered Retirement Income Fund, a Registered Pension Plan, a Registered Retirement Savings Plan; a large diversity of current income sources). The GSS’s do not have such information except whether a respondent has a ‘Workplace Pension plan’ or receives a pension (without any qualifications). Curiously, unlike the GSS’s, the SOW does not have information on immigration status of respondents or number of children living in the household.
2 A statistical appendix of all programs, data and log files/tables written in STATA11 is available from the authors. All the results can be reproduced with these files. 3 See Chen, Fougère and Rainville (2011) who conduct such an exercise using the longitudinal data from the Survey of Labour and Income Dynamics.

The Recent Evolution of Retirement Patterns in Canada
9
Preliminary examination of the retirement age of retirees and the expected age of retirement of never-retired workers declaring an expected age (a significant proportion of respondents did not have an age in mind) at which they planned to completely leave the paid workforce revealed similar patterns as those found in the GSS. Also, the SOW of 2008 does not provide much additional information on retirement trends since we already have the 2007 wave of the GSS to contrast with the data in 2002 and 1994.

The Recent Evolution of Retirement Patterns in Canada
10
4. The Past: Retirement Patterns of Current Retirees
In this section, we use the sample of retirees aged 68 to 80 in 1994, 2002 and 2007. Questions on the retirement age are retrospective which allows looking not only at the mean retirement age but also at the distribution of retirement ages.
4.1 Observed Trends in the Retirement Age of Retirees
In Figure 1, we present trends in actual retirement ages for years 1994, 2002 and 2007 by gender. Because the retirement ages are highly clustered around specific ages (55, 60, and 65), we regrouped actual retirement ages in the categories 55-57, 58-62, 63-65 and 66-67. The graphs show the proportion having retired in each category by gender and year of survey.
Notes: Authors’ computations from the GSS 1994, 2002, and 2007. Among the 68 years or older respondents in each GSS survey, we regrouped answers to the actual retirement age questions in the categories 55-57, 58-62, 63-65 and 66-67. Sampling weights used.
The proportion who retired within the two earliest age categories has increased over
time for both genders, especially for females. The proportion in the 55-57 ages group was just under 10% in 1994 and doubled to close to 20% in 2007. For the next age group, the 58-62 year-olds, the fraction is stable for males, but substantially increases for females. The 63-65 year-olds cluster trend shows an evolution which mirrors that at earlier ages: in 1994, it has the highest fraction for both genders but decreases substantially over the years. For the last age group, the 66-67 year-olds, we observe a small increase of Canadians that retire after 65 years. We do not present the retirement ages after 67 years of age since because ages at retirement are thinly spread over the later years of life.

The Recent Evolution of Retirement Patterns in Canada
11
Hence, from this figure, we can conclude that among the group of individuals over 68 in 1994, 2002 and 2007, the fraction retiring at earlier ages had increased substantially while the fraction retiring at ages 63 to 65 had considerably decreased.
Although there are clearly distributional aspects to this evolution, we summarize those changes in terms of the average age of retirement and stratify such evolution across sub-groups defined by the socio-economic characteristics of the respondents. Table 1 presents the mean ages at first retirement for years 1994, 2002 and 2007 by these sub-groups. The last column presents the change in the mean retirement age between 2007 and 1994. The average age at first retirement has decreased over time (1.37 year from 1994 to 2007) for the full sample. We then proceeded to test whether the changes were different across groups and whether those differences were statistically significant (** at 5% level, * at 10%). The reduction in the average retirement age across education groups appears to be slightly larger at higher levels. But the difference is statistically different only for high school graduates relative to high school dropouts. We also find that the reduction in the average retirement age in Québec is statistically larger than the one for the other provinces grouped together. The same is true for those born in Canada compared to those born outside Canada, and those with pension receipts compared to those without. This last comparison is quite important as it indicates that those who had private pensions are much more likely to have retired earlier, perhaps due to early retirement windows which were quite pervasive during the 1990s.
Table 1: Trends on Means Actual Retirement Age by Selected Characteristics of Retirees
Characteristics 1994 2002 2007 Change 2007-1994 Gender
Male 61.88 61.09 60.56 -1.32 Female 61.00 60.30 59.81 -1.19
Education Less than High school 61.32 60.98 60.42 -0.90 High school 62.01 60.84 60.04 -1.97 * Some College 61.76 60.46 60.11 -1.65 University 61.69 60.75 59.97 -1.72
Region Québec 61.91 60.40 59.69 -2.22 Rest of Canada 61.46 60.87 60.35 -1.11 **
Marital Status Couple 61.59 60.80 60.07 -1.52 Other 61.51 60.72 60.44 -1.08 **
Immigrant Born Outside Canada 62.02 61.59 61.13 -0.89 Born Canada 61.38 60.46 59.89 -1.49 *
Pension Receipt No 61.06 60.79 60.50 -0.56 Yes 61.88 60.73 59.94 -1.94 **
Total 61.56 60.77 60.19 -1.37 Notes: Author’s computations from the GSS 1994, 2002, and 2007. * (**) denotes change relative to first sub-group is statistically significant at 10 (5) % level. Sample weights used.
The Recent Evolution of Retirement Patterns in Canada
12
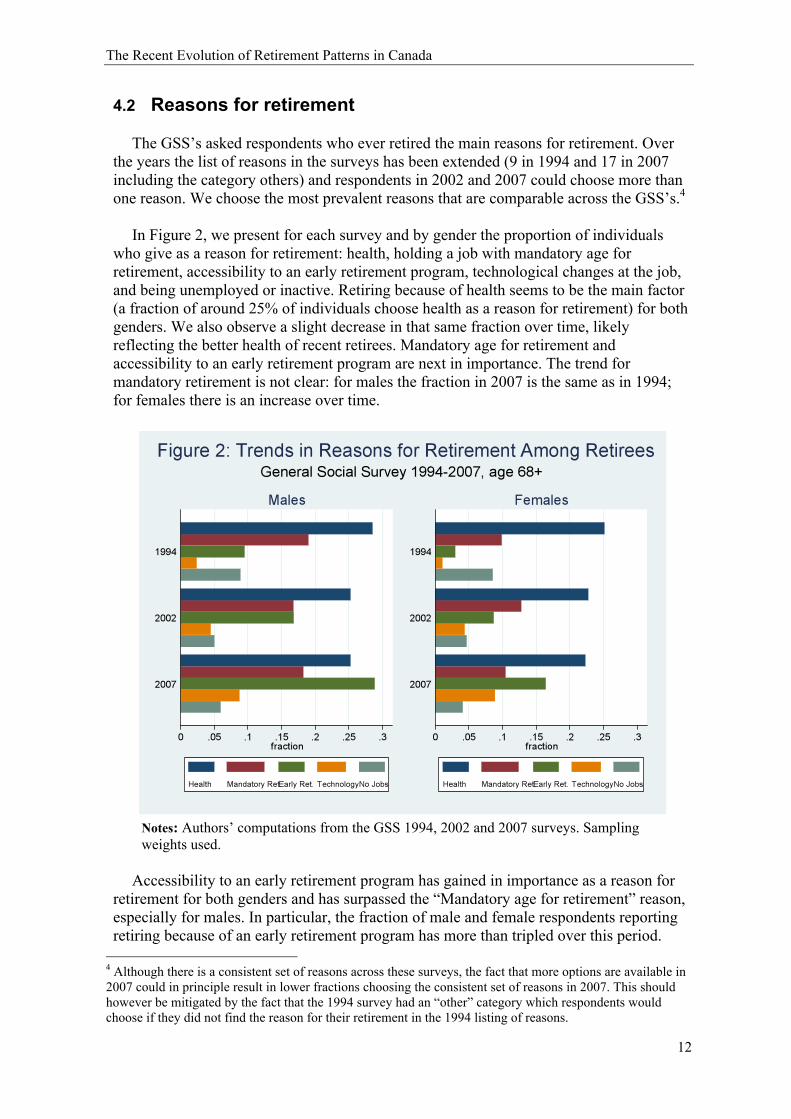
4.2 Reasons for retirement
The GSS’s asked respondents who ever retired the main reasons for retirement. Over the years the list of reasons in the surveys has been extended (9 in 1994 and 17 in 2007 including the category others) and respondents in 2002 and 2007 could choose more than one reason. We choose the most prevalent reasons that are comparable across the GSS’s.4
In Figure 2, we present for each survey and by gender the proportion of individuals who give as a reason for retirement: health, holding a job with mandatory age for retirement, accessibility to an early retirement program, technological changes at the job, and being unemployed or inactive. Retiring because of health seems to be the main factor (a fraction of around 25% of individuals choose health as a reason for retirement) for both genders. We also observe a slight decrease in that same fraction over time, likely reflecting the better health of recent retirees. Mandatory age for retirement and accessibility to an early retirement program are next in importance. The trend for mandatory retirement is not clear: for males the fraction in 2007 is the same as in 1994; for females there is an increase over time.
Notes: Authors’ computations from the GSS 1994, 2002 and 2007 surveys. Sampling weights used.
Accessibility to an early retirement program has gained in importance as a reason for
retirement for both genders and has surpassed the “Mandatory age for retirement” reason, especially for males. In particular, the fraction of male and female respondents reporting retiring because of an early retirement program has more than tripled over this period.
4 Although there is a consistent set of reasons across these surveys, the fact that more options are available in 2007 could in principle result in lower fractions choosing the consistent set of reasons in 2007. This should however be mitigated by the fact that the 1994 survey had an “other” category which respondents would choose if they did not find the reason for their retirement in the 1994 listing of reasons.

The Recent Evolution of Retirement Patterns in Canada
13
This is consistent with the evidence presented in Table 1 where the reduction in the average retirement age has been concentrated among those with private pensions thus potentially reflecting the increased incentives of such plans during the 1980s and 1990s. Technological-on-the-job changes appear to have a small but increasing role. This may reflect the fact that the nature of jobs is changing and older workers faced with new technologies may have difficulties in adopting them. Unemployment is a more marginal reason invoked for retirement and the fraction reporting this as a reason for retirement has declined over the years.
4.3 Determinants of Actual Retirement Ages: Survival Analysis
4.3.1 Survival Rates in Employment by Selected Characteristics
Using the sample of retirees, we have a distribution of retirement ages which is not right-censored. Hence, we conduct a survival analysis of those data. To analyse the exit out of the labour force, we first estimate survival rates in the labour force assuming the risk of exiting starts at 45 for all individuals in our samples of retirees by education and health status (at the time of survey), as well as by two reasons for retirement (due to a mandatory requirement and access to an early retirement program) pooling all the GSS’s (duration is equal to age at retirement minus 45). Of course, since these data are cross-sectional, the measurement of characteristics such as health coincides with the time of the survey and does not correspond to the value taken at the time of retirement or any age before retirement. Figures 3 and 4 present the estimated survival curves.
Notes: Authors’ computations from the GSS 1994, 2002 and 2007. Survival rates are calculated from reports of actual retirement age among respondents aged 68 years or more. Health status is at the time of reporting the age of retirement (Surveys) and not at the time of retirement. Sampling weights used.

The Recent Evolution of Retirement Patterns in Canada
14
In the first panel of Figure 3, the survival rates oppose individuals with a college degree with those with only a high school diploma or an equivalent. There is practically no difference in the survival rates at all ages. The general pattern of the survival curves confirm the trends presented above: jumps into retirement are larger around ages 55, 60 and 65. The age of 55 is a common early retirement age in many private plans while age 60 is the early retirement age for QPP/CPP plans and 65 is the age at which Canadians receive their Old Age Security pension. At age 62, approximately 50% have already retired, and at age 65, almost 85% of retirees had chosen 65 years or less as a retirement age. We compute rates up to age 68. From these jumps in the hazard rate of exit, it is clear that pension programs exhibit some effect on behaviour. This is a common finding across countries (Gruber and Wise, 1999).
The second panel of Figure 3 presents survival rates opposing those declaring having excellent health at the time of the survey with those reporting poor health. Of course, it would have been preferable to compare by health at age 45, however because of the high auto-correlation of health status, health after retirement can be a decent proxy for health while in the work force. Overall, the survival curve for the healthier individuals is always higher than the less healthy showing that the latter exit more quickly out of the labour market. Hence, health plays a crucial role in exit rates out of the labour market for individuals aged 45 or older. This is consistent with the evidence presented in Figure 2 and regression analysis will confirm these results.
Notes: Authors’ computations from the GSS 1994, 2002 and 2007. Survival rates are calculated from reports of actual retirement age among respondents aged 68 years or more. Sampling weights used.
In the first panel of Figure 4 the survival rates compare the survival ages of retirees
who declare having retired due to an early retirement program with those who do not

The Recent Evolution of Retirement Patterns in Canada
15
report this reason. Such a program has a large impact on age at retirement after 50 years, with large changes in the fraction going into a first retirement at ages 55 and 60 years. At 60 years of age almost 65% of retirees with such an option had already retired a first time. The gaps in survival rates increase between the two groups till the 65 years age.
The second panel of Figure 4 presents a very different picture of survival rates for those declaring mandatory retirement among the reasons to retire compared to those who do not. The survival rates are much higher for retirees having most likely a pension plan with a mandatory retirement time limit. The gaps between the two groups increase over ages till the 65 years mark. Large jumps into retirement are observed for ages 63, 64 and 65. The survival rates for the mandatory retirement group most likely reflect that these retirees have worked more years to qualify themselves for a pension plan.
Figure 5 shows the change in survival rates over time (by year). The pattern is obviously very similar to the pattern found in Table 1. Among those retired, survival rates in the labour force have decreased over time.
Notes: Author’s computations from the GSS 1994, 2002 and 2007 for respondents aged 68 years or more. Sample weights used.
4.3.2 Results from Duration Regressions
To estimate the hazard rate or exit rate out of the labour force, we use a complimentary log-log model,5 which estimates the conditional probability of retiring (conditional
5 The complementary log-log model is a binary choice model where the error term is assumed Extreme value type 1. This type of distributional assumption can be shown to follow from the probability of survival within a discrete time interval when the continuous-time hazard is proportional in time-invariant characteristics and time (Sueyoshi, 1992).

The Recent Evolution of Retirement Patterns in Canada
16
duration of the spell in employment, age minus 45), given that the risk of retiring starts at the same age for all individuals in the sample, therefore the age effect is identical to the duration effect. The estimations are conducted by year (1994, 2002, and 2007). All individuals in our regression sample retire before the age of 69. The possible retirement ages are discrete and can be any integer between 45 and 68 justifying the complementary log-log approach. The dependent variable is therefore binary.
The explanatory variables are age, eligibility to a public pension plan or old age allowance, marital status, education levels, urban status, number of children living in the household, immigration status, health status, source of income, dwelling status, household income class, province of residence, and year of survey. The reference categories are identified as omitted in the Tables.
These variables are similarly measured in the three surveys and reasons explaining their presence in the regression for most of them should be self-evident. Eligibility to the CPP/QPP (if respondent is aged 60 years) and eligibility to the old age federal allowance (if respondent is aged 65 years) can precipitate a retirement decision everything else equal. Marital status has been identified as a determinant of retirement, in particular if the spouse is retired or not (but we cannot identify if at age of retirement those conditions prevailed for the individual in the regression sample). Education status is also included. The number of children living in the household increases the financial pressures on the household. Immigration status captures the fact that more recent immigrants have accumulated less work experience and are less financially prepared for retirement. Health status is considered to be an essential factor in retirement decisions as seen in the review of studies in Section 2.
Regarding financial variables, we exploited the available information which is limited as we mentioned in section 3. Given these constraints we construct the following explanatory variables: receiving a private pension (assuming the individual knew he would have a pension after retiring at the age of 45, the amount or type is not asked); receiving capital income, (assuming the individual knew he would have capital income after retirement at the age of 45, the amount or type is not asked); owning a residential dwelling (assuming the individual’s status as owner of not of his dwelling is the same as when he was 45). Recent Canadian studies (Brown and Lafrance, 2010; Brown, Hou and Lafrance, 2010) show that owning the residential principal dwelling generates sizable imputable rents and lowers the income gap between retired and working households. But American studies based on the longitudinal Survey on Health and Retirement (Ondrich, 2011; Bender at al., 2011) present evidence suggesting that owned dwellings can be considered as illiquid assets (reverse mortgages are a rare phenomena in Canada) which do not give rise to an income effect on the age of retirement. A recent Canadian study (Chen, Fougère and Rainville, 2011) based on the Survey of Labour an Income Dynamics finds impacts of imputed pension wealth and accruals on age at retirement. We therefore, include as explanatory variables, pension, dwelling ownership, and household income (as proxy of income at 45).
Table 2 presents the point estimates of the coefficients for both genders and by gender. The first explanatory variable in Table 2 is age and is equivalent to number of years since the beginning of the spell or when the individual is 45. The coefficient is positive and shows that probability of retiring augments with duration such that the hazard rate displays positive duration dependence. The duration effect is larger for males than

The Recent Evolution of Retirement Patterns in Canada
17
females. Eligibility to a state pension at 60 has a positive effect in the sample with both sexes, but the separate regressions shows that this is driven by female behaviour. However, eligibility at 65 has a strong positive effect for both males and females. Being married has a positive and significant effect for the pooled sample but again this is driven by the positive effect on women. More education, on average, reduces the retirement rate in the pooled sample, however the effect is large and negative for males and small and positive for females. Living in an urban area and the number of children has no impact on the retirement rate. Being born in Canada has a positive effect in the pooled sample but it is much stronger for men. Health effects are quite similar across gender as poor health is a strong predictor of early retirement. Having a private pension plan also has a strong positive effect on retirement. Low income defined as less than $30,000 is significantly associated with early retirement. Individuals from the Atlantic Provinces, Québec and BC, both males are females, retire earlier that Ontarians. The opposite is true in the Prairies but mainly because of males in the sample. Finally, the last two coefficients capture period effects and show a very strong increase of the exit rate from the work force in 2002 and 2007 compared to 1994, for both males and female.
Table 3 presents the point estimates of the variables used to explain hazard rates by year of surveys (1994, 2002, and 2007). The duration effects are practically the same. The eligibility at age 60 dummy coefficient is no longer significant in 2007 while the eligible at age 65 coefficient remains very high and significant. While the University effect was negative and strong in 1994, none of the education coefficients are significant in 2007. Being born in Canada has the same effect in 2007 than in 1994 but for the former it is significant. Health effects are similar with bad health decreasing retirement age. Having a pension is a strong predictor of early retirement in both periods, but income effects are no longer present in 2007. In both periods, the Atlantic Provinces and Québec stand out as provinces where individuals retire earlier than in Ontario.

The Recent Evolution of Retirement Patterns in Canada
18
Table 2: Pooled Duration Regression Results, both gender and by gender, z statistic below estimate Variable Both gender Males Females Age 0.201 0.234 0.173 28.51 21.63 19.00 Eligibility CPP/QPP 60 years 0.155 0.105 0.176 2.33 1.07 1.99 Eligibility OAP 65 years 0.650 0.504 0.841 10.82 6.19 9.40 Male -0.317 -8.26 Couple 0.084 0.030 0.107 2.02 0.52 1.87 Education (omitted is less than HS)
High school (HS) -0.079 -0.149 -0.028 -1.42 -1.76 -0.39 More than high school -0.079 0.003 -0.146 -1.81 0.05 -2.402 University or more -0.136 -0.228 0.019
-2.20 -2.62 0.22 Urban -0.044 -0.038 -0.029 -0.98 -0.61 -0.45 Number of children -0.094 -0.010 -0.174 -1.68 -0.14 -2.12 Immigrant (omitted is not recent immigrant)
Born in Canada 0.148 0.244 0.008 3.41 4.11 0.13 Recent Immigrant -0.352 -0.578 -0.305 -1.59 -1.65 -1.28
Health (omitted is good health) Excellent -0.053 -0.036 -0.060 -0.92 -0.44 -0.78 Very good 0.005 0.019 -0.024 0.10 0.3 -0.42 Fair 0.208 0.311 0.063 4.21 4.56 0.89 Poor 0.275 0.389 0.049
2.45 2.55 0.28 Receives pension 0.313 0.483 0.099 8.14 8.78 1.94 Own dwelling -0.010 -0.075 0.048 -0.22 -1.01 0.81 Capital income receipt -0.027 -0.082 0.034 -0.68 -1.46 0.65

The Recent Evolution of Retirement Patterns in Canada
19
Table 2: Continued Variable Both gender Males Females Household income (omitted is income $40,000-50,000)
Missing -0.165 -0.129 -0.165 -2.10 -1.10 -1.55 <$5,000 -0.712 -0.650 -0.680 -1.55 -1.12 -1.07 $5,000-10,000 -0.003 -0.156 0.198 -0.02 -0.61 0.73 $10,000-15,000 -0.196 -0.104 -0.232 -1.97 -0.66 -1.89 $15,000-20,000 -0.198 -0.189 -0.163 -2.20 -1.35 -1.42 $20,000-30,000 -0.160 -0.139 -0.166 -2.05 -1.19 -1.55 $30,000-40,000 -0.157 -0.145 -0.122 -1.91 -1.18 -1.12 $50,000-60,000 -0.039 0.065 -0.112 -0.41 0.50 -0.79 $60,000-80000 0.029 0.130 0.012 0.27 0.86 0.09 $80,000-10,0000 -0.093 -0.125 0.040 -0.62 -0.68 0.15 $100,000> -0.049 0.071 -0.171
-0.39 0.45 -0.72 Provinces (omitted is Ontario)
Maritimes 0.105 0.081 0.142 1.85 0.99 1.95 Québec 0.129 0.129 0.103 2.49 1.79 1.37 Manitoba -0.053 -0.111 0.014 -0.78 -1.253 0.14 Saskatchewan -0.193 -0.361 0.034 -2.50 -3.18 0.034 Alberta -0.082 -0.075 -0.115 -1.29 -0.84 -1.34 British Columbia 0.137 0.163 0.066
2.51 2.13 0.87 Year (omitted is 1994)
2002 0.125 0.152 0.065 2.42 2.18 0.86 2007 0.114 0.153 0.077
2.22 2.14 1.06 Intercept -5.444 -6.338 -4.884 -36.96 -28.87 -25.94 Clusters 125,321 66,015 59,306 Sample size 7,153 3,762 3,629 Notes: Authors’ computations from the GSS 1994, 2002, 2007. Pooled estimates from loglog discrete time duration models. Z-statistics clustered at the respondent level are reported below point estimates. Observations (age at first retirement) are censured after 68 years and represent time at risk of survival not subjects. Sample weight used.

The Recent Evolution of Retirement Patterns in Canada
20
Table 3: Duration Regressions for 1994, 2002, and 2007, z statistic below estimate 1994 2002 2007 Variable Means Coefficients Means Coefficients Means Coefficients Age - 0.196 - 0.211 - 0.203 8.62 24.00 25.59 Eligibility CPP/QPP 60 years - 0.469 - 0.101 - 0.066 2.33 1.23 0.08 Eligibility OAP 65 years - 0.922 - 0.630 - 0.508 6.41 8.91 7.34 Male 0.653 -0.373 0.588 -0.313 0.517 -0.298 -3.22 -5.97 -5.97 Couple 0.663 0.173 0.643 -0.002 0.656 0.114 1.39 -0.04 2.19 Education (omitted is less than HS)
High school (HS) 0.125 -0.102 0.138 -0.167 0.162 -0.022 -0.62 -2.03 -0.32 More than high school 0.236 -0.168 0.316 -0.068 0.269 -0.029 -1.30 -1.16 -0.50 University or more 0.145 -0.143 0.129 -0.240 0.176 -0.048
-0.76 -2.91 -0.65 Urban 0.807 0.073 0.798 -0.0682 0.790 -0.122 0.51 -1.16 -2.18 Number of children 0.097 -0.177 0.110 0.005 0.125 -0.155 -0.95 0.06 -1.97 Place of birth (omitted is non-recent immigrant)
Born in Canada 0.718 0.127 0.724 0.156 0.753 0.149 0.97 2.60 2.47 Recent Immigrant 0.031 -0.811 0.211 0.108 0.007 -0.150 -1.90 0.35 -0.45
Health (omitted is good health) Excellent 0.148 -0.044 0.235 -0.074 0.141 -0.020 -0.25 -1.08 -0.28 Very good 0.270 0.045 0.357 -0.015 0.296 -0.041 0.33 -0.25 -0.72 Fair 0.203 0.345 0.101 0.118 0.175 0.128 2.54 1.38 1.95 Poor 0.083 0.267 0.018 0.197 0.050 0.327
1.36 0.94 2.92 Receives pension 0.506 0.241 0.507 0.376 0.537 0.371 2.19 7.66 7.65 Own dwelling 0.723 -0.101 0.764 0.001 0.802 0.038 -0.81 0.02 0.64 Capital income receipt 0.517 -0.132 0.496 -0.067 0.488 0.047 -1.21 -1.28 0.94

The Recent Evolution of Retirement Patterns in Canada
21
Table 3: Continued 1994 2002 2007 Variable Means Coefficients Means Coefficients Means Coefficients Household income (omitted is income $40,000-50,000)
Missing 0.363 -0.447 0.280 -0.189 0.274 -0.016 -1.69 -1.94 -0.17 <$5,000 0.004 -1.047 0.000 0.399 0.003 -0.553 -0.98 0.58 -1.41 $5,000-10,000 0.025 -1.057 0.004 -0.430 0.001 -0.922 -0.29 -1.15 -1.45 $10,000-15,000 0.106 -0.375 0.072 -0.231 0.039 -0.216 -1.28 -1.97 -1.65 $15,000-20,000 0.124 -0.530 0.084 -0.288 0.079 0.017 -1.87 -2.57 0.16 $20,000-30,000 0.186 -0.264 0.175 -0.231 0.142 -0.123 -0.99 -2.40 -1.27 $30,000-40,000 0.083 -0.417 0.129 -0.127 0.145 -0.084 -1.50 -1.23 -0.87 $50,000-60,000 0.023 -0.265 0.069 0.144 0.078 -0.081 -0.70 1.20 -0.73 $60,000-80,000 0.019 -0.945 0.055 -0.082 0.074 0.261 -1.86 -0.62 2.32 $80,000-100,000 0.010 -0.183 0.025 -0.257 0.049 0.032 -0.30 -1.13 0.205 $100,000> 0.003 0.343 0.028 0.115 0.062 -0.126
0.54 0.61 -0.95 Provinces (omitted is Ontario)
Maritimes 0.076 -0.103 0.077 0.200 0.062 0.184 -0.64 2.84 2.60 Québec 0.222 -0.046 0.213 0.226 0.234 0.172 -0.32 3.20 2.67 Manitoba 0.043 -0.198 0.038 0.074 0.038 -0.088 -0.97 0.79 -0.96 Saskatchewan 0.036 -0.140 0.033 -0.043 0.031 -0.366 -0.72 -0.44 -3.38 Alberta 0.067 -0.321 0.079 0.034 0.091 -0.047 -1.71 0.40 -0.55 British Columbia 0.152 0.218 0.144 0.172 0.149 0.090
1.38 2.56 1.29 Intercept -5.261 -5.391 -5.410 -11.28 -30.94 -32.67 Clusters 12,795 61,946 50,580 Sample size 824 4,018 3,367
Notes: Author’s computations from the GSS 1994, 2002, and 2007. Estimates from loglog discrete time duration model. Z-statistics clustered at the respondent level are reported below point estimates. Means of each variable is reported left of the parameter estimates. Observations (age at first retirement) are censured after 68 years and represent time at risk of survival not subjects. Sample weight used.

The Recent Evolution of Retirement Patterns in Canada
22
5 The Future: Expected Retirement Ages among Workers
We now turn to workers in the samples and their expected retirement ages. Research
has shown that on average workers’ expected retirement age and the actual retirement age are quite close. So the trend in expectations of workers may tell us something about the future. In this section, we use the second sample we constructed from the GSS retirement surveys selecting workers aged 45 to 54 years. 5.1 Observed Trends in Expected Retirement Ages
Figure 6 presents trends in expected retirement ages for years 1994, 2002 and 2007 by gender. Since like retirement ages, the expected retirement ages are highly clustered around specific ages (55, 60, and 65), we regrouped the expected retirement ages in the categories 55-57, 58-62, 63-65.
Notes: Authors’ computations from the GSS 1994, 2002 and 2007 among respondents aged 45-54 years and working. Sample weights used.
The proportion of workers in the first cluster (55-57) has decreased over time for both
genders. The fractions are under the 30% level in 2007 for both genders; a marked decrease for females for whom the fraction was 40% in 1994. The fraction for the 58-62 cluster has not changed for males over time; and has increased marginally for females which mirrors partly the fall in the fraction of the two preceding clusters. In the case of males, 40% expect to retire around the ages of 58-62 in 2007; for females the fraction is around 35% in the same year compared to 30% in 1994. Results for the 63-65 years

The Recent Evolution of Retirement Patterns in Canada
23
cluster shows that over time more workers expect to retire at those ages in 2007 compared to 1994 and 2002, for both genders (the fraction is around 35%).
We then analyse the changes in average expected age of retirement over time stratifying by individual characteristics. Table 4 presents the mean expected age of retirement for years 1994, 2002 and 2007 by characteristic. The last column presents the change in the mean expected retirement age between 2007 and 1994. The mean expected ages at retirement has increased over time for all characteristics. We then proceeded to test whether the differences in the changes were statistically significant (as in Table 1; ** denotes 5% significance, * 10%). We find that the increase in means for the two most educated groups is statistically lower than the increase for the less than high school group. Hence, the expected retirement age has increased by more among less educated workers. We also find that the change in the Rest of Canada is statistically smaller than in Québec. The same is true for the self-employed compared to salaried workers. The increase in the average expected retirement age for Public administration workers is lower than the increase for those in other sectors and finally the increase for those with employer pensions is statistically lower than for those with no employer pension.
Table 4: Trends in Mean Expected Retirement Ages by Education, Pension Plan and Economic Sector Characteristics 1994 2002 2007 Change 2007-19944 Gender
Female 58.58 59.64 60.22 1.64 Male 59.29 60.39 60.81 1.52
Education Less than high school 59.53 60.44 61.70 2.17 High school 57.77 60.03 60.19 2.42 Some College 59.33 59.81 60.42 1.09 ** University or more 59.24 60.31 60.54 1.30 **
Region Québec 58.07 59.30 60.05 1.98 Rest of Canada 59.34 60.34 60.70 1.36 **
Marital Status Couple 58.79 59.81 60.31 1.52 Other 60.13 60.91 61.41 1.28 **
Place of birth Born in Canada 58.65 59.77 60.31 1.66 Not born in Canada 60.13 61.21 61.45 1.32
Self-employment Not Self-employed 58.93 59.82 60.39 1.46 Self-employed 59.16 61.45 61.49 2.33 **
Public administration All others sectors 59.10 60.22 60.73 1.63 Public administration 57.72 58.18 58.57 0.85 *
Pension plan No 59.78 61.46 61.88 2.10 Yes 58.47 59.27 59.65 1.18 **
Total 58.94 60.05 60.53 1.59 Notes: Authors’ computations from the GSS 1994, 2002, and 2007. * (**) denotes change relative to first sub-group is statistically significant at 10 (5) % level. Sample weights used.

The Recent Evolution of Retirement Patterns in Canada
24
Taken together these results suggest that the size of the increase in expected retirement ages is heterogeneous. Groups covered with pensions and better pensions (Public pension employees) as well as provinces such as Québec, who witnessed the largest drop in retirement ages in earlier cohorts, all appear to be holding behind the general increase in the expected retirement age. Other groups such as the self-employed and the less educated are also driving the increase in the expected retirement age.
5.2 Determinants of Expected Retirement Ages
5.2.1 By Gender
To analyse the determinants of expected retirement ages we estimated linear regression models. First the samples of workers from the GSS’s are pooled for males and females and then performed separately by gender. Table 5 presents the OLS estimation results although technically an ordered probit would be more appropriate (coefficients are easier to interpret with OLS and there was little difference in the estimated effects between probit and OLS). We find that males expect to retire on average .63 years later than females. There is no pooled ‘marriage’ effect; however married females expect retiring earlier (.4 years) than unmarried females. The education effects are rather strong and positive, in particular for the university educated (relative to those with less than a high school degree). The pooled results are in some sense misleading for the born in Canada dummy, as it is negative and significant for men but positive and almost significant for women. Recent immigrants, both males and females, expect retiring much later than those having immigrated earlier. Those with private pensions expect retiring almost two years earlier, those who own their dwelling, one year earlier, the same as those with capital income. Income effects are very strong as the income coefficients move from highly negative to highly positive for both males and females. Individuals from all areas of Canada expect to retire earlier that Ontarians, in particular those from the Atlantic Provinces, Québec and Manitoba, both males and females. Finally, ceteris paribus, expected age at retirement has increased by almost 2 years for males and females from 1994 to 2007.
5.2.2 By Year of Survey
The same estimations are conducted by year (1994, 2002, and 2007). Table 6 shows the changes in the coefficients of the expected age at retirement equation from 1994 to 1997. The ‘marriage’ effect has changed radically passing from .726 in 1994 to -.340 in 2007. Education effects are much smaller in 2007 in particular for Some College (education level higher than high school) and University. The number of children has positive effects in both periods but considerably stronger in 2007. The recent immigrant variable has a very large 1.5 year effect in 2007 despite having no statistical significance in 1994. The health coefficients behave somewhat strangely and are difficult to interpret and this may result from the fact that most are in good health and working. Expecting to receive a pension has a very strong negative effect in both 1994 and 2007 as well as owning a dwelling. Capital income also has a negative effect but considerably smaller in both years. Income effects are very strong in 1994 in particular the lower income brackets, in 2007 they are smaller but they have the expected U-shape (as the omitted category is the $40,000 to $50,000 category). Finally, there are substantial changes in the regional effects as all are negative (relative to Ontario) in 2007.

The Recent Evolution of Retirement Patterns in Canada
25
Table 5: Linear Regression Results both gender and by gender, t statistic below estimate Variable Both sexes Males Females Age 0.174 0.152 0.191 7.62 4.76 6.17 Male 0.956 6.27 Couple -0.468 0.249 -0.859 -2.85 0.98 -3.88 Education (omitted is less than high school)
High school -0.440 -0.185 -0.751 -1.70 -0.58 -1.71 More than high school 0.109 0.010 0.106 0.46 0.03 0.26 University or more 0.700 0.754 0.462
2.58 2.18 1.03 Urban 0.227 0.187 0.304 1.33 0.80 1.29 Number of children 0.202 0.169 0.190 2.91 1.80 1.91 Place of birth (omitted is non-recent immigrant)
Born in CAN -0.289 -0.734 0.413 -1.31 -2.43 1.41 Recent Immigrant 1.077 0.299 2.165 3.00 0.58 4.84 Self-employed -0.181 -0.301 -0.152 -0.81 -1.05 -0.45
Health (omitted is good health) Excellent 0.068 0.102 0.089 0.36 0.39 0.36 Very good -0.097 -0.060 -0.161 -0.55 -0.25 -0.67 Fair -0.186 0.127 -0.625 -0.56 0.29 -1.35 Poor -0.492 -1.309 0.963
-0.74 -1.65 1.00 Have pension plan -1.652 -1.888 -1.240 -10.32 -8.38 -5.71 Own dwelling -1.118 -0.895 -1.405 -5.32 -3.19 -4.65 Capital income receipt -0.675 -0.485 -0.917 -4.64 -2.42 -4.68

The Recent Evolution of Retirement Patterns in Canada
26
Table 5: Continued Variable Both sexes Males Females Household income (omitted is income $40,000-50,000)
Missing -0.468 -0.675 -0.223 -1.62 -1.54 -0.61 <$5,000 2.891 5.149 -0.471 2.10 5.95 -0.29 $5,000-10,000 1.957 2.249 1.730 2.02 1.54 1.31 $10,000-15,000 2.273 1.298 2.966 2.63 0.84 3.16 $15,000-20,000 1.158 0.212 1.289 2.19 0.27 1.96 $20,000-30,000 0.894 0.609 1.007 2.50 0.95 2.44 $30,000-40,000 1.073 1.253 1.058 3.35 2.70 2.56 $50,000-60,000 0.005 0.150 -0.064 0.02 0.36 -0.15 $60,000-80,000 -0.520 -0.429 -0.574 -1.92 -1.06 -1.64 $80,000-100,000 -0.775 -0.581 -0.891 -2.76 -1.40 -2.41 $100,000> -1.366 -1.157 -1.658
-5.13 -2.92 -4.85 Provinces (omitted is Ontario)
Maritimes -0.675 -0.775 -0.894 -4.64 -2.64 -3.01 Québec -1.074 -0.756 -1.515 -5.94 -2.96 -6.22 Manitoba -0.769 -0.954 -0.705 -2.69 -2.45 -1.81 Saskatchewan 0.019 0.489 -0.576 0.06 1.08 -1.42 Alberta 0.168 0.155 0.182 0.75 0.51 0.58 British Columbia 0.066 0.549 -0.579
0.30 1.81 -2.03 Year (omitted is 1994)
2002 1.027 1.062 0.924 4.38 3.39 2.68 2007 1.704 1.642 1.744
7.48 5.40 5.21 Industry Controls yes Yes yes Occupation Controls yes Yes yes Sample Size 8,291 4,179 4,112
Notes: Author’s estimations from the GSS 1994, 2002, 2007. Sample weight used.

The Recent Evolution of Retirement Patterns in Canada
27
Table 6: Means and Linear Regression Results by Year, t statistics below estimates 1994 2002 2007 Variable Means Coefficients Means Coefficients Means Coefficients Age 48.7 0.379 49.5 0.189 49.3 0.118 4.97 5.25 4.53 Male 0.549 1.540 0.509 1.023 0.482 0.727 2.97 4.52 4.30 Couple 0.703 -0.281 0.702 -0.503 0.697 -0.515 -0.48 -2.04 -2.70 Education (omitted is less than high school)
High school 0.195 -0.759 0.174 0.103 0.190 -0.507 -1.11 0.29 -1.69 More than high school 0.347 0.678 0.442 0.182 0.429 -0.039
1.05 0.58 -0.14 University or more 0.239 0.670 0.241 1.116 0.270 0.518
0.88 2.88 1.60 Urban 0.763 0.112 0.737 -0.183 0.758 0.370 0.19 -0.75 1.92 Number of children 0.829 0.147 0.871 0.334 0.985 0.223 0.70 3.32 2.76 Place of birth (omitted is non-recent immigrant)
Born in Canada 0.777 -0.862 0.829 -0.233 0.843 0.010 -1.34 -0.82 0.04 Recent Immigrant 0.031 0.675 0.047 1.049 0.040 1.283 0.54 1.88 3.38
Self-employed 0.191 -1.167 0.180 0.178 0.162 0.143 -1.70 0.51 0.52
Health (omitted is good health) Excellent 0.312 0.531 0.346 0.485 0.282 -0.513 0.89 1.88 -2.46 Very good 0.357 -0.352 0.400 0.294 0.411 -0.321 -0.61 1.20 -1.67 Fair 0.065 -1.669 0.043 0.820 0.048 -0.336 -1.68 1.75 -0.84 Poor 0.013 -1.795 0.006 0.387 0.009 1.238
-1.41 0.33 1.52 Have a pension plan 0.549 -1.317 0.610 -1.69 0.550 -1.657 -2.29 -7.09 -9.25 Own dwelling 0.815 -1.83 0.822 -0.921 0.839 -0.932 -2.98 -3.19 -3.97 Capital income receipt 0.316 -0.278 0.205 -0.987 0.276 -0.783 -0.66 -4.17 -4.75

The Recent Evolution of Retirement Patterns in Canada
28
Table 6: Continued 1994 2002 2007 Variable Means Coefficients Means Coefficients Means Coefficients Household income (omitted is income $40,000-50,000)
Missing 0.310 -0.157 0.154 -0.607 0.151 -0.737 -0.24 -1.33 -2.23 <$5,000 0.001 7.445 0.002 -1.0703 0.001 1.79 5.12 -1.88 1.14 $5,000-10,000 0.010 1.404 0.006 1.442 0.003 2.995 0.78 1.17 1.43 $10,000-15,000 0.019 4.180 0.012 2.88 0.012 1.071 3.26 2.03 0.81 $15,000-20,000 0.025 2.497 0.019 0.805 0.015 0.495 1.37 1.02 0.78 $20,000-30,000 0.069 0.702 0.060 1.090 0.045 0.515 0.70 1.94 1.19 $30,000-40,000 0.098 1.736 0.083 0.709 0.072 0.773 1.95 1.61 1.99 $50,000-60,000 0.088 0.592 0.110 -0.541 0.091 0.036 0.73 -1.36 0.10 $60,000-80,000 0.120 -0.423 0.160 -0.677 0.146 -0.722 -0.56 -1.79 -2.25 $80,000-100,000 0.071 -0.733 0.112 -1.227 0.120 -0.762 -0.85 -3.00 -2.32 $100,000> 0.071 -0.586 0.191 -1.657 0.267 -1.634
-0.61 -4.30 -5.24 Provinces (omitted is Ontario)
Maritimes 0.071 -0.008 0.071 -1.203 0.071 -0.973 -0.01 -3.99 -4.24 Québec 0.247 -0.469 0.211 -1.282 0.243 -1.116 -0.76 -5.05 -5.72 Manitoba 0.038 -0.511 0.058 -0.285 0.035 -1.245 -0.59 -0.74 -3.97 Saskatchewan 0.029 1.343 0.052 0.091 0.028 -0.437 1.48 0.17 -1.29 Alberta 0.088 0.416 0.096 0.167 0.106 -0.048 0.63 0.46 -0.18 British Columbia 0.124 0.579 0.111 0.486 0.132 -0.356
0.87 1.44 -1.34 Industry Controls yes yes yes Occupation Controls yes yes yes Sample size 644 2,854 4,793
Notes: Author’s estimations from the GSS 1994, 2002, 2007. Sample weight used.

The Recent Evolution of Retirement Patterns in Canada
29
5.3 Determinants of Unknown Expected Retirement Age and of No Intention to Retire
Some workers declare that their expected retirement age is unknown or that they do not have an age in mind at which they plan to retire from their current job. On the other hand, some respondents from the surveys who are currently working do not plan to retire from their current job or will not completely leave the workforce to retire. Table 7 presents statistics on this topic.
Table 7: Trends on unknown expected retirement age and of no intention to retire Characteristics 1994 2002 2007 Respondent never expects to retire 10.75 15.95 9.55 Respondent does not know when will retire 23.25 11.88 13.04 Notes: Author’s calculation from the GSS 1994, 2002, and 2007. Respondents aged 45-54 years. Sample weights used.
Table 8 presents marginal effects of logit estimations of the probability of not knowing
the expected retirement age and the probability of having no intention to retire, for the 45-54 year-olds still in the labour market for the pooled years 1994-2007. We start with the marginal effects of the probability of having no expectations regarding the age at retirement. Males have a much lower probability of not answering this question than females. Being very poorly educated increases this probability as these individuals probably face a very uncertain last few years in the labour market. Those born in Canada have a lower probability as they have probably accumulated more years in the labour market making their retirement income higher. There is considerable heterogeneity in the industry effects going from -0.044 to 0.082. Being healthy reduces the probability as poor health is associated to uncertainty about future income. Adding income to the household has very strong negative effects. Again, retirement income is probably higher and more certain at higher level of incomes. Finally, the effect for Québec relative to Ontario is high and negative and so is the effect of having a pension plan which is generally contingent on the age at retirement. The Québec effect is possibly related to the high unionisation rate in this province. The 2002 coefficient is large and negative, we find no reason why this is the case.
We now comment on the marginal effects on the probability of having no intention to retire. Being self-employed increases the probability substantially and significantly. Of course, the largest effect comes from having a pension plan but this is a bit of a tautology. Finally, all regions have negative effects and in the same range (relative to Ontario), which is more difficult to explain. Therefore, few determinants are identified in this estimation.

The Recent Evolution of Retirement Patterns in Canada
30
Table 8: Marginal effects of logit estimations of not knowing expected retirement age and of no intention to retire, 45-54-year-olds, pooled years 1994-2007
Expected retirement age not known
No intention to retire
Variable Marginal effect
Z value Marginal effect
Z value
Age -0.001 -0.63 0.005 3.70 Male -0.071 -5.44 0.007 0.82 Couple 0.013 1.07 -0.013 -1.40 Education (omitted is less than high school) High school -0.041 -2.07 -0.013 -1.03 More than high school -0.042 -2.37 -0.000 -0.03 University or more -0.029 -1.34 0.029 1.79 Urban -0.003 -0.20 0.004 0.40 Number of children 0.007 1.38 0.004 1.03 Place of birth (omitted is non-recent immigrant)
Born in Canada -0.028 -1.87 0.001 0.07 Recent immigrant 0.003 0.12 -0.003 -0.17 Self-employed 0.002 0.12 0.036 3.64 Occupation (omitted is blue collar)
Management -0.044 -1.90 0.030 1.94 White collar -0.036 -1.80 0.005 0.39 Sales and services -0.021 -1.02 0.014 0.95
Sectors (omitted is public administration) Primary 0.038 0.88 0.011 0.31 Primary non traditional 0.029 0.78 -0.029 -0.94 Utilities -0.061 -1.09 -0.064 -1.15 Manufacturing -0.007 -0.25 0.004 0.16 Construction 0.070 2.40 -0.024 -0.93 Trade 0.032 1.25 -0.028 -1.15 Transport 0.060 1.91 -0.014 -0.56 Finance and insurance -0.004 -0.11 0.003 0.10 Management 0.082 2.54 -0.010 -0.35 Health and social services 0.010 0.40 -0.041 -1.70 Services 0.039 1.70 -0.010 -0.44

The Recent Evolution of Retirement Patterns in Canada
31
Table 8: Continued Expected retirement age
not known No intention to retire
Variable Marginal effect
Z value Marginal effect
Z value
Health (omitted is good health) Excellent -0.024 -1.70 0.008 0.69 Very good -0.029 -2.20 -0.014 -1.38 Fair -0.019 -0.92 -0.004 -0.21 Poor -0.013 -0.30 0.011 0.26
Have a pension plan -0.073 -6.24 -0.169 -15.38 Own dwelling 0.006 0.41 -0.039 -3.77 Capital income receipt -0.020 -1.61 -0.013 -1.24
Household income (omitted is income $40,000-50,000) Missing 0.021 0.87 0.023 1.16 <$5,000 0.136 0.97 -0.024 -0.32 $5,000-10,000 0.174 1.77 0.0022 0.05 $10,000-15,000 0.099 1.77 -0.023 -0.84 $15,000-20,000 0.004 0.11 0.009 0.32 $20,000-30,000 -0.012 -0.43 0.044 1.66 $30,000-40,000 -0.024 -0.90 -0.004 -0.20 $50,000-60,000 -0.021 -0.84 -0.030 -1.57 $60,000-80,000 -0.045 -1.89 -0.036 -1.95 $80,000-100,000 -0.074 -3.17 -0.018 -0.86 $100,000> -0.081 -3.71 -0.037 -1.95
Provinces (omitted is Ontario) Maritimes -0.004 -0.26 -0.045 -3.71 Québec -0.056 -3.62 -0.026 -2.27 Manitoba -0.022 -1.04 -0.028 -1.68 Saskatchewan -0.024 -1.10 -0.020 -1.09 Alberta 0.010 0.66 -0.031 -2.55 British Columbia 0.004 0.25 -0.041 -3.16
Year (omitted is 1994) 2002 -0.065 -3.94 0.057 4.27 2007 -0.070 -4.46 0.007 0.55
Sample size 10,386 11,100 Notes: Author’s estimations from the GSS 1994, 2002, 2007. Sample weight used.

The Recent Evolution of Retirement Patterns in Canada
32
6. A New Reality: Return to Work After Retirement
6.1 Trends in the Fraction Returning to Work
We now examine the return to work behaviour of retirees aged 55 to 70 who have retired at least once from the labour market. The sample is composed of respondents who have worked before retirement and have experienced a first retirement.6 Figure 7 presents the fraction of respondents working after retirement by gender and year of the GSS. Because of small sample size the fractions of retirees working after a first retirement are clustered in age groups (55-60, 61-65, and 65 years old or more). As expected, for each year, the larger proportion of the returnees to work is from the 55-60 cluster for both genders. Compared to 1994, for males there is clear positive trend to return to work after a first retirement, and for all age groups; for females the trend (2007 compared to 2002) is less clear cut. For males and years 2002 and 2007, the fractions of returnees in the first two clusters of ages are rather important (28% and 20% respectively).
Notes: Authors’ computations from the GSS 1994, 2002, and 2007. Sample weight used.
6.2 Reasons to Return to Work
Figure 8 presents trends in reasons for returning to work after retirement by gender and year (2002 and 2007). As with the reasons to retire, the GSS’s have expanded the list of reasons over time. Since the GSS 1994 coded few reasons (financial, health, wanted something to do and others), we used only reasons from the last two surveys, merging the reasons which appeared similar (abstracting from the “other reasons” category). The
6 The overall percentage of respondents aged 55 to 70 who have retired at least once and have worked after retirement are the following by survey’s year: 5.21 % (1994), 14.21 % (2002), and 13.28 % (2007).

The Recent Evolution of Retirement Patterns in Canada
33
trends are presented for five reasons: financial; stopped care-giving to spouse or a parent; better health; was offered a job by a former employer; dislikes retirement or wanted to do something. The financial motivation is largely the main reason to return to work for both genders, and the fractions for this reason have substantially increased over time. The second most important reason is that retirees returning to work experienced a sense of boredom or uselessness in retirement. Two reasons (obligation of family care-giving reduced and a better health), although marginal as motivations have increased from 2002 to 2007. This may likely reflect that the retired have better health after a spell of retirement and care-giving of a dependent is more of an institutional responsibility.
Notes: Authors computations form the GSS 2002 and 2007. Because the question format was different in 1994, we could not compare 1994 with other years. Sample weight used.
6.3 Factors Associated with Returning to Work
Here we estimate the impact of certain variables on the probability of working given a respondent reports he has retired at least once from the labour market. Although, we know from the survey whether an individual has returned to work after retirement, we have little information on him at that moment, therefore we analyze the determinants of labour force participation at the time of the survey for retired individuals when we observe several characteristics of the respondent. Because of small sample size a regression with the 1994 GSS is not performed separately.
The first column in Table 9 contains the estimates of the labour force participation equation for the 55 to 70 year-olds who have declared that they have retired at least once from the labour market with the pooled data sets (1994, 2002 and 2007), while the last two columns are for 2002 and 2007 respectively. We present in column 1 the average marginal effects on the probability of working for a sample of retired individuals with the

The Recent Evolution of Retirement Patterns in Canada
34
pooled sample. The average effect of age is strong and negative as one additional year of age decreases the probability of work by more than .01. Males have a much higher probability of working than females with an average effect of .07. Education also has a strong positive effect up to .08 for university graduates. An additional child in the household increases the probability of working by .027 on average in the sample. Place of birth and recent immigration have no effects. Health is major factor as simply fair health relative to good health reduces the probability of work by .10 while poor heath reduces it by -.22, a very large drop. Receiving a pension or owning one’s dwelling has no effects, however having capital income reduces the probability of work by 0.32. There are very strong regional effects. Quebecers and BC residents, ceteris paribus, participate considerably less than Ontarians while the inverse is true of Prairie residents with rather large effects in Manitoba. Finally, year dummies show a very large increase from 1994 to 2002 and relative stability from 2002 to 2007. We then present separate regression results from 2002 and 2007. A few differences are striking. First, the university effect is very high in 2002, the own dwelling coefficient is negative and significant in 2007 while it is not in 2002; and Saskatchewan has a very high positive coefficient in 2002 but negative and not significant in 2007.

The Recent Evolution of Retirement Patterns in Canada
35
Table 9: Logit Regression Estimates of Probability to Work After
Retirement, marginal effects and z statistics below estimates Variable Pooled 2002 2007 Age -0.012 -0.016 -0.012 -12.4 -10.58 -8.27 Male 0.070 0.092 0.091 8.03 6.32 7.48 Couple 0.001 -0.001 -0.003 0.08 -0.06 -0.20 Education (omitted is less than high school)
High school 0.025 0.049 0.016 2.13 2.37 0.88 More than high
school 0.041 0.063 0.031 4.16 4.31 1.98 University or more 0.079 0.145 0.054
5.82 6.05 2.95 Urban -0.005 -0.013 0.005 -0.49 -0.91 0.37 Number of children 0.027 0.028 0.038 3.29 1.77 2.88 Place of birth (omitted is non-recent immigrant)
Born in Canada 0.013 0.020 0.004 1.1 1.01 0.28 Recent Immigrant 0.007 0.000 -0.066 0.16 -0.01 -0.96
Health (omitted is good health) Excellent 0.037 0.065 0.038 3.45 3.55 2.37 Very good -0.006 0.008 0.008 -0.59 0.47 0.53 Fair -0.100 -0.118 -0.113 -5.13 -3.53 -4.49 Poor -0.217 -0.410 -0.141
-5.24 -3.51 -2.79 Receives pension -0.011 -0.031 0.006 -1.18 -2.09 0.47 Own dwelling -0.012 0.025 -0.036 -0.96 1.17 -2.09 Capital income receipt -0.032 -0.025 -0.058 -3.87 -1.75 -4.67

The Recent Evolution of Retirement Patterns in Canada
36
Table 9: Continued Variable Pooled 2002 2007 Provinces (omitted is Ontario)
Maritimes -0.011 0.008 -0.034 -0.98 0.40 -1.88 Québec -0.040 -0.010 -0.043 -3.6 -0.55 -2.56 Manitoba 0.036 0.027 0.071 2.5 0.94 3.53 Saskatchewan 0.024 0.096 -0.029 1.45 3.95 -1.01 Alberta 0.047 0.075 0.039 3.79 3.49 1.99 British Columbia -0.031 -0.018 -0.020
-2.51 -0.82 -1.07 Year (omitted is 1994) 2002 0.073 6.36 2007 0.060 5.31 Sample Size 10,216 4,535 4,587
Notes: Authors’ computations from the GSS 1994, 2002 and 2007. Marginal effects from logit models reported with z-statistics for 2002 and 2007. Because of small sample issues, we could estimate 1994 separately in this analysis. Sample weight used.

The Recent Evolution of Retirement Patterns in Canada
37
7. Conclusion: Connecting the Dots
From our analysis, it is possible to connect the dots between the trend in the average retirement age of past birth-cohorts of retirees and the trend in the average expected retirement ages of current workers also by birth cohort. Figure 9 shows the results.
Figure 9
Notes: Author’s computations from the GSS 1994, 2002, and 2007. We computed the average retirement ages of respondents aged 67 years or more in 1994, 2002, and 2007 for cohorts born prior to 1935; and the average mean retirement age of respondents less than age 55 in the same years.
From these computations, it is clear that the trend in retirement age is likely to shift dramatically. Prior to 1945, cohorts of retirees (reaching age 65 prior to 2000) were retiring earlier. Starting with cohorts reaching 65 years in 2000, we are seeing a reverse trend with expected retirement ages increasing year after year.
This upward trend is apparent in current changes in labour force participation by age. In figure 10, we show that for both males and females labour force participation rates have been steadily increasing. For females, the largest increases are at earlier ages because of the general increase in labour force attachment. For males, the largest changes are observed at later ages. This is also consistent with the evidence we have presented earlier: retirement ages are increasing again after a long period of steady declines. Another pattern is emerging: return to work after retirement is more frequent. This has also the effect of increasing overall labour force participation.

The Recent Evolution of Retirement Patterns in Canada
38
Notes: Authors’ calculation from the GSS 1994, 2002, and 2007. Smoothed labour force participation rate profiles are computed using” lowess” smoothing with bandwith = 0.4. Sample weights used.
While the patterns are clear, and they are common to many other countries7, it is less
clear whether there is strong evidence of what has caused these shifts. The findings in this report tend to suggest that the well-documented abundance of early retirement programs in employer-provided pensions may have caused a decrease in the labour force participation rates of males in the 1980s and 1990s. First, we have seen an increase in the fraction of retirees claiming to have retired because of early retirement program offers and second we have seen large differences in survival rates between those with private pensions and those who don’t. Over the last 10 to 15 years, we have now seen a decrease in the generosity of private pensions and also a change from defined benefit to defined contribution pensions, which are more neutral in terms of retirement incentives. Indeed, those workers with private pensions appear to be expecting longer careers but what is perhaps more interesting is that the increase in expected retirement ages among future private pensioners is not as large as for that of workers without private pensions. In terms of composition effects, it is unlikely that the increase in education in these cohorts can explain the increase in retirement ages. As we documented, the increase in expected retirement ages among more educated workers is lower than that for less educated workers. This may suggest that other factors may be at play which may include the desire to spend time in retirement together within couples (women are having longer careers) (Schirle, 2008).
7 Crawford and Tetlow (2010), find similar patterns as the ones in this study for England.

The Recent Evolution of Retirement Patterns in Canada
39
The evidence we present in this report is mostly good news for government and pension fund managers.8 Although pensioners are living longer, increasing the annuity burden of pension funds, and dependency ratios continue to grow, workers are now working longer and often return to work after their first retirement which should lower the pressures on public and private pension funds. The welfare effects of such trends depend in part on the underlying forces and whether or not workers are working longer simply to make up for less generous pensions. Although, the data is pre-2008 and thus before the financial crisis, our results show that the expected trend in delayed retirement should be reinforced by the loss of jobs and wealth created by the crisis. Indeed, we find that incentives tied to income and financial are relatively strong in our regression analyses. Given that the structural elements underlying the crisis have not been modified, the Canadian economy should be growing at a relatively slow pace for the next few years and the underlying uncertainty in the economy should cause individuals to delay retirement until some semblance of stability in the financial markets return. This will play less in Quebec for example where the percentage of individuals who are unionised, and in most cases with strong incentives to retire early, remains around 30%. Finally, given the strong public policy interest on aging and retirement, we suggest that a special longitudinal survey on aging and retirement be created in Canada as in England and the United States.
Private pensions are a potent force driving expectations, reducing expected age at retirement and driving people into retirement. Strangely, they do not seem to matter for returning to work after retirement. Capital income also reduces considerably expected age at retirement and drives people out of the labour force, but it also has a negative impact returning to work. In general income effects, as predicted by theory are reducing labour force participation and drives expectations toward early retirement. Education matters only for returning to work, as more educated individuals display a higher propensity to work. Poor or fair health matters considerably pushing individuals out of the labour market permanently. For expectations, results are hard to interpret, mostly all workers are in good health and being in poor health and at work could signify strong liquidity constraints and relatively important financial considerations.
What is the policy relevance of all this. Two forces are at play for government budgets. People are living longer so that they will be consuming services and receiving pensions for a longer period. However, our results show that they will probably be working for longer and in greater numbers. Because, the more highly educated are returning to work after a first retirement and that there is still a positive trend in the human capital stock we expect that the participation rate trends actually observed and expectations about age at retirement will probably continue to increase labour force participation of the 45-70 year-olds, in particular if individuals are healthier.
8 We could not separate clearly workers (or retirees) in the private and public sector (in the GSS’s only workers in the public administration sector form a separate category). Their mean retirement age has not increased and most likely their retirement behaviour has not changed in the 2000s and will not in the future, considering the pension plan conditions (defined benefits with the early retirement incentives).

The Recent Evolution of Retirement Patterns in Canada
40
8. References Baker, M., Gruber, J., and Milligan, K. 2003. “The Retirement Incentive Effects of Canada's Income Security Programs,” Canadian Journal of Economics, 36: 261–290. Crawford, R. and Tetlow, G. 2010. “Employment, retirement and pensions,” in Financial circumstances, health and well-being of the older population in England: The 2008 English longitudinal study of ageing (wave 4), James Banks, Carli Lessof, James Nazroo, Nina Rogers, Mai Stafford and Andrew Steptoe, editors. London: Institute for Fiscal Studies. Chapter 2: 11-75. Blau, D. and R., Goldstein. 2010. “Can Social Security Explain Trends in the Labour Force Participation of Older Men in the United States?” Journal of Human Resources, 45 (2), Winter: 328-63. Bender, K., Mavromaras, K., Theodossiou, I., and Wei, Z. 2011. “The effect of wealth and earned income on the decision to retire: A dynamic probit estimation of retirement.” ESPE 25th Congress, Hongzhou, China. Brown, W.M., F. Hou, and A. Lafrance. 2010. Incomes of Retirement-age and Working-age Canadians: Accounting for Home Ownership. Economic Analysis Research Paper Series. Statistics Canada Catalogue no. 11F0027M. No. 064. Ottawa. Statistics Canada. Brown, W.M., and A. Lafrance. 2010. Incomes from Owner-occupied Housing for Working-age and Retirement-age Canadians, 1969 to 2006. Economic Analysis Research Paper Series. Statistics Canada Catalogue no. 11F0027M. No. 066. Ottawa. Statistics Canada Chan, S. and Huff, A. 2004. “Do changes in pension incentives affect retirement? A longitudinal study of subjective retirement expectations,” Journal of Public Economics, 88(7-8): 1307-1333. Chen, X., Fougère. M., and Rainville, B. 2011. “Financial factors and older workers’ labour market transitions,” Paper presented to the Annual Canadian Economic Association Meeting, Ottawa. Dorion, J.-F. 2011. « Bref regard sur les nouveaux retraités au Québec et ailleurs : résultats cumulés pour 2008 et 2009. » Direction des statistiques du travail et de la rémunération, Institut de la statistique du Québec. Datta Gupta, N. and Larsen, M. 2007. “Health Shocks and Retirement: The Role of Welfare State Institutions.” Aarhus School of Business, Aarhus University. Danish National Centre for Social Research 10. Gomez, R. and M. Gunderson. 2009. “For whom the retirement bell tolls: inter-temporal comparisons using the 1994 and 2002 Canadian General Social Survey.” Canadian Labour Market and Skills Researcher Network, Working Paper No. 22. Gougeon, P., 2009. “Shifting Pensions,” Perspectives on Labour and Income,” May, Ottawa: Statistics Canada, Catalogue no. 75-001-X, p. 16-23. Gruber, J. and D. Wise, Eds. (1999). Social Security and Retirement around the World. Chicago, University of Chicago Press.
Gustman, A. and Steinmeier, L. (2000), “Retirement in Dual-Career Families: A Structural Model,” Journal of Labour Economics, 18(3): 503-523.

The Recent Evolution of Retirement Patterns in Canada
41
Gustman, A. and Steinmeier, L. 1986. “A Structural Retirement Model,” Econometrica, 54(3): 555-584. Hébert,B-P. and Luong, M. 2008. “Bridge Employment,” Perspectives, Statistics Canada – Catalogue no. 75-001-X, p. 5-12 Hurd, M. 2009. “Subjective Probabilities in Household Surveys,” Annual Review of Economics, 1(1): 543-564. Hurd, M. 1990. “The Joint Retirement Decision of Husbands and Wives.” In Issues in the Economics of Aging, edited by David A. Wise. Chicago: University of Chicago Press, 231-54. Hurd, M. and McGarry K. 2002. “The Predictive Validity of Subjective Probabilities of Survival,” Economic Journal, 112(482): 966-985. Lazear, E. 1986. “Retirement from the Labour Force.” In Handbook of Labour Economics, Vol. 1, eds. Orley Ashenfelter and Richard Layard (London: Elsevier): 305-55. Lumsdaine, R. and O. Mitchell. 1999. “New Developments in the Economic Analysis of Retirement.” In Handbook of Labour Economics, eds. Orley Ashenfelter and David Card, Vol. 3, chapter 49. Maestas, N. 2010. “Back to Work: Expectations and Realizations of Work after Retirement.” Journal of Human Resources, 45(3): 718–748. Maestas, N. and J. Zissimopoulos. 2010. “How Longer Work Lives Ease the Crunch of Population Aging,” Journal of Economic Perspectives, 24(1):139-160. Marmot, M and Stafford, M. 2010. “Introduction” in Financial circumstances, health and well-being of the older population in England: The 2008 English longitudinal study of ageing (wave 4), James Banks, Carli Lessof, James Nazroo, Nina Rogers, Mai Stafford and Andrew Steptoe, editors. London: Institute for Fiscal Studies. Introduction: 1-11. Marschall, K and V. Ferrao. 2007. “Participation of older workers.” Perspectives, Statistics Canada — Catalogue no. 75-001-XIE, p. 5-11. Michaud, P.-C. and F. Vermeulen. 2011. “A collective labour supply model with complementarities in leisure: Identification and estimation by means of panel data,” Labour Economics, 18(1): 159-167. Milligan , K., and Schirle , T. ( 2006 ). Public pensions and retirement: International evidence in the Canadian context. . HRSDC-IC-SSHRC Skills Research Initiative Working Paper 2006-A-13. Ottawa, ON: Industry Canada. Ondrich, J. 2011. “Financial assets, housing assets, and the retirement decision of older workers.” Paper presented to the ESPE 25th Congress, Hongzhou, China. Schellenberg, Grant, et Yuri Ostrovsky (2008). « The retirement plans and expectations of older workers », Canadian Social Trends, no 86, winter, p. 11-34. Schellenberg, Grant and Cynthia Silver. 2004. “You Can’t Always Get What You Want: Retirement Preferences and Experiences.” Canadian Social Trends. Ottawa: Statistics Canada. Schirle, Tammy (2010). “Health, Pensions, and the Retirement Decision: Evidence from Canada.” Canadian Journal on Aging / La Revue canadienne du vieillissement 29 (4): 519– 527.

The Recent Evolution of Retirement Patterns in Canada
42
Schirle, T. 2008. “Why have the labour force participation rates of older men increased since the mid-1990s?” Journal of Labour Economics, 26(4): 549-594. Schirle, T. 2008. “Greener Pastures: Understanding the impact of retirement incentives in defined-benefit pension plans.” C.D. Howe Institute: Commentary No. 262. Stock, James H. and David A. Wise. 1990. “Pensions, the Option Value of Work, and Retirement,” Econometrica, 58(5): 1151-1180. Sueyoshi (1992): “A Class of Binary Response Models for Grouped Duration Data”, Journal of Applied Econometrics, 10(4): 411-431. Venti, F and Wise, D. 2000. “Aging and Housing Equity,” NBER Working Papers 7882, National Bureau of Economic Research, Inc Wannell, T. 2007a. “Young pensioners.” Perspectives on Labour and Income. Vol. 8, no. 2. February. Statistics Canada Catalogue no. 75-001-XIE. p. 5-14. http://www.statcan.ca/english/freepub/75-001-XIE/75-001-XIE2007102.pdf. Wannell, T. 2007b. “Public pensions and work.” Perspectives on Labour and Income. Vol. 8, no. 8. August. Statistics Canada Catalogue no. 75-001-XIE. p. 12-19. http://www.statcan.ca/english/freepub/75-001-XIE/2007108/articles/10304-en.pdf.

SEDAP RESEARCH PAPERS: Recent Releases
Number Title Author(s)
43
(2009)
No. 239: Negative Effects of the Canadian GIS Clawback and PossibleMitigating Alternatives
D. ChisholmR.L. Brown
No. 240: Basic Living Expenses for the Canadian Elderly B.-J. MacDonaldD. AndrewsR.L. Brown
No. 241: Financial security of elders in China Y. ChengM.W. Rosenberg
No. 242: The Impact of Skill Mismatch among Migrants on RemittanceBehaviour
J.T. McDonaldM.R. Valenzuela
No. 243: Car Driving and Public Transit Use in Canadian MetropolitanAreas: Focus on Elderly and Role of Health and SocialNetwork Factors
R.G. MercadoK.B. Newbold
No. 244: Where Would You Turn for Help? Older Adults’ Knowledgeand Awareness of Community Support Services
M. DentonJ. PloegJ. TindaleB. HutchisonK. BrazilN. Akhtar-DaneshM. Quinlan
No. 245: New Evidence on Taxes and Portfolio Choice S. AlanK. AtalayT.F. CrossleyS.H. Jeon
No. 246: How should we support pharmaceutical innovation? P. Grootendorst
No. 247: Cohort Working Life Tables for Older Canadians F.T. DentonC.H. FeaverB.G. Spencer
No. 248: Cancer-related health behaviors and health service use amongInuit and other residents of Canada’s north
J.T. McDonaldR. Trenholm
No. 249: Older Aboriginal Peoples in Canada - Demographics, HealthStatus and Access to Health Care
M.W. RosenbergK. WilsonS. AbonyiA. WiebeK. BeachR. Lovelace

SEDAP RESEARCH PAPERS: Recent Releases
Number Title Author(s)
44
No. 250: Patents, Public-Private Partnerships or Prizes: How should wesupport pharmaceutical innovations?
P. Grootendorst
No. 251: Les besoins non comblés de services à domicile chez les aînéscanadiens
M.A. Busque
No. 252: La «migration de remplacement» au Québec: à quel pointpeut-on compter sur l’immigration pour contrer les problèmesdémographiques appréhendés?
G. Marois
No. 253: Le vieillissement de la population carcérale sousresponsabilité fédérale au Canada: Vers de «pénitenciers-hospices» ?
A.L. Tesseron
No. 254: International Differences in Longevity and Health and theirEconomic Consequences
P.-C. MichaudD. GoldmanD. LakdawallaA. GaileyY. Zheng
No. 255: Understanding the Economic Consequences of Shifting Trendsin Population Health
P.-C. MichaudD. GoldmanD. LakdawallaY. ZhengA. Gailey
No. 256: Population Aging, Older Workers, and Canada’s Labour Force F.T. DentonB.G. Spencer
No. 257: Patterns of Retirement as Reflected in Income Tax Records forOlder Workers
F.T. DentonRoss FinnieB.G. Spencer
No. 258: Reproductive Contributions of Foreign Wives in Taiwan:Similarities and Differences among Major Source Countries
K.-L. LiawJ.-P. LinC.-C. Liu
No. 259: Chronic Health Conditions: Changing Prevalence in an AgingPopulation and Some Implications for the Delivery of HealthCare Services
F.T. DentonB.G. Spencer
No. 260: Portfolio Allocation in the Face of a Means-Tested PublicPension
D.A. Cobb-ClarkV. Hildebrand
No. 261: Income Replacement in Retirement: Longitudinal Evidencefrom Income Tax Records
F.T. DentonR. FinnieB.G. Spencer

SEDAP RESEARCH PAPERS: Recent Releases
Number Title Author(s)
45
No. 262: A New Bismarckian Regime? Path Dependence and PossibleRegime Shifts in Korea’s Evolving Pension System
M. Hering
(2010)
No. 263: Strengthening Fairness and Funding in the Canada PensionPlan: Is Raising the Retirement Age an Option?
M. HeringT.R. Klassen
No. 264: Understanding the Outcomes of Older Job Losers M. BrzozowskiT.F. Crossley
No. 265: Issues in the Issuance of Enhanced Annuities R.L. BrownP. Scahill
No. 266: Criteria for the Optimal Design of a Social SecurityRetirement System
R.L. Brown
No. 267: Retirement 20/20: Innovation in Pension Design R.L. Brown
No. 268: Economic Security in an Aging Canadian Population R.L. Brown
No. 269: Body size and wages in Europe: A semi-parametric analysis V.A. HildebrandP. Van Kerm
No. 270: Employer Pension Plan Inequality in Canada M. DentonJ. Plenderleith
No. 271: Retirement Decisions of People with Disabilities: Voluntary orInvoluntary
M. DentonJ. PlenderleithJ. Chowhan
No. 272: Where Would You Turn for Help? Older Adults’ Awarenessof Community Support Services
M. DentonJ. PloegJ. TindaleB. HutchisonK. BrazilN. Akhtar-DaneshM. QuinlanJ. LillieJ. Millen PlenderleithL. Boos

SEDAP RESEARCH PAPERS: Recent Releases
Number Title Author(s)
46
No. 273: Older Adults’ Awareness of Community Health and SupportServices for Dementia Care
J. PloegM. DentonJ. TindaleB. HutchisonK. BrazilN. Akhtar-DaneshJ. LillieJ. Millen Plenderleith
No. 274: Examining the Gender, Ethnicity, and Age Dimensions of theHealthy Immigrant Effect: Implications for Health Care Policy
K.M. KobayashiS.G. Prus
No. 275: Involuntary Retirement and the Resolution of the Retirement-Consumption Puzzle: Evidence from Australia
G.F. BarrettM. Brzozowski
No. 276: Age of Pension Eligibility, Gains in Life Expectancy, andSocial Policy
F.T. DentonB.G. Spencer
No. 277: The Private Cost of Long-Term Care in Canada: Where YouLive Matters
N. FernandesB.G. Spencer
No. 278: Is There an Age Pattern in the Treatment of AMI? Evidencefrom Ontario
M. GrignonB.G. SpencerL. Wang
No. 279: Aging and Health: An Examination of Differences betweenOlder Aboriginal and non-Aboriginal People
K. WilsonM.W. RosenbergS. AbonyiR. Lovelace
No. 280: Comparing Racial and Immigrant Health Status and HealthCare Access in Later Life in Canada and the United States
S.G. PrusR. TfailyZ. Lin
No. 281: “It Looks at All of You”: Elders’ Understanding andUtilization of Traditional Medicines in a Canadian FirstNation Community
R. MatthewsT.J. IbrahimA. Martin-Matthews
No. 282: The determinants of the migration decisions of immigrant andnon-immigrant physicians in Canada
J.T. McDonaldC. Worswick

SEDAP RESEARCH PAPERS: Recent Releases
Number Title Author(s)
47
(2011)
No. 283: The Age Pattern of Retirement: A Comparison of CohortMeasures
F.T. DentonR. FinnieB.G. Spencer
No. 284: The surprisingly large policy implications of changingretirement durations
P. Hicks
No. 285: Economic Security in an Aging Canadian Population R.L. Brown
No. 286: The Canadian Elder Standard S Pricing the Cost of BasicNeeds for the Canadian Elderly
B.-J. MacDonaldD. AndrewsR.L. Brown
No. 287: The Recent Evolution of Retirement Patterns in Canada P. LefebvreP. MerriganP.-C. Michaud