SML ISUZU LIMITEDsmlisuzu.com/Upload/Presentation/2d5fee6e_SML Isuzu... · As per ICRA, domestic CV...
31
SML ISUZU LIMITED Company Presentation Motilal Oswal Investor Conference 9 th March, 2017 (Mumbai)
Transcript of SML ISUZU LIMITEDsmlisuzu.com/Upload/Presentation/2d5fee6e_SML Isuzu... · As per ICRA, domestic CV...
SML ISUZU LIMITED
Company Presentation
Motilal Oswal Investor Conference
9th March, 2017 (Mumbai)
Safe Harbor
• This presentation and the accompanying slides (the “Presentation”), which have been prepared by the Company have been prepared solely for information purposes and do not constitute any offer, recommendation or invitation to purchase or subscribe for any securities, and shall not form the basis or be relied on in connection with any contract or binding commitment what so ever. No offering of securities of the Company will be made except by means of a statutory offering document containing detailed information about the Company.
• This Presentation has been prepared by the Company based on information and data which the Company considers reliable, but the Company makes no representation or warranty, express or implied, whatsoever, and no reliance shall be placed on, the truth, accuracy, completeness, fairness and reasonableness of the contents of this Presentation. This Presentation may not be all inclusive and may not contain all of the information that you may consider material. Any liability in respect of the contents of, or any omission from, this Presentation is expressly excluded.
• Certain matters discussed in this Presentation may contain statements regarding the Company’s market opportunity and business prospects that are individually and collectively forward-looking statements. Such forward-looking statements are not guarantees of future performance and are subject to known and unknown risks, uncertainties and assumptions that are difficult to predict. These risks and uncertainties include, but are not limited to, the performance of the Indian economy and of the economies of various international markets, the performance of the industry in India and world-wide, competition, the company’s ability to successfully implement its strategy, the Company’s future levels of growth and expansion, technological implementation, changes and advancements, changes in revenue, income or cash flows, the Company’s market preferences and its exposure to market risks, as well as other risks. The Company’s actual results, levels of activity, performance or achievements could differ materially and adversely from results expressed in or implied by this Presentation. The Company assumes no obligation to update any forward-looking information contained in this Presentation. Any forward-looking statements and projections made by third parties included in this Presentation are not adopted by the Company and the Company is not responsible for such third party statements and projections.
1
Board of Directors
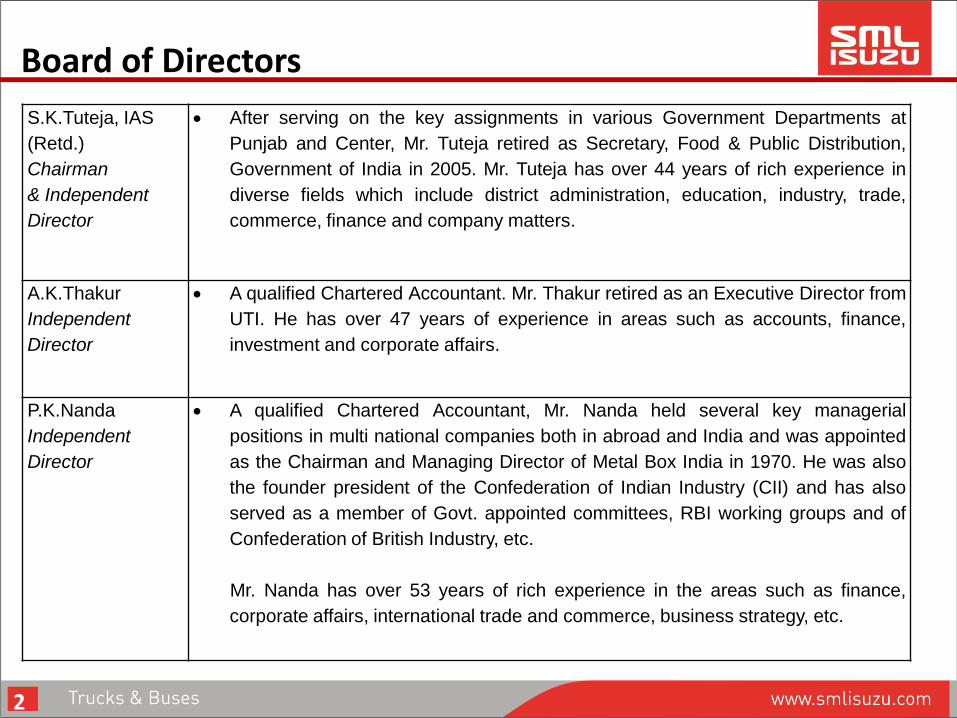
S.K.Tuteja, IAS
(Retd.)
Chairman
& Independent
Director
After serving on the key assignments in various Government Departments at
Punjab and Center, Mr. Tuteja retired as Secretary, Food & Public Distribution,
Government of India in 2005. Mr. Tuteja has over 44 years of rich experience in
diverse fields which include district administration, education, industry, trade,
commerce, finance and company matters.
A.K.Thakur
Independent
Director
A qualified Chartered Accountant. Mr. Thakur retired as an Executive Director from
UTI. He has over 47 years of experience in areas such as accounts, finance,
investment and corporate affairs.
P.K.Nanda
Independent
Director
A qualified Chartered Accountant, Mr. Nanda held several key managerial
positions in multi national companies both in abroad and India and was appointed
as the Chairman and Managing Director of Metal Box India in 1970. He was also
the founder president of the Confederation of Indian Industry (CII) and has also
served as a member of Govt. appointed committees, RBI working groups and of
Confederation of British Industry, etc.
Mr. Nanda has over 53 years of rich experience in the areas such as finance,
corporate affairs, international trade and commerce, business strategy, etc.
2
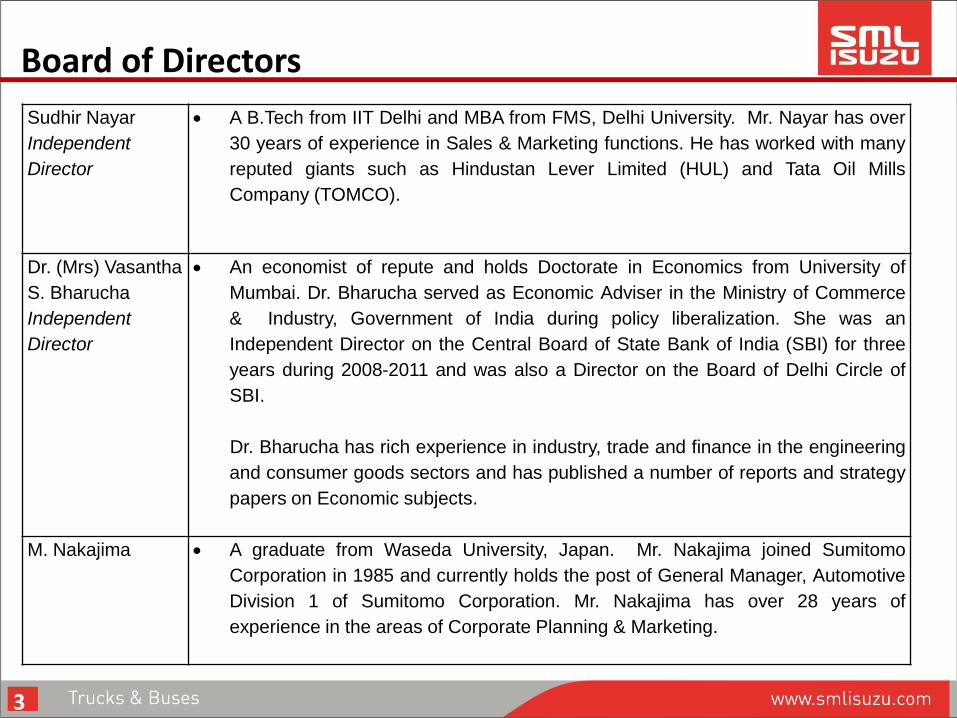
Sudhir Nayar
Independent
Director
A B.Tech from IIT Delhi and MBA from FMS, Delhi University. Mr. Nayar has over
30 years of experience in Sales & Marketing functions. He has worked with many
reputed giants such as Hindustan Lever Limited (HUL) and Tata Oil Mills
Company (TOMCO).
Dr. (Mrs) Vasantha
S. Bharucha
Independent
Director
An economist of repute and holds Doctorate in Economics from University of
Mumbai. Dr. Bharucha served as Economic Adviser in the Ministry of Commerce
& Industry, Government of India during policy liberalization. She was an
Independent Director on the Central Board of State Bank of India (SBI) for three
years during 2008-2011 and was also a Director on the Board of Delhi Circle of
SBI.
Dr. Bharucha has rich experience in industry, trade and finance in the engineering
and consumer goods sectors and has published a number of reports and strategy
papers on Economic subjects.
M. Nakajima A graduate from Waseda University, Japan. Mr. Nakajima joined Sumitomo
Corporation in 1985 and currently holds the post of General Manager, Automotive
Division 1 of Sumitomo Corporation. Mr. Nakajima has over 28 years of
experience in the areas of Corporate Planning & Marketing.
Board of Directors
3
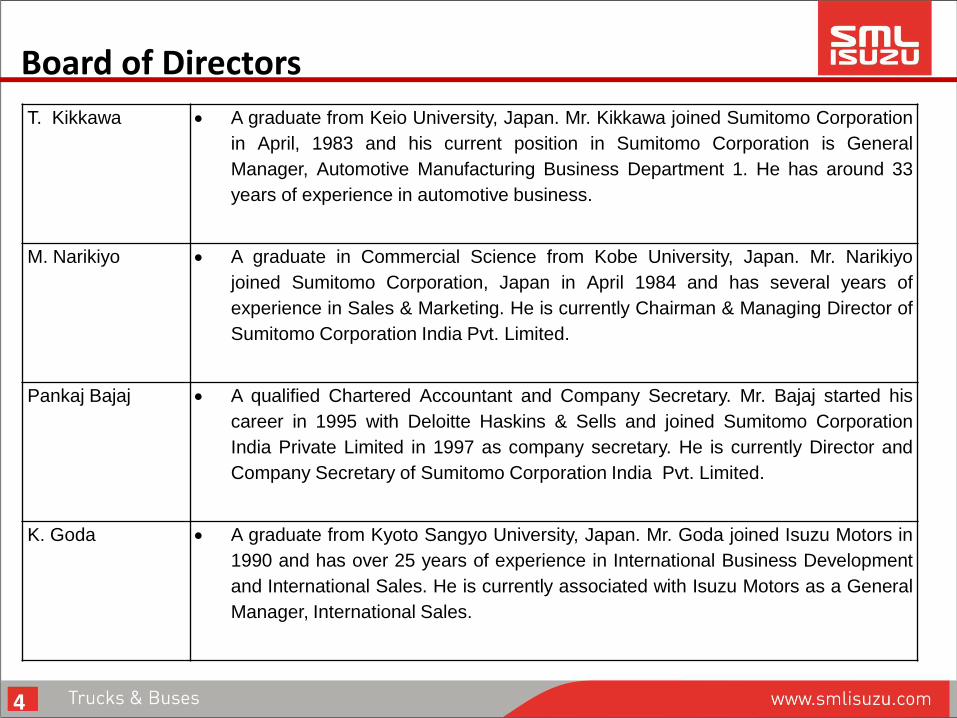
T. Kikkawa A graduate from Keio University, Japan. Mr. Kikkawa joined Sumitomo Corporation
in April, 1983 and his current position in Sumitomo Corporation is General
Manager, Automotive Manufacturing Business Department 1. He has around 33
years of experience in automotive business.
M. Narikiyo A graduate in Commercial Science from Kobe University, Japan. Mr. Narikiyo
joined Sumitomo Corporation, Japan in April 1984 and has several years of
experience in Sales & Marketing. He is currently Chairman & Managing Director of
Sumitomo Corporation India Pvt. Limited.
Pankaj Bajaj A qualified Chartered Accountant and Company Secretary. Mr. Bajaj started his
career in 1995 with Deloitte Haskins & Sells and joined Sumitomo Corporation
India Private Limited in 1997 as company secretary. He is currently Director and
Company Secretary of Sumitomo Corporation India Pvt. Limited.
K. Goda A graduate from Kyoto Sangyo University, Japan. Mr. Goda joined Isuzu Motors in
1990 and has over 25 years of experience in International Business Development
and International Sales. He is currently associated with Isuzu Motors as a General
Manager, International Sales.
Board of Directors
4
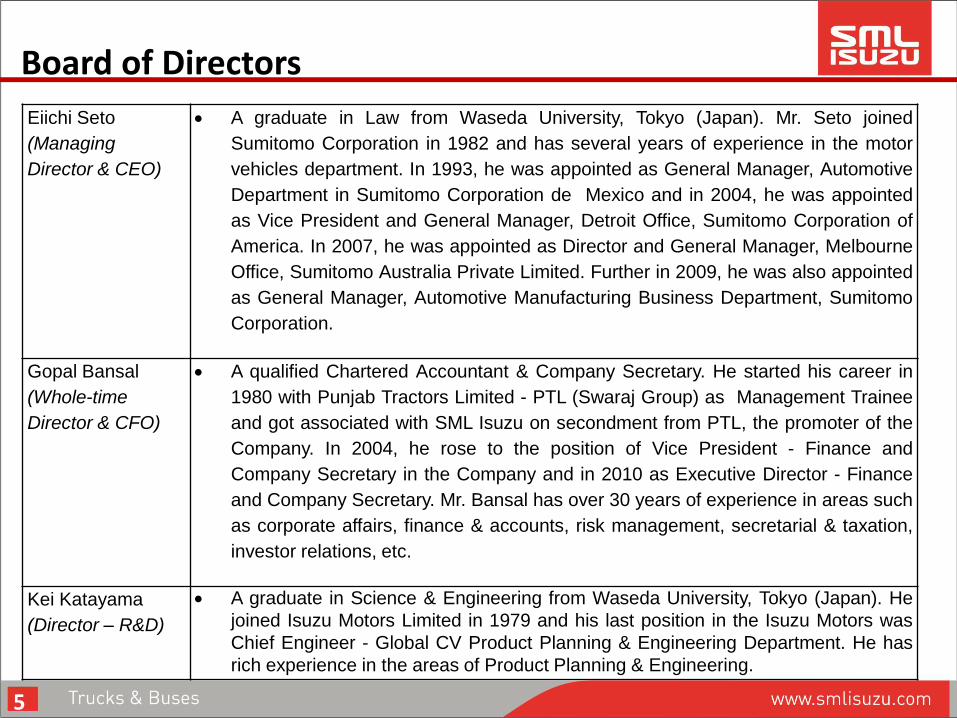
Eiichi Seto
(Managing
Director & CEO)
A graduate in Law from Waseda University, Tokyo (Japan). Mr. Seto joined
Sumitomo Corporation in 1982 and has several years of experience in the motor
vehicles department. In 1993, he was appointed as General Manager, Automotive
Department in Sumitomo Corporation de Mexico and in 2004, he was appointed
as Vice President and General Manager, Detroit Office, Sumitomo Corporation of
America. In 2007, he was appointed as Director and General Manager, Melbourne
Office, Sumitomo Australia Private Limited. Further in 2009, he was also appointed
as General Manager, Automotive Manufacturing Business Department, Sumitomo
Corporation.
Gopal Bansal
(Whole-time
Director & CFO)
A qualified Chartered Accountant & Company Secretary. He started his career in
1980 with Punjab Tractors Limited - PTL (Swaraj Group) as Management Trainee
and got associated with SML Isuzu on secondment from PTL, the promoter of the
Company. In 2004, he rose to the position of Vice President - Finance and
Company Secretary in the Company and in 2010 as Executive Director - Finance
and Company Secretary. Mr. Bansal has over 30 years of experience in areas such
as corporate affairs, finance & accounts, risk management, secretarial & taxation,
investor relations, etc.
Kei Katayama
(Director – R&D)
A graduate in Science & Engineering from Waseda University, Tokyo (Japan). He
joined Isuzu Motors Limited in 1979 and his last position in the Isuzu Motors was
Chief Engineer - Global CV Product Planning & Engineering Department. He has
rich experience in the areas of Product Planning & Engineering.
Board of Directors
5
Repo Rate
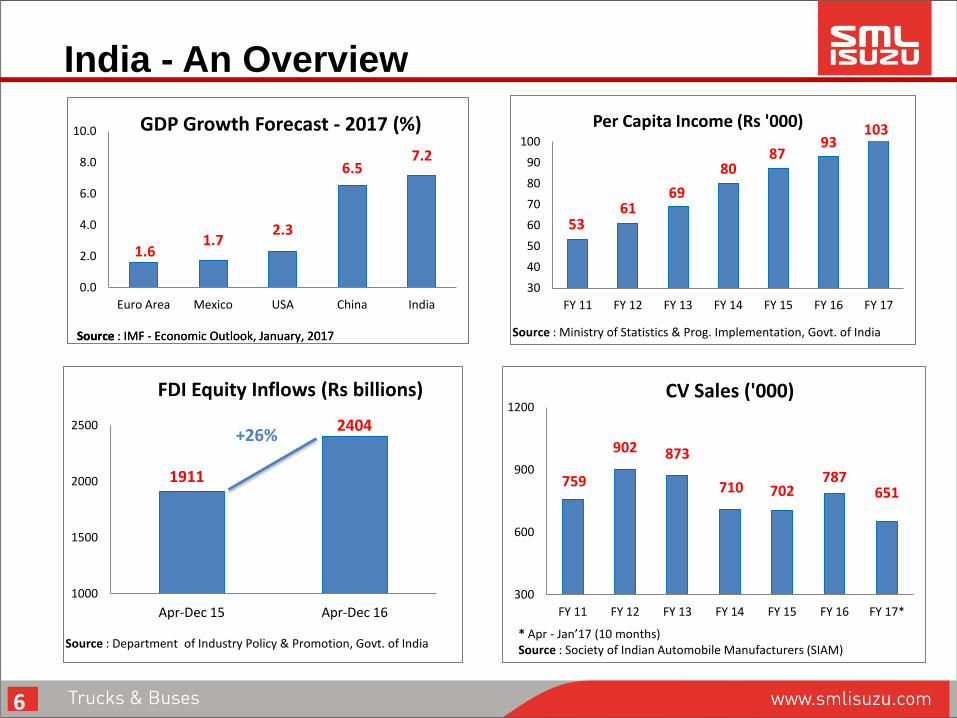
Source : Department of Industry Policy & Promotion, Govt. of India
Source : Ministry of Statistics & Prog. Implementation, Govt. of India
1911
2404
1000
1500
2000
2500
Apr-Dec 15 Apr-Dec 16
FDI Equity Inflows (Rs billions)
+26%
759
902 873
710 702 787
651
300
600
900
1200
FY 11 FY 12 FY 13 FY 14 FY 15 FY 16 FY 17*
CV Sales ('000)
* Apr - Jan’17 (10 months) Source : Society of Indian Automobile Manufacturers (SIAM)
India - An Overview
53 61
69
80 87
93 103
30
40
50
60
70
80
90
100
FY 11 FY 12 FY 13 FY 14 FY 15 FY 16 FY 17
Per Capita Income (Rs '000)
6
1.6 1.7
2.3
6.5 7.2
0.0
2.0
4.0
6.0
8.0
10.0
Euro Area Mexico USA China India
GDP Growth Forecast - 2017 (%)
Source : IMF - Economic Outlook, January, 2017 Source : IMF - Economic Outlook, January, 2017
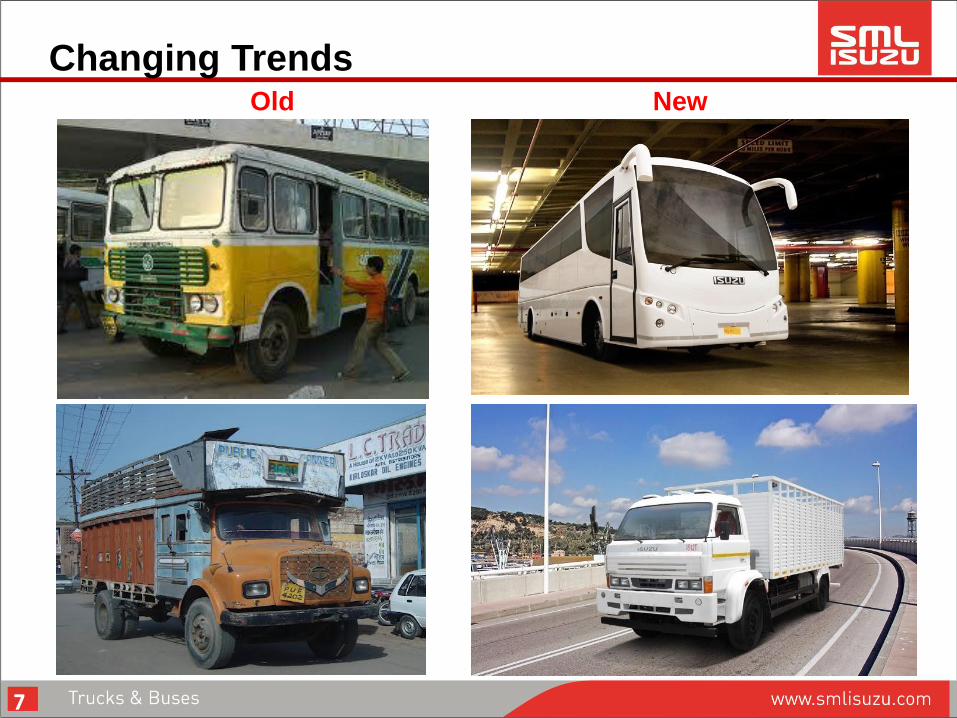
Old New
Changing Trends
7
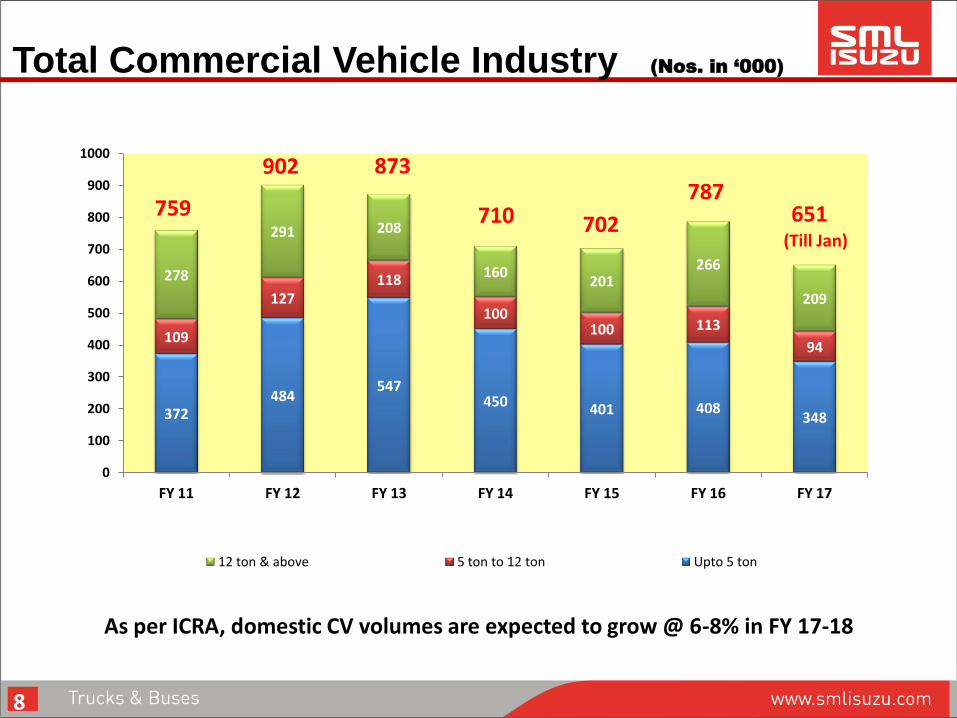
Total Commercial Vehicle Industry (Nos. in ‘000)
As per ICRA, domestic CV volumes are expected to grow @ 6-8% in FY 17-18
8
372 484
547 450 401 408
348
109
127 118
100 100 113
94
278
291 208
160 201
266
209
0
100
200
300
400
500
600
700
800
900
1000
FY 11 FY 12 FY 13 FY 14 FY 15 FY 16 FY 17
12 ton & above 5 ton to 12 ton Upto 5 ton
787
702 710
873 902
759 651 (Till Jan)
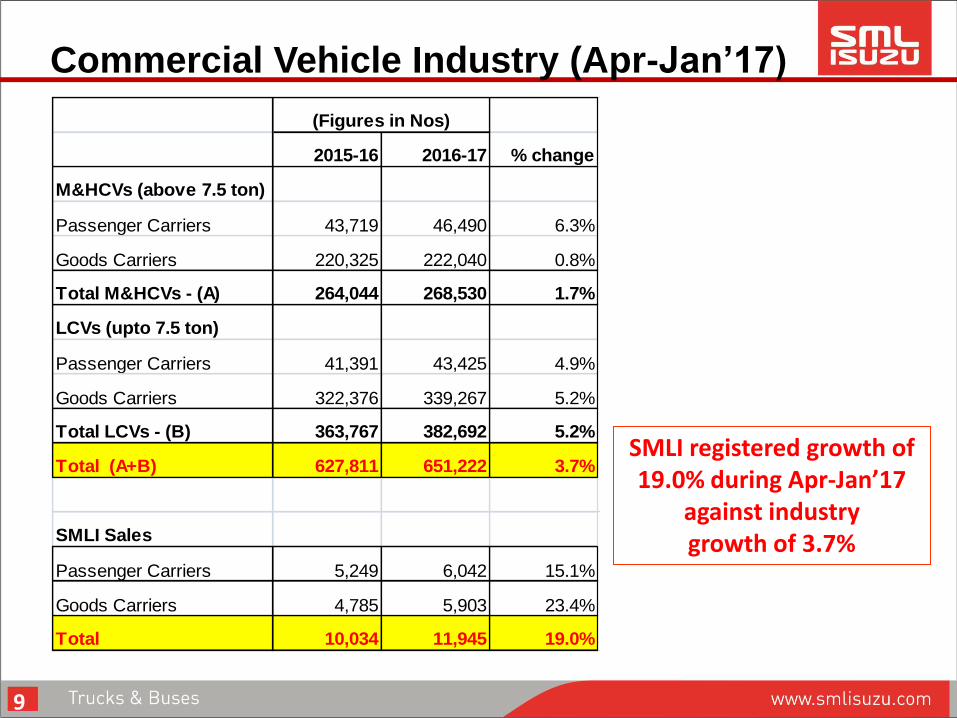
Commercial Vehicle Industry (Apr-Jan’17)
9
SMLI registered growth of 19.0% during Apr-Jan’17
against industry growth of 3.7%
2015-16 2016-17 % change
M&HCVs (above 7.5 ton)
Passenger Carriers 43,719 46,490 6.3%
Goods Carriers 220,325 222,040 0.8%
Total M&HCVs - (A) 264,044 268,530 1.7%
LCVs (upto 7.5 ton)
Passenger Carriers 41,391 43,425 4.9%
Goods Carriers 322,376 339,267 5.2%
Total LCVs - (B) 363,767 382,692 5.2%
Total (A+B) 627,811 651,222 3.7%
SMLI Sales
Passenger Carriers 5,249 6,042 15.1%
Goods Carriers 4,785 5,903 23.4%
Total 10,034 11,945 19.0%
(Figures in Nos)
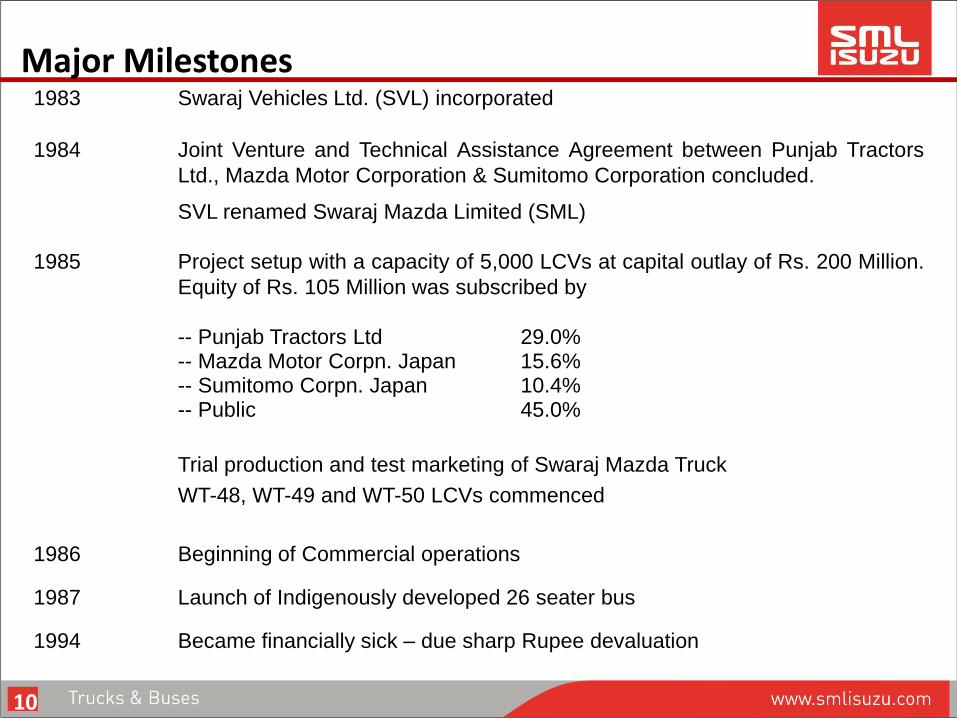
Major Milestones 1983 Swaraj Vehicles Ltd. (SVL) incorporated
1984 Joint Venture and Technical Assistance Agreement between Punjab Tractors
Ltd., Mazda Motor Corporation & Sumitomo Corporation concluded.
SVL renamed Swaraj Mazda Limited (SML)
1985 Project setup with a capacity of 5,000 LCVs at capital outlay of Rs. 200 Million.
Equity of Rs. 105 Million was subscribed by
-- Punjab Tractors Ltd 29.0% -- Mazda Motor Corpn. Japan 15.6% -- Sumitomo Corpn. Japan 10.4% -- Public 45.0%
Trial production and test marketing of Swaraj Mazda Truck
WT-48, WT-49 and WT-50 LCVs commenced
1986 Beginning of Commercial operations
1987 Launch of Indigenously developed 26 seater bus
1994 Became financially sick – due sharp Rupee devaluation
10
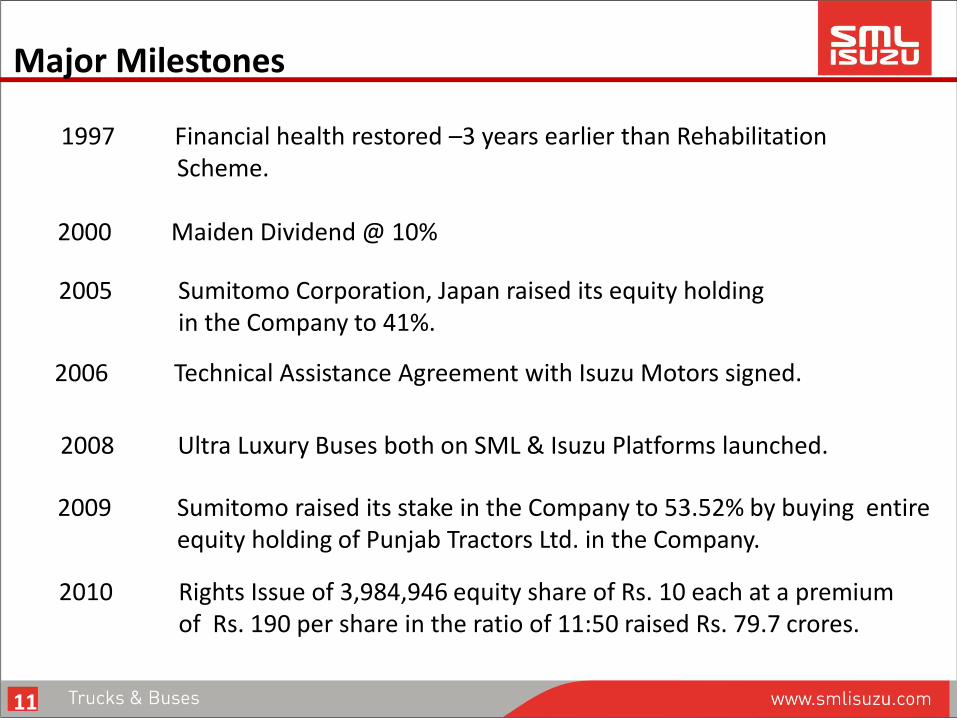
1997 Financial health restored –3 years earlier than Rehabilitation Scheme. 2000 Maiden Dividend @ 10%
2005 Sumitomo Corporation, Japan raised its equity holding in the Company to 41%.
2006 Technical Assistance Agreement with Isuzu Motors signed.
2008 Ultra Luxury Buses both on SML & Isuzu Platforms launched.
2009 Sumitomo raised its stake in the Company to 53.52% by buying entire equity holding of Punjab Tractors Ltd. in the Company.
Major Milestones
11
2010 Rights Issue of 3,984,946 equity share of Rs. 10 each at a premium of Rs. 190 per share in the ratio of 11:50 raised Rs. 79.7 crores.
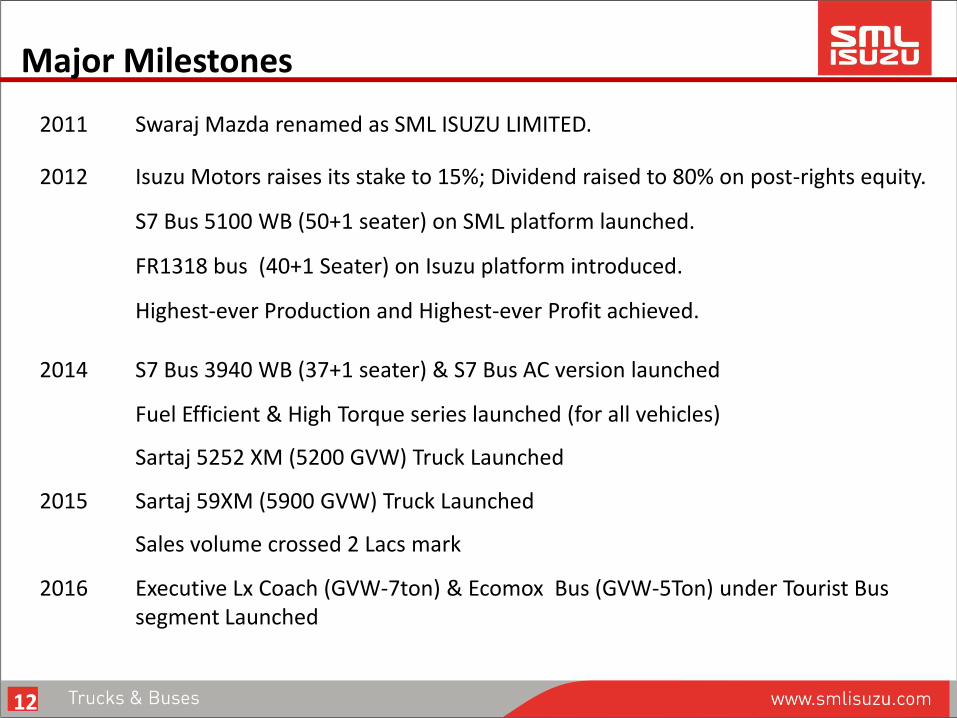
2011 Swaraj Mazda renamed as SML ISUZU LIMITED.
2012 Isuzu Motors raises its stake to 15%; Dividend raised to 80% on post-rights equity.
S7 Bus 5100 WB (50+1 seater) on SML platform launched.
FR1318 bus (40+1 Seater) on Isuzu platform introduced.
Highest-ever Production and Highest-ever Profit achieved.
2014 S7 Bus 3940 WB (37+1 seater) & S7 Bus AC version launched
Fuel Efficient & High Torque series launched (for all vehicles)
Sartaj 5252 XM (5200 GVW) Truck Launched
2015 Sartaj 59XM (5900 GVW) Truck Launched
Sales volume crossed 2 Lacs mark
Major Milestones
12
2016 Executive Lx Coach (GVW-7ton) & Ecomox Bus (GVW-5Ton) under Tourist Bus segment Launched
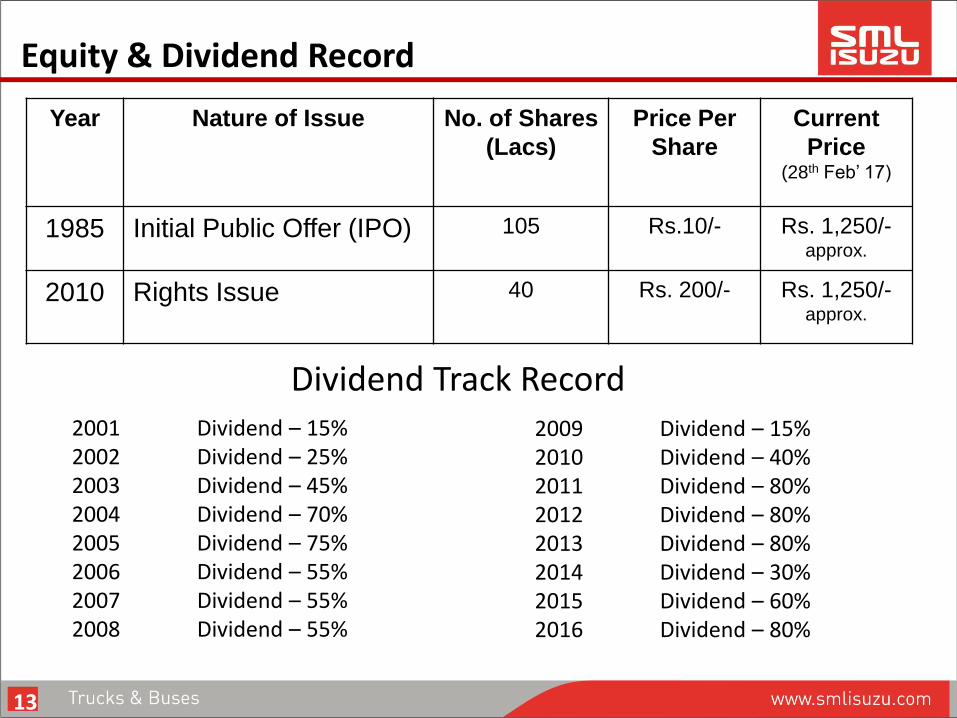
Equity & Dividend Record
Year Nature of Issue No. of Shares
(Lacs)
Price Per
Share
Current
Price (28th Feb’ 17)
1985 Initial Public Offer (IPO) 105 Rs.10/- Rs. 1,250/- approx.
2010 Rights Issue
40 Rs. 200/- Rs. 1,250/- approx.
2001 Dividend – 15% 2002 Dividend – 25% 2003 Dividend – 45% 2004 Dividend – 70% 2005 Dividend – 75% 2006 Dividend – 55% 2007 Dividend – 55% 2008 Dividend – 55%
2009 Dividend – 15% 2010 Dividend – 40% 2011 Dividend – 80% 2012 Dividend – 80% 2013 Dividend – 80% 2014 Dividend – 30% 2015 Dividend – 60% 2016 Dividend – 80%
Dividend Track Record
13
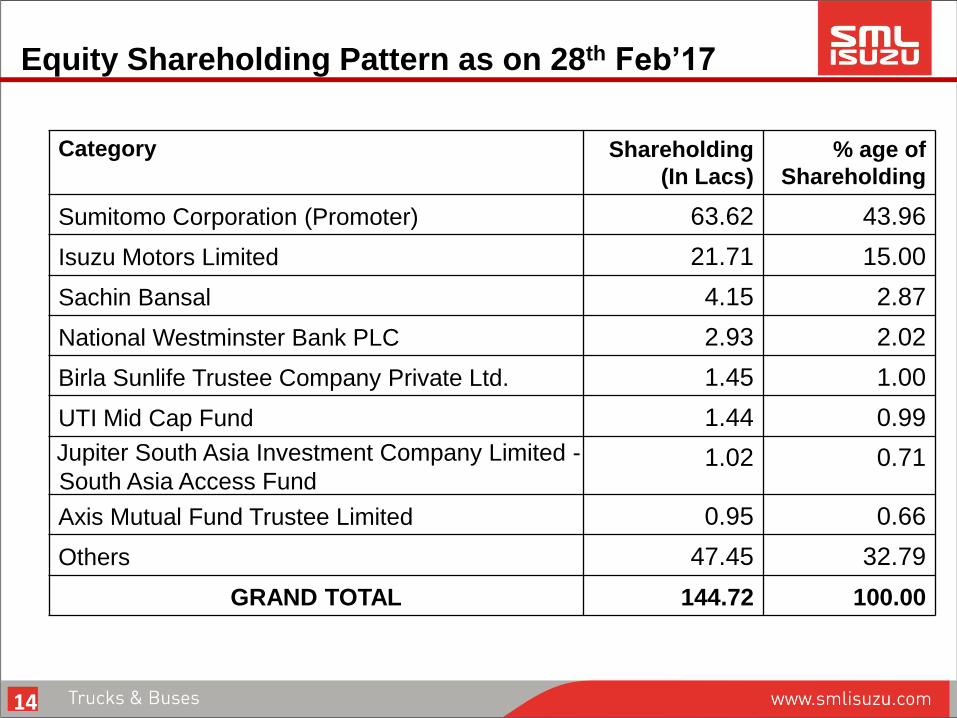
Equity Shareholding Pattern as on 28th Feb’17
14
Category Shareholding
(In Lacs)
% age of
Shareholding
Sumitomo Corporation (Promoter) 63.62 43.96
Isuzu Motors Limited 21.71 15.00
Sachin Bansal 4.15 2.87
National Westminster Bank PLC 2.93 2.02
Birla Sunlife Trustee Company Private Ltd. 1.45 1.00
UTI Mid Cap Fund 1.44 0.99
Jupiter South Asia Investment Company Limited -
South Asia Access Fund 1.02 0.71
Axis Mutual Fund Trustee Limited 0.95 0.66
Others 47.45 32.79
GRAND TOTAL 144.72 100.00
The Company was set up as Swaraj Mazda Limited (now SML ISUZU LTD). At that time, it represented the coming together of three powerful Corporate brands : Swaraj symbolising the best of Indian technology and engineering, Mazda symbolising R&D and innovation edge on a global scale and Sumitomo representing age-old international trading experience and linkages. R&D orientation has been Company’s core strength - building up wide range of trucks, buses & special application vehicles, absorption of technologies, product upgradation to meet regulatory requirements and market needs.
The Journey
Starting from 2-wheel bases, SML ISUZU model range now spans 5-wheel bases. Carrying capacities spread from 2.5 ton to 8.0 ton in the cargo carriers (GVW 5.2 to 12.0 ton) and 13 to 52 seaters in the passenger segment. Portfolio of specialty vehicles - Ambulances, Water Tankers, Tippers, Delivery Van, Dumper Placers, Fire Tenders, 4-Wheel Drive Truck, Troops Carrier etc. Company’s products finds its buyers in countries such as Bangladesh, Nepal, Nigeria, Ghana, Zambia, West Indies, Sri Lanka etc.
Now, alliance with Isuzu ……………..
15
Alliance with Isuzu
• has enabled SML to conceive and set up manufacturing systems and facilities matching global standards within a tight framework of capital outlays.
• has enabled SML to launch medium & large size Isuzu buses.
• has enabled SML to upgrade its existing R&D.
• further boosts SML’s corporate image & brand strengthening and places it on a cutting-edge platform in product range & technology.
• helps SML to upgrade its products faster & at lower costs to meet current / future regulatory requirements of emission and safety.
16
Market Potential
Demand Factor Conditions
• As per IMF Forecast – January 2017, India’s GDP growth in 2017 is estimated
at 7.2% against world average estimate of 3.4%.
• As per GIA study on Commercial Vehicles (CV), Asia-Pacific is expected to
emerge as the fastest growing hub for CV production led by shifting of
automobile production bases to low cost Asian countries.
• As per CRISIL, long term prospects of the Commercial Vehicle industry are
positive. Apart from macro-economic factors, implementation of emission &
anti-overloading norms, scrapping regulations for older vehicles and changing
landscape of the logistics industry towards an organized one would continue to
support demand for CVs.
Long term prospects of commercial vehicle industry are secular. Economic growth in the medium to long term would be driven by infrastructure investments in areas such as – roads, bridges, power generation, information technology, civil aviation, sea-ports, health, education etc. This trend would generate increased demand for commercial vehicles in coming years.
17
• As per ICRA, with new orders from SRTUs (under the JnNURM programme) and Govt.’s recent proposal of opening up the passenger transport sector to private players and other initiatives such as Smart Cities etc., the bus segment is likely to register overall growth of 5-7% in FY 2017-18.
• As per ICRA, M&HCV truck segment is likely to register a growth of 6-8% in FY 2017-18 driven by continuing trend towards replacement of ageing fleet, Govt.’s Scrappage scheme for older vehicles, pre-buying before BS-IV implemented across India, expectations of pick-up in demand from industrial & infrastructure sector and higher budgetary allocation towards infrastructure & rural sectors. Further, LCV truck segment is also expected to grow 7-8% on account of replacement led demand, pre-buying before BS IV implementation across India and pick up in consumption driven sectors.
Improving conditions of road infrastructure – development of state highways & expressways, focus on power generation, housing, health &
education coupled with increasing disposable incomes and changing commuting habits, are expected to maintain the growth momentum in the
Indian CV market.
18
An Overview
• Wide Range of Products -- Both in Cargo (5 – 12 ton) and Passenger Categories (13 - 52 seats)
• Installed Capacity -- 18000 Vehicles
-- 4000 Bus Bodies
• Manpower Strength -- Regular - 1000 approx.
-- Contract - 1000 approx.
19
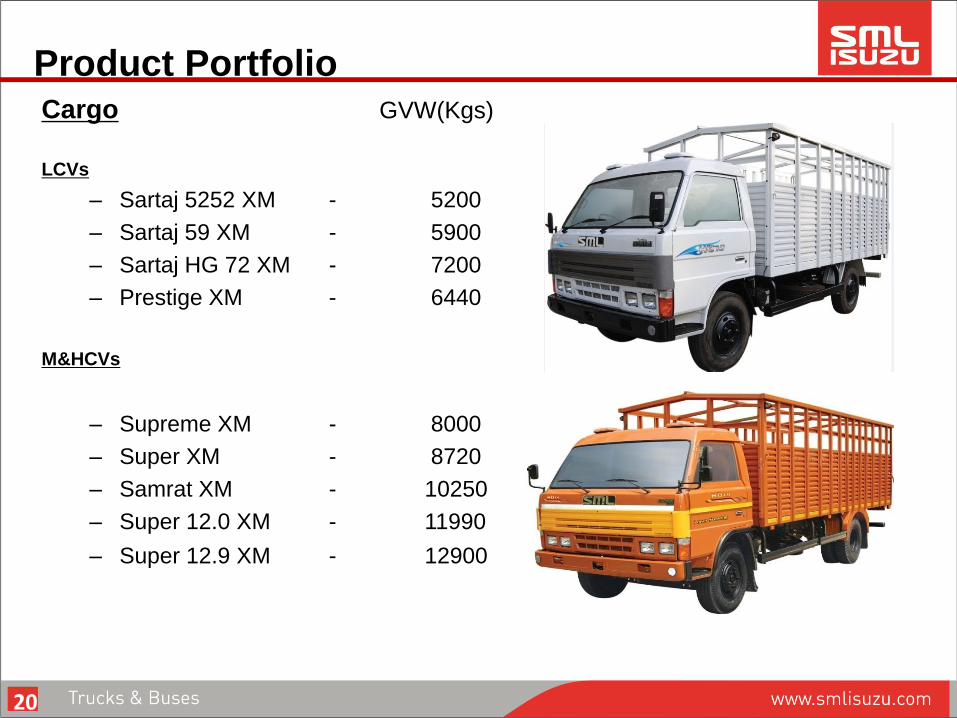
Product Portfolio Cargo GVW(Kgs)
LCVs
– Sartaj 5252 XM - 5200
– Sartaj 59 XM - 5900
– Sartaj HG 72 XM - 7200
– Prestige XM - 6440
M&HCVs
– Supreme XM - 8000
– Super XM - 8720
– Samrat XM - 10250
– Super 12.0 XM - 11990
– Super 12.9 XM - 12900
20
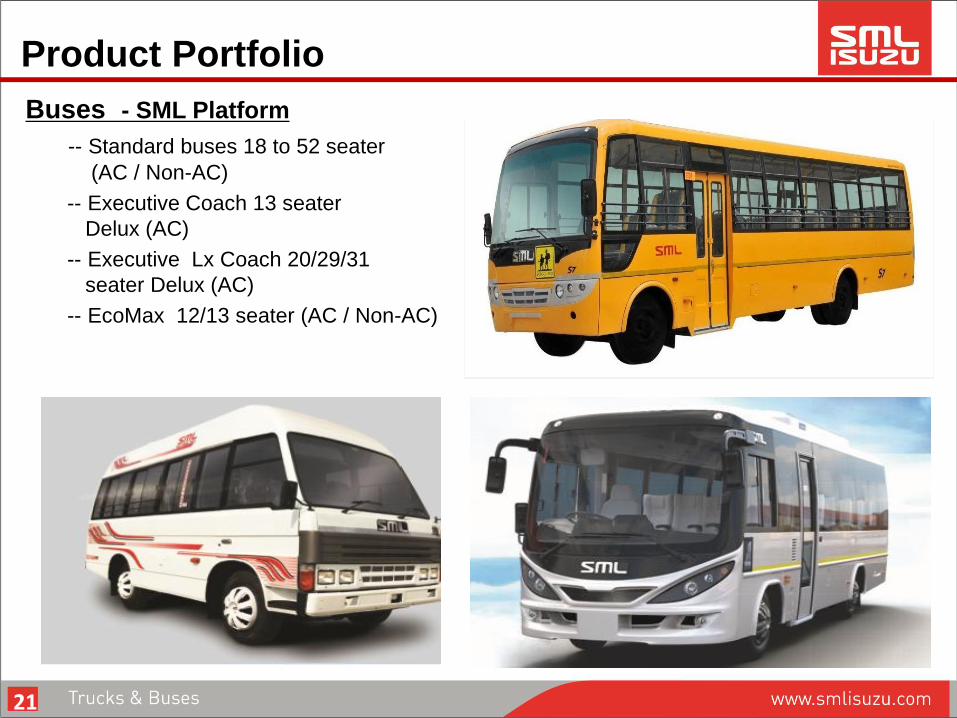
Product Portfolio
Buses - SML Platform
-- Standard buses 18 to 52 seater
(AC / Non-AC)
-- Executive Coach 13 seater
Delux (AC)
-- Executive Lx Coach 20/29/31
seater Delux (AC)
-- EcoMax 12/13 seater (AC / Non-AC)
21
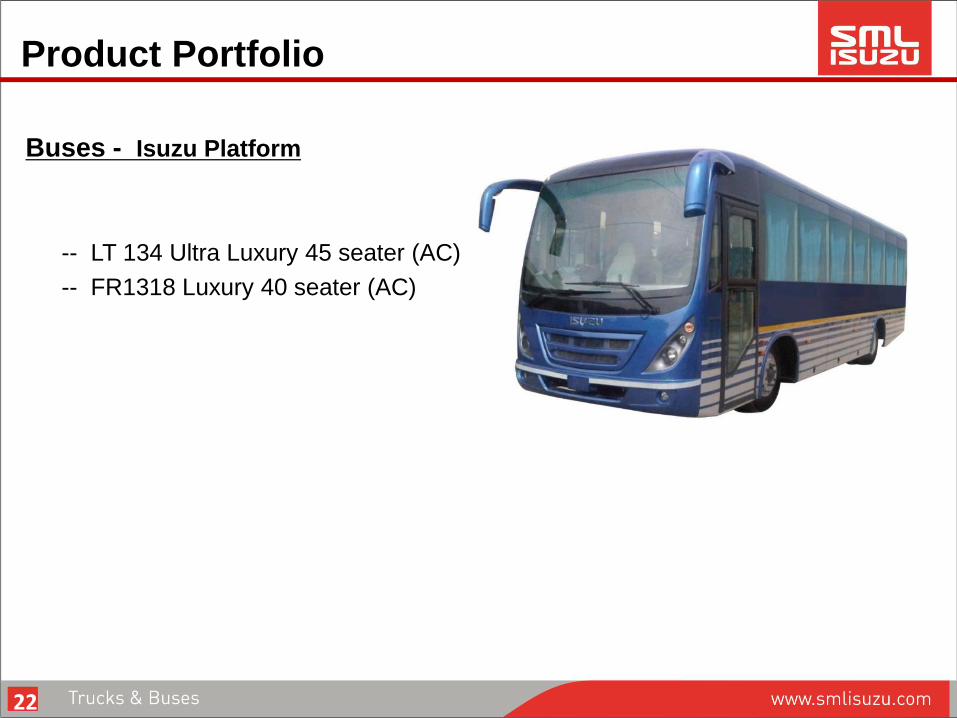
Product Portfolio
Buses - Isuzu Platform
-- LT 134 Ultra Luxury 45 seater (AC)
-- FR1318 Luxury 40 seater (AC)
22
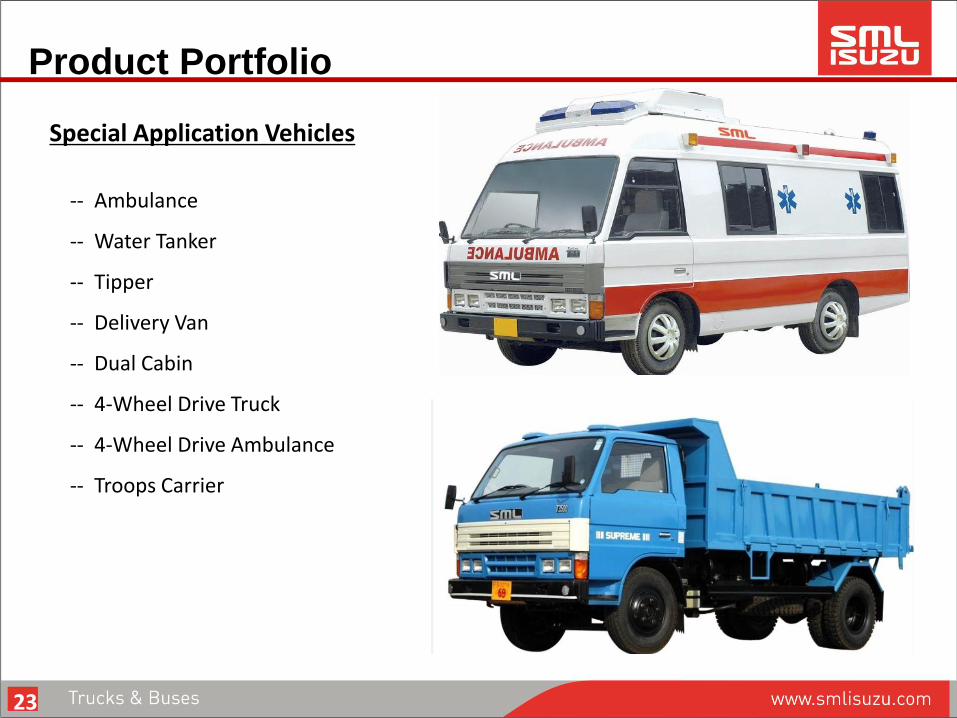
Product Portfolio
Special Application Vehicles
-- Ambulance
-- Water Tanker
-- Tipper
-- Delivery Van
-- Dual Cabin
-- 4-Wheel Drive Truck
-- 4-Wheel Drive Ambulance
-- Troops Carrier
23
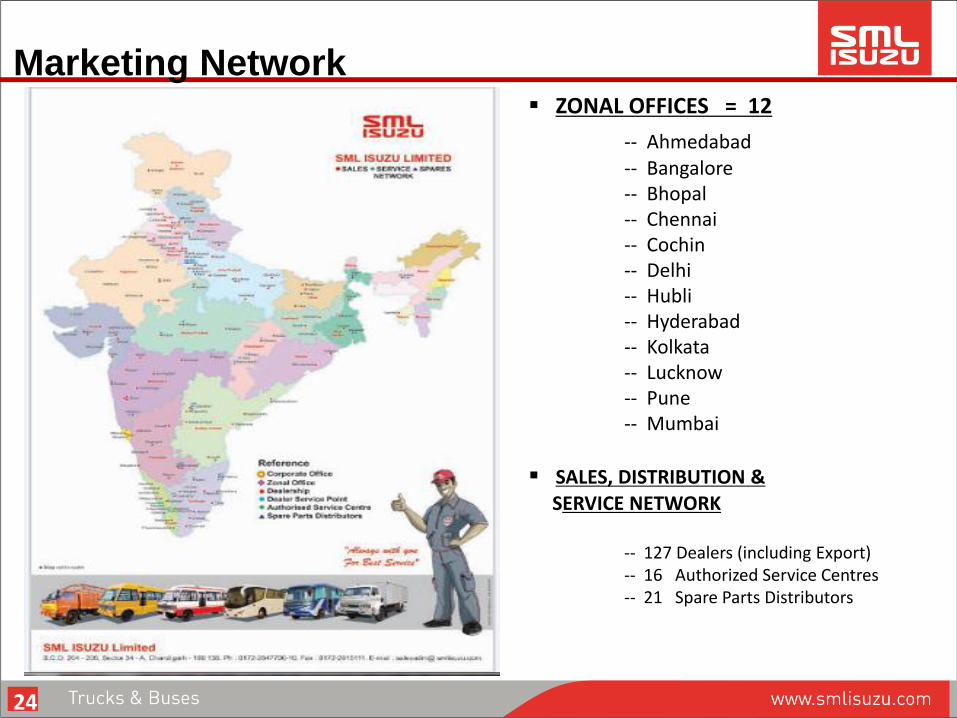
Marketing Network ZONAL OFFICES = 12
-- Ahmedabad -- Bangalore -- Bhopal -- Chennai -- Cochin -- Delhi -- Hubli -- Hyderabad -- Kolkata -- Lucknow -- Pune -- Mumbai
SALES, DISTRIBUTION & SERVICE NETWORK -- 127 Dealers (including Export) -- 16 Authorized Service Centres -- 21 Spare Parts Distributors
24
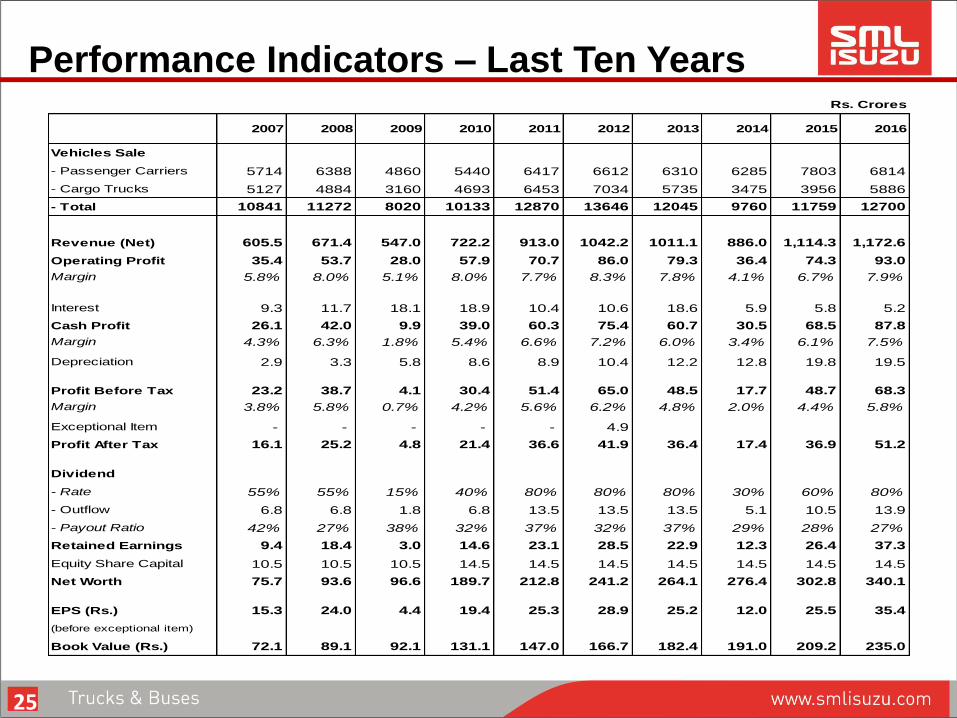
Performance Indicators – Last Ten Years
2007 2008 2009 2010 2011 2012 2013 2014 2015 2016
Vehicles Sale
- Passenger Carriers 5714 6388 4860 5440 6417 6612 6310 6285 7803 6814
- Cargo Trucks 5127 4884 3160 4693 6453 7034 5735 3475 3956 5886
- Total 10841 11272 8020 10133 12870 13646 12045 9760 11759 12700
Revenue (Net) 605.5 671.4 547.0 722.2 913.0 1042.2 1011.1 886.0 1,114.3 1,172.6
Operating Profit 35.4 53.7 28.0 57.9 70.7 86.0 79.3 36.4 74.3 93.0
Margin 5.8% 8.0% 5.1% 8.0% 7.7% 8.3% 7.8% 4.1% 6.7% 7.9%
Interest 9.3 11.7 18.1 18.9 10.4 10.6 18.6 5.9 5.8 5.2
Cash Profit 26.1 42.0 9.9 39.0 60.3 75.4 60.7 30.5 68.5 87.8
Margin 4.3% 6.3% 1.8% 5.4% 6.6% 7.2% 6.0% 3.4% 6.1% 7.5%
Depreciation 2.9 3.3 5.8 8.6 8.9 10.4 12.2 12.8 19.8 19.5
Profit Before Tax 23.2 38.7 4.1 30.4 51.4 65.0 48.5 17.7 48.7 68.3
Margin 3.8% 5.8% 0.7% 4.2% 5.6% 6.2% 4.8% 2.0% 4.4% 5.8%
Exceptional Item - - - - - 4.9
Profit After Tax 16.1 25.2 4.8 21.4 36.6 41.9 36.4 17.4 36.9 51.2
Dividend
- Rate 55% 55% 15% 40% 80% 80% 80% 30% 60% 80%
- Outflow 6.8 6.8 1.8 6.8 13.5 13.5 13.5 5.1 10.5 13.9
- Payout Ratio 42% 27% 38% 32% 37% 32% 37% 29% 28% 27%
Retained Earnings 9.4 18.4 3.0 14.6 23.1 28.5 22.9 12.3 26.4 37.3
Equity Share Capital 10.5 10.5 10.5 14.5 14.5 14.5 14.5 14.5 14.5 14.5
Net Worth 75.7 93.6 96.6 189.7 212.8 241.2 264.1 276.4 302.8 340.1
EPS (Rs.) 15.3 24.0 4.4 19.4 25.3 28.9 25.2 12.0 25.5 35.4
(before exceptional item)
Book Value (Rs.) 72.1 89.1 92.1 131.1 147.0 166.7 182.4 191.0 209.2 235.0
Rs. Crores
25
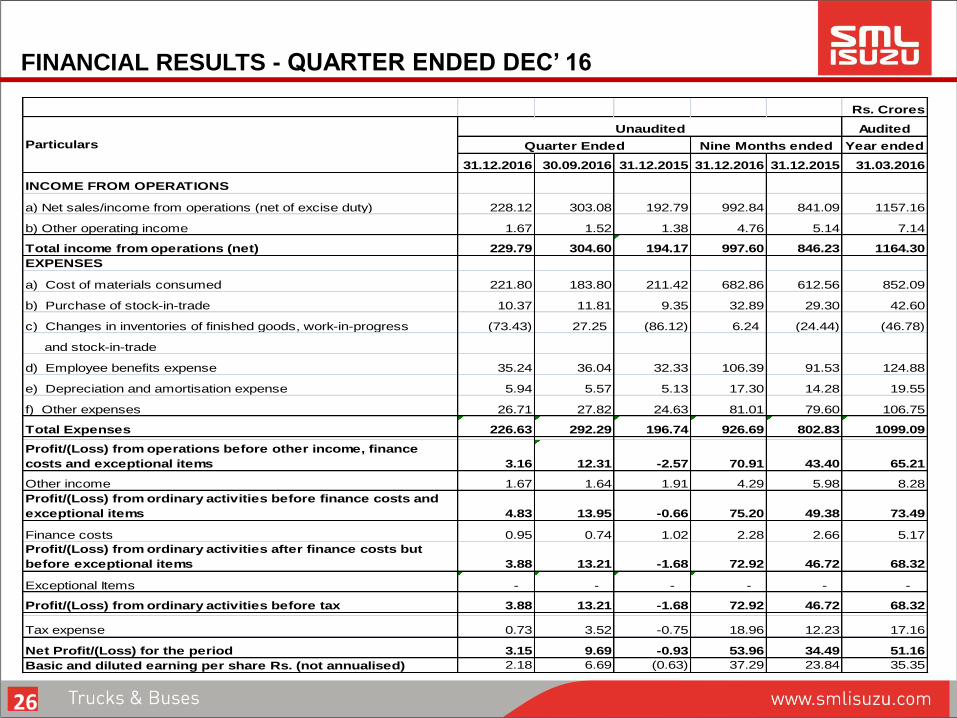
FINANCIAL RESULTS - QUARTER ENDED DEC’ 16
26
Rs. Crores
Audited
Year ended
31.12.2016 30.09.2016 31.12.2015 31.12.2016 31.12.2015 31.03.2016
INCOME FROM OPERATIONS
a) Net sales/income from operations (net of excise duty) 228.12 303.08 192.79 992.84 841.09 1157.16
b) Other operating income 1.67 1.52 1.38 4.76 5.14 7.14
Total income from operations (net) 229.79 304.60 194.17 997.60 846.23 1164.30
EXPENSES
a) Cost of materials consumed 221.80 183.80 211.42 682.86 612.56 852.09
b) Purchase of stock-in-trade 10.37 11.81 9.35 32.89 29.30 42.60
c) Changes in inventories of finished goods, work-in-progress (73.43) 27.25 (86.12) 6.24 (24.44) (46.78)
and stock-in-trade
d) Employee benefits expense 35.24 36.04 32.33 106.39 91.53 124.88
e) Depreciation and amortisation expense 5.94 5.57 5.13 17.30 14.28 19.55
f) Other expenses 26.71 27.82 24.63 81.01 79.60 106.75
Total Expenses 226.63 292.29 196.74 926.69 802.83 1099.09
Profit/(Loss) from operations before other income, finance
costs and exceptional items 3.16 12.31 -2.57 70.91 43.40 65.21
Other income 1.67 1.64 1.91 4.29 5.98 8.28
Profit/(Loss) from ordinary activities before finance costs and
exceptional items 4.83 13.95 -0.66 75.20 49.38 73.49
Finance costs 0.95 0.74 1.02 2.28 2.66 5.17
Profit/(Loss) from ordinary activities after finance costs but
before exceptional items 3.88 13.21 -1.68 72.92 46.72 68.32
Exceptional Items - - - - - -
Profit/(Loss) from ordinary activities before tax 3.88 13.21 -1.68 72.92 46.72 68.32
Tax expense 0.73 3.52 -0.75 18.96 12.23 17.16
Net Profit/(Loss) for the period 3.15 9.69 -0.93 53.96 34.49 51.16
Basic and diluted earning per share Rs. (not annualised) 2.18 6.69 (0.63) 37.29 23.84 35.35
Particulars
Unaudited
Quarter Ended Nine Months ended
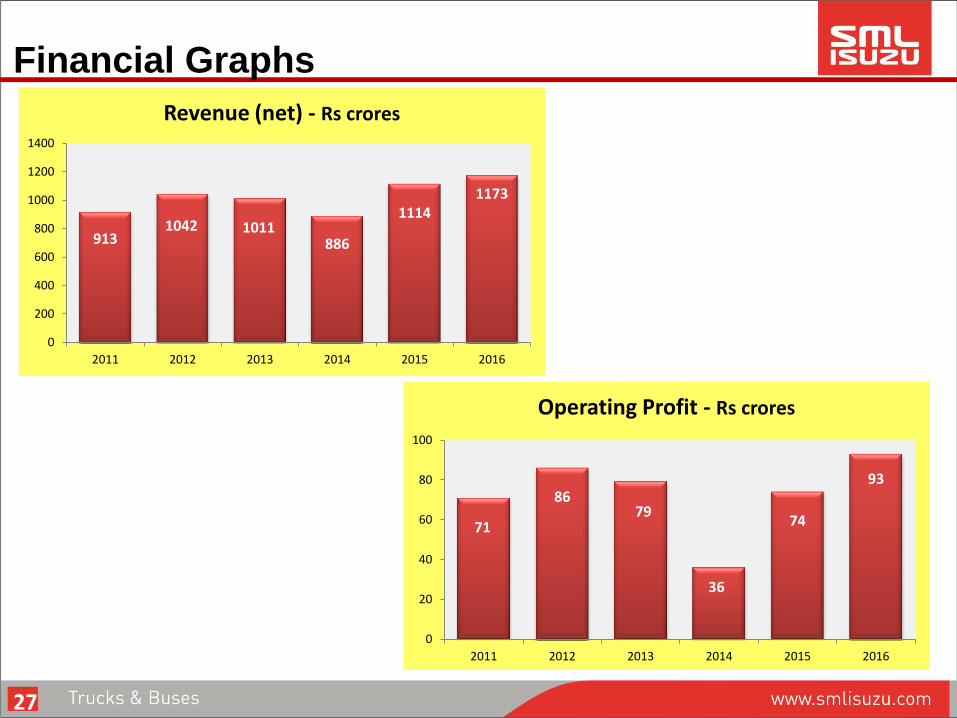
Financial Graphs
913 1042 1011
886
1114 1173
0
200
400
600
800
1000
1200
1400
2011 2012 2013 2014 2015 2016
Revenue (net) - Rs crores
71
86 79
36
74
93
0
20
40
60
80
100
2011 2012 2013 2014 2015 2016
Operating Profit - Rs crores
27
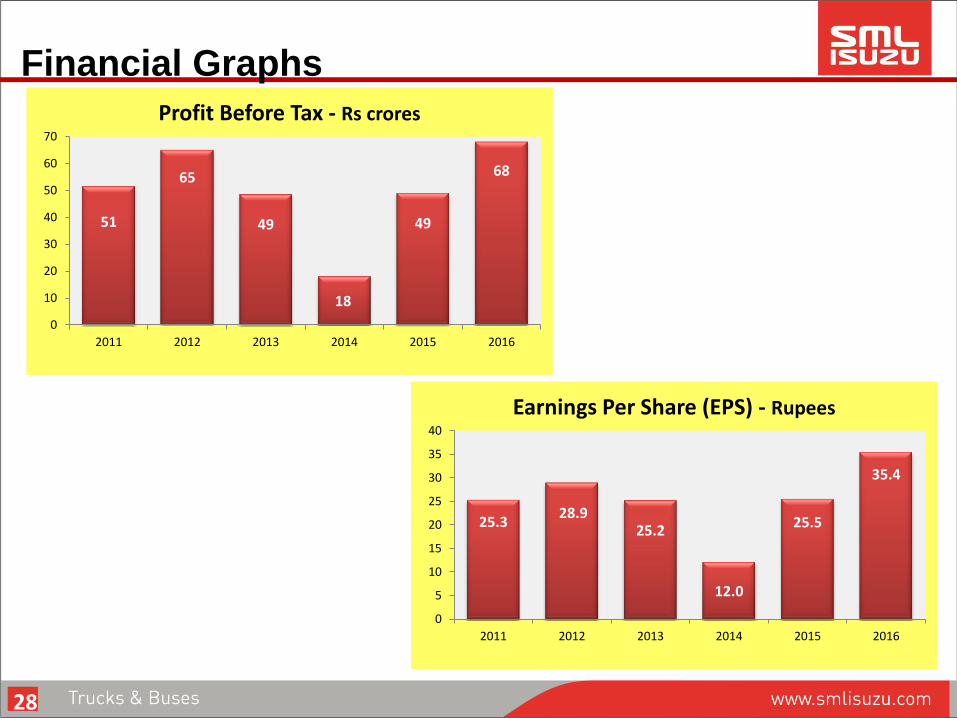
Financial Graphs
51
65
49
18
49
68
0
10
20
30
40
50
60
70
2011 2012 2013 2014 2015 2016
Profit Before Tax - Rs crores
25.3 28.9
25.2
12.0
25.5
35.4
0
5
10
15
20
25
30
35
40
2011 2012 2013 2014 2015 2016
Earnings Per Share (EPS) - Rupees
28
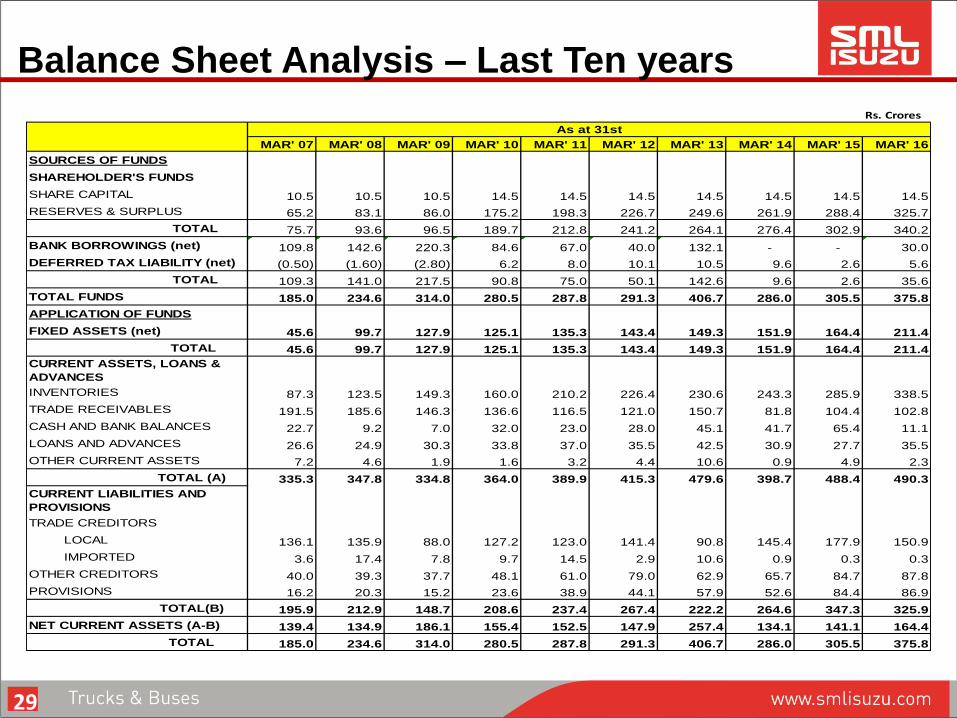
Balance Sheet Analysis – Last Ten years
29
Rs. Crores
MAR' 07 MAR' 08 MAR' 09 MAR' 10 MAR' 11 MAR' 12 MAR' 13 MAR' 14 MAR' 15 MAR' 16
SOURCES OF FUNDS
SHAREHOLDER'S FUNDS
SHARE CAPITAL 10.5 10.5 10.5 14.5 14.5 14.5 14.5 14.5 14.5 14.5
RESERVES & SURPLUS 65.2 83.1 86.0 175.2 198.3 226.7 249.6 261.9 288.4 325.7
TOTAL 75.7 93.6 96.5 189.7 212.8 241.2 264.1 276.4 302.9 340.2
BANK BORROWINGS (net) 109.8 142.6 220.3 84.6 67.0 40.0 132.1 - - 30.0
DEFERRED TAX LIABILITY (net) (0.50) (1.60) (2.80) 6.2 8.0 10.1 10.5 9.6 2.6 5.6
TOTAL 109.3 141.0 217.5 90.8 75.0 50.1 142.6 9.6 2.6 35.6
TOTAL FUNDS 185.0 234.6 314.0 280.5 287.8 291.3 406.7 286.0 305.5 375.8
APPLICATION OF FUNDS
FIXED ASSETS (net) 45.6 99.7 127.9 125.1 135.3 143.4 149.3 151.9 164.4 211.4
TOTAL 45.6 99.7 127.9 125.1 135.3 143.4 149.3 151.9 164.4 211.4
CURRENT ASSETS, LOANS &
ADVANCES
INVENTORIES 87.3 123.5 149.3 160.0 210.2 226.4 230.6 243.3 285.9 338.5
TRADE RECEIVABLES 191.5 185.6 146.3 136.6 116.5 121.0 150.7 81.8 104.4 102.8
CASH AND BANK BALANCES 22.7 9.2 7.0 32.0 23.0 28.0 45.1 41.7 65.4 11.1
LOANS AND ADVANCES 26.6 24.9 30.3 33.8 37.0 35.5 42.5 30.9 27.7 35.5
OTHER CURRENT ASSETS 7.2 4.6 1.9 1.6 3.2 4.4 10.6 0.9 4.9 2.3
TOTAL (A) 335.3 347.8 334.8 364.0 389.9 415.3 479.6 398.7 488.4 490.3
CURRENT LIABILITIES AND
PROVISIONS
TRADE CREDITORS
LOCAL 136.1 135.9 88.0 127.2 123.0 141.4 90.8 145.4 177.9 150.9
IMPORTED 3.6 17.4 7.8 9.7 14.5 2.9 10.6 0.9 0.3 0.3
OTHER CREDITORS 40.0 39.3 37.7 48.1 61.0 79.0 62.9 65.7 84.7 87.8
PROVISIONS 16.2 20.3 15.2 23.6 38.9 44.1 57.9 52.6 84.4 86.9
TOTAL(B) 195.9 212.9 148.7 208.6 237.4 267.4 222.2 264.6 347.3 325.9
NET CURRENT ASSETS (A-B) 139.4 134.9 186.1 155.4 152.5 147.9 257.4 134.1 141.1 164.4
TOTAL 185.0 234.6 314.0 280.5 287.8 291.3 406.7 286.0 305.5 375.8
As at 31st
Thanks