SmartSwitch 9000/9500 (9031443-03) - CA...
160
SmartSwitch 9000/9500 SPECTRUM Enterprise Manager Device Management Supports Multiple Management Modules Titlepae Titlepae Titlepae Titlepae
Transcript of SmartSwitch 9000/9500 (9031443-03) - CA...

SmartSwitch 9000/9500
SPECTRUM Enterprise ManagerDevice Management
Supports Multiple Management Modules
TitlepaeTitlepaeTitlepaeTitlepae

S P E C T R U M E n t e r p r i s e M a n a g e r Page 2 S m a r t S w i t c h 9 0 0 0 / 9 5 0 0
NoticeAprisma Management Technologies, Inc. (Aprisma), reserves the right to makechanges in specifications and other information contained in this document withoutprior notice. The reader should in all cases consult Aprisma to determine whetherany such changes have been made.
The hardware, firmware, or software described in this manual is subject to changewithout notice.
IN NO EVENT SHALL APRISMA, ITS EMPLOYEES, OFFICERS, DIRECTORS,AGENTS, OR AFFILIATES BE LIABLE FOR ANY INCIDENTAL, INDIRECT,SPECIAL, OR CONSEQUENTIAL DAMAGES WHATSOEVER (INCLUDING BUTNOT LIMITED TO LOST PROFITS) ARISING OUT OF OR RELATED TO THISMANUAL OR THE INFORMATION CONTAINED IN IT, EVEN IF APRISMA HASBEEN ADVISED OF, KNOWN, OR SHOULD HAVE KNOWN, THE POSSIBILITYOF SUCH DAMAGES.
Copyright © January 2001 by Aprisma Management Technologies. All rightsreserved.
Printed in the United States of America.
Order Number: 9031443-03
Aprisma Management Technologies, Inc.121 Technology DriveDurham NH 03824
SPECTRUM, the SPECTRUM IMT/VNM logo, DCM, IMT, and VNM are registeredtrademarks, and SpectroGRAPH , SpectroSERVER , Inductive ModelingTechnology , Device Communications Manager , and Virtual Network Machineare trademarks of Aprisma or its affiliates.
Ethernet is a trademark of Xerox Corporation.
Virus DisclaimerAprisma makes no representations or warranties to the effect that the LicensedSoftware is virus-free.
Aprisma has tested its software with current virus checking technologies. However,because no anti-virus system is 100% reliable, we strongly caution you to writeprotect and then verify that the Licensed Software, prior to installing it, is virus-freewith an anti-virus system in which you have confidence.
Restricted Rights Notice(Applicable to licenses to the United States Government only.)
1. Use, duplication, or disclosure by the Government is subject to restrictions asset forth in subparagraph (c) (1) (ii) of the Rights in Technical Data andComputer Software clause at DFARS 252.227-7013.
Aprisma Management Technologies, Inc., 121 Technology Drive NH 03824
2. (a) This computer software is submitted with restricted rights. It may not beused, reproduced, or disclosed by the Government except as provided inparagraph (b) of this Notice or as otherwise expressly stated in the contract.
(b) This computer software may be:
(1) Used or copied for use in or with the computer or computers for whichit was acquired, including use at any Government installation to whichsuch computer or computers may be transferred;
(2) Used or copied for use in a backup computer if any computer for whichit was acquired is inoperative;
(3) Reproduced for archival or backup purposes;
(4) Modified, adapted, or combined with other computer software, providedthat the modified, combined, or adapted portions of the derivativesoftware incorporating restricted computer software are made subjectto the same restricted rights;
(5) Disclosed to and reproduced for use by support service contractors inaccordance with subparagraphs (b) (1) through (4) of this clause,provided the Government makes such disclosure or reproductionsubject to these restricted rights; and
(6) Used or copied for use in or transferred to a replacement computer.
(c) Notwithstanding the foregoing, if this computer software is publishedcopyrighted computer software, it is licensed to the Government, withoutdisclosure prohibitions, with the minimum rights set forth in paragraph (b) ofthis clause.
(d) Any other rights or limitations regarding the use, duplication, or disclosureof this computer software are to be expressly stated in, or incorporated in,the contract.
(e) This Notice shall be marked on any reproduction of this computer software, inwhole or in part.

S P E C T R U M E n t e r p r i s e M a n a g e r Page 3 S m a r t S w i t c h 9 0 0 0 / 9 5 0 0
ContentsINTRODUCTION 7
Purpose...........................................................................7Required Reading ...........................................................7Supported Devices..........................................................8
SMARTSWITCH 9000/9500 SERIES 10
Module Descriptions .....................................................11ATM Access Modules................................................11Ethernet MicroLAN Switch Modules ..........................12Ethernet SmartSwitch INB 2 Modules .......................12Dual INB Modules......................................................13Fast Ethernet INB Modules .......................................14FDDI SmartSwitch Modules ......................................15FDDI Switch Module..................................................15FDDI MicroLAN Modules...........................................15Gigabit Ethernet SmartSwitch Modules.....................16Token Ring MicroLAN Switch Modules .....................16Token Ring SmartSwitch Module ..............................16SmartCell Switches ...................................................17Carrier Module...........................................................17
TASKS 18
VIEWS AND ICONS COMMON TO ALL TECHNOLOGIES20
Application View............................................................21
Application Icon .........................................................22Configuration Views ......................................................23
Device Configuration View ........................................23Interface Configuration Table.............................24
Port Configuration - CSIIf Port View..........................24Chassis Application View..............................................25
Container View..........................................................25Module View..............................................................26
Device Views ................................................................26Interface Device View................................................27
Interface Icons .......................................................28Interface Icon Subviews Menu Selections .............30
Chassis Device View.................................................30Chassis Module Icon .............................................33
Module Identification Labels...............................33Interface Labels..................................................33
Chassis Module Icon Subviews Menu Selections .34FNB Backplane View.................................................34
FNB Configuration View ........................................36Backplane Device View.............................................37
Backplane Module Icon .........................................39Module Identification Labels...............................39SMB 1 and SMB 10 Icons ..................................39FNB 1 and FNB 2 Icons .....................................40INB 1 and INB 2 Icons........................................40
Environmental Device View.......................................41Chassis Environmental Information .......................42
C o n t e n t s C o n t e n t s
S P E C T R U M E n t e r p r i s e M a n a g e r Page 4 S m a r t S w i t c h 9 0 0 0 / 9 5 0 0
UPS Details View...................................................43UPS Configuration Information View .....................44
Identification .......................................................44Status .................................................................44Battery Conditions ..............................................44Battery Test ........................................................45Input/Output Power ............................................45
Environmental Module Information ........................45Physical Device View ................................................47
Device Topology View ..................................................47Model Information View ................................................48Performance View.........................................................49
FDDI 50
Overview .......................................................................50FDDI Interface Label Icon Subviews Menu Options..53
Repeater Labels.....................................................53FDDI Ring Label ....................................................53
FDDI Ring Label Icon Subviews Menu Options ........54FDDI Port Labels ...................................................54
FDDI Port Label Icon Subviews Menu Selections .....55FddiMAC Device Configuration View............................55
Station Configuration..........................................55SMT Information.................................................57
FDDI Port Configuration View.......................................57Port Management ...............................................57
Repeater Configuration View ........................................59Repeater Management.......................................59Source Address Management............................59Trap Configuration..............................................59
Alarm Configuration ........................................... 60Error Source ...................................................... 61
FDDI Station Table View .............................................. 61FDDI Stats View ........................................................... 62
TOKEN RING 63
Overview ...................................................................... 63Token Ring Label...................................................... 66Token Ring Label Icon Subviews Menu Selections .. 66
Ring Speed Label.................................................. 66Token Ring Port Labels......................................... 66Ring In/Ring Out and Ring Status Labels.............. 67
Token Ring Port Icon Subviews Menu Options ........ 67Token Ring Configuration View.................................... 68
Port Configuration.............................................. 68Host Configuration ............................................. 69
TR Ring Configuration View...................................... 69Ring Configuration ............................................. 69Ring Alarm/Threshold/State............................... 70
Token Ring Security Configuration View .................. 71Allowed Station Address Table.......................... 71
Token Ring Station Table View .................................... 72Token Ring Station Isolating Errors View ................. 74
Token Ring Station Non-Isolating Errors View ...... 76Token Ring Station Alarm Thresholds View ...... 78Token Ring Station Detail View ......................... 79Pie Charts .......................................................... 80Station Alarms Dialog Box ................................. 81Modifying Threshold Settings ............................ 83Reading Thresholds from a Station ................... 83

C o n t e n t s C o n t e n t s
S P E C T R U M E n t e r p r i s e M a n a g e r Page 5 S m a r t S w i t c h 9 0 0 0 / 9 5 0 0
Modify Allowed Station List View ...........................84Security Administration State .............................84Changing the Ring Security State ......................86Adding Stations ..................................................86
ATM 87
Overview .......................................................................87ATM Client Application Configuration View...................91
Configuration Table ............................................91ATM Interface Detail View ............................................92SFCS System Configuration View ................................93SFCS System Status View ...........................................95SFCS System Configuration View ................................95Module Configuration Table View .................................96Module Status Table View ............................................97Module UPC Table View ...............................................97Statistics Engine Table View.........................................98ANIM Configuration Table View ....................................98ANIM Status Table View ...............................................99Interface Configuration Table View...............................99Interface Statistics Table View....................................100Connection Configuration Table View.........................100Connection Statistics Table ........................................101Queue Configuration Table View ................................102Queue Statistics Table View .......................................103CTM Interface Configuration Table View ....................103CTM Interface Statistics Table View ...........................104CTM Queue Configuration Table View .......................105CTM Queue Statistics Table View ..............................106BW Manager NIM Information Table View..................106
BW Manager Port Information Table View ................. 107BW Manager Port Pool Limits Table View ................. 107BW Manager Port Pool Statistics Table View ............ 108BW Manager Port Pool Trap Management Table View109
Node Configuration Table View .............................. 110PGL Election Information View............................ 111
Nodal Map Information View................................... 112Nodal Timer Information View ............................. 114SVCC Variable Information View ........................ 115
Interface Views........................................................... 116ATM Interface Configuration View .......................... 117TC Sublayer Table View ......................................... 118DS3 PLCP Table View............................................ 119
Cross Connect Views ................................................. 119VC Cross Connect Table View ............................... 119VP Cross Connect Table View................................ 121
Links Views ................................................................ 122Creating PVCs and PVPs........................................... 123
Virtual Channel Link Table View ............................. 124Virtual Path Link Table View ................................... 125
Traffic Parameter Table View..................................... 126ILMI Network Prefix Table View ................................. 127VCL Statistics Table View .......................................... 128Switched Virtual Channel Cross Connect Table View 128Signalling Monitoring Table View ............................... 130
SSCOP Table .................................................. 130Detected Events Table .................................... 130Transmitted Events Table ................................ 134
ATM Link Modeling Options ....................................... 136

C o n t e n t s C o n t e n t s
S P E C T R U M E n t e r p r i s e M a n a g e r Page 6 S m a r t S w i t c h 9 0 0 0 / 9 5 0 0
ETHERNET 137
Overview .....................................................................137
MODELING CONSIDERATIONS 140
Example of a Modeled Network Topology View..........140Modeling Using the Model Type SmSwChasCont ......141
MANUAL MODELING 143
Summary.....................................................................143Preparation and Topology View Definitions ................143Modeling the Chassis..................................................144
Placing the Chassis Location Icon in the Location View146
Modeling the Modules in the Chassis......................147Quick Steps .............................................................147
Modeling the Flexible Network Bus (FNB) ..................148Modeling the Modules Connected to the INB .............148Modeling the Modules Connected to the FNB ............149Building the FNB Ring in the FDDI LAN Topology View...
150
INDEX 151

S P E C T R U M E n t e r p r i s e M a n a g e r P a g e 7 S m a r t S w i t c h 9 0 0 0 / 9 5 0 0
Introduction
This section defines the purpose and organization of this document, as well as providing a brief description ofeach section that follows.
This introduction contains the following topics:
• Purpose
• Required Reading
• Supported Devices (Page 8)
PurposeThis document includes information specific to the SmartSwitch 9000/9500 Series and how they are modeled in SPECTRUM. The sections within this document provide information on monitoring and configuring the SmartSwitch 9000/9500 Series of devices. It is intended to be used in conjunction with the SPECTRUM Device Management online documentation. It is important that you understand the functions and navigational techniques of SPECTRUM, as listed under Required Reading, before using this document.
Required ReadingTo use this documentation effectively, you must be familiar with the information covered by the other SPECTRUM online documents listed below.
• Getting Started with SPECTRUM for Operators
• Getting Started with SPECTRUM for Administrators
• How to Manage Your Network with SPECTRUM
• SPECTRUM Views
• SPECTRUM Icons
• SPECTRUM Menus
• SPECTRUM Software Release Notice
• SmartSwitch 9000 Chassis User's Guide for SPMA

I n t r o d u c t i o n S u p p o r t e d D e v i c e s
S P E C T R U M E n t e r p r i s e M a n a g e r P a g e 8 S m a r t S w i t c h 9 0 0 0 / 9 5 0 0
The rest of the documentation for this management module is organized according to view type, as follows.
• SmartSwitch 9000/9500 Series (Page 10)
• Tasks (Page 18)
• Views and Icons Common to All Technologies (Page 20)
• FDDI (Page 50)
• Token Ring (Page 63)
• ATM (Page 87)
• Ethernet (Page 137)
• Modeling Considerations (Page 140)
• Manual Modeling (Page 143)
Supported DevicesTable 1 displays the supported devices for the SS9000/9500 chassis.
Table 1: Supported Devices
Part NumberModule
DescriptionSPECTRUMModel Type
SM-CSI1030 Ethernet MicroLAN Switch Modules (Page 12)
9E132_15 9E133_36 9E138_12 9E138_36
SM-CSI1031 FDDI Switch Module (Page 15)
9F116_01
SM-CSI1032 FDDI MicroLAN Modules (Page 15)
9F120_08 9F122_12 9F125_08 9F241_12
SM-CSI1035 FDDI SmartSwitch Modules (Page 15)
9F310_029F426_02 9F426_03
SM-CSI1036 Ethernet SmartSwitch INB 2 Modules (Page 12)
9E312_129E423_249E423_36 9E428_12 9E428_36 9E429_12 9E429_36

I n t r o d u c t i o n S u p p o r t e d D e v i c e s
S P E C T R U M E n t e r p r i s e M a n a g e r P a g e 9 S m a r t S w i t c h 9 0 0 0 / 9 5 0 0
SM-CSI1038 Token Ring MicroLAN Switch Modules (Page 16)
9T122_24 9T122_089T125_24 9T125_08
SM-CSI1055 6-port enet switching module
9E106_06
SM-CSI1059 ATM Access Modules (Page 11)
9A128_01 9A426_01 9A426_02
SM-CSI1066 Fast Ethernet INB Modules (Page 14)
9H421_12 9H422_12 9H423_26 9H423_28 9H429_12
SM-CSI1073 SmartCell Switches (Page 17)
9A656_04 9A686_04
SM-CSI1074 Gigabit Ethernet SmartSwitch Modules (Page 16)
9G421_02 9G426_02 9G429_02
SM-CSI1083 Token Ring SmartSwitch Module (Page 16)
9T425_169T427_16 9T428_16
SM-CSI1092 Carrier Module (Page 17)
9M426_02
Table 1: Supported Devices
Part NumberModule
DescriptionSPECTRUMModel Type
SM-CSI1098 Dual INB Modules (Page 13)
9H5xx9G5xx9E5xx
SM-CSI1100 Generic 9000 Module
Gen9000
Table 1: Supported Devices
Part NumberModule
DescriptionSPECTRUMModel Type

S P E C T R U M E n t e r p r i s e M a n a g e r P a g e 10 S m a r t S w i t c h 9 0 0 0 / 9 5 0 0
SmartSwitch 9000/9500 Series
This section describes the chassis and modules that comprise the SmartSwitch 9000/9500 Series.
The SmartSwitch 9000/9500 Series consists of a 6 and 14 module chassis, an Environmental module, a Flexible Network Bus (FNB), a high speed Internal Network Bus (INB), and over 30 different types of modules. Depending on the modules installed, the SmartSwitch 9000 will support the technologies listed below. The modules associated with these technologies are explained in their respective section.
• Ethernet (Page 12)• Fast Ethernet (Page 14)• Gigabit Ethernet (Page 16)• Token Ring (Page 16)• FDDI (Page 15)• ATM (Page 11)
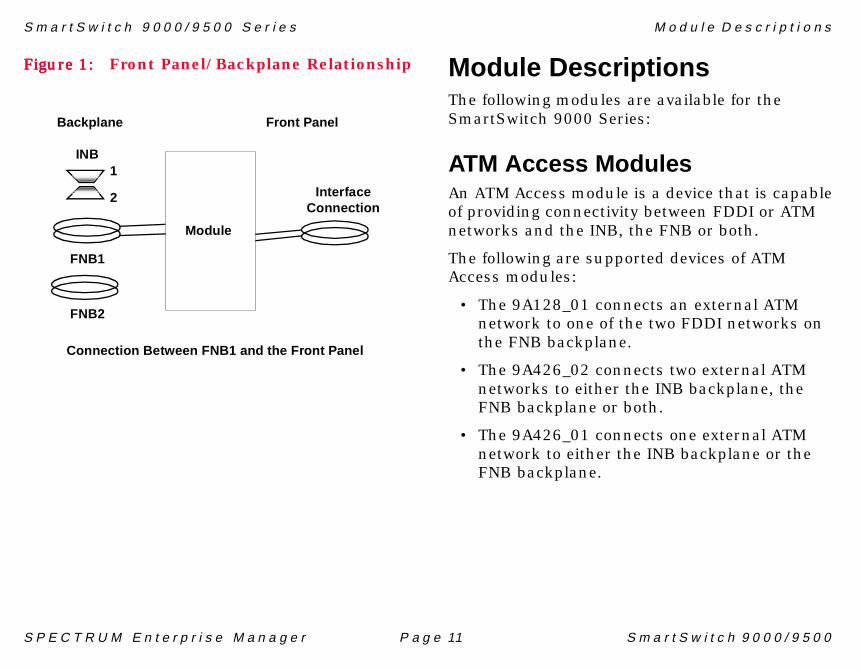
The SmartSwitch 9000/9500 utilizes a packet- and cell- switching backplane to transfer information throughout your network. Figure 1 shows a representation of the relationship between the front panel interfaces and the backplane for each module installed in the SmartSwitch 9000/9500 chassis.
The components that make up the backplane are:
• The FNB consisting of two dual FDDI networks; the FNB1 and the FNB2
• The INB which is divided into two channels; INB1 and INB2
Note:Note:
The SmartSwitch 9500 is the same as the 9000 with the exception that it requires a CTM upgrade kit in order to make use of the 9A656-04 and 9A686-04 modules.
Note:Note:
Throughout this manual the SmartSwitch 9000/9500 Series will be referred to as the SmartSwitch 9000 Series.
S m a r t S w i t c h 9 0 0 0 / 9 5 0 0 S e r i e s M o d u l e D e s c r i p t i o n s
S P E C T R U M E n t e r p r i s e M a n a g e r P a g e 11 S m a r t S w i t c h 9 0 0 0 / 9 5 0 0
Figure 1:Figure 1:Figure 1:Figure 1: Front Panel/Backplane Relationship Module DescriptionsThe following modules are available for the SmartSwitch 9000 Series:
ATM Access ModulesAn ATM Access module is a device that is capable of providing connectivity between FDDI or ATM networks and the INB, the FNB or both.
The following are supported devices of ATM Access modules:
• The 9A128_01 connects an external ATM network to one of the two FDDI networks on the FNB backplane.
• The 9A426_02 connects two external ATM networks to either the INB backplane, the FNB backplane or both.
• The 9A426_01 connects one external ATM network to either the INB backplane or the FNB backplane.
Module
Backplane Front Panel
FNB1
FNB2
Connection Between FNB1 and the Front Panel
INB1
2 InterfaceConnection

S m a r t S w i t c h 9 0 0 0 / 9 5 0 0 S e r i e s M o d u l e D e s c r i p t i o n s
S P E C T R U M E n t e r p r i s e M a n a g e r P a g e 12 S m a r t S w i t c h 9 0 0 0 / 9 5 0 0
Ethernet MicroLAN SwitchModulesThe Ethernet MicroLAN Switch Module is a four channel Ethernet to FDDI bridge. Up to three front panel Ethernet networks can be connected to this module. These networks can be bridged to any other Ethernet or FDDI segment, and to any other MMAC-Plus card via the FNB bus. The Ethernet MicroLAN device is equipped with an advanced Intel i960 microprocessor that provides a platform for all management functions within a scalable RISC-based architecture. Three 50-pin front panel ports provide 12 individual Ethernet connections each. All ports function as repeaters, for incoming data which retime and retransmit all packets. Bridging between the front panel channels and/or to any other module in the chassis is done via FDDI ring 1 or FDDI ring 2 of the FNB bus.
The following devices of Ethernet MicroLAN Modules are supported:
• 9E106_06 MicroLAN
• 9E132_15 MicroLAN Switch Extension
• 9E133_36 MicroLAN
• 9E138_12 MicroLAN (fiber optic)
• 9E138_36 MicroLAN (fiber optic)
Ethernet SmartSwitch INB 2ModulesThe Ethernet SmartSwitch INB 2 Modules are Ethernet switching modules that provide Ethernet networks with connectivity to the SmartSwitch 9000 INB 2.
The following devices of Ethernet SmartSwitch INB Modules are supported:
• The 9E312_12 has 12 10Base-T front panel ports supported by RJ-45 style connectors.
• The 9E423_24 has 24 10Base-T front panel ports supported by RJ-71 style connectors.
• The 9E423_36 has 36 10Base-T front panel ports supported by RJ-71 style connectors.
• The 9E428_12 has 12 10Base-T front panel ports supported by ST connectors.
• The 9E428_36 has 36 10Base-T front panel ports supported by ST connectors.
• The 9E429_12 has 12 10Base-T front panel ports supported by ST connectors.
• The 9E429_36 has 36 10Base-T front panel ports supported by ST connectors.

S m a r t S w i t c h 9 0 0 0 / 9 5 0 0 S e r i e s M o d u l e D e s c r i p t i o n s
S P E C T R U M E n t e r p r i s e M a n a g e r P a g e 13 S m a r t S w i t c h 9 0 0 0 / 9 5 0 0
Dual INB ModulesDual INB Modules make use of both INB 1 and INB 2 backplanes. When a Dual INB board is inserted into the backplane, the chassis makes a determination as to which backplane it will attach to. This is done by checking the loads on both INBs and the INB with the least amount of traffic will be the one the board communicates with. The speed at which the backplane is running will depend upon the speed of the slowest board.
The following devices of Dual INB Modules are supported:
• The 9H531-17 is a high-performance Fast Ethernet module for the SmartSwitch 9000, providing 16 100Base-FX ports via MTRJ interfaces, and one VHSIM interface that can support ATM, Gigabit Ethernet, FDDI and WAN connectivity.
• The 9H531-18 is a high-performance Fast Ethernet module for the SmartSwitch 9000, providing 16 100Base-FX ports via MTRJ interfaces. In addition, the 9H532-18’s GPIM slot can also be populated with a variety of media types, including switched 1000Base-SX/LX Gigabit Ethernet.
• 9H531-24 is a high-performance Fast Ethernet module for the SmartSwitch 9000,providing 24 100Base-Fx ports via MTRJ interfaces.
• The 9H532-17 is a high-performance Fast Ethernet module for the SmartSwitch 9000, providing 16 auto-negotiating 10/100Base-TX ports via RJ45 interfaces. In addition, a VHSIM interface can support ATM, Gigabit Ethernet, FDDI and WAN connectivity.
• The 9H532-18 is a high-performance Fast Ethernet module for the SmartSwitch 9000, providing 16 auto-negotiating 10/100Base-TX ports via RJ45 interfaces. In addition, the 9H532-18’s GPIM slot can also be populated with a variety of media types, including switched 1000Base-SX/LX Gigabit Ethernet.
• The 9H532-24 is a high-performance Fast Ethernet module for the SmartSwitch 9000, providing 24 100Base-FX ports via MMF Mini MTRJ connectors.
• The 9H533-24 is a high-performance Fast Ethernet module for the SmartSwitch 9000, providing 24 10/100Base-TX ports via RJ45 interfaces.

S m a r t S w i t c h 9 0 0 0 / 9 5 0 0 S e r i e s M o d u l e D e s c r i p t i o n s
S P E C T R U M E n t e r p r i s e M a n a g e r P a g e 14 S m a r t S w i t c h 9 0 0 0 / 9 5 0 0
• The 9H539-24 is a high-performance Fast Ethernet module for the SmartSwitch 9000 providing 24 100Base-FX ports via SMF Mini MTRJ connectors.
• The 9G536-04 is a Gigabit Ethernet module next generation SmartSwitch with four switched gigabit ethernet ports via GPIMs.
• The 9E423-24 is an Ethernet module providing 24 front panel interfaces that support two RJ-21 (Telco) connectors.
Fast Ethernet INB ModulesFast Ethernet INB Modules are Fast Ethernet switching modules providing Ethernet networks with connectivity to the SmartSwitch 9000’s INB2.
These modules occupy a single slot in the chassis.
You may model the Fast Ethernet INB Module at the Topology level, or as part of a LAN. One device may be attached to each of the Fast Ethernet INB Module’s interfaces.
The following devices of Fast Ethernet INB Modules are supported:
• The 9H421-12 module has 12 fixed MMF (Multimode Fiber) SC front panel connections with connection to the INB2 backplane.
• The 9H422-12 module provides 11 fixed RJ-45 connections for category 5 twisted pair, and one media-flexible interface to accept either an additional RJ-45 or a MMF or single-mode fiber SC interface via the Fast Ethernet Port Interface Module.
• The 9H423-26 is a Fast Ethernet module with INB-2 connectivity. It Consists of 24 ports via 2 RJ21 Connectors, and 2 ports via 2 MMF SC Connectors.
• The 9H423-28 is a single module offering connectivity for 24 switched Ethernet segments and up to four switched Fast Ethernet connections. It supports media flexibility for both Fiber Optic Fast Ethernet backbone and Twisted Pair server/workstation connections.
• The 9H429-12 features 12 fixed single mode front panel interfaces and provides connectivity to the INB 2 backplane.

S m a r t S w i t c h 9 0 0 0 / 9 5 0 0 S e r i e s M o d u l e D e s c r i p t i o n s
S P E C T R U M E n t e r p r i s e M a n a g e r P a g e 15 S m a r t S w i t c h 9 0 0 0 / 9 5 0 0
FDDI SmartSwitch ModulesThe FDDI SmartSwitch Module (9F310-02, 9F426-02 and 9F426-03) connects two external FDDI networks to a high speed switching backplane, the INB. The external FDDI networks connect to the FDDI SmartSwitch Module using standard FDDI Dual Attached Station (DAS) A/B ports.
The FDDI SmartSwitch Modules operate in two modes: as Bridging or as a SecureFast Switch (SFS). The FDDI SmartSwitch Modules are able to accept variable-size LAN packets, translate them into a generic form for transmission to other front panel ports, and segment them into fixed length data blocks for time division multiplexed transmission over the INB backplane to other Fast Packet Switched based modules.
FDDI Switch ModuleThe FDDI Switch Module (9F116-01) is a two-port FDDI bridge used to connect an external FDDI network with one of the two FDDI networks, FNB 1 or FNB 2; or to connect between FNB 1 and FNB 2 on the FNB backplane. The external FDDI network connects to the FDDI Switch Module using a Dual Attached Station (DAS) interface via standard FDDI Medium Interface Connectors (MIC) on the front panel.
FDDI MicroLAN ModulesThe FDDI MicroLAN Modules are a family of concentrators providing eight or twelve master ports for connections to a Single or Dual Attached Station. Modules attach directly to the SmartSwitch 9000 FNB.
The following devices of FDDI MicroLAN Modules are supported:
• The 9F120-08 is an eight-port FDDI dual channel concentrator via MMF MIC with dual FNB attachments.
• The 9F122-12 is a twelve-port FDDI dual channel concentrator via UTP RJ-45 with dual FNB attachments.
• The 9F125-08 is an eight-port FDDI dual channel concentrator via SMF MIC with dual FNB attachments.
• The 9F241-12 is a twelve-port FDDI dual channel concentrator via MMF SC with FDDI bandwidth statistics and dual FNB attachments with dual MAC.

S m a r t S w i t c h 9 0 0 0 / 9 5 0 0 S e r i e s M o d u l e D e s c r i p t i o n s
S P E C T R U M E n t e r p r i s e M a n a g e r P a g e 16 S m a r t S w i t c h 9 0 0 0 / 9 5 0 0
Gigabit Ethernet SmartSwitchModulesThe Gigabit Ethernet SmartSwitch Modules (9G426-02, 9G421-02, and 9G429-02) are single slot devices that connect to the INB backplane to integrate connectivity to ATM, FDDI, and Fast Ethernet. They feature traditional switching services as well as Cabletron’s SecureFast Virtual Networking, embedded Virtual Routing, optional RMON support, and Broadcast Storm Protection on every port. The devices provide two front panel slots that can accommodate SC connectors offering MMF and SMF connection options. The 9G421-02 and 9G429-02 devices support the IEEE draft 802.3 specification for Gigabit Ethernet.
Token Ring MicroLAN SwitchModulesThe TR MicroLAN Switch Modules ( 9T122-08 and 9T122-24) provide connectivity to two TR networks through the FDDI backplane in the chassis. The TR MicroLAN Switch Module’s single 24-port Token Ring, or two 12-port Token Rings use standard RJ-45 connectors supporting either Unshielded Twisted Pair (UTP) or Shielded Twisted Pair (STP) lobe wiring. The rings
interconnect across the chassis’s FNB, a dual 100 Mbps FDDI backplane, and can be configured for FNB-1 or FNB-2.
The 9T125-08 and 9T125-24 provide connectivity for two individual Token Ring networks. The rings interconnect across the FNB, and can be configured for FNB-1 or FNB-2.
Token Ring SmartSwitch ModuleDesigned specifically for collapsed Token Ring backbones, the 9T425-16 and 9T428-16 Token Ring SmartSwitches occupy two slots, and the 9T427-16 occupies one slot in the chassis. The 9T428-16 has 16 switched multimode fiber ports supported by ST connectors. The 9T425-16 and 9T427-16 are equipped with 16 copper RJ-45 Dedicated Token Ring (DTR) lobe/station ports, also known as concentrator or C-ports.
These modules are considered a “hard card,” with all switching functions performed by the Fast Packet Switch (FPS Application Specific Integrated Circuits ASICs). The TR SmartSwitch Modules attach to the INB 2 backplane and have System Management Bus -1 (SMB-1) and SMB-10 connections for system management.

S m a r t S w i t c h 9 0 0 0 / 9 5 0 0 S e r i e s M o d u l e D e s c r i p t i o n s
S P E C T R U M E n t e r p r i s e M a n a g e r P a g e 17 S m a r t S w i t c h 9 0 0 0 / 9 5 0 0
SmartCell SwitchesTheSmartCell switch module (9A656-04 and 9A686-04) is a single-slot, hot-swappable module for the SmartSwitch 9000. Each module provides 4.5 Gbps of ATM Switching fabric with 64K cell output buffers that provide priority queuing and the ability to communicate with other SmartCell switches via a unique Cell Transfer Matrix (CTM) backplane.
Each switch module holds up to four ATM Network Interface Modules (ANIMs). There are several different ANIMs available for these modules that provide interfaces ranging from 45 Mbps up to 622 Mbps. ANIM options include DS-3/E-3 over coaxial cable, OC-3 over unshielded twisted pair, multi and single mode fiber, OC-12 over multi and single mode fiber, and OC-48 over single mode fiber. This interface flexibility permits scaling to even higher speeds in the future. All physical interfaces--DS3, OC-3, and OC-12 and higher--support UNI and PNNI as well as all relevant ATM standards.
Carrier ModuleThe 9M426-02 Carrier Module for the SmartSwitch 9000 combines voice, video, and data. Technologies such as Frame Relay and Gigabit Ethernet are integrated into the same switching chassis. The 9M426-02 provides securefast support for layer 3 switching as well as port trunking for established load sharing.
Occupying two slots in the SmartSwitch 9000 chassis and equipped with two HSIM interfaces, each capable of supporting a wide variety of flexible LAN, WAN, or ATM options, the 9M426-02 is specifically designed for high-speed, translational switching in the data center.
Note:Note:
A CTM upgrade kit is required for use with the 9A656-04 and 9A686-04 modules.
Note:Note:
Since the Carrier Module (9M426-02) does not represent a specific-technology, it is not discussed in any of the technology sections nor is it represented in any of the model type tables.
S P E C T R U M E n t e r p r i s e M a n a g e r P a g e 18 S m a r t S w i t c h 9 0 0 0 / 9 5 0 0
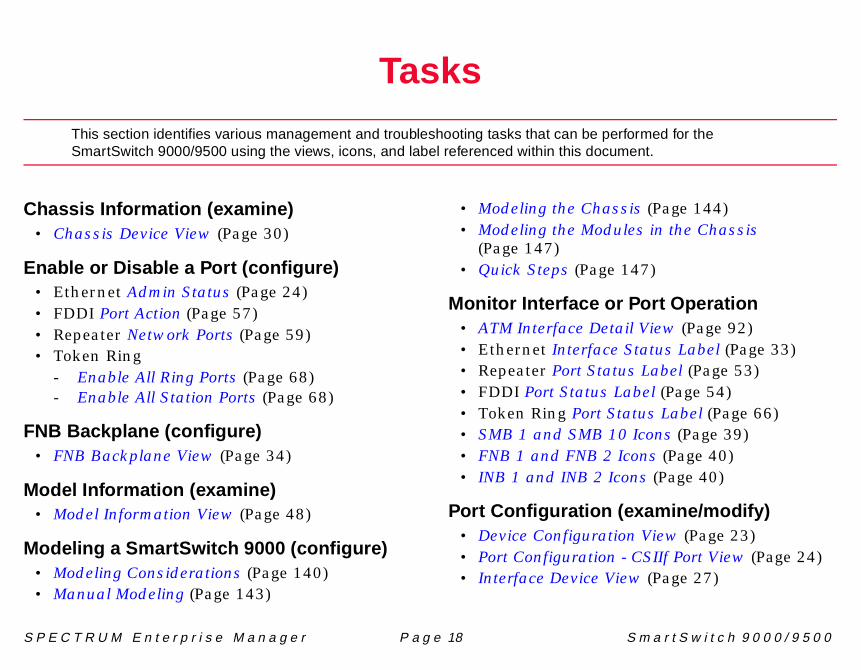
Tasks
This section identifies various management and troubleshooting tasks that can be performed for theSmartSwitch 9000/9500 using the views, icons, and label referenced within this document.
Chassis Information (examine)• Chassis Device View (Page 30)
Enable or Disable a Port (configure)• Ethernet Admin Status (Page 24)• FDDI Port Action (Page 57)• Repeater Network Ports (Page 59)• Token Ring
- Enable All Ring Ports (Page 68)- Enable All Station Ports (Page 68)
FNB Backplane (configure)• FNB Backplane View (Page 34)
Model Information (examine)• Model Information View (Page 48)
Modeling a SmartSwitch 9000 (configure)• Modeling Considerations (Page 140)• Manual Modeling (Page 143)
• Modeling the Chassis (Page 144)• Modeling the Modules in the Chassis
(Page 147)• Quick Steps (Page 147)
Monitor Interface or Port Operation• ATM Interface Detail View (Page 92)• Ethernet Interface Status Label (Page 33)• Repeater Port Status Label (Page 53)• FDDI Port Status Label (Page 54)• Token Ring Port Status Label (Page 66)• SMB 1 and SMB 10 Icons (Page 39)• FNB 1 and FNB 2 Icons (Page 40)• INB 1 and INB 2 Icons (Page 40)
Port Configuration (examine/modify)• Device Configuration View (Page 23)• Port Configuration - CSIIf Port View (Page 24)• Interface Device View (Page 27)

T a s k s M o d u l e D e s c r i p t i o n s
S P E C T R U M E n t e r p r i s e M a n a g e r P a g e 19 S m a r t S w i t c h 9 0 0 0 / 9 5 0 0
Setting Repeater Traps and Alarms• Trap Configuration (Page 59)• Alarm Configuration (Page 60)
Setting Ring Alarms and Thresholds• TR Ring Configuration View (Page 69)• Token Ring Security Configuration View
(Page 71)• Configure Station Alarms (Page 80)• Station Alarms Dialog Box (Page 81)
Setting Token Ring Security• Modify Allowed Station List View (Page 84)
Upgrade Firmware for the Device• Download Application (Page 23)

S P E C T R U M E n t e r p r i s e M a n a g e r P a g e 20 S m a r t S w i t c h 9 0 0 0 / 9 5 0 0
Views and Icons Common to All Technologies
This section gives examples and definitions of SPECTRUM icons and views that are common to all thetechnologies available for the SmartSwitch 9000.
This section contains views and icons that are common to all of the technologies available to the SmartSwitch 9000 series of devices. These views are accessible from Device, Application, Module, and Interface icons via double-click zones and Icon Subviews menus.
• Application View (Page 21). An example of an application view, its icons and the views it can access.
• Configuration Views (Page 23). Contains the Device and Port configuration views which enable you to monitor and configure various aspects of the device and the ports/interfaces it contains.
• Chassis Application View (Page 25). Displays icons that represent the chassis in which the module is contained.
• Device Views (Page 26). These views display icons and labels that represent the device, its ports or interfaces, and its applications. There are five different types of Device views:
- Interface Device View (Page 27)- Chassis Device View (Page 30) - Backplane Device View (Page 37)- Environmental Device View (Page 41)- Physical Device View (Page 47)
• Device Topology View (Page 47). Displays icons that represent the device, its ports or interfaces, and the devices and LAN networks that contain those devices connected to its ports.
• Model Information View (Page 48). Displays information about the device and allows you to set thresholds and alarm severity.
• Performance View (Page 49). Displays statistical information about the device, its ports or interfaces, and its applications.

V i e w s a n d I c o n s C o m m o n t o A l l T e c h n o l o g i e s A p p l i c a t i o n V i e w
S P E C T R U M E n t e r p r i s e M a n a g e r P a g e 21 S m a r t S w i t c h 9 0 0 0 / 9 5 0 0
Application ViewAccess: From the Icon Subviews menu for the Deviceicon, select Application .
When a device model is created, SPECTRUM automatically creates models for each of the major and minor applications supported by the device. The Application view identifies all of these application models, shows their current condition status, and provides access to application-specific subviews.
Figure 2 shows an Application view in its default mode (Icon) where each of the application models is represented by an Application icon (see Figure 3 for a close-up). The Application icons are arranged hierarchically under a Device icon, with major applications in the top row and their respective minor applications stacked directly below.
If you prefer to see applications displayed by name only, in a single vertical list, select View > Mode > List.
Figure 2:Figure 2:Figure 2:Figure 2: Application View
File
SpectroGRAPH: Application: 10.352.1.255
Model Name-
Contact
Description
Location
Network Address System Up Time
Manufacturer
Device Type
Serial Number
Model Name
9A656-04
HelpView Tools Bookmark

V i e w s a n d I c o n s C o m m o n t o A l l T e c h n o l o g i e s A p p l i c a t i o n V i e w
S P E C T R U M E n t e r p r i s e M a n a g e r P a g e 22 S m a r t S w i t c h 9 0 0 0 / 9 5 0 0
Application IconFigure 3 is an example of an application icon and represents device-specific, common, and optional applications supported by the devices available to the SmartSwitch 9000. Table 2 lists the applications that are common to many or all devices and the documentation that describes them. For information on the following optional applications, refer to the associated documentation.
Optional Applications• Routing Services (CtRouter)• DLM (DLM_Agent)• Standard RMON (RMONApp)• SecureFast VLAN (SFVLANApp)
Figure 3:Figure 3:Figure 3:Figure 3: Application Icon
fddimac
FddiMAC
FDDIMACApp
Table 2: Common Applications Supported
Application Reference
Bridging (CSIBridge) Bridging Applications
MIB-II (SNMP2_Agent) MIB-II Applications
DownLoad (CtDownLoad App)
Miscellaneous Applications
FDDI (FddiMAC) Miscellaneous Applications
ATM (ATMClientApp) Miscellaneous Applications
Fast Ethernet (FastEnetApp)
Miscellaneous Applications

V i e w s a n d I c o n s C o m m o n t o A l l T e c h n o l o g i e s C o n f i g u r a t i o n V i e w s
S P E C T R U M E n t e r p r i s e M a n a g e r P a g e 23 S m a r t S w i t c h 9 0 0 0 / 9 5 0 0
Configuration ViewsFigure 4 is an example of a Device Configuration View, which, along with the Port Configuration View also explained in this section, is common to most of the devices contained within the SmartSwitch 9000. Any configuration views that are device specific will be detailed in the appropriate technology section.
Figure 4:Figure 4:Figure 4:Figure 4: Configuration View
Device Configuration ViewAccess: From the Icon Subviews menu for the Deviceicon, select Configuration .
This view provides the following information and operating status:
Contact StatusThis field indicates if a connection with the device has been established.
Firmware RevisionThe current firmware version.
Hardware RevisionThe current hardware version.
Number of InterfacesThe number of interfaces available for this device.
This button provides access to the Community Names view. For information on using the Community Name view, refer to the SPECTRUM Portable Management Application Tools Guide.
This button provides access to the DownLoad Application view which allows you to upgrade the
SpectroGRAPH: 10.253.1.255
Model Name
Contact
Description
Location
Network Address
Primary Application
Sys Up Time
Manufacturer
Device Type
Serial Number
Contact Status
Component Table
Download Application
Interface Configuration Table
Index Type Phy Address Max Frame Size
Device Configuration View
HelpFile View Tools Bookmark
Firmware Revision
Hardware Revision Number of Interfaces
Oper Status
Trap Table
Component Table
Download Application

V i e w s a n d I c o n s C o m m o n t o A l l T e c h n o l o g i e s C o n f i g u r a t i o n V i e w s
S P E C T R U M E n t e r p r i s e M a n a g e r P a g e 24 S m a r t S w i t c h 9 0 0 0 / 9 5 0 0
firmware for the devices from a TFTP Boot or Bootp Server. For more information on this view, refer to the SPECTRUM Portable Management Application Tools Guide.
This button provides access to the Trap Table view. For information on using the Trap Table view, refer to the SPECTRUM Portable Management Application Tools Guide.
Interface Configuration TableThis section of the Device Configuration view provides more detailed information about the devices interfaces.
Number of InterfacesThe number of interfaces on the model.
IndexThe numerical value identifying the port.
TypeThe type of hardware interface for the port.
Phy AddressThe physical (MAC) address of the port.
Max Frame SizeThe maximum frame size for the SmartSwitch network interface modules.
Oper StatusThe current operational state of this port. Valid values are: Up, Down, and Testing .
Port Configuration - CSIIf PortViewAccess: From the Icon Subviews menu for a specificinterface label within a Chassis Module Icon, select CSIIFPort.
This view displays port-specific information for the device.
Interface IndexThe numerical value identifying the port.
Interface TypeThe type of interface for the port (FDDI).
Operation StatusThe current operating state of the port. Possible values are: On, Off , and Test .
Admin StatusThis field provides a button that allows you to change the current administrative state of the port. Possible values are: On, Off , and Test .
IF DescriptionDisplays a description of the interface.
Trap Table

V i e w s a n d I c o n s C o m m o n t o A l l T e c h n o l o g i e s C h a s s i s A p p l i c a t i o n V i e w
S P E C T R U M E n t e r p r i s e M a n a g e r P a g e 25 S m a r t S w i t c h 9 0 0 0 / 9 5 0 0
Chassis Application ViewAccess: From the Icon Subviews menu for the Deviceicon, select Chassis Applications .
Contains information on the chassis in which the module is contained, and the INB icon.
Figure 5:Figure 5:Figure 5:Figure 5: Chassis Application View
Container ViewAccess: From the Icon Subviews for the Chassis Icon,select Container .
Figure 6 displays Location view icons for each module installed in the SmartSwitch 9000 chassis. The views available from the Location view icons are described in this section.
Figure 6:Figure 6:Figure 6:Figure 6: Container ViewFile
SpectroGRAPH: Application: 9CX14
Model Name-
Contact
Description
Location
Network Address System Up Time
Manufacturer
Device Type
Serial Number
9CX14
9CX14
HelpView Tools Bookmark
INB
INB
Chassis Icon
SpectroGRAPH: Location: QA Lab
Model Name
9F426_02
Model Name
9A128-01
Model Name
SFSmartCell
HelpFile View Tools Bookmark

V i e w s a n d I c o n s C o m m o n t o A l l T e c h n o l o g i e s D e v i c e V i e w s
S P E C T R U M E n t e r p r i s e M a n a g e r P a g e 26 S m a r t S w i t c h 9 0 0 0 / 9 5 0 0
Module ViewAccess: From the Icon Subviews for the Chassis icon,select Module View .
Figure 7 displays Location view icons for each module installed in the chassis. Rows list the slot, model type, network address, and community string.
• To display the Location view icon for a specific model listed in the Module view, double-click on that row.
• To search the list in the Module view for a specific Module Type, select Filter... or Search from the Tools menu.
• To determine the number of modules installed in the chassis, select Statistics from the Tools menu.
Figure 7:Figure 7:Figure 7:Figure 7: Module View
Device ViewsThese views display icons and labels that represent the device, its ports or interfaces, and its applications. SmartSwitch 9000 devices support two types of device views:
• Interface Device View (Page 27)
• Chassis Device View (Page 30)
The Device Chassis view can be configured four different ways including: Chassis, Environmental, Physical, and Backplane.
Model Name of type SmartSwitch 9000 of Landscape VNMHost: Primary
Model Name
9A128-01
Slot Network Address Community StringModule Type
3 9F120-08 12.345.67.890 public4 9F120-08 12.345.67.891 public5 9F120-08 12.345.67.892 public7 9F241-12 12.345.67.893 public8 9F120-08 12.345.67.894 public9 9F120-08 12.345.67.895 public
HelpFile View Tools Bookmark
Condition
minornormalnormalnormalnormalnormal

V i e w s a n d I c o n s C o m m o n t o A l l T e c h n o l o g i e s D e v i c e V i e w s
S P E C T R U M E n t e r p r i s e M a n a g e r P a g e 27 S m a r t S w i t c h 9 0 0 0 / 9 5 0 0
Interface Device ViewAccess: From the Icon Subviews for the a SmartSwitch9000/9500 icon, select Device > Interface.
This view provides dynamic configuration and performance information for each of the device’s serial/network I/O ports, which are represented by Interface icons in the bottom panel of the view, as shown in Figure 8. The middle panel of the view also displays a Device icon, which allows you to monitor device operation and access other device-specific views.
Figure 8:Figure 8:Figure 8:Figure 8: Interface Device View
Primary Landscape 0x00400000 - VNM Host - SmartSwitch 9000 of type
Physical
Help
Model Name
Model Type
FDDI0:0:1D:17:2F:3C
0
fnb ON
Ethernet0:0:1D:17:2F:3D
0
e1 ON
Ethernet0:0:1D:17:2F:3E
0
e2 ON
Interface Icons
Interface Options PanelDevice Icon
Filter
Interface Description
File View Tools Bookmark
Model Name
Contact
Description
Location
Network
Primary Application
Sys Up Time
Manufacturer
Device Type
Serial Number

V i e w s a n d I c o n s C o m m o n t o A l l T e c h n o l o g i e s D e v i c e V i e w s
S P E C T R U M E n t e r p r i s e M a n a g e r P a g e 28 S m a r t S w i t c h 9 0 0 0 / 9 5 0 0
Interface IconsFigure 9 shows a close-up of an Interface icon from an Interface Device view. Most of the informational labels on the icon also provide double-click access to other views, as explained in the following label descriptions.
Figure 9:Figure 9:Figure 9:Figure 9: Interface Icon
Interface Number LabelThis label displays the number identifying this interface. The first number represents the slot that this module resides in. The second number represents the interface number on this module.
Interface Status LabelThis label displays the current Operational Status of the interface. It also provides double-click access to the Port Configuration - CSIIf Port View (Page 24).
Table 3 and Table 4 list the possible states relative to the application selected. The default application for this view is Physical (MIB-II). To select the application to be displayed (Physical or Bridging), click the Filter menu button in the Interface Options panel.
(c)(d)(e)(f)
(a) (b)
aaaa Interface Number Label
bbbb Interface Status Label
cccc Port Type Label
dddd MAC Address Label
eeee Network Information Label
ffff Gauge Label
ATM20403 ON
0
0
In:
Out:
ATM Interface
(a) (b)
Gauge Label
FDDI0:0:1D:17:2F:3C
0
fnb ON
Table 3: Interface Status for the Physical Application
Color Status Description
Green ON Port is operational.
Blue OFF Port is off.
Yellow TST Port is in the test mode.
V i e w s a n d I c o n s C o m m o n t o A l l T e c h n o l o g i e s D e v i c e V i e w s
S P E C T R U M E n t e r p r i s e M a n a g e r P a g e 29 S m a r t S w i t c h 9 0 0 0 / 9 5 0 0
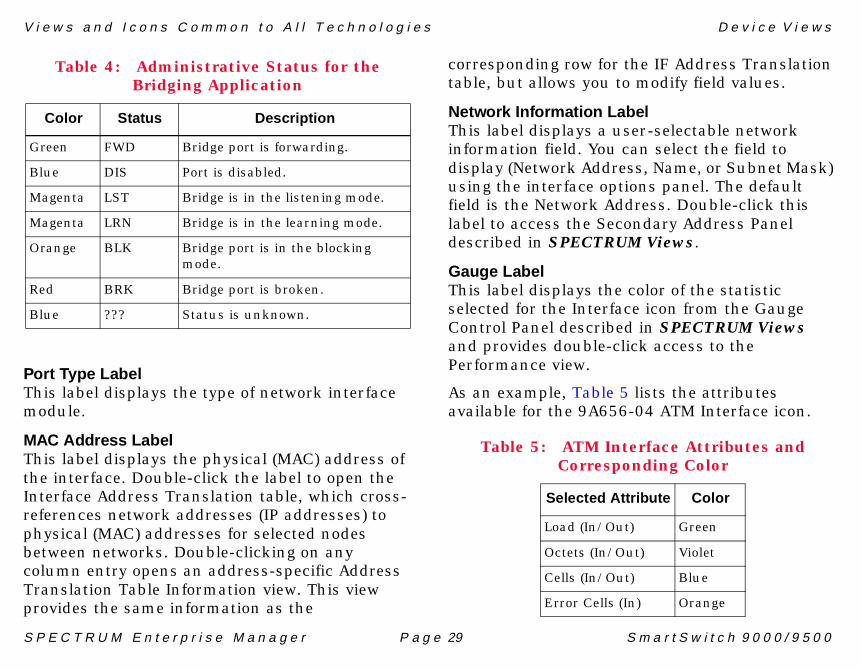
Port Type LabelThis label displays the type of network interface module.
MAC Address LabelThis label displays the physical (MAC) address of the interface. Double-click the label to open the Interface Address Translation table, which cross-references network addresses (IP addresses) to physical (MAC) addresses for selected nodes between networks. Double-clicking on any column entry opens an address-specific Address Translation Table Information view. This view provides the same information as the
corresponding row for the IF Address Translation table, but allows you to modify field values.
Network Information LabelThis label displays a user-selectable network information field. You can select the field to display (Network Address, Name, or Subnet Mask) using the interface options panel. The default field is the Network Address. Double-click this label to access the Secondary Address Panel described in SPECTRUM Views.
Gauge LabelThis label displays the color of the statistic selected for the Interface icon from the Gauge Control Panel described in SPECTRUM Views and provides double-click access to the Performance view.
As an example, Table 5 lists the attributes available for the 9A656-04 ATM Interface icon.
Table 4: Administrative Status for the Bridging Application
Color Status Description
Green FWD Bridge port is forwarding.
Blue DIS Port is disabled.
Magenta LST Bridge is in the listening mode.
Magenta LRN Bridge is in the learning mode.
Orange BLK Bridge port is in the blocking mode.
Red BRK Bridge port is broken.
Blue ??? Status is unknown.
Table 5: ATM Interface Attributes and Corresponding Color
Selected Attribute Color
Load (In/Out) Green
Octets (In/Out) Violet
Cells (In/Out) Blue
Error Cells (In) Orange

V i e w s a n d I c o n s C o m m o n t o A l l T e c h n o l o g i e s D e v i c e V i e w s
S P E C T R U M E n t e r p r i s e M a n a g e r P a g e 30 S m a r t S w i t c h 9 0 0 0 / 9 5 0 0
Interface Icon Subviews MenuSelectionsTable 6 describes each of the Icon Subviews menu selections, available from the interface icon, that are available to all or most of the devices available to the SmartSwitch 9000 Series. Depending on the device type. Some of these views may not be available.
Chassis Device ViewAccess: From the Icon Subviews for the Device icon of theSmartSwitch 9000/9500, select Device > Chassis .
Figure 10 is common to all devices available within the SmartSwitch 9000 and displays the Module Icon that represents the Physical Devices and their placement in the chassis. These Module icons vary depending upon the device and are explained in their appropriate technology section.
Table 6: Interface Icon Subviews Menu Selections
Option Opens the...
Configuration Port Configuration - CSIIf Port View (Page 24).
Secondary Address Panel
Secondary Address Panel View.
Model Information Model Information View (Page 48).

V i e w s a n d I c o n s C o m m o n t o A l l T e c h n o l o g i e s D e v i c e V i e w s
S P E C T R U M E n t e r p r i s e M a n a g e r P a g e 31 S m a r t S w i t c h 9 0 0 0 / 9 5 0 0
Figure 10:Figure 10:Figure 10:Figure 10: Chassis Device View
89E133-36
Model Name
Physical
fnb FWD
e1 FWD
e2 FWD
e3 FWD
E3
E2
E1
Help
Model Name of Type 8E133-36 Landscape VNMHost:Primary
File View Tools Bookmark
Model Name
Contact
Description
Location
Network Address
Primary Application
Sys Up Time
Manufacturer
Device Type
Serial Number
COM 1:
COM 2:
Status
FNB
Environmental
Chassis Module Icon

V i e w s a n d I c o n s C o m m o n t o A l l T e c h n o l o g i e s D e v i c e V i e w s
S P E C T R U M E n t e r p r i s e M a n a g e r P a g e 32 S m a r t S w i t c h 9 0 0 0 / 9 5 0 0
Figure 11: Ethernet Chassis Module Icon
Application Access Label
Configuration Views
Configuration Views
Slot NumberModel Type
Module Identification Labels
i2
e1
e2
e3
e4
e5
e6
e7
e8
e9
e10
e11
89E423-24
Model Name
Bridging
FWD
FWD
FWD
FWD
FWD
FWD
FWD
FWD
FWD
FWD
FWD
Interface Type and NumberInterface Status
Interface Labels
Model Name
FDDI Interface Label Icon Subviews Menu Options
fnb
e1
e2
e3E1
89E132-15
Model Name
Bridging
FWD
FWD
FWD
FWD
UNLOCKED
UNLOCKED
UNLOCKED
E2
E3
1 ON Pkts 4
2 ON Pkts 4
3 ON Pkts 4
Repeater Labels
Packet Rate LabelPort Status LabelPort Number Label
Repeater PortLabels
FWD
V i e w s a n d I c o n s C o m m o n t o A l l T e c h n o l o g i e s D e v i c e V i e w s
S P E C T R U M E n t e r p r i s e M a n a g e r P a g e 33 S m a r t S w i t c h 9 0 0 0 / 9 5 0 0
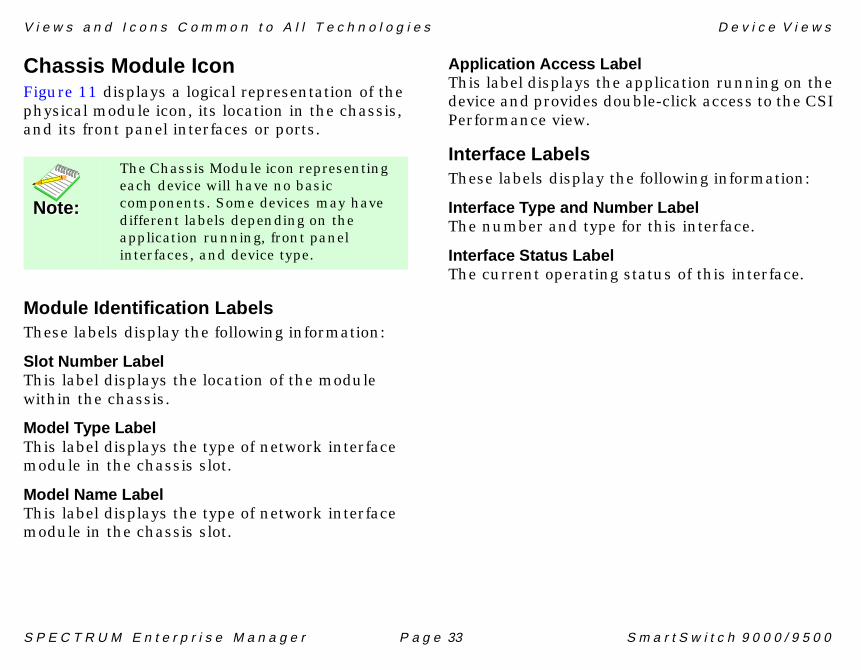
Chassis Module IconFigure 11 displays a logical representation of the physical module icon, its location in the chassis, and its front panel interfaces or ports.
Module Identification LabelsThese labels display the following information:
Slot Number LabelThis label displays the location of the module within the chassis.
Model Type LabelThis label displays the type of network interface module in the chassis slot.
Model Name LabelThis label displays the type of network interface module in the chassis slot.
Application Access LabelThis label displays the application running on the device and provides double-click access to the CSI Performance view.
Interface LabelsThese labels display the following information:
Interface Type and Number LabelThe number and type for this interface.
Interface Status LabelThe current operating status of this interface.
Note:Note:
The Chassis Module icon representing each device will have no basic components. Some devices may have different labels depending on the application running, front panel interfaces, and device type.

V i e w s a n d I c o n s C o m m o n t o A l l T e c h n o l o g i e s D e v i c e V i e w s
S P E C T R U M E n t e r p r i s e M a n a g e r P a g e 34 S m a r t S w i t c h 9 0 0 0 / 9 5 0 0
Chassis Module Icon Subviews MenuSelectionsTable 7 lists each of the Icon Subviews menus common to the Chassis Module for each device within the SmartSwitch 9000 chassis. These views are described in SPECTRUM Views. A summary and example for each view is provided within this section.
FNB Backplane ViewAccess: From the Chassis or Backplane Device View, clickon the FNB button.
The FNB Ring Configuration window (Figure 12) lets you make the most effective use of network bandwidth for your site by allowing you to segment the SmartSwitch 9000 FNB into smaller FDDI ring networks.
The window acts as a template for your network design. You can use it to try out changes to the network design before you actually apply them. After you have reconfigured the network to your needs, you can apply the changes.
Table 7: Common Chassis Module Icon Subviews Menu Selections
Options Opens the...
DevTop Device Topology View (Page 47).
Application Application View (Page 21).
Configuration Configuration Views (Page 23).
Model Information Model Information View (Page 48).
Interface Interface Device View (Page 27).
Application Display Application selection dialog box. This dialog box allows you to select the application to be displayed in the Application label. Example: Bridging.

V i e w s a n d I c o n s C o m m o n t o A l l T e c h n o l o g i e s D e v i c e V i e w s
S P E C T R U M E n t e r p r i s e M a n a g e r P a g e 35 S m a r t S w i t c h 9 0 0 0 / 9 5 0 0
Figure 12:Figure 12:Figure 12:Figure 12: FNB Backplane View Table 8 lists the Icon Subviews menu for the FNB Backplane.
Model Name of type 9E133-36 of Landscape VNMHost: Primary
89E133-36
Model Name
HelpFile View Tools Bookmark
Model Name
Contact
Description
Location
Net Addr Sys Up Time
Manufacturer
Device Type
Serial Number
Primary RingSecondary Ring
Refresh Apply
9F120-08
Model Name
1 4 89H423-26
Model Name
5
MAC
Table 8: FNB Backplane Icon Subviews Menu Selections
Options Opens the...
FNB Config View Opens the FNB Configuration View for the selected slot.
FNB-1 Thru Unwraps to the original state of primary and secondary rings.
FNB-1 Wrap Left Wraps the module’s FNB left multiplexer so that the primary and secondary paths of FNB-1 are looped, causing a single ring to form.
FNB-1 Wrap Right Wraps the module’s FNB right multiplexer so that the primary and secondary paths of FNB-1 are looped, causing a single ring to form.
FNB-2 Thru Unwraps to the original state of primary and secondary rings.
FNB-2 Wrap Left Wraps the module’s FNB left multiplexer so that the primary and secondary paths of FNB-2 are looped, causing a single ring to form.
FNB-2 Wrap Right Wraps the module’s FNB right multiplexer so that the primary and secondary paths of FNB-2 are looped, causing a single ring to form.

V i e w s a n d I c o n s C o m m o n t o A l l T e c h n o l o g i e s D e v i c e V i e w s
S P E C T R U M E n t e r p r i s e M a n a g e r P a g e 36 S m a r t S w i t c h 9 0 0 0 / 9 5 0 0
FNB Configuration ViewAccess: From the Icon Subviews menu for the FNBBackplane View, select FNB Config View .
When you open a module’s FNB Configuration window (see Figure 13), the MAC on the FDDI ring associated with an SMT entity will usually be in normal operation on the ring. However, on some occasions, the ring may be recovering from a beaconing condition, and RMT (the Ring Management component of SMT services) is in the process of initializing or recovering from a ring failure. If you bring up a module’s FNB Configuration window during ring initialization or recovery, the MAC on that ring will be in an isolated state. The isolated state is depicted as the MAC positioned above the ring path pair, instead of connected to one or the other ring path. The MAC will be color-coded according to its last known ring path; however, it is not manageable during this state.
A status message located in the lower left corner of the FNB Configuration window will inform you whether you are looking at the Current Current Current Current ConfigurationConfigurationConfigurationConfiguration of the module with respect to the FNB backplane, whether the window has been changed to a Valid ConfigurationValid ConfigurationValid ConfigurationValid Configuration, whether the window has been changed to an Invalid Invalid Invalid Invalid ConfigurationConfigurationConfigurationConfiguration (in which case you will not be able
to apply the change), or whether the change has been applied successfully to the device (Set Set Set Set SuccessSuccessSuccessSuccess).
For more information on the FNB Backplane and its corresponding views, see SmartSwitch 9000 Chassis User's Guide for SPMA.

V i e w s a n d I c o n s C o m m o n t o A l l T e c h n o l o g i e s D e v i c e V i e w s
S P E C T R U M E n t e r p r i s e M a n a g e r P a g e 37 S m a r t S w i t c h 9 0 0 0 / 9 5 0 0
Figure 13:Figure 13:Figure 13:Figure 13: FNB Configuration View Backplane Device ViewAccess: From the Chassis, Environmental, or Physicalview, select View > Page > Backplane .
Figure 14 shows a logical representation of the backplane connections (FNB, INB and SMB) for each of the modules installed in the chassis. An example of a backplane icon, its double-click zones and Icon Subviews menus is discussed in the following pages. The backplane module Icon will be the same for every device with the exception that the backplane icons (i.e., INB, FNB, SMB) will be grayed out depending on the functionality of the device.
FNB Configuration (Slot 1): IP Address
Bypass
Bypass
MAC
FNB-1
FNB-2
P
S
P
S
PORTS12345678
Refresh Apply Undo Close

V i e w s a n d I c o n s C o m m o n t o A l l T e c h n o l o g i e s D e v i c e V i e w s
S P E C T R U M E n t e r p r i s e M a n a g e r P a g e 38 S m a r t S w i t c h 9 0 0 0 / 9 5 0 0
Figure 14:Figure 14:Figure 14:Figure 14: Backplane Device View Figure 15:Figure 15:Figure 15:Figure 15: Backplane Module Icon
Model Name of type 9E133-36 of Landscape VNMHost: Primary
89E133-36
Model Name
Backplane Module Icon
A
FNB 2
B
FNB 1
B
ON
SMB 1
ON
SMB 10
– – –INB 1
INB 2
A – – –
– – –
– – –
– – –
ON
Environmental Module
HelpFile View Tools Bookmark
Model Name
Contact
Description
Location
Network Sys Up Time
Manufacturer
Device Type
Serial Number
COM 1:
COM 2:
Status
FNB
Slot NumberModel Type
Module Identification Labels
Model Name
SMB 1 and SMB 10 Icons
Backplane Connection Status Label
FNB 1 and FNB 2 Icons
INB 1 and INB 2 Icons
8
9A656-04
Model Name
FNB 1
ONSMB 1
ONSMB 10
---INB 1
---INB 2
A ---B ---FNB 2
A ---B ---

V i e w s a n d I c o n s C o m m o n t o A l l T e c h n o l o g i e s D e v i c e V i e w s
S P E C T R U M E n t e r p r i s e M a n a g e r P a g e 39 S m a r t S w i t c h 9 0 0 0 / 9 5 0 0
Backplane Module IconThis icon displays a logical representation of the physical module, its location in the chassis, its backplane interfaces and its ports. Figure 15 shows an example of the Backplane Module icon.
Module Identification LabelsThese labels display the following information:
Slot Number LabelThis label displays the location of the module within the chassis.
Model Type LabelThis label displays the type of network interface module in the chassis slot.
Model Name LabelThis label displays the type of network interface module in the chassis slot.
SMB 1 and SMB 10 IconsThe System Management Bus (SMB) icons represent the connections between the module and the SMB 1 and SMB 10. Table 9 describes the possible operational states.
Table 9: SMB 1 and SMB 10 Status Descriptions
Color Status Description
Blue OFF The module is not connected to the SMB.
Green ON The module is connected to the SMB.
Yellow TST The interface is in the test state.
Grey - - - The interface could not be found for this module.
Red - - - Problems have occurred reading and determining the status of the interface.

V i e w s a n d I c o n s C o m m o n t o A l l T e c h n o l o g i e s D e v i c e V i e w s
S P E C T R U M E n t e r p r i s e M a n a g e r P a g e 40 S m a r t S w i t c h 9 0 0 0 / 9 5 0 0
FNB 1 and FNB 2 IconsThe Flexible Network Bus (FNB) icons (see Figure 15 on Page 38) represent the connections between the module and the FNB 1 and FNB 2. Table 10 describes the possible operational states.
INB 1 and INB 2 IconsThe Internal Network Bus (INB) icons (see Figure 15 on Page 38) represent the connections between the module and the INB 1 and INB 2. Table 11 describes the possible operational states.
Table 10: FNB 1 and FNB 2 Status Descriptions
Color Status Description
Blue --- The module is not connected to the FNB but has the potential to be connected.
Blue DIS The module is disabled.
Yellow CON The module is in the process of connecting to the FNB.
Green ACT The module is connected to the FNB and is active.
Red SBY The module is in standby mode.
Red --- Problems have occurred reading and determining the status of the interface.
Table 11: INB 1 and INB 2 Status Descriptions
Color Status Description
Blue OFF The module is not connected to the INB.
Green ON The module is connected to the INB.
Yellow TST The interface is in the test state.
Grey - - - The interface for this module could not be found.
Red - - - Problems have occurred reading and determining the status of the interface.

V i e w s a n d I c o n s C o m m o n t o A l l T e c h n o l o g i e s D e v i c e V i e w s
S P E C T R U M E n t e r p r i s e M a n a g e r P a g e 41 S m a r t S w i t c h 9 0 0 0 / 9 5 0 0
Environmental Device ViewAccess: From the Chassis, Backplane, or Physical view,select View > Page > Environmental .
This view displays the temperature in Fahrenheit or Celsius (selectable from the Options menu) and power levels for the devices installed in the chassis. Figure 16 shows an example of an Environmental Device view.
Figure 16: Environmental Device View
SpectroGRAPH: Device: Model Name
Model Name
Contact
Description
Location
Net Addr Sys Up Time
Manufacturer
Device Type
Serial Number
HelpFile View Tools Bookmarks
Model Name of type 9#132_15 of Landscape node: Primary
Climate
Temp:
Humidity:
Fan Status/Speed
F1: F3:
F2: F4:
Power Subsystem
Total:
Used:
Avail:
Status:
Auto Full
Redundancy Redundant
Main Pwr Bus
Diag Pwr Bus
INB Term
UPS/Battery
Status:
Run Time:
Power %
89E133-36
Model Name
68.8
1201101009080706050403020100
Temp101F
140120100806040200
RelTempnormal

V i e w s a n d I c o n s C o m m o n t o A l l T e c h n o l o g i e s D e v i c e V i e w s
S P E C T R U M E n t e r p r i s e M a n a g e r P a g e 42 S m a r t S w i t c h 9 0 0 0 / 9 5 0 0
Chassis Environmental InformationThis area of the Device view also indicates the environmental status of the chassis. These panels and their fields are as follows:
Climate• Temp - displays the ambient temperature of
the room in which the chassis is located.- Green - normal, cool, or cold- Yellow - warm- Red - hot- Blue - unknown
• Humidity - displays the humidity value of the air flowing through the chassis.- Green - dry, normal, or moist- Blue - unknown
Fan Status/Speed• F1 through F4 - displays the fan speed in
percent of maximum speed for each of the four fans in the chassis.- Green - normal, or testing- Yellow - unknown- Red - slow, inoperative, or off
• Auto/Full - allows you to set the fans to Auto (speed controlled by the temperature of the chassis) or Full (speed set to maximum).
Power Subsystem• Total - displays the maximum power that
could be supplied by the chassis power supply.
• Used - displays the total power currently being supplied by the chassis power supply.
• Avail - displays the available power from the chassis power supply.
• Status - displays the status and type of power for the chassis: AC, DC, or Battery.- Green - power normal.- Yellow - over current, over voltage, or
under voltage.
• Redundancy - displays the source of the power for the chassis.- Redundant - indicates that power from the
secondary power source is being used for the chassis.
- NON-Redundant - indicates that power from the primary power source is being used for the chassis.
• Main Pwr Bus - displays the voltage of the chassis’s main power bus. The value can range between 40 and 60 volts DC.
- Green - power normal.

V i e w s a n d I c o n s C o m m o n t o A l l T e c h n o l o g i e s D e v i c e V i e w s
S P E C T R U M E n t e r p r i s e M a n a g e r P a g e 43 S m a r t S w i t c h 9 0 0 0 / 9 5 0 0
- Yellow - over current, over voltage, or under voltage.
• Diag Pwr Bus - field does not function at this time. A future version of firmware will include this functionality.
• INB Term - displays the voltage of the termination power bus. The termination power bus provides power to the INB termination cards within the chassis.- Green - power normal.- Yellow - over current, over voltage, under
voltage, or over power.
UPS/Battery• Status - displays the UPS’s operational
status. Below are a list of colors and conditions associated with this field.
- Red - overload, low battery, or replace battery.
- Blue - no UPS.- Green - on line.- Yellow - calibration running.
• Run Time - displays the estimated remaining run time in minutes. You can query the UPS when operating on-line, bypass, or on-battery
modes of operation. The run time estimate is based on available battery capacity and output load.
UPS Details ViewAccess: From the Icon Subviews menu for theUPS/Battery section of the Chassis Device View, select UPSDetails .
This view provides the following information on the UPS battery.
IndexAn unique value that identifies a particular UPS.
NameThe name of the UPS.
Model TypeThe model type of the UPS.
Battery CapacityThe UPS’s remaining battery capacity expressed as a percent of the fully charged condition. The value of this object is the actual percentage multiplied by 10.
Operational StatusThe operational status of the UPS. Possible entries are: on-line , on-battery , overloaded , low battery , replace battery , smart boost , sleep , and run time calibration running .

V i e w s a n d I c o n s C o m m o n t o A l l T e c h n o l o g i e s D e v i c e V i e w s
S P E C T R U M E n t e r p r i s e M a n a g e r P a g e 44 S m a r t S w i t c h 9 0 0 0 / 9 5 0 0
UPS Configuration Information ViewAccess: By double clicking on an entry in the UPS Detailview .
This view displays information on the condition, status and the input/output power of a particular UPS. This view contains the following:
IdentificationThis section of the UPS Configuration Information View contains entries that uniquely identify a particular UPS.
IndexA unique value which identifies a particular UPS.
NameA name given to a particular UPS.
Model TypeThe UPS’s base model type.
FirmwareThe UPS’s firmware version.
Serial NumberThe UPS’s serial number as set at the factory.
Manufacture DateThe UPS’s date of manufacture, in the format mm/dd.
StatusThe Status section of the UPS Configuration Information view displays information on the operational and fault status of a particular UPS.
OperationalThe operational status of the UPS. Possible entries are: on-line , on-battery , overloaded , low battery , replace battery , smart boost , sleep , and run time calibration running .
FaultThe fault conditions. The possibilities are: current , exceeded , malfunction , operation , and shut down .
TemperatureThe UPS’s present internal operating temperature in degrees Fahrenheit. You can determine the actual temperature by dividing this value by 10.
Battery ConditionsThis section of the UPS Configuration Information view contains the following information.
Capacity (%)The UPS’s remaining battery capacity as expressed by a percent of the fully charged condition.

V i e w s a n d I c o n s C o m m o n t o A l l T e c h n o l o g i e s D e v i c e V i e w s
S P E C T R U M E n t e r p r i s e M a n a g e r P a g e 45 S m a r t S w i t c h 9 0 0 0 / 9 5 0 0
VoltageThe UPS’s present battery voltage. You can determine the actual voltage by dividing the value of the field by 100.
Run Time Remaining (min)The UPS’s estimated remaining run time (in minutes). The UPS can be queried when operating in on-line, bypass, or on-battery modes. The run time estimate is based on available battery capacity and output load.
Battery TestThe section of the UPS Configuration Information view contains information on the last battery test performed on this UPS.
Initiate Battery TestIndicates if a battery test has been initiated. Valid values are: Yes and No.
Test ResultThe results of the last battery test performed.
Input/Output PowerThis section of the UPS Configuration Information view contains information on the incoming and out-going power that the UPS is providing. Column headings are as follows:
Input VoltageThe UPS’s measured utility input voltage. The value is determined by dividing the value of the field by 10.
Output VoltageThe measured UPS output voltage. The value is determined by dividing the value of the field by 10.
Output Power (Watts)The UPS’s output load expressed as a percentage of rated load in watts.
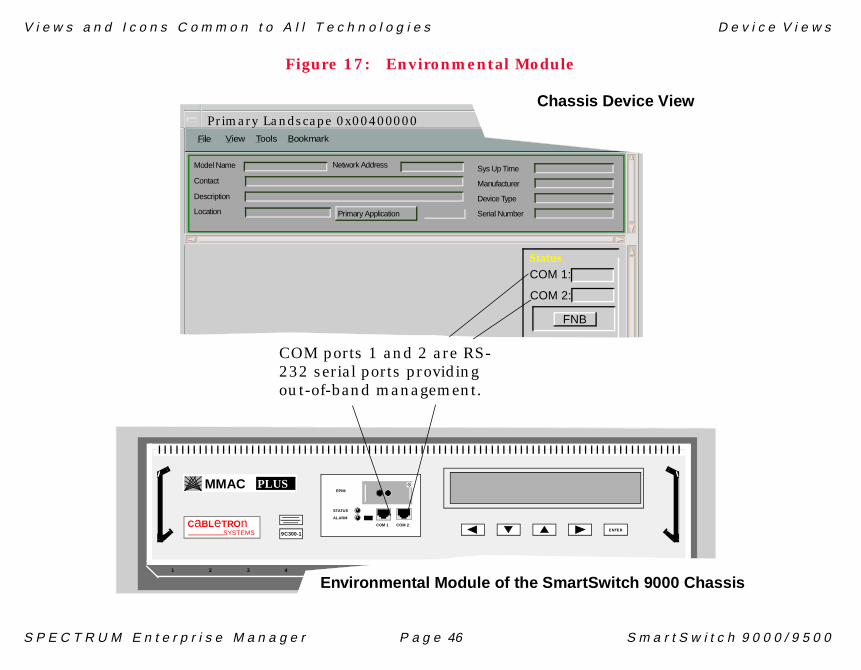
Environmental Module InformationWithin the Device Chassis view are the COM 1, COM 2, and the FNB fields which provide additional information for the connections on the Environmental Module. Figure 17 shows the relationship between the Device view and the corresponding front panel of the Environmental Module of the SmartSwitch 9000 chassis.
V i e w s a n d I c o n s C o m m o n t o A l l T e c h n o l o g i e s D e v i c e V i e w s
S P E C T R U M E n t e r p r i s e M a n a g e r P a g e 46 S m a r t S w i t c h 9 0 0 0 / 9 5 0 0
Figure 17: Environmental Module
Primary Landscape 0x00400000
COM 1:Status
MMAC PLUS
CaBLeTROnSYSTEMS ENTER
9C300-1
COM 1 COM 2
STATUS
ALARM
EPIM
1 2 3 4
Environmental Module of the SmartSwitch 9000 Chassis
Chassis Device View
COM ports 1 and 2 are RS-232 serial ports providing out-of-band management.
File View Tools Bookmark
Model Name
Contact
Description
Location
Network Address
Primary Application
Sys Up Time
Manufacturer
Device Type
Serial Number
COM 2:
FNB

V i e w s a n d I c o n s C o m m o n t o A l l T e c h n o l o g i e s D e v i c e T o p o l o g y V i e w
S P E C T R U M E n t e r p r i s e M a n a g e r P a g e 47 S m a r t S w i t c h 9 0 0 0 / 9 5 0 0
Physical Device ViewAccess: From the Chassis, Environmental, or Backplaneview, select View > Page > Physical .
This view (Figure 18) provides a static image of the chassis, ports, and modules installed in the chassis.
Figure 18:Figure 18:Figure 18:Figure 18: Physical Device View
Device Topology ViewAccess: From the Icon Subviews for the Device icon,select DevTop .
Figure 19 displays icons that represent the device, its ports or interfaces, and the devices and LAN networks that contain those devices connected to its ports. It is described in SPECTRUM Views. The Interface icons displayed in this view are the same as those in the Interface Device view.
MMACPLUS
CaBLETROnSYSTEMS ENTER9C300-1
COM 1COM 2
STATUSALARM
EPIM
1 2 3 4 5 6 7 8 9 10 11 12 13 14
123456791012
811
M1M2M3M4M5M6M7M8M9M10M11M12
FNBSMBCPU
FDDI9F122-12ID Numbers +Stuff like #9More #’s andStuff like #9
MMACPLUS
1 2 3 4 5 6 7 8 9 10 11 12 13 14
FNBSMBCPU
FDDI9F122-12ID Numbers +Stuff like #9More #’s andStuff like #9
MMACPLUS
12
FNBB
FDDI1
FNBA
FNBB
FDDI2
FNBA
FNBSMBCPU
FDDI9F122-12ID Numbers +Stuff like #9More #’s andStuff like #9
MMACPLUS MMACPLUS
123456789101112
123
12
1
ETHERNET1
12
1
ETHERNET2
12
1
ETHERNET3
FNBSMBCPU
FDDI9F122-12ID Numbers +Stuff like #9More #’s andStuff like #9
MMACPLUS
123456789101112
123
12
1
ETHERNET1
12
1
ETHERNET2
12
1
ETHERNET3
MMACPLUS
FNBSMBCPU
FDDI9F122-12ID Numbers +Stuff like #9More #’s andStuff like #9
MMACPLUS
12
FNBB
FDDI1
FNBA
FNBB
FDDI2
FNBA
123456791012
811
M1M2M3M4M5M6M7M8M9M10M11M12
FNBSMBCPU
FDDI9F122-12ID Numbers +Stuff like #9More #’s andStuff like #9
MMACPLUS
FNBSMBCPU
FDDI9F122-12ID Numbers +Stuff like #9More #’s andStuff like #9
MMACPLUS
12
FNBB
FDDI1
FNBA
FNBB
FDDI2
FNBA
FNBSMBCPU
FDDI9F122-12ID Numbers +Stuff like #9More #’s andStuff like #9
MMACPLUS MMACPLUS
123456789101112
123
12
1
ETHERNET1
12
1
ETHERNET2
12
1
ETHERNET3
FNBSMBCPU
FDDI9F122-12ID Numbers +Stuff like #9More #’s andStuff like #9
MMACPLUS
123456789101112
123
12
1
ETHERNET1
12
1
ETHERNET2
12
1
ETHERNET3
MMACPLUS
Model Name of type 9E133-36 of Landscape VNMHost:Primary
File View Tools Bookmark
ModelContactDescriptionLocation
Network
Primary Applica-
Sys Up TimeManufacturerDevice TypeSerial Num-

V i e w s a n d I c o n s C o m m o n t o A l l T e c h n o l o g i e s M o d e l I n f o r m a t i o n V i e w
S P E C T R U M E n t e r p r i s e M a n a g e r P a g e 48 S m a r t S w i t c h 9 0 0 0 / 9 5 0 0
Figure 19:Figure 19:Figure 19:Figure 19: Device Topology View Model Information ViewAccess: From the Icon Subviews for the Device icon,select Model Information .
Figure 20 displays information about this device and allows you to set thresholds and alarm severity. This view may vary depending on the model it defines. For a more detailed description, refer to SPECTRUM Views.
Figure 20:Figure 20:Figure 20:Figure 20: Model Information View
Primary Landscape 0x00400000 - VNM Host - 9E133_08 of type 9E133_08
1 ONETHERNET
0.0.2.1.0.5.1.A:BC
0
2 ONETHERNET
0.0.2.1.0.5.1.A:BC
0
3 ONETHERNET
0.0.2.1.0.5.1.A:BC
0
4 ONETHERNET
0.0.2.1.0.5.1.A:BC
0
Model Type
Model TypeSNMP
Router #1
Model Name
Model Type
LAN Name
LAN Type
HelpFile View Tools Bookmark
Model Name of type 9E133_08 of Landscape VNMHost: Primary
MM Version Number
MM Name
MM Part Number
General Information Communication Information
Community Name
DCM TimeOut
DCM Retry
Poll/Log InformationModel Created By
Model Type
Model Creation Time
Poll Interval
Polling StatusModel State
Security String
Mgmnt Protocol
Help
Model Information View
File View Tools Bookmark
Model Name
Contact
Description
Location
Network Address
Primary Application
Sys Up Time
Manufacturer
Device Type
Serial Number

V i e w s a n d I c o n s C o m m o n t o A l l T e c h n o l o g i e s P e r f o r m a n c e V i e w
S P E C T R U M E n t e r p r i s e M a n a g e r P a g e 49 S m a r t S w i t c h 9 0 0 0 / 9 5 0 0
Performance ViewAccess: From the Icon Subviews for the Device icon,select Performance .
Figure 21 displays statistical information about the device, its ports or interfaces, and, its applications. This view will display different statistical information depending on the Device type, technology, or interface type. For a more detailed description, see SPECTRUM Views.‘‘
Figure 21:Figure 21:Figure 21:Figure 21: Performance View
Note:Note:
When modeling an SFSmartcell (9A6XX-XX) the model represents the entire switch (i.e. all 9A6XX-XX). Therefore, the Performance views statistics are calculated from the sum of all statistics on each of the 9A6XX-XX blades.
Model Name of type 9E133_08 of Landscape VNMHost: Primary
Log
100.0
10.00
1.00
0.10
0.01
000:40:0 0:30:0 0:20:0
NOW Average Peak Value
%Delivered
%Forwarded
%Transmit
%Error
%Discarded
DetailGraph Properties Scroll to Date-Time
HelpFile View Tools Bookmark
Model Name
Contact
Description
Location
Network Address
Primary Application
Sys Up Time
Manufacturer
Device Type
Serial Number

S P E C T R U M E n t e r p r i s e M a n a g e r P a g e 50 S m a r t S w i t c h 9 0 0 0 / 9 5 0 0
FDDI
This section provides a table of all the FDDI model types, the FDDI Chassis Icons associated with these modeltypes, and general descriptions of the views that are available for the devices represented by these model types.
OverviewBelow is a bulleted list of the main FDDI views for the SmartSwitch 9000, and a brief description of each. Table 12 represents all the FDDI Devices available for the SmartSwitch 9000. In addition, Figure 22 provides an example of FDDI Chassis module icons and the views which can be accessed from it. This figure includes links to examples of the Icon Subviews menus from which these same views can also be accessed.
• FddiMAC Device Configuration View (Page 55). Provides information on the configuration and operating status of the concentrator.
• FDDI Port Configuration View (Page 57). Provides information on the configuration and operating status of the ports.
• Repeater Configuration View (Page 59). Provides information on the configuration and operating status of the network the repeater is monitoring.
• FDDI Station Table View (Page 61). Displays the configuration of the FDDI ring.
• FDDI Stats View (Page 62). Displays the bandwidth statistics of the FDDI ring.

F D D I O v e r v i e w
S P E C T R U M E n t e r p r i s e M a n a g e r P a g e 51 S m a r t S w i t c h 9 0 0 0 / 9 5 0 0
Table 12: FDDI Model Types
Device Model Type Example Device Icon
9F116-01 FDDI Switch Module 9F116-01
9F120-08 MicroLAN Concentrator 9F120-08
9F125-08 MicroLAN Concentrator 9F125-08
9F122-12 MicroLAN Concentrator 9F122-12
9F241-12 Concentrator Module-Dual Attached
9F241-12
9F310-02 FDDI SmartSwitch Module 9F310-02
9F426-02 FDDI SmartSwitch Module 9F426-02
9F426-03 FDDI SmartSwitch Module 9F426-03
Model Name
9F426_02
Model Name
9F426_02

F D D I O v e r v i e w
S P E C T R U M E n t e r p r i s e M a n a g e r P a g e 52 S m a r t S w i t c h 9 0 0 0 / 9 5 0 0
Figure 22: FDDI Chassis Module Icon
8
9F426-02
Model Name
A
B
i 2
f 1
f 2
Ring Identification LabelPort Status Label
FDDI Ring Labels
Bridging
FDDI 1
FDDI 2
FWD
FWD
FWD
BA CON
CON
FDDI Port Labels
Slot NumberModel Type
Module Identification Labels
Model Name
Application Access Label
Interface Type and NumberInterface Status
Interface Labels
(with Ring Number) FDDI Ring Label Icon Subviews Menu Options
Configuration Views
Configuration Views
FDDI Port Label Icon Subviews Menu Selections
1
2
3
4
5
67
8
9
10
11
12
89F120-08
Model Name
FDDI 1
ACT
CON
CON
CON
CON
CON
CON
CON
CON
CON
CON
FDDI 2
1
3
5
ACT
CON
CON
7 CON
CON
Port Number LabelPort Status Label
FDDI Port Labels

F D D I O v e r v i e w
S P E C T R U M E n t e r p r i s e M a n a g e r P a g e 53 S m a r t S w i t c h 9 0 0 0 / 9 5 0 0
FDDI Interface Label IconSubviews Menu OptionsTable 13 describes each of the device-specific Icon Subviews menu selections available for the Interface Label.
Repeater LabelsThese labels display information pertaining to the repeater ports as follows:
Port Number LabelThe number for the port.
Port Status LabelThe current operating status of this port. Table 14 lists the possible conditions values and associated colors.
Frame Rate LabelThe frame traffic rate over this port.
FDDI Ring LabelThis label (see Figure 22) represents the front panel FDDI connection and provides double-click access to the Ring Performance view.
Table 13: Interface Label Icon Subviews Menu
Options Opens the...
Configuration Opens the Port Configuration - CSIIf Port View (Page 24).
Operational Mode Configuration
Opens the Port Configuration view for the selected port. Allows you to either select Standard Mode of Full Duplexing.
Table 14: Repeater Port Status and Conditions Values and Colors
Color Status Description
Green ON Port is operational.
Blue OFF Port is off.
Yellow TST Port is in the test mode.

F D D I O v e r v i e w
S P E C T R U M E n t e r p r i s e M a n a g e r P a g e 54 S m a r t S w i t c h 9 0 0 0 / 9 5 0 0
FDDI Ring Label Icon SubviewsMenu OptionsTable 15 describes each of the device-specific Icon Subviews menu selections available for the FDDI Ring Label.
FDDI Port LabelsThese labels (see Figure 22) display information pertaining to the network interface module ports. These areas are as follows:
Port Number LabelThe port on the ring.
Ring Identification LabelThe ring this port is connected to (A or B).
Port Status LabelThe status of this port. Table 16 lists the possible states and corresponding colors.
Table 15: FDDI Icon Subviews Menu
Options Opens the...
FDDI Performance Performance View on Page 49. (Not available for FddiNoMAC.)
FDDI Configuration FddiMAC Device Configuration View on Page 55.
FDDI Station List FDDI Station Table View on Page 61. (Not available for FddiNoMAC.)
FDDI Bandwidth Util. FDDI Stats View on Page 62.
FDDI Model Information
Model Information View on Page 48.
Table 16: FDDI Port Status and Descriptions
Color State Description
Green ACT Port is active and connected to the FNB.
Blue DIS Port is disabled.
Yellow CON Port is in the connecting state.
Blue - - - A potential connection to the FNB exists but is not made at this time.
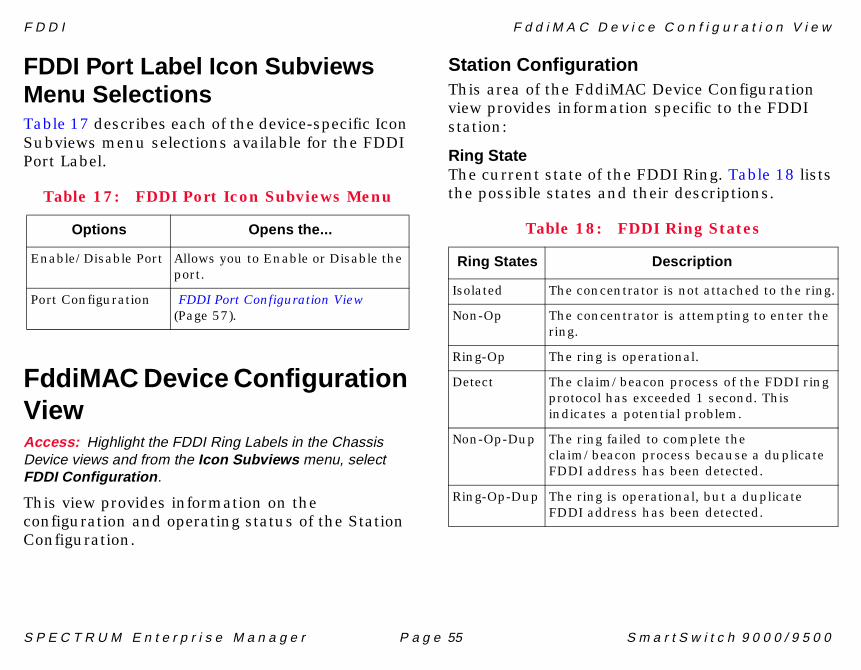
F D D I F d d i M A C D e v i c e C o n f i g u r a t i o n V i e w
S P E C T R U M E n t e r p r i s e M a n a g e r P a g e 55 S m a r t S w i t c h 9 0 0 0 / 9 5 0 0
FDDI Port Label Icon SubviewsMenu SelectionsTable 17 describes each of the device-specific Icon Subviews menu selections available for the FDDI Port Label.
FddiMAC Device ConfigurationViewAccess: Highlight the FDDI Ring Labels in the ChassisDevice views and from the Icon Subviews menu, selectFDDI Configuration .
This view provides information on the configuration and operating status of the Station Configuration.
Station ConfigurationThis area of the FddiMAC Device Configuration view provides information specific to the FDDI station:
Ring StateThe current state of the FDDI Ring. Table 18 lists the possible states and their descriptions.Table 17: FDDI Port Icon Subviews Menu
Options Opens the...
Enable/Disable Port Allows you to Enable or Disable the port.
Port Configuration FDDI Port Configuration View (Page 57).
Table 18: FDDI Ring States
Ring States Description
Isolated The concentrator is not attached to the ring.
Non-Op The concentrator is attempting to enter the ring.
Ring-Op The ring is operational.
Detect The claim/beacon process of the FDDI ring protocol has exceeded 1 second. This indicates a potential problem.
Non-Op-Dup The ring failed to complete the claim/beacon process because a duplicate FDDI address has been detected.
Ring-Op-Dup The ring is operational, but a duplicate FDDI address has been detected.

F D D I F d d i M A C D e v i c e C o n f i g u r a t i o n V i e w
S P E C T R U M E n t e r p r i s e M a n a g e r P a g e 56 S m a r t S w i t c h 9 0 0 0 / 9 5 0 0
MAC ConfigurationThe actual configuration of the station. Table 19 lists the possible configurations and their descriptions.
Directed The claim/beacon process did not complete within 9 seconds. The concentrator is now sending directed beacons to indicate a problem.
Trace A problem has been detected with the station or its upstream neighbor. A trace is being sent to notify the upstream neighbor of the problem. The concentrator and all stations between the concentrator and its upstream neighbor can perform self-tests.
Table 19: SMT MAC Configurations
Ring States Description
Isolated The path is not inserted into any path.
Local_A The A port is inserted into a local path and the B port is not.
Local_B The B port is inserted into a local path and the A port is not.
Local_AB Both A and B are inserted into a local path.
Local_S The S port is inserted into a local path.
Wrap_A The secondary path is wrapped to the A port.
Table 18: FDDI Ring States (Continued)
Wrap_B The secondary path is wrapped to the B port.
Wrap_AB The primary path is wrapped to the B port and the secondary path is wrapped to the A port.
Wrap_S The primary port is wrapped to the S port.
C_Wrap_A The primary and secondary paths are joined internally in the station and wrapped to the A port. Regarding token flow, all resources on the secondary path precede those of the primary path.
C_Wrap_B The primary and secondary paths are joined internally in the station and wrapped to the B port. Regarding token flow, all resources on the secondary path precede those of the primary path.
C_Wrap_S The primary and secondary paths are joined internally in the station and wrapped to the S port. Regarding token flow, all resources on the secondary path precede those of the primary path.
Thru The primary path enters the A port and emerges from the B port. The secondary path enters the B port and emerges from the A port.
Table 19: SMT MAC Configurations

F D D I F D D I P o r t C o n f i g u r a t i o n V i e w
S P E C T R U M E n t e r p r i s e M a n a g e r P a g e 57 S m a r t S w i t c h 9 0 0 0 / 9 5 0 0
Current MAC PathThe ring that this station resides on. Possible entries are: Primary , Secondary , Local , or Isolated .
MAC AddressThe MAC (physical) address of this station.
MAC CountThe number of MACs supported by this station.
Non Master PortsThe number of non-master ports on this station.
Master PortsThe number of master ports on this station.
SMT InformationThis section of the FddiMAC Device Configuration view provides the following configuration information on the FDDI SMT:
SMT VersionThe version of Station Management (SMT) running.
OBS PresentIndicates whether an Optical Bypass Switch (OBS) is connected.
T-Notify (sec)The timer value, in seconds, used in Neighbor Notification Protocol. The allowed range is from 2 to 30 seconds.
T-Req (milli sec)The Target Token Rotation Time (TTRT) bid, in milliseconds, made by this concentrator.
T-Neg (milli sec)The winning TTRT bid, in milliseconds, on the ring.
TVX (milli sec)The valid transmission time, in milliseconds.
FDDI Port Configuration ViewAccess: Highlight the FDDI Port Labels in the ChassisDevice views and from the Icon Subviews menu, selectPort Configuration View .
This view provides information on the configuration and operating status of the ports.
Port ManagementThis section of the FDDI Port Configuration view provides the following information:
Port ActionThis field provides a button that allows you to enable /disable the port. The state returns to

F D D I F D D I P o r t C o n f i g u r a t i o n V i e w
S P E C T R U M E n t e r p r i s e M a n a g e r P a g e 58 S m a r t S w i t c h 9 0 0 0 / 9 5 0 0
“Other” once the port has been Enabled /Disabled .
Port StateThe status of this port. Possible states are: disabled , connecting , standby , and active .
Port TypeThe type of port. Possible port types are: A_Port , B_Port , Slave , or Master .
Link Error Rate EstimateThe link error rate estimate is a cumulative long-term average of the bit error rate, which represents the quality of the physical link. The link error rate estimate is computed when the port is connected and every 10 seconds thereafter. It ranges from 10-4 to 10-15 and is reported as a whole integer. For example, if the port’s link error rate estimate is computed to be 10-5, the value reported in this field would be 5, which represents an actual rate of 1,250 bit errors per second. A lower link error rate estimate indicates a higher bit error rate as shown in Figure 23.
Figure 23:Figure 23:Figure 23:Figure 23: Link Estimate Table
Link Error Monitor CountThe aggregate link error monitor count. This count is set to zero on station power up and increments each time the port’s link error monitor detects an error. An increasing link error monitor count usually indicates a problem with the connectors or the cable between this port and the node.
Link Error Rate CutoffThe link error rate threshold at which a link connection is flagged as faulty and the port disabled by SMT. The default link error rate cutoff threshold is 7, which represents 12.5 bit errors per second.
Bit Errorsper Second
Reported Link Error Rate Estimate (n)

F D D I R e p e a t e r C o n f i g u r a t i o n V i e w
S P E C T R U M E n t e r p r i s e M a n a g e r P a g e 59 S m a r t S w i t c h 9 0 0 0 / 9 5 0 0
Link Error Rate AlarmThe link error rate threshold that, if exceeded, generates an alarm for the port. The default link error rate alarm threshold is 8, which represents 1.25 bit errors per second.
Link Error Monitor Reject CountThe link error monitor count of the times the link has been rejected.
Repeater Configuration ViewAccess: Within the Application views, highlight theCsEnetRptr Icon, and from the Icon Subviews menu, selectConfiguration or from within the Chassis Device views,highlight the Repeater Labels and from the Icon Subviewsmenu, select Repeater Configuration .
This view provides information on the configuration and operating status of the network the repeater is monitoring.
Repeater ManagementThis area of the Repeater Configuration view provides the following port information:
Port CountThe total number of ports on this LAN segment.
Ports OnThe total number of ports currently in the ON state on this network.
Ports OperationalThe number of operational ports on this network.
Network PortsAllows you to select the desired operational state of network ports on this network segment. Valid values are: Enable or NoEnable .
Network Port SecurityAllows you to select the security status of repeater ports. Valid values are: UnLocked or Locked .
Source Address ManagementThis area of the Repeater Configuration view indicates the timeout period, in seconds.
Ageing IntervalThe time, in seconds, that dynamically learned forwarding information remains in the database before being selected.
Trap ConfigurationThis area of the Repeater Configuration view allows you to enable or disable any of the following types of traps.
F D D I R e p e a t e r C o n f i g u r a t i o n V i e w
S P E C T R U M E n t e r p r i s e M a n a g e r P a g e 60 S m a r t S w i t c h 9 0 0 0 / 9 5 0 0
Link TrapsWhen enabled, all packets indicating a change in link status are reported within the trap database. Valid values are: NoEnable , Enable , or other .
Segmentation TrapsWhen enabled, all packets indicating a change in segmentation status are reported within the trap database. Valid values are: NoEnable , Enable , or other .
Source Address TrapsWhen enabled, all packets indicating a change in source address are reported within the trap database. Valid values are: NoEnable , Enable , or other .
Alarm ConfigurationThis area of the Repeater Configuration view provides configuration information on generating alarms for the selected module. The configuration information is as follows:
TimebaseThis field allows you to set the alarm timebase. The timebase is the number of seconds used as the interval for performing all of the rate alarm checks. The minimum is 10 seconds. For example, if the timebase is 10 seconds, an alarm will occur only when the specified number of errors occurs within 10 seconds.
Traffic AlarmsAllows you to turn traffic alarms off and on. Valid values are: NoEnable or Enable .
Traffic ThresholdThe threshold value within the alarm timebase that, once the number of packets is exceeded, generates a traffic alarm.
Collision AlarmsAllows you to turn collision alarms off and on. Valid values are: NoEnable or Enable .
Collision ThresholdThe threshold value within the alarm timebase that, once the number of collisions per good packet is exceeded, generates a collision alarm.
Broadcast AlarmsAllows you to turn broadcast alarms off and on. Valid values are: NoEnable or Enable .
Broadcast ThresholdThe threshold value within the alarm timebase that, once the number of broadcasts received is exceeded, generates a broadcast alarm.
Error AlarmsAllows you to turn error alarms off and on. Valid values are: NoEnable or Enable .

F D D I F D D I S t a t i o n T a b l e V i e w
S P E C T R U M E n t e r p r i s e M a n a g e r P a g e 61 S m a r t S w i t c h 9 0 0 0 / 9 5 0 0
Error ThresholdThe threshold value within the alarm timebase that, once the percentage of errors per good packet is exceeded, generates an error alarm.
Error SourceThis area of the Repeater Configuration view provides a series of buttons allowing you to select the types of errors to include in the error sum. The selectable error types are as follows:
CRCThe number of packets received by the module with bad Cyclical Redundancy Checks (CRCs).
RuntsThe number of runt packets received by the module. A runt packet is one byte less than the standard Ethernet frame of 64 bytes (not including preamble).
OOW_CollsThe number of collisions out of the standard window (51.2�s) due to a network problem.
AlignmentThe number of misaligned packets detected by the module.
No_ResourceThe number of times the module ran out of resources (i.e., lack of buffer space) and could not accept packets.
GiantsThe number of giant packets received by the module. A giant packet exceeds 1518 bytes (not including preamble).
FDDI Station Table ViewAccess: From the Icon Subviews menu for the FddiMACApplication icon, select Fddi Station List .
This view displays the configuration of the FDDI ring, basic information about the devices in the ring, and FDDI network.
Use these buttons to perform the functions listed in the contents of the Station Table.
This button affects the display of the station addressed, toggling between MAC (Physical) and Canonical (Ethernet). This button displays the format NOT currently selected.
Update, Print, Sort and Find
MAC/Canonical

F D D I F D D I S t a t s V i e w
S P E C T R U M E n t e r p r i s e M a n a g e r P a g e 62 S m a r t S w i t c h 9 0 0 0 / 9 5 0 0
Station AddressThe MAC or Canonical address of this node on the ring.
Node ClassThe type of FDDI ring device. Table 20 describes possible node classes.
Ring TopologyThe current state of this FDDI node.
Master PortsThe number of master ports on this node. Values range from 0 to 255.
Upstream NeighborThe canonical or MAC address of the last node to receive the token before this node.
FDDI Stats ViewAccess: From the Icon Subviews menu for the FddiMACApplication Icon, select Bandwidth Util .
The FDDI Stats view displays the bandwidth statistics of the FDDI ring and basic information about the devices on the ring and FDDI network.
Fddi Frames (Frm/Sec)The number of FDDI frames per second for the device.
Fddi KBytes (Kb/Sec)The number of FDDI KBytes per second for the device.
Fddi Peak KBytes (Kb/Sec)The number of FDDI peak KBytes per second for the device.
Time of PeakThe time of peak in Day:Month:Time:Year format for the device.
Bandwidth Utilization%The amount (in percent) of bandwidth utilized by the device. The chart provides a graphical representation of the bandwidth being utilized in bytes/second on the FDDI ring.
Table 20: FDDI Node Classes
Node Class Description
Station An FDDI node capable of receiving, transmitting, and repeating data.
Concentrator An FDDI node that provides attachment points for stations that are not directly connected to the FDDI ring.

S P E C T R U M E n t e r p r i s e M a n a g e r P a g e 63 S m a r t S w i t c h 9 0 0 0 / 9 5 0 0
Token Ring
This section provides a table of all the Token RIng model types, the Token Ring Chassis icons associated withthese model types and general descriptions of the views that are available for the devices represented by thesemodel types.
OverviewBelow is a bulleted list of the main Token Ring views for the SmartSwitch 9000, and a brief description of each. Table 21 displays all the Token Ring Devices available for the SmartSwitch 9000. In addition, Figure 24 provides an example of a Token Ring Chassis module icon and the views which can be accessed from it. This figure includes links to examples of the Icon Subview menus from which these same views can also be accessed.
• Token Ring Configuration View (Page 68). Displays information on the configuration of the Token Ring application.
• TR Ring Configuration View (Page 69). Displays configuration information on the ring to which the ports are attached.
• Token Ring Security Configuration View (Page 71). Provides information on the security configuration for the ring.
• Token Ring Station Table View (Page 72). Displays a Station Table containing information for all stations directly connected to the ring.
• Token Ring Station Isolating Errors View (Page 74). Displays an Isolating Errors Table containing information for all stations directly connected to the ring.

T o k e n R i n g O v e r v i e w
S P E C T R U M E n t e r p r i s e M a n a g e r P a g e 64 S m a r t S w i t c h 9 0 0 0 / 9 5 0 0
Table 21: Token Ring Model Types
Device Device Type Example Device Icon
9T122-08 MicroLAN Switch Extension Module
9T122-08
9T122-24 MicroLAN Switch Module 9T122-24
9T125-08 MicroLAN Switch Module 9T125-08
9T125-24 MicroLAN Switch Extension Module
9T125-24
9T425-16 Token Ring SmartSwitch Module (dual slot)
9T425-16
9T427-16 Token Ring SmartSwitch Module (single slot)
9T427-16
9T428-16 Token Ring SmartSwitch Module (dual slot)
9T428-16
Model Name
9T125-08
Model Name
9T125-08

T o k e n R i n g O v e r v i e w
S P E C T R U M E n t e r p r i s e M a n a g e r P a g e 65 S m a r t S w i t c h 9 0 0 0 / 9 5 0 0
Figure 24: Example Token Ring Chassis Module Icon
8
9T122-08
Model Name
fnb
f 1
f 2
Bridging
FWD
FWD
FWD
T1 16M
T2 16M
1 Frms 0ENB
2 ENB Frms 0
3 Frms 0ENB
4 ENB Frms 0
8
9T122-24
Model Name
fnb
f 1
f 2
Port Number Label
Port Status Label
Token Ring Labels
Bridging
FWD
FWD
FWD
T1 16M
Token Ring Port Labels
Slot NumberModel Type
Module Identification Labels
Model Name
Application Access Label
Interface Type and NumberInterface Status
Interface Labels
Frame Rate Label
(with Ring Number)
Token Ring Label Icon Subviews Menu Selections
Configuration Views
Configuration Views
T2 16M
1 Frms 0ENB
2 ENB Frms 0
3 Frms 0ENB
4 ENB Frms 0
5 Frms 0ENB
6 Frms 0ENB
7 Frms 0ENB
8 Frms 0ENB
Ring Speed Label
RI ACT
RO ACT
RingIn/RingOut Labels
Ring Status Labels

T o k e n R i n g O v e r v i e w
S P E C T R U M E n t e r p r i s e M a n a g e r P a g e 66 S m a r t S w i t c h 9 0 0 0 / 9 5 0 0
Token Ring LabelFigure 24 represents the Token Ring connection and displays the ring number it represents. Double-click this label to access the Token Ring Configuration View (Page 68).
Token Ring Label Icon SubviewsMenu SelectionsTable 22 describes each of the device-specific Icon Subviews menu selections available for the Token Ring Label.
Ring Speed LabelThe speed this ring is configured to operate at (4M or 16M). Double-click on this area to open the Change Ring Speed view for the selected ring. This view allows you to set the desired ring speed.
Token Ring Port LabelsThese labels display information pertaining to the network interface module ports as follows:
Port Number LabelThe port on the ring.
Port Status LabelThe status of this port. Table 23 lists the possible conditions values and associated colors.
Table 22: Token Ring Icon Subviews Menu
Options Open the...
Configuration Token Ring Configuration View (Page 68).
Model Information Model Information View (Page 48).
Stations Token Ring Station Table View (Page 72).
Station Errors Token Ring Station Isolating Errors View (Page 74).
Speed Fault Token Ring Station Detail View (Page 79).
Change Ring Speed Allows you to set the ring speed to 4M or 16M.
Table 23: Port Status Conditions and Colors
Condition Color
INIT (Initial) Gray
ENB (Enabled) Yellow
BYP (Bypassed) Blue
DIS (Disabled) Blue
INS (Inserted) Green
ACT (Active) Green
WRP (Wrapped) Red

T o k e n R i n g O v e r v i e w
S P E C T R U M E n t e r p r i s e M a n a g e r P a g e 67 S m a r t S w i t c h 9 0 0 0 / 9 5 0 0
Frame Rate LabelThe frame traffic rate over this port. Double-click on this area to open the Token Ring Station Detail View (Page 79).
Ring In/Ring Out and Ring StatusLabelsThese labels displays the operational status of the Ring In and the Ring Out.
Token Ring Port Icon SubviewsMenu OptionsTable 24 describes the Icon Subviews menu selections available for Token Ring ports.
Table 24: Token Ring Port Icon Subviews Menu Selections
Options Opens the...
Port Notes Port Notes view, which allows you to attach notes to port view.
Port Configuration Token Ring Configuration View (Page 68).
Station Detail Token Ring Station Detail View (Page 79).
Enable/Disable Port
The Enable/Disable Port view, allowing you to toggle the state of the port.

T o k e n R i n g T o k e n R i n g C o n f i g u r a t i o n V i e w
S P E C T R U M E n t e r p r i s e M a n a g e r P a g e 68 S m a r t S w i t c h 9 0 0 0 / 9 5 0 0
Token Ring ConfigurationViewAccess: Within the Application view, highlight the CsTRAppand from the Icon Subviews menu, select Configuration ,
This view provides information on the configuration of the Token Ring application.
Ring NameThe ASCII name assigned to this ring. This name defaults to Network n, where n is a unique integer value.
Ring NumberThe number of the attached ring. If SPECTRUM cannot determine the number of the ring, a zero is returned.
Ring SpeedThe speed of the ring, which has a value of 4 or 16megabits .
Ring StatusThe operational state of the ring.
Opens the TR Ring Configuration View (Page 69).
Opens the Token Ring Security Configuration View (Page 71).
Opens the Token Ring Station Alarm Thresholds View (Page 78).
Port ConfigurationThis section of the Token Ring Configuration view provides the following information:
Station Ports ON Out OfThe total number of enabled station ports on the addressed module.
Enable All Station PortsAllows you to enable all the station ports in this port group by setting the value to Enable. The default value is NoEnable .
Ring Ports ON Out OfThe total number of enabled ring in/ring out ports in this port group.
Enable All Ring PortsAllows you to enable all the ring ports in this port group by setting the value to Enable. The default value is NoEnable .
Ring Configuration
Ring Security
Alarms Table

T o k e n R i n g T o k e n R i n g C o n f i g u r a t i o n V i e w
S P E C T R U M E n t e r p r i s e M a n a g e r P a g e 69 S m a r t S w i t c h 9 0 0 0 / 9 5 0 0
Host ConfigurationThis section of the Token Ring Configuration view provides the following information:
CommandsAllows you to send commands to the device. Possible commands are: HardwareReset , SoftwareReset , Open, and Close . The default value is NoOperation .
Error Report TimerThe time interval in which the host adapter reports errors to the ring error monitor.
Open StatusThe status of the device, or errors it has received, with respect to insertion into the ring.
Active Monitor ContentionAllows you to prohibit the possibility of the device becoming the active monitor for the ring by setting the proper Allowed or NotAllowed status.
Host Error StatusThis box in the Host Configuration section of the Token Ring Configuration view provides a series of read-only indicator buttons detailing the last error status returned by the Device.
TR Ring Configuration ViewAccess: In the Token Ring Configuration view, click theRing Configuration button.
This view provides configuration information on the ring to which the ports are attached.
Ring ConfigurationThis section of the TR Ring Configuration view displays the following information:
Ring NameThe ASCII name assigned to this ring. This name defaults to Network n, where n is a unique integer value.
Ring NumberThe number of the attached ring. If SPECTRUM cannot determine the number of the ring, a zero is returned.
Ring SpeedThe speed of the ring, which can have a value of 4 or 16 megabits .
Ring StatusThe operational state of the ring.
Active MonitorThe MAC address of the active monitor for the ring. This address will appear in any tables with an asterisk (*) to identify it.

T o k e n R i n g T o k e n R i n g C o n f i g u r a t i o n V i e w
S P E C T R U M E n t e r p r i s e M a n a g e r P a g e 70 S m a r t S w i t c h 9 0 0 0 / 9 5 0 0
Active StationsThe number of active stations currently inserted on the ring.
Beacon RecoveryProvides a button, allowing you to Enable or Disable automatic beacon recovery for the TR MicroLAN Switch Module. When Disabled, the TR MicroLAN Switch Module will not attempt to reinsert itself into the ring after entering a beaconing state. If the device does not support automatic beacon recovery, SPECTRUM will display a status of “Invalid”.
Ring Alarm/Threshold/StateThis section of the TR Ring Configuration view has three columns, displaying information on the ring alarms, their current thresholds, and their states (Enabled or Disabled).
Ring PurgesAllows you to set a value for the Ring Purges alarm threshold, and the state button allows you to Enable or Disable detection of this alarm.
AMP ErrorsAllows you to set a value for the Active Monitor Error alarm threshold, and the state button allows you to Enable or Disable detection of this alarm.
Claim Token ErrorsAllows you to set a value for the Claim Token Errors alarm threshold, and the state button allows you to Enable or Disable detection of this alarm.
Lost FramesThe threshold field allows you to set a value for the Lost Frames alarm threshold, and the state button allows you to Enable or Disable detection of this alarm.
Token ErrorsAllows you to set a value for the Token Errors alarm threshold, and the state button allows you to Enable or Disable detection of this alarm.
Beacon StateAllows you to set a value for the Beacon State alarm threshold, and the state button allows you to Enable or Disable detection of this alarm.
Frame CountAllows you to set a value for the Frame Count alarm threshold, and the state button allows you to Enable or Disable detection of this alarm.
Ring TimebaseAllows you to set the timebase used for getting and setting all alarms pertaining to this ring. This value is measured in seconds.

T o k e n R i n g T o k e n R i n g C o n f i g u r a t i o n V i e w
S P E C T R U M E n t e r p r i s e M a n a g e r P a g e 71 S m a r t S w i t c h 9 0 0 0 / 9 5 0 0
Token Ring SecurityConfiguration ViewAccess: From the Token Ring Configuration views, click theRing Security button .
This view provides information on the security configuration for the ring.
Ring NameThe ASCII name assigned to this ring. This name defaults to Network n, where n is a unique integer value.
Ring NumberThe number of the attached ring. If SPECTRUM cannot determine the number of the ring, a zero is returned.
Ring StatusThe operational state of the ring.
Ring SpeedThe speed of the ring, which can have a value of 4 or 16 megabits .
Administration StateTable 25 displays the valid administration states.
Total Allowed StationsThe total number of stations in the Allowed Stations list.
Allowed Station Address TableThis section of the Token Ring Security Configuration View contains a list of addresses and interface numbers for the stations allowed on the ring. The active monitor for the ring is indicated by an asterisk (*) beside the address. Double-clicking a table entry opens the Modify Allowed Station List View (Page 84). This table has the following buttons:
Table 25: Administration States
State Description
EnabledWithAlarm Generates an alarm upon insertion of an illegal station into the ring.
EnabledWithRemoveAndAlarm
Generates an alarm and also removes the illegal station from the ring.
Disabled Turns off security.

T o k e n R i n g T o k e n R i n g S t a t i o n T a b l e V i e w
S P E C T R U M E n t e r p r i s e M a n a g e r P a g e 72 S m a r t S w i t c h 9 0 0 0 / 9 5 0 0
Allows you to update the contents of the Station Address Table.
Affects the display of the station addresses, toggling the format between MAC (Physical) and Canonical . The button displays the format not currently selected.
Allows you to set a filter affecting the stations displayed in the table. You select an attribute to filter against by clicking one of the column heading buttons.
Allows you to sort the stations displayed in the table. You select an attribute to sort on by clicking one of the column heading buttons.
Opens the Modify Allowed Station List View (Page 84).
Token Ring Station Table ViewAccess: From the Icon Subviews menu of the CsTRApp,select Stations .
This view displays a Station Table containing information for all stations directly connected to the ring. It also displays buttons which manipulate the information in the table, and buttons to access other views.
Ring NameThe ASCII name assigned to this ring. This name defaults to Network n, where n is a unique integer value.
Ring NumberThe number of the attached ring. If SPECTRUM cannot determine the number of the ring, a zero is returned.
Ring SpeedThe speed of the ring, which can have a value of 4 or 16 megabits .
Ring StatusThe operational state of the ring.
Active MonitorThe MAC address of the active monitor for the ring. This address will appear in any tables with an asterisk (*) to identify it.
Update
MAC/Canonical
Set/Clear Filter
Sort Up/Sort Down/Un-Sort
Modify Allowed Station List

T o k e n R i n g T o k e n R i n g S t a t i o n T a b l e V i e w
S P E C T R U M E n t e r p r i s e M a n a g e r P a g e 73 S m a r t S w i t c h 9 0 0 0 / 9 5 0 0
Station AddressThe MAC address of the station to which this information pertains.
Station NameThe ASCII name assigned to this station.
FramesThe total number of frames that have been received/generated by this station.
ErrorsThe total number of errors that this station has detected on the ring.
PortThe number of the port on the token ring module to which this station is connected.
Updates the contents of the Station Table.
Affects the display of statistical information. Selecting Totals displays the statistics as totals since the TR MicroLAN Switch Module was initialized. Selecting Deltas displays the difference between the current value and the value at the time of the last update. The button displays the format currently selected.
This button affects the display of the station addressed, toggling between MAC (Physical) and Canonical (Token Ring). This button displays the format NOT currently selected.
Set Filter Opens the Filter Dialog box for the selected column of the Station table. Type a character string to search the column. Clear Filter returns the Station table to its normal state.
Sort Up organizes the list within a selected column from the lowest alphanumeric value to the highest. Sort Down organizes the list within a selected column from the highest alphanumeric value to the lowest. Unsort returns the fields to its normal state.
Opens the Token Ring Station Isolating Errors View (Page 74).
Opens the Token Ring Station Alarm Thresholds View (Page 78).
Update
Totals/Deltas
MAC/Canonical
Set Filter/Clear Filter
Sort Up/Sort Down/Unsort
Isolating Errors Table
Alarms Table

T o k e n R i n g T o k e n R i n g S t a t i o n T a b l e V i e w
S P E C T R U M E n t e r p r i s e M a n a g e r P a g e 74 S m a r t S w i t c h 9 0 0 0 / 9 5 0 0
Opens the Token Ring Station Detail View (Page 79).
Opens the Station Alarms Dialog Box (Page 81).
Allows you to remove the selected station from the ring.
Token Ring Station IsolatingErrors ViewAccess: Click the Isolating Errors Table button in theToken Ring Station Table view.
This view displays an Isolating Errors Table containing information for all stations directly connected to the ring.
This view provides the following information:
Ring NameThe ASCII name assigned to this ring. This name defaults to Network n, where n is a unique integer value.
Ring NumberThe number of the attached ring. If SPECTRUM cannot determine the number of the ring, a zero is returned.
Ring SpeedThe speed of the ring, which can have a value of 4 or 16 megabits .
Ring StatusThe operational state of the ring.
Active MonitorThe MAC address of the active monitor for the ring. This address appears in all tables with an asterisk (*) to identify it.
Station AddressThe MAC address of the station to which this information pertains.
Station NameThe ASCII name assigned to this station.
LineThe number of line errors that this station has detected on the ring.
BurstThe number of burst errors that this station has detected on the ring.
Station Detail
Station Alarms
Remove Station

T o k e n R i n g T o k e n R i n g S t a t i o n T a b l e V i e w
S P E C T R U M E n t e r p r i s e M a n a g e r P a g e 75 S m a r t S w i t c h 9 0 0 0 / 9 5 0 0
A/CThe number of address/copied errors that this station has detected on the ring.
AbortThe number of abort sequences that this station has sent.
InternalThe number of internal errors that this station has detected.
Updates the contents of the Token Ring Station Isolating Errors Table.
Affects the display of statistical information. Selecting Totals displays the statistics as totals since the TR MicroLAN Switch Module was initialized. Selecting Deltas displays the difference between the current value and the value at the time of the last update. The button displays the format currently selected.
This button affects the display of the station addressed, toggling between MAC (Physical) and
Canonical (Token Ring). This button displays the format NOT currently selected.
Set Filter opens the Filter Dialog box for the selected column of the Station table. Type a character string to search the column.
Clear Filter returns the Station table to its normal state.
Sort Up organizes the list within a selected column from the lowest alphanumeric value to the highest.
Sort Down organizes the list within a selected column from the highest alphanumeric value to the lowest.
Unsort returns the fields to its normal state.
Opens the Token Ring Station Non-Isolating Errors View.
Opens the Token Ring Station Alarm Thresholds View (Page 78).
Update
Totals/Deltas
MAC/Canonical
Set Filter/Clear Filter
Sort Up/Sort Down/Unsort
Non-Isolating Errors
Alarms Table

T o k e n R i n g T o k e n R i n g S t a t i o n T a b l e V i e w
S P E C T R U M E n t e r p r i s e M a n a g e r P a g e 76 S m a r t S w i t c h 9 0 0 0 / 9 5 0 0
Opens the Token Ring Station Detail View (Page 79).
Opens the Station Alarms Dialog Box (Page 81).
Removes the selected station from the ring.
Token Ring Station Non-IsolatingErrors ViewAccess: From the Token Ring Station Isolating Errors view,click Non-Isolating Errors Table button.
This view displays information for all stations directly connected to the ring.
Ring NameThe ASCII name assigned to this ring. This name defaults to Network n, where n is a unique integer value.
Ring NumberThe number of the attached ring. If SPECTRUM cannot determine the number of the ring, a zero is returned.
Ring SpeedThe speed of the ring, which can have a value of 4 or 16 megabits .
Ring StatusThe operational state of the ring.
Active MonitorThe MAC address of the active monitor for the ring. This address will appear in any table with an asterisk (*) to identify it.
Station AddressThe MAC address of the station to which this information pertains.
Station NameThe ASCII name assigned to this station.
Lost FramesThe number of lost frames that this station has detected on the ring.
CongestionsThe number of congestion errors that have occurred at this station.
FrameCopiedThe number of frame copied errors that this station has detected on the ring.
Station Detail
Station Alarms
Remove Station

T o k e n R i n g T o k e n R i n g S t a t i o n T a b l e V i e w
S P E C T R U M E n t e r p r i s e M a n a g e r P a g e 77 S m a r t S w i t c h 9 0 0 0 / 9 5 0 0
TokenThe number of token errors that this station has detected on the ring while it was acting as the active monitor.
FrequencyThe number of frequency errors that this station has detected on the ring.
Updates the contents of the Token Ring Station Non-Isolating Errors Table.
Affects the display of statistical information. Selecting Totals displays the statistics as totals since the TR MicroLAN Switch Module was initialized. Selecting Deltas displays the difference between the current value and the value at the time of the last update. The button displays the format currently selected.
This button affects the display of the station addressed, toggling between MAC (Physical) and Canonical (Token Ring). This button displays the format NOT currently selected.
Set Filter opens the Filter Dialog box for the selected column of the Station table. Type a character string to search the column
Clear Filter returns the Station table to its normal state.
Sort Up organizes the list within a selected column from the lowest alphanumeric value to the highest.
Sort Down organizes the list within a selected column from the highest alphanumeric value to the lowest.
Unsort returns the fields to its normal state.
Opens the Token Ring Station Alarm Thresholds View (Page 78).
Opens the Token Ring Station Detail View (Page 79).
Update
Totals/Deltas
MAC/Canonical
Set Filter/Clear Filter
Sort Up/Sort Down/Unsort
Alarms Table
Station Detail

T o k e n R i n g T o k e n R i n g S t a t i o n T a b l e V i e w
S P E C T R U M E n t e r p r i s e M a n a g e r P a g e 78 S m a r t S w i t c h 9 0 0 0 / 9 5 0 0
Opens the Station Alarms Dialog Box (Page 81).
Removes the selected station from the ring.
Token Ring Station Alarm Thresholds ViewAccess: From the Token Ring Station Non-Isolating Errorsview, click the Alarm Table button.
This view displays information for all stations directly connected to the Token Ring.
Ring NameThe ASCII name assigned to this ring. This name defaults to Network n, where n is a unique integer value.
Ring NumberThe number of the attached ring. If SPECTRUM cannot determine the number of the ring, a zero is returned.
Ring SpeedThe speed of the ring, which can have a value of 4 or 16 megabits .
Ring StatusThe operational state of the ring.
Active MonitorThe MAC address of the active monitor for the ring. This address will appear in any tables with an asterisk (*) to identify it.
Station AddressThe MAC address of the station to which this information pertains.
Station NameThe ASCII name assigned to this station.
LineThe threshold setting for line errors on the device.
BurstThe threshold setting for burst errors on the device.
A/CThe setting for address/copied errors on the device.
InternalThe threshold setting for internal errors on the device.
CongestionsThe threshold setting for congestion errors.
Updates the Station Alarm Thresholds Table.
Station Alarms
Remove Station
Update

T o k e n R i n g T o k e n R i n g S t a t i o n T a b l e V i e w
S P E C T R U M E n t e r p r i s e M a n a g e r P a g e 79 S m a r t S w i t c h 9 0 0 0 / 9 5 0 0
This button affects the display of the station addressed, toggling between MAC (Physical) and Canonical (Token Ring). This button displays the format NOT currently selected.
Set Filter opens the Filter Dialog box for the selected column of the Station table. Type a character string to search the column.
Clear Filter returns the Station table to its normal state.
Sort Up organizes the list within a selected column from the lowest alphanumeric value to the highest.
Sort Down organizes the list within a selected column from the highest alphanumeric value to the lowest.
Unsort returns the field to its normal state.
Opens the Token Ring Station Alarm States View, which provides the same button functions and fields as the Token Ring Station Alarm Thresholds
View (Page 78), but displays information on the state of each alarm threshold (Enabled or Disabled).
Opens the Token Ring Station Detail View.
Opens the Station Alarms Dialog Box (Page 81).
Allows you to remove the selected station from the ring.
Token Ring Station Detail ViewAccess: From the Token Ring Station Alarm Thresholdsview, click the Station Detail button.
This view includes three color-coded pie charts presenting a breakdown of token ring application statistics. Each statistic is presented as a total amount since the device was initialized, and as a percentage of overall traffic.
Station AddressThe MAC address of the station for which the information in this table pertains.
Station NameThe ASCII name assigned to this station.
MAC/Canonical
Set Filter/Clear Filter
Sort Up/Sort Down/UnSort
Alarm States Table
Station Detail
Station Alarms
Remove Station

T o k e n R i n g T o k e n R i n g S t a t i o n T a b l e V i e w
S P E C T R U M E n t e r p r i s e M a n a g e r P a g e 80 S m a r t S w i t c h 9 0 0 0 / 9 5 0 0
Station PortThe number of the port on the token ring module to which this station is connected.
UpstreamThe MAC address of the device (neighbor) immediately upstream of the station on the ring.
DownstreamThe MAC address of the device (neighbor) immediately downstream of the station on the ring.
Opens the Token Ring Station Alarms Configuration View, which allows you to change the threshold value and state of the station for the Line, Burst, A/C, Internal, and Receive Congestion errors.
Station RemovalAllows you to modify the removal state of the station and displays the last request made of the device. Remove causes the station to remove itself from the ring, NotRemovable disables removal from the ring, and DoNotRemove is the default setting and does not affect the station.
Station PriorityThe station’s maximum access priority.
Pie ChartsTable 26 through Table 28 list the statistics and definitions for each of the pie charts displayed in this view.
Configure Station Alarms
Table 26: Frame Breakdown Pie Chart
Statistic Definition
Frames The total frames detected on this station or ring.
Errors The total errors detected by this station or ring.

T o k e n R i n g T o k e n R i n g S t a t i o n T a b l e V i e w
S P E C T R U M E n t e r p r i s e M a n a g e r P a g e 81 S m a r t S w i t c h 9 0 0 0 / 9 5 0 0
Station Alarms Dialog BoxAccess: From the Token Ring Station Alarm Thresholdview, click the Stations Alarms button.
The Station Alarms dialog box allows you to read, display, and modify the alarm settings for a single station or list of stations. The list displays the stations that were on the ring at the time the dialog box was opened. You can read and modify the settings to a valid station that does not appear in the list and was added after opening the view by entering its address in the Station field.
Table 27: Non-Isolating Errors Pie Chart
Statistic Definition
Lost Frames The total number of times a station has had its Token Ring Rotation (TRR) timer expire trying to transmit.
Congestions The total number of times a station recognizes a frame addressed to it, but the station has no available buffer space.
Frame Copied The total number of times a station recognizes a frame addressed to it, and detects that the FS field A bits are set to 1.
Token The total number of times the station acting as active monitor recognizes an error condition requiring a token be transmitted.
Frequency The total frequency errors on this ring.
Table 28: Isolating Errors Pie Chart
Statistic Definition
Line The number of line errors that have occurred on this ring.
Burst The number of burst errors that have occurred on this ring.
A/C The number of address/copied errors that have occurred on this ring.
Abort Sequence
The number of abort sequences transmitted on this ring.
Internal The number of internal errors detected by a station on this ring.

T o k e n R i n g T o k e n R i n g S t a t i o n T a b l e V i e w
S P E C T R U M E n t e r p r i s e M a n a g e r P a g e 82 S m a r t S w i t c h 9 0 0 0 / 9 5 0 0
StationThe address of the current station. You can enter the address of a valid station in this field to make it the current station.
AlarmThe threshold alarms that can be manipulated. The alarms in this column include: Line , Internal , Burst , A/C , and Congestion .
ThresholdThe current setting for each corresponding alarm threshold. You can change the values by selecting the field and editing the number.
StateThe state of each corresponding alarm threshold. Valid values are: Enable or Disable .
StationsThe MAC addresses of all stations in the ring at the time the dialog box was opened except the current station, which is displayed in the Apply Settings to list. Double-clicking on an address in this list moves it to the Apply Settings to list.
Apply Settings toThe MAC addresses of all stations to which the threshold settings may be applied. This list always contains the current station’s MAC address upon opening the dialog box. Double-
clicking on an address in this list moves it to the Stations list.
Moves the selected item from the Stations list to the Apply Settings to list.
Moves the selected item from the Apply Settings to list to the Stations list.
Moves all of the stations from the Stations list to the Apply Settings to list. The current station remains at the top of the Apply Settings to list if it is a valid station.
Moves all of the stations from the Apply Settings to list to the Stations list. The current station remains at the top of the Apply Settings to list if it is a valid station.
Applies the threshold settings to the stations listed in the Apply Settings to list or the station entered into the Station field if the list is empty.
>
<
>>
<<
Apply

T o k e n R i n g T o k e n R i n g S t a t i o n T a b l e V i e w
S P E C T R U M E n t e r p r i s e M a n a g e r P a g e 83 S m a r t S w i t c h 9 0 0 0 / 9 5 0 0
Initiates a read of the threshold settings for the selected station or the station entered into the Station field.
Exits the dialog box without applying settings to the stations or once you have applied all changes and wish to exit.
Modifying Threshold SettingsTo change the threshold settings for one or more stations, follow these steps:
1 Move the addresses of all the stations to be modified to the Apply Settings to list. If you are only modifying the current station, this step is not necessary. If you wish to modify a valid station that does not appear in the list, enter its MAC address into the Station field. For information on how to move addresses between lists, refer to the buttons described earlier in this section.
2 Select the desired settings to be applied to the current station and all stations in the Apply Settings to list by clicking on Enable or Disable for each alarm threshold and typing a value into each Threshold field.
3 Click Apply.
If the new alarm thresholds cannot be written to the device due to the device being down, an error message appears and you should try again later.
Reading Thresholds from a StationTo read the current threshold settings from any station, follow these steps:
1 Select the station to be read from the Stations or Apply Settings to list. If you are reading from the current station, this step is not necessary. If you wish to modify a valid station that does not appear in either list, enter its MAC address into the Station field.
2 Click Read. The threshold settings for the selected station are read from the device.
Read
Cancel

T o k e n R i n g T o k e n R i n g S t a t i o n T a b l e V i e w
S P E C T R U M E n t e r p r i s e M a n a g e r P a g e 84 S m a r t S w i t c h 9 0 0 0 / 9 5 0 0
Modify Allowed Station List ViewAccess: Within Token Ring Security Configuration view,click the Modify Allowed Station List button
This view allows you to modify the security for the ring by adding or removing stations from the ring’s list of allowed stations.
Security Administration StateThis section allows you to choose the level of security for the ring. You may only select one option at a time. Click on the desired option to select it. The buttons indent to indicate the selected option.
DisableDisables the ring security. All stations are allowed on the ring.
Enable with AlarmEnables the ring security, and any station entering the ring will generate an alarm unless it
is on the secure list. The device will place the station address on the Allowed Stations list.
Enable with Remove and AlarmEnables the ring security, and any station not on the secure list that enters or currently resides on the ring will generate an alarm and be removed from the ring.
Allowed StationsThe list of stations currently allowed on the ring. Double-clicking on an item in the list moves it to the Disallowed Stations window. However, you cannot move a station from the Allowed Stations window if the security is set to Enable withAlarm . A symbol (>) indicates that this station has recently been moved to the Disallowed Stations window from the Allowed Station window, and will remain until the changes are applied.
Disallowed StationsActs as a scratch pad or buffer to store addresses currently disallowed on the ring, but you may want to move to the Allowed Stations window in the future. The ring does not read this buffer to deny ring access to certain stations, but rather denies access to all stations not explicitly listed in the Allowed Stations window. Double-clicking on an item in the list will move it to the Allowed Stations window. A symbol (<) indicates that this station has recently been moved to the Allowed
CautionCaution
Do not attempt to modify Ring Security without a complete understanding of Token Ring concepts. Removal of the station acting as the connecting bridge from the Ring Security Allowed Station List can cause isolation from the ring.

T o k e n R i n g T o k e n R i n g S t a t i o n T a b l e V i e w
S P E C T R U M E n t e r p r i s e M a n a g e r P a g e 85 S m a r t S w i t c h 9 0 0 0 / 9 5 0 0
Stations window from the Disallowed Station window, and will remain until the changes are applied.
Moves the selected station from the Allowed Stations window to the Disallowed Stations window. A symbol (>) indicates that this station has recently been moved to the Disallowed Stations window from the Allowed Station window, and will remain until the changes are applied. You cannot move a station from the Allowed Stations window if the security is set to Enable with Alarm.
Moves the selected station from the Disallowed Stations window to the Allowed Stations window. A symbol (<) indicates that this station has recently been moved to the Allowed Stations window from the Disallowed Stations window, and will remain until the changes are applied.
Allows you to add a new station. The station address must be added in valid hex MAC address form, and valid separators are the colon (:), period (.), and dash (-). You can add the new station to
either the Allowed or Disallowed Station window by selecting the appropriate option in the ADD Station dialog box. A symbol (+) indicates that this station has recently been added, and will remain until the changes are applied. Selecting a recently added and still marked (+) station and clicking DELETE will remove it from the window.
Allows you to remove the selected station (refer to the CAUTION earlier in this section). You may remove any station address except that belonging to the device itself, or a station from the Allowed Stations window if the security is set to Enable with Alarm. A symbol (-) indicates that this station has been marked for removal, and will remain until the changes are applied, at which time the station is actually removed from the window. Selecting the station and clicking ADD will remove the symbol (-) and unmark the station for removal. This button will also remove a station marked with the symbol (+).
Allows you to remove all of the stations in the Allowed Stations window (refer to the CAUTION earlier in this section). A symbol (-) marks all of the items in the window, indicating that the stations have been designated for removal, and
>
<
ADD
DELETE
Delete All Allowed Stations

T o k e n R i n g T o k e n R i n g S t a t i o n T a b l e V i e w
S P E C T R U M E n t e r p r i s e M a n a g e r P a g e 86 S m a r t S w i t c h 9 0 0 0 / 9 5 0 0
will remain until the changes are applied, at which time the stations are actually removed from the window. This option will remove all station addresses except that belonging to the device itself. Selecting a station and clicking ADD will remove the symbol (-) and unmark that station for removal.
Applies all changes made to the Allowed and Disallowed Stations windows, writing the list from the Allowed Stations window to the device and from the Disallowed Stations window to SPECTRUM, and removes all indicator markings from the modified stations.
Updates the Allowed and Disallowed Stations windows by reading the saved values from both the device and SPECTRUM. This serves to reset any changes you made to either window but did not apply.
Exits from the view. Only changes that have been applied will be saved.
Changing the Ring Security StateTo change the level of ring security, follow these steps:
1 Click on the desired security option.
2 Click Apply and then select OK in the confirmation window.
If the new security state cannot be written to the device, a Cannot Update error message appears. There may be a problem contacting the device, or the firmware may not have updated. Click Read before attempting another update.
Adding StationsTo add stations to the view, follow these steps:
1 Click ADD. A pop-up dialog box appears.
2 Enter the station address in the text entry field following the guidelines described in the ADD button description.
3 Select the option corresponding to the list you want to add the station to (Allowed or Disallowed) and click Apply.
If the new station cannot be written to the device, a Cannot Update error message appears. There may be a problem contacting the device, or the address you are trying to add to the station’s allowed list may already exist. Click Read before attempting another update.
Apply
Read
Cancel

S P E C T R U M E n t e r p r i s e M a n a g e r P a g e 87 S m a r t S w i t c h 9 0 0 0 / 9 5 0 0
ATM
This section provides a table of all ATM model types, the ATM Chassis icons associated with these model types,and general descriptions of the views that are available for the devices represented by these model types.
OverviewBelow is a bulleted list of the main ATM views for the SmartSwitch 9000, and a brief description of each. Table 29 represents all the ATM Devices available for the SmartSwitch 9000. In addition, Figure 25 provides an example of an ATM Chassis module icon and the views which can be accessed from it. This figure includes links to examples of the Icon Subview menus from which these same views can also be accessed.
• ATM Client Application Configuration View (Page 91). This view provides configuration information on the ATM Client Application.
• ATM Interface Detail View (Page 92). This view displays cell performance breakdown information for ATM.
• SFCS Configuration Views (Page 93). These views provide detailed information on each virtual switch contained within the device.
• SFCS Module Views (Page 96). These views provide information for each SFCS module contained within the device.
• ANIM Configuration Table View (Page 98). These views provide you with information on each ANIM contained within the device.
• SFCS IF Views (Page 99). These views provide detailed information on the switching interfaces contained within the device.
• SFCS Connection Views (Page 100). These views provide detailed information on all connections contained within the device.
• SFCS Queue Views (Page 102). These views contain detailed information about all the queues maintained within the device.
• SFCS CTM Views (Page 103). These views provide detailed information for the CTM backplane contained within the device.

A T M O v e r v i e w
S P E C T R U M E n t e r p r i s e M a n a g e r P a g e 88 S m a r t S w i t c h 9 0 0 0 / 9 5 0 0
• SFCS Bandwidth Management Views (Page 106). These views contain detailed information about bandwidth accessed and used by this device.
Note:Note:
The SFCS views are only accessible from the 9A656-04 and 9A686-04 models.

A T M O v e r v i e w
S P E C T R U M E n t e r p r i s e M a n a g e r P a g e 89 S m a r t S w i t c h 9 0 0 0 / 9 5 0 0
* The 9A000 was developed for Cabletron by Fore Systems and is discussed in the ForeRunner ATM Switch.
Table 29: ATM Model Types
Device Model Type Example Device Icon
9A000 Switch Module * 9A000
9A128-01 Access Module-FNB 9A128-01
9A426-01 Access Module-FNB and INB 9A426-01
9A426-02 Access Module-FNB and INB 9A426-02
9A656-04 SmartCell Switch 9A656-04
9A686-04 SmartCell Switch 9A686-04
Model Name
9A128-01
Model Name
9A128-01
Model Name
SFSmartCell
Model Name
SFSmartCell

A T M O v e r v i e w
S P E C T R U M E n t e r p r i s e M a n a g e r P a g e 90 S m a r t S w i t c h 9 0 0 0 / 9 5 0 0
Figure 25: ATM Chassis Module Icon
Application Access Label
Model Information View
Configuration Views
Slot NumberModel Type
Module Identification Labels
fnb
atm
89A128-01
Model Name
Bridging
FWD
FWD
Interface Type
Interface Status
Interface Labels
Model Name
401
402
149A686-04
Model Name
Physical
OFF
ON
403 ON
Model Information View
Configuration Views

A T M A T M C l i e n t A p p l i c a t i o n C o n f i g u r a t i o n V i e w
S P E C T R U M E n t e r p r i s e M a n a g e r P a g e 91 S m a r t S w i t c h 9 0 0 0 / 9 5 0 0
ATM Client ApplicationConfiguration ViewAccess: Highlight the ATM Application Icon, and from theIcon Subviews , select ATM Configuration .
This view provides configuration information on the ATM Client Application.
Configuration Table
Max VPCs (Virtual Path Connections)The maximum number of VPCs supported at this ATM interface. At the UNI (User Network Interface), the maximum number of VPCs ranges from 0 to 256.
Max VCCs (Virtual Channel Connections)The maximum number of VCCs supported at this ATM interface.
Conf VPCsThe number of VPCs configured for use at this ATM interface. At the UNI, the configured number of VPCs ranges from 0 to 256.
Conf VCCsThe number of VCCs configured for use at this ATM interface.
Max VPI (Virtual Path Identifier) BitsThe maximum number of active VPI bits configured for use at this ATM interface. At the UNI, the maximum number of active VPI bits configured for use ranges from 0 to 8.
Max VCI (Virtual Channel Identifier) BitsThe maximum number of active VCI bits configured for use at this ATM interface.
ILMI (Interim Local Management Interface) VPIThe VPI value of the VCC supporting the ILMI at this ATM interface. If the values of both ILMI VPI and ILMI VCI equal 0, then the ILMI is not supported.
ILMI VCIThe VCI value of the VCC supporting the ILMI at this ATM interface. If the values of both ILMI VPI and ILMI VCI equal 0, then the ILMI is not supported for this ATM interface.
Address TypeThe type of primary ATM address configured for use at this ATM interface.
Admin AddressThe address assigned for administrative purposes.

A T M A T M I n t e r f a c e D e t a i l V i e w
S P E C T R U M E n t e r p r i s e M a n a g e r P a g e 92 S m a r t S w i t c h 9 0 0 0 / 9 5 0 0
Neighbor AddressThe IP address of the neighbor system at the far end of this interface to which a Network Management Station can access network management information.
Neighbor If NameThe name of the interface on the neighbor system at the far end of this interface, to which this interface connects. If the neighbor system is manageable through SNMP and supports the object ifName, the value of this object must be identical to that of the ifName for the ifEntry of the lowest level physical interface for this port. If this interface does not have a name, the value of this object is a zero length string.
ATM Interface Detail ViewAccess: From the Icon Subviews menu for the ATMInterface Icon, select Detail .
This view displays cell performance breakdown information for ATM as shown in Figure 26.
ReceivedThe number of cells received by the switch.
TransmittedThe number of cells transmitted by the switch.
HEC ErrorsThe number of Header Error Control Errors.
TotalThe total number of cells.
Figure 26:Figure 26:Figure 26:Figure 26: ATM Interface Detail View
Cell Breakdown
Total Delta
HEC Errors
TransmittedReceived
Total
Accum
value
value
value
value
0.00%
0.00%0.00%
Clear
Chart sections comparing received and transmitted values.
Names and values of models being compared.
Background colors match chart sections
Current values (will vary depending on mode selected).
Percent of total pie.
Mode selection buttons.

A T M S F C S S y s t e m C o n f i g u r a t i o n V i e w
S P E C T R U M E n t e r p r i s e M a n a g e r P a g e 93 S m a r t S w i t c h 9 0 0 0 / 9 5 0 0
SFCS System ConfigurationViewAccess: From the Icon Subviews for a SFCS Device icon,select SFCS System > Configuration .
This view contains information used to set up and configure each Virtual Switch. It contains the following information:
Admin StatusSets the administrative state of the Secure Fast Cell Switching (SFCS) services for this virtual switch. This controls the SFCS state at a chassis level. Regardless of the per-interface state of each SFCS switching element and the state of active connections, writing the value disabled causes the entire switch to immediately shutdown.
Oper StatusThe current operating condition of this switch. Possible values are described in Table 30.
Oper TimeThe amount of time that this switch system has been in its current operational state.
Last ChangeThe last time a change was made to the configuration entry for this switch.
Switch CapacityThe maximum capacity of the switch in megabytes.
Max Cnx EntriesThe maximum number of connections which can be established on this switch.
Table 30: Operating Status Values
Value Description
enabled Running.
disabled Not running.
pending-disable Shut-down in progress.
pending-enable Start-up in progress.
invalid-config Not running, invalid configuration.
other None of the above.

A T M S F C S S y s t e m C o n f i g u r a t i o n V i e w
S P E C T R U M E n t e r p r i s e M a n a g e r P a g e 94 S m a r t S w i t c h 9 0 0 0 / 9 5 0 0
Max Stat EntriesThe maximum number of stats enabled VCs for this switch.
Max UPC EntriesThe maximum number of UPC enabled VCs for this switch.
Firmware VersionThe Firmware Version of the switch.
ANIM CountThe number of ATM Network Interface Modules (ANIMs) currently configured on this switch.
Interface CapabilityThe total bandwidth capability (transmit and receive) for this switch expressed in Mbps.
Type of SwitchIndicates what type of switch this is.
Policing SupportIndicates whether this switch supports policing.
CTM Slot MaskThe slot mask for all CTM boards in the chassis. The least significant bit represents slot 1.
PNNI NSAP PrefixThe 13-byte Network Server Access Point (NSAP) prefix to use with address registration.
PNNI Node LevelThe PNNI node level value. The range can be from 0 to 104.
PNNI Addressing ModeThe PNNI addressing mode. Possible modes are listed in Table 31.
PNNI Addressing Admin StatusThe PNNI addressing administrative status. Valid values are: Up and Down.
Table 31: PNNI Addressing Modes
Mode Description
automode-MAC Address configured automatically, based on MAC address.
automode-board Address configured automatically, based on board number.
manual Address configured manually.

A T M S F C S S y s t e m S t a t u s V i e w
S P E C T R U M E n t e r p r i s e M a n a g e r P a g e 95 S m a r t S w i t c h 9 0 0 0 / 9 5 0 0
SFCS System Status ViewAccess: From the Icon Subviews for a SFCS Device icon,select SFCS System > Status .
This table contains the objects that pertain to the operational status of a Virtual Switch. It provides the following:
TDM Cell CountThe total number of cells being transferred across the Time Division Multiplexing (TDM) backplane for the entire switch.
Current UPC EntriesThe current number of Usage Parameter Control (UPC) entries for this switch.
TDM UtilizationThe total percentage of TDM utilization for the switch.
Current Stat EntriesThe current number of statistics entries for this switch.
Current Connection EntriesThe current number of connection entries for this switch.
SFCS System ConfigurationViewAccess: From the Icon Subviews for a SFCS Device icon,select SFCS System > System Configuration .
The following information pertains to the setup and configuration of the Virtual Switch.
Admin ResetResets this Virtual Switch. Writing a value of reset will force a restart of the entire switch, without any graceful shutdown. Any active connections or services will be interrupted.
ATOM PersistenceThis enables or disables ATOM mib persistence.
VC SizeThe size of Virtual Connections (VCs) allocated for all Virtual Paths (VPs) in the switch.
Power Up DiagnosticsEnables or disables power-up diagnostics.
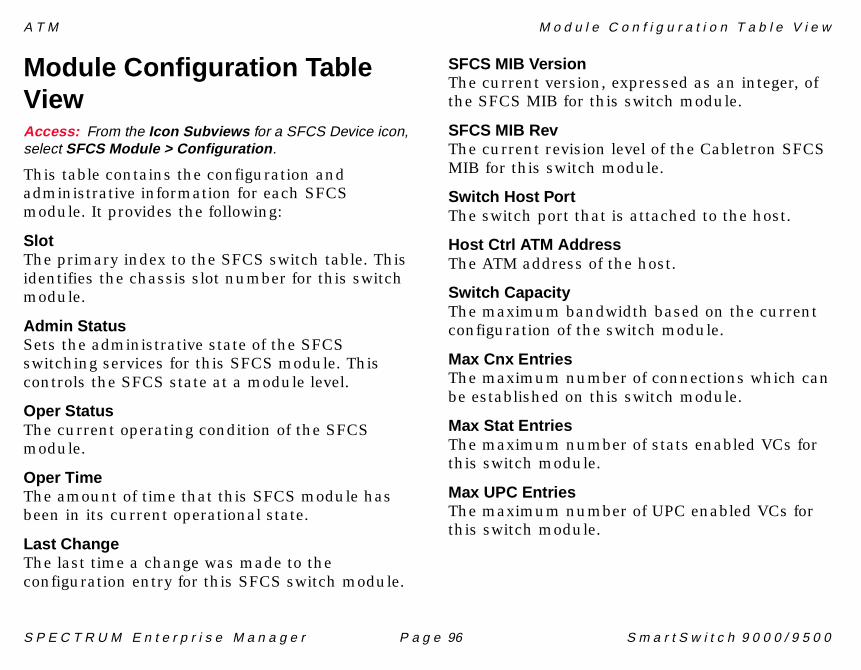
A T M M o d u l e C o n f i g u r a t i o n T a b l e V i e w
S P E C T R U M E n t e r p r i s e M a n a g e r P a g e 96 S m a r t S w i t c h 9 0 0 0 / 9 5 0 0
Module Configuration TableViewAccess: From the Icon Subviews for a SFCS Device icon,select SFCS Module > Configuration .
This table contains the configuration and administrative information for each SFCS module. It provides the following:
SlotThe primary index to the SFCS switch table. This identifies the chassis slot number for this switch module.
Admin StatusSets the administrative state of the SFCS switching services for this SFCS module. This controls the SFCS state at a module level.
Oper StatusThe current operating condition of the SFCS module.
Oper TimeThe amount of time that this SFCS module has been in its current operational state.
Last ChangeThe last time a change was made to the configuration entry for this SFCS switch module.
SFCS MIB VersionThe current version, expressed as an integer, of the SFCS MIB for this switch module.
SFCS MIB RevThe current revision level of the Cabletron SFCS MIB for this switch module.
Switch Host PortThe switch port that is attached to the host.
Host Ctrl ATM AddressThe ATM address of the host.
Switch CapacityThe maximum bandwidth based on the current configuration of the switch module.
Max Cnx EntriesThe maximum number of connections which can be established on this switch module.
Max Stat EntriesThe maximum number of stats enabled VCs for this switch module.
Max UPC EntriesThe maximum number of UPC enabled VCs for this switch module.

A T M M o d u l e S t a t u s T a b l e V i e w
S P E C T R U M E n t e r p r i s e M a n a g e r P a g e 97 S m a r t S w i t c h 9 0 0 0 / 9 5 0 0
Number of ANIMSThe number of ATM Network Interface Modules (ANIMs) currently configured on this switch module.
BW CapabilityThe total bandwidth capability for this switch engine, expressed in Mbps.
Module Status Table ViewAccess: From the Icon Subviews for a SFCS Device icon,select SFCS Module > Status .
This table contains the status information for each SFCS switch module. It provides the following:
SlotThe primary index to the SFCS switch table. This identifies the chassis slot number for this SFCS module.
TDM Cell CountThe total number of cells being transferred across the TDM backplane for this switch module.
TDM UtilizationThe percentage of TDM utilization for this switch module.
Curr Cnx EntriesThe current number of connection entries for this switch module.
Curr UPC EntriesThe current number of UPC entries for this switch module.
Curr Stats EntriesThe current number of statistics entries for this switch module.
Curr CTM AgentThe current board number.
Module UPC Table ViewAccess: From the Icon Subviews for a SFCS Device icon,select SFCS Module > Usage Parameter Control .
This table contains the Usage Parameter Control (UPC) information for this SFCS module. It provides the following:
Slot IndexThe primary index to the SFCS switch table. This identifies the slot number for this SFCS module.
Admin StatusSets the administrative state of the SFCS module's UPC engine.

A T M S t a t i s t i c s E n g i n e T a b l e V i e w
S P E C T R U M E n t e r p r i s e M a n a g e r P a g e 98 S m a r t S w i t c h 9 0 0 0 / 9 5 0 0
Oper StatusThe operational state of the SFCS module's UPC engine.
Oper TimeThe amount of time that the UPC engine has been active for this switch module.
ResetResets the UPC engine for this SFCS module.
Statistics Engine Table ViewAccess: From the Icon Subviews for a SFCS Device icon,select SFCS Module > Statistics Engine .
This table contains information for the Statistics Engine for a particular switch module. It provides the following:
Slot IndexThe primary index to the SFCS statistics engine table. This identifies the chassis slot number for this SFCS module.
Admin StatusSets the administrative state of the SFCS switch statistics engine.
Oper StatusThe operational state of the SFCS switch statistics engine for this switch module.
Oper TimeThe amount of time that the SFCS switch statistics have been active for this switch module.
ResetResets the SFCS switch counters for this SFCS module. Writing a value of reset resets the SFCS switch counters to 0 and causes Oper Time to also be reset to “0.”
ANIM Configuration TableViewAccess: From the Icon Subviews for a SFCS Device icon,select SFCS ANIM > Configuration .
This table contains the managed objects used to set up and configure each SFCS ANIM. It contains the following:
ANIM IndexThe ATM Network Interface Module (ANIM) with which you are dealing.
Admin StatusSets the administrative state of the SFCS switch ANIM.
Oper StatusThe operational state of the SFCS switch ANIM for this SFCS ANIM instance.

A T M A N I M S t a t u s T a b l e V i e w
S P E C T R U M E n t e r p r i s e M a n a g e r P a g e 99 S m a r t S w i t c h 9 0 0 0 / 9 5 0 0
ANIM TypeThe type of physical interface for this ANIM.
Number of IfsThe number of operational interfaces for this ANIM.
Line RateThe line rate per port, in Mbps, for this ANIM.
ANIM Status Table ViewAccess: From the Icon Subviews for a SFCS Device icon,select SFCS ANIM > Status .
This table contains the managed objects used to keep track of, transmit, receive counts and bandwidth for each SFCS ANIM.
ANIM IndexA unique value that specifies the ANIM with which you are dealing.
Rx CellsThe number of cells received from this ANIM's interfaces.
Tx CellsThe number of cells transmitted from this ANIM's interfaces.
Interface Configuration TableViewAccess: From the Icon Subviews for a SFCS Device icon,select SFCS IF > Configuration .
This table contains the managed objects used to set up and configure each SFCS switching interface.
If IndexThe interface with which you are dealing.
Buffers AllocatedThe number of cells in transmit buffer memory.
Queue CountThe number of priority queues configured on this interface.
Sig Stack IdThe user signaling stack ID for this interface.
Clocking From Mother BoardThe ANIM clocking source from the mother board.
Clocking To Mother BoardThe ANIM clocking source to the mother board.

A T M I n t e r f a c e S t a t i s t i c s T a b l e V i e w
S P E C T R U M E n t e r p r i s e M a n a g e r P a g e 100 S m a r t S w i t c h 9 0 0 0 / 9 5 0 0
Interface Statistics Table ViewAccess: From the Icon Subviews for a SFCS Device icon,select SFCS IF > Statistics .
This table contains the objects that specify the packet and byte counters for each configured SFCS switching interface. It provides the following:
If IndexA unique value identifying the interface with which you are dealing.
Rx ErrorsThe number of receive path lookup invalid and out of range errors.
VPI Lookup Invalid ErrorsIndicates the number of Virtual Path Identifier (VPI) lookup invalid and out of range errors.
Rx Cnx Lookup Invalid ErrorsThe number of receive connection lookup invalid errors.
Rx Cell CountThe number of receive cells on this interface.
Tx Cell CountThe number of transmit cells on this interface.
Overflow Dropped Cell CountThe number of cells that were dropped due to queue overflows.
Connection ConfigurationTable ViewAccess: From the Icon Subviews for a SFCS Device icon,select SFCS Connections > Configuration .
This table contains the connection configuration information.
IndexDisplays a unique value used to identify this cross-connect.
Low If IndexThe value of this object that is equal to the low MIB-II IfIndex value of the ATM interface port for this cross-connect.
Low VPIThe value of this object that is equal to the low VPI value at the ATM interface associated with the cross-connect that is identified by Index .
Low VCIThe value of this object that is equal to the low VCI value at the ATM interface associated with this cross-connect that is identified by Index.

A T M C o n n e c t i o n S t a t i s t i c s T a b l e
S P E C T R U M E n t e r p r i s e M a n a g e r P a g e 101 S m a r t S w i t c h 9 0 0 0 / 9 5 0 0
High If IndexThe value of this object that is equal to the high MIB II IfIndex value of the ATM interface port for this cros s-connect.
High VPIThe value of this object that is equal to the high VPI value at the ATM interface associated with the cross-connect that is identified by Index .
High VCIThe value that is equal to the high VCI value at the ATM interface associated with this cross-connect that is identified by Index .
TypeThe connection type for this VC.
TM TypeThe type of traffic management used on this VC. Possible values are: er, efci , and other .
UPC EnableIndicates whether UPC policing is enabled on this VC.
Stats EnableIndicates whether statistics will be kept on this VC.
Stats Table Counter SizeThe size of the drop counter for this VC.
OwnerThe owner of this cross-connect. Possible values are: other , own, and dontown .
Connection Statistics TableAccess: From the Icon Subviews for a SFCS Device icon,select SFCS Connections > Statistics .
This table contains the connection configuration information. It provides the following:
CC IndexThe unique value used to identify this cross-connect.
CC Low If IndexThe value of this object that is equal to the low MIB-II IfIndex value of the ATM interface port for this cross-connect.
CC Low VPIThe value of this object that is equal to the low VPI value at the ATM interface associated with the cross-connect that is identified by Index.
CC Low VCIThe value of this object that is equal to the low VCI value at the ATM interface associated with this cross-connect that is identified by Index .

A T M Q u e u e C o n f i g u r a t i o n T a b l e V i e w
S P E C T R U M E n t e r p r i s e M a n a g e r P a g e 102 S m a r t S w i t c h 9 0 0 0 / 9 5 0 0
CC High If IndexThe value of this object that is equal to the high MIB-II IfIndex value of the ATM interface port for this cross-connect.
CC High VPIThe value of this object that is equal to the high VPI value at the ATM interface associated with the cross-connect that is identified by Index .
CC High VCIThe value of this object that is equal to the high VCI value at the ATM interface associated with this cross-connect that is identified by Index .
Lo to Hi Tx CellsThe Low to High transmitted cell count for this connection.
Lo to Hi Dropped CellsThe Low to High dropped cell count for this connection.
Lo to Hi Tagged CellsThe Low to High tagged cell count for this connection.
Hi to Lo Tx CellsThe High to Low transmitted cell count for this connection.
Hi to Lo Dropped CellsThe High to Low dropped cell count for this connection.
Hi to Lo Tagged CellsThe High to Low tagged cell count for this connection.
Queue Configuration TableViewAccess: From the Icon Subviews for a SFCS Device icon,select SFCS Queue > Configuration .
This group contains the managed objects for maintaining SFCS queues.
If IndexThe interface with which you are dealing.
QueueThe index that specifies the transmit queue with which you are dealing.
SizeThe size of the transmit queue for this queue.
BandwidthThe percentage of this interface's bandwidth, utilized by this particular queue.
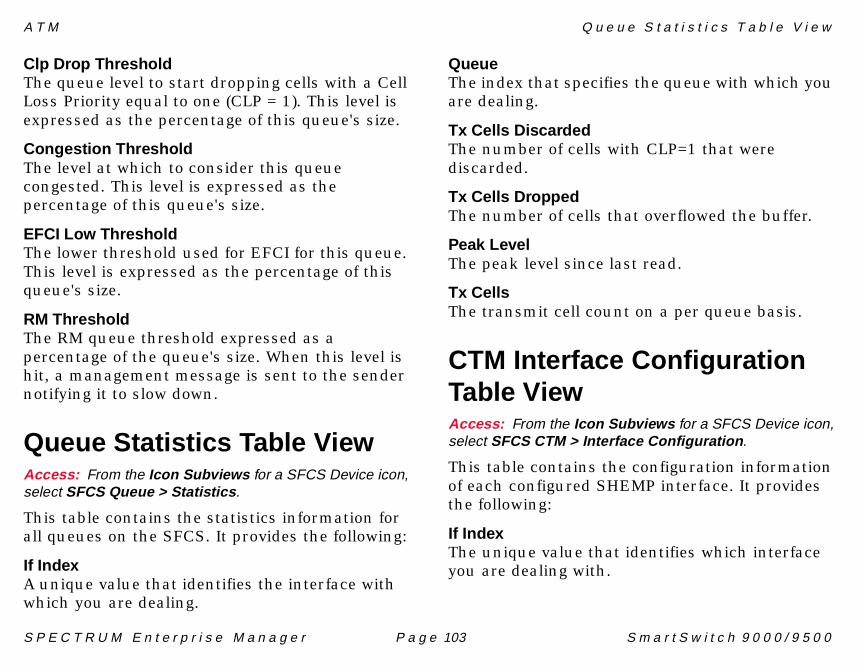
A T M Q u e u e S t a t i s t i c s T a b l e V i e w
S P E C T R U M E n t e r p r i s e M a n a g e r P a g e 103 S m a r t S w i t c h 9 0 0 0 / 9 5 0 0
Clp Drop ThresholdThe queue level to start dropping cells with a Cell Loss Priority equal to one (CLP = 1). This level is expressed as the percentage of this queue's size.
Congestion ThresholdThe level at which to consider this queue congested. This level is expressed as the percentage of this queue's size.
EFCI Low ThresholdThe lower threshold used for EFCI for this queue. This level is expressed as the percentage of this queue's size.
RM ThresholdThe RM queue threshold expressed as a percentage of the queue's size. When this level is hit, a management message is sent to the sender notifying it to slow down.
Queue Statistics Table ViewAccess: From the Icon Subviews for a SFCS Device icon,select SFCS Queue > Statistics .
This table contains the statistics information for all queues on the SFCS. It provides the following:
If IndexA unique value that identifies the interface with which you are dealing.
QueueThe index that specifies the queue with which you are dealing.
Tx Cells DiscardedThe number of cells with CLP=1 that were discarded.
Tx Cells DroppedThe number of cells that overflowed the buffer.
Peak LevelThe peak level since last read.
Tx CellsThe transmit cell count on a per queue basis.
CTM Interface ConfigurationTable ViewAccess: From the Icon Subviews for a SFCS Device icon,select SFCS CTM > Interface Configuration .
This table contains the configuration information of each configured SHEMP interface. It provides the following:
If IndexThe unique value that identifies which interface you are dealing with.

A T M C T M I n t e r f a c e S t a t i s t i c s T a b l e V i e w
S P E C T R U M E n t e r p r i s e M a n a g e r P a g e 104 S m a r t S w i t c h 9 0 0 0 / 9 5 0 0
TypeSets the type of interface access attribute for the SFCS interfaces. Possible attributes are described in Table 32.
Buffer AllocatedThe number of cells in transmit buffer memory.
# of QueuesThe number of priority queues configured on this interface.
Sig Stack IdThe user signalling stack ID for this interface.
Clocking From MBThe ANIM clocking from source. Possible values are: generatedTransmitClock , channelRecoveredClock , systemMasterClock , and notSupported .
Clocking To MBThe ANIM clocking to source. Possible values are: generatedTransmitClock , channelRecoveredClock , systemMasterClock , and notSupported .
CTM Interface Statistics TableViewAccess: From the Icon Subviews for a SFCS Device icon,select SFCS CTM > Interface Statistics .
This view contains the objects that specify the packet and byte counters for each configured SFCS switching interface.
If IndexA unique numeric value that identifies the interface you are dealing with.
Rx ErrsThe number of receive path lookup invalid and out of range errors.
Table 32: SFCS Attribute Types
Attribute Description
accessPort Allow single user or shared access and perform statistics and control.
networkPort Equivalent to trunk ports with no access control.
hostManagement Port
Indicates the (virtual) port to which the (internal) management agent is attached.
hostControlPort Indicates the port to redirect non-management packets.

A T M C T M Q u e u e C o n f i g u r a t i o n T a b l e V i e w
S P E C T R U M E n t e r p r i s e M a n a g e r P a g e 105 S m a r t S w i t c h 9 0 0 0 / 9 5 0 0
VPI Lookup Invalid ErrsThe number of VPI lookup invalid and out of range errors.
Rx Cnx Lookup Invalid ErrsThe number of receive connection lookup invalid errors.
Allocated Rx BWThe allocated receive bandwidth.
Allocated Tx BWThe allocated transmit bandwidth.
Rx Cell CountThe number of receive cells on this interface.
CTM Queue ConfigurationTable ViewAccess: From the Icon Subviews for a SFCS Device icon,select SFCS CTM > Queue Configuration .
This table contains the CTM configuration information for all queues on the SFCS. It includes the following:
IF IndexA unique value that identifies the interface with which you are dealing.
QueueThe index that identifies the transmit queue with which you are dealing.
SizeThe size of the transmit queue.
BandwidthThe percentage of this interface's bandwidth utilized by this particular queue.
Clp Drop ThresholdThe queue level to start dropping CLP=1 cells for this queue. This level is expressed as the percentage of this queue's size.
Congestion ThresholdThe level at which to consider this queue congested. This level is expressed as the percentage of this queue's size.
EFCI Low ThresholdThe lower threshold used for Explicit Forward Congestion Indication (EFCI) for this queue. This level is expressed as the percentage of this queue's size.
RM ThresholdThe Remote Management (RM) queue threshold expressed as a percentage of the queue's size. When this level is hit, a management message is sent to the sender notifying it to slow down.

A T M C T M Q u e u e S t a t i s t i c s T a b l e V i e w
S P E C T R U M E n t e r p r i s e M a n a g e r P a g e 106 S m a r t S w i t c h 9 0 0 0 / 9 5 0 0
CTM Queue Statistics TableViewAccess: From the Icon Subviews for a SFCS Device icon,select SFCS CTM > Queue Statistics .
This view contains the statistics information for all queues on the SFCS.
If IndexA unique value that indicates which interface you are dealing with.
QueueThe index that identifies the queue with which we are dealing.
Tx CLP Cells DiscardedThe number of cells with Cell Loss Priority equal to one (CLP=1) that were discarded for this queue.
Tx Cells DroppedThe number of cells that overflowed the buffer for this queue.
Peak LevelThe peak level since last read for this queue.
Tx CellsThe transmit cell count on a per queue basis.
BW Manager NIM InformationTable ViewAccess: From the Icon Subviews for a SFCS Device icon,select SFCS Bandwidth Manager > Nim Information .
This table contains information about the administrative status of the Network Information Module (NIM).
Nim IndexA unique value that identifies which NIM you are dealing with. This reference is in the same format as MIB II's Interface index.
Admin StatusThe administrative status of this NIM.

A T M B W M a n a g e r P o r t I n f o r m a t i o n T a b l e V i e w
S P E C T R U M E n t e r p r i s e M a n a g e r P a g e 107 S m a r t S w i t c h 9 0 0 0 / 9 5 0 0
BW Manager Port InformationTable ViewAccess: From the Icon Subviews for a SFCS Device icon,select SFCS Bandwidth Manager > Port PoolInformation .
This table contains the following information:
Port IndexThis index identifies the port with which you are dealing.
Admin StatusThe administrative status of this port.
Forward Physical BandwidthThe forward physical bandwidth of the port measured in cells per second.
Reverse Physical BandwidthThe reverse physical bandwidth of the port measured in cells per second.
BW Manager Port Pool LimitsTable ViewAccess: From the Icon Subviews for a SFCS Device icon,select SFCS Bandwidth Manager > Port Pool LimitsInformation .
This table contains the following information:
Port IndexA unique numeric value that specifies which port you are dealing with.
Pool IndexThis index specifies the Pool within the port that you are dealing with.
Max Allocated Bw ForwardUpper Limit for BW to be allocated in a forward direction. It defaults to the physical BW and is set by administrative action. Can not be set to a value greater than physical BW.
Max Allocated Bw ReverseUpper Limit for BW to be allocated in a reverse direction. It defaults to the physical BW and is set by administrative action. This cannot be set to a value greater than physical BW
Bw Allocated FormulaDetermines which of three formulas will be used for computing the amount of variable bandwidth

A T M B W M a n a g e r P o r t P o o l S t a t i s t i c s T a b l e V i e w
S P E C T R U M E n t e r p r i s e M a n a g e r P a g e 108 S m a r t S w i t c h 9 0 0 0 / 9 5 0 0
to be allocated. Possible values are listed in Table 33.
Bw ConstantA ratio used in formulas for computing the amount of variable bandwidth to be allocated. Valid values are from 1 to 255, which is the numerator of a fraction whose fixed denominator is 256. Thus the value 255 is really 255/256 (the most conservative value); the value 1 is really 1/256 (the most liberal value); and the value 128 is really 128/256 (or 50%). The default value is 255.
BW Manager Port PoolStatistics Table ViewAccess: From the Icon Subviews for a SFCS Device icon,select SFCS Bandwidth Manager > Port Pool Statistics .
This table contains the following information:
PortA unique value that specifies which Port you are dealing with
PoolThis index specifies the Pool within the Port that you are dealing with.
Cnx Count ForwardThe current total number of calls in the forward direction.
Cnx Count RevThe current total number of calls in the reverse direction.
Alloc Bw FwdThe current amount of allocated bandwidth in the forward direction.
Alloc Bw RevThe current amount of allocated bandwidth in the reverse direction.
Table 33: BW Allocated Formula Values
Value Description
0 Conservative: Allocates the full amount of variable bandwidth. This is the default value.
1 Moderate: Allocates approximately half of the variable bandwidth.
2 Liberal: Supports very aggressive allocation and should be used with caution.

A T M B W M a n a g e r P o r t P o o l T r a p M a n a g e m e n t T a b l e V i e w
S P E C T R U M E n t e r p r i s e M a n a g e r P a g e 109 S m a r t S w i t c h 9 0 0 0 / 9 5 0 0
Avail Bw FwdThe current amount of available bandwidth in the forward direction.
Avail Bw RevThe current amount of available bandwidth in the reverse direction.
Peak Bw FwdThe peak amount of allocated bandwidth in the forward direction since the port was initialized or the switch was reset.
Peak Bw RevThe peak amount of allocated bandwidth in the reverse direction since the port was initialized or the switch was reset.
BW Manager Port Pool TrapManagement Table ViewAccess: From the Icon Subviews for a SFCS Device icon,select SFCS Bandwidth Manager > Port Pool TrapManagement .
This table contains the following information:
PortA unique value that specifies the port with which you are dealing.
PoolThis index specifies the Pool within the Port which you are dealing with.
Fwd Alloc Bw UpperThe upper threshold for the Alloc BW fwd trap. When an allocation causes the currently allocated bandwidth to exceed this value, a trap is generated.
Rev Alloc Bw UpperThe upper threshold for the Alloc BW revtrap. When an allocation causes the currently allocated bandwidth to exceed this value a trap is generated.
Fwd Alloc Bw LowerThe lower threshold for the Alloc BW fwd trap. When an allocation causes the currently allocated

A T M B W M a n a g e r P o r t P o o l T r a p M a n a g e m e n t T a b l e V i e w
S P E C T R U M E n t e r p r i s e M a n a g e r P a g e 110 S m a r t S w i t c h 9 0 0 0 / 9 5 0 0
bandwidth to fall below this value, a trap is generated.
Rev Alloc Bw LowerThe lower threshold for the Alloc BW rev trap. When an allocation causes a currently allocated bandwidth to fall below this value, a trap is generated.
Fwd Peak BwThe upper threshold for the Peak BW fwd trap. When an allocation causes the currently allocated bandwidth to exceed this value, a trap is generated.
Rev Peak BwThe upper threshold for the Peak BW rev trap. When an allocation causes the currently allocated bandwidth to exceed this value, a trap is generated.
Node Configuration Table ViewAccess: From the Icon Subviews menu for the PNNIApplication icon, select Node Configuration .
This view contains the following information:
IndexThe numerical sequence of the node.
Node LevelPNNI level of the node.
Admin StatusThe administrative status of the node. Valid values are: Up or Down.
Peer Group IdentificationA unique number identifying the peer group.
Node IdentificationA unique number identifying the node.
Opens the PGL Election Information View (Page 111).
PGL Election Information
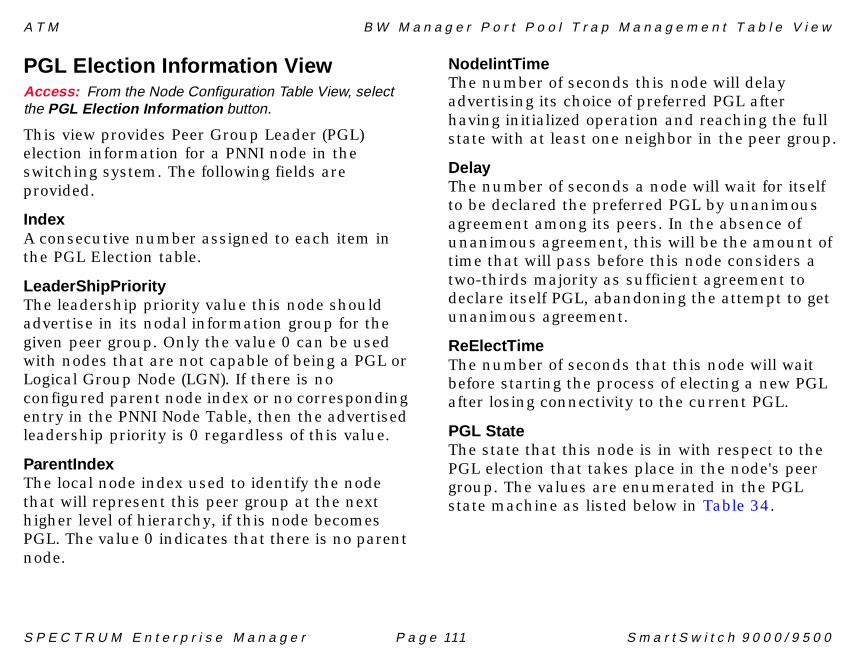
A T M B W M a n a g e r P o r t P o o l T r a p M a n a g e m e n t T a b l e V i e w
S P E C T R U M E n t e r p r i s e M a n a g e r P a g e 111 S m a r t S w i t c h 9 0 0 0 / 9 5 0 0
PGL Election Information ViewAccess: From the Node Configuration Table View, selectthe PGL Election Information button.
This view provides Peer Group Leader (PGL) election information for a PNNI node in the switching system. The following fields are provided.
IndexA consecutive number assigned to each item in the PGL Election table.
LeaderShipPriorityThe leadership priority value this node should advertise in its nodal information group for the given peer group. Only the value 0 can be used with nodes that are not capable of being a PGL or Logical Group Node (LGN). If there is no configured parent node index or no corresponding entry in the PNNI Node Table, then the advertised leadership priority is 0 regardless of this value.
ParentIndexThe local node index used to identify the node that will represent this peer group at the next higher level of hierarchy, if this node becomes PGL. The value 0 indicates that there is no parent node.
NodeIintTimeThe number of seconds this node will delay advertising its choice of preferred PGL after having initialized operation and reaching the full state with at least one neighbor in the peer group.
DelayThe number of seconds a node will wait for itself to be declared the preferred PGL by unanimous agreement among its peers. In the absence of unanimous agreement, this will be the amount of time that will pass before this node considers a two-thirds majority as sufficient agreement to declare itself PGL, abandoning the attempt to get unanimous agreement.
ReElectTimeThe number of seconds that this node will wait before starting the process of electing a new PGL after losing connectivity to the current PGL.
PGL StateThe state that this node is in with respect to the PGL election that takes place in the node's peer group. The values are enumerated in the PGL state machine as listed below in Table 34.

A T M B W M a n a g e r P o r t P o o l T r a p M a n a g e m e n t T a b l e V i e w
S P E C T R U M E n t e r p r i s e M a n a g e r P a g e 112 S m a r t S w i t c h 9 0 0 0 / 9 5 0 0
PreferredPGLThe ID of the node that the local node believes should be or should become the PGL. This is also the value the local node is currently advertising in the preferred PGL Node ID field of its nodal information group within the given peer group. If a preferred PGL has not been chosen, the value is set to all zeros.
PGLeaderThe ID of the node that is currently operating as PGL of the peer group this node belongs to. If a PGL has not been elected, the value is set to all zeros.
PGLTimeStampThe system time at which the current PGL established itself.
ActiveParentIDThe ID being used by the PGL to represent this peer group at the next higher level of the hierarchy. If this node is at the highest level of the hierarchy or if no PGL has been elected, the value is all zeros.
Nodal Map Information ViewAccess: From the Icon Subviews menu for the PNNIApplication icon, select Node Statistics .
This view contains the following information:
Peer Group IDIdentifies the peer group of the originating node.
Parent Node IDWhen the originating node is a peer group leader, this indicates the node ID of the parent LGN. If the originating node is not the peer group leader of its peer group, this attribute's value is set to (all) zero(s).
Parent Peer Group IDWhen the originating node is a peer group leader, this indicates the node's parent peer group ID. If the originating node is not the peer group leader of its peer group, this attribute's value is set to (all) zero(s).
Table 34: PGL States
1 starting 6 await unanimity
2 awaiting 7 operating
3 awaiting full 8 operation not PGL
4 initial delay 9 hung election
5 calculating 10 await re-election

A T M B W M a n a g e r P o r t P o o l T r a p M a n a g e m e n t T a b l e V i e w
S P E C T R U M E n t e r p r i s e M a n a g e r P a g e 113 S m a r t S w i t c h 9 0 0 0 / 9 5 0 0
Node ATM AddressThe ATM End System Address of the originating node.
Parent ATM AddressWhen the originating node is a peer group leader, this indicates the ATM address of the parent LGN. If the originating node is not the peer group leader of its peer group, this attribute's value is set to (all) zero(s).
Parent PGL Node IDWhen the originating node is a peer group leader, this identifies the node elected as peer group leader of the parent peer group. If the originating node is not the peer group leader of its peer group, this attribute's value is set to (all) zero(s).
The Nodal Map Table contains the following fields.
NodeIDThe node whose nodal information is being described.
RestrictedIndicates whether the originating node is restricted to only allow support of SVCs originating or terminating at this node. A value of true indicates that the transit capabilities are restricted, i.e., transit connections are not allowed. A value of false indicates that transit connections are allowed.
ComplexRepIndicates whether the originating node uses the complex node representation. If the value is true , the spokes and bypasses that make up the complex node representation should be found in the PNNI Map Table.
RestrictedBranchIndicates whether the originating node is able to support additional branches. If the value is false , then it can support additional branches.
DBOverloadIndicates whether the originating node is currently operating in a topology database overload state. Valid values are: true or false .
IAMLeaderIndicates whether the originating node claims to be PGL of its peer group. Valid values are: true or false .
LeaderPriorityThe leadership priority value advertised by the originating node.
PreferredPGLIdentifies the node that the originating node believes should be or is PGL of its peer group. If the originating node has not chosen a preferred PGL, this field is all zeros.

A T M B W M a n a g e r P o r t P o o l T r a p M a n a g e m e n t T a b l e V i e w
S P E C T R U M E n t e r p r i s e M a n a g e r P a g e 114 S m a r t S w i t c h 9 0 0 0 / 9 5 0 0
Opens the Nodal Timer Information View (Page 114).
Opens the SVCC Variable Information View (Page 115).
Nodal Timer Information ViewAccess: From the Nodal Map Information view, click theNode Timer Information button.
This view provides nodal timer information in the following fields.
PTSE HoldThe initial value for the PNNI Topology State Element (PTSE) hold down timer that is used by the given node to limit the rate at which it can re-originate PTSEs. The value must be a positive non-zero number in units of 100 milliseconds.
HelloHoldDownThe initial value for the Hello hold down timer that is used by the given node to limit the rate at which it sends Hellos. The value must be a positive non-zero number in units of 100 milliseconds.
HelloIntervalThe initial value for the Hello timer, in seconds. In the absence of triggered Hellos, this node will send one Hello packet on each of its ports on this interval.
InactivityThe value for the Hello inactivity factor that this node will use to determine when a neighbor has gone down. The default value is 5.
LinkInactThe number of seconds a node will continue to advertise a horizontal (logical) link for which it has not received and processed an LGN horizontal link information group. The default value is 120 .
RefreshThe initial value for the Refresh timer that this node uses to drive (re-)origination of PTSEs in the absence of triggered updates. The default value is 1800 seconds .
LifetimeFactorThe value for the lifetime multiplier, expressed as a percentage. The result of multiplying the value for Refresh by this value is used as the initial lifetime that this node places into self-originated PTSEs.
Node Timer Information
Svcc Variable Information

A T M B W M a n a g e r P o r t P o o l T r a p M a n a g e m e n t T a b l e V i e w
S P E C T R U M E n t e r p r i s e M a n a g e r P a g e 115 S m a r t S w i t c h 9 0 0 0 / 9 5 0 0
RXIntervalThe number of seconds between retransmissions of unacknowledged database summary packets, PTSE request packets, and PNNI Topology State Packets (PTSP). The default value is 5.
DlyActIntvlThe minimum amount of time between transmissions of delayed PTSE acknowledgment packets, in units of 100 milliseconds. The default value is 10.
AVCRPMThe proportional multiplier used in the algorithms that determine significant change for available cell rate (AvCR) parameters, expressed as a percentage. The default value is 50.
AVCRMtThe minimum threshold used in the algorithms that determine significant change for available cell rate (AvCR) parameters, expressed as a percentage. The default value is 3.
CDVPmThe proportional multiplier used in the algorithms that determine significant change for cell delay variation (CDV) metrics, expressed as a percentage. The default value is 25.
CtDPmThe proportional multiplier used in the algorithms that determine significant change for cell transfer delay (CTD) metrics, expressed as a percentage. The default value is 50.
SVCC Variable Information ViewAccess: From the Nodal Information Map Information view,click the SVCC Variable Information button.
This view provides Switched Virtual Channel Connection (SVCC) information as follows.
IndexThe index value for the node.
InitTimeThe time, in seconds, this node delays establishing an SVCC to a neighbor with a numerically lower ATM address after determining that such an SVCC should be established. The default value is 4.
RetryTimeThe time, in seconds, this node delays before attempting to re-establish an apparently still necessary and viable SVCC-based RCC after it is unexpectedly torn down. The default value is 30.
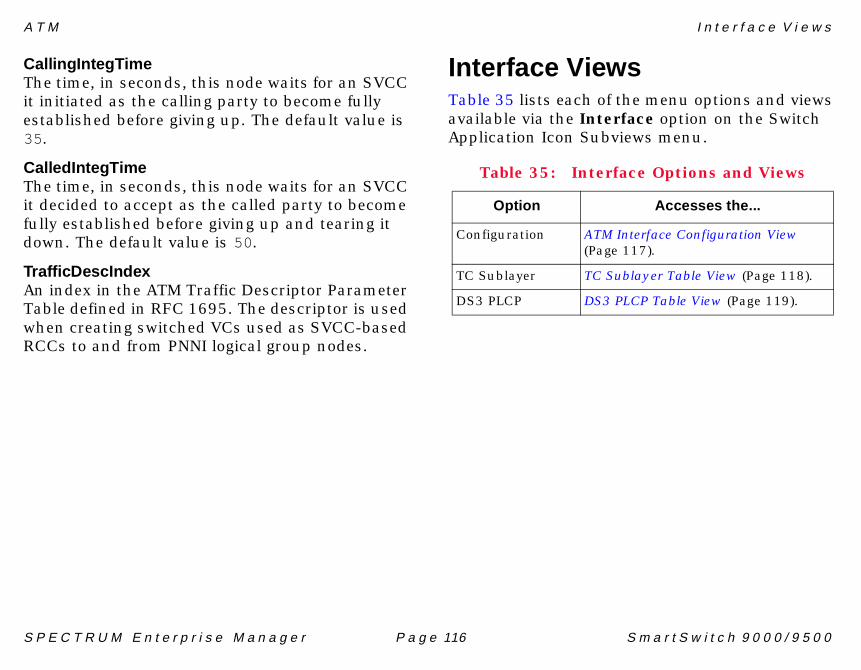
A T M I n t e r f a c e V i e w s
S P E C T R U M E n t e r p r i s e M a n a g e r P a g e 116 S m a r t S w i t c h 9 0 0 0 / 9 5 0 0
CallingIntegTimeThe time, in seconds, this node waits for an SVCC it initiated as the calling party to become fully established before giving up. The default value is 35.
CalledIntegTimeThe time, in seconds, this node waits for an SVCC it decided to accept as the called party to become fully established before giving up and tearing it down. The default value is 50.
TrafficDescIndexAn index in the ATM Traffic Descriptor Parameter Table defined in RFC 1695. The descriptor is used when creating switched VCs used as SVCC-based RCCs to and from PNNI logical group nodes.
Interface ViewsTable 35 lists each of the menu options and views available via the Interface option on the Switch Application Icon Subviews menu.
Table 35: Interface Options and Views
Option Accesses the...
Configuration ATM Interface Configuration View (Page 117).
TC Sublayer TC Sublayer Table View (Page 118).
DS3 PLCP DS3 PLCP Table View (Page 119).

A T M I n t e r f a c e V i e w s
S P E C T R U M E n t e r p r i s e M a n a g e r P a g e 117 S m a r t S w i t c h 9 0 0 0 / 9 5 0 0
ATM Interface Configuration ViewAccess: From the Icon Subviews menu for the SwitchApplication icon, select Interface > Configuration .
This view provides the following information on the local interface configuration parameters for each ATM interface or port.
If IndexThe interface number.
Max VPCsThe maximum number of VPCs (PVC and SVC) supported by the ATM interface.
Max VCCsThe maximum number of VCCs (PVC and SVC) supported by this ATM interface.
Conf VPCsThe number of VPCs currently in use on this ATM interface. This includes the number of PVCs and SPVCs that are configured on the interface, plus the number of SVCs that are currently established on the interface.
Conf VCCsThe number of VCCs currently in use on this ATM interface. This includes the number of PVCs and SPVCs that are configured at the interface plus the number of SVCs that are currently established on the interface.
Max VPI BitsThe maximum number of active VPI bits configured for use at the ATM interface.
Max VCI BitsThe maximum number of active VCI bits configured for use on the ATM interface.
ILMI VPIThe VPI value of the VCC supporting the Interim Local Management Interface (ILMI) on the ATM interface. If this value and the value of ILMI VCI are 0, then ILMI is not supported on this interface.
ILMI VCIThe VCI value of the VCC supporting the ILMI at the ATM interface. If this value and the value of ILMI VPI are 0, then ILMI is not supported on this interface.
Address TypeThe type of ATM address, such as private .
Admin AddressAn address assigned for administrative purposes, e.g., an address associated with the service provider side of a public network UNI.

A T M I n t e r f a c e V i e w s
S P E C T R U M E n t e r p r i s e M a n a g e r P a g e 118 S m a r t S w i t c h 9 0 0 0 / 9 5 0 0
Neighbor AddressThe IP address of the neighbor system connected to the far end of this interface to which an NMS can send SNMP messages.
Neighbor If NameThe textual name of the interface of the neighbor defined in the Neighbor Address field.
TC Sublayer Table ViewAccess: From the Icon Subviews menu for the SwitchApplication icon, select Interface > TC Sublayer .
This view provides the following Transmission Convergence (TC) sublayer alarm and event information.
IF IndexThe interface number.
OCD EventsThe number of times the Out of Cell Delineation (OCD) events occur. An OCD event occurs when seven consecutive ATM cells have Header Error Control (HEC) violations. A high number of OCD events may indicate a problem with the TC sublayer.
TC Alarm StateIndicates if there is an alarm present for the TC sublayer. Failure indicates that a Loss of Cell Delineation (LCD) state has been declared for the TC sublayer. Transition from Failure to NoAlarm occurs when six consecutive ATM cells are received with a valid Header Error Check (HEC), followed by about 10 seconds of acceptable signal.
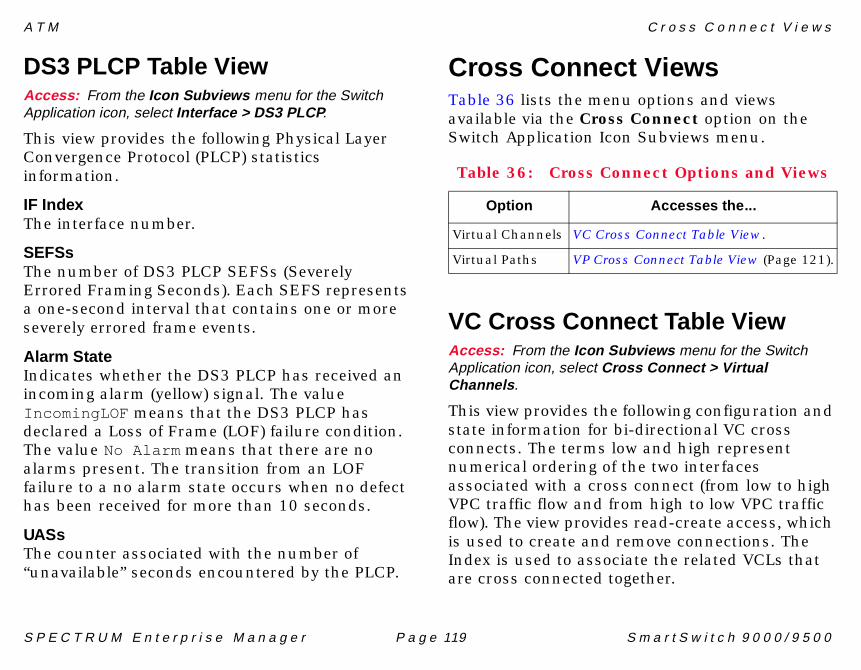
A T M C r o s s C o n n e c t V i e w s
S P E C T R U M E n t e r p r i s e M a n a g e r P a g e 119 S m a r t S w i t c h 9 0 0 0 / 9 5 0 0
DS3 PLCP Table ViewAccess: From the Icon Subviews menu for the SwitchApplication icon, select Interface > DS3 PLCP .
This view provides the following Physical Layer Convergence Protocol (PLCP) statistics information.
IF IndexThe interface number.
SEFSsThe number of DS3 PLCP SEFSs (Severely Errored Framing Seconds). Each SEFS represents a one-second interval that contains one or more severely errored frame events.
Alarm StateIndicates whether the DS3 PLCP has received an incoming alarm (yellow) signal. The value IncomingLOF means that the DS3 PLCP has declared a Loss of Frame (LOF) failure condition. The value No Alarm means that there are no alarms present. The transition from an LOF failure to a no alarm state occurs when no defect has been received for more than 10 seconds.
UASsThe counter associated with the number of “unavailable” seconds encountered by the PLCP.
Cross Connect ViewsTable 36 lists the menu options and views available via the Cross Connect option on the Switch Application Icon Subviews menu.
VC Cross Connect Table ViewAccess: From the Icon Subviews menu for the SwitchApplication icon, select Cross Connect > VirtualChannels .
This view provides the following configuration and state information for bi-directional VC cross connects. The terms low and high represent numerical ordering of the two interfaces associated with a cross connect (from low to high VPC traffic flow and from high to low VPC traffic flow). The view provides read-create access, which is used to create and remove connections. The Index is used to associate the related VCLs that are cross connected together.
Table 36: Cross Connect Options and Views
Option Accesses the...
Virtual Channels VC Cross Connect Table View.
Virtual Paths VP Cross Connect Table View (Page 121).

A T M C r o s s C o n n e c t V i e w s
S P E C T R U M E n t e r p r i s e M a n a g e r P a g e 120 S m a r t S w i t c h 9 0 0 0 / 9 5 0 0
IndexA unique value identifying the VC cross connect.
Low IndexThe index value for the ATM interface for this VC cross connect, which is numerically lower than the Index value of the other ATM interface.
Low VPIThe VPI value at the ATM interface associated with the VC cross connect that is identified by Low Index.
Low VCIThe VCI value at the ATM interface associated with the VC cross connect that is identified by Low Index.
High IndexThe index value for the ATM interface for this VC cross connect, which is numerically higher than the index value of the other ATM interface.
High VPIThe value equal to the VPI value at the ATM interface associated with the VC cross connect that is identified by High Index.
High VCIThe value equal to the VCI value at the ATM interface associated with the VC cross connect that is identified by High Index.
Admin StatusThe desired administrative status of this bi-directional VC cross connect. Up indicates that the traffic flow is enabled on this VC cross connect. Down means it is disabled.
L2H Oper StatusThe current operational status (Up or Unknown) of the VC cross connect in one direction (i.e., from the low to high direction).
H2L Oper StatusThe current operational status of the VC cross connect in one direction (i.e., from the high to low direction). UP indicates that this ATM VC cross connect from the high to low direction is operational. Unknown indicates that the state cannot be determined.
L2H Last ChangeThe value of Sys Up Time (located in the Banner area of the view) at the time this VC cross connect entered its current operational state in the low to high direction. If the current state was entered prior to the last re-initialization of the agent, the value is 0.
H2L Last ChangeThe value of Sys Up Time at the time this VC cross connect entered its current operational state in the high to low direction. If the current

A T M C r o s s C o n n e c t V i e w s
S P E C T R U M E n t e r p r i s e M a n a g e r P a g e 121 S m a r t S w i t c h 9 0 0 0 / 9 5 0 0
state was entered prior to the last re-initialization of the agent, the value is 0.
Row StatusThe status of this entry in the Cross Connect Table. This is used to create new VCL cross connects that are created using the VCL Table, or to change and delete existing cross connects.
VP Cross Connect Table ViewAccess: From the Icon Subviews menu for the SwitchApplication icon, select Cross Connect > Virtual Paths .
This view provides configuration and state information for all point-to-point, point-to-multipoint, and multipoint-to-multipoint VP cross connects. The view provides read-create access, which can be used to cross connect the VPLs together in an ATM switch or network. The index is used to associate the related VPLs that are cross connected together.
IndexThe unique value to identify this VP cross connect.
Low IndexThe value for the low interface Index of the ATM interface for this VP cross connect.
Low VpiThe value equal to the VPI value at the ATM interface associated with the VP cross connect that is identified by Low Index.
High IndexThe value for the high interface Index of the ATM interface for this VP cross connect.
High VpiThe value equal to the VPI value at the ATM interface associated with the VP cross connect that is identified by High Index.
Admin StatusThe desired administrative status of this bi-directional VP cross connect. Up indicates that the traffic flow is enabled on this VP cross connect.
L2H Oper StatusIdentifies the current operational status (Up or Unknown) of the VP cross connect in one direction (i.e., from the low to high direction).
H2L Oper StatusThe current operational status (Up or Unknown) of the VP cross connect in one direction (i.e., from the high to low direction).

A T M L i n k s V i e w s
S P E C T R U M E n t e r p r i s e M a n a g e r P a g e 122 S m a r t S w i t c h 9 0 0 0 / 9 5 0 0
L2H Last ChangeThe value of Sys Up Time at the time this VP cross connect entered its current operational state in the low to high direction. If the current state was entered prior to the last re-initialization of the agent, the value is 0.
H2L Last ChangeThe value of Sys Up Time at the time this VP cross connect entered its current operational state in the high to low direction. If the current state was entered prior to the last re-initialization of the agent, the value is 0.
Row StatusThe status of this entry in the Cross Connect Table. This is used to create VPL cross connects that are created using the VPL Table or to change and delete existing cross connects.
Links ViewsTable 37 lists the menu options and views available via the Links option on the Switch Application Icon Subviews menu.
Table 37: Links Options and Views
Option Accesses the...
Virtual Channels Creating PVCs and PVPs,.
Virtual Paths Virtual Path Link Table View (Page 125).
Tip:Tip:The Virtual Channel Link Table view is used to create PVCs and the Virtual Path Link Table view is used to create PVPs. See Creating PVCs and PVPs before attempting to perform these tasks.

A T M C r e a t i n g P V C s a n d P V P s
S P E C T R U M E n t e r p r i s e M a n a g e r P a g e 123 S m a r t S w i t c h 9 0 0 0 / 9 5 0 0
Creating PVCs and PVPsThe procedures for creating a Permanent Virtual Channel (PVC) and Permanent Virtual Path (PVP) are identical. You accomplish both by using views accessible from the SwitchApp Icon Subviews menu, as described below. Basically, you use Virtual Channel views to create PVCs and Virtual Path views to create PVPs.
The following procedure describes how to create a PVC. To create a PVP, use the Virtual Path views instead of the Virtual Channel views.
Creating a PVC involves defining individual links (VPI/VCI) on each of two ports and then cross connecting the ports. Use the Virtual Channel Link Table View (Page 124) to define the links on each port; then use the VC Cross Connect Table View (Page 119) to cross connect the ports.
4 From the SwitchApp Icon Subviews menu, select Links -> Virtual Channel.
The Virtual Channel Link Table View (Page 124) displays.
5 Set the link information (IF Index, VPI, and VCI). For example, 20101.0.160 .
6 Save the link by pressing <Return> and then clicking Create Link.
The VCL Row Status view displays.
7 Assign traffic parameters for transmit and receive and then click <Return> to save.
8 Click Validate Row and then wait to see that the row status changes from Not Ready to Active .
9 Return to the Virtual Channel Link Table view to validate that the link was defined with the assigned traffic parameters.
10 That completes the link definition for the first port to be cross connected. Now repeat steps 1 through 6 to complete the link definition for the other port.
11 When the links are defined correctly for both ports, go to the SwitchApp Icon Subviews menu and select Cross Connect -> Virtual Channels.
Note:Note:
Check the following before you begin:
1. You must have write privileges for the device.
2. The traffic parameters for the ports must be set properly.
3. The ILMI parameters must be set. Use local management to do this.
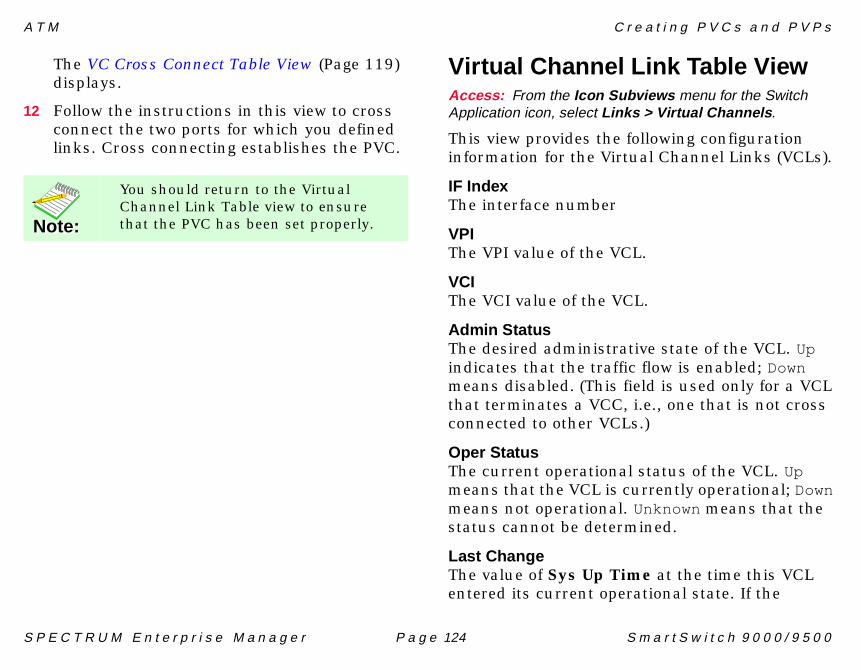
A T M C r e a t i n g P V C s a n d P V P s
S P E C T R U M E n t e r p r i s e M a n a g e r P a g e 124 S m a r t S w i t c h 9 0 0 0 / 9 5 0 0
The VC Cross Connect Table View (Page 119) displays.
12 Follow the instructions in this view to cross connect the two ports for which you defined links. Cross connecting establishes the PVC.
Virtual Channel Link Table ViewAccess: From the Icon Subviews menu for the SwitchApplication icon, select Links > Virtual Channels .
This view provides the following configuration information for the Virtual Channel Links (VCLs).
IF IndexThe interface number
VPIThe VPI value of the VCL.
VCIThe VCI value of the VCL.
Admin StatusThe desired administrative state of the VCL. Up indicates that the traffic flow is enabled; Down means disabled. (This field is used only for a VCL that terminates a VCC, i.e., one that is not cross connected to other VCLs.)
Oper StatusThe current operational status of the VCL. Up means that the VCL is currently operational; Down means not operational. Unknown means that the status cannot be determined.
Last ChangeThe value of Sys Up Time at the time this VCL entered its current operational state. If the
Note:Note:
You should return to the Virtual Channel Link Table view to ensure that the PVC has been set properly.

A T M C r e a t i n g P V C s a n d P V P s
S P E C T R U M E n t e r p r i s e M a n a g e r P a g e 125 S m a r t S w i t c h 9 0 0 0 / 9 5 0 0
current state was entered prior to the last re-initialization of the agent, the value is 0.
Rcv Descr IndexThe row in the ATM Traffic Descriptor Table that applies to the receive direction of this VCL.
Xmit Descr IndexThe row of the ATM Traffic Descriptor Table that applies to the transmit direction of this VCL.
Cross Connect IdImplemented only for a VCL that is cross connected to other VCLs that belong to the same VCC. All such VCLs have the same value, which is reflected in the VC Cross Connect Table View (Page 119).
Row StatusUsed to create, delete, or modify a row in this table. Follow the procedure given in the view to make a change.
Virtual Path Link Table ViewAccess: From the Icon Subviews menu for the SwitchApplication icon, select Links > Virtual Paths .
This view provides the following configuration information for the virtual path links.
IF IndexThe interface number.
VPIThe VPI value of the Virtual Path Link (VPL). Note that a VPI value of 0 is not used for a VPL not associated with a VCL. The maximum VPI value cannot exceed the value allowable by the interface’s maximum VPI.
Admin StatusThe desired administrative state of the VPL. Up indicates that the traffic flow is enabled for this VPL. Down means disabled. (This field is used only for a VPL that terminates a VPC, i.e., one that is not cross connected to other VPLs.)
Oper StatusThe current operational status of the VPL. Valid values are: Up, Down, or Unknown.
Last ChangeThe value of Sys Up Time at the time this VPL entered its current operational state. If the

A T M T r a f f i c P a r a m e t e r T a b l e V i e w
S P E C T R U M E n t e r p r i s e M a n a g e r P a g e 126 S m a r t S w i t c h 9 0 0 0 / 9 5 0 0
current state was entered prior to the last re-initialization of the agent, the value is 0.
Rcv Descr IndexThe row in the Traffic Parameter Table that applies to the receive direction of the VPL.
Xmit Descr IndexThe row in the Traffic Parameter Table that applies to the transmit direction of the VPL.
Cross Connect IdImplemented only for a VPL that is cross connected to other VPLs that belong to the same VPC. All such VPLs have the same value, which is reflected in the VP Cross Connect Table.
Row StatusUsed to create, delete, or modify a row in this table. Use the procedure given in the view to make a change.
Traffic Parameter Table ViewAccess: From the Icon Subviews menu for the SwitchApplication icon, select Traffic Parameter .
This view lets you create and modify traffic parameters or descriptors using the instructions given in the view. This should be done before creating PVCs and PVPs. The view contains the following fields.
IndexUsed by the Virtual Link Table (VPL or VCL Table) to identify the row of this table.
Descr TypeType of ATM traffic descriptor. The type may indicate no traffic descriptor or a traffic descriptor with one or more parameters. These parameters are specified as a parameter vector in the corresponding instances of Param 1, Param 2, Param 3, Param 4, and Param 5.
Param 1, 2, 3, 4, or 5Parameter of the ATM traffic descriptor used according to the value of Descr Type.
QoS ClassA value identifying one of four QoS classes specified in the ATM Forum UNI specification as follows:

A T M I L M I N e t w o r k P r e f i x T a b l e V i e w
S P E C T R U M E n t e r p r i s e M a n a g e r P a g e 127 S m a r t S w i t c h 9 0 0 0 / 9 5 0 0
• 1 = Service Class A, Constant Bit Rate and is used for video and circuit emulation.
• 2 = Service Class B, Variable Bit Rate and is used for video and audio.
• 3 = Service Class C and is used for connection-oriented data transmission.
• 4 = Service Class D and used for connectionless data transmission. An unspecified QoS (value 0) is used for “best-effort” traffic.
Row StatusUsed to specify the state of the row in this table. The possible states are: Active , Not inservice , Not ready , Create and go , Createand wait , and Destroy .
ILMI Network Prefix Table ViewAccess: From the Icon Subviews menu for the SwitchApplication icon, select ILMI Network Prefix .
This table specifies per-interface network prefix(es) supplied by the network side of the UNI during ILMI address registration. When no network prefixes are specified for a particular interface, one or more network prefixes based on the switch address(es) may be used for ILMI address registration.
InterfaceInformation about a single network prefix supplied by the network side of the UNI during ILMI address registration.
Network PrefixThe network prefix specified for use in ILMI address registration.
Row StatusUsed to create, delete, activate and de-activate network prefixes used in ILMI address registration.

A T M V C L S t a t i s t i c s T a b l e V i e w
S P E C T R U M E n t e r p r i s e M a n a g e r P a g e 128 S m a r t S w i t c h 9 0 0 0 / 9 5 0 0
VCL Statistics Table ViewAccess: From the Icon Subviews menu for the SwitchApplication icon, select VCL Statistics .
This table contains all statistics counters per VCL. It is used to monitor the usage of the VCL in terms of incoming cells and outgoing cells.
InterfaceThe interface number.
VCL VPIThe VPI value of the VCL.
VCL VCIThe VCI value of the VCL.
Total Cells InThe total number of valid ATM cells received by this VCL including both CLP=0 and CLP=1 cells. The cells are counted prior to the application of the traffic policing.
Clp0 Cells InThe number of valid ATM cells received by this VCL with CLP=0. The cells are counted prior to the application of the traffic policing.
Total DiscardsThe total number of valid ATM cells discarded by the traffic policing entity. This includes cells originally received with CLP=0 and CLP=1.
Total Cells OutThe total number of valid ATM cells transmitted by this VCL. This includes both CLP=0 and CLP=1 cells.
Clp0 Cells OutThe total number of valid ATM cells transmitted with CLP=0 by this VCL.
Tagged OutsThe total number of valid ATM cells tagged by the traffic policing entity from CLP=0 to CLP=1 and transmitted by this VCL.
Switched Virtual ChannelCross Connect Table ViewAccess: From the Icon Subviews menu for the SwitchApplication icon, select SVC VC Cross Connect .
The ATM SVCC Cross-Connect table. A bi-directional VC cross-connect between two switched VCLs is modeled as one entry in this table. A Soft PVCC cross-connect, between a soft permanent VCL and a switched VCL, is also modeled as one entry in this table.
IndexA unique value to identify this SVCC cross-connect.

A T M S w i t c h e d V i r t u a l C h a n n e l C r o s s C o n n e c t T a b l e V i e w
S P E C T R U M E n t e r p r i s e M a n a g e r P a g e 129 S m a r t S w i t c h 9 0 0 0 / 9 5 0 0
Low IFThe value of this object is equal to the ifIndex value of the ATM interface port for this SVCC cross-connect. The term low implies that this ATM interface has the numerically lower ifIndex value than the other ATM interface identified in the same atmSvcVcCrossConnectEntry.
Low VPIThe value of this object is equal to the VPI value associated with the SVCC cross-connect at the ATM interface that is identified by atmSvcVcCrossConnectLowIfIndex. The VPI value cannot exceed the number supported by High VPI at the low ATM interface port.
Low VCIThe value of this object is equal to the VCI value associated with the SVCC cross-connect at the ATM interface that is identified by atmSvcVcCrossConnectLowIfIndex. The VCI value cannot exceed the number supported by High VCI at the low ATM interface port.
High IFThe value of this object is equal to the ifIndex value for the ATM interface port for this SVCC cross-connect. The term high implies that this ATM interface has the numerically higher ifIndex value than the other ATM interface identified in the same atmSvcVcCrossConnectEntry.
High VPIThe value of this object is equal to the VPI value associated with the SVCC cross-connect at the ATM interface that is identified by atmSvcVcCrossConnectHighIfIndex. The VPI value cannot exceed the number supported by the atmInterfaceMaxVpiBits at the high ATM interface port.
High VCIThe value of this object is equal to the VCI value associated with the SVCC cross-connect at the ATM interface that is identified by atmSvcVcCrossConnectHighIfIndex. The VCI value cannot exceed the number supported by the atmInterfaceMaxVciBits at the high ATM interface port.
Created TimeThe value of the sysUpTime object at the time this bi-directional SVCC cross-connect was created. If the current state was entered prior to the last re-initialization of the agent, then this object contains a zero value.
Row StatusThis object is used to delete rows in the atmSvcVcCrossConnectTable.

A T M S i g n a l l i n g M o n i t o r i n g T a b l e V i e w
S P E C T R U M E n t e r p r i s e M a n a g e r P a g e 130 S m a r t S w i t c h 9 0 0 0 / 9 5 0 0
Signalling Monitoring TableViewAccess: From the Icon Subviews menu for the SwitchApplication icon, select Signalling Monitoring .
SSCOP TableThis table displays the following information:
InterfaceThe interface number.
SSCOP Connection EventsSSCOP Connection Events Counter. This counter counts the sum of the following errors:
• SSCOP Connection Disconnect Counter. The abnormal occurrence of this event is characterized by the expiry of Timer_NO_RESPONSE.
• SSCOP Connection Initiation Failure. This condition indicates the inability to establish an SSCOP connection. This event occurs whenever the number of expiries of the connection control timer (Timer_CC) equals or exceeds the MaxCC, or upon receipt of a connection reject message BGREJ PDU.
• SSCOP Connection Re-Establ/Resynch. This event occurs upon receipt of a BGN PDU or RS PDU.
SSCOP Errored PDUsSSCOP Errored PDUs Counter. This counter counts the sum of the following errors:
• Invalid PDUs. These are defined in SSCOP and consist of PDUs with an incorrect length (MAA-ERROR code U), an undefined PDU type code, or that are not 32-bit aligned.
• PDUs that result in MAA-ERROR codes and are discarded.
Detected Events TableThis table displays the following information:
InterfaceThe interface number.
Call Setup AttemptsCall Setup Attempts Counter. This counter counts the number of call setup attempts (both successful and unsuccessful) detected on this interface.
Routes UnavailableNumber of Route Unavailability detected on this interface. This counter is incremented when a RELEASE, RELEASE COMPLETE (only when not preceded by a RELEASE message for the same call), ADD PARTY REJECT, or STATUS message that contains one of the following cause code

A T M S i g n a l l i n g M o n i t o r i n g T a b l e V i e w
S P E C T R U M E n t e r p r i s e M a n a g e r P a g e 131 S m a r t S w i t c h 9 0 0 0 / 9 5 0 0
values is received. See Table 38 for applicable cause values and meanings:
Resources UnavailableNumber of Resource Unavailability detected on this interface. This counter is incremented when a RELEASE, RELEASE COMPLETE (only when not preceded by a RELEASE message for the same call), ADD PARTY REJECT, or STATUS message that contains one of the following cause code values is received. See Table 39 for applicable cause values and meanings. (Note: These cause values apply to both UNI3.0 and UNI3.1 unless otherwise stated):
Called PartyNumber of Called Party Responsible For Unsuccessful Call detected on this interface. This counter is incremented when a RELEASE, RELEASE COMPLETE (only when not preceded by a RELEASE message for the same call), ADD PARTY REJECT, or STATUS message that contains one of the following cause code values is received. See Table 40 for applicable cause values and meanings. (Note: These cause values apply to both UNI3.0 and UNI3.1):
Table 38: Routes Unavailable
Cause Value Meaning
1 Unallocated (unassigned) number.
2 No route to specified transit network.
3 No route to destination.
Table 39: Resources Unavailable
Cause Value Meaning
35 Requested VPCI/VCI not available.
37 User cell rate not available (UNI3.1 only).
38 Network out of order.
41 Temporary failure.
45 No VPCI/VCI available.
47 Resource unavailable, unspecified.
49 Quality of Service unavailable.
51 User cell rate not available (UNI3.0 only).
58 Bearer capability not presently available.
63 Service or option not available, unspecified.
92 Too many pending add party requests.
Table 39: Resources Unavailable
Cause Value Meaning

A T M S i g n a l l i n g M o n i t o r i n g T a b l e V i e w
S P E C T R U M E n t e r p r i s e M a n a g e r P a g e 132 S m a r t S w i t c h 9 0 0 0 / 9 5 0 0
-
Message ErrorsNumber of Incorrect Messages detected on this interface. The Incorrect Messages Counter reflects any sort of incorrect information in a message. This includes:
• RELEASE, RELEASE COMPLETE, ADD PARTY REJECT, and STATUS messages transmitted, that contain any of the Cause values listed below.
• Ignored messages. These messages are dropped because the message was so damaged that it could not be further processed.
A list of dropped messages is compiled below:
• Message with invalid protocol discriminator
• Message with errors in the call reference I.E.
- Bits 5-8 of the first octet not equal to '0000'
- Bits 1-4 of the first octet indicating a length other than 3 octets
- RELEASE COMPLETE message received with a call reference that does not relate to a call active or in progress
- SETUP message received with call reference flag incorrectly set to 1
- SETUP message received with a call reference for a call that is already active or in progress.
• Message too short
Table 40: Called Party
Cause Value Meaning
17 User busy.
18 No user responding.
21 Call rejected.
22 Number changed.
23 User rejects all calls with calling line identification restriction (CLIR).
27 Destination out of order.
31 Normal, unspecified.
88 Incompatible destination.
Note:Note:
Cause Value #30 'response to STATUS ENQUIRY' was not included in this memo since it did not apply to a hard failure.

A T M S i g n a l l i n g M o n i t o r i n g T a b l e V i e w
S P E C T R U M E n t e r p r i s e M a n a g e r P a g e 133 S m a r t S w i t c h 9 0 0 0 / 9 5 0 0
The following cause values are monitored by this counter. See Table 41 for applicable cause values and meanings. (Note: These cause values apply to both UNI3.0 and UNI3.1 unless otherwise stated):
Calling PartyNumber of Calling Party Events detected on this interface. This counter monitors error events that occur due to the originating user doing something wrong. This counter is incremented when a RELEASE, RELEASE COMPLETE (only when not preceded by a RELEASE message for the same call), ADD PARTY REJECT, or STATUS message that contains one of the following cause code values is received. See Table 42 for applicable cause values and meanings. (Note: These cause values apply to both UNI3.0 and UNI3.1):
Table 41: Message Errors
Cause Value Meaning
10 VPCI/VCI unacceptable (UNI3.0 only).
36 VPCI/VCI assignment failure (UNI3.1 only).
81 Invalid call reference value.
82 Identified channel does not exist.
89 Invalid endpoint reference.
96 Mandatory information element is missing.
97 Message type non-existent or not implemented.
99 Information element non-existent or not implemented.
100 Invalid information element contents.
101 Message not compatible with call state.
104 Incorrect message length.
111 Protocol error, unspecified.
Table 42: Calling Party
Cause Value Meaning
28 Invalid number format (address incomplete).
43 Access information discarded.
57 Bearer capability not authorized.
65 Bearer capability not implemented.
73 Unsupported combination of traffic parameters.
78 AAL parameters cannot be supported (UNI3.1 only).
91 Invalid transit network selection.
93 AAL parameters cannot be supported (UNI3.0 only).

A T M S i g n a l l i n g M o n i t o r i n g T a b l e V i e w
S P E C T R U M E n t e r p r i s e M a n a g e r P a g e 134 S m a r t S w i t c h 9 0 0 0 / 9 5 0 0
Timer ExpiredNumber of Timer Expiries detected on this interface. The Timer Expiries Counter provides a count of network timer expiries, and to some extent, host or switch timer expiries. The conditions for incrementing this counter are:
• Expiry of any network timer
• Receipt of a RELEASE or RELEASE COMPLETE message with Cause #102, 'recovery on timer expiry'.
RestartsNumber of Restart Activity errors detected on this interface. The Restart Activity Counter provides a count of host, switch, or network restart activity. This counter is incremented when receiving a RESTART message.
Incoming SVC VCCs EstablishedNumber of SVC VCCs established at this signalling entity for incoming connections.
Transmitted Events Table
InterfaceThe interface number.
Call Setup AttemptsCall Setup Attempts Counter. This counter counts the number of call setup attempts (both
successful and unsuccessful) transmitted on this interface.
Routes UnavailableNumber of Route Unavailability transmitted from this interface. This counter is incremented when a RELEASE, RELEASE COMPLETE (only when not preceded by a RELEASE message for the same call), ADD PARTY REJECT, or STATUS message that contains one of the following cause code values is transmitted. See Table 38 (Page 131) for applicable cause values and meanings.
Resources UnavailableNumber of Resource Unavailability transmitted from this interface. This counter is incremented when a RELEASE, RELEASE COMPLETE (only when not preceded by a RELEASE message for the same call), ADD PARTY REJECT, or STATUS message that contains one of the following cause code values is transmitted. See Table 39 for applicable cause values and meanings.
Called PartyNumber of Called Party Responsible For Unsuccessful Call transmitted from this interface. This counter is incremented when a RELEASE, RELEASE COMPLETE (only when not preceded by a RELEASE message for the same call), ADD PARTY REJECT, or STATUS message that contains one of the following cause code values is

A T M S i g n a l l i n g M o n i t o r i n g T a b l e V i e w
S P E C T R U M E n t e r p r i s e M a n a g e r P a g e 135 S m a r t S w i t c h 9 0 0 0 / 9 5 0 0
transmitted. See Table 40 for applicable cause values and meanings.
NOTE: For this counter, RELEASE COMPLETE messages that are a reply to a previous RELEASE message and contain the same cause value, are redundant (for counting purposes) and should not be counted.
Message ErrorsNumber of Incorrect Messages transmitted on this interface. The Incorrect Messages Counter reflects any sort of incorrect information in a message. This includes:
• RELEASE, RELEASE COMPLETE, ADD PARTY REJECT, and STATUS messages transmitted or received, that contain any of the Cause values listed below.
- Ignored messages. These messages are dropped because the message was so damaged that it could not be further processed.
A list of dropped messages is compiled below:
• Message with invalid protocol discriminator
• Message with errors in the call reference I.E.
- Bits 5-8 of the first octet not equal to '0000'
- Bits 1-4 of the first octet indicating a length other than 3 octets
- RELEASE COMPLETE message received with a call reference that does not relate to a call active or in progress
- SETUP message received with call reference flag incorrectly set to 1
- SETUP message received with a call reference for a call that is already active or in progress.
• Message too short
The following cause values are monitored by this counter. See Table 41 (Page 133) for applicable cause values and meanings.
Calling PartyNumber of Calling Party Events transmitted from this interface. This counter monitors error events that occur due to the originating user doing something wrong. This counter is incremented when a RELEASE, RELEASE COMPLETE (only when not preceded by a RELEASE message for the same call), ADD PARTY REJECT, or STATUS message that contains one of the following cause
Note:Note:
Cause Value #30 'response to STATUS ENQUIRY' was not included in this memo since it did not apply to a hard failure.

A T M A T M L i n k M o d e l i n g O p t i o n s
S P E C T R U M E n t e r p r i s e M a n a g e r P a g e 136 S m a r t S w i t c h 9 0 0 0 / 9 5 0 0
code values is transmitted. See Table 42 for applicable cause values and meanings.
Timer ExpiredNumber of Timer Expiries transmitted from this interface. The Timer Expiries Counter provides a count of network timer expiries, and to some extent, host or switch timer expiries. The conditions for incrementing this counter are:
• Expiry of any network timer
• Receipt of a RELEASE or RELEASE COMPLETE message with Cause #102, 'recovery on timer expiry'.
RestartsNumber of Restart Activity errors transmitted from this interface. The Restart Activity Counter provides a count of host, switch, or network restart activity. This counter is incremented when transmitting a RESTART message.
Outgoing SVC VCCs EstablishedNumber of SVC VCCs established at this signalling entity for outgoing connections.
ATM Link Modeling OptionsAccess: From the Icon Subviews menu for the SwitchApplication icon, select ATM Link Modeling .
This view allows you create link models by following the instructions given in the view. Clicking on the Option Explanations button will display information on the fields in this window and allow you to force a link model reconfiguration.

S P E C T R U M E n t e r p r i s e M a n a g e r P a g e 137 S m a r t S w i t c h 9 0 0 0 / 9 5 0 0
Ethernet
This section provides a table of all the Ethernet models and their associated model types, and the EthernetChassis icons associated with these model types.
OverviewTable 43 represents all the Ethernet Devices available for the SmartSwitch 9000. An example of an Ethernet Chassis module icon and the views available from it can be found in Views and Icons Common to All Technologies (Page 20).
Note:Note:
This section does not contain detailed explanations of any views because all of the views available to Ethernet, Fast Ethernet, and Gigabit Ethernet are described in other SPECTRUM documentation or covered in this manual within another technology section.

E t h e r n e t O v e r v i e w
S P E C T R U M E n t e r p r i s e M a n a g e r P a g e 138 S m a r t S w i t c h 9 0 0 0 / 9 5 0 0
Table 43: Ethernet Model Types
Device Model Type Example Device Icon
9E132-15 MicroLAN Switch Extension Module 9E132-15
9E133-36 MicroLAN Switch Module - TP 9E133-36
9E138-12/36 MicroLAN Switch Module - Fiber 9E138-12/36
Model Name
9E133-36
Model Name
9E133-36

E t h e r n e t O v e r v i e w
S P E C T R U M E n t e r p r i s e M a n a g e r P a g e 139 S m a r t S w i t c h 9 0 0 0 / 9 5 0 0
9E106-06 Ethernet SmartSwitch Module 9E106-06
9E423-36 Ethernet SmartSwitch Module 9E423-36
9E428-12/30 Ethernet SmartSwitch Module 9E428-12/30
9E429-12/36 Ethernet SmartSwitch Module 9E428-12/36
9E531-24 Ethernet Dual INB 9E5xx
9H423-28 SmartSwitch 10/100 Module 9H423-28
9H421-12 Fast Ethernet SmartSwitch Module 9H421-12
9H422-12 Fast Ethernet SmartSwitch Module 9H422-12
9H429-12 Fast Ethernet SmartSwitch Module 9H429-12
9H423-26 SmartSwitch 10/100 Module 9H423-26
9G421-02 Gigabit Ethernet SmartSwitch Module 9G421-02
9H531-17 Fast Ethernet Dual INB 9H5xx
9H531-18 Fast Ethernet Dual INB 9H5xx
9H531-24 Fast Ethernet Dual INB 9H5xx
9H532-17 Fast Ethernet Dual INB 9H5xx
9H532-18 Fast Ethernet Dual INB 9H5xx
9H532-24 Fast Ethernet Dual INB 9H5xx
9H533-24 Fast Ethernet Dual INB 9H5xx
9H539-24 Fast Ethernet Dual INB 9H5xx
9G536-04 Gigabit Ethernt Dual INB 9G5xx
Table 43: Ethernet Model Types
Device Model Type Example Device Icon
Model Name
9E423-36
Model Name
9E423-36
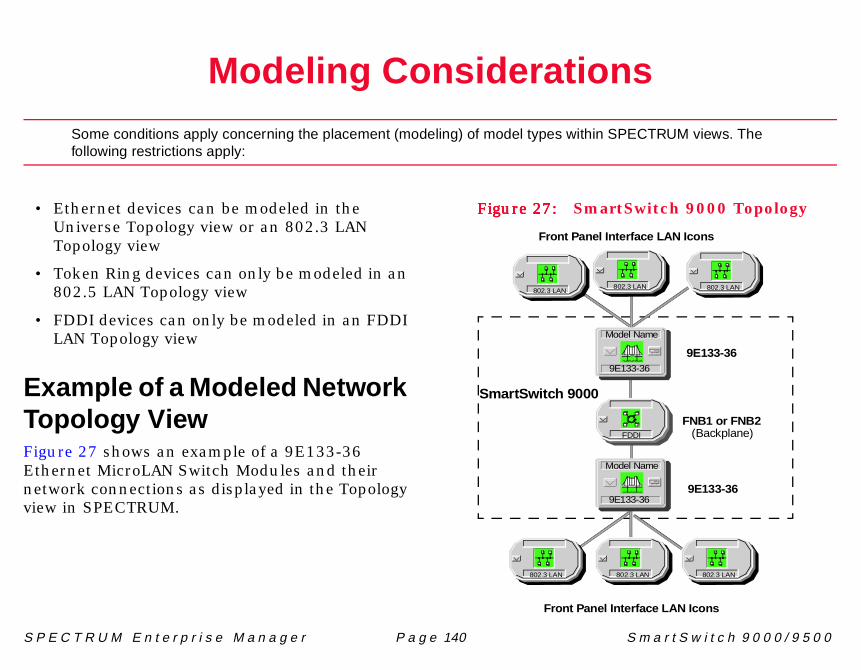
S P E C T R U M E n t e r p r i s e M a n a g e r P a g e 140 S m a r t S w i t c h 9 0 0 0 / 9 5 0 0
Modeling Considerations
Some conditions apply concerning the placement (modeling) of model types within SPECTRUM views. Thefollowing restrictions apply:
• Ethernet devices can be modeled in the Universe Topology view or an 802.3 LAN Topology view
• Token Ring devices can only be modeled in an 802.5 LAN Topology view
• FDDI devices can only be modeled in an FDDI LAN Topology view
Example of a Modeled NetworkTopology ViewFigure 27 shows an example of a 9E133-36 Ethernet MicroLAN Switch Modules and their network connections as displayed in the Topology view in SPECTRUM.
Figure 27:Figure 27:Figure 27:Figure 27: SmartSwitch 9000 Topology
FNB1 or FNB2
Front Panel Interface LAN Icons
Front Panel Interface LAN Icons
(Backplane)
802.3 LAN
9E133-36
FDDI
9E133-36
SmartSwitch 9000
802.3 LAN 802.3 LAN
802.3 LAN 802.3 LAN 802.3 LAN
Model Name
9E133-36
Model Name
9E133-36

M o d e l i n g C o n s i d e r a t i o n s M o d e l i n g U s i n g t h e M o d e l T y p e S m S w C h a s C o n t
S P E C T R U M E n t e r p r i s e M a n a g e r P a g e 141 S m a r t S w i t c h 9 0 0 0 / 9 5 0 0
Modeling Using the ModelType SmSwChasContYou can also model the modules in a Chassis Container using the model type SmSwChasCont. This is a container that is modeled in the Universe view to contain the devices in a given chassis. These devices must be manually modeled in the container or cut and pasted into the Topology view for this container.
The advantage of using the SmSwChasCont model type is that it allows you to group all of your devices in a given chassis into one view, and takes the clutter out of the Universe view.
To navigate down into the Chassis Container SS9000 Topology view, simply double-click the down arrow on the SmSwChasCont icon.
Figure 28:Figure 28:Figure 28:Figure 28: Chassis Container
Note:Note:
You must use the model type, SmSwChasCont. You cannot model by IP address as it is not an actual device.
File View Tools Bookmark
SpectroGRAPH: Topology: Universe
VNM
tutor
SmSwChasCont
Help
File View Tools Bookmark
SpectroGRAPH: Topology: Chas Cont SS9000Help
Model Name
9H423-26
Model Name
9G429-02
Chas Cont SS9000
Model Name
9E133-36
Model Name
9H532-18Model Name
9G536-04
INB
INB
Model Name
9H429-16

M o d e l i n g C o n s i d e r a t i o n s M o d e l i n g U s i n g t h e M o d e l T y p e S m S w C h a s C o n t
S P E C T R U M E n t e r p r i s e M a n a g e r P a g e 142 S m a r t S w i t c h 9 0 0 0 / 9 5 0 0
Table 44 lists the Icon Subviews menu available from the Chassis Container Device icon. These views are specific to using the SmSwChasCont model type and allow for a central place for all chassis information to be accessed.
Table 44: Icon Subviews menu for Chassis Container
Option Accesses the...
Topology Opens the Topology View, which contains the SmartSwitch modules that the user has placed/modeled in the container.
Chassis Applications Opens the Chassis Application View (Page 25).
Device > Chassis Opens the Chassis Device View (Page 30).

S P E C T R U M E n t e r p r i s e M a n a g e r P a g e 143 S m a r t S w i t c h 9 0 0 0 / 9 5 0 0
Manual Modeling
This section details how to manually model your network.
SummaryModeling the SmartSwitch 9000 chassis manually in SPECTRUM involves modeling one of the modules contained within the chassis, locating the SmartSwitch 9000 Location icon in the Lost and Found View, creating a Room Location View and copying the SmartSwitch 9000 Location icon to the Room Location View. From the SmartSwitch 9000 Location View icon you can access the views available for the SmartSwitch 9000 Chassis.
Modeling the modules contained in the SmartSwitch 9000 can be done using AutoDiscovery (refer to the AutoDiscovery User’s Guide) or manually as described in this chapter.
The SmartSwitch 9000 is managed through the icons and views that represent the modules it contains, the Flexible Network Buses (FNB1 and FNB2), the INB, the Environmental Module (EM), and the front panel interfaces.
Preparation and TopologyView DefinitionsBefore modeling the SmartSwitch 9000, you should be familiar with SPECTRUM’s functions as described in the Administration and Operation documentation. You should be familiar with any network management and hardware requirements described in the SmartSwitch 9000 hardware documentation. You will also need to know the IP addresses, MAC addresses, and chassis positions of the modules contained within the SmartSwitch 9000 chassis. A worksheet is provided, for your convenience, to be used during the modeling of your SmartSwitch 9000 and the modules it contains. Use this worksheet to identify the IP address, MAC address, module type, and position of each module. This information will be used to model the modules contained within the SmartSwitch 9000 chassis.

M a n u a l M o d e l i n g M o d e l i n g t h e C h a s s i s
S P E C T R U M E n t e r p r i s e M a n a g e r P a g e 144 S m a r t S w i t c h 9 0 0 0 / 9 5 0 0
For the purpose of this chapter, the Topology Views are defined as follows:
• Topology View refers to the view that the FDDI LAN (backplane), other networks (front panel interfaces), and some modules are modeled in
• FDDI LAN Topology View refers to the view that contains the FddiMAC models that represent the connections to the FNB
Modeling the ChassisThe SmartSwitch 9000 chassis is modeled indirectly using one of the modules it contains. Model one of the modules contained within the chassis as follows:
1 Using a copy of the worksheet provided (Table 45) identify the modules contained in the SmartSwitch 9000 to be modeled.
2 Select one of the modules listed on the worksheet.
3 Refer to Modeling the Modules in the Chassis (Page 147) section and model the selected module.
Once the first module has been modeled and an icon representing that module exists, the Chassis icon is automatically created and placed in the Lost &Found View.

M a n u a l M o d e l i n g M o d e l i n g t h e C h a s s i s
S P E C T R U M E n t e r p r i s e M a n a g e r P a g e 145 S m a r t S w i t c h 9 0 0 0 / 9 5 0 0
Table 45: SmartSwitch 9000 Module Identification Worksheet
ChassisPosition Module Type IP Address MAC Address
Example 9F116-01 192:168:123:45 00:00:12:34:56:78
1
2
3
4
5
6
7
8
9
10
11
12
13
14

M a n u a l M o d e l i n g M o d e l i n g t h e C h a s s i s
S P E C T R U M E n t e r p r i s e M a n a g e r P a g e 146 S m a r t S w i t c h 9 0 0 0 / 9 5 0 0
Placing the Chassis Location Iconin the Location ViewThe Chassis Location icon must be copied into a Room Location View to allow access to the views available from the Location icon. Create a Room Location View as follows:
1 From the View menu select New View > Location.
2 From the File menu select Edit > New Model.
3 Select the desired location (Building, Country, etc.) from the Select Model Type dialog box. Click OK.
4 Enter a Name for the Location View created and a Security String (optional) in the Creating Location dialog box. Click OK.
5 When the icon appears in the Location View, exit the Edit mode.
6 Double-click the icon to open its Location View.
7 Repeat steps 3 through 8 until the Select Model Type dialog box lists the Room Location model type. Create the Room Location model.
8 Locate the Chassis icon in the Lost & Found View as follows:
a Select New View from the View menu.
b Select Lost & Found from the New View menu.
9 Copy the Chassis Location icon into the Room View as follows:
a From the Lost & Found View, select Edit from the File menu.
b Select the MMACPlus model type and select Copy from the Edit menu.
c Go back to the Room Location View and select Edit from the File menu.
d Select Paste from the Edit menu and exit the edit mode.
e Return to the Lost & Found View and click the right mouse button to exit the Edit mode. Click the right mouse button to exit the Lost & Found View.

M a n u a l M o d e l i n g M o d e l i n g t h e C h a s s i s
S P E C T R U M E n t e r p r i s e M a n a g e r P a g e 147 S m a r t S w i t c h 9 0 0 0 / 9 5 0 0
Modeling the Modules in theChassisThe following instructions are used to manually model modules in the SmartSwitch 9000. The “Quick Steps” are intended to provide a basic understanding of the process as well as a quick reference for modeling the modules. For more detailed instructions for modeling modules in the SmartSwitch 9000, refer to the procedures following the “Quick Steps.” To model the modules in the SmartSwitch 9000 using AutoDiscovery, refer to the AutoDiscovery User’s Guide.
Quick Steps1 In the Topology view, create an FDDI LAN
model to represent the FNB (FNB1 or FNB2).
2 In the Topology view, model the modules that can be modeled at this level (from the worksheet) that are connected to the FNB (FNB1 or FNB2) you modeled in step 1.
3 Open the FDDI LAN Topology view and model the modules (from the worksheet) that must be modeled at this level (refer to the Modeling the Chassis (Page 144) section).
4 If you have RingView for FDDI installed, copy at least one model’s FddiMAC Application icon into the FDDI LAN Topology view and select Current View Information from the Icon Subviews menu. Model the ring using the procedures described in the RingView for FDDI User’s Guide.
5 If you do not have RingView for FDDI installed, copy the FddiMAC or GenFDDIMAC Application icon for each module’s model into the FDDI LAN Topology view.
6 Position the FddiMAC or GenFddiMAC icons in a ring in the order described in the Station List for one of the FddiMACs.
7 Connect the FddiMAC or GenFddiMAC icons by drawing pipes between the adjacent icons in the ring.
8 Resolve the adjacent FddiMAC Off-Page Reference icons in the Device Topology views.
Note:Note:
Some modules cannot be modeled in the Universe Topology view. If you attempt to model a module that cannot be modeled at this level, you will get an error message. This indicates that the module must be modeled in the FDDI LAN Topology View described in step 3.

M a n u a l M o d e l i n g M o d e l i n g t h e F l e x i b l e N e t w o r k B u s ( F N B )
S P E C T R U M E n t e r p r i s e M a n a g e r P a g e 148 S m a r t S w i t c h 9 0 0 0 / 9 5 0 0
Modeling the Flexible NetworkBus (FNB)Model an FDDI LAN to represent the FNB (FNB1 or FNB2) as follows:
1 In the Topology View, select Edit from the File menu.
2 Select New Model... from the Edit menu.
3 Select FDDI from the Select Model Type dialog box. Click OK.
4 Enter a Name for the FNB to be created and a Security String (optional) in the Creating FDDI dialog box. Click OK.
5 Click the right mouse button to exit the edit mode.
Modeling the ModulesConnected to the INBWhen modules that are connected to the INB are modeled, the INB is represented by an INB icon. This icon will appear automatically when two or more models are created in SPECTRUM. Model each device using the New Model... or New Model By IP... options. For modeling instructions for those devices also connected to the FNB, refer to Modeling the Modules Connected to the FNB. The following modules may be connected to the INB within the SmartSwitch 9000:
• 9F426-08
• 9E423-24
The INB icon representing the physical connection to the INB will appear as shown below
Figure 29:Figure 29:Figure 29:Figure 29: Modeling Modules Connected to the INB
INB2
Model Name
9E423-24
Model Name
9E423-24
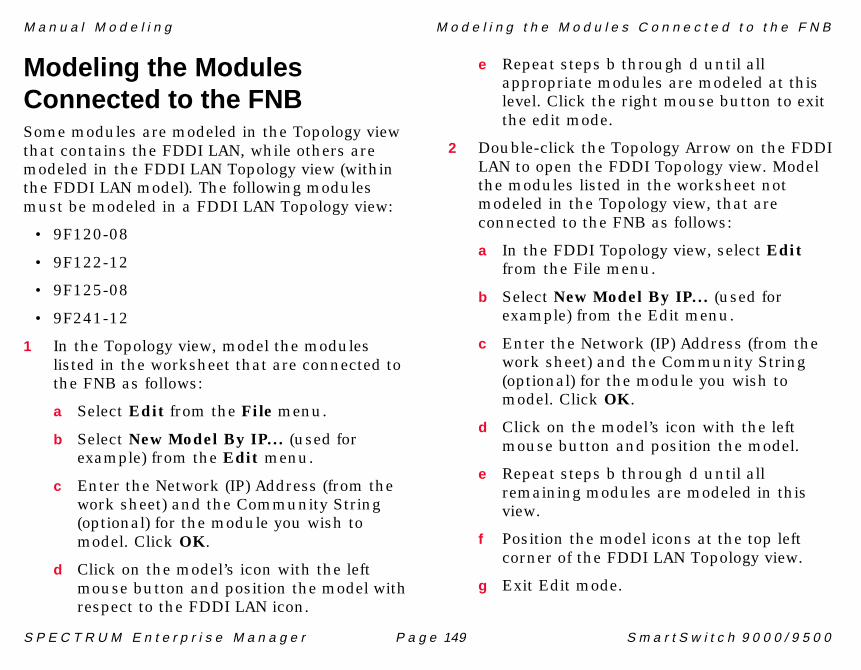
M a n u a l M o d e l i n g M o d e l i n g t h e M o d u l e s C o n n e c t e d t o t h e F N B
S P E C T R U M E n t e r p r i s e M a n a g e r P a g e 149 S m a r t S w i t c h 9 0 0 0 / 9 5 0 0
Modeling the ModulesConnected to the FNBSome modules are modeled in the Topology view that contains the FDDI LAN, while others are modeled in the FDDI LAN Topology view (within the FDDI LAN model). The following modules must be modeled in a FDDI LAN Topology view:
• 9F120-08
• 9F122-12
• 9F125-08
• 9F241-12
1 In the Topology view, model the modules listed in the worksheet that are connected to the FNB as follows:
a Select Edit from the File menu.
b Select New Model By IP... (used for example) from the Edit menu.
c Enter the Network (IP) Address (from the work sheet) and the Community String (optional) for the module you wish to model. Click OK.
d Click on the model’s icon with the left mouse button and position the model with respect to the FDDI LAN icon.
e Repeat steps b through d until all appropriate modules are modeled at this level. Click the right mouse button to exit the edit mode.
2 Double-click the Topology Arrow on the FDDI LAN to open the FDDI Topology view. Model the modules listed in the worksheet not modeled in the Topology view, that are connected to the FNB as follows:
a In the FDDI Topology view, select Edit from the File menu.
b Select New Model By IP... (used for example) from the Edit menu.
c Enter the Network (IP) Address (from the work sheet) and the Community String (optional) for the module you wish to model. Click OK.
d Click on the model’s icon with the left mouse button and position the model.
e Repeat steps b through d until all remaining modules are modeled in this view.
f Position the model icons at the top left corner of the FDDI LAN Topology view.
g Exit Edit mode.

M a n u a l M o d e l i n g B u i l d i n g t h e F N B R i n g i n t h e F D D I L A N T o p o l o g y V i e w
S P E C T R U M E n t e r p r i s e M a n a g e r P a g e 150 S m a r t S w i t c h 9 0 0 0 / 9 5 0 0
Building the FNB Ring in theFDDI LAN Topology ViewThe FNB ring displays the FDDI Media Access Controller (FddiMAC) models or GenFddiMAC models representing the connection to the FNB ring on the backplane. To model the ring automatically use the procedure described in the RingView for FDDI User’s Guide. To build a ring manually you must copy the FddiMAC or GenFddiMAC Application icons from each module’s Application view into the FDDI LAN Topology view as follows:
1 From either the Topology view or the FDDI LAN Topology view, highlight a model icon and select Application from the Icon Subviews menu or double-click the Application view Label.
2 Copy the FddiMAC Application Icon from the Application view as follows:
a Select Edit from the File menu.
b Highlight the FddiMAC Application Icon.
c Select Copy from the Edit menu.
d Exit Edit mode and the Application View.
3 From the Topology view, click the Topology Arrow on the FDDI LAN icon to open the FDDI LAN Topology view.
4 Paste the FddiMAC Application icon into the FDDI LAN Topology View as follows:
a Select Edit from the File menu.
b Select Paste from the Edit menu.
c Drag the FddiMAC or GenFDDIMAC icon to position it in a ring.
d Exit Edit mode.
5 Repeat steps 1 through 4 until all modules have a FddiMAC or GenFDDIMAC icon in the FDDI LAN.

S P E C T R U M E n t e r p r i s e M a n a g e r Page 151 S m a r t S w i t c h 9 0 0 0 / 9 5 0 0
Index
Symbols< Button 82, 85<< Button 82> Button 85>> Button 82
Numerics9A128_01 119A426_01 119A426_02 119A686-04 179E106 129E106_06 129E1132-15 129E133-36 129E138-12 129E138-36 129E312_12 129E423_24 129E423_36 129E423-24 14, 1489E428_12 129E428_36 129E429_12 129E429_36 12
9F116-01 159F120_08 159F120-08 1499F122_12 159F122-12 1499F125_08 159F125-08 1499F241_12 159F241-12 1499F310-02 159F426-02 159F426-03 159F426-08 1489G421-02 169G426-02 169G429-02 169G536-04 149H421_12 149H421-12 149H422-12 149H423_26 149H423_28 149H429-12 149H531-17 139H531-18 139H531-24 139H532-17 139H532-18 13
9H532-24 139H533-24 139H539-24 149M426-02 179T122-08 169T122-24 169T125-08 169T125-24 16
AA/C 75, 78, 80, 81, 82A_Port 58Abort 75
Sequence 81Active
(ACT) 66Monitor 69, 72, 74, 76, 78
Contention 69Error 70
Stations 70ADD Button 85Adding Stations 86Address
Canonical 62Ethernet 24MAC 24, 29

I n d e x I n d e x
S P E C T R U M E n t e r p r i s e M a n a g e r Page 152 S m a r t S w i t c h 9 0 0 0 / 9 5 0 0
Mac 57Management
Source 59Neighbor 118Physical 24Source
Traps 60Admin Reset 93Admin Status 24, 93, 96, 97, 98, 120,
121, 124, 125Administration State 71Administrative Status
Bridging Application 29Aging
Interval 59Alarm 82
Configuration 60Link Error Rate 59State 119States Table Button 79Table Button 68, 73, 75, 77
AlarmsBroadcast 60Collisions 60Error 60Traffic 60
Alignment 61Allowed Station 84
Address Table 71AMP Errors 70ANIM Index 98, 99ANIM Type 99
ApplicationATM (ATMClientApp) 22Bridging (CSIBridge) 22DownLoad (CtDownLoad App) 22Fast Ethernet (FastEnetApp) 22FDDI (FddiMAC) 22Icons 21MIB-II (SNMP2_Agent) 22
Application Access Label 33, 39Application Icon 50Application Label
Icon Subviews 23Apply
Button 82, 86Settings to 82
ATM Access Modules 11ATM Interface Detail View
HEC Errors 92Received 92Total 92Transmitted 92
ATM Link Modeling Options 136ATM Network Interface Modules 17ATM Traffic 126Auto/Full 42AutoDiscovery 143, 147Avail 42
BB_Port 58
Backplane Device View 32Bandwidth 105Bandwidth Utilization% 62Battery Capacity 43Battery Conditions 44Battery Test 45Beacon 55
Recovery 70State 70
Blue 66Broadcast
Alarms 60Threshold 60
Buffer Allocated 99Building
FNB Ring 150Burst 74, 78, 80, 81, 82BW 102Bypassed (BYP) 66
CC_Wrap
A 56B 56S 56
Cancel 83Button 86
Canonical 62, 72Button 72
Capacity 93

I n d e x I n d e x
S P E C T R U M E n t e r p r i s e M a n a g e r Page 153 S m a r t S w i t c h 9 0 0 0 / 9 5 0 0
Carrier Module 17Change Ring Speed 66Changing Ring Security State 86Channel Links 124Channels 119, 122Chassis Device View 32Chassis Environmental
Information 42Chassis Module Icon 33
Application 34Application Display 34Configuration 34Interface 34Model Information 34
Claim Token Errors 70Claim/Beacon Process 55Clear
FilterButton 72
Climate 42Close 69Clp Drop Threshold 103Cnx Table Size 93, 96Collision
Alarms 60Threshold 60
CollisionsOut of Window 61
Commands 69Component Table 23Concentrator 62
Isolated 55
Configuration 116ATM Interface 117
Configuration View 91Address Type 91Admin Address 91Conf VCCs 91Conf VPCs 91CSIIf Port 30Device 23FddiMAC Device 55ILMI VCI 91ILMI VPI 91Max VCCs 91Max VCI Bits 91Max VPI Bits 91Neighbor Address 92Neighbor If Name 92
Configure Station Alarms Button 80Confirguration View
Max VPCs 91Congestion Threshold 103Congestions 76, 78, 81, 82Connecting
Bridge 84Connection Entries 95, 97Contact Status 23Container View 26Copy 146C-ports 16CRC 61Create Model By IP Address Dialog
Box 149
Creating Location dialog box 146Creating PVCs/PVPs 123Cross Connect
Id 125, 126Views 119
CtRouter 22Current CTM Agent 97Current MAC Path 57Current View Information 147Cyclical Redundancy Checks 61
DDedicated Token Ring 16Delete
All Allowed Stations Button 85Deltas Button 73, 75, 77Descr Type 126Detect 55Detected Events Table 130Device Configuration View
FddiMAC 55Device icon 21, 27Device Topology View 47Device Views 26DevTop 34Diag Pwr Bus 43Directed 56Disable 70, 79, 82, 84Disabled
(DIS) 66

I n d e x I n d e x
S P E C T R U M E n t e r p r i s e M a n a g e r Page 154 S m a r t S w i t c h 9 0 0 0 / 9 5 0 0
Disallowed Stations 84DLM_Agent 22DoNotRemove 80DownLoad Application 23Downstream 80DS3 PLCP 116
EEnable 68, 70, 79, 82
With Alarm 84With Remove and Alarm 84
Enable/DisableEthernet Port (Admin Status) 24FDDI Port 55Token Ring Port 67
Enabled (ENB) 66Engine Reset 98Environmental Device View 47Environmental Module 143Environmental Module
Information 45ERCI Low Threshold 103Error 59, 73, 80
Alarms 60Monitor Count
Link 58Monitor Reject Count
Link 59Rate Alarm
Link 59
Rate CutoffLink 58
Rate EstimateLink 58
Report Timer 69Source 61Threshold 61
Ethernet MicroLAN Switch Modules 12
Ethernet SmartSwitch INB 2 Modules 12
FF 42F1 42Fan Status/Speed 42Fast Ethernet INB Modules 14FDDI
Configuration 54Icon Subviews Menu
Selections 54, 55MAC
Device Configuration View 55Model Information 54Node Classes 62Performance 54Station List 54
FDDI Bandwidth 54FDDI LAN Topology View 144FDDI MicroLAN Modules 15
FDDI Port Labels 54FDDI Ring Label 53FDDI SmartSwitch Modules 15FDDI Switch Module 15FddiMAC 147, 150FddiMAC Device Configuration
View 55Firmware
Revision 23Firmware Revision 23Flexible Network Bus 10Flexible Network Buse 143FNB 1 and FNB 2 Icons 40FNB Ring Configuration Window 34FNB-1 Thru 35FNB-1 Wrap Left 35FNB-1 Wrap Right 35FNB-2 Thru 35FNB-2 Wrap Left 35FNB-2 Wrap Right 35Frame
Copied 81Count 70
Frame Rate Label 53, 67Frame Size
Maximum 24FrameCopied 76Frames 73, 80Frequency 77, 81
I n d e x I n d e x
S P E C T R U M E n t e r p r i s e M a n a g e r Page 155 S m a r t S w i t c h 9 0 0 0 / 9 5 0 0
GGauge
Logical 28, 29Gauge Label 29GenFDDIMAC 147, 150Giants 61Gigabit Ethernet SmartSwitch
Modules 16Gray 66Green 66
HH2L Last Change 120, 122H2L Oper Status 120, 121Hardware
Reset 69Hardware Revision 23HEC Errors 92Hi to Lo Dropped Cells 102Hi to Lo Tagged Cells 102Hi to Lo Tx Cells 102High If Index 101, 102High Index 120, 121High VCI 101, 102, 120High VPI 101, 102, 120, 121Host
Configuration 69Error Status 69
Host Ctrl ATM Address 96
Humidity 42
IIcon
Application 22ATM Chassis Module 90Backplane Module 39Chassis Module 33Ethernet Chassis Module 32FDDI Chassis Module 52Interface 28Token Ring Chassis Module 65
Icon mode 21Icon Subviews 50Icon Subviews Menu
Chassis Module 34FDDI Port Label 55FDDI Ring Label 54Interface 30Interface Label 53Token Ring Label 66
IconsDevice 21Interface 28
IF Description 24IF Index 118, 119, 124, 125If Index 99, 100, 102, 103ILMI
VCI 117VPI 117
ILMI Network Prefix Table 127ILMI Network Prefix View 127IN.OUT Header Support 94INB
definition 14INB 1 and INB 2 Icons 40INB Term 43INB2 14In-Band ATM Support 140Index 24, 100, 101, 102, 120, 121, 126Initial (INIT) 66Input Voltage 45Input/Output Power 45Inserted (INS) 66Interface 116, 117
Icon 28Index 24Number 28Type 24
Interface Capability 94Interface Configuration Table 24Interface Device View 47Interface icon 28Interface Labels 33Interface Number Label 28Interface Status Label 33Interface Type and Number Label 33Internal 75, 78, 80, 81, 82Isolated 56Isolated MAC 36Isolating Errors Table Button 73

I n d e x I n d e x
S P E C T R U M E n t e r p r i s e M a n a g e r Page 156 S m a r t S w i t c h 9 0 0 0 / 9 5 0 0
LL2H Last Change 120, 122L2H Oper Status 120, 121Last Change 93, 96, 124, 125Leadership Priority 111, 113Line 74, 78, 80, 81, 82Line Rate 99Link
ErrorMonitor
Count 58Reject Count 59
RateAlarm 59Cutoff 58Estimate 58
Traps 60Links Views 122List mode 21Lo to Hi Dropped Cells 102Lo to Hi Tagged Cells 102Lo to Hi Tx Cells 102Local
A 56AB 56B 56S 56
LogicalFDDI
Icon Subviews Menu Selections 54
Loss of Cell Delineation 118Loss of Frame 119Lost Frames 70, 76, 81Low
Index 120, 121VCI 120VPI 120, 121
Low If Index 100, 101Low VCI 100, 101Low VPI 100, 101
MMAC
Address 29, 57Label 28
Button 72Configuration 56Count 57
MAC Address 29Mac Cnx Entries 93MAC, isolated 36MAC/Canonical 61Main Pwr Bus 42Master 58
Ports 57, 62Max Cnx Entries 96Max Stat Entries 94, 96Max UPC Entries 94Max VCCs 91Max VPCs 91
Max VPI Bits 91Maximum
Frame Size 24Mode (Icon or List) 21Model
FDDI LAN 147Model Information View 30, 48Model Type Label 33, 39Modeling
Flexible Network Bus 148Module 148Modules 148, 149Quick Steps 147
Modify Allowed Station ListButton 72
Modifying the Threshold Settings 83Module Descriptions 11Module Identification Labels 33Module View 26
Filter... 26Search 26Statistics 26
MonitorReject Count
Link Error 59Monitor Count
Link Error 58
NNeighbor

I n d e x I n d e x
S P E C T R U M E n t e r p r i s e M a n a g e r Page 157 S m a r t S w i t c h 9 0 0 0 / 9 5 0 0
Notification Protocol 57Upstream 56, 62
Neighbor Address 118Neighbor Id 99Network
Information 28, 29Port 59
Security 59No_Resource 61Nodal Information 112Nodal Timer Information 114Node Class 62Node Timer Information 114NoEnable 68Non Master Ports 57Non-Op 55
Dup 55NoOperation 69NotRemovable 80Number of ANIMS 94Number of Ifs 99Number of Interfaces 24Number of Queues 99
OOBS
Present 57OCD Events 118Open 69
Status 69
Oper Status 24, 93, 96, 98Oper Time 93, 96, 98Operation Status 24Operational Status 43, 124, 125Optical Bypass Switch 57Out of Window Collisions 61Output Voltage 45Overflow Dropped Cell Count 100
PPackets
Giant 61Runt 61
Param 126Parent ID 112Parent Index 111Paste 146Path
Current MAC 57Path Links 125Paths 119, 122Peak Level 103Peer Group Leader 111, 112Performance View 49PGL State 111Physical 72Physical Address 24Physical Device View 47PNNI Topology State Element 114Policing Support 94
Port 73Action 57Configuration 68, 117Count 59Management 57Notes 67Security
Network 59State 58Type 58
Port ConfigurationFDDI 55Token Ring Port 67
Port Configuration View 57Port Label 66Port Number Label 53, 54Port Status Label 53, 54, 66Port Type Label 28, 29Ports
Master 57, 62Network 59Non Master 57On 59Operational 59
Power Subsystem 42Preferred PGL 112, 113Protocol
Neighbor Notification 57PTSE Information 114PVP 123

I n d e x I n d e x
S P E C T R U M E n t e r p r i s e M a n a g e r Page 158 S m a r t S w i t c h 9 0 0 0 / 9 5 0 0
QQuality of Service 126Queue Index 103
RRcv Descr Index 125, 126Read Button 83, 86Reading Thresholds from a
Station 83Receive Congestion 80Received 92Red 66Redundancy 42Re-elect Time 111Remove 80
Station Button 74, 76, 78, 79Repeater
ConfigurationView 59
Management 59Repeater Labels 53Reset 98Restricted Rights Notice 2Ring
Alarm 70Configuration 69
Button 68Name 68, 69, 71, 72, 74, 76, 78Number 68, 69, 71, 72, 74, 76, 78
Operational 55Port ON Out Of 68Purges 70Security Button 68Speed 68, 69, 71, 72, 74, 76, 78State 55, 70Status 68, 69, 71, 72, 74, 76, 78Threshold 70Timebase 70Topology 62
Ring Identification Label 54Ring Speed 66Ring Speed Label 66Ring States
FDDI 55RingIn/Ring Out and Ring Status
Labels 67Ring-Op
Dup 55RingView 147RM Threshold 103RMONApp 22Row Status 121, 122, 125, 126, 127Run Time 43Runts 61Rx Cell Count 100Rx Cells 99Rx Cnx Lookup Invalid Errors 100Rx Errors 100
SSecurity
Network Port 59Security Administration State 84SEFSs 119Segmentation Traps 60Select Model Type dialog box 146Set Filter Button 72SFCS MIB Rev 96SFCS MIB Version 96SFVLANApp 22Sig Stack Id 99Signalling Monitoring Table 130Size 102Slave 58Slot Index 96, 97, 98Slot Number Label 33SmartCell Switches 17SMB 1 and SMB 10 Icons 39SmSwChasCont 141SMT
Information 57Version 57
SoftwareReset 69Sort
DownButton 72
UpButton 72
SourceAddress

I n d e x I n d e x
S P E C T R U M E n t e r p r i s e M a n a g e r Page 159 S m a r t S w i t c h 9 0 0 0 / 9 5 0 0
Traps 60Error 61
Source AddressManagement 59
SSCOP Table 130Stat Entries 95Stat Table Size 94, 96State 82Station 62, 82
Address 73, 74, 76, 78, 79Alarms
Button 74, 76, 78, 79Dialog Box 81
Configuration View 55Detail
Button 74, 76, 77, 79Management 57Name 73, 74, 76, 78, 79Port 80
ON Out Of 68Priority 80
Station Configuration 55Station Detail View 67Stats Enable 101Stats Entries 97Stats Table Counter Size 101Status 42, 43
Administrative 28SVC Support 113SVCC Information 115Svcc Variable Information 114Switch Capacity 96
Switch Host Port 96Switched Virtual Channel 115Switched Virtual Channel Cross
Connect Table 128
TTarget Token Rotation Time 57Tasks 18TDM Cell Count 95, 97TDM Utilization 95, 97Temp 42Threshold 82
Broadcast 60Collision 60Error 61Traffic 60
Thresholds 115Thru 56Time
Target Token Rotation 57Valid Transmission 57
Timebase 60Timers 114, 115T-Neg 57T-Notify 57Token 77, 81
Errors 70Ring
Security Configuration View 71
StationAlarm Thresholds View 74Detail View 79Non-Isolating Errors
View 76Table View 72
Rotation TimeTarget 57
Token Ring Label 66Change Ring Speed 66Configuration 66Model Information 66Station Errors 66Stations 66
Token Ring Port Labels 66Token Ring SmartSwitch Module 16Topology View 144Total 42, 92
Allowed Stations 71Totals Button 73, 75, 77TR Ring Configuration View 68, 69Trace 56Trademarks 2Traffic
Alarms 60Threshold 60
Traffic Parameters 126Transmission Convergence
TC Alarm State 118TC Sublayer 116
Transmitted 92Trap

I n d e x I n d e x
S P E C T R U M E n t e r p r i s e M a n a g e r Page 160 S m a r t S w i t c h 9 0 0 0 / 9 5 0 0
Configuration 59Trap Table 24Traps
Link 60Segmentation 60Source Address 60
T-Req 57TTRT 57TVX 57Tx Cell Count 100Tx Cells 99, 103Tx Cells Discarded 103Tx Cells Dropped 103Tx Table Size 94Type 24, 99, 101Type of Switch 94
UUASs 119Un-Sort
Button 72UPC Enable 101UPC Entries 95, 97Update
Button 72, 75, 77, 78UPS Configuration Information
View 44UPS/Battery 43Upstream 80Upstream Neighbor 56, 62
Used 42
VValid Transmission Time 57VC Cross Connect 119VCC 117VCI 117, 124, 128VCL Statistics Table 128View
Application 150FDDI LAN Topology 144, 147, 150Lost & Found 146Room Location 146Topology 144
VirtualChannel Links 124Channels 119, 122Paths 119, 122
Virtual Path Links 125Voltage 45VP Cross Connect 121VPC 117VPI 124, 125VPI Lookup Invalid Errors 100
Wworksheet 143Wrap
A 56AB 56B 56S 56
Wrapped (WRP) 66
XXmit Descr Index 125, 126
YYellow 66