FNB book v5b
93
Contents ORIGINAL RESEARCH Anemia determinants Determinants of anemia among pregnant women in Mali —M. Ag Ayoya, G. M. Spiekermann-Brouwer, A. K. Traoré, R. J. Stoltzfus, and C. Garza ............................................................ 3 Iodine intake Urinary iodine concentration of pregnant women and female adolescents as an indicator of excessive iodine intake in Sri Lanka —K. D. R. R. Silva and D. L. L. Munasinghe .................................................... 12 Iron fortification Fortification of soy sauce using various iron sources: Sensory acceptability and shelf stability —R. Watanapaisantrakul, V. Chavasit, and R. Kongkachuichai ........................................................................ 19 Weaning food supplementation Development of weaning food from sorghum supplemented with legumes and oil seeds —M. A. Asma, E. B. El Fadil, and A. H. El Tinay ................................................................................................ 26 Growth monitoring Accuracy of child growth-monitoring weights obtained by commune volunteers in Phu Tho Province, Vietnam —V. T. Huong, T. D. Thach, T. Tuan, T. T. Ha, and D. R. Marsh ................................................. 35 Adolescent obesity Prevalence of obesity, overweight, and underweight in Qatari adolescents —A. Bener ............................... 39 SPECIAL SECTION World Food Program Nutrition Policy Papers Editorial commentary —P. Webb .................................................................................................................... 46 Food for nutrition: Mainstreaming nutrition in WFP........................................................................................... 47 Nutrition in emergencies: WFP experiences and challenges ................................................................................. 57 Micronutrient fortification: WFP experiences and ways forward ......................................................................... 67 The 2005 Abraham Horwitz Award for Leadership in Inter-American Health Address —R. Uauy ............... y y 76 Book reviews ............................................................................................................................................................ 80 News and notes ........................................................................................................................................................ 83 UNU Food and Nutrition Program .......................................................................................................................... 87
Transcript of FNB book v5b

Contents
ORIGINAL RESEARCH
Anemia determinants
Determinants of anemia among pregnant women in Mali —M. Ag Ayoya, G. M. Spiekermann-Brouwer, A. K. Traoré, R. J. Stoltzfus, and C. Garza ............................................................ 3
Iodine intake
Urinary iodine concentration of pregnant women and female adolescents as an indicator of excessive iodine intake in Sri Lanka —K. D. R. R. Silva and D. L. L. Munasinghe .................................................... 12
Iron fortifi cation
Fortification of soy sauce using various iron sources: Sensory acceptability and shelf stability —R. Watanapaisantrakul, V. Chavasit, and R. Kongkachuichai ........................................................................ 19
Weaning food supplementation
Development of weaning food from sorghum supplemented with legumes and oil seeds —M. A. Asma, E. B. El Fadil, and A. H. El Tinay ................................................................................................—M. A. Asma, E. B. El Fadil, and A. H. El Tinay ................................................................................................—M. A. Asma, E. B. El Fadil, and A. H. El Tinay 26
Growth monitoring
Accuracy of child growth-monitoring weights obtained by commune volunteers in Phu Tho Province, Vietnam —V. T. Huong, T. D. Thach, T. Tuan, T. T. Ha, and D. R. Marsh ................................................. 35
Adolescent obesity
Prevalence of obesity, overweight, and underweight in Qatari adolescents —A. Bener ............................... 39
SPECIAL SECTION
World Food Program Nutrition Policy PapersEditorial commentary —P. Webb .................................................................................................................... 46Food for nutrition: Mainstreaming nutrition in WFP ........................................................................................... 47Nutrition in emergencies: WFP experiences and challenges ................................................................................. 57Micronutrient fortification: WFP experiences and ways forward ......................................................................... 67
The 2005 Abraham Horwitz Award for Leadership in Inter-American Health Address —R. Uauy ...............R. Uauy ...............R. Uauy 76
Book reviews ............................................................................................................................................................ 80
News and notes ........................................................................................................................................................ 83
UNU Food and Nutrition Program .......................................................................................................................... 87
Food and Nutrition Bulletin, vol. 27, no. 1© The United Nations University, 2006United Nations University PressPublished by the International Nutrition Foundation for The United Nations University53-70 Jingumae 5-chome, Shibuya-ku, Tokyo 150-8925, JapanTel.: (03) 3499-2811 Fax: (03) 3406-7345E-mail: [email protected] 0379-5721Design and production by Digital Design Group, Newton, MA USAPrinted on acid-free paper by Webcom Ltd., Toronto, ON Canada
Food and Nutrition Bulletin
Editor: Dr. Irwin H. Rosenberg, Friedman School of Nutrition Science and Policy, Tufts University, Boston, Mass., USA
Senior Associate Editor: Dr. Nevin S. ScrimshawAssociate Editor—Food Policy and Agriculture:
Dr. Suresh Babu, International Food Policy Research Institute (IFPRI), Washington, DC, USA
Associate Editor—Food Science and Technology: Dr. V. Prakash, Central Food Technological Research Institute (CFTRI), Mysore, India
Statistical Advisor—Dr. William M. Rand, Tufts University School of Medicine, Boston, Mass., USA
Managing Editor: Ms. Susan KarczManuscripts Editor: Mr. Jonathan HarringtonCopyeditor: Ms. Ellen DuffEditorial Assistant: Ms. Ellyson R. Stout
Editorial Board:Dr. Ricardo Bressani, Institute de Investigaciones, Universidad del Valle
de Guatemala, Guatemala City, GuatemalaDr. Hernán Delgado, Director, Institute of Nutrition of Central America
and Panama (INCAP), Guatemala City, GuatemalaDr. Cutberto Garza, Academic Vice President and Dean of Faculties, Boston
College, Chestnut Hill, Mass., USADr. Joseph Hautvast, Secretary General, International Union of Nutritional
Sciences (IUNS), Department of Human Nutrition, Agricultural University, Wageningen, Netherlands
Dr. Peter Pellett, Professor, Department of Food Science and Nutrition, University of Massachusetts, Amherst, Mass., USA
Dr. Zewdie Wolde-Gabreil, Director, Ethiopian Nutrition Institute, Addis Ababa, Ethiopia
Dr. Aree Valyasevi, Professor and Institute Consultant, Mahidol University, Bangkok, Thailand
Food and Nutrition Bulletin, vol. 27, no. 1 © 2006, The United Nations University. 3
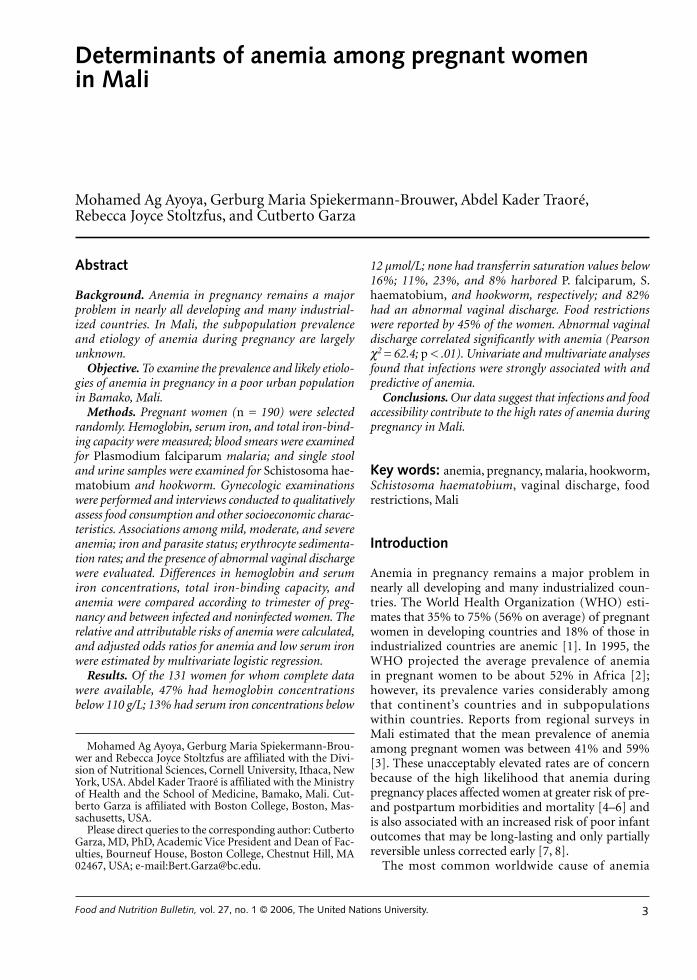
Abstract
Background. Anemia in pregnancy remains a major problem in nearly all developing and many industrial-ized countries. In Mali, the subpopulation prevalence and etiology of anemia during pregnancy are largely unknown.
Objective. To examine the prevalence and likely etiolo-gies of anemia in pregnancy in a poor urban population in Bamako, Mali.
Methods. Pregnant women (n = 190) were selected randomly. Hemoglobin, serum iron, and total iron-bind-ing capacity were measured; blood smears were examined for Plasmodium falciparum malaria; and single stool and urine samples were examined for Schistosoma hae-matobium and hookworm. Gynecologic examinations were performed and interviews conducted to qualitatively assess food consumption and other socioeconomic charac-teristics. Associations among mild, moderate, and severe anemia; iron and parasite status; erythrocyte sedimenta-tion rates; and the presence of abnormal vaginal discharge were evaluated. Differences in hemoglobin and serum iron concentrations, total iron-binding capacity, and anemia were compared according to trimester of preg-nancy and between infected and noninfected women. The relative and attributable risks of anemia were calculated, and adjusted odds ratios for anemia and low serum iron were estimated by multivariate logistic regression.
Results. Of the 131 women for whom complete data were available, 47% had hemoglobin concentrations below 110 g/L; 13% had serum iron concentrations below
12 µmol/L; none had transferrin saturation values below 16%; 11%, 23%, and 8% harbored P. falciparum, S. haematobium, and hookworm, respectively; and 82% had an abnormal vaginal discharge. Food restrictions were reported by 45% of the women. Abnormal vaginal discharge correlated significantly with anemia (Pearson χ2 = 62.4; p < .01). Univariate and multivariate analyses found that infections were strongly associated with and predictive of anemia.
Conclusions. Our data suggest that infections and food accessibility contribute to the high rates of anemia during pregnancy in Mali.
Key words: anemia, pregnancy, malaria, hookworm, Schistosoma haematobium, vaginal discharge, food restrictions, Mali
Introduction
Anemia in pregnancy remains a major problem in nearly all developing and many industrialized coun-tries. The World Health Organization (WHO) esti-mates that 35% to 75% (56% on average) of pregnant women in developing countries and 18% of those in industrialized countries are anemic [1]. In 1995, the WHO projected the average prevalence of anemia in pregnant women to be about 52% in Africa [2]; however, its prevalence varies considerably among that continent’s countries and in subpopulations within countries. Reports from regional surveys in Mali estimated that the mean prevalence of anemia among pregnant women was between 41% and 59% [3]. These unacceptably elevated rates are of concern because of the high likelihood that anemia during pregnancy places affected women at greater risk of pre- and postpartum morbidities and mortality [4–6] and is also associated with an increased risk of poor infant outcomes that may be long-lasting and only partially reversible unless corrected early [7, 8].
The most common worldwide cause of anemia
Determinants of anemia among pregnant women in Mali
Mohamed Ag Ayoya, Gerburg Maria Spiekermann-Brou-wer and Rebecca Joyce Stoltzfus are affiliated with the Divi-sion of Nutritional Sciences, Cornell University, Ithaca, New York, USA. Abdel Kader Traoré is affiliated with the Ministry of Health and the School of Medicine, Bamako, Mali. Cut-berto Garza is affiliated with Boston College, Boston, Mas-sachusetts, USA.
Please direct queries to the corresponding author: Cutberto Garza, MD, PhD, Academic Vice President and Dean of Fac-ulties, Bourneuf House, Boston College, Chestnut Hill, MA 02467, USA; e-mail:[email protected].
Mohamed Ag Ayoya, Gerburg Maria Spiekermann-Brouwer, Abdel Kader Traoré, Rebecca Joyce Stoltzfus, and Cutberto Garza
4
during pregnancy is purported to be iron deficiency due to chronically inadequate dietary iron; this inad-equacy is heightened by the physiologic demands for this essential element imposed by fetal needs and maternal blood volume expansion during pregnancy. In many tropical regions, the absorption of dietary iron and the utilization of endogenous and exogenous iron are also influenced adversely by common states of chronic infection and inflammation due to malaria and multiple helminthic infections [9–11]. The rela-tive impacts of these potential causes vary by sex, age, geography, and various other sociodemographic risk factors that are not well described in most presumably iron-deficient populations [10].
The subpopulation prevalence and etiology of anemia during pregnancy are largely unknown in Mali. Thus, a cross-sectional study was undertaken to exam-ine the prevalence of anemia during pregnancy and the likely etiologic factors associated with it in a presum-ably high-risk population. The study was designed to assess relationships among anemia, malaria, and other parasitic diseases (e.g., hookworm and schis-tosomiasis), inform local and regional micronutrient fortification and supplementation policies, promote effective prevention and control strategies in Mali, and identify research needs to strengthen those aims in future efforts undertaken by the government and other actors with interests in enhancing the well-being of pregnant women.
Methods
The study was conducted in Banconi, one of the poor-est and most densely populated suburban areas of the capital city of Bamako, from June to August 2002. Plasmodium falciparum malaria and infections with Schistosoma haematobium and hookworm were sus-pected to be highly endemic in this area.
The study protocol was reviewed and approved by the Malian Ministry of Health in Bamako, the board of directors and medical staff of the community health center in Bamako, and the Cornell University commit-tee on human subjects, Ithaca, New York, USA. The women were informed individually of the purpose of the study in Bamanan (the local dialect) and asked to sign a consent form prior to enrollment.
Subjects and data collection
The study population consisted of women 18 to 45 years old who were attending the community health center. All pregnant women who visited the center during the study period were invited to participate. None of those invited to participate declined. The eli-gibility criteria for consenting participants included no oral iron or anthelmintic treatment since the beginning
of the pregnancy and no blood transfusion within the 3 months preceding entry into the study. Of the 190 pregnant women enrolled, 131 (69%) provided infor-mation on selected demographic characteristics and food habits and gave blood, urine, and stool specimens for the assessment of various hematologic indicators and chronic infections.
Initial participant interviews were used to ascertain various demographic and dietary factors associated with nutritional risk. Venous blood was obtained for a complete blood count (including hemoglobin concen-tration), for measurement of erythrocyte sedimenta-tion rate, serum iron, and total iron-binding capacity, and to determine the presence of malarial parasitemia. Stool and urine samples were requested to determine whether hookworm or schistosomiasis infection was present. A gynecologic examination also was performed during the initial clinical contact.
All participants were provided with sufficient sup-plements for a 30-day course of ferrous fumarate and folate tablets containing 64 mg of elemental iron and 400 µg of folate. A 4-week course of chloroquine (three 100-mg tablets per week) was also provided as a pre-ventative against malaria.
The examining physician used a structured ques-tionnaire at the initial interview to record the partici-pant’s age, weight, height, parity, stage of pregnancy, diet, marital status, literacy, household possessions, workload, and socioeconomic status. Self-imposed or socially imposed food restrictions were identified and categorized as present or absent, and workloads were classified as unchanged from, less than, or more than those before the current pregnancy.
Weight was measured to the nearest 0.1 kg with a battery-powered electronic scale (Seca, Hamburg, Germany) and height was measured to the nearest 0.1 cm with a locally produced portable instrument whose design is based on a model recommended by UNICEF. Height was measured when the subject was not wearing shoes or head covering.
Venous blood samples (10 mL) were collected from the antecubital fossa by standard antiseptic techniques. Urine and stool samples were collected in the clinic. Women unable to provide a stool sample on the initial visit were asked to bring in a sample on the follow-ing day. All samples were processed on the day of collection.
Complete blood counts were obtained from a Diana-5 hematology analyzer calibrated regularly with appropriate controls according to the manufac-turer’s recommended specifications (Hycel Diagnostics, Massy, France). The erythrocyte sedimentation rate was determined by the Westergren method recommended by the International Committee for Standardization in Hematology [12]. Hemoglobin and serum iron concentrations and total iron-binding capacity were measured. Transferrin saturation was derived from
M. Ag Ayoya et al.
5
serum iron and total iron-binding capacity. Hemo-globin also was measured as part of the complete blood count from the Diana-5 hematology analyzer. Serum iron and total iron-binding capacity were deter-mined with a commercial chemical kit (SCrifer-Kit, BioMérieux, Marcy l’Étoile, France). Women found to have hemoglobin concentrations below 110 g/L were advised to take higher doses of iron/folate according to the type of anemia: i.e., two tablets containing 64 mg elemental iron per day for moderate and mild anemia (70–110 g/L), and three tablets per day for severe anemia (hemoglobin < 70 g/L). Anemic patients were also advised to consume iron-rich foods, such as beef, eggs, and green leafy vegetables.
To detect malaria parasitemia, thick and thin blood films were collected, fixed, and stained with Giemsa and then examined. A minimum of 100 microscopic fields were examined in all blood films. In general, 200 leukocytes were counted, and if fewer than 10 parasites were seen, the microscopist continued counting up to 500 leukocytes. Malarial parasite counts were converted to number of parasites per microliter of whole blood by using the conversion factor 8,000 leukocytes per microliter of blood [13].
Schistosomiasis and hookworm infections were diagnosed by the presence of schistosomes or hook-worm eggs in urine or stool samples, as appropriate. To assess the presence of other helminthic infections, stool samples were also examined macroscopically for general characteristics. Stools were stained by the Kato-Katz method and examined microscopically [14]. For S. haematobium, urine samples were shaken well to ensure adequate dispersal of eggs, and 10 mL was processed by the Nuclepore filtration technique [15]. Schistosome eggs were then detected microscopically after the addition of Lugol iodine solution. Hookworm and schistosomiasis infections were classified as 0 for absent (negative) or + for present (positive).
Abnormal vaginal discharge was defined as a thick, white, gray-white, or yellow-green vaginal discharge with a fetid odor accompanied by itching. Diagnoses were made clinically by an experienced midwife and confirmed by the attending physician. As was done routinely within the health center, metronidazole and nystatine were prescribed to women with this condition.
Those diagnosed with malaria were treated with chloroquine (500 mg per day for 5 days), and those with hookworm eggs received a single dose (400 mg) of albendazole if they were in the second or third tri-mester of pregnancy. For safety reasons, those infected with schistosomiasis were not treated with praziquan-tel. They were, however, informed about their status and advised to report back to the center for treatment after delivery.
Statistical analysis
The data were analyzed by SPSS for Windows version 11.5 (SPSS, Chicago, IL, USA). The frequencies of gen-eral demographic and socioeconomic characteristics were computed, and the prevalence of protein–energy malnutrition (body-mass index < 18.5 kg/m2) was estimated. Mild anemia was defined as a hemoglobin level less than 110 g/L, moderate anemia as a hemo-globin level less than 90 g/L, and severe anemia as a hemoglobin level less than 70 g/L [16]. Low serum iron was defined as an iron level less than 12 µmol/L (normal, 12–30 µmol/L) and high total iron-binding capacity as greater than 64 µmol/L (normal, 32–64 µmol/L). Associations among mild, moderate, and severe anemia, iron and parasite status, erythrocyte sedimentation rate values, and the presence of abnor-mal vaginal discharge were evaluated. Student’s t-test and the χ2 test were used, as appropriate, to compare differences in hemoglobin concentrations, serum iron, and total iron-binding capacity, anemia and serum iron according to trimester of pregnancy between infected and noninfected women.
The relative risks of anemia were calculated for women infected with malaria, schistosomiasis, and hookworm and for those with abnormal vaginal dis-charge. Population-attributable risks [17] were also cal-culated to estimate the proportion of anemia that could be prevented by the elimination of each of the assessed risk factors. The adjusted odds ratios for anemia and low serum iron were estimated from multivariate logis-tic regression models that included gestational stage, helminthic infection, abnormal vaginal discharge, food constraints, and various sociodemographic variables. Unless otherwise stated, all values are presented as means ± SD. A p value less than .05 was used to deter-mine statistical significance.
Results
Complete clinical and biochemical data were obtained from 131 of the 190 women who were enrolled. No significant differences in baseline characteristics were noted between the 59 women who were excluded because of incomplete information and the remainder of the sample. Table 1 summarizes the characteristics of those included in all subsequent analyses. The women included in these analyses ranged in age from 18 to 45 years; 51% were between 20 and 29 years of age. Almost two-thirds (64%) visited the health center for the first time during the second trimester of the index preg-nancy (13 to 24 weeks). The remainder first visited the center during the first or the third trimester (20% and 16%, respectively). Very few were literate (16%), and only 55% came from families that owned the houses in which they lived. Approximately 20% of the women
Anemia among pregnant women in Mali
6
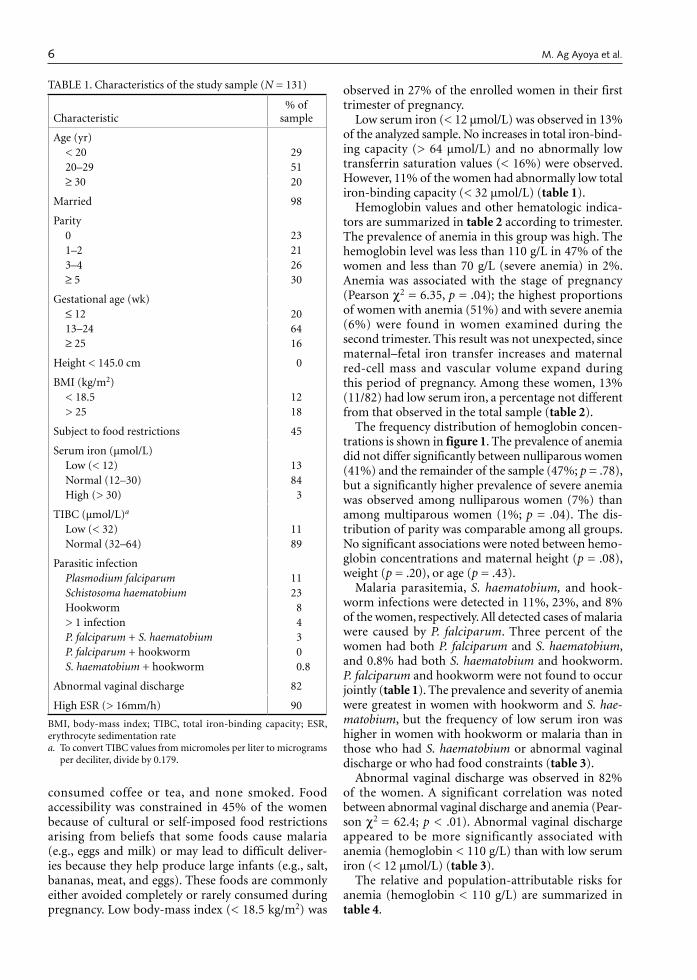
consumed coffee or tea, and none smoked. Food accessibility was constrained in 45% of the women because of cultural or self-imposed food restrictions arising from beliefs that some foods cause malaria (e.g., eggs and milk) or may lead to difficult deliver-ies because they help produce large infants (e.g., salt, bananas, meat, and eggs). These foods are commonly either avoided completely or rarely consumed during pregnancy. Low body-mass index (< 18.5 kg/m2) was
observed in 27% of the enrolled women in their first trimester of pregnancy.
Low serum iron (< 12 µmol/L) was observed in 13% of the analyzed sample. No increases in total iron-bind-ing capacity (> 64 µmol/L) and no abnormally low transferrin saturation values (< 16%) were observed. However, 11% of the women had abnormally low total iron-binding capacity (< 32 µmol/L) (table 1).
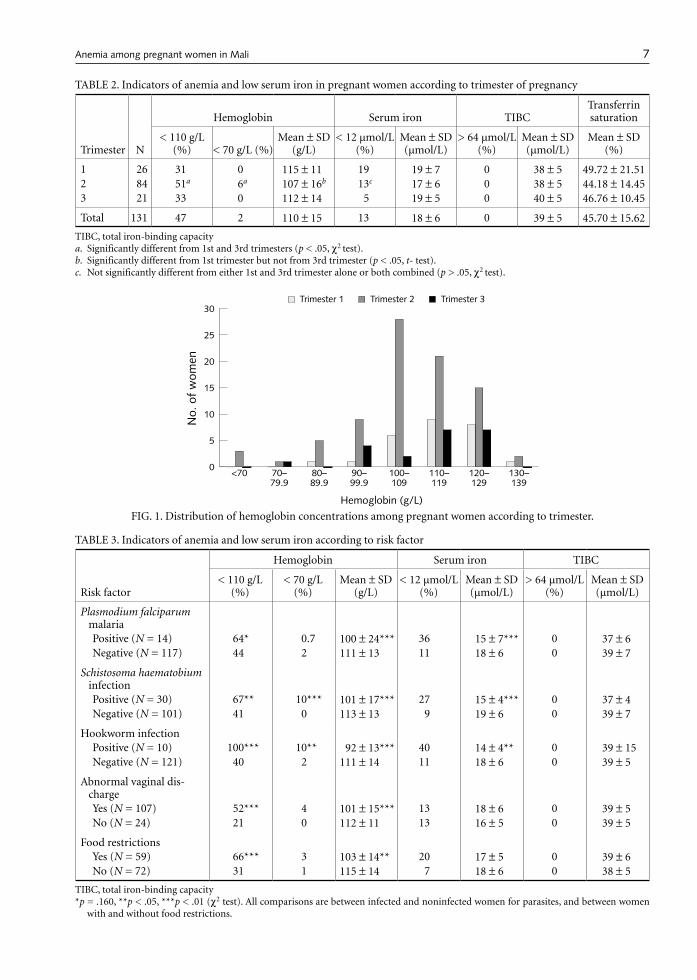
Hemoglobin values and other hematologic indica-tors are summarized in table 2 according to trimester. The prevalence of anemia in this group was high. The hemoglobin level was less than 110 g/L in 47% of the women and less than 70 g/L (severe anemia) in 2%. Anemia was associated with the stage of pregnancy (Pearson χ2 = 6.35, p = .04); the highest proportions of women with anemia (51%) and with severe anemia (6%) were found in women examined during the second trimester. This result was not unexpected, since maternal–fetal iron transfer increases and maternal red-cell mass and vascular volume expand during this period of pregnancy. Among these women, 13% (11/82) had low serum iron, a percentage not different from that observed in the total sample (table 2).
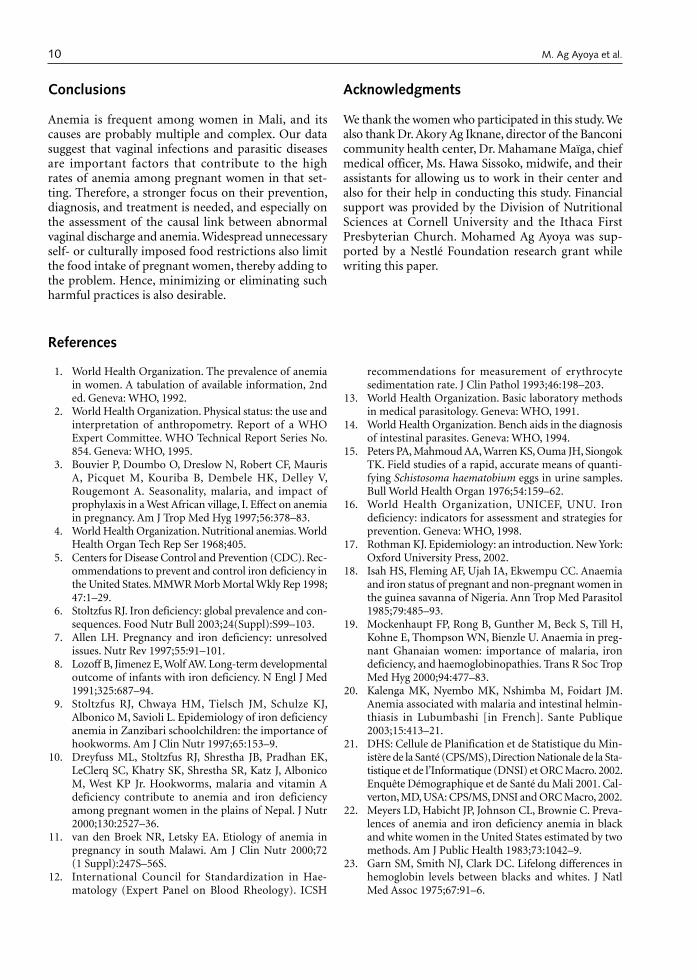
The frequency distribution of hemoglobin concen-trations is shown in figure 1. The prevalence of anemia did not differ significantly between nulliparous women (41%) and the remainder of the sample (47%; p = .78), but a significantly higher prevalence of severe anemia was observed among nulliparous women (7%) than among multiparous women (1%; p = .04). The dis-tribution of parity was comparable among all groups. No significant associations were noted between hemo-globin concentrations and maternal height (p = .08), weight (p = .20), or age (p = .43).
Malaria parasitemia, S. haematobium, and hook-worm infections were detected in 11%, 23%, and 8% of the women, respectively. All detected cases of malaria were caused by P. falciparum. Three percent of the women had both P. falciparum and S. haematobium, and 0.8% had both S. haematobium and hookworm. P. falciparum and hookworm were not found to occur jointly (table 1). The prevalence and severity of anemia were greatest in women with hookworm and S. hae-matobium, but the frequency of low serum iron was higher in women with hookworm or malaria than in those who had S. haematobium or abnormal vaginal discharge or who had food constraints (table 3).
Abnormal vaginal discharge was observed in 82% of the women. A significant correlation was noted between abnormal vaginal discharge and anemia (Pear-son χ2 = 62.4; p < .01). Abnormal vaginal discharge appeared to be more significantly associated with anemia (hemoglobin < 110 g/L) than with low serum iron (< 12 µmol/L) (table 3).
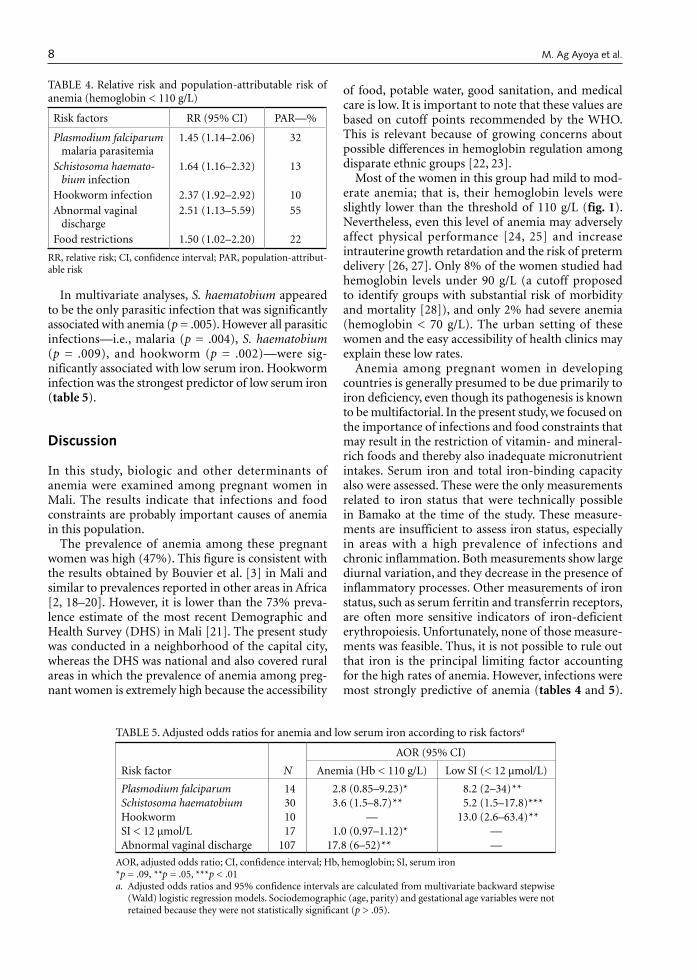
The relative and population-attributable risks for anemia (hemoglobin < 110 g/L) are summarized in table 4.
TABLE 1. Characteristics of the study sample (N = 131)
Characteristic% of
sample
Age (yr)< 20 2920–29 51≥ 30 20
Married 98
Parity0 231–2 213–4 26≥ 5 30
Gestational age (wk)≤ 12 2013–24 64≥ 25 16
Height < 145.0 cm 0
BMI (kg/m2)< 18.5 12> 25 18
Subject to food restrictions 45
Serum iron (µmol/L)Low (< 12) 13Normal (12–30) 84High (> 30) 3
TIBC (µmol/L)a
Low (< 32) 11Normal (32–64) 89
Parasitic infectionPlasmodium falciparum 11Schistosoma haematobium 23Hookworm 8> 1 infection 4P. falciparum + S. haematobium 3P. falciparum + hookworm 0S. haematobium + hookworm 0.8
Abnormal vaginal discharge 82
High ESR (> 16mm/h) 90
BMI, body-mass index; TIBC, total iron-binding capacity; ESR, erythrocyte sedimentation ratea. To convert TIBC values from micromoles per liter to micrograms
per deciliter, divide by 0.179.
M. Ag Ayoya et al.
7
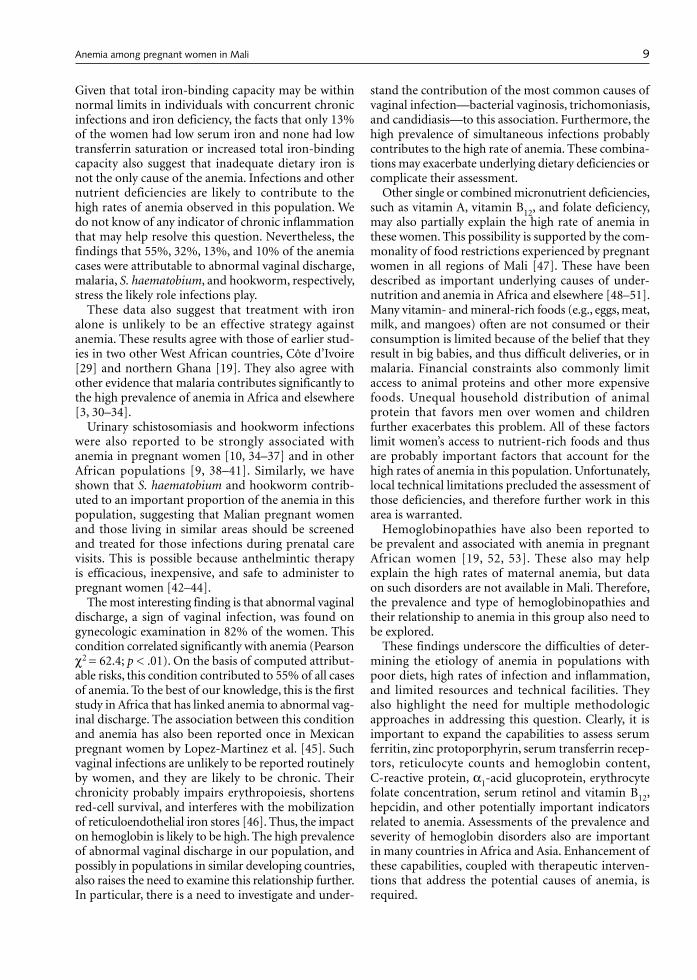
TABLE 2. Indicators of anemia and low serum iron in pregnant women according to trimester of pregnancy
Trimester N
Hemoglobin Serum iron TIBCTransferrin saturation
< 110 g/L (%) < 70 g/L (%)
Mean ± SD (g/L)
< 12 µmol/L (%)
Mean ± SD (µmol/L)
> 64 µmol/L (%)
Mean ± SD (µmol/L)
Mean ± SD (%)
1 26 31 0 115 ± 11 19 19 ± 7 0 38 ± 5 49.72 ± 21.512 84 51a 6a 107 ± 16b 13c 17 ± 6 0 38 ± 5 44.18 ± 14.453 21 33 0 112 ± 14 5 19 ± 5 0 40 ± 5 46.76 ± 10.45
Total 131 47 2 110 ± 15 13 18 ± 6 0 39 ± 5 45.70 ± 15.62
TIBC, total iron-binding capacitya. Significantly different from 1st and 3rd trimesters (p < .05, χ2 test).b. Significantly different from 1st trimester but not from 3rd trimester (p < .05, t- test).c. Not significantly different from either 1st and 3rd trimester alone or both combined (p > .05, χ2 test).
TABLE 3. Indicators of anemia and low serum iron according to risk factor
Risk factor
Hemoglobin Serum iron TIBC
< 110 g/L (%)
< 70 g/L (%)
Mean ± SD (g/L)
< 12 µmol/L (%)
Mean ± SD (µmol/L)
> 64 µmol/L (%)
Mean ± SD (µmol/L)
Plasmodium falciparum malaria Positive (N = 14) 64* 0.7 100 ± 24*** 36 15 ± 7*** 0 37 ± 6Negative (N = 117) 44 2 111 ± 13 11 18 ± 6 0 39 ± 7
Schistosoma haematobium infectionPositive (N = 30) 67** 10*** 101 ± 17*** 27 15 ± 4*** 0 37 ± 4Negative (N = 101) 41 0 113 ± 13 9 19 ± 6 0 39 ± 7
Hookworm infectionPositive (N = 10) 100*** 10** 92 ± 13*** 40 14 ± 4** 0 39 ± 15Negative (N = 121) 40 2 111 ± 14 11 18 ± 6 0 39 ± 5
Abnormal vaginal dis-chargeYes (N = 107) 52*** 4 101 ± 15*** 13 18 ± 6 0 39 ± 5No (N = 24) 21 0 112 ± 11 13 16 ± 5 0 39 ± 5
Food restrictionsYes (N = 59) 66*** 3 103 ± 14** 20 17 ± 5 0 39 ± 6No (N = 72) 31 1 115 ± 14 7 18 ± 6 0 38 ± 5
TIBC, total iron-binding capacity*p = .160, **p < .05, ***p < .01 (χ2 test). All comparisons are between infected and noninfected women for parasites, and between women
with and without food restrictions.
FIG. 1. Distribution of hemoglobin concentrations among pregnant women according to trimester.
�
�
��
��
��
��
��
�������
�������
�������
�������
�������
�������
�������
���
���
����
���
��
����������������
����������� ����������� �����������
Anemia among pregnant women in Mali
8
In multivariate analyses, S. haematobium appeared to be the only parasitic infection that was significantly associated with anemia (p = .005). However all parasitic infections—i.e., malaria (p = .004), S. haematobium (p = .009), and hookworm (p = .002)—were sig-nificantly associated with low serum iron. Hookworm infection was the strongest predictor of low serum iron (table 5).
Discussion
In this study, biologic and other determinants of anemia were examined among pregnant women in Mali. The results indicate that infections and food constraints are probably important causes of anemia in this population.
The prevalence of anemia among these pregnant women was high (47%). This figure is consistent with the results obtained by Bouvier et al. [3] in Mali and similar to prevalences reported in other areas in Africa [2, 18–20]. However, it is lower than the 73% preva-lence estimate of the most recent Demographic and Health Survey (DHS) in Mali [21]. The present study was conducted in a neighborhood of the capital city, whereas the DHS was national and also covered rural areas in which the prevalence of anemia among preg-nant women is extremely high because the accessibility
of food, potable water, good sanitation, and medical care is low. It is important to note that these values are based on cutoff points recommended by the WHO. This is relevant because of growing concerns about possible differences in hemoglobin regulation among disparate ethnic groups [22, 23].
Most of the women in this group had mild to mod-erate anemia; that is, their hemoglobin levels were slightly lower than the threshold of 110 g/L (fig. 1). Nevertheless, even this level of anemia may adversely affect physical performance [24, 25] and increase intrauterine growth retardation and the risk of preterm delivery [26, 27]. Only 8% of the women studied had hemoglobin levels under 90 g/L (a cutoff proposed to identify groups with substantial risk of morbidity and mortality [28]), and only 2% had severe anemia (hemoglobin < 70 g/L). The urban setting of these women and the easy accessibility of health clinics may explain these low rates.
Anemia among pregnant women in developing countries is generally presumed to be due primarily to iron deficiency, even though its pathogenesis is known to be multifactorial. In the present study, we focused on the importance of infections and food constraints that may result in the restriction of vitamin- and mineral-rich foods and thereby also inadequate micronutrient intakes. Serum iron and total iron-binding capacity also were assessed. These were the only measurements related to iron status that were technically possible in Bamako at the time of the study. These measure-ments are insufficient to assess iron status, especially in areas with a high prevalence of infections and chronic inflammation. Both measurements show large diurnal variation, and they decrease in the presence of inflammatory processes. Other measurements of iron status, such as serum ferritin and transferrin receptors, are often more sensitive indicators of iron-deficient erythropoiesis. Unfortunately, none of those measure-ments was feasible. Thus, it is not possible to rule out that iron is the principal limiting factor accounting for the high rates of anemia. However, infections were most strongly predictive of anemia (tables 4 and 5).
TABLE 4. Relative risk and population-attributable risk of anemia (hemoglobin < 110 g/L)
Risk factors RR (95% CI) PAR—%
Plasmodium falciparum malaria parasitemia
1.45 (1.14–2.06) 32
Schistosoma haemato-bium infection
1.64 (1.16–2.32) 13
Hookworm infection 2.37 (1.92–2.92) 10Abnormal vaginal
discharge2.51 (1.13–5.59) 55
Food restrictions 1.50 (1.02–2.20) 22
RR, relative risk; CI, confidence interval; PAR, population-attribut-able risk
TABLE 5. Adjusted odds ratios for anemia and low serum iron according to risk factorsa
Risk factor N
AOR (95% CI)
Anemia (Hb < 110 g/L) Low SI (< 12 µmol/L)
Plasmodium falciparum 14 2.8 (0.85–9.23)* 8.2 (2–34)**Schistosoma haematobium 30 3.6 (1.5–8.7)** 5.2 (1.5–17.8)***Hookworm 10 — 13.0 (2.6–63.4)**SI < 12 µmol/L 17 1.0 (0.97–1.12)* —Abnormal vaginal discharge 107 17.8 (6–52)** —
AOR, adjusted odds ratio; CI, confidence interval; Hb, hemoglobin; SI, serum iron*p = .09, **p = .05, ***p < .01a. Adjusted odds ratios and 95% confidence intervals are calculated from multivariate backward stepwise
(Wald) logistic regression models. Sociodemographic (age, parity) and gestational age variables were not retained because they were not statistically significant (p > .05).
M. Ag Ayoya et al.
9
Given that total iron-binding capacity may be within normal limits in individuals with concurrent chronic infections and iron deficiency, the facts that only 13% of the women had low serum iron and none had low transferrin saturation or increased total iron-binding capacity also suggest that inadequate dietary iron is not the only cause of the anemia. Infections and other nutrient deficiencies are likely to contribute to the high rates of anemia observed in this population. We do not know of any indicator of chronic inflammation that may help resolve this question. Nevertheless, the findings that 55%, 32%, 13%, and 10% of the anemia cases were attributable to abnormal vaginal discharge, malaria, S. haematobium, and hookworm, respectively, stress the likely role infections play.
These data also suggest that treatment with iron alone is unlikely to be an effective strategy against anemia. These results agree with those of earlier stud-ies in two other West African countries, Côte d’Ivoire [29] and northern Ghana [19]. They also agree with other evidence that malaria contributes significantly to the high prevalence of anemia in Africa and elsewhere [3, 30–34].
Urinary schistosomiasis and hookworm infections were also reported to be strongly associated with anemia in pregnant women [10, 34–37] and in other African populations [9, 38–41]. Similarly, we have shown that S. haematobium and hookworm contrib-uted to an important proportion of the anemia in this population, suggesting that Malian pregnant women and those living in similar areas should be screened and treated for those infections during prenatal care visits. This is possible because anthelmintic therapy is efficacious, inexpensive, and safe to administer to pregnant women [42–44].
The most interesting finding is that abnormal vaginal discharge, a sign of vaginal infection, was found on gynecologic examination in 82% of the women. This condition correlated significantly with anemia (Pearson χ2 = 62.4; p < .01). On the basis of computed attribut-able risks, this condition contributed to 55% of all cases of anemia. To the best of our knowledge, this is the first study in Africa that has linked anemia to abnormal vag-inal discharge. The association between this condition and anemia has also been reported once in Mexican pregnant women by Lopez-Martinez et al. [45]. Such vaginal infections are unlikely to be reported routinely by women, and they are likely to be chronic. Their chronicity probably impairs erythropoiesis, shortens red-cell survival, and interferes with the mobilization of reticuloendothelial iron stores [46]. Thus, the impact on hemoglobin is likely to be high. The high prevalence of abnormal vaginal discharge in our population, and possibly in populations in similar developing countries, also raises the need to examine this relationship further. In particular, there is a need to investigate and under-
stand the contribution of the most common causes of vaginal infection—bacterial vaginosis, trichomoniasis, and candidiasis—to this association. Furthermore, the high prevalence of simultaneous infections probably contributes to the high rate of anemia. These combina-tions may exacerbate underlying dietary deficiencies or complicate their assessment.
Other single or combined micronutrient deficiencies, such as vitamin A, vitamin B12, and folate deficiency, may also partially explain the high rate of anemia in these women. This possibility is supported by the com-monality of food restrictions experienced by pregnant women in all regions of Mali [47]. These have been described as important underlying causes of under-nutrition and anemia in Africa and elsewhere [48–51]. Many vitamin- and mineral-rich foods (e.g., eggs, meat, milk, and mangoes) often are not consumed or their consumption is limited because of the belief that they result in big babies, and thus difficult deliveries, or in malaria. Financial constraints also commonly limit access to animal proteins and other more expensive foods. Unequal household distribution of animal protein that favors men over women and children further exacerbates this problem. All of these factors limit women’s access to nutrient-rich foods and thus are probably important factors that account for the high rates of anemia in this population. Unfortunately, local technical limitations precluded the assessment of those deficiencies, and therefore further work in this area is warranted.
Hemoglobinopathies have also been reported to be prevalent and associated with anemia in pregnant African women [19, 52, 53]. These also may help explain the high rates of maternal anemia, but data on such disorders are not available in Mali. Therefore, the prevalence and type of hemoglobinopathies and their relationship to anemia in this group also need to be explored.
These findings underscore the difficulties of deter-mining the etiology of anemia in populations with poor diets, high rates of infection and inflammation, and limited resources and technical facilities. They also highlight the need for multiple methodologic approaches in addressing this question. Clearly, it is important to expand the capabilities to assess serum ferritin, zinc protoporphyrin, serum transferrin recep-tors, reticulocyte counts and hemoglobin content, C-reactive protein, α1-acid glucoprotein, erythrocyte folate concentration, serum retinol and vitamin B12, hepcidin, and other potentially important indicators related to anemia. Assessments of the prevalence and severity of hemoglobin disorders also are important in many countries in Africa and Asia. Enhancement of these capabilities, coupled with therapeutic interven-tions that address the potential causes of anemia, is required.
Anemia among pregnant women in Mali
10
Conclusions
Anemia is frequent among women in Mali, and its causes are probably multiple and complex. Our data suggest that vaginal infections and parasitic diseases are important factors that contribute to the high rates of anemia among pregnant women in that set-ting. Therefore, a stronger focus on their prevention, diagnosis, and treatment is needed, and especially on the assessment of the causal link between abnormal vaginal discharge and anemia. Widespread unnecessary self- or culturally imposed food restrictions also limit the food intake of pregnant women, thereby adding to the problem. Hence, minimizing or eliminating such harmful practices is also desirable.
Acknowledgments
We thank the women who participated in this study. We also thank Dr. Akory Ag Iknane, director of the Banconi community health center, Dr. Mahamane Maïga, chief medical officer, Ms. Hawa Sissoko, midwife, and their assistants for allowing us to work in their center and also for their help in conducting this study. Financial support was provided by the Division of Nutritional Sciences at Cornell University and the Ithaca First Presbyterian Church. Mohamed Ag Ayoya was sup-ported by a Nestlé Foundation research grant while writing this paper.
References
1. World Health Organization. The prevalence of anemia in women. A tabulation of available information, 2nd ed. Geneva: WHO, 1992.
2. World Health Organization. Physical status: the use and interpretation of anthropometry. Report of a WHO Expert Committee. WHO Technical Report Series No. 854. Geneva: WHO, 1995.
3. Bouvier P, Doumbo O, Dreslow N, Robert CF, Mauris A, Picquet M, Kouriba B, Dembele HK, Delley V, Rougemont A. Seasonality, malaria, and impact of prophylaxis in a West African village, I. Effect on anemia in pregnancy. Am J Trop Med Hyg 1997;56:378–83.
4. World Health Organization. Nutritional anemias. World Health Organ Tech Rep Ser 1968;405.
5. Centers for Disease Control and Prevention (CDC). Rec-ommendations to prevent and control iron deficiency in the United States. MMWR Morb Mortal Wkly Rep 1998; 47:1–29.
6. Stoltzfus RJ. Iron deficiency: global prevalence and con-sequences. Food Nutr Bull 2003;24(Suppl):S99–103.
7. Allen LH. Pregnancy and iron deficiency: unresolved issues. Nutr Rev 1997;55:91–101.
8. Lozoff B, Jimenez E, Wolf AW. Long-term developmental outcome of infants with iron deficiency. N Engl J Med 1991;325:687–94.
9. Stoltzfus RJ, Chwaya HM, Tielsch JM, Schulze KJ, Albonico M, Savioli L. Epidemiology of iron deficiency anemia in Zanzibari schoolchildren: the importance of hookworms. Am J Clin Nutr 1997;65:153–9.
10. Dreyfuss ML, Stoltzfus RJ, Shrestha JB, Pradhan EK, LeClerq SC, Khatry SK, Shrestha SR, Katz J, Albonico M, West KP Jr. Hookworms, malaria and vitamin A deficiency contribute to anemia and iron deficiency among pregnant women in the plains of Nepal. J Nutr 2000;130:2527–36.
11. van den Broek NR, Letsky EA. Etiology of anemia in pregnancy in south Malawi. Am J Clin Nutr 2000;72 (1 Suppl):247S–56S.
12. International Council for Standardization in Hae-matology (Expert Panel on Blood Rheology). ICSH
recommendations for measurement of erythrocyte sedimentation rate. J Clin Pathol 1993;46:198–203.
13. World Health Organization. Basic laboratory methods in medical parasitology. Geneva: WHO, 1991.
14. World Health Organization. Bench aids in the diagnosis of intestinal parasites. Geneva: WHO, 1994.
15. Peters PA, Mahmoud AA, Warren KS, Ouma JH, Siongok TK. Field studies of a rapid, accurate means of quanti-fying Schistosoma haematobium eggs in urine samples. Bull World Health Organ 1976;54:159–62.
16. World Health Organization, UNICEF, UNU. Iron deficiency: indicators for assessment and strategies for prevention. Geneva: WHO, 1998.
17. Rothman KJ. Epidemiology: an introduction. New York: Oxford University Press, 2002.
18. Isah HS, Fleming AF, Ujah IA, Ekwempu CC. Anaemia and iron status of pregnant and non-pregnant women in the guinea savanna of Nigeria. Ann Trop Med Parasitol 1985;79:485–93.
19. Mockenhaupt FP, Rong B, Gunther M, Beck S, Till H, Kohne E, Thompson WN, Bienzle U. Anaemia in preg-nant Ghanaian women: importance of malaria, iron deficiency, and haemoglobinopathies. Trans R Soc Trop Med Hyg 2000;94:477–83.
20. Kalenga MK, Nyembo MK, Nshimba M, Foidart JM. Anemia associated with malaria and intestinal helmin-thiasis in Lubumbashi [in French]. Sante Publique 2003;15:413–21.
21. DHS: Cellule de Planification et de Statistique du Min-istère de la Santé (CPS/MS), Direction Nationale de la Sta-tistique et de l’Informatique (DNSI) et ORC Macro. 2002. Enquête Démographique et de Santé du Mali 2001. Cal-verton, MD, USA: CPS/MS, DNSI and ORC Macro, 2002.
22. Meyers LD, Habicht JP, Johnson CL, Brownie C. Preva-lences of anemia and iron deficiency anemia in black and white women in the United States estimated by two methods. Am J Public Health 1983;73:1042–9.
23. Garn SM, Smith NJ, Clark DC. Lifelong differences in hemoglobin levels between blacks and whites. J Natl Med Assoc 1975;67:91–6.
M. Ag Ayoya et al.
11
24. Haas JD, Fairchild MV. Summary and conclusions of the International Conference on Iron Deficiency and Behav-ioral Development. Am J Clin Nutr 1988;50:703–5.
25. Haas JD, Brownlie T. Iron deficiency and reduced work capacity: a critical review of the research to determine a causal relationship. J Nutr 2001;131:676S–90S.
26. Scholl TO, Hediger ML, Fischer RL, Shearer JW. Anemia vs iron deficiency: increased risk of preterm delivery in a prospective study. Am J Clin Nutr 1992;55:985–8.
27. Rasmussen KM. Is there a causal relationship between iron deficiency or iron-deficiency anemia and weight at birth, length of gestation and perinatal mortality? J Nutr 2001;131:590S–603S.
28. Stoltzfus RJ. Rethinking anaemia surveillance. Lancet 1997;349:1764–6.
29. Asobayire FS, Adou P, Davidsson L, Cook JD, Hurrell RF. Prevalence of iron deficiency with and without concur-rent anemia in population groups with high prevalences of malaria and other infections: a study in Côte d’Ivoire. Am J Clin Nutr 2001;74:776–82.
30. Brabin BJ, Ginny M, Sapau J, Galme K, Paino J. Conse-quences of maternal anaemia on outcome of pregnancy in a malaria endemic area in Papua New Guinea. Ann Trop Med Parasitol 1990;84:11–24.
31. Fleming AF. The aetiology of severe anaemia in preg-nancy in Ndola, Zambia. Ann Trop Med Parasitol 1989; 83:37–49.
32. Mateelli A, Donato F, Shein A, Muchi JA, Leopardi O, Astori L, Carosi G. Malaria and anemia in pregnant women in urban Zanzibar, Tanzania. Ann Trop Med Parasitol 1994;88:475–83.
33. McGregor IA. Epidemiology, malaria and pregnancy. Am J Trop Med Hyg 1984;33:517–25.
34. Shulman CE, Graham WJ, Jilo H, Lowe BS, New L, Obiero J, Snow RW, Marsh K. Malaria is an important cause of anaemia in primigravidae: evidence from a district hospital in coastal Kenya. Trans R Soc Trop Med Hyg 1996;90:535–9.
35. Greenham R. Anaemia and Schistosoma haematobium infection in the North-Eastern Province of Kenya. Trans R Soc Trop Med Hyg 1978;72:72–5.
36. Olsen A, Magnussen P, Ouma JH, Andreassen J, Friis H. The contribution of hookworm and other parasitic infections to haemoglobin and iron status among chil-dren and adults in western Kenya. Trans R Soc Trop Med Hyg 1998;92:643–9.
37. Bondevik GT, Eskeland B, Ulvik RJ, Ulstein M, Lie RT, Schneede J, Kyale G. Anemia in pregnancy: possible causes and risk factors in Nepali women. Eur J Clin Nutr 2000;54:3–8.
38. Stephenson LS, Latham MC, Kurz KM, Kinoti SN, Oduori ML, Crompton DW. Relationships of Schis-tosoma haematobium, hookworm and malarial infec-tions and metrifonate treatment to haemoglobin
level in Kenyan school children. Am J Trop Med Hyg 1985;34:519–28.
39. Wilkins HA, Goll PH, Moore PJ. Schistosoma haema-tobium infection and haemoglobin concentrations in a Gambian community. Ann Trop Med Parasitol 1985; 79:159–61.
40. Urbani C, Toure A, Hamed AO, Albonico M, Kane I, Cheikna D, Hamed N, Montresor A, Savioli L. Intestinal parasitic infections and schistosomiasis in the valley of the Senegal river in the Islamic Republic of Mauritania [in French]. Med Trop (Mars) 1997;57:157–60.
41. Massawe SN, Ronquist G, Nystrom L, Lindmark G. Iron status and iron deficiency anemia in adolescents in a Tanzanian suburban area. Gynecol Obstet Invest 2002;54:137–44.
42. Allen HE, Crompton DW, de Silva N, LoVerde PT, Olds GR. New policies for using anthelmintics in high risk groups. Trends Parasitol 2002;18:381–2.
43. Stephenson LS, Latham MC. Hookworm. Curr Treat Options Infect Dis 2003;5:291–9.
44. Olds RG. Administration of praziquantel to pregnant and lactating women. Acta Trop 2003;86:185–95.
45. Lopez-Martinez R, Ruiz-Sanchez D, Vertiz-Chavez E. Vag-inal candidosis: opportunistic factors and clinical correla-tion in 600 patients. Mycopathologia 1984;85:167–70.
46. Means RT Jr. Advances in the anemia of chronic disease. Int J Hematol 1999;70:7–12.
47. Ag Ayoya M, Theophin C, Moore EC. Nutrition in Mali: a qualitative study of knowledge, perceptions and practices. Report on preliminary and second analyses of data collected in June 1998 for the Groupe ad hoc Santé, Ministry of Health, Republic of Mali. Washington, DC: Chemonics International, 2001.
48. Houdegbe A. Health problems facing rural women. Child Trop 1985;159:57–61.
49. Igbedioh SO. Undernutrition in Nigeria: dimension, causes and remedies for alleviation in a changing socio-economic environment. Nutr Health 1993;9:1–14.
50. Goodburn L. Bangladesh women report postpartum health problems. Safe Mother. 1994 Feb;(13):3.
51. Marchant T, Armstrong Schellenberg JR, Edgar T, Ronsmans C, Nathan R, Abdulla S, Mukasa O, Urassa H, Lengeler C. Anaemia during pregnancy in southern Tanzania. Ann Trop Med Parasitol 2002;96:477–87.
52. Menendez C, Todd J, Alonso PL, Francis N, Lulat S, Ceesay S, M’Boge B, Greenwood BM. The effects of iron supplementation during pregnancy, given by traditional birth attendants, on the prevalence of anaemia and malaria. Trans R Soc Trop Med Hyg 1994;88:590–3.
53. Brabin BJ, Prinsen-Geerligs PD, Verhoeff FH, Fletcher KA, Chimsuku LH, Ngwira BM, Leich OJ, Broadhead RL. Haematological profiles of the people of rural southern Malawi: an overview. Ann Trop Med Parasitol 2004;98:71–83.
Anemia among pregnant women in Mali
12 Food and Nutrition Bulletin, vol. 27, no. 1 © 2006, The United Nations University.
Abstract
Background. Mild deficiencies and excesses of iodine have deleterious effects in both females and males. The iodine status of the population after implementation of the universal salt iodization program in Sri Lanka is not known.
Objective. This cross-sectional study was carried out to assess the iodine status of pregnant women and female adolescents, with urinary iodine concentration used as the measure of outcome.
Methods. The participants were 100 women in the first trimester of pregnancy and 99 female adolescents
Urinary iodine concentration of pregnant women and female adolescents as an indicator of excessive iodine intake in Sri Lanka
The authors are affiliated with the Department of Applied Nutrition, Faculty of Livestock, Fisheries and Nutrition, Wayamba University of Sri Lanka, Makandura, Gonawila 60170, Sri Lanka.
Please direct queries to the corresponding author: K. D. Renuka R. Silva, Department of Applied Nutrition, Faculty of Livestock, Fisheries and Nutrition, Wayamba University of Sri Lanka, Makandura, Gonawila 60170, Sri Lanka; e-mail: [email protected].
An abstract of this work was published in the Proceed-ings of the 18th International Congress of Nutrition held in Durban, South Africa, September 2005.
References
1. Delange F. Risks and benefits of iodine supplementation. Lancet 1998; 351:923–4.
2. Baltisberger BL, Minder CE, Burgi H. Decrease of inci-dence of toxic nodular goiter in the region of Switzer-land after full correction of mild iodine deficiency. Eur J Endocrinol 1995; 132:546–9.
3. WHO/UNICEF/ICCIDD. Assessment of iodine defi-ciency disorders and monitoring their elimination. A guide for programme managers. 2nd ed, Geneva: WHO/NHD/01.1, 2001. http://www.who.int/nut/documents/assessment_idd_monitoring_eliminination.pdf.
Commentary
Hyperthyroidism is a documented complication of iodine supplementation. In the 1960s, iodine supplementation in Tasmania was provided by tablets of iodide, iodized bread, and the use of iodophors by the milk industry. The incidence of hyperthyroidism increased from 24 per 100,000 in 1963 to 125 per 100,000 in 1967. Since then, iodine-induced hyperthyroidism (IIH) has been accepted as a complication of iodine prophylaxis. IIH has been reported from Zimbabwe and eastern Congo resulting from the sudden introduction of poorly monitored and excessively iodized salt in populations that had been severely iodine deficient for very long periods in the past [1]. In the year 1980, Switzerland raised the iodine con-tent of salt from 7.5 mg/kg to 15 mg/kg. This increase in iodine intake resulted in an increase in urinary iodine levels from 90 to 150 µg/g creatinine, with a concomitant 27% increase in hyperthyroidism in the first year of the study [2]. IIH can thus occur in “normal” populations.
Iodine deficiency contributes to IIH by increasing thyro-cyte proliferation, which can result in hyperthyroidism after iodine supplementation [1]. The incidence of IIH reverts to normal or even below normal after 1 to 10 years of iodine supplementation. Thus, it has been shown that iodine supplementation can cause an increase in the incidence of hyperthyroidism, and that a median urinary iodine concentration above 200 µg/L can increase the risk of IIH [3]. In pregnant women (the study subjects in this article), changes in iodine kinetics and metabolism that take place cause increases in iodine requirements. There is a debate among scientists on the cutoffs and the distribu-tion of urinary iodine concentrations that can be used to define deficiency states and optimal and above-optimal states for pregnant women. Until those criteria are pub-lished, researchers continue to use the criteria established for the general population.
Denish Moorthy Friedman School of Nutrition Science and Policy
Boston, Mass., USA
K. D. Renuka R. Silva and D. Lalani L. Munasinghe
13
in Kuliyapitiya, Kurunegala District, North-Western Province, Sri Lanka. The urinary iodine concentration was measured in a casual urine sample from each sub-ject. The iodate contents of salt samples collected from households of the adolescents participating in the study were also measured.
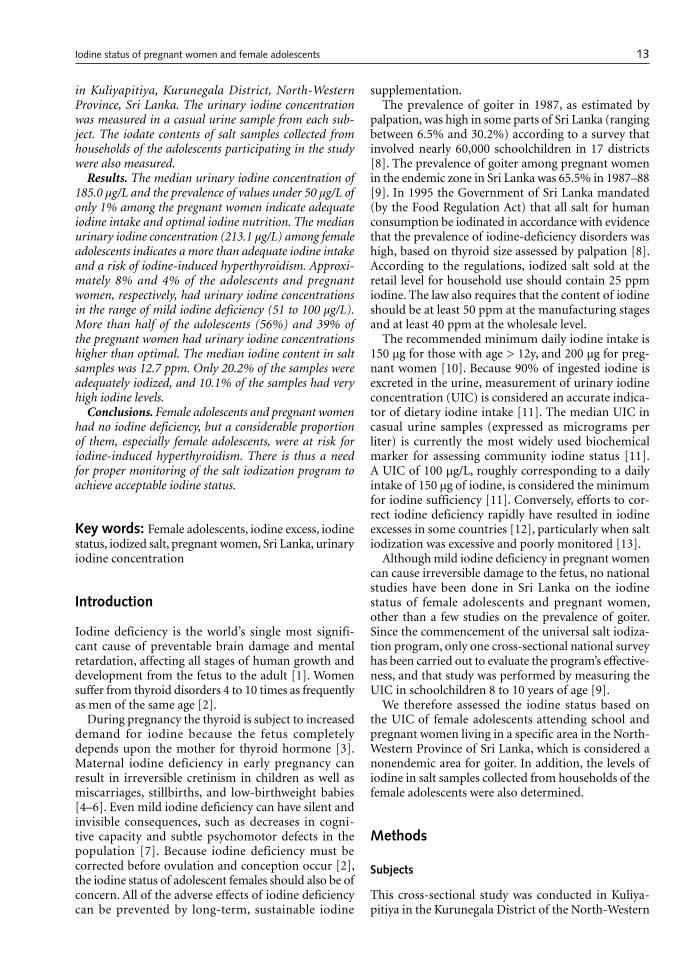
Results. The median urinary iodine concentration of 185.0 µg/L and the prevalence of values under 50 µg/L of only 1% among the pregnant women indicate adequate iodine intake and optimal iodine nutrition. The median urinary iodine concentration (213.1 µg/L) among female adolescents indicates a more than adequate iodine intake and a risk of iodine-induced hyperthyroidism. Approxi-mately 8% and 4% of the adolescents and pregnant women, respectively, had urinary iodine concentrations in the range of mild iodine deficiency (51 to 100 µg/L). More than half of the adolescents (56%) and 39% of the pregnant women had urinary iodine concentrations higher than optimal. The median iodine content in salt samples was 12.7 ppm. Only 20.2% of the samples were adequately iodized, and 10.1% of the samples had very high iodine levels.
Conclusions. Female adolescents and pregnant women had no iodine deficiency, but a considerable proportion of them, especially female adolescents, were at risk for iodine-induced hyperthyroidism. There is thus a need for proper monitoring of the salt iodization program to achieve acceptable iodine status.
Key words: Female adolescents, iodine excess, iodine status, iodized salt, pregnant women, Sri Lanka, urinary iodine concentration
Introduction
Iodine deficiency is the world’s single most signifi-cant cause of preventable brain damage and mental retardation, affecting all stages of human growth and development from the fetus to the adult [1]. Women suffer from thyroid disorders 4 to 10 times as frequently as men of the same age [2].
During pregnancy the thyroid is subject to increased demand for iodine because the fetus completely depends upon the mother for thyroid hormone [3].
Maternal iodine deficiency in early pregnancy can result in irreversible cretinism in children as well as miscarriages, stillbirths, and low-birthweight babies [4–6]. Even mild iodine deficiency can have silent and invisible consequences, such as decreases in cogni-tive capacity and subtle psychomotor defects in the population [7]. Because iodine deficiency must be corrected before ovulation and conception occur [2], the iodine status of adolescent females should also be of concern. All of the adverse effects of iodine deficiency can be prevented by long-term, sustainable iodine
supplementation.The prevalence of goiter in 1987, as estimated by
palpation, was high in some parts of Sri Lanka (ranging between 6.5% and 30.2%) according to a survey that involved nearly 60,000 schoolchildren in 17 districts [8]. The prevalence of goiter among pregnant women in the endemic zone in Sri Lanka was 65.5% in 1987–88 [9]. In 1995 the Government of Sri Lanka mandated (by the Food Regulation Act) that all salt for human consumption be iodinated in accordance with evidence that the prevalence of iodine-deficiency disorders was high, based on thyroid size assessed by palpation [8]. According to the regulations, iodized salt sold at the retail level for household use should contain 25 ppm iodine. The law also requires that the content of iodine should be at least 50 ppm at the manufacturing stages and at least 40 ppm at the wholesale level.
The recommended minimum daily iodine intake is 150 µg for those with age > 12y, and 200 µg for preg-nant women [10]. Because 90% of ingested iodine is excreted in the urine, measurement of urinary iodine concentration (UIC) is considered an accurate indica-tor of dietary iodine intake [11]. The median UIC in casual urine samples (expressed as micrograms per liter) is currently the most widely used biochemical marker for assessing community iodine status [11]. A UIC of 100 µg/L, roughly corresponding to a daily intake of 150 µg of iodine, is considered the minimum for iodine sufficiency [11]. Conversely, efforts to cor-rect iodine deficiency rapidly have resulted in iodine excesses in some countries [12], particularly when salt iodization was excessive and poorly monitored [13].
Although mild iodine deficiency in pregnant women can cause irreversible damage to the fetus, no national studies have been done in Sri Lanka on the iodine status of female adolescents and pregnant women, other than a few studies on the prevalence of goiter. Since the commencement of the universal salt iodiza-tion program, only one cross-sectional national survey has been carried out to evaluate the program’s effective-ness, and that study was performed by measuring the UIC in schoolchildren 8 to 10 years of age [9].
We therefore assessed the iodine status based on the UIC of female adolescents attending school and pregnant women living in a specific area in the North-Western Province of Sri Lanka, which is considered a nonendemic area for goiter. In addition, the levels of iodine in salt samples collected from households of the female adolescents were also determined.
Methods
Subjects
This cross-sectional study was conducted in Kuliya-pitiya in the Kurunegala District of the North-Western
Iodine status of pregnant women and female adolescents
14
Province from July to December 2003. The partici-pants in the study were pregnant women and healthy female adolescents. Twelve of 18 prenatal/maternal and child health-care clinics in the Kuliyapitiya Divisional Director of Health Services/ Medical Officer of Health area were randomly selected, and all women in the first trimester of pregnancy who registered with the clinics were invited to participate in the study. Those who agreed to participate were screened for diseases related to the thyroid (see below); 100 pregnant women (age < 50 years) participated in the study. Female adolescents from two schools in the area voluntarily participated (n = 99; age, 16 to 19 years). The selected schools enrolled students from urban and rural areas, representing a diverse socioeconomic background.
The subjects had no previous history of thyroid disease, medications that affect thyroid status, or renal diseases. The staple foods of the area are rice, bread, and products of rice and wheat flour. Ethical approval for the study was obtained from the ethical review committee of the Wayamba University of Sri Lanka. All subjects were informed about the study; written consent was obtained from each subject, and from a parent in the case of adolescents.
Data collection
Information on parity (the number of pregnancies, including the existing pregnancy, abortions, and still-births), gestational age, and history of pregnancies was obtained from clinical reports of the pregnant women. The ages of all subjects and the gestational ages of the fetuses on the day that the sample was collected were recorded.
Urinary iodine concentration
A casual urine sample (50–250 mL) was collected from each participant in the morning (between 8:00 and 10:00 am) in a screw-capped plastic bottle provided by the investigators, with no preservative added. The sam-ples were divided into 2 × 3–5 mL aliquots and stored frozen at –20°C until ready for assay. Urinary iodine analysis was performed by digestion with ammonium persulfate [14]. The inter- and intra-assay coefficients of variation were less than 10%. The WHO/UNICEF/ICCIDD (World Health Organization/United Nations Children’s Fund/International Council for Control of Iodine Deficiency Disorders) classification of iodine nutritional status [10] was used to classify the urinary concentration of iodine.
Analysis of salt for iodine
Each schoolgirl participating in the study was requested to bring a salt sample (10–20 g) from the place of residence in separately labeled nontransparent poly-
ethylene bags provided for rock salt (which had a larger crystal size) and granulated salt. The samples were stored in the refrigerator until ready for assay. Because salt is fortified with potassium iodate (KIO3), the titration method for iodate content [15] was used to analyze the iodine content of the salt samples. Accord-ing to the regulations for salt iodization, iodized salt for household use should contain 50 ppm of iodine at the point of manufacture, 40 ppm at the wholesale level, and 25 ppm at the retail level. The concentrations of iodate in the salt samples were compared with these standard values.
Because UIC values are usually not normally distrib-uted, medians and percentiles were used for interpreta-tion of the data.
Results
Age
The mean ages of the female adolescents and the preg-nant women were 17.9 and 26.5 years, respectively. Among the pregnant women, the mean gestational age of the fetus was 2.5 months and the mean parity was 1.8.
Urinary iodine concentration
The median UIC and the 20th and 80th percentiles are presented in table 1. In pregnant women, a median UIC of 185.0 µg/L indicates adequate iodine intake and optimal iodine nutrition. In adolescents, a median UIC of 213.1 µg/L is consistent with more than adequate iodine intake and therefore, may have an increased risk of iodine-induced hyperthyroidism (IIH) [10].
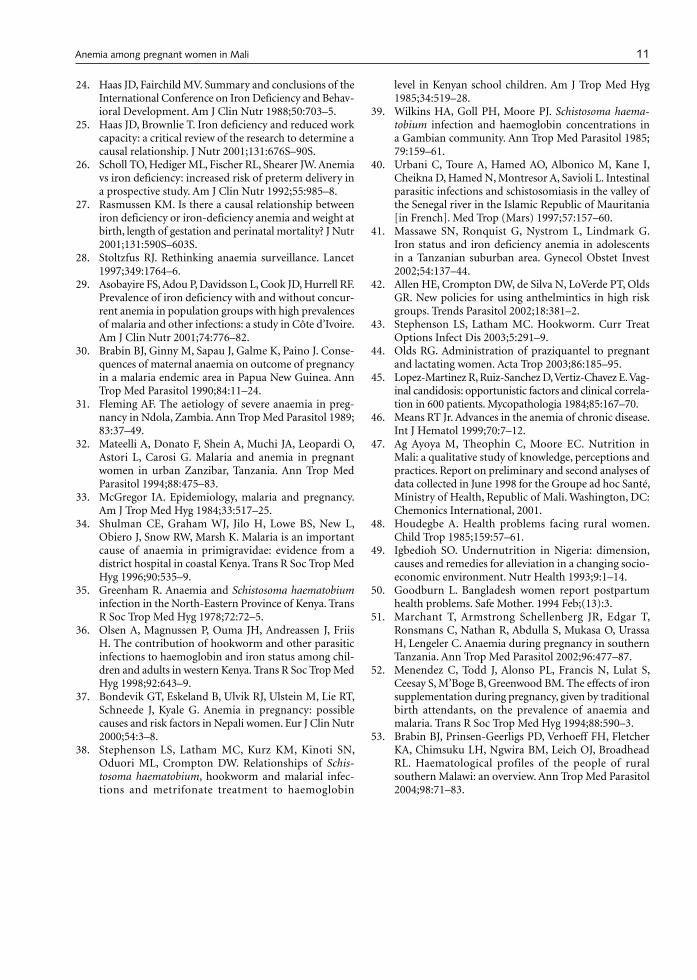
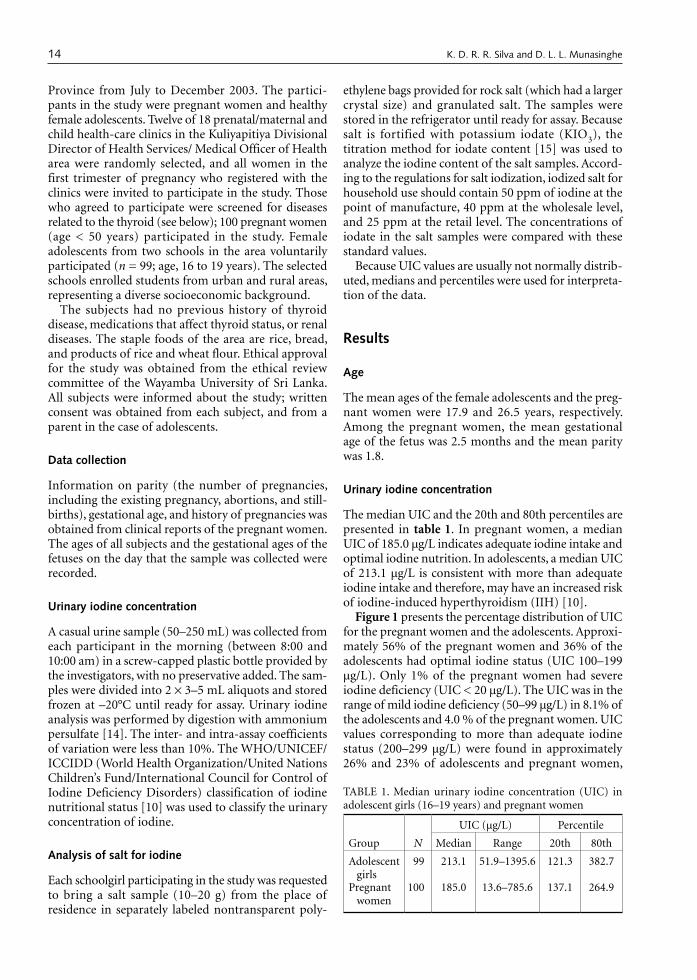
Figure 1 presents the percentage distribution of UIC for the pregnant women and the adolescents. Approxi-mately 56% of the pregnant women and 36% of the adolescents had optimal iodine status (UIC 100–199 µg/L). Only 1% of the pregnant women had severe iodine deficiency (UIC < 20 µg/L). The UIC was in the range of mild iodine deficiency (50–99 µg/L) in 8.1% of the adolescents and 4.0 % of the pregnant women. UIC values corresponding to more than adequate iodine status (200–299 µg/L) were found in approximately 26% and 23% of adolescents and pregnant women,
TABLE 1. Median urinary iodine concentration (UIC) in adolescent girls (16–19 years) and pregnant women
Group N
UIC (µg/L) Percentile
Median Range 20th 80th
Adolescent girls
99 213.1 51.9–1395.6 121.3 382.7
Pregnant women
100 185.0 13.6–785.6 137.1 264.9
K. D. R. R. Silva and D. L. L. Munasinghe
15
respectively. Approximately 29% of the adolescents and 16% of the pregnant women had UICs greater than 300 µg/L.
Iodine in household salt
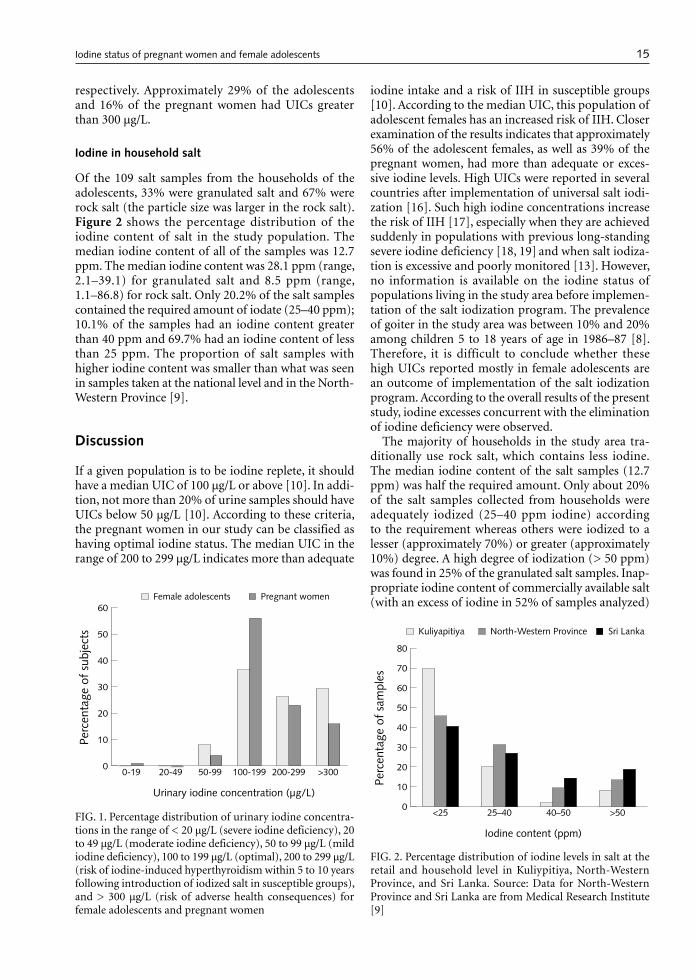
Of the 109 salt samples from the households of the adolescents, 33% were granulated salt and 67% were rock salt (the particle size was larger in the rock salt). Figure 2 shows the percentage distribution of the iodine content of salt in the study population. The median iodine content of all of the samples was 12.7 ppm. The median iodine content was 28.1 ppm (range, 2.1–39.1) for granulated salt and 8.5 ppm (range, 1.1–86.8) for rock salt. Only 20.2% of the salt samples contained the required amount of iodate (25–40 ppm); 10.1% of the samples had an iodine content greater than 40 ppm and 69.7% had an iodine content of less than 25 ppm. The proportion of salt samples with higher iodine content was smaller than what was seen in samples taken at the national level and in the North-Western Province [9].
Discussion
If a given population is to be iodine replete, it should have a median UIC of 100 µg/L or above [10]. In addi-tion, not more than 20% of urine samples should have UICs below 50 µg/L [10]. According to these criteria, the pregnant women in our study can be classified as having optimal iodine status. The median UIC in the range of 200 to 299 µg/L indicates more than adequate
iodine intake and a risk of IIH in susceptible groups [10]. According to the median UIC, this population of adolescent females has an increased risk of IIH. Closer examination of the results indicates that approximately 56% of the adolescent females, as well as 39% of the pregnant women, had more than adequate or exces-sive iodine levels. High UICs were reported in several countries after implementation of universal salt iodi-zation [16]. Such high iodine concentrations increase the risk of IIH [17], especially when they are achieved suddenly in populations with previous long-standing severe iodine deficiency [18, 19] and when salt iodiza-tion is excessive and poorly monitored [13]. However, no information is available on the iodine status of populations living in the study area before implemen-tation of the salt iodization program. The prevalence of goiter in the study area was between 10% and 20% among children 5 to 18 years of age in 1986–87 [8]. Therefore, it is difficult to conclude whether these high UICs reported mostly in female adolescents are an outcome of implementation of the salt iodization program. According to the overall results of the present study, iodine excesses concurrent with the elimination of iodine deficiency were observed.
The majority of households in the study area tra-ditionally use rock salt, which contains less iodine. The median iodine content of the salt samples (12.7 ppm) was half the required amount. Only about 20% of the salt samples collected from households were adequately iodized (25–40 ppm iodine) according to the requirement whereas others were iodized to a lesser (approximately 70%) or greater (approximately 10%) degree. A high degree of iodization (> 50 ppm) was found in 25% of the granulated salt samples. Inap-propriate iodine content of commercially available salt (with an excess of iodine in 52% of samples analyzed)
FIG. 1. Percentage distribution of urinary iodine concentra-tions in the range of < 20 µg/L (severe iodine deficiency), 20 to 49 µg/L (moderate iodine deficiency), 50 to 99 µg/L (mild iodine deficiency), 100 to 199 µg/L (optimal), 200 to 299 µg/L (risk of iodine-induced hyperthyroidism within 5 to 10 years following introduction of iodized salt in susceptible groups), and > 300 µg/L (risk of adverse health consequences) for female adolescents and pregnant women
�
��
��
��
��
��
��
��������������������������������
����
����
����
����
����
��
�����������������������������������
������������������ ��������������
FIG. 2. Percentage distribution of iodine levels in salt at the retail and household level in Kuliypitiya, North-Western Province, and Sri Lanka. Source: Data for North-Western Province and Sri Lanka are from Medical Research Institute [9]
�
��
��
��
��
��
��
��
��
����������������
����
����
����
����
���
��
��������������������
������������ ���������������������� ���������
Iodine status of pregnant women and female adolescents
16
was also reported in a previous study [20]. To eliminate iodine-deficiency disorders in a community through salt iodization, 90% (or more) of households should consume salt containing at least 15 ppm of iodine [15]. The present study, however, found that only 42.2% of households consumed salt with more than 15 ppm of iodine. The high median UIC in the female adolescents indicates that dietary iodine intake is more than adequate. The use of commercially available salt, particularly the granulated form, which is iodinated to a variable degree, together with the probable high salt consumption, could contribute to high dietary iodine intake. We suggest that the high median UIC in the adolescents in our study might be an early indication of the risk of adverse health consequences of excess iodine. The comparatively low UICs reported in the pregnant women may be due to low intake of food because of the high prevalence of vomiting and food aversion during the first trimester and a greater demand for iodine by the thyroid gland in pregnancy.
With rapid global progress in correcting iodine deficiency, instances of iodine excess are being recog-nized, particularly when salt iodization is excessive and poorly monitored [13]. Excessive iodine intake may lead to a high prevalence of hypothyroidism [21–23], IIH [17], hypothyreosis or hyperthyreosis [24], thyroid cancer [25], and colloid goiter [26] and also trigger the development of autoimmune thyroid diseases such as lymphocytic Hashimoto’s thyroiditis [27, 28]. Excessive iodine intake affects lipid metabolism [29] and can damage not only the thyroid, but also the metabolism of the whole body [30]. Therefore, iodine intakes above 300 µg per day should generally be discouraged, particularly in areas where iodine deficiency has previ-ously existed [10]. It has been observed that IIH can occur during the 5 to 10 years following the introduc-tion of iodized salt in populations characterized by long-standing iodine deficiency and a rapid increase in iodine intake [17, 18]. The high prevalence of goiter in the past [9, 31–33], together with the high UICs reported in the present study and in another study [9] after implementation of a salt iodization program, indicates the risk of a similar situation in Sri Lanka. The findings of normal median thyroid volumes, iodine concentrations, and thyroid function in schoolgirls between the ages of 11 and 16 years in Sri Lanka [34] further support our findings that iodine deficiency is not a major problem among schoolgirls of this age, at least after implementation of universal salt iodization in the country. However, a high prevalence of antithy-roglobulin reported among schoolgirls in the above study suggested the onset of an increased incidence of autoimmune thyroiditis [34].
The glomerular filtration rate increases by 50% during pregnancy [35], and therefore higher UICs can be expected during pregnancy in iodine-replete areas and marginally sufficient areas [36]. Higher UICs (indi-
cating iodine loss) during pregnancy can be accepted as an indicator of normal iodine intake, resulting in an underestimation of the prevalence of iodine deficiency during pregnancy if the assessments are based on UIC alone [36, 37], as in the present study. It has been sug-gested that 120 µg/L is the best cutoff for low UIC to identify endemic goiter in pregnant women [37], but 100 µg/L was used as the cutoff in the present study.
One simple explanation for the reported high UICs is an excess intake of iodine. Iodized salt, other food sources of iodine (e.g., milk and fish), and drinking water may provide adequate iodine to the popula-tion. Although we did not assess dietary intakes in the present study, 97.5% of the females studied were non-vegetarians, and most of them consumed milk. Saltwa-ter fish that contain large amounts of iodine are also a major source of iodine in the habitual diet of this study population. Furthermore, the median level of iodine in the water is high (42.5 µg/L) in the North-Western Province [9], where the study was conducted. It has been found that water iodine levels are positively cor-related with UIC [38]. Therefore, household water in the study area may be another source of excess iodine. Conversely, high consumption of dietary goitrogens such as cassava, cruciferous vegetables [39, 40], and water and vegetables contaminated with agricultural fertilizers such as nitrates [2] may also contribute to increased excretion of iodine in the urine. However, the extent of this contribution to UIC in the study population is not known.
The results of the present study should be interpreted cautiously, because the participants did not represent all age and socioeconomic groups of the study area. However, the results suggest potentially important policy and research issues to maximize the benefits of the universal salt iodization program as implemented in Sri Lanka. The results of this study indicate that the prevalence of goiter, as assessed by the size of the thyroid gland alone, without measurement of UIC, is insufficient to determine the causative factors of endemic goiter in a particular area. The risks and benefits of providing iodized salt in areas with exces-sive iodine intakes (in water or food) must be care-fully monitored by periodic measurement of UIC as a marker of population iodine status. Effective legislation and monitoring of salt iodization is essential at the processing, marketing, and consumer levels. Further research is needed to assess the detrimental health effects of excess consumption of iodine.
In conclusion, female adolescents and pregnant women had no iodine deficiency, but a considerable proportion of them, especially the female adolescents, were at risk for IIH. Therefore, in the light of the find-ings of the present study, immediate attention should be given to the monitoring and evaluation of the salt iodization program in Sri Lanka in order to achieve acceptable iodine status.
K. D. R. R. Silva and D. L. L. Munasinghe
17
Acknowledgments
This research was funded by Wayamba University of Sri Lanka. The authors thank Dhammika Menike of the
Department of Applied Nutrition for assistance with the laboratory analysis and Dr. Pramitha Ratnayake, Medical Officer of Health, Kuliyapitiya, for assistance provided during the study.
References
1. World Health Organization. Elimination of iodine efficiency disorders in South-East Asia. SEA/NUT/138. New Delhi: WHO, 1997.
2. Wynn M, Ma AW. Human reproduction and iodine defi-ciency: Is it a problem in UK? J Nutr Environ Med 1998; 8:53–64.
3. Bauch K, Meng W, Ulrich FE, Grosse E, Kempe R, Schönemann F, Sterzel G, Seitz W, Mockel G, Weber A. Thyroid status during pregnancy and post partum in regions of iodine deficiency and endemic goiter. Endo-crinol Exp 1986;20:67–77.
4. Herzmann C, Torrens JK. Maternal thyroid deficiency during pregnancy and subsequent neuropsycho-logical development of the child. N Engl J Med 1999; 341:2015.
5. Tajtakova M, Capova J, Bires J, Sebokova E, Petrovicova J. Thyroid volume, urinary and milk iodine in moth-ers after delivery and their newborns in iodine-replete country. Endocr Regul 1999;33:9–15.
6. UCP Research and Educational Foundation. Mater-nal thyroid deficiency during pregnancy. Research Fact Sheets 2000. Available at: http://www.ucp.org/ucp_printdoc.cfm/138/4/24/24-6610/127. Accessed 25 January 2006.
7. Delange F. The disorders induced by iodine deficiency. Thyroid 1994;4:107–28.
8. Fernando MA, Balasuriya S, Herath KB, Katugampola S. Endemic goitre in Sri Lanka. Asia Pac J Public Health 1989;3:11–8.
9. Medical Research Institute. Iodine deficiency status of children in Sri Lanka. Sri Lanka: MRI/Department of Health Services, 2001.
10. World Health Organization (WHO)/ United Nations Children’s Fund (UNICEF)/ International Council for Control of Iodine Deficiency Disorders (ICCIDD). Assessment of the iodine deficiency disorders and monitoring their elimination. Report of Consultation, 4–6 May 1999. A guide for program managers, 2nd ed. WHO/NHI/01.1. Geneva: WHO, 2001.
11. Dunn JT. Editorial: What’s happening to our iodine? J Clin Endocrinol Metab 1998;83:3398–400.
12. World Health Organization. Universal salt iodization works: Quality control and monitoring are critical elements for success. Press Release WHO/52. Geneva: WHO, 1996.
13. Delange F, de Benoist B, Alnwick D. Risks of iodine-induced hyperthyroidism after correction of iodine deficiency by iodized salt. Thyroid 1999;9:545–56.
14. Pino S, Fang SL, Braverman LE. Ammonium persulfate: a safe alternative oxidizing reagent for measuring uri-nary iodine. Clin Chem 1996;42:239–43.
15. De Maeyer EM, Lowenstein FW, Thilly CH. The control of epidemic goitre. Geneva: WHO, 1979.
16. Delange F, de Benoist B, Pretell E, Dunn JT. Iodine defi-ciency in the world: Where do we stand at the turn of the century? Thyroid 2001;11:437–47.
17. Stanbury JB, Ermans AE, Bourdoux P, Todd C, Oken E, Tonglet R, Vidor G, Braverman LE, Medeiros-Neto G. Iodine-induced hyperthyroidism: occurrence and epidemiology. Thyroid 1998;8:83–100.
18. Todd CH, Allain T, Gomo ZA, Hasler JA, Ndiweni M, Oken E. Increase in thyrotoxicosis associated with iodine supplements in Zimbabwe. Lancet 1995;346:1563–4.
19. Bourdoux P, Ermans AM, Mukalay wa Mukalay A, Filetti S, Vigneri R. Iodine-induced thyrotoxicosis in Kivu, Zaire. Lancet 1996;347:552–3.
20. Kumarasiri JP, Fernandopulle BMR, Lankathillake MA. Iodine content of commercially available iodised salt in the Sri Lankan market. Ceylon Med J 1998; 43:84–7.
21. Ranganathan S. Iodised salt is safe. Indian J Public Health 1995;39:164–71.
22. Yamada T, Sato A. Iodine responsive autoimmune thyroid disease [in Japanese]. Nippon Rinsho 1999;57: 1788–93.
23. Laurberg P, Bulow Pedersen I, Knudsen N, Ovesen L, Andersen S. Environmental iodine intake affects the type of nonmalignant thyroid disease. Thyroid 2001;11:457–69.
24. Jorgensen H, Svindland O. Hyperthyreosis and hypothy-reosis after use of iodine-containing natural prod-ucts and iodine-containing vitamin and mineral supplements [in Norwegian]. Tidsskr Nor Laegeforen 1991;111:3153–5.
25. Guan H, Teng W, Cui B. An epidemiological survey of thyroid disorders in an area with high iodine content in water supply [in Chinese]. Zhonghua Nei Ke Za Zh 2001; 40:597–601.
26. Kanno J, Onodera H, Furuta K, Maekawa A, Kasuga T, Hayashi Y. Tumor-promoting effects of both iodine deficiency and iodine excess in the rat thyroid. Toxicol Pathol 1992;20:226–35.
27. Boyages SC, Bloot AM, Marberly GF, Eastman CJ, Li M, Qian QD, Liu DR, van der Gaag RD, Drexhage HA. Thy-roid autoimmunity in endemic goitre caused by exces-sive iodine intake. Clin Endocrinol 1989;31:453–65.
28. Zois C, Stavrou I, Kalogera C, Svarna E, Dimoliatis I, Seferiadis K, Tsatsoulis A. High prevalence of autoim-mune thyroiditis in schoolchildren after elimination of iodine deficiency in northwestern Greece. Thyroid 2003;13:485–9.
29. Jenkins KJ. Lipid compositional changes in calves fed excess iodine. J Dairy Sci 1990;73:2489–93.
30. Zhou X, Yin G. Experimental studies on effects of excessive iodine intake on morphology and function of kidney in mice [in Chinese]. Zhonghua Yu Fang Yi Xue Za Zhi 1996;30:340–2.
Iodine status of pregnant women and female adolescents

18
31. Mahadeva K, Seneviratne DA, Jayatillake DB. Further studies on the problem of goiter in Ceylon. Br J Nutr 1968;22:527–34.
32. Deo MG, Subramanian TA. Iodine metabolism in chil-dren and women with endemic goitre in Ceylon. Br J Nutr 1971;25:97–105.
33. Katugampola SL. The prevalence of goitre in pregnancy: a preliminary study. Ceylon J Med Sci 1989;32:85–9.
34. Premawardhana LD, Parkes AB, Smyth PP, Wijeyaratne CN, Jayasinghe A, de Silva DG, Lazarus JH. Increased prevalence of thyroglobulin antibodies in Sri Lankan schoolgirls: Is iodine the cause? Eur J Endocrinol 2000; 143:185–8.
35. Koutras DA. Thyroidopathies. Ann NY Acad Sci 2000; 900:77–88.
36. Soldin OP. Controversies in urinary iodine determina-tions. Clin Biochem 2002;35:575–9.
37. Castaneda R, Lechuga D, Ramos RI, Magos C, Orozco M, Martinez H. Endemic goitre in pregnant women: utility of the simplified classification of thyroid size by palpation and urinary iodine as screening tests. BJOG 2002;109:1366–72.
38. Zhao J, Wang P, Shang L, Sullivan KM, van der Haar F, Maberly G. Endemic goiter associated with high iodine intake. Am J Public Health 2000;90:1633–5.
39. Delange F, Iteke FB, Ermans AM, eds. Nutritional factors involved in the goitrogenic action of cassava. Ottawa: International Development Research Centre, 1982.
40. Gaitan E. Goitrogens. Baillieres Clin Endocrinol Metab 1988;2:683–702.
K. D. R. R. Silva and D. L. L. Munasinghe
Food and Nutrition Bulletin, vol. 27, no. 1 © 2006, The United Nations University. 19
Abstract
Background. Soy sauces are available in different types and grades, which allows them to reach consumers of all socioeconomic groups. Ferric sodium ethylenediami-netetraacetic acid (NaFeEDTA) has been used for iron fortification of soy sauces in some countries, however, its high cost may make it unattractive to policymakers and industry.
Objective. We evaluated the feasibility of using more economical iron sources for iron fortification, with soy sauce of various types and grades used as a vehicle.
Methods. Seven iron sources were tested for their feasi-bility for fortification of four types of soy sauce: naturally fermented in the traditional style, naturally fermented according to large-scale industrial formulas 1 and 5, and chemically hydrolyzed at 5 mg per serving (15 mL, per Thailand’s food labeling regulations). Either citric acid or sodium citrate was added at 0.1% as a chelator.
Results. Five iron sources—ferrous sulfate, NaFeEDTA, ferric ammonium citrate, ferrous lactate, and ferrous gluconate—did not significantly affect the sensory quali-ties of the product over a period of 3 months (p > .05). Ferrous fumarate and ferrous bisglycinate caused unac-ceptable precipitation. Less than 3% of 260 and 306 com-monly cooked foods out of 871 and 772 preparations using soy sauces fortified with NaFeEDTA and ferrous sulfate, respectively, were found to be different from normal with regard to sensory qualities. The cost of fortification was US 0.22 cents to US 3.28 cents per bottle (700 mL).
Conclusions. Both naturally fermented and chemi-cally hydrolyzed soy sauces could be fortified with all five iron sources. Ferrous sulfate is the most appropriate source because of its low cost and acceptable sensory characteristics. Soy sauce is a promising vehicle for iron
fortification, however, the bioavailability of iron in the products examined here needs to be evaluated under normal use conditions.
Key words: Fortification, iron deficiency, iron sources, soy sauces
Introduction
Food fortification is generally considered to be the best long-term strategy to combat iron deficiency. Condi-ments and sauces have several advantages as vehicles for iron fortification. In particular, they are widely consumed, traditional parts of the daily diet in most countries. They can also be added to several differ-ent types of foods and can reach the most vulnerable populations [1]. Soy sauce is a popular condiment used widely throughout the world [2]. Soy sauce intake becomes even higher as people alter their consumption patterns toward a vegetarian diet, largely because of health concerns [3]. In Thailand, two types of soy sauce are widely consumed: naturally fermented and chemi-cally hydrolyzed. Variations in the type and grade of soy sauce give it appeal and make it accessible across all socioeconomic groups. Other characteristics also make soy sauce a promising vehicle for iron fortification. In particular, the liquid form allows uniform distribution of a fortificant, the dark color can conceal color changes caused by a fortificant, and the strong flavor can mask a change in taste induced by the fortificant [4].
Iron fortification of condiments, especially fish and soy sauces, has been studied for decades. All studies, however, have used ferric sodium ethylenediamine-tetraacetic acid (NaFeEDTA) for fortification [5–8]. Since 1998, China has implemented iron fortification of soy sauce at the national level [5]. NaFeEDTA is known for its higher bioavailability of iron in the presence of inhibitors such as phytate and polyphenol. However, NaFeEDTA is one of the most expensive iron compounds and is manufactured by only one or two
Fortification of soy sauce using various iron sources: Sensory acceptability and shelf stability
The authors are affiliated with the Institute of Nutrition, Mahidol University, Salaya, Thailand.
Please direct queries to the corresponding author: Visith Chavasit, Institute of Nutrition, Mahidol University, Salaya, Phutthamonthon, Nakhon Pathom 73170, Thailand; e-mail: [email protected].
Ratana Watanapaisantrakul, Visith Chavasit, and Ratchanee Kongkachuichai
20
producers in the world. The cost of NaFeEDTA as a fortificant can contribute up to 8% of the product price, which could affect the sustainability of food-for-tification programs in developing countries. Chavasit et al. [9] found that it was feasible to use other sources of iron for fortifying fish sauce when citric acid was used as a chelator. For instance, using ferrous sulfate instead of NaFeEDTA could reduce costs by four- to fivefold without altering iron bioavailability [10, 11]. Consequently, as a prerequisite for implementing a sustainable national iron-fortification program using soy sauce, especially in developing countries, it is necessary to evaluate the feasibility of using alterna-tive iron sources that are more economical. In addi-tion, the study should be performed using various types and grades of soy sauce in order to cover most population groups.
Methods
Soy sauce
Two types of naturally fermented soy sauces were used. The first was a traditional-style sauce from a medium-scale producer (Tawantip Food Products Co., Samutsa-korn, Thailand) using a traditional process (NFT). The second was a large-scale industrial-style sauce, con-sisting of two grades of Healthy Boy brand soy sauce produced by Yan Wal Yun Co., Samutsakorn, Thailand. This brand had the highest market share of soy sauce in the country; it included a grade 1 type for higher-income groups (NFL1) and a grade 5 type for lower-income groups as well as small restaurants (NFL5). Chemically hydrolyzed (CH) soy sauce was also tested in this study. The brand was Golden Mountain, which has the highest market share in Thailand and is pro-duced by Thai Thepparos Food Products Public Co., Samutsakorn, Thailand. The product is produced by acid hydrolysis and neutralized with alkaline.
Iron sources
The seven iron compounds tested were the following: dried ferrous sulfate, 86% FeSO4 (37% iron) from Ajax Co. (Aubern, Australia); NaFeEDTA (14% iron) from Akzo Nobel Functional Chemicals Co. (Arnhem, Netherlands); ferric ammonium citrate (18% iron) from Merck (Frankfurt, Germany); ferrous lactate (20% iron) from Vicky Consolidate Co. (Bangkok, Thailand); ferrous gluconate (10% iron) from Nutri-tion Co. (Bangkok, Thailand); ferrous fumarate (33% iron) from Siam Union (Bangkok, Thailand); and fer-rous bisglycinate, Ferrochel (20% iron), from Albion (Clearfield, Utah, USA).
Soy sauce was fortified with 5 mg of iron per 15 mL of sauce by directly dissolving the fortificant in the soy
sauce. The actual amounts of soy sauce that people consume have never been documented; however, one serving size has been estimated by the Thai Food and Drug Administration as 15 mL [12]. The fortification in this study aimed to provide one-third of the iron requirement per serving. The iron-fortified and unfor-tified (control) products were packed into capped glass bottles, kept at room temperature for 3 months, and observed for precipitation.
Modification of the fortification process
Our preliminary study indicated that the chelator, citric acid or sodium citrate, could be used at a prede-termined level to prevent precipitation in the fortified products. The samples with chelator were tested for differences in sensory quality compared with unche-lated samples by using the triangle test. Boiled sirloin pork cut in a 1-cm cube was used as the sample carrier. The test was performed twice by 20 panelists under a daylight fluorescent lamp in individual testing booths at the sensory science laboratory, Institute of Nutri-tion, Mahidol University. After iron fortification, the soy sauce with chelator and the unchelated sample were incubated under accelerated conditions at 40°C for 2 weeks. The fortificant that caused precipitation was then rejected.
Shelf-life study
The fortified product was pasteurized at 73°C for 5 minutes, packed in glass bottles, stored in a corru-gated kraft paper case at room temperature (daytime, 25°–32°C; nighttime, 25°C), and analyzed for iron and sensory quality once a month for 3 months. The study period was chosen to match the product turnover period in the market. After wet digestion, the iron was analyzed in triplicate with a Flame Atomic Absorption Spectrophotometer (Model Spectr AA-20, Varian Asso-ciates, Sydney, Australia) at a wavelength of 248.3 nm.
Sensory quality was determined by 50 panelists who were students at Mahidol University. Overall accept-ability was measured on a nine-point hedonic scale, and the acceptabilities of color, odor, and taste were measured on five-point hedonic scales. Each sample was coded with a three-digit random number and served in random order with steamed beaten egg cut in 1-cm cubes. The panelists rinsed their mouths with soda water before tasting the new sample. The test was performed at the same laboratory mentioned above.
Home-use test
Two panels of approximately 50 subjects each com-posed of faculty members, staff, and graduate students at the Institute of Nutrition, Mahidol University, were used to test NFL1 and CH. Two bottled fortified
R. Watanapaisantrakul et al.
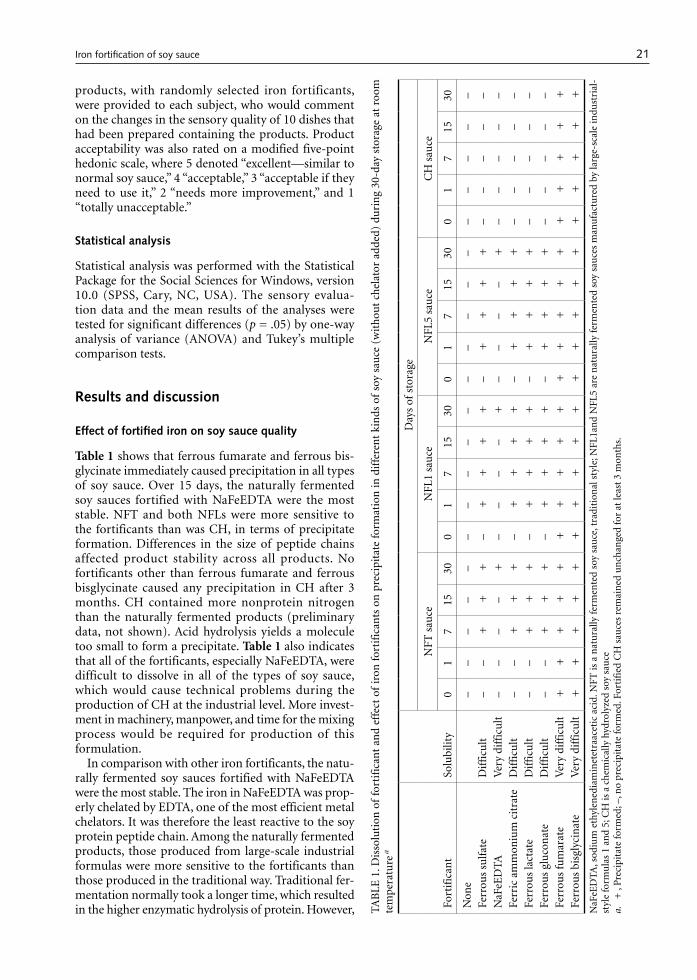
21
products, with randomly selected iron fortificants, were provided to each subject, who would comment on the changes in the sensory quality of 10 dishes that had been prepared containing the products. Product acceptability was also rated on a modified five-point hedonic scale, where 5 denoted “excellent—similar to normal soy sauce,” 4 “acceptable,” 3 “acceptable if they need to use it,” 2 “needs more improvement,” and 1 “totally unacceptable.”
Statistical analysis
Statistical analysis was performed with the Statistical Package for the Social Sciences for Windows, version 10.0 (SPSS, Cary, NC, USA). The sensory evalua-tion data and the mean results of the analyses were tested for significant differences (p = .05) by one-way analysis of variance (ANOVA) and Tukey’s multiple comparison tests.
Results and discussion
Effect of fortified iron on soy sauce quality
Table 1 shows that ferrous fumarate and ferrous bis-glycinate immediately caused precipitation in all types of soy sauce. Over 15 days, the naturally fermented soy sauces fortified with NaFeEDTA were the most stable. NFT and both NFLs were more sensitive to the fortificants than was CH, in terms of precipitate formation. Differences in the size of peptide chains affected product stability across all products. No fortificants other than ferrous fumarate and ferrous bisglycinate caused any precipitation in CH after 3 months. CH contained more nonprotein nitrogen than the naturally fermented products (preliminary data, not shown). Acid hydrolysis yields a molecule too small to form a precipitate. Table 1 also indicates that all of the fortificants, especially NaFeEDTA, were difficult to dissolve in all of the types of soy sauce, which would cause technical problems during the production of CH at the industrial level. More invest-ment in machinery, manpower, and time for the mixing process would be required for production of this formulation.
In comparison with other iron fortificants, the natu-rally fermented soy sauces fortified with NaFeEDTA were the most stable. The iron in NaFeEDTA was prop-erly chelated by EDTA, one of the most efficient metal chelators. It was therefore the least reactive to the soy protein peptide chain. Among the naturally fermented products, those produced from large-scale industrial formulas were more sensitive to the fortificants than those produced in the traditional way. Traditional fer-mentation normally took a longer time, which resulted in the higher enzymatic hydrolysis of protein. However, TAB
LE 1
. Dis
solu
tion
of
fort
ific
ant
and
effe
ct o
f ir
on f
orti
fica
nts
on
pre
cipi
tate
for
mat
ion
in d
iffe
ren
t ki
nds
of
soy
sau
ce (
wit
hou
t ch
elat
or a
dded
) du
rin
g 30
-day
sto
rage
at
room
te
mp
erat
ure
a
Fort
ific
ant
Solu
bilit
y
Day
s of
sto
rage
NFT
sau
ceN
FL1
sau
ce
NFL
5 sa
uce
CH
sau
ce
01
715
300
17
1530
01
715
300
17
1530
Non
e–
––
––
––
––
––
––
––
––
––
–Fe
rrou
s su
lfat
eD
iffi
cult
––
+
+
+
– +
+
+
+
–
+
+
+
+
––
––
–N
aFeE
DTA
Ver
y di
ffic
ult
––
––
+
––
––
+
––
––
+
––
––
–Fe
rric
am
mon
ium
cit
rate
Dif
ficu
lt–
– +
+
+
–
+
+
+
+
– +
+
+
+
–
––
––
Ferr
ous
lact
ate
Dif
ficu
lt–
– +
+
+
–
+
+
+
+
– +
+
+
+
–
––
––
Ferr
ous
glu
con
ate
Dif
ficu
lt–
– +
+
+
–
+
+
+
+
– +
+
+
+
–
––
––
Ferr
ous
fum
arat
eV
ery
diff
icu
lt +
+
+
+
+
+
+
+
+
+
+
+
+
+
+
+
+
+
+
+
Fe
rrou
s bi
sgly
cin
ate
Ver
y di
ffic
ult
+
+
+
+
+
+
+
+
+
+
+
+
+
+
+
+
+
+
+
+
NaF
eED
TA, s
odiu
m e
thyl
ened
iam
inet
etra
acet
ic a
cid.
NFT
is a
nat
ura
lly f
erm
ente
d so
y sa
uce
, tra
diti
onal
sty
le; N
FL1a
nd
NFL
5 ar
e n
atu
rally
fer
men
ted
soy
sau
ces
man
ufa
ctu
red
by la
rge-
scal
e in
dust
rial
-st
yle
form
ula
s 1
and
5; C
H is
a c
hem
ical
ly h
ydro
lyze
d so
y sa
uce
a.
+ ,
Pre
cipi
tate
form
ed; –
, no
prec
ipit
ate
form
ed. F
orti
fied
CH
sau
ces
rem
ain
ed u
nch
ange
d fo
r at
leas
t 3
mon
ths.
Iron fortification of soy sauce
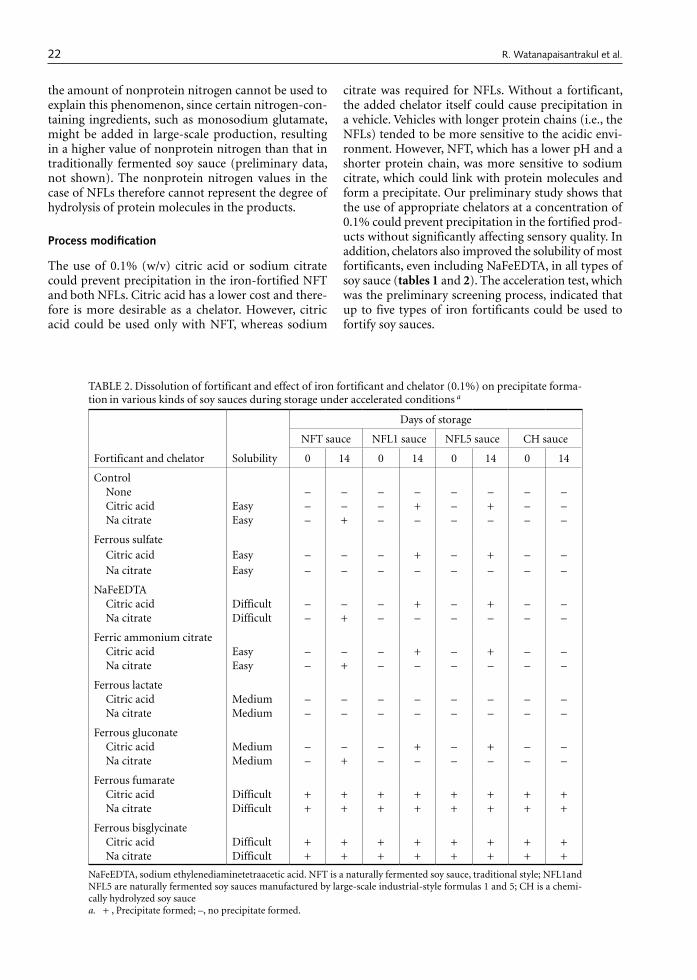
22
the amount of nonprotein nitrogen cannot be used to explain this phenomenon, since certain nitrogen-con-taining ingredients, such as monosodium glutamate, might be added in large-scale production, resulting in a higher value of nonprotein nitrogen than that in traditionally fermented soy sauce (preliminary data, not shown). The nonprotein nitrogen values in the case of NFLs therefore cannot represent the degree of hydrolysis of protein molecules in the products.
Process modification
The use of 0.1% (w/v) citric acid or sodium citrate could prevent precipitation in the iron-fortified NFT and both NFLs. Citric acid has a lower cost and there-fore is more desirable as a chelator. However, citric acid could be used only with NFT, whereas sodium
citrate was required for NFLs. Without a fortificant, the added chelator itself could cause precipitation in a vehicle. Vehicles with longer protein chains (i.e., the NFLs) tended to be more sensitive to the acidic envi-ronment. However, NFT, which has a lower pH and a shorter protein chain, was more sensitive to sodium citrate, which could link with protein molecules and form a precipitate. Our preliminary study shows that the use of appropriate chelators at a concentration of 0.1% could prevent precipitation in the fortified prod-ucts without significantly affecting sensory quality. In addition, chelators also improved the solubility of most fortificants, even including NaFeEDTA, in all types of soy sauce (tables 1 and 2). The acceleration test, which was the preliminary screening process, indicated that up to five types of iron fortificants could be used to fortify soy sauces.
TABLE 2. Dissolution of fortificant and effect of iron fortificant and chelator (0.1%) on precipitate forma-tion in various kinds of soy sauces during storage under accelerated conditions a
Fortificant and chelator Solubility
Days of storage
NFT sauce NFL1 sauce NFL5 sauce CH sauce
0 14 0 14 0 14 0 14
ControlNone – – – – – – – –Citric acid Easy – – – + – + – –Na citrate Easy – + – – – – – –
Ferrous sulfateCitric acid Easy – – – + – + – –Na citrate Easy – – – – – – – –
NaFeEDTACitric acid Difficult – – – + – + – –Na citrate Difficult – + – – – – – –
Ferric ammonium citrateCitric acid Easy – – – + – + – –Na citrate Easy – + – – – – – –
Ferrous lactate Citric acid Medium – – – – – – – –Na citrate Medium – – – – – – – –
Ferrous gluconateCitric acid Medium – – – + – + – –Na citrate Medium – + – – – – – –
Ferrous fumarateCitric acid Difficult + + + + + + + + Na citrate Difficult + + + + + + + +
Ferrous bisglycinateCitric acid Difficult + + + + + + + + Na citrate Difficult + + + + + + + +
NaFeEDTA, sodium ethylenediaminetetraacetic acid. NFT is a naturally fermented soy sauce, traditional style; NFL1and NFL5 are naturally fermented soy sauces manufactured by large-scale industrial-style formulas 1 and 5; CH is a chemi-cally hydrolyzed soy saucea. + , Precipitate formed; –, no precipitate formed.
R. Watanapaisantrakul et al.
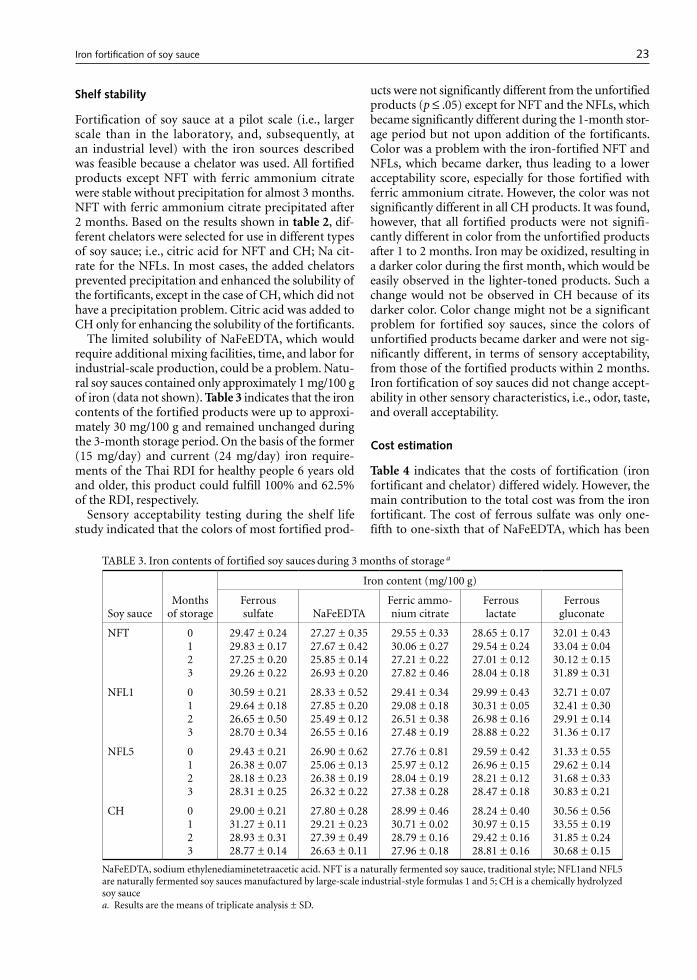
23
Shelf stability
Fortification of soy sauce at a pilot scale (i.e., larger scale than in the laboratory, and, subsequently, at an industrial level) with the iron sources described was feasible because a chelator was used. All fortified products except NFT with ferric ammonium citrate were stable without precipitation for almost 3 months. NFT with ferric ammonium citrate precipitated after 2 months. Based on the results shown in table 2, dif-ferent chelators were selected for use in different types of soy sauce; i.e., citric acid for NFT and CH; Na cit-rate for the NFLs. In most cases, the added chelators prevented precipitation and enhanced the solubility of the fortificants, except in the case of CH, which did not have a precipitation problem. Citric acid was added to CH only for enhancing the solubility of the fortificants.
The limited solubility of NaFeEDTA, which would require additional mixing facilities, time, and labor for industrial-scale production, could be a problem. Natu-ral soy sauces contained only approximately 1 mg/100 g of iron (data not shown). Table 3 indicates that the iron contents of the fortified products were up to approxi-mately 30 mg/100 g and remained unchanged during the 3-month storage period. On the basis of the former (15 mg/day) and current (24 mg/day) iron require-ments of the Thai RDI for healthy people 6 years old and older, this product could fulfill 100% and 62.5% of the RDI, respectively.
Sensory acceptability testing during the shelf life study indicated that the colors of most fortified prod-
ucts were not significantly different from the unfortified products (p ≤ .05) except for NFT and the NFLs, which became significantly different during the 1-month stor-age period but not upon addition of the fortificants. Color was a problem with the iron-fortified NFT and NFLs, which became darker, thus leading to a lower acceptability score, especially for those fortified with ferric ammonium citrate. However, the color was not significantly different in all CH products. It was found, however, that all fortified products were not signifi-cantly different in color from the unfortified products after 1 to 2 months. Iron may be oxidized, resulting in a darker color during the first month, which would be easily observed in the lighter-toned products. Such a change would not be observed in CH because of its darker color. Color change might not be a significant problem for fortified soy sauces, since the colors of unfortified products became darker and were not sig-nificantly different, in terms of sensory acceptability, from those of the fortified products within 2 months. Iron fortification of soy sauces did not change accept-ability in other sensory characteristics, i.e., odor, taste, and overall acceptability.
Cost estimation
Table 4 indicates that the costs of fortification (iron fortificant and chelator) differed widely. However, the main contribution to the total cost was from the iron fortificant. The cost of ferrous sulfate was only one-fifth to one-sixth that of NaFeEDTA, which has been
TABLE 3. Iron contents of fortified soy sauces during 3 months of storage a
Soy sauceMonths
of storage
Iron content (mg/100 g)
Ferrous sulfate NaFeEDTA
Ferric ammo-nium citrate
Ferrous lactate
Ferrous gluconate
NFT 0123
29.47 ± 0.2429.83 ± 0.1727.25 ± 0.2029.26 ± 0.22
27.27 ± 0.3527.67 ± 0.4225.85 ± 0.1426.93 ± 0.20
29.55 ± 0.3330.06 ± 0.2727.21 ± 0.2227.82 ± 0.46
28.65 ± 0.1729.54 ± 0.2427.01 ± 0.1228.04 ± 0.18
32.01 ± 0.4333.04 ± 0.0430.12 ± 0.1531.89 ± 0.31
NFL1 0123
30.59 ± 0.2129.64 ± 0.1826.65 ± 0.5028.70 ± 0.34
28.33 ± 0.5227.85 ± 0.2025.49 ± 0.1226.55 ± 0.16
29.41 ± 0.3429.08 ± 0.1826.51 ± 0.3827.48 ± 0.19
29.99 ± 0.4330.31 ± 0.0526.98 ± 0.1628.88 ± 0.22
32.71 ± 0.0732.41 ± 0.3029.91 ± 0.1431.36 ± 0.17
NFL5 0123
29.43 ± 0.2126.38 ± 0.0728.18 ± 0.2328.31 ± 0.25
26.90 ± 0.6225.06 ± 0.1326.38 ± 0.1926.32 ± 0.22
27.76 ± 0.8125.97 ± 0.1228.04 ± 0.1927.38 ± 0.28
29.59 ± 0.4226.96 ± 0.1528.21 ± 0.1228.47 ± 0.18
31.33 ± 0.5529.62 ± 0.1431.68 ± 0.3330.83 ± 0.21
CH 0123
29.00 ± 0.2131.27 ± 0.1128.93 ± 0.3128.77 ± 0.14
27.80 ± 0.2829.21 ± 0.2327.39 ± 0.4926.63 ± 0.11
28.99 ± 0.4630.71 ± 0.0228.79 ± 0.1627.96 ± 0.18
28.24 ± 0.4030.97 ± 0.1529.42 ± 0.1628.81 ± 0.16
30.56 ± 0.5633.55 ± 0.1931.85 ± 0.2430.68 ± 0.15
NaFeEDTA, sodium ethylenediaminetetraacetic acid. NFT is a naturally fermented soy sauce, traditional style; NFL1and NFL5 are naturally fermented soy sauces manufactured by large-scale industrial-style formulas 1 and 5; CH is a chemically hydrolyzed soy saucea. Results are the means of triplicate analysis ± SD.
Iron fortification of soy sauce
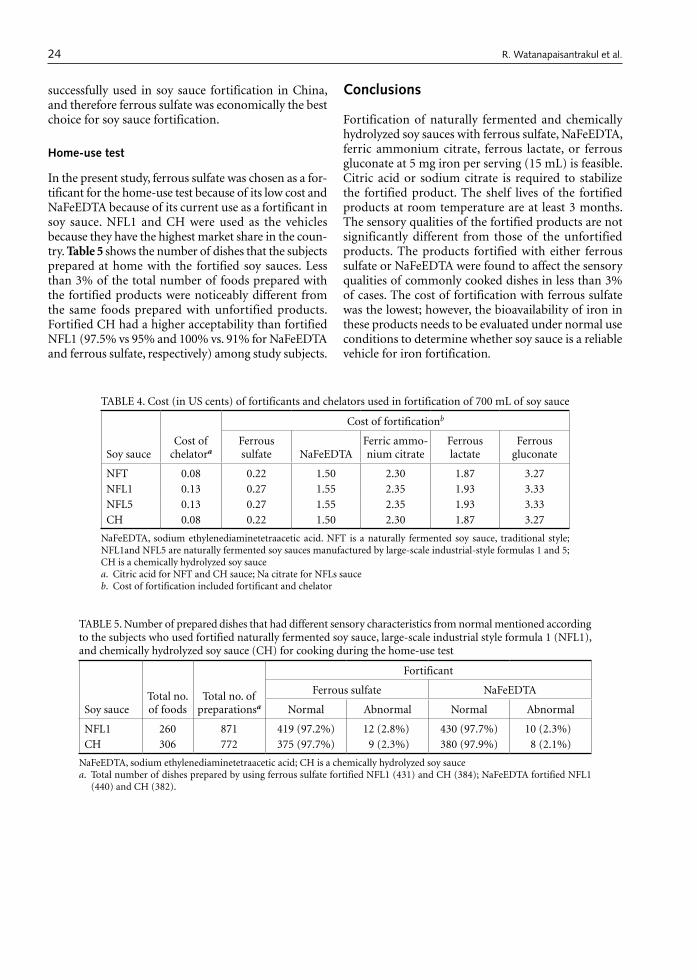
24
successfully used in soy sauce fortification in China, and therefore ferrous sulfate was economically the best choice for soy sauce fortification.
Home-use test
In the present study, ferrous sulfate was chosen as a for-tificant for the home-use test because of its low cost and NaFeEDTA because of its current use as a fortificant in soy sauce. NFL1 and CH were used as the vehicles because they have the highest market share in the coun-try. Table 5 shows the number of dishes that the subjects prepared at home with the fortified soy sauces. Less than 3% of the total number of foods prepared with the fortified products were noticeably different from the same foods prepared with unfortified products. Fortified CH had a higher acceptability than fortified NFL1 (97.5% vs 95% and 100% vs. 91% for NaFeEDTA and ferrous sulfate, respectively) among study subjects.
Conclusions
Fortification of naturally fermented and chemically hydrolyzed soy sauces with ferrous sulfate, NaFeEDTA, ferric ammonium citrate, ferrous lactate, or ferrous gluconate at 5 mg iron per serving (15 mL) is feasible. Citric acid or sodium citrate is required to stabilize the fortified product. The shelf lives of the fortified products at room temperature are at least 3 months. The sensory qualities of the fortified products are not significantly different from those of the unfortified products. The products fortified with either ferrous sulfate or NaFeEDTA were found to affect the sensory qualities of commonly cooked dishes in less than 3% of cases. The cost of fortification with ferrous sulfate was the lowest; however, the bioavailability of iron in these products needs to be evaluated under normal use conditions to determine whether soy sauce is a reliable vehicle for iron fortification.
TABLE 4. Cost (in US cents) of fortificants and chelators used in fortification of 700 mL of soy sauce
Soy sauceCost of
chelatora
Cost of fortificationb
Ferrous sulfate NaFeEDTA
Ferric ammo-nium citrate
Ferrous lactate
Ferrous gluconate
NFT 0.08 0.22 1.50 2.30 1.87 3.27NFL1 0.13 0.27 1.55 2.35 1.93 3.33NFL5 0.13 0.27 1.55 2.35 1.93 3.33CH 0.08 0.22 1.50 2.30 1.87 3.27
NaFeEDTA, sodium ethylenediaminetetraacetic acid. NFT is a naturally fermented soy sauce, traditional style; NFL1and NFL5 are naturally fermented soy sauces manufactured by large-scale industrial-style formulas 1 and 5; CH is a chemically hydrolyzed soy saucea. Citric acid for NFT and CH sauce; Na citrate for NFLs sauceb. Cost of fortification included fortificant and chelator
TABLE 5. Number of prepared dishes that had different sensory characteristics from normal mentioned according to the subjects who used fortified naturally fermented soy sauce, large-scale industrial style formula 1 (NFL1), and chemically hydrolyzed soy sauce (CH) for cooking during the home-use test
Soy sauceTotal no. of foods
Total no. of preparationsa
Fortificant
Ferrous sulfate NaFeEDTA
Normal Abnormal Normal Abnormal
NFL1 260 871 419 (97.2%) 12 (2.8%) 430 (97.7%) 10 (2.3%)CH 306 772 375 (97.7%) 9 (2.3%) 380 (97.9%) 8 (2.1%)
NaFeEDTA, sodium ethylenediaminetetraacetic acid; CH is a chemically hydrolyzed soy saucea. Total number of dishes prepared by using ferrous sulfate fortified NFL1 (431) and CH (384); NaFeEDTA fortified NFL1
(440) and CH (382).
R. Watanapaisantrakul et al.
25
References
1. Uauy R, Hertrampf E, Reddy M. Iron fortification of foods: overcoming technical and practical barriers. J Nutr 2002;132(4 Suppl):849S–52S.
2. Chen WL. Soyfoods, fermented. In: Hui YH, ed. Encyclo-pedia of food science and technology. Vol 4. New York: Wiley, 1992:2396–406.
3. Valyasevi R. Soy sauce and seasoning sauce. Food Science and Technology Association of Thailand. Available at: http://fostat.biotec.or.th. Accessed 4 December 2005.
4. Dai Y. Iron fortification of Chinese soy sauce. Food Nutr Bull 1983;5(1):35–42.
5. Chunming C. Iron fortification of soy sauce in China. Rome: Food and Agriculture Organization, Food Nutr Agric 2003;32:76–82.
6. Mannar V, Gallego EB. Iron fortification: country level experiences and lessons learned. J Nutr 2002;132(4 Suppl):856S–8S.
7. Garby L, Areekul S. Iron supplementation in Thai fish-
sauce. Ann Trop Med Parasitol 1974;68:467–76. 8. Suwanik R, Pleehachinda R, Pattanachak S. Double
fortification. Bangkok: UNICEF East Asia and Pacific Regional Office, 1997. http://fostat.biotec.or.th
9. Chavasit V, Nopburabutr P, Kongkachuichai R. Com-bating iodine and iron deficiencies through the double fortification of fish sauce, mixed fish sauce, and salt brine. Food Nutr Bull 2003;24(2):200–7.
10. Fidler MC, Davidsson L, Walczyk T, Hurrell RF. Iron absorption from fish sauce and soy sauce fortified with sodium iron EDTA. Am J Clin Nutr 2003; 78:274–8.
11. Walczyk IT, Tuntipopipat S, Zeder IC , Sirichakwal P, Wasantwisut E, Hurrell RF. Iron absorption by human subjects from different iron fortification compounds added to Thai fish sauce. Eur J Clin Nutr 2005; 59:668–74.
12. Food and Drug Administration. Food Notification 2522 B.E.: No. 182 (1998). Bangkok: Ministry of Public Health, 2003 (in Thai).
Iron fortification of soy sauce
26 Food and Nutrition Bulletin, vol. 27, no. 1 © 2006, The United Nations University.
Abstract
Background. The development of low-cost, high-protein food supplements for weaning infants from local and readily available raw materials is a constant challenge for developing countries.
Objective. To formulate, develop, and assess the nutri-tive value, acceptability, and keeping quality of sorghum-based staple dried flakes as instant weaning foods.
Methods. Weaning blends composed of 42% sorghum supplemented with 20% legumes, 10% oil seeds, and 28% additives (sugar, oil, skim milk powder, and vanillin) were prepared according to FAO/WHO/UNU recom-mendations and processed in a twin-roller drum dryer. The effects of fermentation and of the addition of malt on the nutritive value and functional properties of the blends were investigated.
Results. The blends were found to contain 16.6% to 19.3% protein, 68.7% to 72.7% carbohydrate, 0.9% to 1.3% fiber, and 405.8 to 413.2 kcal of energy per 100 g. The iron content of the blends ranged from 5.3 to 9.1 mg/100 g, and the calcium content ranged from 150 to 220 mg/100 g. All blends reconstituted well and formed a soft paste when stirred with hot or cold water.
The water-holding capacity, wettability, and bulk density were within the ranges of corresponding values of commercial weaning foods. Sensory attributes, viscosity values, and in vitro digestibility varied among the blends, whereas lysing content improved considerably (p ≤ .05) for all blends. All blends had similar keeping quality,
with no signs of spoilage or development of off-flavors or colors after 10 months of storage. Most blends remained free of aflatoxins.
Conclusions. Legumes and oil seeds can be effectively used in sorghum-based weaning foods as an acceptable protein and mineral supplement.
Key words: Legumes, oil seeds, weaning food, sor-ghum, Sudan
Introduction
The formulation and development of nutritious wean-ing foods from local and readily available raw materials has received considerable attention in many developing countries. The commercially standardized foods are generally very good and can help meet the nutritional requirements of young children in both developed and developing countries. However, the development of low-cost, high-protein food supplements for weaning infants is a constant challenge for developing countries [1]. This is particularly important in countries where malnutrition is still common. In African countries, traditional foods used during the weaning process are frequently characterized by low nutrient density and high bulk [2], which can adversely affect infants’ health. Infants are usually either weaned directly onto the family diet early in life or continue to be breastfed, both resulting in suboptimal nutrient intake. In either case, the nutrition of the child suffers, and optimum growth cannot be ensured. The high cost of weaning foods, vegetables, and animal protein, together with the unavailability of nutritious foods, adds to the difficulty of providing good nutrition to infants.
Sudan is in a similar situation to other African countries in that supplementation represents a major nutritional problem for infants in poor rural areas, where the majority of children appear to be at risk for delayed supplementation [3]. Protein–energy malnu-trition generally occurs during the crucial transitional
Development of weaning food from sorghum supplemented with legumes and oil seeds
M. Ali Asma is affiliated with the Agricultural Research Corporation, Food Research Center, Department of Food Chemistry, Khartoum North, Shambat, Sudan; E. Babiker El Fadil and Abdullahi H. El Tinay are affiliated with the Department of Food Science and Technology, Faculty of Agriculture, University of Khartoum, Khartoum North, Shambat, Sudan.
Please direct queries to the corresponding author: E. Babiker El Fadil, Department of Food Science and Technology, Faculty of Agriculture, University of Khartoum, Khartoum North, 13314, Shambat, Sudan; e-mail: elfadilbabiker@ yahoo.com.
M. Ali Asma, E. Babiker El Fadil, and Abdullahi H. El Tinay
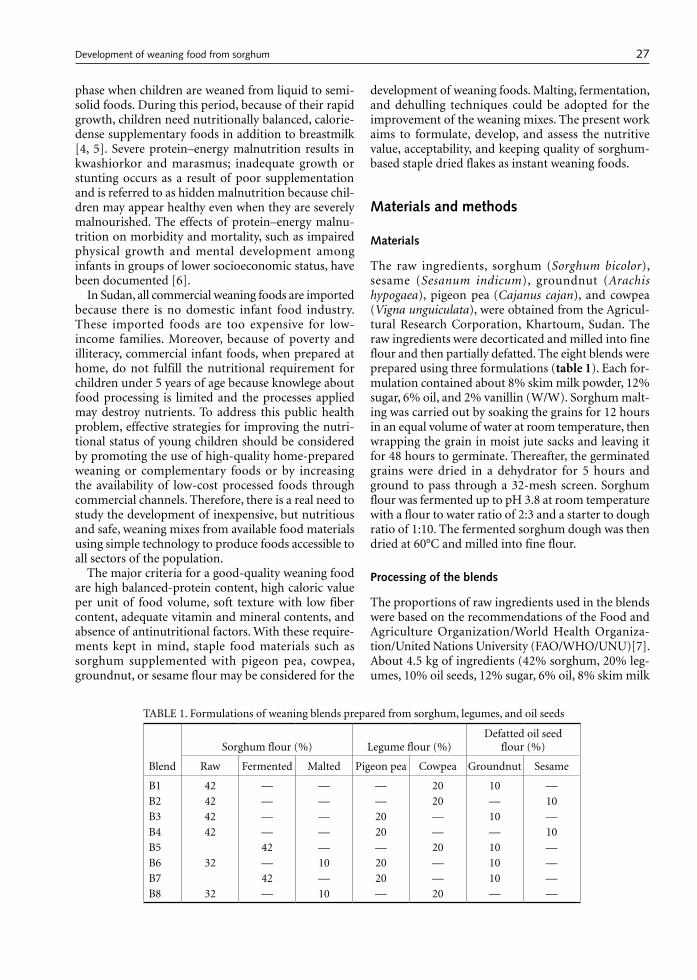
27
phase when children are weaned from liquid to semi-solid foods. During this period, because of their rapid growth, children need nutritionally balanced, calorie-dense supplementary foods in addition to breastmilk [4, 5]. Severe protein–energy malnutrition results in kwashiorkor and marasmus; inadequate growth or stunting occurs as a result of poor supplementation and is referred to as hidden malnutrition because chil-dren may appear healthy even when they are severely malnourished. The effects of protein–energy malnu-trition on morbidity and mortality, such as impaired physical growth and mental development among infants in groups of lower socioeconomic status, have been documented [6].
In Sudan, all commercial weaning foods are imported because there is no domestic infant food industry. These imported foods are too expensive for low-income families. Moreover, because of poverty and illiteracy, commercial infant foods, when prepared at home, do not fulfill the nutritional requirement for children under 5 years of age because knowlege about food processing is limited and the processes applied may destroy nutrients. To address this public health problem, effective strategies for improving the nutri-tional status of young children should be considered by promoting the use of high-quality home-prepared weaning or complementary foods or by increasing the availability of low-cost processed foods through commercial channels. Therefore, there is a real need to study the development of inexpensive, but nutritious and safe, weaning mixes from available food materials using simple technology to produce foods accessible to all sectors of the population.
The major criteria for a good-quality weaning food are high balanced-protein content, high caloric value per unit of food volume, soft texture with low fiber content, adequate vitamin and mineral contents, and absence of antinutritional factors. With these require-ments kept in mind, staple food materials such as sorghum supplemented with pigeon pea, cowpea, groundnut, or sesame flour may be considered for the
development of weaning foods. Malting, fermentation, and dehulling techniques could be adopted for the improvement of the weaning mixes. The present work aims to formulate, develop, and assess the nutritive value, acceptability, and keeping quality of sorghum-based staple dried flakes as instant weaning foods.
Materials and methods
Materials
The raw ingredients, sorghum (Sorghum bicolor), sesame (Sesanum indicum), groundnut (Arachis hypogaea), pigeon pea (Cajanus cajan), and cowpea (Vigna unguiculata), were obtained from the Agricul-tural Research Corporation, Khartoum, Sudan. The raw ingredients were decorticated and milled into fine flour and then partially defatted. The eight blends were prepared using three formulations (table 1). Each for-mulation contained about 8% skim milk powder, 12% sugar, 6% oil, and 2% vanillin (W/W). Sorghum malt-ing was carried out by soaking the grains for 12 hours in an equal volume of water at room temperature, then wrapping the grain in moist jute sacks and leaving it for 48 hours to germinate. Thereafter, the germinated grains were dried in a dehydrator for 5 hours and ground to pass through a 32-mesh screen. Sorghum flour was fermented up to pH 3.8 at room temperature with a flour to water ratio of 2:3 and a starter to dough ratio of 1:10. The fermented sorghum dough was then dried at 60°C and milled into fine flour.
Processing of the blends
The proportions of raw ingredients used in the blends were based on the recommendations of the Food and Agriculture Organization/World Health Organiza-tion/United Nations University (FAO/WHO/UNU)[7]. About 4.5 kg of ingredients (42% sorghum, 20% leg-umes, 10% oil seeds, 12% sugar, 6% oil, 8% skim milk
TABLE 1. Formulations of weaning blends prepared from sorghum, legumes, and oil seeds
Blend
Sorghum flour (%) Legume flour (%)Defatted oil seed
flour (%)
Raw Fermented Malted Pigeon pea Cowpea Groundnut Sesame
B1 42 — — — 20 10 —B2 42 — — — 20 — 10B3 42 — — 20 — 10 —B4 42 — — 20 — — 10B5 42 — — 20 10 —B6 32 — 10 20 — 10 —B7 42 — 20 — 10 —B8 32 — 10 — 20 — —
Development of weaning food from sorghum
28
powder, and 2% vanillin) were preweighed for each blend at the ratios shown in table 1. Water was added to the ingredients to make a 25% slurry (weight/volume), which was then baked.
Evaluation of nutrients
The moisture, crude protein, fat, fiber, and ash contents (as the percentage of dry weight) of the blends were determined according to the methods of the Associa-tion of Official Analytical Chemists (AOAC) [8]. The available percentage of carbohydrate in each sample was estimated by difference [100% – % (moisture + protein + ash + fiber + fat)]. Iron was estimated by atomic absorption spectrometry (Perkin Elmer) and calcium by the titrimetric method according to AOAC [8]. The energy content of the blends was determined by a standard calculation (Atwater factor) and expressed in kilocalories. Amino acids were determined accord-ing to the method of Cohen et al. [9]. Tryptophan was determined colorimetrically in an alkaline hydrolyzate according to the method of Blauth et al. [10].
Sensory evaluation
The blends were first evaluated for sensory qualities in two sessions. Blends containing untreated sorghum flour (B1–B4) were evaluated in the first session, and blends containing either fermented (B5 and B7) or malted (B6 and B8) sorghum flour were evaluated in the second session. The two blends from each session judged to have the best sensory qualities were then evaluated in a third session. Organoleptic evaluation was performed by the ranking method described by Ihekoronye and Ngoddy [11]. Ten well-trained moth-ers who had successfully passed standardized tests for olfactory and taste sensitivities as well as verbal abilities and creativity were chosen to rank the dif-ferent blends for appearance, taste (sweetness), flavor (odor and taste), consistency (mouthfeel), and overall acceptance using a five-point hedonic scale in which an increase in the number of points indicates decreased acceptability.
Functional properties
Water-holding capacity, bulk density, wettability were measured by the methods of Quinn and Beuchat [12], Wang and Kinsella [13], and Neff and Morris [14], respectively. Dispersability was measured by placing 10 g of the sample in a 100-mL stoppered measuring cylinder and then increasing the volume to 100 mL. The mixture was vigorously shaken and allowed to stand for 3 hours. The volume of the settled particles was subtracted from the total volume and the differ-ence was expressed as percentage dispersability. The viscosity of the blends was measured by the method of
Quinn and Beuchat [12]. In vitro protein digestibility was measured by the pepsin–pancreatin method of Manjula et al. [15]. The calculated protein efficiency ratio (PER) was determined from the amino acid scores of the blends, based on their amino acid patterns as suggested by FAO/WHO/UNU [16], multiplied by their pepsin–pancreatin digestibility factors according to the equations of Satterlee et al. [17]. In vitro starch digestibility was determined by the pancreatic α-amy-lase procedure [18].
Keeping quality tests
The total microbial loads of the blends were deter-mined at 4° and 25°C immediately after preparation and after 10 months of storage according to the method of Harrigan and MacCance [19]. The peroxide value was determined at the same two time points according to the AOAC [8] method. Total aflatoxin (B1, B2, G1, G2) was determined by the AOAC method [8].
Statistical analysis
Each sample was analyzed in duplicate, and the figures were averaged. Analysis of variance (ANOVA) [20] and the Duncan multiple range test [21] were performed with SAS, version 6.0 (SAS Institute, Cary, NC, USA).
Results and discussion
Composition and formulation of raw ingredients
The decorticated sorghum, groundnut, sesame, cowpea, and pigeon pea contained 6.4%, 2.2%, 1.8%, 5.7%, and 6.6% moisture, respectively, and 16.6%, 27.5%, 24.2%, 20.9%, and 17.1% protein. Partial defatting improved the keeping quality of the flour and increased the protein content of groundnut and sesame by 48 and 70%, respectively. Some of the raw ingredients used to prepare the blends were observed to be rich in carbohydrates and poor in essential amino acids. The cereal:legume ratio (table 1) of the blends was 42:20, which was close to the ratio of 2:1 recommended by Wondimu and Malleshi [22]. The level of sugar in all blends (12%) is based on the sugar levels in commer-cial weaning formulas. The blends with a calculated amino acid score of more than 75% were considered for processing as recommended by FAO/WHO/UNU [7]. The formulations were based on the Codex Com-mittee Guidelines [23].
Composition of the blends
The protein content of the blends (table 2) ranged from 16.63% to 19.25% on a dry weight basis, which agrees with the recommended value of the Codex [23].
M. A. Asma et al.
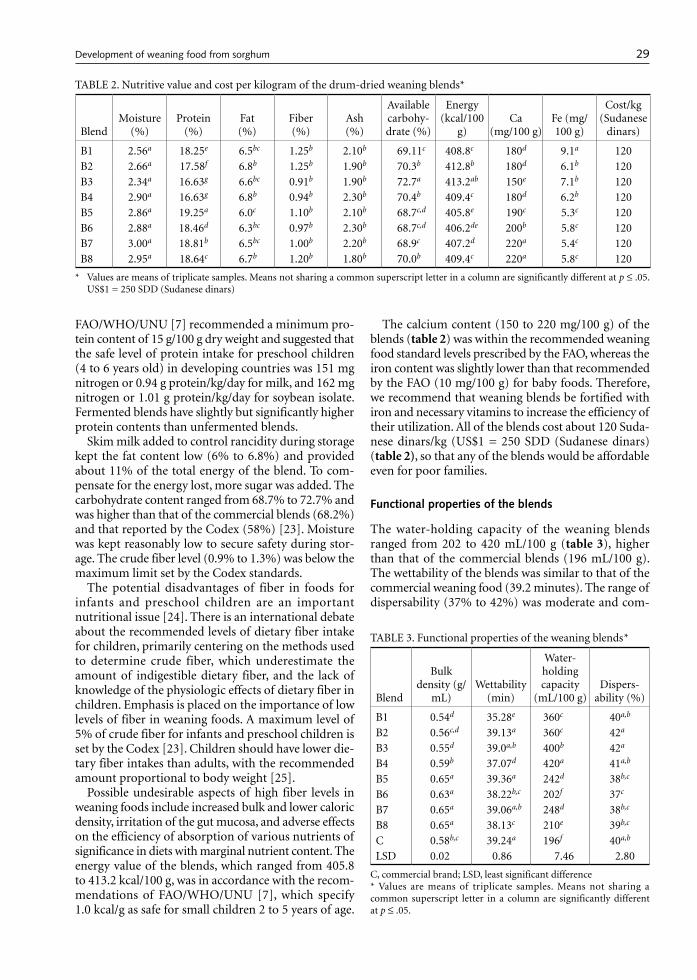
29
FAO/WHO/UNU [7] recommended a minimum pro-tein content of 15 g/100 g dry weight and suggested that the safe level of protein intake for preschool children (4 to 6 years old) in developing countries was 151 mg nitrogen or 0.94 g protein/kg/day for milk, and 162 mg nitrogen or 1.01 g protein/kg/day for soybean isolate. Fermented blends have slightly but significantly higher protein contents than unfermented blends.
Skim milk added to control rancidity during storage kept the fat content low (6% to 6.8%) and provided about 11% of the total energy of the blend. To com-pensate for the energy lost, more sugar was added. The carbohydrate content ranged from 68.7% to 72.7% and was higher than that of the commercial blends (68.2%) and that reported by the Codex (58%) [23]. Moisture was kept reasonably low to secure safety during stor-age. The crude fiber level (0.9% to 1.3%) was below the maximum limit set by the Codex standards.
The potential disadvantages of fiber in foods for infants and preschool children are an important nutritional issue [24]. There is an international debate about the recommended levels of dietary fiber intake for children, primarily centering on the methods used to determine crude fiber, which underestimate the amount of indigestible dietary fiber, and the lack of knowledge of the physiologic effects of dietary fiber in children. Emphasis is placed on the importance of low levels of fiber in weaning foods. A maximum level of 5% of crude fiber for infants and preschool children is set by the Codex [23]. Children should have lower die-tary fiber intakes than adults, with the recommended amount proportional to body weight [25].
Possible undesirable aspects of high fiber levels in weaning foods include increased bulk and lower caloric density, irritation of the gut mucosa, and adverse effects on the efficiency of absorption of various nutrients of significance in diets with marginal nutrient content. The energy value of the blends, which ranged from 405.8 to 413.2 kcal/100 g, was in accordance with the recom-mendations of FAO/WHO/UNU [7], which specify 1.0 kcal/g as safe for small children 2 to 5 years of age.
The calcium content (150 to 220 mg/100 g) of the blends (table 2) was within the recommended weaning food standard levels prescribed by the FAO, whereas the iron content was slightly lower than that recommended by the FAO (10 mg/100 g) for baby foods. Therefore, we recommend that weaning blends be fortified with iron and necessary vitamins to increase the efficiency of their utilization. All of the blends cost about 120 Suda-nese dinars/kg (US$1 = 250 SDD (Sudanese dinars) (table 2), so that any of the blends would be affordable even for poor families.
Functional properties of the blends
The water-holding capacity of the weaning blends ranged from 202 to 420 mL/100 g (table 3), higher than that of the commercial blends (196 mL/100 g). The wettability of the blends was similar to that of the commercial weaning food (39.2 minutes). The range of dispersability (37% to 42%) was moderate and com-
TABLE 2. Nutritive value and cost per kilogram of the drum-dried weaning blends*
BlendMoisture
(%)Protein
(%)Fat (%)
Fiber (%)
Ash (%)
Available carbohy-drate (%)
Energy (kcal/100
g)Ca
(mg/100 g)Fe (mg/ 100 g)
Cost/kg (Sudanese
dinars)
B1 2.56a 18.25e 6.5bc 1.25b 2.10b 69.11c 408.8c 180d 9.1a 120B2 2.66a 17.58f 6.8b 1.25b 1.90b 70.3b 412.8b 180d 6.1b 120B3 2.34a 16.63g 6.6bc 0.91b 1.90b 72.7a 413.2ab 150e 7.1b 120B4 2.90a 16.63g 6.8b 0.94b 2.30b 70.4b 409.4c 180d 6.2b 120B5 2.86a 19.25a 6.0c 1.10b 2.10b 68.7c,d 405.8e 190c 5.3c 120B6 2.88a 18.46d 6.3bc 0.97b 2.30b 68.7c,d 406.2de 200b 5.8c 120B7 3.00a 18.81b 6.5bc 1.00b 2.20b 68.9c 407.2d 220a 5.4c 120B8 2.95a 18.64c 6.7b 1.20b 1.80b 70.0b 409.4c 220a 5.8c 120
* Values are means of triplicate samples. Means not sharing a common superscript letter in a column are significantly different at p ≤ .05. US$1 = 250 SDD (Sudanese dinars)
TABLE 3. Functional properties of the weaning blends*
Blend
Bulk density (g/
mL)Wettability
(min)
Water- holding capacity
(mL/100 g)Dispers-
ability (%)
B1 0.54d 35.28e 360c 40a,b
B2 0.56c,d 39.13a 360c 42a
B3 0.55d 39.0a,b 400b 42a
B4 0.59b 37.07d 420a 41a,b
B5 0.65a 39.36a 242d 38b,c
B6 0.63a 38.22b,c 202f 37c
B7 0.65a 39.06a,b 248d 38b,c
B8 0.65a 38.13c 210e 39b,c
C 0.58b,c 39.24a 196f 40a,b
LSD 0.02 0.86 7.46 2.80
C, commercial brand; LSD, least significant difference* Values are means of triplicate samples. Means not sharing a common superscript letter in a column are significantly different at p ≤ .05.
Development of weaning food from sorghum
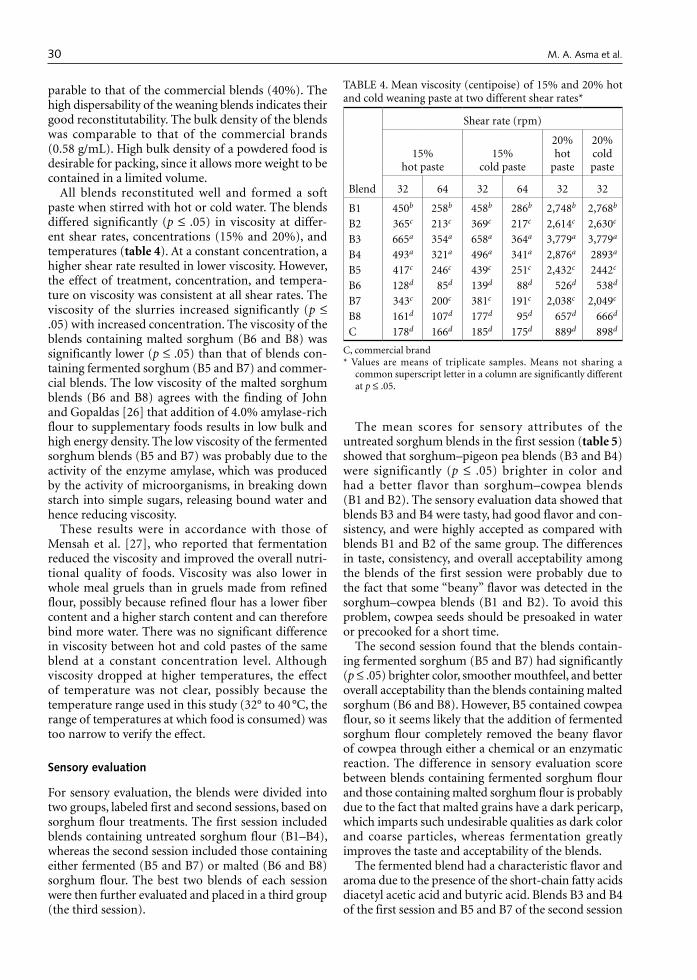
30
parable to that of the commercial blends (40%). The high dispersability of the weaning blends indicates their good reconstitutability. The bulk density of the blends was comparable to that of the commercial brands (0.58 g/mL). High bulk density of a powdered food is desirable for packing, since it allows more weight to be contained in a limited volume.
All blends reconstituted well and formed a soft paste when stirred with hot or cold water. The blends differed significantly (p ≤ .05) in viscosity at differ-ent shear rates, concentrations (15% and 20%), and temperatures (table 4). At a constant concentration, a higher shear rate resulted in lower viscosity. However, the effect of treatment, concentration, and tempera-ture on viscosity was consistent at all shear rates. The viscosity of the slurries increased significantly (p ≤ .05) with increased concentration. The viscosity of the blends containing malted sorghum (B6 and B8) was significantly lower (p ≤ .05) than that of blends con-taining fermented sorghum (B5 and B7) and commer-cial blends. The low viscosity of the malted sorghum blends (B6 and B8) agrees with the finding of John and Gopaldas [26] that addition of 4.0% amylase-rich flour to supplementary foods results in low bulk and high energy density. The low viscosity of the fermented sorghum blends (B5 and B7) was probably due to the activity of the enzyme amylase, which was produced by the activity of microorganisms, in breaking down starch into simple sugars, releasing bound water and hence reducing viscosity.
These results were in accordance with those of Mensah et al. [27], who reported that fermentation reduced the viscosity and improved the overall nutri-tional quality of foods. Viscosity was also lower in whole meal gruels than in gruels made from refined flour, possibly because refined flour has a lower fiber content and a higher starch content and can therefore bind more water. There was no significant difference in viscosity between hot and cold pastes of the same blend at a constant concentration level. Although viscosity dropped at higher temperatures, the effect of temperature was not clear, possibly because the temperature range used in this study (32° to 40 °C, the range of temperatures at which food is consumed) was too narrow to verify the effect.
Sensory evaluation
For sensory evaluation, the blends were divided into two groups, labeled first and second sessions, based on sorghum flour treatments. The first session included blends containing untreated sorghum flour (B1–B4), whereas the second session included those containing either fermented (B5 and B7) or malted (B6 and B8) sorghum flour. The best two blends of each session were then further evaluated and placed in a third group (the third session).
The mean scores for sensory attributes of the untreated sorghum blends in the first session (table 5) showed that sorghum–pigeon pea blends (B3 and B4) were significantly (p ≤ .05) brighter in color and had a better flavor than sorghum–cowpea blends (B1 and B2). The sensory evaluation data showed that blends B3 and B4 were tasty, had good flavor and con-sistency, and were highly accepted as compared with blends B1 and B2 of the same group. The differences in taste, consistency, and overall acceptability among the blends of the first session were probably due to the fact that some “beany” flavor was detected in the sorghum–cowpea blends (B1 and B2). To avoid this problem, cowpea seeds should be presoaked in water or precooked for a short time.
The second session found that the blends contain-ing fermented sorghum (B5 and B7) had significantly (p ≤ .05) brighter color, smoother mouthfeel, and better overall acceptability than the blends containing malted sorghum (B6 and B8). However, B5 contained cowpea flour, so it seems likely that the addition of fermented sorghum flour completely removed the beany flavor of cowpea through either a chemical or an enzymatic reaction. The difference in sensory evaluation score between blends containing fermented sorghum flour and those containing malted sorghum flour is probably due to the fact that malted grains have a dark pericarp, which imparts such undesirable qualities as dark color and coarse particles, whereas fermentation greatly improves the taste and acceptability of the blends.
The fermented blend had a characteristic flavor and aroma due to the presence of the short-chain fatty acids diacetyl acetic acid and butyric acid. Blends B3 and B4 of the first session and B5 and B7 of the second session
TABLE 4. Mean viscosity (centipoise) of 15% and 20% hot and cold weaning paste at two different shear rates*
Blend
Shear rate (rpm)
15% hot paste
15% cold paste
20% hot
paste
20% cold paste
32 64 32 64 32 32
B1 450b 258b 458b 286b 2,748b 2,768b
B2 365c 213c 369c 217c 2,614c 2,630c
B3 665a 354a 658a 364a 3,779a 3,779a
B4 493a 321a 496a 341a 2,876a 2893a
B5 417c 246c 439c 251c 2,432c 2442c
B6 128d 85d 139d 88d 526d 538d
B7 343c 200c 381c 191c 2,038c 2,049c
B8 161d 107d 177d 95d 657d 666d
C 178d 166d 185d 175d 889d 898d
C, commercial brand* Values are means of triplicate samples. Means not sharing a
common superscript letter in a column are significantly different at p ≤ .05.
M. A. Asma et al.
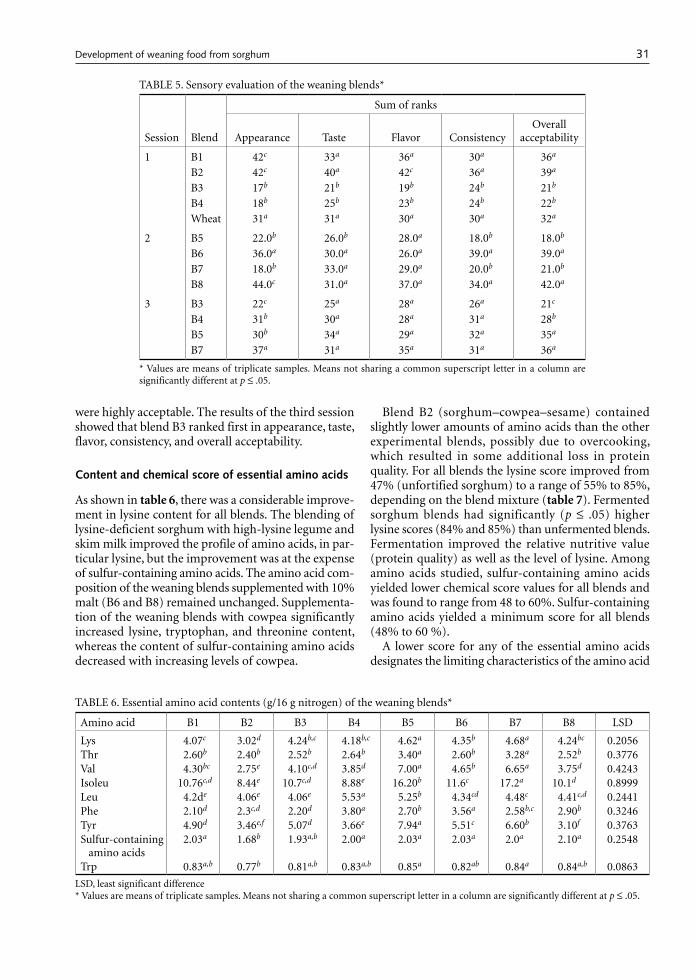
31
were highly acceptable. The results of the third session showed that blend B3 ranked first in appearance, taste, flavor, consistency, and overall acceptability.
Content and chemical score of essential amino acids
As shown in table 6, there was a considerable improve-ment in lysine content for all blends. The blending of lysine-deficient sorghum with high-lysine legume and skim milk improved the profile of amino acids, in par-ticular lysine, but the improvement was at the expense of sulfur-containing amino acids. The amino acid com-position of the weaning blends supplemented with 10% malt (B6 and B8) remained unchanged. Supplementa-tion of the weaning blends with cowpea significantly increased lysine, tryptophan, and threonine content, whereas the content of sulfur-containing amino acids decreased with increasing levels of cowpea.
Blend B2 (sorghum–cowpea–sesame) contained slightly lower amounts of amino acids than the other experimental blends, possibly due to overcooking, which resulted in some additional loss in protein quality. For all blends the lysine score improved from 47% (unfortified sorghum) to a range of 55% to 85%, depending on the blend mixture (table 7). Fermented sorghum blends had significantly (p ≤ .05) higher lysine scores (84% and 85%) than unfermented blends. Fermentation improved the relative nutritive value (protein quality) as well as the level of lysine. Among amino acids studied, sulfur-containing amino acids yielded lower chemical score values for all blends and was found to range from 48 to 60%. Sulfur-containing amino acids yielded a minimum score for all blends (48% to 60 %).
A lower score for any of the essential amino acids designates the limiting characteristics of the amino acid
TABLE 5. Sensory evaluation of the weaning blends*
Session Blend
Sum of ranks
Appearance Taste Flavor ConsistencyOverall
acceptability
1 B1 42c 33a 36a 30a 36a
B2 42c 40a 42c 36a 39a
B3 17b 21b 19b 24b 21b
B4 18b 25b 23b 24b 22b
Wheat 31a 31a 30a 30a 32a
2 B5 22.0b 26.0b 28.0a 18.0b 18.0b
B6 36.0a 30.0a 26.0a 39.0a 39.0a
B7 18.0b 33.0a 29.0a 20.0b 21.0b
B8 44.0c 31.0a 37.0a 34.0a 42.0a
3 B3 22c 25a 28a 26a 21c
B4 31b 30a 28a 31a 28b
B5 30b 34a 29a 32a 35a
B7 37a 31a 35a 31a 36a
* Values are means of triplicate samples. Means not sharing a common superscript letter in a column are significantly different at p ≤ .05.
TABLE 6. Essential amino acid contents (g/16 g nitrogen) of the weaning blends*
Amino acid B1 B2 B3 B4 B5 B6 B7 B8 LSD
Lys 4.07c 3.02d 4.24b,c 4.18b,c 4.62a 4.35b 4.68a 4.24bc 0.2056Thr 2.60b 2.40b 2.52b 2.64b 3.40a 2.60b 3.28a 2.52b 0.3776Val 4.30bc 2.75e 4.10c,d 3.85d 7.00a 4.65b 6.65a 3.75d 0.4243Isoleu 10.76c,d 8.44e 10.7c,d 8.88e 16.20b 11.6c 17.2a 10.1d 0.8999Leu 4.2de 4.06e 4.06e 5.53a 5.25b 4.34cd 4.48c 4.41c,d 0.2441Phe 2.10d 2.3c,d 2.20d 3.80a 2.70b 3.56a 2.58b,c 2.90b 0.3246Tyr 4.90d 3.46e,f 5.07d 3.66e 7.94a 5.51c 6.60b 3.10f 0.3763Sulfur-containing
amino acids2.03a 1.68b 1.93a,b 2.00a 2.03a 2.03a 2.0a 2.10a 0.2548
Trp 0.83a,b 0.77b 0.81a,b 0.83a,b 0.85a 0.82ab 0.84a 0.84a,b 0.0863
LSD, least significant difference* Values are means of triplicate samples. Means not sharing a common superscript letter in a column are significantly different at p ≤ .05.
Development of weaning food from sorghum
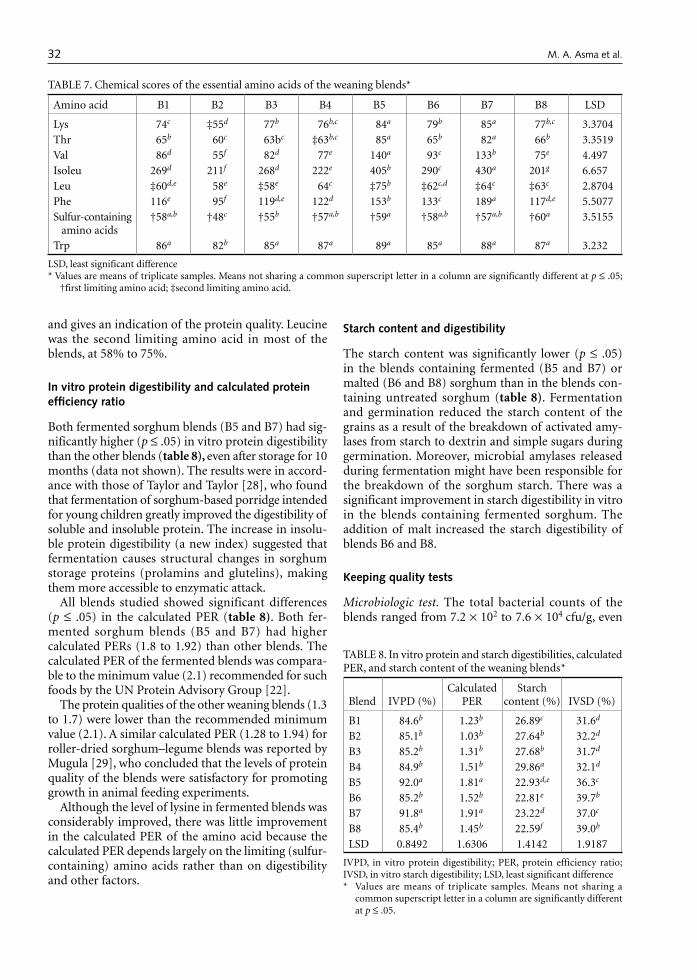
32
and gives an indication of the protein quality. Leucine was the second limiting amino acid in most of the blends, at 58% to 75%.
In vitro protein digestibility and calculated protein efficiency ratio
Both fermented sorghum blends (B5 and B7) had sig-nificantly higher (p ≤ .05) in vitro protein digestibility than the other blends (table 8), even after storage for 10 months (data not shown). The results were in accord-ance with those of Taylor and Taylor [28], who found that fermentation of sorghum-based porridge intended for young children greatly improved the digestibility of soluble and insoluble protein. The increase in insolu-ble protein digestibility (a new index) suggested that fermentation causes structural changes in sorghum storage proteins (prolamins and glutelins), making them more accessible to enzymatic attack.
All blends studied showed significant differences (p ≤ .05) in the calculated PER (table 8). Both fer-mented sorghum blends (B5 and B7) had higher calculated PERs (1.8 to 1.92) than other blends. The calculated PER of the fermented blends was compara-ble to the minimum value (2.1) recommended for such foods by the UN Protein Advisory Group [22].
The protein qualities of the other weaning blends (1.3 to 1.7) were lower than the recommended minimum value (2.1). A similar calculated PER (1.28 to 1.94) for roller-dried sorghum–legume blends was reported by Mugula [29], who concluded that the levels of protein quality of the blends were satisfactory for promoting growth in animal feeding experiments.
Although the level of lysine in fermented blends was considerably improved, there was little improvement in the calculated PER of the amino acid because the calculated PER depends largely on the limiting (sulfur-containing) amino acids rather than on digestibility and other factors.
Starch content and digestibility
The starch content was significantly lower (p ≤ .05) in the blends containing fermented (B5 and B7) or malted (B6 and B8) sorghum than in the blends con-taining untreated sorghum (table 8). Fermentation and germination reduced the starch content of the grains as a result of the breakdown of activated amy-lases from starch to dextrin and simple sugars during germination. Moreover, microbial amylases released during fermentation might have been responsible for the breakdown of the sorghum starch. There was a significant improvement in starch digestibility in vitro in the blends containing fermented sorghum. The addition of malt increased the starch digestibility of blends B6 and B8.
Keeping quality tests
Microbiologic test. The total bacterial counts of the blends ranged from 7.2 × 10² to 7.6 × 10⁴ cfu/g, even
TABLE 7. Chemical scores of the essential amino acids of the weaning blends*
Amino acid B1 B2 B3 B4 B5 B6 B7 B8 LSD
Lys 74c ‡55d 77b 76b,c 84a 79b 85a 77b,c 3.3704Thr 65b 60c 63bc ‡63b,c 85a 65b 82a 66b 3.3519Val 86d 55f 82d 77e 140a 93c 133b 75e 4.497Isoleu 269d 211f 268d 222e 405b 290c 430a 201g 6.657Leu ‡60d,e 58e ‡58e 64c ‡75b ‡62c,d ‡64c ‡63c 2.8704Phe 116e 95f 119d,e 122d 153b 133c 189a 117d,e 5.5077Sulfur-containing
amino acids†58a,b †48c †55b †57a,b †59a †58a,b †57a,b †60a 3.5155
Trp 86a 82b 85a 87a 89a 85a 88a 87a 3.232
LSD, least significant difference* Values are means of triplicate samples. Means not sharing a common superscript letter in a column are significantly different at p ≤ .05;
†first limiting amino acid; ‡second limiting amino acid.
TABLE 8. In vitro protein and starch digestibilities, calculated PER, and starch content of the weaning blends*
Blend IVPD (%)Calculated
PERStarch
content (%) IVSD (%)
B1 84.6b 1.23b 26.89c 31.6d
B2 85.1b 1.03b 27.64b 32.2d
B3 85.2b 1.31b 27.68b 31.7d
B4 84.9b 1.51b 29.86a 32.1d
B5 92.0a 1.81a 22.93d,e 36.3c
B6 85.2b 1.52b 22.81e 39.7b
B7 91.8a 1.91a 23.22d 37.0c
B8 85.4b 1.45b 22.59f 39.0b
LSD 0.8492 1.6306 1.4142 1.9187
IVPD, in vitro protein digestibility; PER, protein efficiency ratio; IVSD, in vitro starch digestibility; LSD, least significant difference* Values are means of triplicate samples. Means not sharing a
common superscript letter in a column are significantly different at p ≤ .05.
M. A. Asma et al.
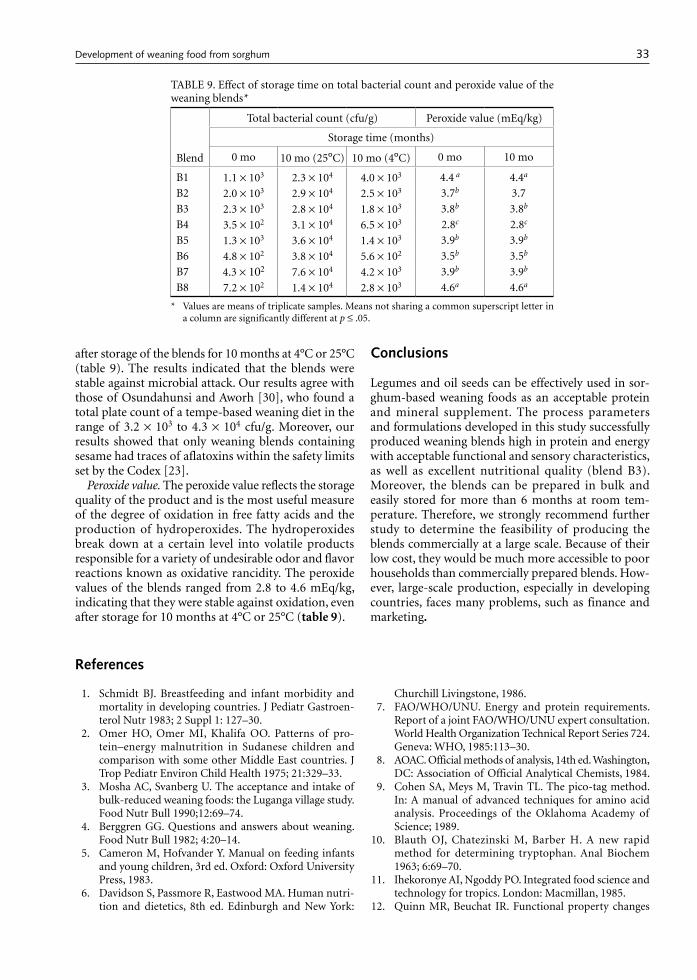
33
after storage of the blends for 10 months at 4°C or 25°C (table 9). The results indicated that the blends were stable against microbial attack. Our results agree with those of Osundahunsi and Aworh [30], who found a total plate count of a tempe-based weaning diet in the range of 3.2 × 10³ to 4.3 × 10⁴ cfu/g. Moreover, our results showed that only weaning blends containing sesame had traces of aflatoxins within the safety limits set by the Codex [23].
Peroxide value. The peroxide value reflects the storage quality of the product and is the most useful measure of the degree of oxidation in free fatty acids and the production of hydroperoxides. The hydroperoxides break down at a certain level into volatile products responsible for a variety of undesirable odor and flavor reactions known as oxidative rancidity. The peroxide values of the blends ranged from 2.8 to 4.6 mEq/kg, indicating that they were stable against oxidation, even after storage for 10 months at 4°C or 25°C (table 9).
Conclusions
Legumes and oil seeds can be effectively used in sor-ghum-based weaning foods as an acceptable protein and mineral supplement. The process parameters and formulations developed in this study successfully produced weaning blends high in protein and energy with acceptable functional and sensory characteristics, as well as excellent nutritional quality (blend B3). Moreover, the blends can be prepared in bulk and easily stored for more than 6 months at room tem-perature. Therefore, we strongly recommend further study to determine the feasibility of producing the blends commercially at a large scale. Because of their low cost, they would be much more accessible to poor households than commercially prepared blends. How-ever, large-scale production, especially in developing countries, faces many problems, such as finance and marketing.
TABLE 9. Effect of storage time on total bacterial count and peroxide value of the weaning blends*
Blend
Total bacterial count (cfu/g) Peroxide value (mEq/kg)
Storage time (months)
0 mo 10 mo (25°C) 10 mo (4°C) 0 mo 10 mo
B1 1.1 × 10³ 2.3 × 10⁴ 4.0 × 10³ 4.4 a 4.4a
B2 2.0 × 10³ 2.9 × 10⁴ 2.5 × 10³ 3.7b 3.7
B3 2.3 × 10³ 2.8 × 10⁴ 1.8 × 10³ 3.8b 3.8b
B4 3.5 × 10² 3.1 × 10⁴ 6.5 × 10³ 2.8c 2.8c
B5 1.3 × 10³ 3.6 × 10⁴ 1.4 × 10³ 3.9b 3.9b
B6 4.8 × 10² 3.8 × 10⁴ 5.6 × 10² 3.5b 3.5b
B7 4.3 × 10² 7.6 × 10⁴ 4.2 × 10³ 3.9b 3.9b
B8 7.2 × 10² 1.4 × 10⁴ 2.8 × 10³ 4.6a 4.6a
* Values are means of triplicate samples. Means not sharing a common superscript letter in a column are significantly different at p ≤ .05.
References
1. Schmidt BJ. Breastfeeding and infant morbidity and mortality in developing countries. J Pediatr Gastroen-terol Nutr 1983; 2 Suppl 1: 127–30.
2. Omer HO, Omer MI, Khalifa OO. Patterns of pro-tein–energy malnutrition in Sudanese children and comparison with some other Middle East countries. J Trop Pediatr Environ Child Health 1975; 21:329–33.
3. Mosha AC, Svanberg U. The acceptance and intake of bulk-reduced weaning foods: the Luganga village study. Food Nutr Bull 1990;12:69–74.
4. Berggren GG. Questions and answers about weaning. Food Nutr Bull 1982; 4:20–14.
5. Cameron M, Hofvander Y. Manual on feeding infants and young children, 3rd ed. Oxford: Oxford University Press, 1983.
6. Davidson S, Passmore R, Eastwood MA. Human nutri-tion and dietetics, 8th ed. Edinburgh and New York:
Churchill Livingstone, 1986. 7. FAO/WHO/UNU. Energy and protein requirements.
Report of a joint FAO/WHO/UNU expert consultation. World Health Organization Technical Report Series 724. Geneva: WHO, 1985:113–30.
8. AOAC. Official methods of analysis, 14th ed. Washington, DC: Association of Official Analytical Chemists, 1984.
9. Cohen SA, Meys M, Travin TL. The pico-tag method. In: A manual of advanced techniques for amino acid analysis. Proceedings of the Oklahoma Academy of Science; 1989.
10. Blauth OJ, Chatezinski M, Barber H. A new rapid method for determining tryptophan. Anal Biochem 1963; 6:69–70.
11. Ihekoronye AI, Ngoddy PO. Integrated food science and technology for tropics. London: Macmillan, 1985.
12. Quinn MR, Beuchat IR. Functional property changes
Development of weaning food from sorghum
34
resulting from fungal fermentation of peanut flour: effect on nutritive value. J Food Sci 1975; 40:475–8.
13. Wang JC, Kinsella JE. Functional properties of novel proteins: alfalfa leaf protein. J Food Sci 1976; 41:256–62.
14. Neff E, Morris HAL. Evaluation of reconstitution char-acteristics of food powder. Aust J Dairy Technol 1967; 22:24–28.
15. Manjula S, John E. Biochemical changes and in-vitro protein digestibility of germinating of seeds of Dolichos lablab. J Sci Food Agric 1991; 55:529–39.
16. FAO/WHO/UNU. Energy and protein requirements. Report of a joint FAO/WHO/UNU expert consultation. World Health Organization Technical Report Series 522. Geneva: WHO, 1973:108–24.
17. Satterlee LD, Marshall HF, Tennyson JM. Measuring protein quality. J Am Oil Chem Soc 1979; 56:103–9.
18. Singh U, Kherdekar MS, Jambunathan R. Studies on Desi and Kabuli chickpeas cultivars. The levels of amy-lase inhibitors, levels of oligosaccharides and in-vitro digestibility. J Food Sci 1982; 47:510–2.
19. Harrigan WF, MacCance M. Laboratory methods in food and dairy microbiology, 1st ed. London: Academic Press, 1976:139–50.
20. Snedecor GW, Cochran WG. Statistical methods, 7th ed. Ames, Iowa, USA: Iowa State University Press, 1980: 221–2.
21. Duncan DB. Multiple range and multiple F-tests. Bio-metrics 1955; 11:1–42.
22. Wondimu A, Malleshi NG. Development of weaning foods based on malted, popped, and roller-dried barley and chickpea. Food Nutr Bull 1996;17:24–8.
23. Codex Committee on Foods for Special Dietary Uses. Guidelines for development of supplementary foods for older infants and young children. Rome: Codex Alimen-tarius Commission, Food and Agriculture Organization of the United Nations/World Health Organization, 1985.
24. Jansen GR. A consideration of allowable fiber levels in weaning foods. Food Nutr Bull 1980; 2: 38–47.
25. Hegazy SM, Hussein MM, Bressani R. Nutritional qual-ity of low-cost food supplements for infant feeding. Egypt J Food Sci 1989; 17:1–13.
26. John C, Gopaldas T. Reduction in dietary bulk of soya-fortified bulgur wheat gruels with wheat-based amylase-rich food. Food Nutr Bull 1988;10 (4):51–5.
27. Mensah P, Tomkins AM, Drasar BS, Harrison TJ. Anti-microbial effect of fermented Ghanaian maize dough. J Appl Bacteriol 1991;7:203–10.
28. Taylor J, Taylor JRN. Alleviation of the adverse effects of cooking on protein digestibility in sorghum through fermentation in traditional African porridges. Int J Food Sci Tech 2002; 37:129–38.
29. Mugula JK. The nutritive quality of sorghum-common bean tempe. Plant Foods Hum Nutr 1992;42:247–56.
30. Osundahunsi OF, Aworh OC. A preliminary study on the use of tempe-based formula as a weaning diet in Nigeria. Plant Foods Hum Nutr 2002;57:365–76.
M. A. Asma et al.
Food and Nutrition Bulletin, vol. 27, no. 1 © 2006, The United Nations University. 35
Abstract
Background. Weight-for-age is a commonly used indi-cator of the health of children and communities. We determined the accuracy of health volunteers’ weight measurements in a nutrition project in Vietnam.
Objective. To report the accuracy of the volunteers’ weight measurements and to assess the likely effect of any inaccuracies.
Methods. Save the Children /USA trained health vol-unteers to weigh children (6–36 months old) every other month from December 1999 to August 2000. Trained researchers randomly rechecked 257 weights (range, 24–114 per session). We computed nondirectional and directional differences between the weights measured by volunteers and those measured by researchers.
Results. The weights recorded by volunteers were lower than those recorded by researchers by an average of 30 g (p < .05). Almost all of the error occurred during the first weighing session, at which the average weight recorded by volunteers was 280 g below that recorded by researchers (p = .01). The error at subsequent weighings was mini-mal (< 20 g below reference at each session).
Conclusions. One-time directional error suggests bias. Perhaps some communities (or families) influenced the volunteers to report weights lower than those actually observed to justify the programmatic food supplements or to give the impression at subsequent weighings that the level of malnutrition had been successfully reduced from that at the first session. Careful supervision of measure-ments of weight at baseline is essential.
Key words: measurement accuracy, nutrition, Viet-nam, volunteers, weight monitoring
Introduction
Community nutritional programs in Vietnam were first implemented in the early 1990s. The programs rely on female community volunteers, who are hamlet nurses, population or family planning collaborators, or the heads of the hamlet Women’s Unions, one of several mass organizations in socialist Vietnam. These volunteers weigh children once every 2 months to identify those at malnutrition levels C (< –3 and ≥ –4 weight-for-age z score [WAZ]) and D (< –4 WAZ), according to Government of Vietnam protocol. These children are targeted for rehabilitation by government or nongovernment programs. The nutritional status results not only guide interventions for specific chil-dren and families, but also help evaluate the effective-ness of interventions. Much rests on the accuracy of the anthropometric measurements performed by the volunteers. These volunteers are briefly trained in the use of scales to weigh children, but the accuracy of the measurements in Vietnam is generally unknown. The purpose of this paper is to report the accuracy of the volunteers’ weight measurements during the imple-mentation of a community nutrition intervention by Save the Children/USA in Phu Tho Province and to assess the likely effect of any inaccuracies.
Methods
Weighing by volunteers
The project included training, growth monitoring and promotion (GMP) sessions, and nutrition education and rehabilitation program (NERP) centers in six communes in two Districts of Phu Tho Province. The project targeted children aged 0 to 36 months from December 1999 to December 2000, during which time
Accuracy of child growth-monitoring weights obtained by commune volunteers in Phu Tho Province, Vietnam
Van Thuy Huong, Tran Duc Thach, Tran Tuan, and Tran Thu Ha are affiliated with the Research and Training Center for Community Development, Hanoi, Vietnam; David R. Marsh is affiliated with Save the Children/USA, Westport, Conn, USA.
Please direct queries to the corresponding author: Tran Tuan, Research and Training Center for Community Devel-opment, No. 39, Lane 255, Vong Street, Hai Ba Trung, Hanoi, Vietnam; e-mail: [email protected].
Van Thuy Huong, Tran Duc Thach, Tran Tuan, Tran Thu Ha, and David R. Marsh
36
GMP sessions were conducted for 1 or 2 days every 2 months [1]. Save the Children determined food sup-plementation per commune on the basis of the levels of malnutrition determined at the first GMP session.
The Save the Children volunteers lived in the com-munes and understood the conditions of people living there. They were between 25 and 45 years of age and were respected and trusted by people in the hamlet and commune. Save the Children staff, following the instructions of the GMP training curriculum, trained district trainers who, in turn, trained teams of vol-unteers. Two trained fieldworkers from the Research and Training Center for Community Development (RTCCD) observed the entire training. Save the Chil-dren provided each volunteer with Xuan Hoa scales (accurate to ± 100 g), which the volunteer had to main-tain, keeping them in good condition and determining their accuracy once a month against a standardized 1-kg weight.
Each volunteer was responsible for overseeing one weighing station, which was usually staffed by two people (a volunteer and a communal project manager or head of hamlet, or two volunteers), who usually weighed 20 to 30 children per GMP day. During the GMP, Save the Children volunteers were expected to perform the weighing in accordance with their train-ing, and with support from the village headman and a staff of the women’s union. Save the Children staff members made unannounced visits to GMP sessions to supervise the process. On the basis of the GMP results, caregivers of malnourished children were counseled and invited to participate in a Nutrition Education and Rehabilitation Program in which they would be able to share experiences and learn better child-care and feed-ing practices, and they were provided with nutritious meals for their children daily for 12 consecutive days, once a month. After the 12-day session, caregivers had the opportunity to continue healthy practices at home for the rest of the month, often supported by a visit from the local volunteer.
Validation
The RTCCD fieldworkers, supported by the LINK-AGES Project [2], assessed the accuracy of the weights recorded by volunteers during five GMP sessions. Working individually, the fieldworkers assessed all 53 weighing stations in the six communes. The fieldwork-ers observed the volunteers as they weighed the children and then randomly reweighed about a third of them, using the same scale and confirming the child’s identity from the Save the Children volunteers. The fieldwork-ers were trained not to intervene while the volunteers were weighing the children. Following a previously validated protocol [3], the fieldworkers removed the child’s outer clothing, shoes, hat, and blanket; estimated the weight of the remaining clothing, using prede-
termined reference weights for similar clothing; and subtracted the estimated weight of the clothing from the weight of the clothed child to determine the child’s weight. Tuan et al. [3] reported that the fieldworkers’ estimates of the weight of hot-weather clothing were accurate. The estimated weights of clothing worn in cold and extremely cold weather were slightly less than the actual clothing weights, but nearly all estimated weights (97.7%) were within the precision of the scales (± 50 g). The RTCCD results were then compared with the volunteers’ results from their own record books at the end of the GMP session.
Statistical analysis
The difference between the weights recorded by the volunteers and those recorded by the fieldworkers was calculated in two ways. The mean of the nondirectional difference was calculated by the equation
Diff =
(HVi -FWi )2
i=1
n
Â
n
Diff =
(HVi -FWi )i=1
n
Â
n
and the mean of the directional difference was calcu-lated by the equation
Diff =
(HVi -FWi )2
i=1
n
Â
n
Diff =
(HVi -FWi )i=1
n
Â
n
where HVi is the weight of child i measured by the volunteer, FWi is the weight of child i measured by the fieldworker, and n is the number of children. The mean nondirectional difference produced the average differ-ence between the weights recorded by the volunteers and those recorded by the fieldworkers. The mean directional difference produced the difference (nega-tive or positive) between the weights. We used a paired t-test to test the hypothesis that there was no difference between the weights recorded by the volunteers and those recorded by the fieldworkers; the analysis was performed by Epi Info 6.0 (Centers for Disease Control and Prevention, Atlanta, GA, USA).
Ethical approval for the larger, overarching longitu-dinal ViSION (Vietnam Study to Improve Outcomes in Nutrition) Project was granted by the Emory University Human Investigations Committee [2]. In Vietnam, RTCCD fieldworkers obtained written permission from the provincial authorities and obtained written informed consent from each mother or caregiver of the children in the study.
Results
The fieldworkers reweighed 257 children (table 1). Overall, the weights recorded by the volunteers differed
V. T. Huong et al.
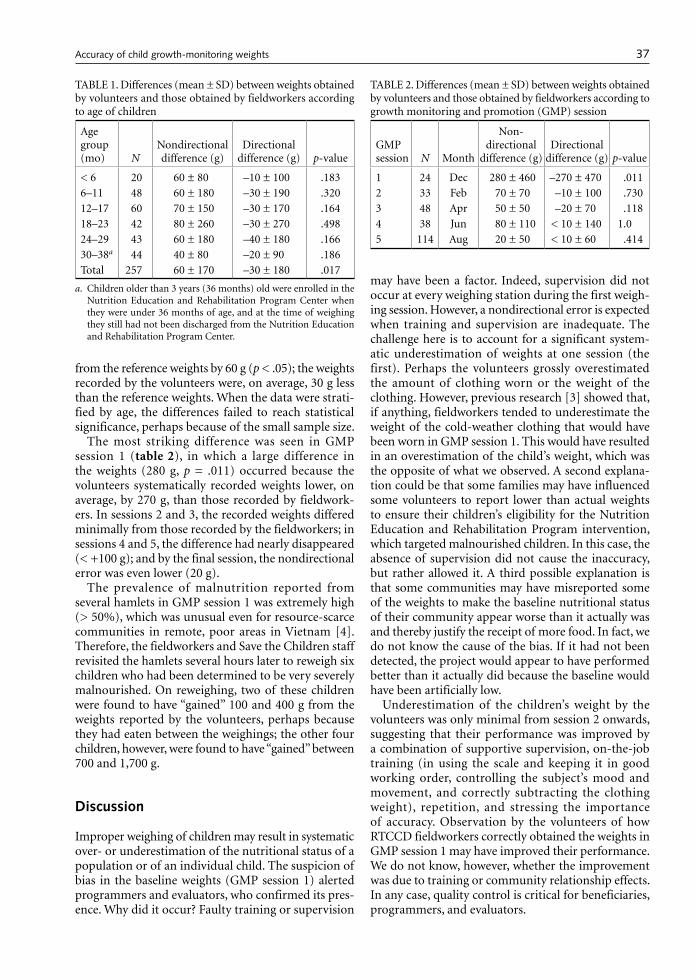
37
from the reference weights by 60 g (p < .05); the weights recorded by the volunteers were, on average, 30 g less than the reference weights. When the data were strati-fied by age, the differences failed to reach statistical significance, perhaps because of the small sample size.
The most striking difference was seen in GMP session 1 (table 2), in which a large difference in the weights (280 g, p = .011) occurred because the volunteers systematically recorded weights lower, on average, by 270 g, than those recorded by fieldwork-ers. In sessions 2 and 3, the recorded weights differed minimally from those recorded by the fieldworkers; in sessions 4 and 5, the difference had nearly disappeared (< +100 g); and by the final session, the nondirectional error was even lower (20 g).
The prevalence of malnutrition reported from several hamlets in GMP session 1 was extremely high (> 50%), which was unusual even for resource-scarce communities in remote, poor areas in Vietnam [4]. Therefore, the fieldworkers and Save the Children staff revisited the hamlets several hours later to reweigh six children who had been determined to be very severely malnourished. On reweighing, two of these children were found to have “gained” 100 and 400 g from the weights reported by the volunteers, perhaps because they had eaten between the weighings; the other four children, however, were found to have “gained” between 700 and 1,700 g.
Discussion
Improper weighing of children may result in systematic over- or underestimation of the nutritional status of a population or of an individual child. The suspicion of bias in the baseline weights (GMP session 1) alerted programmers and evaluators, who confirmed its pres-ence. Why did it occur? Faulty training or supervision
may have been a factor. Indeed, supervision did not occur at every weighing station during the first weigh-ing session. However, a nondirectional error is expected when training and supervision are inadequate. The challenge here is to account for a significant system-atic underestimation of weights at one session (the first). Perhaps the volunteers grossly overestimated the amount of clothing worn or the weight of the clothing. However, previous research [3] showed that, if anything, fieldworkers tended to underestimate the weight of the cold-weather clothing that would have been worn in GMP session 1. This would have resulted in an overestimation of the child’s weight, which was the opposite of what we observed. A second explana-tion could be that some families may have influenced some volunteers to report lower than actual weights to ensure their children’s eligibility for the Nutrition Education and Rehabilitation Program intervention, which targeted malnourished children. In this case, the absence of supervision did not cause the inaccuracy, but rather allowed it. A third possible explanation is that some communities may have misreported some of the weights to make the baseline nutritional status of their community appear worse than it actually was and thereby justify the receipt of more food. In fact, we do not know the cause of the bias. If it had not been detected, the project would appear to have performed better than it actually did because the baseline would have been artificially low.
Underestimation of the children’s weight by the volunteers was only minimal from session 2 onwards, suggesting that their performance was improved by a combination of supportive supervision, on-the-job training (in using the scale and keeping it in good working order, controlling the subject’s mood and movement, and correctly subtracting the clothing weight), repetition, and stressing the importance of accuracy. Observation by the volunteers of how RTCCD fieldworkers correctly obtained the weights in GMP session 1 may have improved their performance. We do not know, however, whether the improvement was due to training or community relationship effects. In any case, quality control is critical for beneficiaries, programmers, and evaluators.
TABLE 1. Differences (mean ± SD) between weights obtained by volunteers and those obtained by fieldworkers according to age of children
Age group (mo) N
Nondirectional difference (g)
Directional difference (g) p-value
< 6 20 60 ± 80 –10 ± 100 .1836–11 48 60 ± 180 –30 ± 190 .32012–17 60 70 ± 150 –30 ± 170 .16418–23 42 80 ± 260 –30 ± 270 .49824–29 43 60 ± 180 –40 ± 180 .16630–38a 44 40 ± 80 –20 ± 90 .186Total 257 60 ± 170 –30 ± 180 .017
a. Children older than 3 years (36 months) old were enrolled in the Nutrition Education and Rehabilitation Program Center when they were under 36 months of age, and at the time of weighing they still had not been discharged from the Nutrition Education and Rehabilitation Program Center.
TABLE 2. Differences (mean ± SD) between weights obtained by volunteers and those obtained by fieldworkers according to growth monitoring and promotion (GMP) session
GMP session N Month
Non-directional
difference (g)Directional
difference (g) p-value
1 24 Dec 280 ± 460 –270 ± 470 .0112 33 Feb 70 ± 70 –10 ± 100 .7303 48 Apr 50 ± 50 –20 ± 70 .1184 38 Jun 80 ± 110 < 10 ± 140 1.05 114 Aug 20 ± 50 < 10 ± 60 .414
Accuracy of child growth-monitoring weights

38
References
1. Schroeder DG, Pachon H, Dearden KA, Kwon CB, Ha TT, Lang TT, Marsh DR. An integrated child nutrition intervention improved growth of younger, more mal-nourished children in northern Viet Nam. Food Nutr Bull 2002;23(Suppl):53–61.
2. Marsh DR, Pachon H, Schroeder DG, Ha TT, Dearden KA, Lang TT, Hien ND, Tuan DA, Thach TD, Claussen-ius DR. Design of a prospective, randomized evaluation of an integrated nutrition program in rural Viet Nam. Food Nutr Bull 2002;23(Suppl):36–47.
3. Tuan T, Marsh DR, Ha TT, Schroeder DG, Thach TD, Dung VM, Huong NT. Weighing Vietnamese children: How accurate are child weights adjusted for estimates of clothing weight? Food Nutr Bull 2002;23(Suppl):48–52.
4. Dibley MJ, Khoi HH, Tam NC, Tuyen LD, Do TT, Mai LB. National Protein Energy Malnutrition Survey Viet Nam 1998: Report of Survey Results. National Institute of Nutrition, Ministry of Health Vietnam and Center for Clinical Epidemiology and Biostatistics, the University of Newcastle Australia. Hanoi, Vietnam, July 1999.
V. T. Huong et al.
Food and Nutrition Bulletin, vol. 27, no. 1 © 2006, The United Nations University. 39
Abstract
Background. Overweight and obesity have reached epidemic proportions in Arabian oil-rich countries and are threatening to become a global epidemic. Excess weight has a great impact on the health and quality of life of individuals. However, prevalence of underweight in the developing world has shown a decline during the last decade.
Objective. The aim of this cross-sectional study was to determine the prevalence of underweight, overweight, and obesity, as measured by body-mass index, in a rep-resentative sample of adolescents aged 12 to 17 years in the State of Qatar.
Methods. Qatari schoolchildren (n = 3,923) from 30 schools in urban and semiurban districts responded to a sociodemographic questionnaire. Body-mass index was calculated and the prevalence of overweight and obesity was determined on the basis of cutoff points of the Inter-national Obesity Task Force (IOTF) values (above the 85th and 95th percentiles, respectively, for overweight and obesity). Underweight was defined on the basis of CDC (Centers for Disease Control and Prevention) less than 5th percentile of BMI for age.
Results. The final sample consisted of 1,968 boys and 1,955 girls. The prevalence of underweight, overweight, and obesity was 8.6%, 28.6%, and 7.9%, respectively, among adolescent boys and 5.8%, 18.9%, and 4.7% among girls. The prevalence of underweight was highest at 16 years of age among boys (10.5%) and at 17 years among girls (8.9%). The prevalence of obesity was highest
at 12 years of age among boys (11.7%) and at 13 years among girls (6.4%). The 95th percentile curve for boys was above the IOTF standard curve; the 95th percentile curve for girls was below the IOTF curve.
Conclusions. Adolescents living in the State of Qatar are at high risk for overweight and obesity. There is a need to establish a national program for the prevention and treatment of obesity and related complications.
Key words: Adolescents, body-mass index (BMI), obesity, overweight, prevalence, underweight
Introduction
Adolescence is characterized by rapid physical growth and sexual development, accompanied by changes in the percentage of body fat. Childhood and adolescent obesity has been identified as a risk factor for obesity in adulthood, and it increases adult morbidity and mortality by leading to a variety of adverse health out-comes [1, 2]. On the other hand, undernutrition is still prevalent in developing countries and continues to be a primary cause of poor health [3, 4]. In Asian countries, the incidence of low birthweight predicts the prevalence of underweight during preschool and subsequent years. Childhood and adolescent stunting adversely affects the health of adults [5]. The prevalence of malnutrition, particularly wasting, is much higher in South Asia than in developing countries in other regions. The risk fac-tors for cardiovascular diseases originate in youth and early adulthood [6]. Numerous studies have reported that cardiovascular disease risk factors are associated with adiposity in children [7]. Childhood overweight and obesity are associated with an increased prevalence of cardiovascular disease risk factors [8], and persistent obesity is associated with the development of adverse adult cardiovascular disease risk profiles [9]. Child-hood obesity has become a severe health problem in some developing countries, especially during the last few decades [10], mirroring the increased prevalence
Prevalence of obesity, overweight, and underweight in Qatari adolescents
The author is affiliated with the Department of Medi-cal Statistics and Epidemiology, Hamad General Hospital, Hamad Medical Corporation, Doha, State of Qatar, and Evidence for Population Health Unit, School of Epidemi-ology and Health Sciences, The University of Manchester, Manchester, UK.
Please direct queries to the author: Abdulbari Bener, Department of Medical Statistics and Epidemiology, Hamad Medical Corporation, PO Box 3050, Doha, State of Qatar; e-mail: [email protected] or abaribener@ hotmail.com.
Abdulbari Bener
40
of overweight and obesity in industrialized countries in recent years [11]. The increasing numbers of obese children and adolescents worldwide demand an invest-ment in primary and secondary prevention of obesity and overweight in this age group [12].
In contrast to children and adults, relatively little information is available about gender differences in weight status among adolescents [13–16]. However, it has recently been estimated that the prevalence of adolescent obesity is increasing not only in developed countries but also in some developing countries in which malnutrition used to be the major nutritional disorder [2, 16–18].
Adolescent growth is influenced by individual, genetic, and environmental factors. During childhood and adolescence, the body-mass index (BMI) is the preferred method of expressing the body fat percentiles of groups. It is widely accepted that a BMI between the 85th and 95th percentiles is defined as overweight, and a BMI greater than the 95th percentile as obesity [1, 19, 20]. Furthermore, there are some population-specific differences in BMI cutoffs; for example, the 85th percentile for children in the United States, cor-responds to the 95th percentile for Brazilian children [17] and the 90th percentile for British children [21]. Therefore, it is necessary to determine values specific to a community.
The aim of this study was to determine BMI percen-tiles and the prevalence of underweight, overweight, and obesity in a representative sample of adolescents aged 12 to 17 years living in the State of Qatar, and to compare the 95th percentile BMI curve to the curves of other countries and the recently published Interna-tional Obesity Task Force (IOTF) values [1].
Methods
The State of Qatar, with a land area of 11,493 km2 and an estimated population of 724,125 for the year 2003, is divided into 22 urban and semiurban districts, with virtually no rural areas. During the study period from September 2003 to May 2004, 45,354 Qatari students aged 6 to 18 years were attending government schools was [22].
The State of Qatar has experienced rapid social and economic changes and a rise in per capita income, particularly during the oil boom of 1973–81. The result has been a dramatic improvement in the health and nutritional status of the population. The infant mor-tality rate decreased from 17 per thousand in 1981 to 10.7 per thousand in 2003, a much better rate than the target set by the World Health Organization (WHO) of 50 per thousand [22].
The schoolchildren studied for the growth survey were the subjects of the cross-sectional population study conducted in both urban and semiurban areas
of the State of Qatar with the use of a multistage, stratified, random sampling technique. The original objective was to collect a sample size of 4,800 students which is 10.6% of Qatari students aged 12 to 17 years registered for the school year 2003/04. To collect a uniform sample 400 students in each age–sex group were selected. A list of names of government schools was obtained from the office of the Director of General Education in the Ministry of Education. Thirty schools (15 boys’ schools and 15 girls’ schools) were selected randomly. Of these, 24 were proportionally selected from urban areas and 6 from semiurban areas. The schools were divided into two educational levels, inter-mediate and secondary, and the sample was adjusted proportionally to these levels from each school using school records in a systematic sampling technique. The socio-demographic questionnaire along with a consent form was sent to the parents of the schoolchil-dren a few days before the measurements were taken. Written informed consent was obtained and then the measurements were taken. The study was approved by the Research Ethics Committee of the Hamad Medical Corporation, State of Qatar.
The final sample size was determined by the fol-lowing steps. First, the number of adolescents in each age group was obtained from the population census (Annual Health Report 2003) [22]. Second, the number of subjects living in urban and semiurban areas was estimated at 80% and 20%, respectively. The number of students selected from each school was determined according to the total number of students at each school. Finally, the classrooms were chosen on a sys-tematic random basis, and each adolescent was selected randomly from a classroom. Since the Government of Qatar bears all expenses of the education of Qataris, the majority of children (90%) go to school.
The survey instrument, which included the socio-demographic information of the parents, was tested on 100 randomly selected children from different schools. A representative sample of 4,800 students from various schools was included in this study. Of these students, 3,923 were included for analysis; 877 were excluded because of incomplete surveys and weights/heights outside a specific range (see below for details on criteria for exclusion).
School nurses were trained in the correct meth-ods for taking anthropometric measurements of the subjects. To minimize errors in measurement, scales were checked for accuracy by weighing an object of known weights. Height was measured by a portable stadiometer (SECA 208; Vogel and Halke, Germany) attached to the scales. The students stood up straight, in bare feet, with heels, buttocks, and back touching the stadiometer. The portable scale and stadiometer were calibrated daily. The students were dressed in light underclothing and wore no shoes throughout the measurements. Weight was measured in grams and
A. Bener
41
converted to kilograms to three decimal places, and height was measured in centimeters and converted to meters to two decimal places. The BMI was calculated as the ratio of the body weight in kilograms to the square of the height in meters.
The data were entered and processed on an IBM computer by SPSS (Statistical Package for the Social Sciences, Chicago, IL, USA). Descriptive statistics on BMI, weight, and height, including the median (50th percentile) and the other percentiles, were calculated. Estimates of the prevalence of overweight and obesity were based on the cutoff points of IOTF values. IOTF defines overweight as a BMI equal to or greater than the 85th percentile and less than the 95th percentile for sex and age, and obesity as a BMI equal to or greater than the 95th percentile for sex and age. Since there is no IOTF definition of underweight, the prevalence of underweight was defined as the percentage of adoles-cents with a BMI below the 5th percentile for sex and age according to the Centers for Disease Control and Prevention (CDC) cutoffs [23]. We used the least mean squares (LMS) method to fit smooth centile curves to reference data as described by Cole [1, 24–26]. Subjects with values outside the range from –6 to +6 SD in
height-for-age and weight-for-age and from –4 to +6 SD in weight-for-height were excluded. Chi-square test was performed to test the difference in proportions of categorical variables with p < .05 as the cut-off value for significance.
Results
The final sample of adolescents aged between 12 and 17 years consisted of 1,968 boys and 1,955 girls. The final sample in this study consisted of 3,923 adolescents after removal of all outliers. The mean values (±SD) of weight, height, and calculated BMI in relation to age are shown in table 1.
The crude BMI percentiles for adolescents accord-ing to sex are shown in table 2. The prevalences of underweight, overweight, and obesity for adolescents of different ages according to sex are shown in table 3. The prevalence of underweight, overweight, and obesity was 8.6%, 28.6%, and 7.9%, respectively, among boys and 5.8%, 18.9%, and 4.7% among girls. The prevalence of underweight was highest at 16 years of age among boys (10.5%) and at 17 years among girls (8.9%). The preva-
TABLE 1. Mean ± SD height, weight, and body-mass index (BMI) of Qatari adolescents according to age and sexa
Age (yr)
No. of subjects Height (cm) Weight (kg) BMI (kg/m2)
Boys Girls Boys Girls Boys Girls Boys Girls
12 385 353 149.6 ± 7.2[136–167]
149.0 ± 5.8[134–165]
45.6 ± 12.1[28–78]
43.2 ± 9.9[30–75]
20.2 ± 4.5[13–32]
19.4 ± 3.9[14–33]
13 298 377 154.2 ± 7.6[138–172]
153.8 ± 5.5[140–169]
49.7 ± 12.1[30–84]
48.9 ± 10.8[30–77]
20.7 ± 4.1[12–30]
20.6 ± 4.2[13–33]
14 383 345 161.4 ± 6.7[146–174]
155.1 ± 5.3[144–171]
56.9 ± 12.3[30–85]
51.4 ± 10.6[34–78]
21.8 ± 4.2[13–33]
21.3 ± 4.0[15–33]
15 318 343 165.0 ± 6.6[148–182]
157.1 ± 4.9[149–173]
60.0 ± 11.6[33–86]
52.6 ± 10.0[36–80]
22.0 ± 4.0[14–31]
21.3 ± 3.8[14–33]
16 334 290 167.9 ± 6.0[150–182]
158.6 ± 5.1[150–173]
63.7 ± 11.8[40–89]
55.0 ± 9.2[37–82]
22.6 ± 4.1[15–33]
21.8 ± 3.2[16–31]
17 250 247 168.2 ± 6.5[150–180]
159.1 ± 4.5[151–175]
64.7 ± 1.8[42–83]
55.1 ± 9.6[38–82]
22.9 ± 3.7[15–33]
21.7 ± 3.5[16–32]
a. Values in square brackets are ranges.
TABLE 2. Crude percentiles for body-mass index of Qatari adolescents according to age and sex
Age (yr)
BMI (kg/m2)
Boys Girls
P 05 P 10 P 25 P 50 P 75 P 85 P 90 P 95 P 05 P 10 P 25 P 50 P 75 P 85 P 90 P 95
12 14.8 15.2 16.6 19.0 23.2 25.2 27.1 29.4 14.9 15.6 16.6 18.4 21.4 23.7 25.1 27.513 15.2 15.9 17.3 20.2 24.1 26.0 26.8 27.8 15.1 16.0 17.4 19.8 23.0 25.1 27.2 28.814 15.6 16.4 18.4 21.3 25.0 26.1 27.6 29.3 16.2 16.8 18.2 20.3 24.2 25.8 27.4 29.015 16.3 17.1 18.8 21.6 25.3 26.8 27.5 28.3 16.6 17.1 18.2 20.4 23.4 25.2 27.0 28.616 16.5 17.2 19.1 22.2 26.0 27.0 28.0 29.0 17.2 18.2 19.4 21.2 23.9 25.6 26.5 27.717 16.5 18.2 20.3 22.2 25.5 27.3 28.0 29.4 16.9 17.7 19.1 21.0 23.9 25.5 26.4 28.6
BMI, body-mass index; P, percentile
Prevalence of overweight and obesity in Qatari adolescents
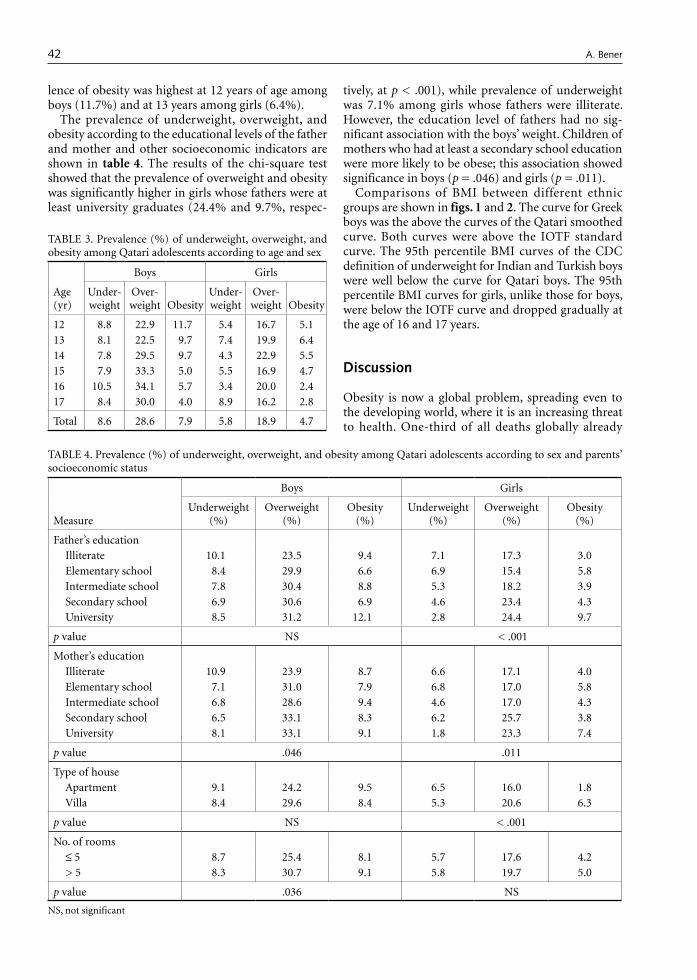
42
lence of obesity was highest at 12 years of age among boys (11.7%) and at 13 years among girls (6.4%).
The prevalence of underweight, overweight, and obesity according to the educational levels of the father and mother and other socioeconomic indicators are shown in table 4. The results of the chi-square test showed that the prevalence of overweight and obesity was significantly higher in girls whose fathers were at least university graduates (24.4% and 9.7%, respec-
tively, at p < .001), while prevalence of underweight was 7.1% among girls whose fathers were illiterate. However, the education level of fathers had no sig-nificant association with the boys’ weight. Children of mothers who had at least a secondary school education were more likely to be obese; this association showed significance in boys (p = .046) and girls (p = .011).
Comparisons of BMI between different ethnic groups are shown in figs. 1 and 2. The curve for Greek boys was the above the curves of the Qatari smoothed curve. Both curves were above the IOTF standard curve. The 95th percentile BMI curves of the CDC definition of underweight for Indian and Turkish boys were well below the curve for Qatari boys. The 95th percentile BMI curves for girls, unlike those for boys, were below the IOTF curve and dropped gradually at the age of 16 and 17 years.
Discussion
Obesity is now a global problem, spreading even to the developing world, where it is an increasing threat to health. One-third of all deaths globally already
TABLE 3. Prevalence (%) of underweight, overweight, and obesity among Qatari adolescents according to age and sex
Age (yr)
Boys Girls
Under-weight
Over-weight Obesity
Under-weight
Over-weight Obesity
12 8.8 22.9 11.70 5.4 16.7 5.113 8.1 22.5 9.7 7.4 19.9 6.414 7.8 29.5 9.7 4.3 22.9 5.515 7.9 33.3 5.0 5.5 16.9 4.716 10.50 34.1 5.7 3.4 20.0 2.417 8.4 30.0 4.0 8.9 16.2 2.8
Total 8.6 28.6 7.9 5.8 18.9 4.7
TABLE 4. Prevalence (%) of underweight, overweight, and obesity among Qatari adolescents according to sex and parents’ socioeconomic status
Measure
Boys Girls
Underweight (%)
Overweight (%)
Obesity (%)
Underweight (%)
Overweight (%)
Obesity (%)
Father’s education Illiterate 10.10 23.5 9.4 7.1 17.3 3.0Elementary school 8.4 29.9 6.6 6.9 15.4 5.8Intermediate school 7.8 30.4 8.8 5.3 18.2 3.9Secondary school 6.9 30.6 6.9 4.6 23.4 4.3University 8.5 31.2 12.10 2.8 24.4 9.7
p value NS < .001
Mother’s educationIlliterate 10.90 23.9 8.7 6.6 17.1 4.0Elementary school 7.1 31.0 7.9 6.8 17.0 5.8Intermediate school 6.8 28.6 9.4 4.6 17.0 4.3Secondary school 6.5 33.1 8.3 6.2 25.7 3.8University 8.1 33.1 9.1 1.8 23.3 7.4
p value .046 .011
Type of houseApartment 9.1 24.2 9.5 6.5 16.0 1.8Villa 8.4 29.6 8.4 5.3 20.6 6.3
p value NS < .001
No. of rooms≤ 5 8.7 25.4 8.1 5.7 17.6 4.2> 5 8.3 30.7 9.1 5.8 19.7 5.0
p value .036 NS
NS, not significant
A. Bener
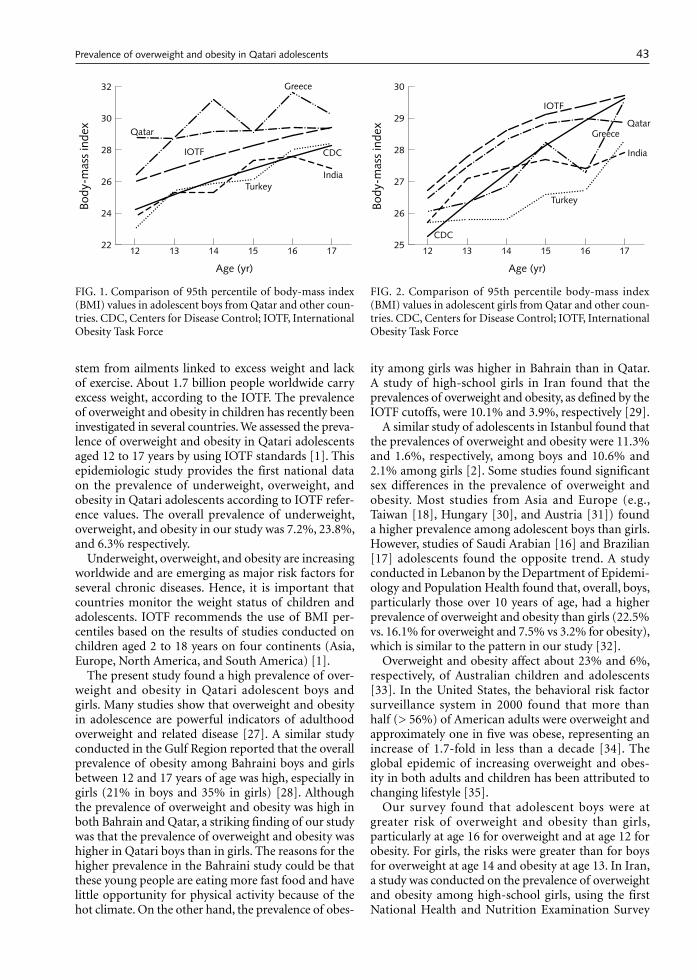
43
stem from ailments linked to excess weight and lack of exercise. About 1.7 billion people worldwide carry excess weight, according to the IOTF. The prevalence of overweight and obesity in children has recently been investigated in several countries. We assessed the preva-lence of overweight and obesity in Qatari adolescents aged 12 to 17 years by using IOTF standards [1]. This epidemiologic study provides the first national data on the prevalence of underweight, overweight, and obesity in Qatari adolescents according to IOTF refer-ence values. The overall prevalence of underweight, overweight, and obesity in our study was 7.2%, 23.8%, and 6.3% respectively.
Underweight, overweight, and obesity are increasing worldwide and are emerging as major risk factors for several chronic diseases. Hence, it is important that countries monitor the weight status of children and adolescents. IOTF recommends the use of BMI per-centiles based on the results of studies conducted on children aged 2 to 18 years on four continents (Asia, Europe, North America, and South America) [1].
The present study found a high prevalence of over-weight and obesity in Qatari adolescent boys and girls. Many studies show that overweight and obesity in adolescence are powerful indicators of adulthood overweight and related disease [27]. A similar study conducted in the Gulf Region reported that the overall prevalence of obesity among Bahraini boys and girls between 12 and 17 years of age was high, especially in girls (21% in boys and 35% in girls) [28]. Although the prevalence of overweight and obesity was high in both Bahrain and Qatar, a striking finding of our study was that the prevalence of overweight and obesity was higher in Qatari boys than in girls. The reasons for the higher prevalence in the Bahraini study could be that these young people are eating more fast food and have little opportunity for physical activity because of the hot climate. On the other hand, the prevalence of obes-
ity among girls was higher in Bahrain than in Qatar. A study of high-school girls in Iran found that the prevalences of overweight and obesity, as defined by the IOTF cutoffs, were 10.1% and 3.9%, respectively [29].
A similar study of adolescents in Istanbul found that the prevalences of overweight and obesity were 11.3% and 1.6%, respectively, among boys and 10.6% and 2.1% among girls [2]. Some studies found significant sex differences in the prevalence of overweight and obesity. Most studies from Asia and Europe (e.g., Taiwan [18], Hungary [30], and Austria [31]) found a higher prevalence among adolescent boys than girls. However, studies of Saudi Arabian [16] and Brazilian [17] adolescents found the opposite trend. A study conducted in Lebanon by the Department of Epidemi-ology and Population Health found that, overall, boys, particularly those over 10 years of age, had a higher prevalence of overweight and obesity than girls (22.5% vs. 16.1% for overweight and 7.5% vs 3.2% for obesity), which is similar to the pattern in our study [32].
Overweight and obesity affect about 23% and 6%, respectively, of Australian children and adolescents [33]. In the United States, the behavioral risk factor surveillance system in 2000 found that more than half (> 56%) of American adults were overweight and approximately one in five was obese, representing an increase of 1.7-fold in less than a decade [34]. The global epidemic of increasing overweight and obes-ity in both adults and children has been attributed to changing lifestyle [35].
Our survey found that adolescent boys were at greater risk of overweight and obesity than girls, particularly at age 16 for overweight and at age 12 for obesity. For girls, the risks were greater than for boys for overweight at age 14 and obesity at age 13. In Iran, a study was conducted on the prevalence of overweight and obesity among high-school girls, using the first National Health and Nutrition Examination Survey
��
��
��
��
��
����
����
����
����
�
��������
������������
�����
������
����
�����
���
������
FIG. 1. Comparison of 95th percentile of body-mass index (BMI) values in adolescent boys from Qatar and other coun-tries. CDC, Centers for Disease Control; IOTF, International Obesity Task Force
��
��
��
��
��
��
����
����
����
���
��������
������������
�����
����
�����
���
������
������
FIG. 2. Comparison of 95th percentile body-mass index (BMI) values in adolescent girls from Qatar and other coun-tries. CDC, Centers for Disease Control; IOTF, International Obesity Task Force
Prevalence of overweight and obesity in Qatari adolescents
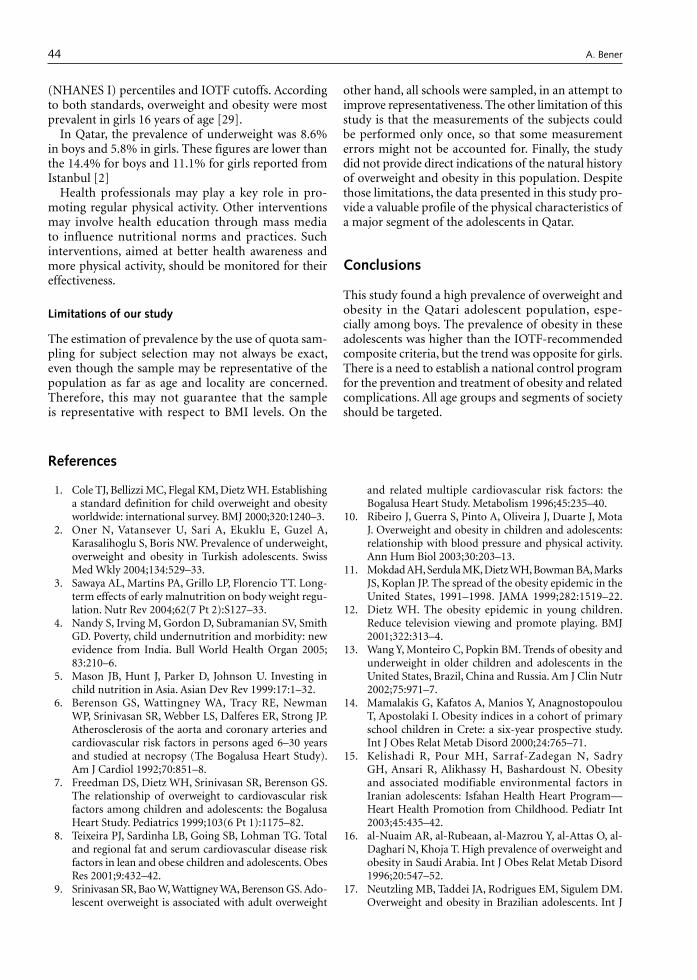
44
(NHANES I) percentiles and IOTF cutoffs. According to both standards, overweight and obesity were most prevalent in girls 16 years of age [29].
In Qatar, the prevalence of underweight was 8.6% in boys and 5.8% in girls. These figures are lower than the 14.4% for boys and 11.1% for girls reported from Istanbul [2]
Health professionals may play a key role in pro-moting regular physical activity. Other interventions may involve health education through mass media to influence nutritional norms and practices. Such interventions, aimed at better health awareness and more physical activity, should be monitored for their effectiveness.
Limitations of our study
The estimation of prevalence by the use of quota sam-pling for subject selection may not always be exact, even though the sample may be representative of the population as far as age and locality are concerned. Therefore, this may not guarantee that the sample is representative with respect to BMI levels. On the
other hand, all schools were sampled, in an attempt to improve representativeness. The other limitation of this study is that the measurements of the subjects could be performed only once, so that some measurement errors might not be accounted for. Finally, the study did not provide direct indications of the natural history of overweight and obesity in this population. Despite those limitations, the data presented in this study pro-vide a valuable profile of the physical characteristics of a major segment of the adolescents in Qatar.
Conclusions
This study found a high prevalence of overweight and obesity in the Qatari adolescent population, espe-cially among boys. The prevalence of obesity in these adolescents was higher than the IOTF-recommended composite criteria, but the trend was opposite for girls. There is a need to establish a national control program for the prevention and treatment of obesity and related complications. All age groups and segments of society should be targeted.
References
1. Cole TJ, Bellizzi MC, Flegal KM, Dietz WH. Establishing a standard definition for child overweight and obesity worldwide: international survey. BMJ 2000;320:1240–3.
2. Oner N, Vatansever U, Sari A, Ekuklu E, Guzel A, Karasalihoglu S, Boris NW. Prevalence of underweight, overweight and obesity in Turkish adolescents. Swiss Med Wkly 2004;134:529–33.
3. Sawaya AL, Martins PA, Grillo LP, Florencio TT. Long-term effects of early malnutrition on body weight regu-lation. Nutr Rev 2004;62(7 Pt 2):S127–33.
4. Nandy S, Irving M, Gordon D, Subramanian SV, Smith GD. Poverty, child undernutrition and morbidity: new evidence from India. Bull World Health Organ 2005; 83:210–6.
5. Mason JB, Hunt J, Parker D, Johnson U. Investing in child nutrition in Asia. Asian Dev Rev 1999:17:1–32.
6. Berenson GS, Wattingney WA, Tracy RE, Newman WP, Srinivasan SR, Webber LS, Dalferes ER, Strong JP. Atherosclerosis of the aorta and coronary arteries and cardiovascular risk factors in persons aged 6–30 years and studied at necropsy (The Bogalusa Heart Study). Am J Cardiol 1992;70:851–8.
7. Freedman DS, Dietz WH, Srinivasan SR, Berenson GS. The relationship of overweight to cardiovascular risk factors among children and adolescents: the Bogalusa Heart Study. Pediatrics 1999;103(6 Pt 1):1175–82.
8. Teixeira PJ, Sardinha LB, Going SB, Lohman TG. Total and regional fat and serum cardiovascular disease risk factors in lean and obese children and adolescents. Obes Res 2001;9:432–42.
9. Srinivasan SR, Bao W, Wattigney WA, Berenson GS. Ado-lescent overweight is associated with adult overweight
and related multiple cardiovascular risk factors: the Bogalusa Heart Study. Metabolism 1996;45:235–40.
10. Ribeiro J, Guerra S, Pinto A, Oliveira J, Duarte J, Mota J. Overweight and obesity in children and adolescents: relationship with blood pressure and physical activity. Ann Hum Biol 2003;30:203–13.
11. Mokdad AH, Serdula MK, Dietz WH, Bowman BA, Marks JS, Koplan JP. The spread of the obesity epidemic in the United States, 1991–1998. JAMA 1999;282:1519–22.
12. Dietz WH. The obesity epidemic in young children. Reduce television viewing and promote playing. BMJ 2001;322:313–4.
13. Wang Y, Monteiro C, Popkin BM. Trends of obesity and underweight in older children and adolescents in the United States, Brazil, China and Russia. Am J Clin Nutr 2002;75:971–7.
14. Mamalakis G, Kafatos A, Manios Y, Anagnostopoulou T, Apostolaki I. Obesity indices in a cohort of primary school children in Crete: a six-year prospective study. Int J Obes Relat Metab Disord 2000;24:765–71.
15. Kelishadi R, Pour MH, Sarraf-Zadegan N, Sadry GH, Ansari R, Alikhassy H, Bashardoust N. Obesity and associated modifiable environmental factors in Iranian adolescents: Isfahan Health Heart Program—Heart Health Promotion from Childhood. Pediatr Int 2003;45:435–42.
16. al-Nuaim AR, al-Rubeaan, al-Mazrou Y, al-Attas O, al-Daghari N, Khoja T. High prevalence of overweight and obesity in Saudi Arabia. Int J Obes Relat Metab Disord 1996;20:547–52.
17. Neutzling MB, Taddei JA, Rodrigues EM, Sigulem DM. Overweight and obesity in Brazilian adolescents. Int J
A. Bener
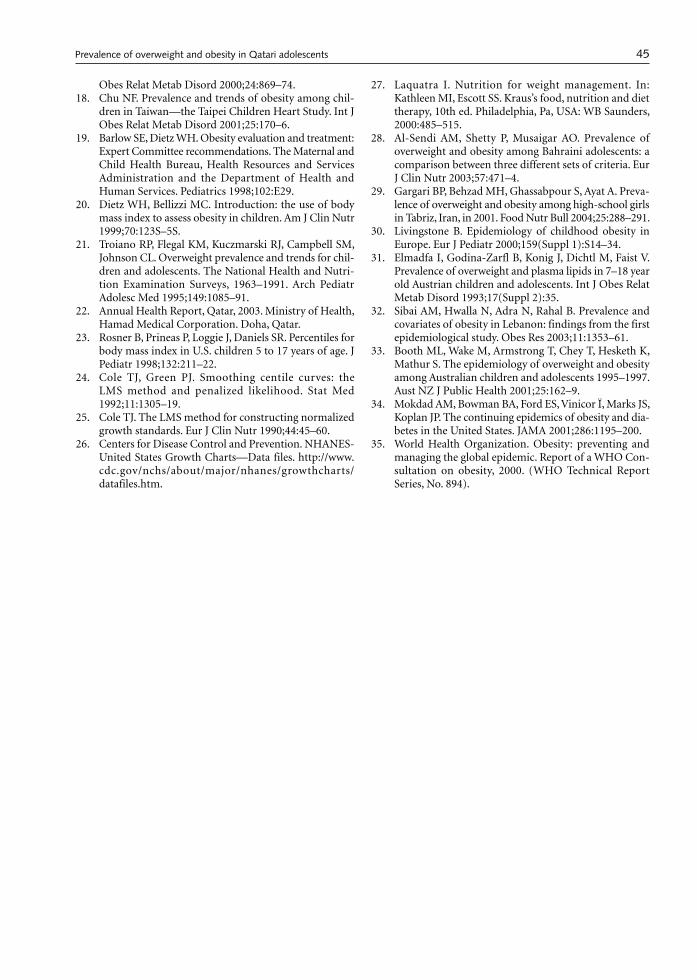
45
Obes Relat Metab Disord 2000;24:869–74. 18. Chu NF. Prevalence and trends of obesity among chil-
dren in Taiwan—the Taipei Children Heart Study. Int J Obes Relat Metab Disord 2001;25:170–6.
19. Barlow SE, Dietz WH. Obesity evaluation and treatment: Expert Committee recommendations. The Maternal and Child Health Bureau, Health Resources and Services Administration and the Department of Health and Human Services. Pediatrics 1998;102:E29.
20. Dietz WH, Bellizzi MC. Introduction: the use of body mass index to assess obesity in children. Am J Clin Nutr 1999;70:123S–5S.
21. Troiano RP, Flegal KM, Kuczmarski RJ, Campbell SM, Johnson CL. Overweight prevalence and trends for chil-dren and adolescents. The National Health and Nutri-tion Examination Surveys, 1963–1991. Arch Pediatr Adolesc Med 1995;149:1085–91.
22. Annual Health Report, Qatar, 2003. Ministry of Health, Hamad Medical Corporation. Doha, Qatar.
23. Rosner B, Prineas P, Loggie J, Daniels SR. Percentiles for body mass index in U.S. children 5 to 17 years of age. J Pediatr 1998;132:211–22.
24. Cole TJ, Green PJ. Smoothing centile curves: the LMS method and penalized likelihood. Stat Med 1992;11:1305–19.
25. Cole TJ. The LMS method for constructing normalized growth standards. Eur J Clin Nutr 1990;44:45–60.
26. Centers for Disease Control and Prevention. NHANES-United States Growth Charts—Data files. http://www.cdc.gov/nchs/about/major/nhanes/growthcharts/ datafiles.htm.
27. Laquatra I. Nutrition for weight management. In: Kathleen MI, Escott SS. Kraus’s food, nutrition and diet therapy, 10th ed. Philadelphia, Pa, USA: WB Saunders, 2000:485–515.
28. Al-Sendi AM, Shetty P, Musaigar AO. Prevalence of overweight and obesity among Bahraini adolescents: a comparison between three different sets of criteria. Eur J Clin Nutr 2003;57:471–4.
29. Gargari BP, Behzad MH, Ghassabpour S, Ayat A. Preva-lence of overweight and obesity among high-school girls in Tabriz, Iran, in 2001. Food Nutr Bull 2004;25:288–291.
30. Livingstone B. Epidemiology of childhood obesity in Europe. Eur J Pediatr 2000;159(Suppl 1):S14–34.
31. Elmadfa I, Godina-Zarfl B, Konig J, Dichtl M, Faist V. Prevalence of overweight and plasma lipids in 7–18 year old Austrian children and adolescents. Int J Obes Relat Metab Disord 1993;17(Suppl 2):35.
32. Sibai AM, Hwalla N, Adra N, Rahal B. Prevalence and covariates of obesity in Lebanon: findings from the first epidemiological study. Obes Res 2003;11:1353–61.
33. Booth ML, Wake M, Armstrong T, Chey T, Hesketh K, Mathur S. The epidemiology of overweight and obesity among Australian children and adolescents 1995–1997. Aust NZ J Public Health 2001;25:162–9.
34. Mokdad AM, Bowman BA, Ford ES, Vinicor Ï, Marks JS, Koplan JP. The continuing epidemics of obesity and dia-betes in the United States. JAMA 2001;286:1195–200.
35. World Health Organization. Obesity: preventing and managing the global epidemic. Report of a WHO Con-sultation on obesity, 2000. (WHO Technical Report Series, No. 894).
Prevalence of overweight and obesity in Qatari adolescents
46 Food and Nutrition Bulletin, vol. 27, no. 1 © 2006, The United Nations University.
Editorial commentary
As argued in 2005 by the Hunger Task Force of the Millennium Project, nutrition must be “placed at the heart of national poverty reduction strategies.” This means making nutrition a priority in policy setting and investment strategies, as well as implementing targeted activities at the community level. Unless this is quickly achieved in a coordinated fashion, at scale, around the globe, there is little hope that any of the Millennium Development Goals will be met, let alone the first goal of reducing poverty and hunger. All United Nations agencies and partner institutions dealing with food and nutrition now recognize that extra effort is required; business as usual will not suffice.
It is in this context that the World Food Program (WFP), the largest humanitarian organization in the world, recently decided to focus more explicitly than before on nutrition. WFP is already recognized as a key player in emergency nutrition. It is the major source of multilateral relief associated with armed conflicts (such as in Darfur), economic collapse (as in North Korea), or natural disasters (such as the Kashmir earthquake and the drought in Niger). In such cases, what matters for nutrition is that an appropriate assessment of needs
be carried out quickly, that the right kinds of foods be delivered to meet defined needs, and that these foods be delivered to the right people at the right time. Of course, appropriate nutritional rehabilitation or pre-vention of nutritional deterioration does not depend on food alone; key nonfood resources also have to be defined, delivered, and dovetailed with distribution of emergency food. That said, having adequate food is an important part of the nutrition equation, and that applies as much to nonemergency conditions as to relief.
In 2004, the Executive Board of WFP (a 36-member governing body representing governments from both donor and developing countries) discussed and endorsed the three nutrition policy papers reproduced here. The papers explain how WFP currently uses food assistance to support nutrition programming—includ-ing micronutrient fortification of foods used in sup-plementary feeding, HIV-nutrition programming, and school nutrition (which itself includes de-worming, nutrition curriculum development, and provision of fortified foods)—and defines future strategic direc-tions to ensure greater effectiveness and nutrition impact. Building on lessons from the field, reviews of best practice, and in-depth consultations with the UN and other partners, the papers define areas where WFP can do more, and do better, in nutrition, while not minimizing the considerable challenges that lie ahead. The goals of mainstreaming nutrition across WFP’s activities, adopting evidence-based program-ming, enhancing partnerships at global and local levels, and designing new kinds of interventions all offer the promise of greater WFP impact on nutrition in the coming years.
—Patrick Webb
World Food Program Nutrition Policy Papers*
These policy papers were prepared by the Nutrition Service of WFP, in collaboration with many international partners and experts. The Nutrition Service comprised Patrick Webb (then Chief of Nutrition), Andrew Thorne-Lyman, Leah Richardson, Tina van den Briel, Rita Bhatia, Christine van Nieuenhuyse, Wafa Sidahmed, Ellen Kramer, and Diana Populin. Dr. Webb is now Dean for Academic Affairs, Fried-man School of Nutrition Science and Policy, Tufts University, Boston, Massachusetts, USA.
* The following documents are reprinted with permission from the World Food Program and are available on WFP’s website at http://www.wfp.org/policies.
Food and Nutrition Bulletin, vol. 27, no. 1 © 2006, The United Nations University. 47
Executive summary
Most preventable deaths among hungry people take place outside of emergency contexts. In countries not involved in conflicts or natural disasters malnutrition is directly implicated in the deaths of millions of chil-dren and mothers each year. Thus, WFP’s great efforts focused on saving lives in emergencies should be mir-rored by efforts aimed at tackling malnutrition, and hence saving lives, beyond emergencies as well.
While food sufficiency is not the same as good nutri-tion, food is nevertheless an important part of the nutrition equation. New scientific evidence confirms that it is possible to have positive nutritional impacts with food aid. Consistent with Strategic Priority No. 3, WFP seeks to use food resources to achieve nutritional impacts in three complementary ways: a) enhancing the effectiveness and impact of targeted mother and child health and nutrition interventions (MCHN) that combine food and appropriate nonfood inputs; b) enhancing the nutritional value of WFP food (for instance, through micronutrient fortification); and c) enhancing the nutritional impact of other WFP (non-MCHN) interventions. These approaches repre-sent a mainstreaming of nutrition across WFP’s activi-ties. Adoption of evidence-based programming, joint interventions with partners, and new project designs offer the promise of greater WFP effectiveness and impact in the coming years.
Introduction
“Reducing malnutrition is central to reducing poverty.
As long as malnutrition persists, development goals for the coming decade will not be reached.”
World Bank 20031
1. Malnutrition is a formidable challenge, but not an intractable one. Today, we know better than ever
why it is critical to treat and prevent nutritional deficiencies. We also know that it is possible. The number of stunted children—low height for age—was reduced from 220 million in 1990 to 180 million in 2003.2 The number of underweight children—low weight for age—also fell from 177 million to 140 million. Fewer people suffer iodine deficiency than a decade ago, and in some countries birth-weights and infant survival have improved.3
2. Such gains are important. They demonstrate that progress was possible despite population growth, devastating conflicts and natural disasters, and lim-ited advances in agricultural productivity in most food deficit countries. That said, much remains to be done. Malnutrition is not a just a physical state—a snapshot of current well-being—it is a process. Reduced food consumption, ill-health and poor caring practices lead to infection, weight loss, and compromised mental capacity. Nutritional deterioration is related not only to prevailing levels of consumption, health, and care, but to past well-being (birthweight, severity of episodes of illness). Some periods of life are more critical in nutrition terms than others, such as birth, infancy, early childhood, adolescence, pregnancy and lactation. Nutrition vulnerability is also associated with dis-eases such as measles, TB and HIV/AIDS.
3. WFP plays a growing role in fighting malnutrition, already recognized as a key player in emergency nutrition, micronutrient fortification, HIV-nutri-tion programming, school nutrition, as well as enhanced maternal and child interventions. The Strategic Plan for 2004–2007 reconfirms WFP’s commitment to support the improved nutrition and health of children, mothers and other vul-
Food for nutrition: Mainstreaming nutrition in WFP
1 World Bank. 2003. Combating Malnutrition: Time to Act. Human Development Network. Washington, D.C.
2 UNSCN. 2004. 5th Report on the World Nutrition Situa-tion. Geneva; World Bank 2003 ibid.
3 UNICEF/MI. 2004. Vitamin and Mineral Deficiencies: Global Damage Report. New York.
48
nerable people. Yet malnutrition also cuts across strategic priorities, being a core aspect, for example, of the Enhanced Commitments for Women (2003–2007) and central to most emergency responses.
4. This paper explains how WFP uses food aid to support nutrition programming, and defines stra-tegic directions to ensure greater effectiveness and impact. Building on recent field evidence and reviews of best practice, as well as consultations with key UN and other partners in nutrition, this paper highlights links between nutrition and overall development goals, takes stock of WFP’s current nutrition activities, defines areas for expansion and intensification of activities, and considers chal-lenges to be overcome in mainstreaming nutrition within WFP.4
Nutrition and the Millennium Development Goals
5. The burden of malnutrition is carried not only by individuals, but by entire societies. On the one hand, there are intergenerational effects. Maternal malnutrition determines the status of newborns and the trajectory of infant growth—an “inheritance of hunger” passed from parents to offspring. On the other hand, malnutrition has serious developmen-tal implications. According to the World Bank, “…the Millennium Development Goals (MDGs) cannot be reached without significant progress in eliminating malnutrition.”5 This is not just rhetoric; such statements are grounded in an accumulation of evidence documenting the importance of nutri-tion not just as an outcome of development, but as underpinning the development process itself.
Malnutrition, disease and mortality
6. There are critical interactions between nutrition and most of the MDGs, but particularly between malnutrition and hunger (MDG1), child mortality (MDG 4), maternal health (MDG 5), and diseases, such as HIV/AIDS (MDG 6). For example, mal-nutrition is directly implicated in more than 50 percent of the 10 to 12 million children under the age of 5 who die each year.6 Women are equally affected by malnutrition as iron-deficiency anemia contributes to hundreds of thousands of maternal deaths each year, and stunting is a major factor in obstructed labor during childbirth, another cause of maternal mortality. As a result, a woman living in Africa has a 1 in 16 chance of dying in pregnancy
or childbirth, compared with a 1 in 2,800 risk for a woman in an industrialized country.7
7. Malnutrition’s main contribution to mortality is through disease. Infant and maternal underweight together rank as the leading risk factor in the global burden of disease, together contributing an estimated 170 million Disability Adjusted Life Years (DALYs).8 When a body’s ability to resist infection is impaired severe illness may result, which in turn decreases appetite and reduces the absorption of nutrients. The interaction between nutrition and disease is especially critical in rela-tion to TB and HIV/AIDS (MDG 6). While research is still needed, malnutrition is thought to hasten disease progression and death. Furthermore, the treatment of HIV with antiretroviral drugs may be less efficacious (with more side-effects) for malnourished individuals. With more HIV testing becoming available to affected populations, and with a growing scientific understanding of links between malnutrition and HIV, new opportunities are emerging for developing nutrition interven-tions specifically for food insecure people with HIV/AIDS.
Malnutrition and the dimensions of poverty
8. Equally important, albeit less direct, interactions exist between malnutrition and poverty (MDG 1), education (MDG 2), and gender equality (MDG 3). Productivity losses in developing countries from the combined effects of stunting and iodine and iron deficiencies are equivalent to as much as 4 per-cent of Gross Domestic Product (GDP) per year.9 This effect is largely due to the impact on wages, productivity and low labor force participation (absenteeism linked to ill-health). Low weight and height among adults is linked to reduced output and wages; an increase of 1 percent in caloric intake among Brazilians consuming only 1,700 kilocalo-ries per day (well below the minimum required) results in almost a 2 percent increase in income through higher productivity.10
4 Constructive comments from UNICEF, FAO, IFAD, UNHCR, and WHO on earlier drafts are gratefully acknowl-edged.
5 World Bank. 2003. ibid. 6 Jones, G. et al. 2003. How many child deaths can we
prevent this year? The Lancet. 362: 65-71; Rice, A. et al. 2000. Malnutrition as an underlying cause of childhood deaths. Bulletin of the WHO. 78 (10): 1207-21; Black, S. et al. 2003. Where and why are 10 million children dying every year? The Lancet. 361: 2226-34.
7 WHO. 2003. Maternal Deaths Disproportionately High in Developing Countries. Brief WHO/77 (Oct). Geneva.
8 WHO. 2002. The World Health Report. Geneva. 9 Horton, S. 1999. Opportunities for investment in nutri-
tion. Asian Development Review. 17 (1/2): 246-73.
WFP Nutrition Policy Papers
49
9. Other determinants of low income relate to educa-tion and gender discrimination. According to FAO, “…there is sufficient empirical evidence to indicate that early childhood nutrition plays a key role in cognitive achievement, learning capacity and ulti-mately household welfare.”11 The effects are greater for girls than boys, since girls already face more hurdles in gaining access to, and retaining, places in school. Greater gender balance in school, coupled with improved performance by girls (thanks to reduced malnutrition) contributes significantly to the enhanced status of adult women.
10. Such far-reaching interactions suggest that WFP should pay more attention to nutrition in its activi-ties to support the achievement of all MDGs, not just MDG 1 (on hunger). This will require not only enhanced impact through targeted nutrition inter-ventions but a mainstreaming of nutrition across its food-supported activities.
The role of food in nutrition programming
11. Much is known today about how to design effective nutrition interventions.12 Food is not the only, or always the optimal, resource needed in such activi-ties. However, where malnutrition is linked to con-strained food access, and where food of sufficient quality and quantity is required to meet identified needs (in combination with relevant nonfood resources), then food is an important element.13
12. The importance to nutrition programming of food as food (rather than as resource transfer or incen-tive) is increasingly documented. Well-designed trials involving food, rather than just micronutri-ent supplements or medicines, document a range of positive outcomes, including maternal weight gain, improved birthweights, and positive growth responses in children in locations as diverse as The Gambia, Indonesia and Nepal.14 Indeed, in Mexico it has been shown that food supplements to children under 3 in poorest households had a significant impact on child growth and reduced stunting. This impact, from “nutrition supplements alone”, is estimated to account for almost 3 percent increase in lifetime earnings for those children through improved growth and productivity.15
13. Moreover, evidence of the nutritional impact of food aid is also accumulating. One recent study in Ethiopia showed that food aid had a significant pro-
tective impact on child growth during droughts.16 Another study showed that households receiving food aid (through Food-for-Work activities, includ-ing WFP’s Meret program), showed positive results in terms of child weight-for-height.17 Other work among Bhutanese refugees in Nepal demonstrated that WFP’s fortified blended food (FBF) was associ-ated with enhanced birth outcomes; that is, between 1994 and 2001 camp-based birthweights improved coinciding with the introduction of FBFs in the general ration.18 Similarly, a trial among WFP-supported refugees in Algeria found that fortified food given to stunted children permitted rapid nutritional improvement.19 The latter study sug-gests that treatment of micronutrient deficiencies and growth retardation can be achieved among seriously malnourished children even up to the age of five.
14. These scientific results confirm not only that food aid can play an important part in nutrition pro-gramming (alongside other essential inputs), but also that WFP already has a solid basis on which to enhance its effectiveness.20 The aim in coming years should be not only to explore new avenues for action, but also to expand and enhance what is already done well.
10 Thomas, D. and J. Strauss. 1997. Health and wages. Journal of Econometrics. 77: 159-85.
11 FAO 2003. Nutrition Intake and Economic Growth. Rome.
12 Allen, L. and S. Gillespie. 2001. What Works? Geneva. UNSCN/Asian Development Bank.
13 OECD/WHO. 2003. Poverty and Health. DAC Guide-lines and Reference Series. Paris.
14 Kramer, M. and R. Kakuma, 2004. Energy and protein intake in pregnancy (Cochrane Review). The Cochrane Library. 1/2004. Chichester, UK: John Wiley; Ceesay, S. et al. 1997. Effects on birth weight and perinatal mortality of maternal dietary supplements. British Medical Journal. 315: 786-90; Ramachandran, P. 2002. Maternal nutrition. Nutri-tion Reviews. 60 (5): 26S-34S; Rivera, J. and J.-P. Habicht. Effect of supplementary feeding on the prevention of mild-to-moderate wasting in conditions of endemic malnutrition in Guatemala. Bulletin of WHO. 80 (12):926-32.
15 Behrman, J. and J. Hoddinott. 2001. An Evaluation of the Impact of PROGRESA on Preschool Child Height. Food Consumption Discussion Paper. No. 104. Washington, D.C.: International Food Policy Research Institute.
16 Yamano, T. et al. 2003. Child Growth, Shocks and Food Aid in Rural Ethiopia. World Bank Policy Research Working Paper Series No. 3096.
17 Quisumbing, A. 2002. Food Aid and Child Nutrition in Rural Ethiopia. World Development. 31 (7): 1309-132.
18 Shrimpton, R. et al. 2003. Maternal Nutrition, Birth Weight and Infant Growth in Nepal. Institute of Child Health, London.
19 Lopriore, C. and F. Branca. 2001. Strategies to Fight Anae-mia and Growth Retardation in Saharawi Refugee Children. Rome: Italian Nutrition Institute.
20 Other positive impacts of WFP nutrition programming have been documented in the context of Ecuador’s CP evalu-ation of 2002, Bangladesh’s flour fortification activity, and reduced malnutrition in DPRK from 1998 to 2002.
Food for nutrition
50
WFP and nutrition programming
15. Nutrition has long been important to WFP. During the 1960s, WFP began supporting “mother and infant” projects which delivered supplementary food through health clinics—an activity that accounted for 6 percent of WFP development expenditure during the decade. Such experiences resulted in a resolution being adopted by the World Food Conference in 1974 which called on govern-ments (supported by multilateral food and financial assistance) to provide supplementary foods to vul-nerable groups “…on a scale large enough to cover on a continuing basis a substantial part of their need.”21 In response, WFP activities were expanded, particularly in Asia, such that the share of support to mother and infant programs rose to almost 13 percent of the development portfolio during the 1970s, involving 1.5 million people.
16. Today, WFP allocates roughly 20 percent of its development resources to what are now called Mother and Child Health and Nutrition (MCHN) interventions; this represents around $40 million per year targeted to more than 5.6 million people.22 Most WFP beneficiaries inhabit South Asia (38 percent) and sub-Saharan Africa (49 percent). South Asia suffers the highest prevalence of low birthweights, maternal undernutrition and child stunting. Africa has higher rates of child mortality and acute malnutrition; indeed, Africa is the only continent in which malnutrition is getting worse rather than better.23
17. Of the 30 African countries hosting country pro-grams (CPs), 11 currently have MCHN interven-tions. In some cases, such as Malawi and Ghana, tackling malnutrition represents the primary CP activity. The total number of beneficiaries reached in Africa was over 3.5 million during 2002. While this represents around half of WFP’s global MCHN beneficiaries the number is relatively small given current levels of malnutrition. It also reflects the particular difficulty of implementing MCHN activ-ities in countries with limited absorptive capacity due to weak infrastructural development, limita-tions in the coverage of government health systems
in rural areas, and a lack of qualified implementing partners.
18. In Asia, by contrast, where 6 CPs contain nutrition activities, there is a tradition of nationally-owned food-based nutrition interventions. India, Bangla-desh and Cambodia, for example, have considerable institutional capacity with which WFP has been able to partner. India’s Integrated Child Devel-opment Service (ICDS), established in 1975 and supported by WFP since 1977, reaches almost 20 million young children and 3.5 million mothers per year.24 Although WFP’s support to India has diminished in recent years due to a geographic concentration of CP activities, and resource con-straints, current activities in 5 states still reach over 1 million children annually.
19. WFP supports nutrition in the other regions, but on a smaller scale. The Latin America and Caribbean region includes 7 countries with MCHN interven-tions, reaching more than 500,000 beneficiaries. Nutrition is the primary activity of CPs in Guate-mala and Honduras. The Middle East/North Africa region accounted for the remaining 9 percent of global MCHN beneficiaries, the largest activities located in Yemen and more recently in Pakistan.
Nutrition goals of MCHN
20. The objectives of WFP’s MCHN interventions are by no means standard, despite their common concerns. Goals range from combating acute mal-nutrition (in Benin and Central African Republic); to preventing weight loss among small children (in Pakistan); reducing iron-deficiency anemia among mothers (in Nepal and Honduras); cutting vitamin A deficiency among children in Bolivia; improving nutrition knowledge and practices (in Sri Lanka and Bangladesh); reducing maternal mortality (in Mauritania); and even lowering the incidence of low birthweight (in Ghana and Madagascar).
21. The variety of objectives reflects the multifaceted nature of malnutrition and the diverse contexts in which WFP operates. For instance, WFP contrib-uted food to over 12,000 acutely malnourished chil-dren in Zambia during 2002, and to 5,000 children in Burkina Faso—in the context of development programming. Conversely, there are emergency operations that seek not only to save lives but also to promote longer-term behavioral change through nutrition education. During 2002, 10 PRROs
21 Memorandum on Special Feeding Programmes—Joint Action by FAO/WFP. File FP 1/1. 24 March 1976. Rome.
22 WFP data for 2003. This excludes WFP expenditure on nutrition in the context of emergencies (roughly 11 percent of relief expenditure), which during 2003 involved an additional 6 million mothers and children. Comparable spending by UNICEF on non-emergency nutrition averaged $24 million annually during the 1990s, and annual nutrition investments by the World Bank are less than $100 million per year (See Shrimpton, R. et al. 2002. UNICEF Nutrition Portfolio Review. New York; and World Bank 2003. ibid.)
23 World Bank 2002. Human Development in Africa. Wash-ington, D.C.
24 WFP/M.S. Swaminathan Foundation. 2001. Enabling Development: Food Assistance in South Asia. Oxford Univer-sity Press.
WFP Nutrition Policy Papers
51
included nutrition education in their activities. Some emergency responses also channeled supple-mentary foods to malnourished children through MCHN institutions (300,000 in Afghanistan and almost 1.5 million in DPRK). Additional health and nutrition inputs were needed to prevent further deterioration of nutritional status—a preventive action.
22. Since malnutrition cuts across WFP’s resourcing categories it is important for WFP to build links where possible between development and emer-gency programming. WFP and its partners must be attentive to the precise nature of nutrition needs and seek to respond appropriately; a one-size fits all approach to malnutrition cannot be effective.
Evolving principles and practices
23. While the provision of supplementary food to mothers and children remains central to many of WFP’s nutrition activities, much has changed during recent decades. First, the nature of MCHN activities has evolved so that food delivery is no longer the only objective, and programs are better tailored to problems they seek to overcome. Second, there is increased attention to maximizing the nutritional value of food rations. Third, the scope of nutrition programming now goes beyond nar-rowly-defined MCHN projects to include nutrition concerns in other (non-MCHN) interventions.
The changing nature of MCHN interventions
24. The promotion of mother and child nutrition is a complex activity. To be effective, WFP should only intervene when a primary factor limiting child growth or maternal weight gain is inad-equate food (including micronutrient intake), and where food can generate leverage for necessary nonfood inputs to be provided as well.25 In such cases, food supplements can be an essential ele-ment of successful nutrition interventions. Indeed, WFP activities of recent years have generally shared design principles framed around lessons learned during the 1990s; among the most important are the following:
25. First, good problem analysis that clarifies the role of food. Closer attention from VAM and ENA to nutrition problems has led to enhanced analysis of sub-national dimensions of malnutrition: Is
the problem more to do with a lack of food or unsanitary water? Is the priority concern infants, school-aged children, mothers or adolescents? The result has been better geographic targeting to areas of food insecurity that also have nutrition and food consumption problems, and a better clustering of activities to gain value-added from food combined with nonfood resources.
26. For example, India’s CP concentrated its activities during 2003 on 4 priority states, with a further concentration of resources in 10 districts. The aim is to create synergies among different WFP programs—MCHN combined with FFW and other development activities to generate multiplier effects. Similarly, in Mauritania WFP focuses on areas of high food insecurity and high malnutrition and encourages other agencies (such as the World Bank-supported nutrition program, NUTRICOM) to work in the same locations as WFP-supported community food centers.
27. Second, complementary resources and skills are needed for nutrition interventions. In terms of resources, WFP is moving towards defining an “optimum package for nutrition.” MCHN pro-grams revolve around a set of mutually-reinforc-ing activities shown to reduce maternal and child malnutrition, including supplementary feeding, nutrition education (promoting good breastfeeding and complementary feeding practices for infants, including appropriate feeding and rehydration of sick children), health services (vaccinations, antenatal care, health referrals), vitamin/mineral supplementation (especially iron folate to pregnant women, vitamin A, and iodized salt), deworming, and disease control.26
28. While WFP has long worked with Ministries of Health to implement MCHN activities, government and donor spending on nutrition has generally been low and usually inadequate to address the scale of problem.27 This is in part because nutrition (and hunger more generally) has been sidelined by the poverty alleviation agenda that dominates national and sectoral budgetary allocations.28 Since good
26 UNICEF 2002. Facts for Life. New York; Bonnard, P. et al. 2002. A Review of the Title II Development Food Aid Program. FANTA. Washington, D.C.
27 Spending on nutrition is usually subsumed under health expenditures, which are low to begin with. For example, among African countries with a Gross National Product below $300 per year the average spent on health is a mere 1.4 percent ($3.2 per capita). Nutrition expenditure represents only a tiny fraction of that small amount. (See Peters, D. et al. 2000. Benchmarks for Health Expenditures in Africa. Bulletin of the WHO. 78 (6): 761-69.)
28 World Bank. 2003. ibid.
25 WFP. 2003. A Desk Review of WFP and Other Agency Mother and Child Nutrition Interventions. Rome; LoPriore et al. 2004. Best Practices in the Use of Food for Maternal and Child Nutrition Interventions (draft). Rome.
Food for nutrition
52
nutrition requires more than the delivery of food, multiple resources and skills are needed to make a change.
29. In terms of skills, WFP can play a role in build-ing capacity at national and at household levels. Finding ways to bring nutrition into the political and poverty-alleviation agenda, including build-ing national capacity to address malnutrition, is a priority. WFP increasingly seeks to support local health and nutrition infrastructure develop-ment and service delivery in remote, rural loca-tions (where most WFP beneficiaries reside). That said, as per WFP’s programming principles, many MCHN projects seek to identify centers that offer at least a minimum of nonfood resources and services necessary to achieve nutritional impacts.29
30. Third, there is an increasing focus on preventing malnutrition not just treating it. Having noted that national capacity for health and nutrition service delivery needs to be much enhanced it is equally true that greater capacity to recognize and deal with malnutrition is also needed at household level. Prevention is the key to obtaining desired nutrition outcomes in the long-term. To be effec-tive, prevention has to start at the community level with improvements in the care of women during pregnancy, complementary feeding, infant feeding and weaning practices, child care, and women’s status and entitlements more broadly.30
31. This requires communities to be involved in prob-lem analysis and identifying local practices to be encouraged.31 WFP already supports a variety of community-level actions: in El Salvador, for example, preschool children obtain supplementary food through day-care centers organized and man-aged by parents and local teachers. In Cambodia, communities are mobilized beyond institutional settings. During 2002, over 1,000 village-based volunteers carried out child growth monitoring and offered nutrition training to mothers at village meeting points. The volunteers were responsible for storing and distributing WFP food provided to some 40,000 children and mothers conditional on their participation in growth promotion and
nutritional monitoring activities.32. Concerning nutrition education, many women
receiving supplementary feeding also receive nutri-tion training. For example, in Zambia 37,000 women were trained during 2002 in nutrition best practices. In Central African Republic, over 8,000 women received training and informational mate-rials on nutrition. In Pakistan, more than 5,000 health workers were trained in anemia management and nutrition counseling, and key nutrition mes-sages were printed on ration cards. WFP’s activity in El Salvador goes a step further and includes fathers in nutrition education sessions. Indeed, WFP has been directly involved in preparing, publishing and disseminating well-regarded nutrition training and education materials from Nepal and India, to Mauritania and Ghana.
33. In all cases, the aim is to better equip individuals and households to identify and manage malnutri-tion themselves. The effectiveness and impact of IEC activities supported by WFP needs to be better understood and disseminated with a view to bring-ing the benefits of nutrition knowledge to more households.
Maximizing the nutritional value of WFP food
34. In acknowledging that food alone is not enough, the fundamental importance of ensuring that mal-nourished people have enough, high quality food to eat cannot be lost sight of. WFP places emphasis on enhancing the quality of rations, not only through balanced food baskets but by adding nutritional value to food through micronutrient fortification.
35. At a technical level, WFP is collaborating with UNHCR and the Institute for Child Health (Uni-versity of London) to develop a software tool to enable WFP and UNHCR staff to better assess and compare alternative food basket compositions.32 WFP recently established a system for external, scientific review of “new” foods proposed to WFP. A Technical Advisory Group (TAG), of technical experts in many fields, works under the auspices of the United Nations University on WFP’s behalf to review potential new commodities in terms of quality, safety, nutritional value, and operational value (bearing in mind the shipment, storage and handling requirements of WFP).33
36. At the programming level, WFP’s role in food fortification has expanded. Roughly two-thirds of
29 WFP. 2003. Consolidated Framework of WFP Policies: An Updated Version. WFP/EB.3/2003/10-B.
30 According to Amarthya Sen, “in so far as WFP can reduce future [nutrition] deprivations through preventative intervention this may even help to economize on the necessity of future intervention.” Sen, A. The Entitlement Perspective of Hunger. Lecture given at WFP/UNU Seminar, 31 May 1997.
31 Of course community-level programming should be supportive of, not isolated from, government health sys-tems.
32 This tool is at an advanced stage of design and testing and will be available to WFP field staff during 2004.
33 Applications to the TAG are coded (blind to the review-ers), so that assessments focus on technical qualities of the product and its intended uses. A WFP Internal Review Panel (IRP) reviews TAG conclusions in relation to additional factors, such as a) cost; b) procurement/shipment issues; c) administrative and political considerations; d) likelihood of large-scale use; e) vendor/donor reliability.
WFP Nutrition Policy Papers
53
MCHN projects provide fortified commodities. Realizing that nutritious complementary foods are often not available to mothers for feeding children above 6 months, WFP is increasingly involved in supporting production of low cost fortified com-plementary foods largely using local ingredients.34 So far WFP has assisted in establishing blended fortified food production in 13 countries.35 Indeed, WFP’s use of FBFs in India alone doubled from 55,000 tons in 2001 to 105,000 tons in the first 10 months of 2003.36 This reflects the value of enhanced foods in MCHN, and other activities.
Enhancing the nutrition contribution of other WFP interventions
37. The third approach to mainstreaming nutri-tion involves recognizing the scope for achieving nutrition results even through non-MCHN inter-ventions. For example, an increasing number of Food-for-Education (FFE) activities incorporate goals of enhancing nutrition knowledge (as in Rwanda and Tanzania), as well as reducing micro-nutrient deficiencies through school meals.
38. A review of FFE activities in 68 countries (for 2002) showed that, a) a majority of school meal activities included at least one fortified item in their food basket, b) 13 included corn-soya blend, c) 7 include 4 fortified commodities. Where these products were used, micronutrient deficiencies had been identified as a nutritional concern to be addressed through FFE. For example, an activity in Angola seeks not only to enhance capacity for milling and fortification of maize meal, but to target children in areas prone to pellagra (vitamin B deficiency), using a school-feeding modality—thereby achiev-ing multiple aims simultaneously. Similarly, in Bolivia WFP supports preschool and school-based feeding with fortified wheat flour, iodized salt and fortified vegetable oil, coupled with distribution of deworming tablets organized by the Ministry of Health, WHO and UNICEF. The combination of fortified food, deworming, and education has important synergistic effects.
39. Deworming is also a growing area of interest cen-tring on nutritional benefits. Deworming is one of the most cost-effective ways of ensuring that food consumed by a child provides optimum benefits
with regard to nutrition outcomes. Individuals suf-fering serious worm infestations have high risk of anemia and other nutritional deficiencies. Working closely with WHO on deworming since 1998, WFP has increased coverage to over 2 million children (1.3 million in Africa where the problem is wide-spread), with plans for expansion through schools and MCHN activities. For example, in Cambodia WFP supports the national Nutrition Investment Plan (2002–2007) which includes introduction of deworming for children over 2 years and pregnant women after the first trimester.
40. Gains are also to be had through WFP’s income generating activities. In countries like Bangladesh and Senegal WFP encourages local production of fortified blended foods which help tackle micronu-trient deficiencies. In Bangladesh, fortified wheat flour is destined for families as a take home ration, while in Senegal fortified maize-based foods are mainly for children under 3, consumed in commu-nity feeding centers. Longer-term sustainability is an important element since these projects promote local business development as well as enhancing women’s technical and managerial capacities.
41. Finally, it is important to highlight WFP’s role in advocacy and support for national policy develop-ment.37 WFP is increasingly involved with national governments to:
» better define the nature of nutrition problems (in the context of advances in understanding the nature of livelihood risks and household food insecurity),
» elaborate the roles of food-supported program-ming in addressing malnutrition, including national activities using domestic resources (as in India and Sri Lanka),
» raise public and donor awareness of the urgency of malnutrition problems, and addressing these more explicitly in the context of Poverty Reduc-tion Strategy Processes and the MDGs,
» assist in promoting new nutrition and/or food for-tification policies and strategies (as in Cambodia and Bangladesh)
42. Such policy-level activities pursued in close col-laboration with national experts and UN partners are important in framing an enabling environment in which targeted nutrition interventions on the ground can succeed. They represent critical ele-ments of institutional capacity building that is much needed to support effective nutrition pro-gramming.
34 The link with nutrition education is important since mothers should be able to act on advice on appropriate com-plementary feeding of infants or the information conveyed will be seen as irrelevant.
35 Bolivia, Bangladesh, DPRK, Ethiopia, Honduras, India, Indonesia, Kenya, Malawi, Nepal, Pakistan, Senegal, Zambia.
36 WFP Wings/SAP database.
37 This includes linking nutrition concerns to other pri-orities, such as gender mainstreaming. For example, the first of WFP’s Enhanced Commitments to Women (2003-2007) focuses on meeting the nutritional needs of adolescent girls and mothers, and raising their nutrition awareness.
Food for nutrition
54
Programming challenges for nutrition
Weak demand for nutrition services reflects weak capacity
43. Chronic malnutrition often goes unnoticed. Where more than half of all children are stunted it is hard for parents to identify the processes that lead to stunting among their own sons and daughters. Yet, while malnutrition is overlooked, good nutrition is largely invisible. Healthy, productive individuals do not equate their well-being with sound nutrition. Thus, it is hard to stimulate demand for the prod-ucts and services that contribute to nutritional well-being. Nutrition is also rarely high on the political agenda of local governments or donors. Conse-quently, nutrition priorities are easily bypassed in priority setting for budgetary allocations, resulting in weak capacity for bringing about change.38
44. Inadequate capacity at all levels is a hurdle. Predict-ably, the weakest institutional and human capacities for nutrition programming coincide with the worst nutritional problems. Interventions are hampered by the limited reach of delivery infrastructure, a lack of skills (in disciplines beyond medical training), and limited availability of nonfood resources.39
45. A greater shift towards community programming is one way to overcome institutional weaknesses; but it is not an easy option. Large investments in time and effort are needed to promote community own-ership, and among competing priorities nutrition may still be sidelined. WFP seeks to work closely with the World Bank in countries like Ethiopia to support initiatives that have government backing and resources earmarked for nutrition activities. However, communities often focus on more press-ing needs, such as clean water or tributary roads. This being the case, collaboration is needed with partners who not only contribute to programming but who support institutional and skills develop-ment at national and community levels, and who promote policy dialogue that brings malnutrition center-stage alongside economic growth. “Demand” for nutrition has to be facilitated just as demand for gender equality or decentralization of power has been in recent decades.
Partnerships
46. Because so many factors interact to determine nutritional well-being (food, health, care, service
delivery), WFP must expand its network of col-laboration with agencies, institutions and experts in nutrition policy and programming. Already WFP is a leading contributor to the budget and steering committee activities of the UN Standing Commit-tee on Nutrition—the premier forum for policy dialogue on both scientific and operational issues in nutrition.
47. In terms of programmatic partnership, WFP is increasingly sought out by sister UN agencies seeking to combine forces on nutrition interven-tions. In Ethiopia, for example, UNICEF and WFP are working together to achieve a large coverage in a new MCHN activity by offering supplemen-tary (fortified) food distribution as a conditional transfer linked to growth monitoring and promo-tion, health service delivery and vaccination. In Southern Africa, a new joint activity among FAO, UNICEF and WFP will focus on meeting immedi-ate and longer-term nutritional and food security needs of HIV/AIDS orphans in southern Africa. In Senegal, Mauritania and Madagascar, WFP also works closely with the World Bank as well as with UN volunteers (UNVs).
48. Plans for joint work on nutrition are being elabo-rated between WFP and UNICEF and FAO, as are new umbrella agreements with the Centers for Disease Control and Prevention (CDC), the Italian Nutrition Institute, the Micronutrient Initiative and key NGOs. WFP commitments to nutrition must be underpinned by committed staff resources, not simply food resources. Expanded nutrition training for WFP staff, coupled with guidance on technical programming issues, remain priorities.
Nonfood resources
49. WFP’s capacity to contribute to partnerships relies not only on skills and capabilities, but also on resources. Nonfood resources are needed for training, to produce nutrition education materials, and to develop technical modules for staff training. Nutrition projects also require nonfood resources, including support for training of village volunteers and clinic-based counselors, micronutrient fortifi-cation (including milling), local purchase of forti-fied blended foods, and improved nutrition data management. Documenting and disseminating results within a Results Based Management (RBM) framework will require WFP to collect, analyze, and manage nutrition information. Flexible fund-ing modalities that generate cash resources have in recent years underpinned much that is innovative in WFP’s nutrition programming. Sources of cash to support enhanced nutrition activities across WFP must be identified and secured.
38 According to the World Bank (2003 ibid. p. 37) “nutri-tion is not dealt with systematically in country assistance strategies or in poverty assessments.”
39 FAO 2003. ibid; Gillespie and Allan. 2001. ibid.
WFP Nutrition Policy Papers
55
Documenting nutrition impact
50. Evidence-based programming is essential to achieve nutrition goals. The adoption of nutrition indica-tors in the context of RBM represents a significant shift in WFP’s approach. However, since the use of nutrition information is new to WFP (for cor-porate and management purposes), much needs to be done on staff training, technical guidance, analytical support, and interaction with field part-ners in nutrition. For example, IFAD and WFP collaborated during 2000/01 in piloting rapid nutrition assessment tools to establish benchmarks on malnutrition in China. Surveys conducted, in partnership with national institutions in Shaanxi, Hubei and West Guangxi provinces, will serve as reference points for impact evaluations in 2006.
51. This is not to suggest that WFP staff will collect most nutrition data—nutrition data are frequently collected by implementing partners and need to be reported more systematically. However, in some cases WFP country offices, with headquarters and regional bureaux support, will need to work with counterparts to oversee data collection themselves. Collaboration with FAO, UNHCR, ICRC, UNICEF and other agencies will be needed to build national and local institutional capacities in support of enhanced nutrition programming. Interaction among WFP’s own technical units will also be needed to support enhanced data collection and analysis capability. Over time this will contribute to greater understanding, and ownership, of nutrition information in WFP.
52. These largely new activities will tax WFP capacity, particularly in small COs with limited cash (and heavily reliant on bilateral, in-level funds for value-added activities). It will be important to budget appropriate resources in project formulation for relevant baselines and follow-up surveys; some-thing that has not been done on a consistent basis in the past.
Conclusions and recommendations
53. Targeted nutrition interventions represent roughly 11 percent of WFP’s emergency expenditure and 20 percent of the development portfolio. When adding WFP investments in milling and micronutrient for-tification, deworming activities, nutrition education (in PRROs as well as in CPs), the production and purchase of fortified blended foods, and HIV/AIDS and school-based programming with explicit nutri-tion goals, it becomes clear that WFP’s contribution to nutrition programming is significant indeed.40
54. Importantly, the Strategic Plan for 2004–2007 does not only commit to giving nutrition “a higher
priority” in its activities, it seeks to do so by broad-ening WFP’s nutrition agenda: no longer a niche activity, nutrition is being mainstreamed across the Programme under the rubric of Food for Nutrition (FFN). This includes new generation MCHN activities, and also focuses on the leverage offered by food itself, the nutritional gains to be had even in the margins of food-supported activi-ties, and WFP’s role in advocating at national and international levels for policies and actions against malnutrition.
55. FFN as a goal is ultimately focused on enhancing the capacity of the world’s most food insecure people to overcome the current and future burdens associated with malnutrition. This means build-ing capabilities both at national and household levels to recognize, manage, and ultimately prevent nutritional deterioration. However, for nutrition programming to have impact resources must be sustained and flexible: sustained in the sense that a secure flow of food (commodities arriving on time and together for the entire period of a nutrition program) is essential since maternal well-being, pregnancy outcomes and child growth are much harder to remedy once compromised; and flex-ible in the sense that conventional approaches to determining cash resources based on tonnage of food delivered is not conducive to nutrition programming (where quality matters as much as quantity).
56. To achieve WFP’s strategic nutrition goals, human and institutional capacity has to be enhanced within the agency at all levels. Good problem analy-sis, innovative programming, effective collabora-tion with partners and documentation of results will require more skills, sustained funding, and a commitment to prevention, not just cure. For this to be possible:
» Nutrition capacity needs to be enhanced at coun-try and regional levels to ensure that WFP can effectively implement best practice in nutrition and document results. Each Regional Bureau, as well as large priority operations, should be more systematically staffed with appropriate nutrition expertise, supported by nutrition training for all staff categories.
» Appropriate modalities to support the special resource needs of nutrition interventions should be explored. Cash is critical for local fortification, local procurement of blended foods (where pos-
40 Growing awareness of the scale of WFP’s activities is reflected by the suggestion in UNDP’s Human Development Report 2003 that, “…international financing for community nutrition…could be organized under the World Food Pro-gramme as an international bank providing nutrition for all.“ (p. 90)
Food for nutrition
56
sible using local ingredients), the production of nutrition education materials, and supporting local nutrition training. If nutrition is to be main-streamed across WFP internal sources of financing for nutrition may need to be earmarked. In the past, a few key donors were instrumental in sup-porting WFP’s nutrition programming through institutional support grants. Wider support of this kind, focused on nutrition programming, is desirable.
» The prevention of malnutrition requires crea-tive food-supported programming as part of an optimum package of resources and skills. WFP should commit to longer-term capacity-build-ing at household and national levels, while also seeking to facilitate policy-level and private sector initiatives that focus on meeting the needs of nutritionally-vulnerable individuals.
Policy decision of the Executive Board
WFP will mainstream nutrition in its programs, advocacy and partnerships in order to (i) tackle mal-nutrition directly, responding to and/or preventing malnutrition when food can make a difference, and (ii) enhance national and household capacities to recognize and respond to nutritional challenges. WFP will expand
its efforts to achieve and document positive nutritional outcomes. This will include putting in place appropri-ate staff capacity at country, regional and headquarters levels in nutrional assessment, program design, project implementation and data collection and management. WFP will engage more fully in global and national policy dialogues on malnutrition problems and solu-tions in collaboration with appropriate partners.
Acronyms and abbreviations used in the document
CP WFP Country ProgrammeEMOP Emergency OperationFAO Food and Agriculture Organization of the
United NationsFBF Fortified Blended FoodNGO Nongovernmental OrganizationPRRO Protracted Relief and Recovery OperationUNDP United Nations Development ProgrammeUNHCR Office of the United Nations High Com-
missioner for RefugeesUNICEF United Nations Children’s FundUNSCN United Nations System Standing Com-
mittee on NutritionWHO World Health Organization
WFP Nutrition Policy Papers
Food and Nutrition Bulletin, vol. 27, no. 1 © 2006, The United Nations University. 57
Executive summary
WFP and its partners have made significant strides in the last decade towards tackling malnutrition in emer-gencies. Since malnutrition is an important determi-nant of mortality, food interventions play a key role in saving lives through their impact on the nutrition and health of affected populations.
Humanitarian interventions aiming to prevent the deterioration, or promote recovery, of nutritional status have to be carefully tailored to the nature of each crisis and seek to address underlying causes. There are three elements crucial to successful action:» Ensuring that a nutritionally-appropriate food basket
is formulated to meet local needs, that it arrives on time and in coordinated fashion (not one commod-ity one month, another the next). Some food com-modities are needed in small amounts (iodized salt and fortified blended foods) but their inclusion and delivery are often critical to positive nutrition out-comes. The importance of micronutrients in achiev-ing the goals of emergency operations is increasingly well-understood and there is evidence of the need for greater use of fortified foods than in the past.
» Coupling food with essential nonfood inputs is important in nutrition programming. Cash resources are required by WFP for a variety of nutrition and public health activities, including local milling/for-tification of cereals, local procurement of fortified blended foods, and support for complementary activities such as nutrition education, training, and deworming. An ability to offer sustained improve-ments in nutrition will depend on strong collabora-tion with partners skilled in nutrition and public health, including information management.
» Better linking of emergency programming with non-emergency activities is required so that underlying processes contributing to serious malnutrition are effectively tackled in the long run.
Introduction
1. Humanitarian emergencies are characterized by the inability of large numbers of people to main-tain a balance between food needs and what they are able to eat. While malnutrition does not only result from a lack of food, prolonged inadequacies in food consumption result in higher malnutri-tion. Consequently, food remains central to most emergency responses, incorporated into a range of interventions that address malnutrition directly—through general food distribution, supplementary and therapeutic feeding activities, and micronutri-ent fortification—as well as indirectly by tackling underlying causes.
2. While links between food shortage and malnu-trition have been recognized for decades, the importance of addressing nutritional deficiencies as a key to saving lives has only recently become fully appreciated. Today it is acknowledged that a) acute malnutrition is a strong predictor of excess mortality among young children;1 b) even moder-ate malnutrition raises mortality in emergencies because a larger share of the affected population is typically moderately, rather than severely, malnour-ished;2 c) micronutrient deficiencies contribute to disease-mediated mortality in emergencies;3 and d) the timely arrival of food assistance contributes to
Nutrition in emergencies: WFP experiences and challenges
1 Excess mortality is operationally defined as a crude mortality rate exceeding one death per 10,000 people per day (WHO/UNHCR/IFRCRCS/WFP. 2000. The Management of Nutrition in Major Emergencies. Geneva).
2 Pelletier, D. and E. Frongillo. 2002. Changes in Child Sur-vival Are Strongly Associated with Changes in Malnutrition in Developing Countries. Washington, D.C.: Food and Nutrition Technical Assistance Project.
3 UNICEF, WFP and others. 2002. Facts for Life. New York.
58
the prevention of mortality through its impact on reducing malnutrition.4
3. This paper explains how, building on these scien-tifically-established links between malnutrition and mortality, WFP uses food aid to address nutrition concerns in emergencies. Based on a wide-ranging consultation with WFP staff and other profession-als, coupled with an in-depth review of project documents, the paper highlights important devel-opments in emergency nutrition of recent decades, takes stock of key elements of WFP’s emergency nutrition activities, identifies major programming challenges, and proposes practical measures for future WFP operations in crisis settings.5
Trends in emergency nutrition
4. Since the start of the 21st Century, 75 percent or more of WFP resources have been dedicated to emergency relief and recovery; in 2003, that figure reached almost 90 percent. It was not always so. In 1975, WFP allocated almost 90 percent of its resources to development projects; a mere 99,000 tons of food were destined to support emergency activities. By 2002, food resources for emergencies exceed 3 million tons, delivered to some 60 million people.
5. The increase in WFP resources for humanitarian response reflects an escalation in crises since the early 1990s. The number of people affected by natu-ral disasters increased from 50 million in 1980 to 250 million in 2000.6 Floods alone affect an average of 140 million people each year, while in 2002 more than 600 million people were affected by climatic shocks—more than half of those by droughts across much of Africa and South Asia.
6. Similarly, around 30 million people were affected by conflicts each year of the 1990s—being displaced or having their livelihoods destroyed—in more than 60 countries. Horrific death tolls emerged
from conflicts of the past decade in the Great Lakes region, Somalia, the Balkans, and more recently in coastal West Africa and the Democratic Republic of Congo.7
7. However, despite the increase in number and scale of disasters excess mortality in emergencies has been falling. Reported nonviolent deaths in the context of major emergencies declined by almost 40 percent between 1993 and 2003 compared with the previous decade. Humanitarian agencies are doing a better job than ever before in saving and protect-ing lives, largely through more timely responses, improved mobilization of resources, and better management of both the symptoms and causes of malnutrition.
8. Two important factors contributed to this improve-ment. The first was an evolution in medical and nutritional sciences during the 1990s, coupled with an increasingly professional application of knowl-edge on the ground. A wealth of applied research has recently been accumulated which continues to inform humanitarian strategies for responding to nutritional emergencies (including medical proto-cols for the treatment of severe malnutrition and guidelines for effective uses of food in emergency programming).8
9. For example, understanding how to design food rations with a view to maximizing nutritional ben-efits has significantly improved over time. Table 1 indicates the evolution of planning rations based on nutritional needs rather than on what foods were available for emergency uses. Major agencies gradu-ally adopted a planning figure that seeks not only to protect minimal metabolic functions (at a minimal-ist “starvation-avoidance” level) but also to reduce mortality by correcting pre-existing nutritional deficiencies and allowing for the physical activity necessary to be able to access food. Humanitarian organizations realized the dangers inherent in dis-tributing dairy products and infant formulas (the risk of substituting breastmilk, and of higher infant mortality when using unclean water/bottles). Other conclusions relate to the need for diversity in food rations and food fortification to protect against micronutrient deficiencies.
10. The second contributing factor was increased interagency harmonization of policies and meth-ods. Improved coordination and standardization
4 Mason, J. 2002. Lessons on nutrition of displaced people. Journal of Nutrition. 132: 2096S-2103S; Toole M., and R. Waldman. 1997. The public health aspects of complex emergencies and refugee situations. Annual Review of Public Health. 18: 283-312; Young, H. et al. 2004. Nutrition in Emer-gencies. The Lancet. Forthcoming 2004.
5 These topics were discussed with key partners in the humanitarian community (including the working group on nutrition in emergencies of the UN/SCN), and with WFP nutrition focal points in several dozen country offices. Con-structive comments from UNHCR, UNICEF, and WHO on drafts are gratefully acknowledged.
6 Statistics in this section derive from the IFRCRCS World Disasters Reports for 2001 and 2003, supplemented by data from the Centre for Research on the Epidemiology of Disas-ters (University of Louvain, Belgium).
7 Recent assessments of excess mortality linked in part to malnutrition and epidemics range from 250,000 in southern Sudan (for 1998/99) to some 3 million people in the Demo-cratic Republic of Congo (2000/01).
8 The Sphere Project. 2004. Humanitarian Charter and Minimum Standards in Disaster Response. Geneva; Collins, S. 2001. Changing the way we address severe malnutrition during famine. The Lancet. 358: 498-501.
WFP Nutrition Policy Papers
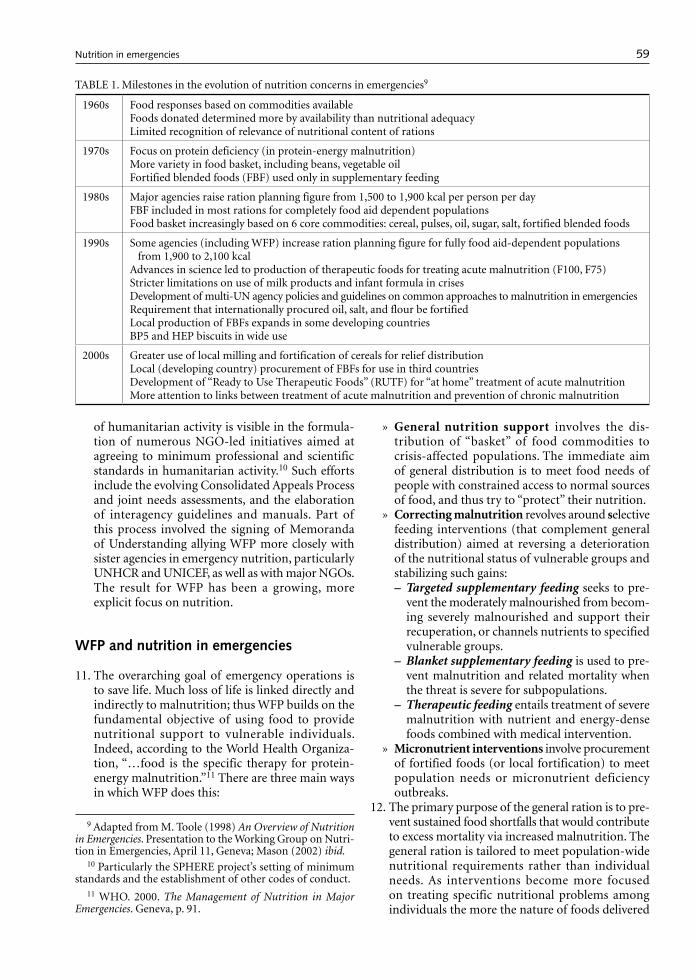
59
of humanitarian activity is visible in the formula-tion of numerous NGO-led initiatives aimed at agreeing to minimum professional and scientific standards in humanitarian activity.10 Such efforts include the evolving Consolidated Appeals Process and joint needs assessments, and the elaboration of interagency guidelines and manuals. Part of this process involved the signing of Memoranda of Understanding allying WFP more closely with sister agencies in emergency nutrition, particularly UNHCR and UNICEF, as well as with major NGOs. The result for WFP has been a growing, more explicit focus on nutrition.
WFP and nutrition in emergencies
11. The overarching goal of emergency operations is to save life. Much loss of life is linked directly and indirectly to malnutrition; thus WFP builds on the fundamental objective of using food to provide nutritional support to vulnerable individuals. Indeed, according to the World Health Organiza-tion, “…food is the specific therapy for protein-energy malnutrition.”11 There are three main ways in which WFP does this:
» General nutrition support involves the dis-tribution of “basket” of food commodities to crisis-affected populations. The immediate aim of general distribution is to meet food needs of people with constrained access to normal sources of food, and thus try to “protect” their nutrition.
» Correcting malnutrition revolves around selective feeding interventions (that complement general distribution) aimed at reversing a deterioration of the nutritional status of vulnerable groups and stabilizing such gains:– Targeted supplementary feeding seeks to pre-
vent the moderately malnourished from becom-ing severely malnourished and support their recuperation, or channels nutrients to specified vulnerable groups.
– Blanket supplementary feeding is used to pre-vent malnutrition and related mortality when the threat is severe for subpopulations.
– Therapeutic feeding entails treatment of severe malnutrition with nutrient and energy-dense foods combined with medical intervention.
» Micronutrient interventions involve procurement of fortified foods (or local fortification) to meet population needs or micronutrient deficiency outbreaks.
12. The primary purpose of the general ration is to pre-vent sustained food shortfalls that would contribute to excess mortality via increased malnutrition. The general ration is tailored to meet population-wide nutritional requirements rather than individual needs. As interventions become more focused on treating specific nutritional problems among individuals the more the nature of foods delivered
TABLE 1. Milestones in the evolution of nutrition concerns in emergencies9
1960s Food responses based on commodities availableFoods donated determined more by availability than nutritional adequacyLimited recognition of relevance of nutritional content of rations
1970s Focus on protein deficiency (in protein-energy malnutrition)More variety in food basket, including beans, vegetable oilFortified blended foods (FBF) used only in supplementary feeding
1980s Major agencies raise ration planning figure from 1,500 to 1,900 kcal per person per dayFBF included in most rations for completely food aid dependent populationsFood basket increasingly based on 6 core commodities: cereal, pulses, oil, sugar, salt, fortified blended foods
1990s Some agencies (including WFP) increase ration planning figure for fully food aid-dependent populations from 1,900 to 2,100 kcal
Advances in science led to production of therapeutic foods for treating acute malnutrition (F100, F75)Stricter limitations on use of milk products and infant formula in crisesDevelopment of multi-UN agency policies and guidelines on common approaches to malnutrition in emergenciesRequirement that internationally procured oil, salt, and flour be fortifiedLocal production of FBFs expands in some developing countriesBP5 and HEP biscuits in wide use
2000s Greater use of local milling and fortification of cereals for relief distributionLocal (developing country) procurement of FBFs for use in third countriesDevelopment of “Ready to Use Therapeutic Foods” (RUTF) for “at home” treatment of acute malnutritionMore attention to links between treatment of acute malnutrition and prevention of chronic malnutrition
9 Adapted from M. Toole (1998) An Overview of Nutrition in Emergencies. Presentation to the Working Group on Nutri-tion in Emergencies, April 11, Geneva; Mason (2002) ibid.
10 Particularly the SPHERE project’s setting of minimum standards and the establishment of other codes of conduct.
11 WHO. 2000. The Management of Nutrition in Major Emergencies. Geneva, p. 91.
Nutrition in emergencies
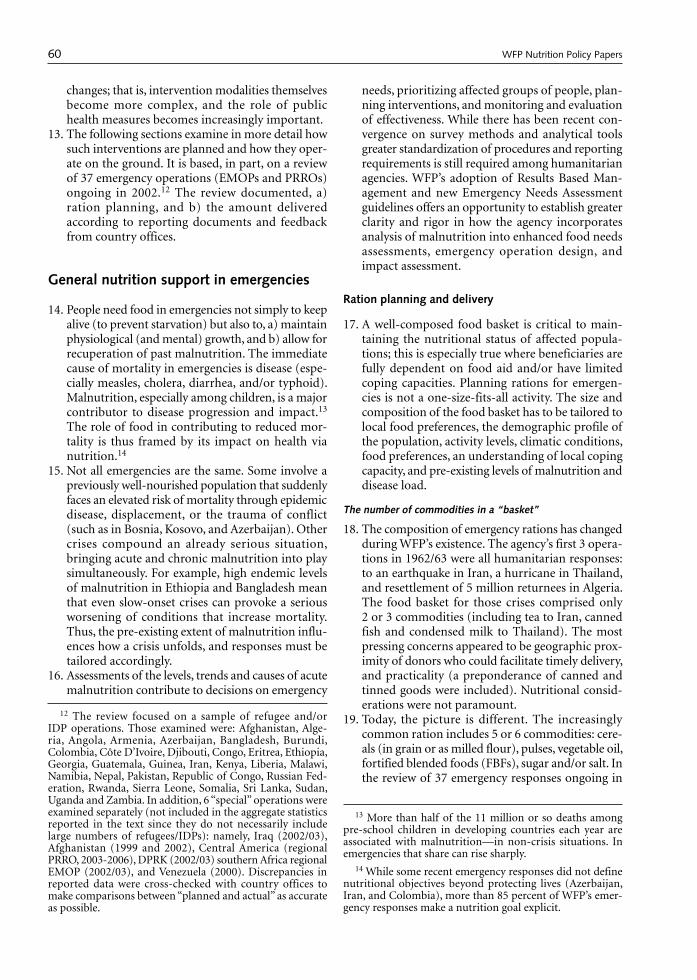
60
changes; that is, intervention modalities themselves become more complex, and the role of public health measures becomes increasingly important.
13. The following sections examine in more detail how such interventions are planned and how they oper-ate on the ground. It is based, in part, on a review of 37 emergency operations (EMOPs and PRROs) ongoing in 2002.12 The review documented, a) ration planning, and b) the amount delivered according to reporting documents and feedback from country offices.
General nutrition support in emergencies
14. People need food in emergencies not simply to keep alive (to prevent starvation) but also to, a) maintain physiological (and mental) growth, and b) allow for recuperation of past malnutrition. The immediate cause of mortality in emergencies is disease (espe-cially measles, cholera, diarrhea, and/or typhoid). Malnutrition, especially among children, is a major contributor to disease progression and impact.13 The role of food in contributing to reduced mor-tality is thus framed by its impact on health via nutrition.14
15. Not all emergencies are the same. Some involve a previously well-nourished population that suddenly faces an elevated risk of mortality through epidemic disease, displacement, or the trauma of conflict (such as in Bosnia, Kosovo, and Azerbaijan). Other crises compound an already serious situation, bringing acute and chronic malnutrition into play simultaneously. For example, high endemic levels of malnutrition in Ethiopia and Bangladesh mean that even slow-onset crises can provoke a serious worsening of conditions that increase mortality. Thus, the pre-existing extent of malnutrition influ-ences how a crisis unfolds, and responses must be tailored accordingly.
16. Assessments of the levels, trends and causes of acute malnutrition contribute to decisions on emergency
needs, prioritizing affected groups of people, plan-ning interventions, and monitoring and evaluation of effectiveness. While there has been recent con-vergence on survey methods and analytical tools greater standardization of procedures and reporting requirements is still required among humanitarian agencies. WFP’s adoption of Results Based Man-agement and new Emergency Needs Assessment guidelines offers an opportunity to establish greater clarity and rigor in how the agency incorporates analysis of malnutrition into enhanced food needs assessments, emergency operation design, and impact assessment.
Ration planning and delivery
17. A well-composed food basket is critical to main-taining the nutritional status of affected popula-tions; this is especially true where beneficiaries are fully dependent on food aid and/or have limited coping capacities. Planning rations for emergen-cies is not a one-size-fits-all activity. The size and composition of the food basket has to be tailored to local food preferences, the demographic profile of the population, activity levels, climatic conditions, food preferences, an understanding of local coping capacity, and pre-existing levels of malnutrition and disease load.
The number of commodities in a “basket”
18. The composition of emergency rations has changed during WFP’s existence. The agency’s first 3 opera-tions in 1962/63 were all humanitarian responses: to an earthquake in Iran, a hurricane in Thailand, and resettlement of 5 million returnees in Algeria. The food basket for those crises comprised only 2 or 3 commodities (including tea to Iran, canned fish and condensed milk to Thailand). The most pressing concerns appeared to be geographic prox-imity of donors who could facilitate timely delivery, and practicality (a preponderance of canned and tinned goods were included). Nutritional consid-erations were not paramount.
19. Today, the picture is different. The increasingly common ration includes 5 or 6 commodities: cere-als (in grain or as milled flour), pulses, vegetable oil, fortified blended foods (FBFs), sugar and/or salt. In the review of 37 emergency responses ongoing in
12 The review focused on a sample of refugee and/or IDP operations. Those examined were: Afghanistan, Alge-ria, Angola, Armenia, Azerbaijan, Bangladesh, Burundi, Colombia, Côte D’Ivoire, Djibouti, Congo, Eritrea, Ethiopia, Georgia, Guatemala, Guinea, Iran, Kenya, Liberia, Malawi, Namibia, Nepal, Pakistan, Republic of Congo, Russian Fed-eration, Rwanda, Sierra Leone, Somalia, Sri Lanka, Sudan, Uganda and Zambia. In addition, 6 “special” operations were examined separately (not included in the aggregate statistics reported in the text since they do not necessarily include large numbers of refugees/IDPs): namely, Iraq (2002/03), Afghanistan (1999 and 2002), Central America (regional PRRO, 2003-2006), DPRK (2002/03) southern Africa regional EMOP (2002/03), and Venezuela (2000). Discrepancies in reported data were cross-checked with country offices to make comparisons between “planned and actual” as accurate as possible.
13 More than half of the 11 million or so deaths among pre-school children in developing countries each year are associated with malnutrition—in non-crisis situations. In emergencies that share can rise sharply.
14 While some recent emergency responses did not define nutritional objectives beyond protecting lives (Azerbaijan, Iran, and Colombia), more than 85 percent of WFP’s emer-gency responses make a nutrition goal explicit.
WFP Nutrition Policy Papers
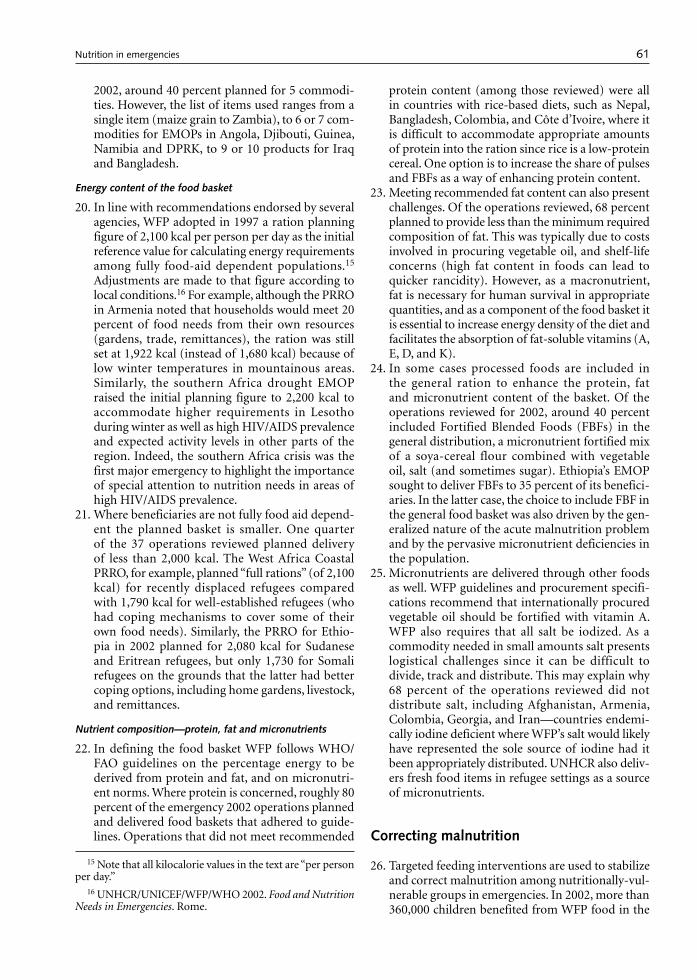
61
2002, around 40 percent planned for 5 commodi-ties. However, the list of items used ranges from a single item (maize grain to Zambia), to 6 or 7 com-modities for EMOPs in Angola, Djibouti, Guinea, Namibia and DPRK, to 9 or 10 products for Iraq and Bangladesh.
Energy content of the food basket
20. In line with recommendations endorsed by several agencies, WFP adopted in 1997 a ration planning figure of 2,100 kcal per person per day as the initial reference value for calculating energy requirements among fully food-aid dependent populations.15 Adjustments are made to that figure according to local conditions.16 For example, although the PRRO in Armenia noted that households would meet 20 percent of food needs from their own resources (gardens, trade, remittances), the ration was still set at 1,922 kcal (instead of 1,680 kcal) because of low winter temperatures in mountainous areas. Similarly, the southern Africa drought EMOP raised the initial planning figure to 2,200 kcal to accommodate higher requirements in Lesotho during winter as well as high HIV/AIDS prevalence and expected activity levels in other parts of the region. Indeed, the southern Africa crisis was the first major emergency to highlight the importance of special attention to nutrition needs in areas of high HIV/AIDS prevalence.
21. Where beneficiaries are not fully food aid depend-ent the planned basket is smaller. One quarter of the 37 operations reviewed planned delivery of less than 2,000 kcal. The West Africa Coastal PRRO, for example, planned “full rations” (of 2,100 kcal) for recently displaced refugees compared with 1,790 kcal for well-established refugees (who had coping mechanisms to cover some of their own food needs). Similarly, the PRRO for Ethio-pia in 2002 planned for 2,080 kcal for Sudanese and Eritrean refugees, but only 1,730 for Somali refugees on the grounds that the latter had better coping options, including home gardens, livestock, and remittances.
Nutrient composition—protein, fat and micronutrients
22. In defining the food basket WFP follows WHO/FAO guidelines on the percentage energy to be derived from protein and fat, and on micronutri-ent norms. Where protein is concerned, roughly 80 percent of the emergency 2002 operations planned and delivered food baskets that adhered to guide-lines. Operations that did not meet recommended
protein content (among those reviewed) were all in countries with rice-based diets, such as Nepal, Bangladesh, Colombia, and Côte d’Ivoire, where it is difficult to accommodate appropriate amounts of protein into the ration since rice is a low-protein cereal. One option is to increase the share of pulses and FBFs as a way of enhancing protein content.
23. Meeting recommended fat content can also present challenges. Of the operations reviewed, 68 percent planned to provide less than the minimum required composition of fat. This was typically due to costs involved in procuring vegetable oil, and shelf-life concerns (high fat content in foods can lead to quicker rancidity). However, as a macronutrient, fat is necessary for human survival in appropriate quantities, and as a component of the food basket it is essential to increase energy density of the diet and facilitates the absorption of fat-soluble vitamins (A, E, D, and K).
24. In some cases processed foods are included in the general ration to enhance the protein, fat and micronutrient content of the basket. Of the operations reviewed for 2002, around 40 percent included Fortified Blended Foods (FBFs) in the general distribution, a micronutrient fortified mix of a soya-cereal flour combined with vegetable oil, salt (and sometimes sugar). Ethiopia’s EMOP sought to deliver FBFs to 35 percent of its benefici-aries. In the latter case, the choice to include FBF in the general food basket was also driven by the gen-eralized nature of the acute malnutrition problem and by the pervasive micronutrient deficiencies in the population.
25. Micronutrients are delivered through other foods as well. WFP guidelines and procurement specifi-cations recommend that internationally procured vegetable oil should be fortified with vitamin A. WFP also requires that all salt be iodized. As a commodity needed in small amounts salt presents logistical challenges since it can be difficult to divide, track and distribute. This may explain why 68 percent of the operations reviewed did not distribute salt, including Afghanistan, Armenia, Colombia, Georgia, and Iran—countries endemi-cally iodine deficient where WFP’s salt would likely have represented the sole source of iodine had it been appropriately distributed. UNHCR also deliv-ers fresh food items in refugee settings as a source of micronutrients.
Correcting malnutrition
26. Targeted feeding interventions are used to stabilize and correct malnutrition among nutritionally-vul-nerable groups in emergencies. In 2002, more than 360,000 children benefited from WFP food in the
15 Note that all kilocalorie values in the text are “per person per day.”
16 UNHCR/UNICEF/WFP/WHO 2002. Food and Nutrition Needs in Emergencies. Rome.
Nutrition in emergencies
62
context of therapeutic feeding, and around 3 mil-lion children were assisted through supplementary feeding as part of EMOPs and PRROs.
Targeted supplementary feeding
27. Supplementary feeding programs (SFPs) provide additional food to specific vulnerable groups. In some instances SFPs were already operating prior to an emergency. For example, SFPs were already supported as part of country programs in Zambia and Malawi before the 2002/03 drought response. In both cases, malnourished children and mothers were targeted with recuperative and preventative goals in mind, and the emergency response ben-efited from pre-established pipelines and targeting mechanisms (which allowed for a rapid increase in the volume of food delivered once the EMOP was under way). In other cases, emergency SFPs can serve as the basis for institution-building and a focus for service delivery by NGOs and government when a crisis has passed but needs remain high.
28. Indeed, it is important to recognize that SFPs often have benefits beyond the food provided. Locations used for food distribution offer opportunities to reach special target groups with additional services, such as medical referrals, antenatal consultations, iron supplementation and deworming, nutrition and health promotion, or additional food resources provided by collaborating partners.
29. Where SFPs have been set up in refugee settings they can also reach out to the local population. For example, SFPs in Sierra Leone and Guinea offer supplementary feeding to mothers and children from surrounding villages where malnutrition remains higher than in the camps. This not only helps defuse potential tensions between refugees and hosts but contributes to addressing a wider problem of malnutrition in the region as a whole.
30. Although widely implemented by WFP and its partners, the coverage and effectiveness of SFPs needs to be enhanced and better documented. Much depends on the availability of trained staff and nonfood inputs to allow for nutrition training, nutrition and health education and appropriate screening and referral to health systems.
“Blanket” supplementary feeding
31. Blanket supplementary feeding programs provide targeted food support to specific groups within a population that are at particular risk of malnutri-tion, such as young children, pregnant women, and lactating women. Current recommendations suggest that implementation of blanket SFPs is appropriate in situations where the prevalence of child acute malnutrition exceeds 15%, which can
happen even in situations where a full general ration is provided.
32. It is recommended that blanket SFPs should not be used as a substitute for an under-resourced general ration, although in practice this is sometimes done. For example, in Ethiopia deficiencies in the pipeline during 2002 led to reductions in the general ration. Consequently, blanket feeding (an additional 900 kcal over the halved general ration) was initiated for 50,000 women and children in priority regions. This approach can be counterproductive since it is difficult to prevent an escalation of malnutrition with supplementary food if overall food adequacy remains low. Another danger is that while malnu-trition among young children and mothers may be contained, the status of the rest of the population could deteriorate. However, when more than 15 percent of children are seriously malnourished blanket feeding may be necessary to contain an escalating public health emergency.17
Therapeutic feeding
33. Therapeutic Feeding Programs are implemented by NGOs and governments with the objective of reducing mortality among populations facing severe malnutrition. The proportion of thera-peutic feeding beneficiaries compared to general ration recipients ranges from less than 1 percent (Kenya, Uganda) to as high as 12 percent (Eritrea, Somalia).
34. Recognition of severe acute malnutrition as a com-plex nutritional condition led to the development during the 1990s of foods designed for therapeutic treatment, including F75 and F100 milk, and other Ready-to-Use-Foods (RUTFs), which have proven effective under controlled conditions but can be costly. Under existing MOUs with UNICEF and UNHCR those agencies are responsible for the procurement and delivery of such foods. That said, there have been instances where WFP had a comparative advantage in acting quickly to ensure timely delivery of high energy rehabilitative foods. WFP also supports therapeutic feeding through provision of fortified blended food. During 2002, around 55 percent of EMOPs involved some kind of therapeutic feeding activity in which WFP was responsible for the delivery of FBFs.
35. While the cost of therapeutic foods tends to be high its volume (tonnage) is usually low. For example, in the context of Bangladesh’s PRRO 10045.1 in 2002 (assisting refugees from Myanmar), only 8 tons of food were delivered for therapeutic feed-ing compared with 4,400 tons of food for general distribution.
17 WHO/UNHCR/IFRCRCS/WFP. 2000. ibid.
WFP Nutrition Policy Papers
63
Micronutrient interventions
36. Micronutrient deficiencies are a major contributor to mortality and morbidity even in nonemergency settings.18 Emergencies can exacerbate micronu-trient deficiency disorders in all age groups. Thus, there are two challenges to be met: a) how to pre-vent and/or resolve outbreaks of micronutrient deficiency disease in emergencies, and b) how to address micronutrient deficiencies with a view to preventing deterioration in subsequent crises.
37. Where the first challenge is concerned, serious deficiency outbreaks are becoming rare thanks to heightened awareness of the dangers and better planning. For example, the Russian Federation’s PRRO identified anemia as a serious problem in targeted regions and so requested a donation of 30,000 tons of iron-fortified wheat flour. Using a different strategy, 16,000 tons of wheat flour was fortified in Pakistan, using technology installed by WFP in Peshawar intended to support fortification for the Kabul bakery project in Afghanistan. Iron deficiency anemia was the main concern underlying that initiative, fortifying flour with iron, A, B1, B2, niacin and folic acid since micronutrient deficien-cies were known to be widespread in the Afghan population as a whole.
38. As for preventing the next micronutrient crisis, WFP increasingly supports local fortification capacity building. For instance, persistent out-breaks of pellagra in southern Africa (due to lack of niacin in a predominantly maize-based diet) have been addressed not only through procurement of fortified cereals (almost 40 percent of WFP’s relief operations reviewed included a fortified milled staple in the food basket), but also by using locally-fortified foods.
Programming challenges
Getting the right foods at the right time to the right people
39. WFP does well in ensuring delivery of adequate nutrients on a large scale. Most recent emergency operations involved over 100,000 people; many more than 1 million (Angola, DPRK, Great Lakes); some involved 10 million people or more (Afghani-stan, Southern Africa). In each case, attention to nutrition concerns was key to saving lives.
40. Improvements are desirable, however. A delayed start to food distribution for one or more commod-ities and/or breaks in the pipeline once established
can seriously affect the nutrition of beneficiary populations. The flow of food has to be regular and well coordinated for the basket as a whole to be delivered, not just individual commodities at different times. What is more, even if all foods are provided on time malnutrition and crude mortality are determined by more than food adequacy. This poses a challenge to WFP as it seeks to demonstrate impact on both mortality and nutritional status in the context of emergency operations.
Pipeline breaks and operational responses
41. Among the emergency operations in 2002 reviewed, two-thirds experienced at least one break. Of these, most had 2 breaks, each lasting 2 to 4 months. Most breaks related to underfunding, delayed funding and/or constraints in procurement. This is of con-cern: if acute malnutrition is a factor in triggering an EMOP, then rapid deployment of resources to address malnutrition is of highest priority. Mal-nutrition cannot be effectively removed if a full complement of food items is not delivered. Efforts are under way to overcome pipeline breaks, particu-larly in refugee operations. For example, WFP now produces and shares a monthly pipeline update for all refugee operations with donors and partners to avert potential breaks due to funding shortfalls.
42. Delayed arrival and/or procurement of commodi-ties accounted for one-third of the breaks. Zambia’s PRRO for Angolan and Congolese refugees went 6 months during 2002 without any maize because of delivery delays linked in large part to logistical challenges associated with the regional drought response. The most serious logistical constraints reported in 2002 were for operations in Afghani-stan, Pakistan and the Congo. It should be noted that a Special Operation was initiated for Congo aimed at rail rehabilitation to ease logistics bot-tlenecks, but the SO had a 100 percent shortfall in funding. Other breaks were due to security con-cerns in countries like Somalia and Colombia.
43. Local procurement can also be difficult. Ethiopia had problems purchasing pulses in-country due to fragmented markets and logistical constraints. Numerous countries had problems procuring FBFs in 2002, partly because of capacity constraints on local (developing country) production and partly because of the simultaneity of large-scale emergencies across Africa. In fact, only 73 percent of the volume of FBFs planned for 2002 was actu-ally distributed. WFP needs to assess, and support expansion of, local capacity for FBF production in Africa if multiple emergency operations continue to compete for the same, limited pool of foods.
44. The main responses to pipeline disruptions are to a) borrow against country program activities
18 See “Micronutrient Fortification: WFP Experiences and Ways Forward” (WFP/EB.A/2004/5-A/2).
Nutrition in emergencies
64
(which often involves borrowing from NGO part-ners or government stocks), b) reduce the general ration for some beneficiaries, c) sharper targeting to the nutritionally vulnerable, involving increased use of FBFs where cereal availability is hampered, and d) cutting individual items out of the basket altogether. A common candidate for elimination is sugar, of which only 44 percent of the planned quantities were actually distributed in 2002.
Constraints to quality nutrition programming in emergencies
Nonfood resources
45. Delivering sufficient, timely, quality foods is neces-sary but not sufficient in overcoming the underlying processes that cause malnutrition. The availability of nonfood resources of many kinds is essential. This is most apparent where therapeutic feeding is concerned since medicines, clean water and skilled partners must combine with food to achieve desired results. Complementary resources are also needed to address moderate malnutrition. WFP’s more innovative nutrition interventions (which include nutrition education and fortification activities) have tended to be linked to a large flow of grains. High tonnage is often associated with greater avail-ability of cash resources. Ways need to be found to ensure appropriate nonfood resources focused not only on logistics or security, but equally on more effectively overcoming malnutrition.
Partnership capacity
46. Many of WFP’s partners provide skills and resources that complement WFP’s expertise and inputs. The importance of MOUs signed with UNHCR, UNICEF and ICRC in the late 1990s should not be underestimated since this has brought practical, as well as policy-level, collaboration to a higher level. Joint participation in UN agency-specific train-ings of staff on nutrition issues in emergencies continues to grow; joint guidelines have proven to be important in removing confusion; clearer demarcations of responsibility have led to greater efficiency. Similarly, WFP is increasingly involved in joint trainings, consultations and partnership with numerous NGOs that operate in emergency nutri-tion, including Action Contre la Faim and Medecins Sans Frontières. WFP also collaborates in helping enhance national capacities. For example, in Eritrea, WFP and CARE International signed a local MOU in 2003 to work together to strengthen the Ministry of Health’s nutrition unit. While in Ethiopia, WFP currently covers the cost of key nutrition personnel posted in regions of concern under the auspices of the national Disaster Prevention and Preparedness
Commission’s emergency nutrition unit.47. However, two important problems remain: first,
partners are financially and institutionally stretched in a world which often requires fighting humani-tarian battles on multiple fronts simultaneously; second, not all partners in emergencies have the skills or training to focus on nutrition. For example, Colombia’s PRRO was implemented through 350 implementing partners but only 11 implemented nutrition activities. In southern Africa although only 53 implementing partners were involved in the 6 regional EMOP countries, and coordination was relatively good, many problems still arose, includ-ing a lack of resources for (and limited skills in) the collection and analysis of nutrition information.
Nutrition information
48. An increased commitment by WFP to achieving nutrition goals through Results Based Manage-ment (RBM) requires the agency to assume more responsibility for documenting impact. This is dif-ficult in emergencies because of security constraints or a paucity of data gathering resources or skills. That said, appropriate surveys/assessments that allow WFP to understand a) location and causes of nutritional problems, b) trends in nutritional status (among population groups not just individuals), and c) the effectiveness of nutrition interventions, are essential to quality programming. In the context of RBM it is no longer sufficient to rely on other agencies to take responsibility for providing nutri-tion data relevant to WFP programming. That has presented difficulties in the past where WFP needed to act quickly but partners did not have funds to react in the same time-frame. Enhancing WFP’s own capacity to collect and interpret nutrition data is a priority.
49. More systematic attention to nutrition in Vul-nerability Assessment and Mapping (VAM) and Emergency Needs Assessment (ENA) activities rep-resents value-added to WFP’s knowledge-building initiatives. The new emergency needs assessment guidelines under development will enhance WFP’s ability to incorporate nutrition information into assessments and to define what kinds of nutrition intervention would be most appropriate in response to identified conditions.
Sustaining nutrition benefits beyond the emergency
50. The humanitarian community is increasingly suc-cessful in saving lives in crises, treating severe mal-nutrition, and controlling moderate malnutrition in refugee camps. Paradoxically, refugees (once settled) typically enjoy a better nutritional status than sur-rounding host communities. Such successes should
WFP Nutrition Policy Papers
65
be more widely shared with host populations and best practice from settled camp situations must be benefits sustained in post-emergency contexts. New WFP activities in Ethiopia, Angola and Afghanistan, in collaboration with UNICEF and national gov-ernments, seek to enhance the nutritional impact of emergency operations by looking to the post-crisis period—enhancing local institutional capacity to reach vulnerable people with health and nutrition resources and establishing systems that should per-sist into a rehabilitation/development period once emergencies are past.
51. In this context, it is important not to treat the malnourished individual in isolation from the rest of the population.19 Those who graduate from therapeutic treatment generally need further sup-port under SFPs, and that only works if the general ration supports an improvement in food security. “Curing” acute conditions and resolving underlying chronic conditions need to be better dovetailed as mutually-reinforcing aims. All too often TFPs close down once a crisis has passed but the processes that led to widespread malnutrition and loss of life have not substantially altered. Closer examination of the role of population-wide nutritional improvement in the transition out of emergencies is required, including the potential for support of so-called home-based (community-led) therapeutic care that links more organically with attempts to resolve long-term nutrition problems. Similarly, certain distribution modalities that operate both in emer-gency and nonemergency contexts, such as feeding through schools, should be designed where possible with a view to offering a bridge for child nutrition between more curative and more preventative operations.
Conclusions and recommendations
52. WFP and its partners have made significant strides in managing nutrition concerns in emergencies. Since malnutrition is a key determinant of mor-tality, nutrition interventions supported by food play an increasingly effective role in saving lives. However, new approaches are needed to facilitate a transition from the focus on treating immediate nutrition problems in emergencies to addressing underlying causes of malnutrition in nonemergency contexts. However, important challenges remain:
» WFP needs to more systematically analyze nutri-tion concerns in assessments of food and non-food needs, in the design of interventions, and in reporting results of emergency operations. This requires not only enhanced staff (and partner) capacity to conduct stronger causal analysis and to tailor responses accordingly, but also to manage nutrition information in a more standardized fashion.
» In operational terms, greater effort is required to ensure the timely and full delivery of all elements of a nutritionally-appropriate food basket, with special attention to nutritionally-vital commodi-ties however small their volume. Flexible funding modalities are also needed to enhance WFP’s ability to promote value-added foods through local purchases, local fortification, and use of new ready-to-use foods where cost-effective.
» Improved guidelines are needed on supplementary feeding under diverse emergency settings, with a particular focus on roles and responsibilities among partners who bring nonfood resources to bear (particularly UNHCR, UNICEF and major NGOs operating in nutrition and public health). Indeed, efforts need to be made by WFP to develop partnerships with organizations having specific nutrition and public health skills in order to increase both scale and effectiveness of its nutri-tion programs.
Policy decision of the Executive Board
WFP will systematically analyze nutrition problems in emergencies and define the most appropriate responses based on up-to-date knowledge and best practice. Greater efforts will be made to ensure that nutrition-ally adequate foods are provided in a timely manner in support of nutrition objectives. WFP will enable staff to design and implement effective nutrition-related interventions and report on results, and will increase its collaboration with partners that offer complementary nutrition skills. WFP will enhance its collaboration with specialized institutions of the United Nations system and its other partners, and will ensure a proper division of tasks in designing and implementing inte-grated responses to malnutrition, particularly in the framework of needs identification. Funding modalities will be explored to enhance WFP’s cash resources to support nutrition objectives. Nutrition programming in emergencies will also pay more attention to under-lying causes of malnutrition, not just acute outcomes during crises, and seek to build links with longer-term development activities.”
19 Prudhon, C. 2002. Assessment and Treatment of Malnu-trition in Emergency Situations. Paris, France: Action Contre la Faim; Young et al. 2004. ibid.
Nutrition in emergencies

66
Acronyms and abbreviations used in the document
EMOP Emergency OperationFBF Fortified Blended FoodHIV/AIDS Human Immune Deficiency Virus/
Acquired Immune Deficiency SyndromeICRC International Committee of the Red CrossIDP Internally Displaced PeopleIFRCRCS International Federation of Red Cross and
Red Crescent Societies
kcal KilocalorieMOU Memorandum of UnderstandingNGO Nongovernmental OrganizationPRRO Protracted Relief and Recovery OperationUNSCN United Nations Standing Committee on
NutritionUNHCR Office of the United Nations High Com-
missioner for RefugeesUNICEF United Nations Children’s FundVAM Vulnerability Analysis and MappingWHO World Health Organization
WFP Nutrition Policy Papers
Food and Nutrition Bulletin, vol. 27, no. 1 © 2006, The United Nations University. 67
Executive summary
Micronutrient deficiencies represent a largely invisible, but often devastating, form of malnutrition that is par-ticularly prevalent among WFP’s beneficiary popula-tions already lacking sufficient food. Known effects of micronutrient deficiencies include impaired physical and mental growth among children, iron-deficiency anemia, maternal mortality, low adult labor productiv-ity and blindness.
WFP makes important, often pioneering contribu-tions to overcoming such deficiencies through:» Careful attention to micronutrients in needs assess-
ment and ration planning,» Delivering fortified foods, particularly to nutrition-
ally-vulnerable groups, on an increasingly large scale,
» Promotion and use of locally-produced and fortified commodities in more than a dozen low income, food deficit countries,
» Advocacy for fortification at national and interna-tional policy levels.Important activities in local processing and fortifica-
tion have recently taken place in countries like Zambia, Angola, Bangladesh, India, Nepal, and in the context of the regional southern Africa drought emergency. Each case demonstrates that where micronutrient deficiencies are an operational concern local fortifica-tion is possible, albeit challenging. Several ongoing assessments of the impact of such initiatives suggest important nutritional benefits. That said, challenges remain in terms of technical and managerial capac-ity constraints, the need for systematic compliance with procurement specifications and quality control, clearer policies on micronutrient content labeling, and the need for cash resources to support many aspects associated with local processing and fortification activities.
Introduction
1. WFP seeks to support improved nutrition and health of children, mothers and other vulnerable people as a strategic priority. While this implies a focus on meeting macronutrient needs (adequate carbohydrate, fat and protein intake), the enormous magnitude of micronutrient deficiencies, including vitamin A, iron, iodine, zinc, requires WFP to pay more attention not only to the quantity of food that it delivers, but equally to its nutrient quality.
2. For many years WFP has been distributing several fortified commodities (procured or donated), such as oil and dried skimmed milk fortified with vitamin A, iodized salt and fortified blended foods or biscuits whenever possible. More recently, WFP has directly supported the processing of food com-modities at a local level, including both the milling and fortification of cereals and the production of fortified blended foods and biscuits. The impor-tance of these activities is increasingly apparent as evidence accumulates on the pivotal role of micronutrient deficiencies not only in mortality, morbidity and malnutrition, but also in a country’s economic development potential.
3. This paper elaborates on why WFP pays explicit attention to micronutrient deficiencies in its strate-gies and operations, highlights WFP’s recent expe-riences with micronutrient fortified foods and the fortification process, and proposes ways to expand such efforts both at the policy level and through actions on the ground.1 The goal is not to achieve 100 percent fortification of food aid, but rather 100 percent effective responses to micronutrient prob-lems where food aid is an appropriate and viable mechanism.
Micronutrient fortification: WFP experiences and ways forward
1 Constructive comments from UNICEF, FAO, IFAD, and WHO on earlier drafts are gratefully acknowledged.
68
Micronutrient deficiencies and food insecurity
4. According to the World Health Organization, deficiencies in iron, vitamin A and zinc each rank among the top 10 leading causes of death through disease in developing countries.2 Most people affected by micronutrient deficiencies do not show overt clinical symptoms, nor are they themselves necessarily aware of the deficiency, a phenomenon called “hidden hunger.” Yet hidden hunger makes people susceptible to infectious diseases, it impairs their physical and mental development, lowers their labor productivity, and increases the risk of premature death.
5. Iron deficiency, for example, is one of the most widely prevalent micronutrient deficiencies in the world, affecting at least half of all pregnant women and young children in developing countries. Chil-dren under 24 months are especially at risk of anemia which stunts their growth and reduces their ability to resist common childhood illness. In older children the ability to concentrate and perform well in school is lowered.3 Among adults, anemia is a serious risk to mothers in childbirth: every day some 140 women die in childbirth because of severe anemia. Anemia also impairs the health and labor productivity of working adults in general. As a result, countries like Bangladesh lose between 1 and 2 percent of their annual economic growth directly because of high levels of anemia.4 When iron deficiency is compounded by other vitamin and mineral deficiencies (VMDs) the economic impact often exceeds 2 percent of Gross Domestic Product per year—economic losses due to VMDs are put at 2.7 percent in Mali, 2.5 percent in Burundi and 2.3 percent in Afghanistan.5
6. Such huge economic losses result from human resource depletion linked to ill-health, lowered intellectual capacity and early death. For example, a lack of vitamin A is not only the leading cause of child blindness across developing countries, it affects children’s immune system and is directly responsible for around 10.8 million deaths each year. Eradicating vitamin A deficiency would cut child deaths due to measles alone by 50 percent.6 Removing zinc deficiencies would also prevent around 800,000 deaths per year due to growth failure and weakened immunity, which renders children particularly vulnerable to diseases such as
pneumonia, malaria and diarrhea.7
7. VMDs result from a low intake of micronutrients, infectious diseases which hamper absorption and increase requirements, or both. The wide prevalence of VMDs in poor countries leaves most of WFP’s beneficiaries even more vulnerable to the effects of periods of constrained food intake. Obviously, if a population is already micronutrient deficient when a food emergency unfolds the impact is worse than if pre-existing conditions had been satisfactory. In Bangladesh, for example, a higher intake of vita-min A was associated with a lower risk of severe malnutrition among children directly affected by floods, while in Indonesia although the drought and economic crisis of the late 1990s did not have a significant impact on child anthropometry (weight-for-age), child iron status deteriorated sharply during the crisis and still had not recovered to its precrisis level 5 years later.8
8. What is more, even where deficiencies were under control before a crisis, subclinical deficiencies can convert into overt problems when displaced persons become dependent on a limited range of foods. Food aid-dependent populations in par-ticular face the threat of micronutrient diseases if their diet lacks key nutrients for an extended period of time. While serious outbreaks of micronutrient diseases are increasingly rare in emergency contexts (thanks in part to WFP’s recently increased focus on micronutrient concerns), they can still occur. Scurvy (vitamin C deficiency) was noted in the context of WFP operations in Somalia and Kenya in the mid 1990s, and again in Afghanistan in 2001. Beriberi (a deficiency of vitamin B1) was recorded in Nepal (in camps for Bhutanese refugees) as recently as 1999. Pellagra (niacin deficiency) was a problem among Mozambican refugees in Malawi at the end of the 1980s and again in the mid-1990s and Tanzania in 2001, it remains a concern in Angola even in 2004. Such deficiencies are rare, but when an agency assumes responsibility for meeting
2 WHO 2002. The World Health Report 2002. Geneva: World Health Organization.
3 Mason, J. et al. 2001. The micronutrient report: cur-rent progress and trends in the control of vitamin A. Ottawa, Canada: Micronutrient Initiative and International Develop-ment Research Centre.
4 FAO. 2002. The State of Food Insecurity in the World. Rome, Italy: Food and Agriculture Organization.
5 UNICEF/Micronutrient Initiative. 2004. Vitamin and Mineral Deficiency: A Global Damage Assessment Report. New York; Horton, S. 1999. Opportunities for investments in nutrition in low-income Asia. Asian Development Review. 17 (1/2): 246–73.
6 UNICEF 2002. A World Fit for Children. New York, NY. 7 WHO. 2002. ibid. 8 Choudhury, A. and A. Bhuiya. 1993. Effects of bio-
social variables on changes in nutritional status of rural Bangladeshi children, pre- and post-monsoon flood-ing. Journal of Biosocial Science. 25: 351–57; Block, S. et al. 2004. Macro Shocks and Micro(scopic) Out-comes. Journal of Human Ecology. Forthcoming 2004.
WFP Nutrition Policy Papers
69
the entire food needs of a population such risks have to be taken into account.
Food fortification in addressing micronutrient deficiencies
9. There are many ways to address micronutrient deficiencies, including the distribution of vitamin/mineral supplements (capsules, tablets or syrups), public education on the foods that can increase intake of micronutrients, agricultural programs that increase production of and access to a wider diversity of foods, disease control (since parasitic infections and diseases impair the body’s ability to absorb micronutrients), and food fortification. Fortification is considered to be one of the most cost-effective approaches to addressing widespread deficiencies; according to the World Bank “…prob-ably no other technology available today offers as large an opportunity to improve lives and acceler-ate development at such low cost and in such a short time.” 9
10. The aim of fortification is to increase intake of one or more nutrients that are inadequate in the food supply. This can be done in three ways: a) restor-ing the nutrient(s) lost during food processing by restoring depleted nutrients to their previous (nat-urally-occurring) level (for example, restoring B vitamins—lost during milling—to original levels); b) increasing the level of a nutrient above that normally found in the food (for example, adding extra iron to wheat flour or extra calcium to milk); or c) adding nutrients that are not normally present in a food which is, nevertheless, a good vehicle for delivering micronutrients to the consumer (for example, putting vitamin A into sugar, or iodine into salt).10
11. In developing countries the importance of fortifica-tion from public health and economic standpoints is increasingly recognized. Fortification of salt with iodine is now mandatory in 75 percent of develop-ing countries, while fortification of oil and sugar (with vitamin A) and cereals or noodles (with multiple micronutrients), has become standard in China, Brazil, Zambia and South Africa.11 Fortified foods are an important source of vitamin A for poor children in urban Guatemala—today over half of their total vitamin A intake from non-breastmilk
food sources derives from three fortified foods: sugar, Incaparina (a fortified blended food based on maize), and margarine. Evaluations of vitamin A fortification initiatives in Guatemala and in other Central American countries such as Honduras and Venezuela have shown a reduction of about 60 per-cent in the prevalence of vitamin A deficiency.12
12. However, there are constraints to this approach. On the one hand, such initiatives are still relatively lim-ited, especially in low income food deficit countries, since they require coordinated efforts and specific start-up investments from many stakeholders, including governments, the private sector and con-sumer organizations. On the other hand, even when fortification is successfully introduced in countries like Zambia or Kenya “enhanced” foods do not automatically reach remote rural areas because of poorly functioning markets. Even if available in such locations these foods are not accessible to poorest households because the poor rarely pur-chase value-added, processed and packaged goods. In other words, WFP’s beneficiaries are typically bypassed by most current fortification efforts to address micronutrient deficiencies. This will change over time but for the immediate future more direct, targeted approaches have to be implemented.
WFP beneficiaries lack both macro- and micronutrients
13. There is a close relationship between malnutrition (often linked to a lack of food) and specific micro-nutrient deficiency diseases that are associated with, among other things, consumption of micro-nutrient-poor foods. Since WFP’s beneficiaries are known to have limited access to a varied diet a large share of them are also likely to suffer micronutri-ent deficiencies—especially those fully-dependent on rations for survival (such as camp-restricted refugees). WHO prevalence data for micronutri-ent problems in the countries supported by WFP suggest that roughly 4 million women and young children are vitamin A deficient, almost 7 million schoolchildren face iodine deficiency, while 7 mil-lion women of child-bearing age are anemic.13 As the prevalence of VMDs amongst WFP beneficiar-ies is likely to be higher than among a country’s population as a whole, it can be argued that close to 20 million of WFP’s beneficiaries currently face serious micronutrient problems, even accepting that some of these deficiencies overlap. The figures
9 World Bank. 1993. Enriching Lives. Washington, D.C.10 Different specific technical terms may be used in this
context, such as “restoration” and “enrichment.” The term “fortification” however is increasingly used to cover any form of adding micronutrients to a commodity during processing and will be used as such in this paper.
11 Mason, J. et al. 2001. ibid. 12 USAID/International Life Sciences Institute. 2003. Food
Fortification and Public Health. Washington, D.C.13 WHO. 2003. World Health Report. Geneva.
Micronutrient fortification
70
would be even higher when counting other popu-lation groups, such as the elderly and some adults who are also at risk of micronutrient impairment where a lack of food, disease and displacement affect their ability to consume an adequate diet.
14. The seriousness of this “hidden” hunger prob-lem is increasingly reflected in WFP’s operations. About 75 percent of country programs that include explicit maternal and child nutrition interventions (some 30 countries) make mention of micronutri-ent problems and seek to address them through the use of fortified blended foods and often fortified oil, salt and even cereals. Similarly, more than half of the EMOPs and PRROs during 2002 specified micronutrient concerns as part of the crisis being addressed; more than 80 percent of those included various fortified foods in the ration distributed.14
WFP’s experiences with fortified food aid
15. WFP addresses micronutrient deficiencies through: i) careful attention to micronutrients in ration planning, ii) the programming of donor-supplied or internationally procured fortified foods, iii) promotion and use of locally processed, fortified commodities, and, increasingly, iv) advocacy for fortification at national and international policy making levels.
Ration planning
16. During the past decade WFP has made more systematic efforts to recognize conditions that increase the likelihood of VMDs and plan opera-tions accordingly. Today, the micronutrient content of the food basket is a key consideration in most ration planning. Determining the micronutrient adequacy of rations requires a comparison of a population’s daily micronutrient requirement and potential intake with the level of micronutrients in the ration. In theory general rations should also meet higher requirements during critical periods of life, including pregnancy and lactation, early infancy, child growth, adolescence and during cer-tain illnesses. However, provision of extra rations of fortified blended foods to pregnant and lactating women and young children through clinics is often the modality chosen when general rations may not be fully adequate or when malnutrition rates are indicative of inadequacies in the diet.
17. The high prevalence of HIV/AIDS affected people in some regions adds new challenges to ration
planning. People living with HIV/AIDS may face greater risk of malnutrition for various reasons, including loss of appetite and poor intestinal absorption. In this context, micronutrients are important in preserving immune function and promoting survival. While the scientific debate about recommended micronutrient intake levels for PLWH/A is still going on, milling and fortification of food aid or provision of blended foods are seen as possible strategies for improving their access to an adequate diet.15
18. Calculating the content of rations in terms of individual vitamins and minerals manually is a complex task. This process is going to be consider-ably simplified through the development by WFP in collaboration with UNHCR of a web-accessible software called “Nutval”—a food basket calculator that defines micronutrient content of all commonly used foods and calculates the degree to which the food basket meets a population’s requirements, based on FAO/WHO recommended nutrient intakes, and allows for comparisons of alternative basket composition.
International procurement of fortified foods
19. During the 1990s WFP elaborated procurement specifications for several processed commodities, including oils, blended foods, salt, and high-energy biscuits. The guidelines prescribe what kinds and quantities of vitamins and minerals each commod-ity should contain.16 For example, WFP requires that vegetable oil be fortified with vitamin A, and with vitamin D as appropriate. Salt must be forti-fied with iodine. When wheat flour is internation-ally procured these should be fortified with a mix of vitamins B1 and B2, as well as niacin, folate, and iron.
20. Procured FBFs or high energy biscuits are also forti-fied with a range of micronutrients. Blended foods were originally designed to provide additional pro-tein to younger children, but in many instances they are used for all age groups in nutritional rehabilita-tion programs and sometimes in general rations, particularly where the threat of VMDs is high. FBFs must comply with the Guidelines on Formulated Supplementary Foods for Older Infants and Young Children of the Codex Alimentarius. However, a range of FBFs and biscuits exist since they are ver-satile in terms of uses and objectives. For example, high energy biscuits (HEBs) donated by India to Afghanistan were rerouted to Bam in Iraq in the
14 See Nutrition in Emergencies EB 2004/ (p. 57) for details of the 38 EMOPS and PRROs reviewed.
15 The SPHERE Project. Humanitarian Charter and Mini-mum Standards. 2004 edition. Geneva.
16 For details see WFP’s Food and Nutrition Handbook. 2002 edition.
WFP Nutrition Policy Papers
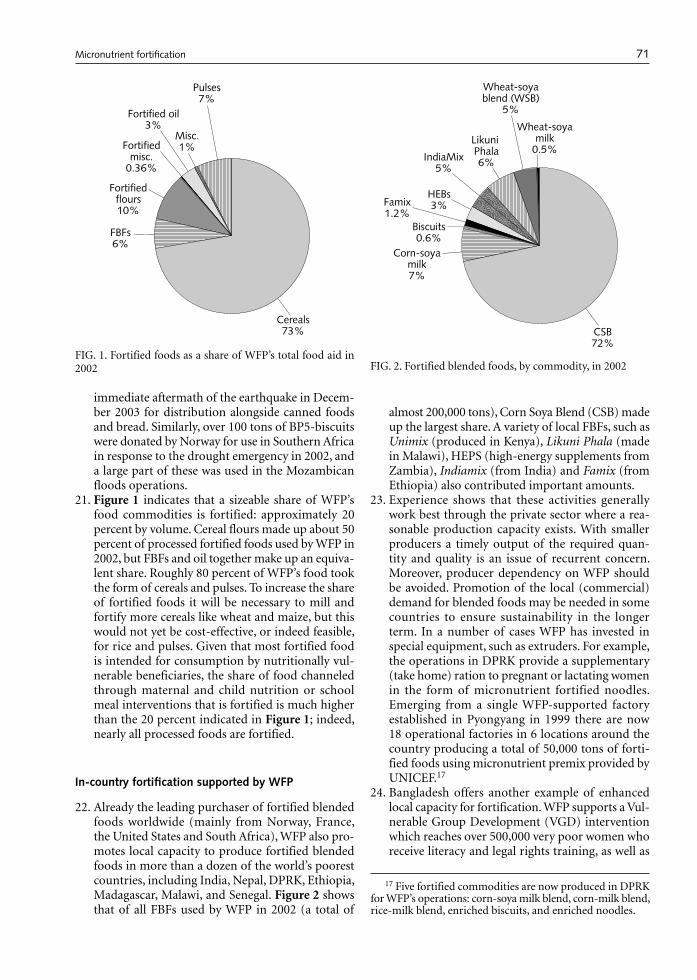
71
immediate aftermath of the earthquake in Decem-ber 2003 for distribution alongside canned foods and bread. Similarly, over 100 tons of BP5-biscuits were donated by Norway for use in Southern Africa in response to the drought emergency in 2002, and a large part of these was used in the Mozambican floods operations.
21. Figure 1 indicates that a sizeable share of WFP’s food commodities is fortified: approximately 20 percent by volume. Cereal flours made up about 50 percent of processed fortified foods used by WFP in 2002, but FBFs and oil together make up an equiva-lent share. Roughly 80 percent of WFP’s food took the form of cereals and pulses. To increase the share of fortified foods it will be necessary to mill and fortify more cereals like wheat and maize, but this would not yet be cost-effective, or indeed feasible, for rice and pulses. Given that most fortified food is intended for consumption by nutritionally vul-nerable beneficiaries, the share of food channeled through maternal and child nutrition or school meal interventions that is fortified is much higher than the 20 percent indicated in Figure 1; indeed, nearly all processed foods are fortified.
In-country fortification supported by WFP
22. Already the leading purchaser of fortified blended foods worldwide (mainly from Norway, France, the United States and South Africa), WFP also pro-motes local capacity to produce fortified blended foods in more than a dozen of the world’s poorest countries, including India, Nepal, DPRK, Ethiopia, Madagascar, Malawi, and Senegal. Figure 2 shows that of all FBFs used by WFP in 2002 (a total of
almost 200,000 tons), Corn Soya Blend (CSB) made up the largest share. A variety of local FBFs, such as Unimix (produced in Kenya), Likuni Phala (made in Malawi), HEPS (high-energy supplements from Zambia), Indiamix (from India) and Famix (from Ethiopia) also contributed important amounts.
23. Experience shows that these activities generally work best through the private sector where a rea-sonable production capacity exists. With smaller producers a timely output of the required quan-tity and quality is an issue of recurrent concern. Moreover, producer dependency on WFP should be avoided. Promotion of the local (commercial) demand for blended foods may be needed in some countries to ensure sustainability in the longer term. In a number of cases WFP has invested in special equipment, such as extruders. For example, the operations in DPRK provide a supplementary (take home) ration to pregnant or lactating women in the form of micronutrient fortified noodles. Emerging from a single WFP-supported factory established in Pyongyang in 1999 there are now 18 operational factories in 6 locations around the country producing a total of 50,000 tons of forti-fied foods using micronutrient premix provided by UNICEF.17
24. Bangladesh offers another example of enhanced local capacity for fortification. WFP supports a Vul-nerable Group Development (VGD) intervention which reaches over 500,000 very poor women who receive literacy and legal rights training, as well as
17 Five fortified commodities are now produced in DPRK for WFP’s operations: corn-soya milk blend, corn-milk blend, rice-milk blend, enriched biscuits, and enriched noodles.
FIG. 1. Fortified foods as a share of WFP’s total food aid in 2002
������������������
��������
����������
������
���������������
��������������
�����
�������
FIG. 2. Fortified blended foods, by commodity, in 2002
�����������
����������������
��������������
����
������
���������������
����������������������
��
���������������������
��
Micronutrient fortification
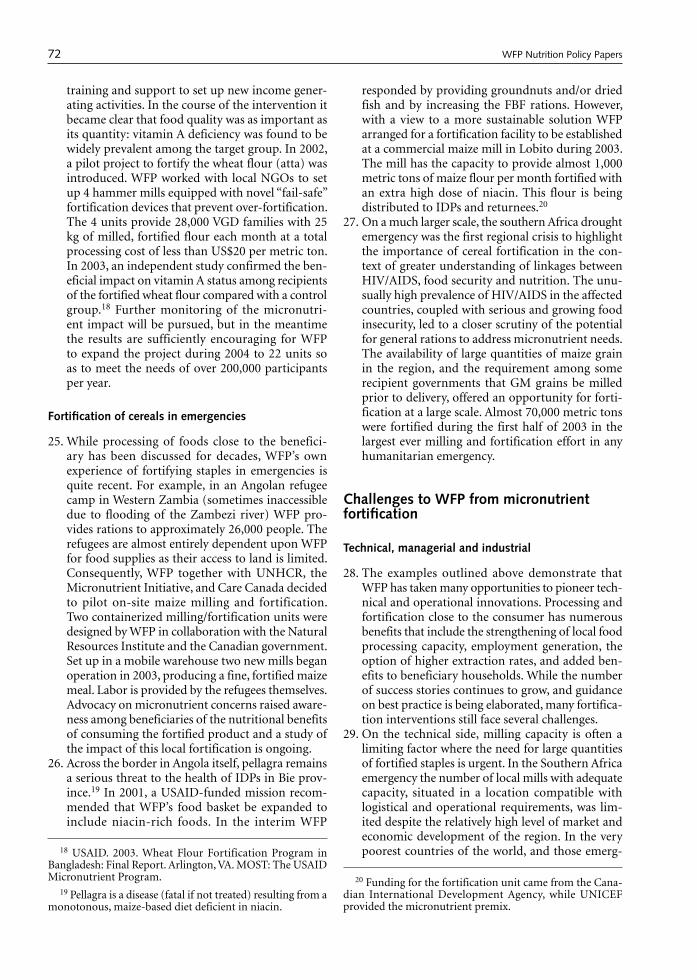
72
training and support to set up new income gener-ating activities. In the course of the intervention it became clear that food quality was as important as its quantity: vitamin A deficiency was found to be widely prevalent among the target group. In 2002, a pilot project to fortify the wheat flour (atta) was introduced. WFP worked with local NGOs to set up 4 hammer mills equipped with novel “fail-safe” fortification devices that prevent over-fortification. The 4 units provide 28,000 VGD families with 25 kg of milled, fortified flour each month at a total processing cost of less than US$20 per metric ton. In 2003, an independent study confirmed the ben-eficial impact on vitamin A status among recipients of the fortified wheat flour compared with a control group.18 Further monitoring of the micronutri-ent impact will be pursued, but in the meantime the results are sufficiently encouraging for WFP to expand the project during 2004 to 22 units so as to meet the needs of over 200,000 participants per year.
Fortification of cereals in emergencies
25. While processing of foods close to the benefici-ary has been discussed for decades, WFP’s own experience of fortifying staples in emergencies is quite recent. For example, in an Angolan refugee camp in Western Zambia (sometimes inaccessible due to flooding of the Zambezi river) WFP pro-vides rations to approximately 26,000 people. The refugees are almost entirely dependent upon WFP for food supplies as their access to land is limited. Consequently, WFP together with UNHCR, the Micronutrient Initiative, and Care Canada decided to pilot on-site maize milling and fortification. Two containerized milling/fortification units were designed by WFP in collaboration with the Natural Resources Institute and the Canadian government. Set up in a mobile warehouse two new mills began operation in 2003, producing a fine, fortified maize meal. Labor is provided by the refugees themselves. Advocacy on micronutrient concerns raised aware-ness among beneficiaries of the nutritional benefits of consuming the fortified product and a study of the impact of this local fortification is ongoing.
26. Across the border in Angola itself, pellagra remains a serious threat to the health of IDPs in Bie prov-ince.19 In 2001, a USAID-funded mission recom-mended that WFP’s food basket be expanded to include niacin-rich foods. In the interim WFP
responded by providing groundnuts and/or dried fish and by increasing the FBF rations. However, with a view to a more sustainable solution WFP arranged for a fortification facility to be established at a commercial maize mill in Lobito during 2003. The mill has the capacity to provide almost 1,000 metric tons of maize flour per month fortified with an extra high dose of niacin. This flour is being distributed to IDPs and returnees.20
27. On a much larger scale, the southern Africa drought emergency was the first regional crisis to highlight the importance of cereal fortification in the con-text of greater understanding of linkages between HIV/AIDS, food security and nutrition. The unu-sually high prevalence of HIV/AIDS in the affected countries, coupled with serious and growing food insecurity, led to a closer scrutiny of the potential for general rations to address micronutrient needs. The availability of large quantities of maize grain in the region, and the requirement among some recipient governments that GM grains be milled prior to delivery, offered an opportunity for forti-fication at a large scale. Almost 70,000 metric tons were fortified during the first half of 2003 in the largest ever milling and fortification effort in any humanitarian emergency.
Challenges to WFP from micronutrient fortification
Technical, managerial and industrial
28. The examples outlined above demonstrate that WFP has taken many opportunities to pioneer tech-nical and operational innovations. Processing and fortification close to the consumer has numerous benefits that include the strengthening of local food processing capacity, employment generation, the option of higher extraction rates, and added ben-efits to beneficiary households. While the number of success stories continues to grow, and guidance on best practice is being elaborated, many fortifica-tion interventions still face several challenges.
29. On the technical side, milling capacity is often a limiting factor where the need for large quantities of fortified staples is urgent. In the Southern Africa emergency the number of local mills with adequate capacity, situated in a location compatible with logistical and operational requirements, was lim-ited despite the relatively high level of market and economic development of the region. In the very poorest countries of the world, and those emerg-18 USAID. 2003. Wheat Flour Fortification Program in
Bangladesh: Final Report. Arlington, VA. MOST: The USAID Micronutrient Program.
19 Pellagra is a disease (fatal if not treated) resulting from a monotonous, maize-based diet deficient in niacin.
20 Funding for the fortification unit came from the Cana-dian International Development Agency, while UNICEF provided the micronutrient premix.
WFP Nutrition Policy Papers

73
ing from destructive wars, capacity has to be built up from scratch, as in Afghanistan, for example, where WFP’s distribution of fortified cereals relied on industrial capacity in Pakistan in the first years of the post-Taliban government.
30. Capacity is also likely to be constrained in terms of managerial and supervisory skills. For fortification to be safe and cost-effective, food producers/mill-ers (as well as WFP’s own staff) must not only understand the importance of careful dosing and proper mixing (to ensure homogeneous distribu-tion of micronutrients in the product), but also of storing and handling micronutrient premixes. In order to increase capacity for fortification WFP is initiating new training courses mainly for procure-ment and logistics personnel (the first one was held in December 2003). WFP will also team up with UNICEF, the Micronutrient Initiative (MI), WHO, FAO, NGOs, private sector companies and national institutions to pioneer innovative approaches as well as strengthen national level expertise in forti-fication.
31. In quite a number of countries, national policies need to be elaborated, and WFP has begun playing a more active role, in partnership with UNICEF, the MI and the Global Alliance for Improved Nutrition (GAIN) in helping frame the agenda for policy development on fortification. In several cases UNICEF and MI were instrumental in helping establish local fortification standards and in supply-ing the required fortificant. Under umbrella agree-ments, MI assisted in awareness raising or social mobilization campaigns to increase awareness and acceptance among WFP beneficiaries and partners of fortified foods. MI also frequently provides technical expertise and guidance to WFP on the design and establishment of fortification facilities in developing countries. Other technical expertise is provided by the National Resources Institute (University of Greenwich), the Institute for Child Health (University of London), and the Centers for Disease Control and Prevention, Atlanta, USA.21
Costs and benefits
32. Fortification involves adding value to a food, and it does not come cost free. FBFs and biscuits are valued commodities and their use outside targeted child nutrition interventions continues to grow. While usually more expensive than wheat or maize, a product like CSB delivers more energy, protein and fat, as well as considerably more micronutrients on a per unit basis. The balance is redressed some-what where cereal grains are milled and fortified, but the cost of the cereal then rises too. Apart from FBFs and biscuits, most milled and fortified flours are also well appreciated by beneficiaries, because
of their taste and fine consistency (and often better digestibility) as well as the time saved on pounding and/or milling. These are additional benefits, par-ticularly in a context where HIV/AIDS may affect a household’s capacity to undertake such tasks. That said, higher value commodities imply lower ton-nage delivered to any given operation and all WFP ration planners have to face tradeoffs where nutri-tional priorities compete with other programmatic goals, and where cash is a limited resource. New WFP training on commodity handling, processing and fortification will enhance understanding of the importance of micronutrient fortification and allow WFP staff to make better informed decisions.
33. Cash is needed to support premix procurement and the added costs of processing and fortifica-tion. With cereals the main cost increase relates to milling. Depending on the mix of micronutrients added, the fortification premix itself typically costs less than US$5 per metric ton, compared with milling which can add up to US$25 per ton.22 This becomes a cost borne by WFP that was formerly imposed upon the beneficiary. When given whole grain WFP’s food recipients have to organize and pay for pounding or milling themselves. In doing so beneficiaries typically lose as much as 20 percent of the value of the grains—a “loss” that relates not only to payments to the miller in cash or kind but also to losses in the milling process.
34. To date, it has been recommended to increase rations, thereby adding to planned tonnage figures (with a view to covering this particular “loss” for the beneficiary). For example, the PRRO in Eri-trea increased its total ration planning figure by 10 percent because beneficiaries were known to have to pay high fees to millers and they therefore consumed appreciably less than the ration figure implied. Alternatively, rations distributed that include (fortified) flour may be reduced by 10–15 percent and achieve the same goal—a reduction that compares favorably with the cost of local mill-ing. Local milling and fortification can therefore have several economic and nutritional advantages.
Shelf-life
35. Aside from cost the main variable of concern in decisions on fortification relate to shelf-life. Whole
21 The critical role played by CIDA in financially sup-porting many WFP micronutrient activities should also be acknowledged.
22 In some countries millers accept payment in the form of milling waste (the husk and bran by-products) when there is high demand from the animal husbandry sector. However, there may be other costs relating to the logistics of adding a cereals processing step between the port of arrival and extended delivery point.
Micronutrient fortification
74
grain well stored can last a year; many milled and fortified products, including FBFs and flour or meal, have a shorter shelf-life. The longevity of a milled cereal is determined by the extraction rate used. Flour with an extraction rate of 90 percent or higher is classified as a “whole meal flour” which does not have a long shelf-life. In situations where the pipeline is short this is acceptable. However, when the pipeline is long, transportation logistics are complex, and storage conditions are poor, a longer shelf-life, and thus a lower extraction rate are essential. A longer shelf-life may also imply improved, slightly more costly packaging.
36. The stability of vitamins and minerals added to food depends on moisture content, light, access to oxygen and ambient temperature, and varies by nutrient. Even under normal conditions, most vita-mins lose their potency over time. Dried products in particular, such as flour, salt and FBFs, become damp and deteriorate quickly under humid condi-tions, but also oil when exposed to light and high ambient temperatures will become rancid and lose its vitamin A. To minimize micronutrient losses during storage and transport, processed, fortified foods must be appropriately packed to exclude air, light and moisture. Effective pipeline management is essential to ensure the shortest possible period between production and consumption. Hence the value to WFP of increased capacity to mill and/or fortify products as close to beneficiary populations as possible.
Policies and standards
37. To achieve compliance and quality control in its growing number of micronutrient activities WFP needs to be able to ensure that specifications are well-defined and followed, that levels of nutrient content are appropriate to each context, and be able to share such information with implementing and other technical partners. As things stand this is not always possible. There is a need for, a) an assessment of levels of fortificants used in different commodities and different contexts (emergencies in particular), leading to guidelines on how levels should be set and achieved, b) review of the qual-ity and costs associated with alternative premix suppliers, c) improved product labeling, and d) clearer guidelines on quality control procedures in the field.
38. While WFP should follow national policies on fortification standards, these do not yet exist every-where. WFP should be part of the process that leads to the elaboration of standards at national level, but also prepare more detailed guidance for its own operations. Such guidance would focus on defin-ing levels/standards for different contexts in light
of recent scientific recommendations as well as on known costs and benefits of vitamin and mineral premixes. WFP will engage in the debate on new food vehicles for fortification, including participa-tion as appropriate in operations research on their efficacy and acceptability. Similarly, operational research into ways of meeting the dietary needs of HIV/AIDS-affected populations may affect the choice of commodities, their processing require-ments or levels of fortification. WFP is involved in, and contributes to, some of these studies and will remain on the cutting edge in terms of both science and practice.
39. Specification of commodity content is increas-ingly important for WFP. Some operations receive vegetable oil from multiple donors, or from a com-bination of sources (donated and procured). This creates confusion in cases where both fortified and unfortified oil are in the pipeline. Similarly, where products are not labeled it is hard for WFP and its partners to, a) make judgments on alternative food basket compositions where micronutrient deficien-cies are of concern; b) assess whether additional vitamin supplements may be needed in tablet form in refugee camps or clinics; and c) explore whether recommended micronutrient intake levels might be exceeded where multiple micronutrient activities are concerned. As a result, efforts should be made to ensure that fortified commodities be clearly labeled at the point of production/packaging or at least be accompanied by micronutrient content specifications.
Conclusions and recommendations
40. WFP has already made significant, often pioneering contributions to addressing the global burden of micronutrient deficiencies. Not only is an increas-ing amount of WFP food fortified but innovative approaches to enhancing local milling and fortifica-tion capacity have been developed, local production of fortified blended foods continues to grow, and working with partners to raise micronutrient-defi-ciency diseases higher up international and national political agendas.
41. Next steps for WFP include the following:» Make efforts to ensure appropriate micronutrient
fortification of commodities intended for use in all WFP operations, including EMOPs and PRROs. To support this goal, WFP will, in collaboration with partners, formulate guidelines and standards that establish the choice of appropriate commodi-ties and levels of fortification, as well as provide operational guidance based on best practices and lessons learned from the field.
» Seek opportunities to support and strengthen
WFP Nutrition Policy Papers
75
capacity for local milling and fortification of cereals, as well as production of fortified blended foods, with a view to processing and fortification of commodities as close to consumers as possible. In this context WFP will also provide technical guidance with respect to procedures and criteria for ensuring quality of the end product.
» Explore funding mechanisms that would more effectively disassociate tonnage levels from cash available to country operations needed to cover the costs of in-country “value added” activities in milling and fortification. Discussion is needed on the extent of donor responsibility in covering the cost of milling and fortification where, a) micro-nutrient deficiencies are a concern, but b) only whole grains have been supplied.
» Step up efforts to build capacity, both in-house and among partners in the field, to plan for and manage the distribution of appropriately fortified food. This will entail more training on process-ing, milling and quality concerns for program, logistics and procurement staff, as well as for selected partners from governments and private sector. In addition, practical publications cover-ing aspects of quality, shelf life, and costs, must be developed for use in the field.
» Enhance WFP capacity to conduct rigorous needs assessments, as well as baseline and impact sur-veys. Documenting effectiveness and impact of fortification activities will be an important input to RBM during the 2004–2007 Strategic Plan. Applied research aimed at identifying new vehicles for fortification and delivery channels appropriate for different vulnerable population groups will also be supported.
» Review existing commodity specifications and update internal procedures to support appropriate procurement, receipt and handling of commodi-ties. There is a need for, a) more systematic com-pliance with WFP’s micronutrient specifications, b) tracking or tracing of products in relation to their micronutrient content (perhaps through a modification of WFP’s Compass CTS systems).
» Strengthen partnerships with technical agencies and research institutions, as well as in the private sector entities, that are able to collaborate in identifying cost-effective approaches to meeting
the micronutrient needs of WFP beneficiaries. At national and international policy levels alliances with UN agencies, governments, and NGOs will be pursued to promote and support national for-tification policies.
Policy decision of the Executive Board
WFP will increase its efforts to meet micronutrient deficiencies among beneficiaries through the distri-bution of appropriately fortified foods and support for national and international fortification initiatives and policies, as well as food-based approaches, paying particular attention to micronutrient needs in emer-gencies and meeting the special needs of people living with HIV/AIDS. Central to these efforts are ensuring adherence to WFP’s procurement specifications and quality-control procedures, and documenting effec-tiveness and the impact of fortification activities. WFP will expand its local initiatives in the production of fortified blended foods and biscuits, and in the mill-ing and fortification of cereals. Institutional and staff capacity to implement these activities will be enhanced as necessary.”
Acronyms and abbreviations used in the document
CIDA Canadian International Development Agency
EMOP Emergency OperationFBFs Fortified Blended FoodsGAIN Global Alliance for Improved NutritionMI Micronutrient InitiativeMOU Memorandum of UnderstandingNGO Nongovernmental OrganizationPRRO Protracted Relief and Recovery OperationUNHCR Office of the United Nations High
Commissioner for RefugeesUNICEF United Nations Children’s FundUNSCN United Nations System Standing
Committee on NutritionVMD Vitamin and mineral deficienciesWHO World Health Organization
Micronutrient fortification
76 Food and Nutrition Bulletin, vol. 27, no. 1 © 2006, The United Nations University.
About the Award
The Abraham Horwitz Award for Leadership in Inter-American Health, created in 1975, was established to honor creative public health leaders whose commit-ment to public health stimulates excellence among their peers, staff, and other public health professionals. The leadership demonstrated by award winners has an impact beyond their borders and throughout the Americas.
This award is one of five presented by the Pan American Health and Education Foundation (PAHEF) through its Awards for Excellence in Inter-American Public Health Program, a partnership between the Foundation and the Pan American Health Organiza-tion (PAHO).
The 2005 recipient of the Abraham Horwitz Award for Leadership in Inter-American Health is Dr. Ricardo Uauy, who accepted it in Washington, DC, on Septem-ber 26, 2005. Dr. Uauy’s remarks are reprinted here with permission from PAHEF.
For more information on the PAHEF awards pro-gram, visit the PAHEF website at www.pahef.org/pahef/pages/awards.
Dr. Uauy’s address
As one of many who have placed the improvement of nutrition, a key component of public health in the Americas, as the purpose of their professional careers, I am honored to receive the Horwitz Award for Leader-ship in Inter-American Health for the year 2005.
The lessons I learned from Abraham Horwitz have served me well throughout my career. I learned from him how to be strong in denouncing what is wrong, but gentle in delivering the message, inviting all to take part in the necessary actions to improve the health and nutrition of populations. PAHEF serves well its mission of promoting health in the Americas by keeping the Horwitz legacy alive.
Relevance of nutrition for life-long health
Nutrition and the health of populations go hand in hand. Food is not just another environmental exposure. Rather, nutrition is the substance of life. We evolved in direct relationship with our food supply, and up to now, humankind has been shaped by that food supply. It is only through continuing improvements in agriculture that we have been able to secure food for the over 6 billion humans that inhabit earth. We now face the daunting challenge of having the capacity to design novel foods to meet our special needs (preserv-ing function, preventing chronic disease, promoting healthy aging). These novel foods have the potential of opening the way to shaping the evolution of our own health. As we face this challenge we need to assure that benefits reach humankind as a whole and not only those who can pay.
We are what we eat in many ways, especially when it comes to health at every stage of the life course. From the earliest, nutrition affects the way we grow and develop from conception through the early stages of embryogenesis and fetal life. At birth, the stature of mothers more than their weight determines their babies’ sizes, affecting the potential for survival. Birth weights for countries in this region have risen steadily and low birth weight (LBW) for most is under 10 %. In places where it remains high, it is linked to the inherent risks of adolescent pregnancies under precarious condi-tions. The provision of folate-fortified foods benefiting women of reproductive age is helping to reduce the risk of neural tube defects and other congenital malforma-tions. Breast milk and adequate complementary foods in infancy are necessary to secure not only protein and energy, but micronutrients needed to prevent and resist infection, and to grow in length as well in weight. In fact WHO/PAHO (World Health Organization/Pan American Health Organization) are releasing next year the new Multicountry Growth Reference Standards for young children. Eight thousand children from 6 coun-tries, one from each continent (for the Americas, Brazil and the USA), breastfed according to present norms,
Pan American Health and Education Foundation
The 2005 Abraham Horwitz Award for Leadership in Inter-American Health Address: Dr. Ricardo Uauy
77
grew similarly in both weight and height independent of ethnic group and country of origin. Provided chil-dren are raised in the right environment, they have an equal potential to grow well and be healthy. We now have the right tool to promote optimal growth in length while preventing unhealthy weight gain.
A healthy diet must provide the right quality and amount of foods to meet the complementary goals of securing all essential nutrients while preventing energy excess. Balancing energy intake with physical activity is presently an important challenge facing the region. Children and adults, urban and rural dwellers, those living under poverty and the affluent, share the problem of preventing unhealthy weight gain which translates to excess body fat, specially dangerous when fat sits around the waist.
Most countries in the region confront a double burden of disease. That is, while they continue to work to reduce the burden of infections and adverse perinatal outcomes, they face a virtual epidemic of cardiovascu-lar disease (hypertension and coronary heart disease), “diabesity” (diabetes and obesity) and rising rates of cancer. We have no vaccine prophylaxis for these dis-eases. We can no longer call them noncommunicable since consumption and physical activity patterns are, in fact, being shaped by infectious-like agents that accompany modern life and are disseminated by mass media and commercial marketing strategies across countries. Displacement of traditional foods from our diets, increased consumption of energy-dense nutrient-poor foods, the explosive increase in motor vehicles, the proliferation of labor-saving devices, and the physical inactivity characteristic of modern work and leisure are the modern vectors of the obesity epidemic. We end up buying in response to advertisement rather than because of true needs. Yes, to some these may be considered individual choices and thus not a public health issue; but then, how can we explain the doubling or tripling of obesity in 6-year-old children in most countries of this region, if not by market forces that promote increasingly less expensive energy dense foods and promote sedentary lives? It is up to social forces, governments, and other organizations to take the nec-essary steps to make the healthy choice the easy choice. Consider the uneven balance between your budgets to promote healthy foods and active lives versus the wealth in advertisement budgets of major food com-panies. The imbalance in most countries is staggering, approximately 1,000 to 1. It is time we confront the epidemic of nutrition-related chronic disease with a clear public health response, strategically addressing the root causes that lead to unhealthy weight gain. This will require leadership and an ability to build in prevention of chronic disease into our primary health systems with a life course perspective.
Just as the physical and mental development of chil-dren are modulated by, and depend on, an adequate
supply of all the nearly 50 critical essential nutrients; the aging process is modulated by critical nutrition, including food consumed and energy spent on physical activity. Most of what we accept as diseases character-istic of older people are in fact not obligatory condi-tions. Healthy diets and proper exercise can prevent the occurrence of many age-related diseases. The rise in the proportion of older and very old people in our region will demand that greater attention be paid to preventing loss of healthy life years and to consider ways of incorporating them into society as active participants.
Nutrition and health in the global development agenda
The United Nations, in concert with member states, has set Millennium Development Goals (MDG) to be met by 2015. The MDGs provide a set of commonly agreed priorities as a focus for development efforts by the international community. How are Latin American and Caribbean countries poised with respect to meet-ing the MDGs? On the positive side, as a region we have the highest GNP per capita of all developing regions. It is the only developing region where girls have a higher literacy rate than boys. The region also has the lowest military spending among developing regions, 1.5% of GNP. The region has the highest life expectancy at birth, 70 years. Child malnutrition and infant mortal-ity remain a problem in the low-income and poorer regions of middle-income countries, but are on the decline in most countries.
On the negative side, the number of poor at 77 mil-lion remains unacceptably high in a region that has the highest GNP. We need an annual economic growth rate of 3.6% in order for this to drop to 60 million by 2015. Regional growth has slowed since the 1980’s and per capita income has grown by less than 2% a year since 1990. Moreover, the region includes two of the poorest countries in the world (Haiti and Nicaragua) and three of the world’s 10 most severely indebted countries (Argentina, Brazil, and Mexico). We will most likely not meet the MDG of reducing poverty by 50% unless we change our policies and put greater emphasis on bridging the gaps between the poor and the rich within and between countries. In terms of meeting the hunger MDG, it depends on how we define hunger. If we take the definition based on food insecurity (that is, spending more than 50% of income on food) we certainly will not meet this MDG since as noted before the optimistic projection is that the number of poor at best will decrease to 60 million, which is only a 25% reduction from 1990. Ironically, we are doing much better with declarations. The presi-dents of the region in preparation for the Rome World Food Summit in 1996 proclaimed that the Americas would uphold the right to food as established in the
Abraham Horwitz Award Address
78
Universal Declaration of Human Rights and decreed that the Americas should be freed from hunger. This political statement was read in Rome by none other than President Aylwin of Chile. Presently Brazil’s President Lula leads the continent in this fight, having established a national program for hunger eradication called Fome Zero (zero hunger), and other countries in the region are establishing similar initiatives. Last year Lula, Lagos, Chirac, Zapatero, and Kofi Annan met with 50 other world leaders in New York to launch a crusade to eradicate hunger. Past experiences indicate that unless the issue of poverty is addressed in an inte-grated manner and efforts are sustained over a period of time, poverty will prevail; income transfer alone will certainly not do.
Sufficient food is presently being produced to meet on average the energy and protein needs of all people on the planet. The key problem here is in the words on average, since the highest quintile of the population take 50% of the animal foods while the lowest quintile gets less than 10%. Let alone that 40 % of global grain production is destined for animal feeding, which in turn is used to produce meat for human consump-tion. Of course, we can always benefit from enriching our existing staple foods (wheat bread, corn tortillas, or even cane sugar) with adequate micronutrients by widespread fortification or by enhancement of micronutrient content using conventional breeding and novel genetic manipulation of plants. However, these measures alone will not resolve the problem of access to healthy foods by the poor. Access depends on income, empowerment of communities, and good gov-ernance rather than on increases in food production. In fact in the Americas we face the apparent paradox of obesity being more prevalent amongst the urban poor rather than in the affluent groups. The stunted children raised in the slum settings miss 10 to 15 cm in linear growth during their early years and are more susceptible to obesity in an environment that provides high sugar/high fat, low nutrient density foods at cheap prices. Conquering the present double burden of dis-ease affecting population health is largely dependent on making food available to all socioeconomic groups in sufficient quantity and adequate quality. We need to redefine food quality beyond safety, taste, and afford-ability. We need to introduce lifelong health considera-tions in the definition of food quality. Salt, sugar, and hydrogenated fat are certainly not poisons but should not be consumed in excess; in today’s food supply con-sumers have no way of controlling the amount of these compounds in the processed foods they consume.
The cost of the malnutrition burden (in terms of death, disability and economic losses)
Well nourished, healthier populations have lower mor-tality and fertility rates, better cognitive and mental
performance, higher labor productivity, and are more inclined to invest in higher levels of skills training for themselves and education for their children, leading to higher permanent incomes, savings rates, and national investment over time. Improvements in nutrition and health of populations are crucial to achieve real poverty reduction, as opposed to increasing per capita GNP. According to Robert Fogel (Nobel Prize laureate in Economics, 1993) a significant proportion of the economic growth of industrialized countries during the industrial revolution came from increased labor productivity associated with improved health and nutrition, as documented by the secular trends in birth weight and children’s stature. He has also dem-onstrated that age-adjusted disability rates associated with chronic disease in adults over the past century have dropped significantly and this can be linked to economic growth in the USA.
According to another Nobel prize laureate, Amartya Sen (Economics, 1998), countries that pursue eco-nomic growth and focus exclusively on increasing income often find that inequalities persist or are exac-erbated by growth. Reduction of income poverty alone does not necessarily catalyze nutritional and health equity. Considering that health is a universal human right, inequalities in health and nutrition should be accepted only as transitional conditions and viewed as true inequities if they persist despite being avoidable, unnecessary, and unfair. Sen argues that countries adopting human and social development policies beyond economic growth are more likely to address the social determinants of health. These include coverage of basic human needs by essential services for all and by social policies assuring education, health care, food and nutrition security, water supply, and public sanitation at an essential minimum. Nutrition and health should be seen today as investments leading to human capital formation. As clearly stated by Dr. Horwitz on multiple occasions to member states and especially to donors or development partners, as we call them today, “Health has an intrinsic value for all human beings…it is not only an end in itself, but it is also an essential means for human and economic development.”
PAHO’s role in the nutritional improvement of the region
PAHO, as mandated by its mission, should lead the region’s efforts in the nutritional improvement of the populations of the Americas. It is not a question of choosing improving nutrition to prevent child death and disability resulting from undernutrition or con-trolling nutrition- and physical inactivity-related adult chronic diseases. We need to do both in order to pre-vent chronic disease, and we need to start early. Invest-ing in promoting linear growth and preventing excess weight in children has direct implications on health
R. Uauy
79
and nutrition at later stages of life. Moreover if we are going to break the cycle of poverty, malnutrition, and ill health, we should be concerned even more about the early growth of little girls, the mothers to be. Nutrition interventions in young children, such as promoting breastfeeding and providing micronutrient-rich com-plementary foods, are among the most cost-effective of all health improvement options. Fortification of staple foods and provision of micronutrient-rich foods as promoted by PAHO in the last decade are making a significant impact in saving young children’s lives and promoting better growth and mental develop-ment. This will activate the virtuous cycle of better educational and physical performance that result in improved income leading to true poverty eradication
The life course approach to health and nutrition improvement permits the effective integration of maternal and child health services with prevention of adult nutrition-related chronic disease. They in fact act in synergy. Prevention of adult chronic disease will allow for better funding of effective health interven-tions for all, since the expenses associated with the treatment of diabetes, hypertension, dyslipidemia, obesity, and some forms of cancer will be reduced. The reality is that unless we take a preventive approach we will not be able to afford the escalating costs of treating chronic disease for our populations.
How can PAHO respond to its mission leading the region in strategic collaborative efforts among member states and other partners? Perhaps it is time for PAHO to accept that in today’s world it is virtually impossible to lead in all areas. I suggest that PAHO should lead, not by being the best and only in technical knowledge and skills; but rather it should lead the way in the evaluation and application of knowledge required for purposeful action. It should come as no surprise that many centers in the Americas and outside the region have technical expertise beyond PAHO’s. As with any modern organization, PAHO should acknowledge its strengths and weaknesses and define its selective advan-tage and the value it can add to health and nutrition programs. Only then can it identify the true partners it needs to lead the way to effective action. Perhaps it is time for PAHO to explore how it is perceived by others and accordingly refocus its work on how it will best achieve its mission. PAHO is at its best when it leads strategic collaborative efforts among Member States and other partners to promote equity in health, combat disease, improve the quality and lengthen the lives of peoples of the Americas.
Only then can the Pan American Sanitary Bureau be the major catalyst for ensuring that all peoples of the Americas enjoy optimal health and be recognized as fulfilling its mission of service.
Abraham Horwitz Award Address
80 Food and Nutrition Bulletin, vol. 27, no. 1 © 2006, The United Nations University.
Carotenoids in health and disease. Edited by Norman I. Krinsky, Susan T. Mayne, and Helmut Sies. Marcel Dekker, New York, 2004. (ISBN: 0-8247-5416-6) 568 pages, hardcover. US$189.95.
Although they are not listed as essential nutrients, the evidence for the health importance of carotenoids in the human diet has become compelling. This book is a collection of 25 chapters by leading carotenoid researchers describing the roles of carotenoids in human health. It is noteworthy that only three chapters are devoted to the bioconversion and bioequivalence of β-carotene as a precursor of vitamin A. More than 50 of the carotenoids in nature may occur in human diets. They have a variety of biological activities; there is extensive evidence for their antioxidant and antican-cer properties.
Two-thirds of the chapters deal with basic carotenoid chemistry, antioxidant properties, pro-oxidant effects, carotenoids and membrane stabilization, interactions with other nutrients, and assessment of carotenoid levels in tissues. The remaining chapters deal with evidence for the relationship of carotenoids to car-cinogenesis, vascular disease, immune responses, eye diseases, and skin photosensitivity diseases, as well as their impact on the consequences of smoking and heavy alcohol consumption.
Numerous epidemiologic, interventional, and clinical human studies are currently under way to determine more precisely the possible roles of carotenoids and their metabolites in human nutrition. Although much further progress can be anticipated, the timeliness and comprehensiveness of this volume make it very useful for nutrition and health professionals.
Freedom from want: The human right to adequate food. By George Kent. Georgetown University Press, Washington, DC, 2005. (ISBN 1-58901-056-6) 271 pages, softcover. US$26.95.
The thesis of this book is “the right to adequate food as a human right for all people everywhere.” Kent shows that the right to adequate food is established in the most important human rights document, the Universal Declaration of Human Rights, as well as by the Inter-national Covenant on Economic, Social, and Cultural Rights. He also shows how hunger and poverty are not simple, technical problems that can be addressed by raising agricultural production. Hunger and poverty are instead deeply political problems rooted in the fact that many people do not have access to food because they do not have adequate control over local resources or decent opportunities to engage in meaningful, pro-ductive work.
Kent portrays the human right to adequate food as a practical goal, as well as a moral and legal obligation. It is not simply a theoretical or aspirational ideal. It requires all governments to work progressively toward the full eradication of hunger. If they fail to make progress, they can, and should, be held accountable by the people.
Kent’s book is part of a growing movement to construct a strong and coherent understanding of the right to food. He urgently calls for a true rights-based approach to development and demonstrates how the human rights approach can make a difference. Every-one needs to be aware of the national and international evolution and application of the human rights concept that includes the right to food. This should be a major concern in the formulation of nutrition and health policies as well as agricultural and economic policies.
Geology and health: Closing the gap. Edited by H. Catherine W. Skinner and Antony R. Berger. Oxford University Press, New York, 2003. (ISBN 0-19-516204-8) 179 pages, hardcover. US$75.00.
Geology and Health is an integrated collection of papers from earth scientists, biologists, and medical specialists
Book reviews
Nevin S. Scrimshaw
81
on health issues of concern to people worldwide, dem-onstrating how human health and well-being now and in the future can benefit from coordinated scientific efforts. International examples of dusts, coal, arsenic, fluorine, lead, mercury, and water-borne chemicals that have affected health are among the cases documented. They illustrate how hazards and potential hazards may come from natural materials and processes and how human-induced changes have contributed to disease and debilitation from naturally occurring materials. Introductory essays by the editors highlight progress toward scientific integration that may be applied elsewhere. Increased collaboration between earth and health scientists could benefit communities and indi-viduals in many countries.
The consequences of the distribution of iodine in soils and water are the best known effects of geology on health and are well treated in this book. However, the interactions also involve both deficiencies and excesses of essential elements, such as iron, fluoride, copper, selenium, molybdenum, and trace minerals, as well as potentially toxic minerals such as mercury and cadmium. The latter include wind-blown mineral and biogenic dust that leads to silicosis and other lung diseases. The availability of minerals in soils also determines the crops that can be grown. For nutritional epidemiologists and policy makers, these insights into the relationships between geography, geology, climate, and the distribution of minerals in soils, water, and plants can be very useful.
Effective solutions to combat present and future hazards will arise when the full scope of human inter-actions with the total environment is understood by decision makers whose choices will have long-term impacts. Geology and Health does elucidate and help to close the gap.
Marketing nutrition: Soy, functional foods, biotech-nology, and obesity. By Brian Wansink. University of Illinois Press, Chicago, IL, USA, 2005. (ISBN 0-252-02942-9) 206 pages, hardcover. US$34.95.
The stated objective of this book is to promote an understanding of the principles of social marketing to help health professionals, government officials, brand managers, and researchers to promote the consump-tion of nutritious foods. Its thesis is that food fads and perceptions that helped to make less-nutritious food products popular can be used to bring people back to a more nutritious diet and better lifestyle. It asserts that this requires marketing and promises to show how this can be done. It attributes a great deal of the disconnect between nutrition education and behavioral change to ineffective planning, but it does not provide examples.
The book first examines very briefly erroneous per-spectives to social marketing and then focuses on tools for targeting messages, marketing approaches, making labeling work, and managing consumer reactions. Sep-arate chapters discuss four of the most critical current food-related promotions: decrease obesity, increase the consumption of fruits and vegetables, improve the understanding and acceptance of advances in biotech-nology, and minimize and manage food crises.
The book is written in a popular, assertive style with limited evidence to support the assertions. A long list of suggested readings at the end is not linked to the text and does not include the classic in the field [1]. The topics listed in the index often have no useful information in the text. The substance that the chapters seem to lack is packed into a five-page table entitled “Marketing Nutrition Takeaways for Four Groups of Thought Leaders: Dieticians and Health Profession-als, Administrators of Food Aid Programs and Public Policy Officials, Brand Managers, and Scientists and Researchers.” This table and an informative discussion of successful measures to change and improve dietary habits during World War II are the most useful sections of the book.
Reference
1. Manoff RK. Social marketing: new imperative for public health. Westport, CT, USA: Praeger Publishers, 1985.
Principles of nutritional assessment. 2nd edition. By Rosalind S. Gibson. Oxford University Press, New York, 2005. (ISBN: 0-19-517169-1) 908 pages, hardcover. US$95.00.
This valuable text and guide to nutritional assessment of individuals and populations is a welcome rarity, a comprehensive and authoritative book written by a single author. This assures continuity and lack of duplication among chapters. As the author notes in the preface, there have been numerous large-scale interven-tion studies requiring accurate appraisal of nutritional status since the first edition was published in 1990. This has led to some significant technical advances in the measurement and evaluation of the usual food intake of individuals, experience incorporated in this second edition. It includes recognition of widespread under-reporting of dietary intakes and the use of independent biomarkers of dietary intake to validate dietary intake data in large-scale nutrition surveys.
New anthropometric data have been used for revised growth charts. There has also been increased emphasis on estimates of body-mass index and more biochemical measures. The latter have led to greater understand-ing of the critical importance of confounding factors,
Book reviews

82
particularly infections. The increased emphasis on micronutrients has led to the development of more sensitive biochemical and functional tests that better monitor and evaluate the effects of nutrition interven-tions. Another development has been the recognition that even subclinical levels of some nutrients have health consequences and that one may look for differ-ent cutoffs from those that have been used to identify clinical deficiency.
The scope of this book is indicated by its more than 900 pages and 26 chapters. Eight chapters cover the design of nutritional assessments; food consumption at the individual and national levels and, importantly, sources of errors in estimating food intake and food composition; and the variability, reproducibility, valid-ity, and evaluation of dietary assessments. Six chapters are required to deal with the issues of anthropometry and seven with the biochemical assessment of the status of specific nutrients. These chapters have very extensive references to relevant research. Appendices with dietary recommendations of various countries, growth charts, and National Health and Nutrition Examination Survey (NHANES) III anthropometric and biochemical data are useful additions.
For use in developing countries, the book has a weak-ness, namely, that only two short final chapters dealing with clinical assessment and the nutritional assessment of hospital patients are included. These do not provide sufficient information on the medical history and med-ical examination for inexperienced physicians, nor do the chapters dealing with individual nutrients discuss clinical signs and symptoms. The book also contains no description of the classical deficiency diseases that can still be seen in some refugee populations and victims of civil war or disasters. This does not diminish its value for epidemiologic and intervention studies, but it must be supplemented by other sources for those concerned with the clinical signs and symptoms of nutritional deficiencies.
Vitamin and mineral requirements in human nutri-tion. 2nd edition. Joint FAO/WHO Expert Consulta-tion Report. World Health Organization, Geneva, 2004. (ISBN 92-4-154612-3) 360 pages, hardcover. US$63.00.
This paperback publication from the World Health Organization/Food and Agriculture Organization (WHO/FAO) is the latest to result from a long series of FAO/WHO expert consultations on nutrient require-ments beginning in 1973. From the start, their purpose was to review the state of knowledge of the role of various nutrients in the human diet and to formulate practical recommendations, with interpretation when it is needed or when controversies exist.
It is essential that the international nutrition and health community as well as relevant regulatory bodies base their decisions on internationally agreed-upon estimates of nutritional requirements. Moreover, knowledge of all aspects of nutrition must be con-stantly updated. Background papers on each of 19 micronutrients were prepared and reviewed at a Joint FAO/WHO Expert Consultation held in Bangkok in September 1998. The result was a consensus report that provided both specific recommendations for these micronutrients and practical advice for those working in nutrition, health, and agriculture.
This second edition incorporates new evidence obtained since the previous consultation. It reflects increased concern for iron, calcium, and selenium in human diets and a shift from an emphasis only on the minimum requirements of micronutrients to consideration of the presumptive role these nutrients may play in preventing an increasing range of disease conditions in populations. These recommendations are as “science-based” as current knowledge permits, but controversies remain and are acknowledged. Until sufficient new knowledge becomes available, the recommendations of this volume should be used by all nutrition and health workers concerned with micronutrients.
Book reviews
Food and Nutrition Bulletin, vol. 27, no. 1 © 2006, The United Nations University. 83
International Union of Nutritional Sciences (IUNS)
Officers and council members for the 2005–09 term
Officers: Ricardo Uauy, President (Chile); Ibrahim Elmadfa, President-Elect (Austria); Lindsey Allen, Vice President (USA); Osman Galal, Secretary General (Egypt/USA); Suzanne Murphy, Treasurer (USA)
Council Members: Kamala Krishnaswamy (India); Anna Lartey (Ghana); J. Alfredo Martinez (Spain); Marja Mutanen (Finland); Hee Young Paik (Korea); Helio Vannucchi (Brazil)
IUNS mission and values
The mission of the IUNS is to promote the advance-ment of the science of nutrition, research, and devel-opment through global cooperation. The actions that IUNS takes and the manner in which it proceeds in its work should reflect these shared values:» Scientific excellence» Be truly global» Invest in and empower future leaders» Accountable to our stakeholders» Transparent in our actions» Place public interest first» Partnership with others» All nations as equals
The newly elected council examined the strengths of the IUNS in the global scene and agreed that these include being truly global in representation, pres-ence, and scope; taking multi- and interdisciplinary approaches in addressing food and nutrition issues; having an established record in strengthening and developing capacity for nutrition research and leader-ship, especially in developing countries; being led by a committed group of nutrition scientists who, as council members, make the IUNS a credible independent sci-
entific body; being the voice of nutrition scientists in advocating for improved nutrition globally and work-ing in partnership with key United Nations agencies, including the World Health Organization (WHO), Food and Agriculture Organization (FAO), Stand-ing Committee on Nutrition (SCN), United Nations University (UNU), and International Atomic Energy Agency (IAEA); and being responsible for the Inter-national Congress of Nutrition (ICN), which serves as the premier global forum for scientific interactions and information exchange.
In discussing IUNS strategic orientations for the next four years, the council considered the need to:» Enhance collaboration between national IUNS
adhering bodies to create regional networks in order to influence policy and community-level decision makers;
» Increase awareness of the significance of malnutri-tion in all its forms by promoting multinational training, research, and information dissemination activities;
» Promote research collaboration between industrial-ized and developing countries in the fight against undernutrition and nutrition-related chronic dis-eases;
» Lead a process of global harmonization of nutri-ent-based and food-based dietary guidelines and strengthen the application of International Food Data Systems (INFOODS);
» Facilitate public–private partnerships for improved nutrition of populations worldwide;
» Lead nutrition capacity development and strength-ening activities;
» Use modern communication technology to enhance interactions and facilitate publication of research work conducted in less-developed countries;
» Provide direction and technical assistance to devel-oping countries in advancing their training and research programs.Please direct comments or suggestions to the IUNS
president by e-mail: [email protected].
News and notes
84
Upcoming IUNS-sponsored meetings
13–17 March 2006. 33rd Session of the UN Standing Committee on Nutrition (SCN) will be hosted by the World Health Organization in Geneva, Switzerland.
27–28 June 2006. International Association of Nutrition Research meeting in Vienna, Austria.
17–21 September 2006. 13th World Congress of Food Science and Technology in Nantes, France, on the Atlantic coast. Under the aegis of IUFoST (Interna-tional Union of Food Science and Technology) and GISRIA (the consortium of the French public food research institutes), the congress is jointly organized by ADRIA (Association for Development, Research and Innovation in the Food Processing Industry) and INRA (National Institute for Agricultural Research), with the support of ENTIAA (University for Food Industry, Nantes) and IFREMER (French Research Institute for Exploitation of the Sea). “Food is life” is the theme of the congress. For further information, please visit: www.inra.fr/iufost2006.
28–30 September 2006. 1st World Congress of Public Health Nutrition in Barcelona, Spain.
15–18 October 2006. 8th IUNS-International Sympo-sium on Clinical Nutrition (ISCN) and 5th Asia-Pacific Clinical Nutrition Society (APCNS) joint conference in Hangzhou, Zhejiang Province, China.
12–16 November 2006. SLAN (Latin American Society of Nutrition) XIV Latin American Congress of Nutri-tion in Santa Catarina, Brazil.
7–9 May 2007. First meeting of the Federation of Afri-can Nutrition Sciences (FANUS)–IUNS in collabora-tion with the Moroccan Society of Nutrition (MSN), will be held in Ouarzazate, Morocco.
11–13 July 2007. FENS–IUNS Congress: 10th European Nutrition Conference in Paris.
For more information on these meetings, visit the IUNS website at www.iuns.org and click on “Important Events.”
Reports from the 18th International Congress of Nutrition (ICN), Durban, South Africa, 19–23 September 2005: Nutrition Safari for Innovative Solutions
The setting in southern Africa allowed the IUNS Coun-cil and the local organizers to project and highlight a conscious and comprehensive concentration on issues of this continent. The meeting concluded the four-year (2001–05) presidency of Dr. Mark Wahlqvist of Australia and initiated that of Dr. Ricardo Uauy of Chile (2005–09). A new group of IUNS officers and councilors, representing each of the geographic regions
of the globe, was elected by the Assembly, which also chose Granada, Spain, as the venue for the 20th ICN in 2013.
On Monday, September 19, 10 full-day or half-day workshops were held. Of particular interest for their emphasis on micronutrients and bioactive dietary con-stituents were the following: nutrition and cognition; food-based approaches to combating micronutrient deficiencies in children of developing countries; inter-national workshop on fruit and vegetable consumption for health and nutrition; and cocoa flavonoids and cardiovascular health: translating fundamental science into nutritional action.
In addition, three memorial sessions and five awards ceremonies complemented the program. The memo-rial sessions were dedicated to honoring the memory of three recently deceased distinguished investigators: Prof. Peter Fürst of Germany, Prof. Vernon R. Young of the United States, and Prof. Clive E. West of the Neth-erlands. Prof. West had been a longtime Contributing Editor for the Sight & Life Newsletter.
The E. V. McCollum International Lecture of the American Society for Nutrition, delivered by outgoing IUNS President Wahlqvist, addressed the progress in nutritional science through the vision of the IUNS. The International Prize for Nutrition of the Danone Institute went to Prof. David Barker of Southampton, United Kingdom, who summarized the growing evi-dence base for a crucial role of nutrition in early life as a determinant of health in later life. The IUNS Inter-national Nutrition Prize of the International Nutrition Foundation was awarded to Dr. Florentino Solon of the Philippines. Dr. Solon’s lecture provided a perspective on “good governance” of nutrition in a case study from his Southeast Asian nation, highlighting the broad test-ing and support for fortification of the national food supply with micronutrients, including fortification of oils, margarines, sugar, and flour with vitamin A.
The inaugural Human Nutrition Award Lecture of DSM was given by Dr. Robert M. Russell, Director of the US Department of Agriculture (USDA) Human Nutrition Research Center on Aging at Tufts University in Boston, Massachusetts, USA. The lecture focused on vitamin A and its cellular and protective functions in nutrition and health. Dr. Russell summarized the work in his laboratory, which links the metabolism of pro-vitamin A carotenes to the regulatory role of retinoids. Finally, a ceremony of Awards of the Nestlé Nutrition Institute of Africa conferred awards for research publi-cations, community service to nutrition, and sustained nutrition leadership. The latter award went to Prof. Esté Vorster of the Northwest University at Potchefstrom, South Africa, who also chaired the Organizing Com-mittee of the ICN event.
Intertwined underlying themes ran through the majority of the plenary sessions and the two debate sessions and signaled a tension between the process
News and notes
85
of scientific discovery and the implementation of remedial actions to alleviate health problems across the world. The larger of these themes related to the UN Millennium Development Goals and their rela-tively sparse attention to resolving nutritional prob-lems; this was commented upon in multiple plenary lectures. A related issue focused on the nature and complexity of the world’s nutritional problems and the corresponding considerations for applied solutions and actions to address these problems. Frequent refer-ence was made to the paradigm of a “dual burden” for public health—problems of deficiency and deprivation alongside of issues of excess consumption and dietary imbalance—inclining the balance of consensus to an acceptance of growing complexity. Some speakers even formulated “triple” and “quadruple” burdens for the epidemiology of human illness. Within this context, it was widely conceded that considerations of envi-ronmental pollution, physical inactivity, and genetic constitution are essential components of the public health equation. Hence, most participants had to admit that optimizing diet and nutrition would, at best, only contribute to the general solution, but that nutritional science could not single-handedly clarify or resolve all of the burdens of ill health. Debates were held about how first to engage the other disciplines in the scientific inquiry, and second how to build intersectoral alliances for public health actions at local, national, and bilateral or multilateral agency levels.
The discussions and debates about means, values, and priorities set the stage for reassessing the vision, mission, scope, and mandate for nutritional sciences and for the worldwide community of the IUNS. What are the relative roles and responsibilities of academia, civil society, and the food industry for the correction of epidemic health and nutritional imbalances across societies? It was heartening that Prof. Uauy, the incom-ing President of the IUNS, took this reassessment as a challenge for his four-year term. He also supported the inclusion of the younger generation of nutritionists across the regions to work through the regional Nutri-tion Leadership Programs in concert with the IUNS. Renovation of thinking and rejuvenation of leadership were goals that Dr. Uauy would have the council and its constituencies pursue during his tenure. We hope that the next meeting report will highlight progress both in the advancement of nutritional science and in our understanding of its role in the campaign for better human health and well-being.
The Scientific Program is available on the congress website at: www.puk.ac.za/iuns.
FAO Symposium on Community Nutrition Intervention Programs at ICN meeting in Durban, South Africa
The FAO Food and Nutrition Division organized and
sponsored three symposia at the ICN meeting, includ-ing one on “Community Nutrition Intervention Pro-grams.” This symposium provided an opportunity to present and showcase the work being done by the FAO Food and Nutrition Division for improving nutrition using community-based methods and approaches championed by the division for their impact on nutri-tional status. The purpose of the symposium was to share experiences with such approaches and to distill the key lessons of their success in order to inform future plans and interventions for reducing hunger and mal-nutrition. Country presentations included the projects supported by the FAO/Belgium Survival Fund and operating in Zambia, Mozambique, and Ethiopia; an FAO project in Laos; and the joint FAO/UNICEF/WFP German–supported activities for improving nutrition of orphans and others affected by AIDS in Lesotho and Malawi. The country presentations described the prin-ciples of the approaches used and the tools that have been generated, the processes and methods by which they were implemented, and the successes and con-straints in their application. Due attention was given to outcome and sustainability issues. The assessment tool developed by FAO following an in-depth review of nine country case studies was presented, and floor discus-sions further highlighted the best practices and lessons learned. The proceedings of the symposium are avail-able at: http://www.fao.org/es/ESN/index_en.stm.
Symposium and Workshops from the Central Food Technological Research Institute (CFTRI)
In association with the International Nutrition Foundation, Tufts University, and the United Nations University
International Symposium on Building Leadership Skills in Food and Nutrition Essential for National Development, 23-25 June 2006, CFTRI, Mysore, India
Internationally recognized scientists with interest in leadership and capacity development issues in the area of food and nutrition are invited to participate in this international symposium.
There is a growing recognition among institutions engaged in many facets of capacity development in developing countries that the present tools (e.g., train-ing modules) are inadequate. There is a need to evalu-ate and strengthen the current efforts being made in different countries toward capacity building in food and nutrition. This symposium:» Aims to bring together individuals with interest in
building human capacity and leadership on food for nutrition in developing countries
» Explores how leadership skills can be developed in food and nutrition for critical national develop-ment
News and notes
86
» Considers enhancing organizational, technical, and scientific skills to address global nutritional chal-lenges as an essential and challenging taskThe symposium will also identify the need for train-
ing in several areas of food and nutrition, including multidisciplinary perspectives, nutrition policy and research, communication, education, evaluation and monitoring, quality assurance, and project implemen-tation.
Participants from international and bilateral agen-cies, non-governmental organizations (NGOs), foun-dations, universities, and industry are welcome.
Workshop on Enhancing the Efficiency of Nutritional Investigation, 19–22 June 2006, CFTRI, Mysore, India
Course Directors: Dr. Gary Gleason and Dr. Nevin Scrimshaw, President, International Nutrition Founda-tion and Senior Advisor, UNU (E-mail: [email protected]).
Course enrollment is limited to 20 participants; there is a registration fee.
Workshop on Metrological Concepts for Strengthening Food and Nutritional Measurements, 26–30 June 2006, CFTRI, Mysore, India
Course Director: Dr. Venkatesh Iyengar, Adjunct Professor, Tufts University (E-mail: [email protected]).
Course enrollment is limited to 20 participants; there is a registration fee.
For further information on the symposium and the workshops, contact the Course Director or Dr. V. Pra-kash, Director, CFTRI, Mysore – 570 020, India; Fax: +91 - 821 – 2516308; E-mail: [email protected]
Call for Nominations
Abraham Horwitz Award for Leadership in Inter-American Health 2006
The Pan American Health and Education Founda-tion (PAHEF) is accepting nominations for the Abra-ham Horwitz Award for Leadership in Inter-American Health. This award is one of five from the Awards for Excellence in Inter-American Public Health Program, a partnership between the Foundation and the Pan American Health Organization (PAHO).
The Leadership Award recognizes individuals whose professional achievement in any field of inter-American health stimulates excellence and has had an impact on the health of populations across the borders of the Americas. Nominees may be active in their careers, active though in formal retirement, or retired following an outstanding lifetime career.
The winner receives a cash prize of US$5,000, a certificate of honor, and a paid trip to Washington, DC. Nominations must be received no later than 15 April 2006.
To learn more, visit our website at www.pahef.org, send e-mail to [email protected], or telephone +1-202-974-3882.
News and notes
Food and Nutrition Bulletin, vol. 27, no. 1 © 2006, The United Nations University. 87
Editorial Office — Food and Nutrition Bulletin
Tufts University, Boston, Massachusetts, USA
Editor: Dr. Irwin H. RosenbergE-mail: [email protected]
Senior Associate Editor: Dr. Nevin S. ScrimshawE-mail: [email protected]
Associate Editor, Food Science and Technology: Dr. V. Prakash
E-mail: [email protected]
Assistant Editor, Food Policy and Agriculture: Suresh BabuE-mail: [email protected]
Statistical Advisor: Dr. William M. RandE-mail: [email protected]
Managing Editor: Susan KarczE-mail: [email protected]
United Nations University Food and Nutrition Program
Coordinating Centers
Boston Coordinating OfficeInternational Nutrition Foundation150 Harrison Ave.Boston, MA 02111, USATel: 1-617-636-3771; Fax: 1-617-636-3727E-mail: [email protected] Advisor: Dr. Nevin ScrimshawProgram Officer: Dr. Shibani Ghosh
Regional Coordinating Centers
AsiaInstitute of Nutrition, Mahidol University (INMU)Salaya Campus, c/o Research CentreFaculty of Medicine, Ramathibodi HospitalRama VI Road, Bangkok 4, ThailandTel: 282-6435E-mail: [email protected]: Dr. Emorn Wasantwisut
EuropeDivision of Human NutritionWageningen UniversityP.O. Box 81296700 EV WageningenThe NetherlandsTel: 31 317 485751; Fax: 31 317 483342E-mail: [email protected], [email protected]: Dr. Frans KokCoordinator: Dr. Fré Pepping
Mexico, Central and South America, and the CaribbeanNational Institute of Public Health.Av. Universidad No. 655, Universidad 115Cuernavaca, Morales, C.P. MexicoTel: 52 73 175391E-mail: [email protected]: Dr. Juan Rivera-DommarcoInstitute of Nutrition and Food Technology (INTA)University of Chile,Casilla 138-11 Macul 5540 Santiago 11, Chile.Tel: 56 2 221-4105; Fax: 56 2 221-4030E-mail: [email protected]: Dr. Ricardo Uauy
Associated Institutions
Central Food Technological Research Institute (CFTRI). Mysore
570013, India. Tel: 22298. Cable: UNVERCENT MYSORE. Telex: 0846-241. E-mail: [email protected] Coordinator: Dr. V. Prakash
Department of Nutrition and Food Science, University of Ghana (DNFS). P.O. Box 134, Legon, Ghana. Tel: 233 27 553090. Fax: 233 21 774880. Telex: 2446 UGL GH. Coordinator: Dr. Samuel Sefa-Dedeh. E-mail:crspugl@ ghana.com
Institute of Nutrition, Chinese Academy of Preventive Medi-cine. 29 Nan Wei Road, Beijing 100050, People’s Republic of China. Tel: 8610 3022960. Fax: 8610 3170892. Coordina-tor Fengying Zhai. E-mail: [email protected]
Institute of Nutrition of Central America and Panama (INCAP). Carretera Roosevelt, Zona 11, Guatemala City, Guatemala. Tel: 43762. Cable: INCAP GUATEMALA. Coor-dinator: Dr. Hernán Delgado. E-mail: [email protected]
UNU Food and Nutrition Program
88
Kazakhstan Academy of Nutrition (KAN). Klochkova 66, 480008 Almaty, Kazakhstan. Tel: 7 3272 429-203. Fax: 7 3272 420-720. Coordinator: Dr. Turgeldy Sharmanov. E-mail: [email protected]
National Institute of Public Health. Av. Universidad No. 655, Universidad 115, Cuernavaca, Morales, C.P. Mexico. Tel: 52 73 175391. Coordinator: Dr. Juan Rivera-Dommarco. E-mail: [email protected]
Nutrition Center of the Philippines (NCP). South Super Highway, Nichols Interchange, Makati, Metro Manila 3116, Philippines. Tel: 85-30-71 to -79. Cable: NUTRICEN MANILA. Coordinator: Dr. Mercedes de Solon
Regional Center for Community Nutrition (RCCN). SEAMEO-TROPMED, Gldg. JL, Salemba Raya 4, Jakarta 10430, Indonesia. Tel: 62-21-330205. Fax: 62-21-3913933. Coordinator: Dr. Soemilah Sastroamidjojo. E-mail: [email protected]
Cooperating Institutions
Developing Countries
Caribbean Food and Nutrition Institute (CFNI), Kingston, Jamaica. Contact: Dr. Fitzroy Henry.
Center for Studies of Sensory Impairment, Aging and Metab-olism (CeSSIAM), Guatemala City, Guatemala. Contact: Dr. Noel W. Solomons. E-mail: [email protected]
Centro de Estudios sobre Nutrición Infantil (CESNI). Buenos Aires, Argentina. Contact: Dr. Alejandro O’Donnell. E-mail: [email protected]
Department of Food Technology and Nutrition, American University of Beirut, Beirut, Lebanon. Tel: 961 1 343002. Fax: 961 1 744460. Coordinator: D. Raja I. Tannous. E-mail: [email protected]
Department of Nutrition, State University of Morelos, Cuer-navaca, Mexico (Drs. Miriam and Adolfo Chávez). E-mail: [email protected], [email protected]
Food and Nutrition Research Institute, Manila, Philippines. Contact: Dr. Rodolfo Florentino. E-mail: rff@pacific. net.ph
Makerere University. Vice Chancellor’s Office, P.O. Box 7062, Kampala, Uganda. Tel: 256-42-542803. Coordinator: Dr. Robert Mwadime. E-mail: [email protected]
Medunsa Medical University of South Africa, P.O. Box 177, Medunsa, South Africa. Tel: 27 12 521-4499. Coordinator: Dr. Pauline Kuzwayo
National Institute of Nutrition, Hanoi, Vietnam. Contact: Dr. Nguyen Khan. E-mail: [email protected]
National Institute of Nutrition (NIN), Indian Council of Medical Research, Hyderabad, India. Contact: Dr. Kamala Krishnaswamy. E-mail: [email protected]
Potchesfroomse University, School of Physiology and Nutrition. Potchefstroom, 2520, South Africa. Tel: 27 18 299-2469. Coordinator: Dr. Johann C. Jerling. E-mail: [email protected]
Tanzania Food and Nutrition Center (TFNC). 22 Ocean Rd., Box 977, Dar es Salaam, Tanzania. Tel: 255 22 2780378/9. Coordinator: Dr. Godwin Ndossi. E-mail: [email protected]
University of Ibadan. Department of Nutrition, 6 Olnyole Way, New Bodija, Nigeria. Tel: 234 2810 3682. Coordinator: Dr. Tola Atinmo. E-mail: [email protected]
University of the Western Cape. Private Bag X17, Belville 7535, Capetown, South Africa. Tel: 27 21 959-2872. Coor-dinator: Dr. David Sanders
West African Health Organization. 01 BP 153, Bobo Diou-lasso 01, Burkina Faso. Tel: 226 97 57 72. Coordinator: Dr. Kinday Samba Ndure
University of Nairobi. Department of Food Technology and Nutrition, Faculty of Agriculture, Kabete Campus, P.O. Box 41670, Nairobi, Kenya. E-mail: [email protected]
Industrialized Countries
Agricultural Research Council, Food Research Institute, Norwich, UK
Center for International Health, Emory University School of Public Health, Atlanta, Ga., USA. Contact: Dr. Reynaldo Martorell. E-mail: [email protected]
Department of Nutrition, Harvard Medical School, Boston, Mass., USA (Dr. Allan Walker). E-mail: [email protected]
Department of Tropical Nutrition, Royal Tropical Institute, Amsterdam, Netherlands Food Research Institute, Nor-wich, UK. Contact: Dr. David Southgate
Friedman School of Nutrition Science and Policy, Tufts Uni-versity, Boston, Mass., USA. Contact: Dr. Eileen Kennedy. E-mail: [email protected]
International Agricultural Centre (ICFSN), Wageningen, Netherlands. Contact: Mrs. M van Dorp MSc. Netherlands Organisation for International Cooperation in Higher Education (NUFFIC), The Hague, Netherlands
London School of Hygiene and Tropical Medicine (LSHTM). Keppel Street (Gower Street), London WC1E 7HT, UK. Tel: 01-636 8636. Coordinator: Dr. Andrew Tomkins. E-mail: [email protected]
Netherlands International Nutrition Institute (NINI). Law-ickse Alle 11, P.O. Box 88, 6700 AB, Wageningen, Nether-lands. Tel: (08370) 19040. Coordinator: Dr. Fre Pepping. E-mail: [email protected]
Program in International Nutrition, University of California, Davis. Department of Nutrition, Davis, Calif. 95616, USA. Tel: 1 530 752-1992. Director: Dr. Kenneth Brown. E-mail: [email protected]
School of Public Health, Johns Hopkins University, Balti-more, Md., USA. Contact: Dr. Benjamin Caballero. E-mail: [email protected]
School of Public Health, University of California, Los Angeles, Calif., USA. Contact: Dr. Osman Galal. E-mail: ogalal@ ucla.edu
Western Human Nutrition Research Center, University of California, Davis, Calif., USA. Director: Dr. Lindsay Allen. E-mail: [email protected]
International organizations
FFI (Flour Fortification Initiative), Rollins School of Public Health, Emory University, Atlanta, Ga., USA. Contact: Dr. Glen Maberly. E-mail: [email protected]
International Center for Diarrhoeal Disease Research (ICDDR, B), Dhaka, Bangladesh. www.icddrb.org. Contact: Dr. David Sack. E-mail: [email protected]
International Food Policy Research Institute (IFPRI), Wash-ington, D.C., USA. www.ifpri.org
International Foundation of Science, Stockholm, Sweden. Conact: Dr. Nathalie Persson. E-mail: [email protected]
International Union of Food Science and Technology (IUFoST) www.iufost.org
International Union of Nutritional Sciences (IUNS) www.iuns.org President: Dr. Ricardo Uauy, E-mail: [email protected]. Secretary: Dr. Osman Galal, E-mail: [email protected]
Micronutrient Initiative, Ottawa, Canada. www.micronutri-ent.org. Contact: Dr. M.G. Venkatesh Mannar. E-mail: [email protected]
UNU Food and Nutrition Program
89
INF/EMF/UNU Capacity Building and Fellowship Program
Selected Institutions
Corporacion Ecuatoriana de Biotecnologia, Ave. Colón 1485 y nueve de Octubre Quito, Ecuador. Contact: Dr. Fernando Sempertegui. E-mail: [email protected]
Institute for Health Research, St. John’s Medical College, Ban-galore 560 034, India. Contact: Dr. Anura Kurpad. E-mail: [email protected]
Institute of Health Research, Chiang Mai University, Chiang Mai, Thailand. Contact: Dr. Thira Sirisanthana. E-mail: [email protected]
Institute of Nutrition, Mahidol University (INMU). Salaya Campus, c/o Research Centre, Faculty of Medi-cine, Ramathibodi Hospital, Rama VI Road, Bangkok 4, Thailand. Contact: Dr. Emorn Wasantiwisut. E-mail: [email protected]
Institute of Nutrition and Food Technology (INTA) Uni-versity of Chile, Casilla 138-11 Macul 5540. Santiago 11, Chile. Tel: 56 2 221-4105. Fax: 56 2 221-4030. Contact: Dr. Fernando Vio. E-mail: [email protected]
Institute of Nutritional Sciences, Chinese Academy of Sci-ences, Shanghai, China. Contact: Dr. Yan Chen. E-mail:[email protected]
International Center for Diarrhoeal Disease Research (ICDDR, B), Dhaka, Bangladesh. www.icddrb.org. Contact: Dr. David Sack. E-mail: [email protected]
Makerere University. Vice chancellor’s Office, P.O. Box 7062, Kampala, Uganda. Tel: 256-42-542803. Contact: Dr. Robert Mwadime. E-mail: [email protected]
Medunsa Medical University of South Africa. P.O. Box 177, Medunsa, South Africa. Tel: 27 12 521-4499. Contact: Dr. Pauline Kuzwayo
National Institute of Nutrition, Hanoi, Vietnam Contact: Dr.Nguyen Khan. E-mail: [email protected]
National Institute of Public Health. Av. Universidad No. 655, Universidad 115, Cuernavaca, Morales, C.P. Mexico. Tel: 52 73 175391. Contact: Dr. Juan Rivera-Dommarco. E-mail: [email protected]
Nelson Mandela Medical School, University of Kwazulu-Natal, Durban, South Africa; Contact: Dr. Nigel Rollins. E-mail: [email protected]
School of Public Health, University of Tehran, Tehran, Iran. Contact: Dr. Alireza Mesdaghinia. E-mail: mesdaghi@ sphtums.com
Sun Yat-Sen University, Guangzhou, China. Contact: Dr. Yi-xiang Su. E-mail: [email protected]
Universite Cheikh Anta Diop, Dakar, Senegal. Contact: Dr. Salimate Wade. E-mail: [email protected]
University of Ghana, Legon, Ghana. Department of Nutri-tion and Food Science. Contact: Dr. Anna Lartey. E-mail: [email protected]
University of Indonesia, Jakarta, Indonesia (SEAMEO-TROP). Contact: Dr Widjaja Lukito. E-mail: [email protected]
University of Nairobi. Department of Food Technology and Nutrition, Faculty of Agriculture, Kabete Campus, P.O. Box 41670, Nairobi, Kenya. E-mail: [email protected]
University of the West Indies, Mona, Jamaica. Contact: Dr. Terrence Forrester.
Training Institutions
Center for International Health, Emory University School of Public Health, Atlanta, Ga., USA Contact: Dr. Reynaldo Martorell. E-mail: [email protected]
Cornell University. Division of Human Nutrition, Ithaca, New York Contact: Dr. Cutberto Garza
Department of Nutrition, Harvard Medical School, Boston, Mass., USA Contact: Dr. Allan Walker. E-mail: [email protected]
Division of Human Nutrition Wageningen University P.O. Box 8129 6700 EV Wageningen. The Netherlands Tel: 31 317 485751. Fax: 31 317 483342 Contact: Dr. Frans Kok, Dr. Fré Pepping. E-mail: [email protected], [email protected]
Friedman School of Nutrition Science and Policy, 150 Har-rison Avenue, Boston, Mass., USA Contact: Dr. Eileen Kennedy. E-mail: [email protected]
Institute of Child Health, London, EnglandInstitute of Nutrition, Mahidol University (INMU).
Salaya Campus, c/o Research Centre, Faculty of Medi-cine, Ramathibodi Hospital, Rama VI Road, Bangkok 4, Thailand. Contact: Dr. Emorn Wasantiwisut. E-mail: [email protected]
Institute of Nutrition and Food Technology (INTA) Uni-versity of Chile, Casilla 138-11 Macul 5540. Santiago 11, Chile. Tel: 56 2 221-4105. Fax: 56 2 221-4030 Contact: Dr. Fernando Vio. E-mail: [email protected]
London School of Hygiene and Tropical Medicine (LSHTM). Keppel Street (Gower Street), London WC1E 7HT, UK. Tel: 01-636 8636. Contact: Dr. Andrew Tomkins. E-mail: [email protected]
Monash University. Monash Asia Institute/Asian Pacific Health and Nutrition Center
Monash University. ARC Centre for Microbial Genomics. Contact: Dr. Ben Adler. E-mail: [email protected]
School of Public Health, Johns Hopkins University, Balti-more, Md., USA Contact: Dr. Benjamin Caballero. E-mail: [email protected]
University of California, Davis. Department of Nutrition, Davis, Calif. 95616, USA. Tel: 1 530 752-1992. Contact: Dr. Kenneth Brown. E-mail: [email protected]
University of the West Indies, Mona, Jamaica. Contact: Dr. Terrence Forrester
Cooperating with the United Nations system
Asian Development Bank, Manila, Philippines. www.adb.orgFood and Agriculture Organization (FAO). www.fao.org
Contact: Dr. Kraisid Tontisirin. E-mail: Kraisid.Tontisrin@ fao.org
International Atomic Energy Agency (IAEA). www.iaea.orgPan American Health Organization. www.paho.orgUnited Nations Children’s Fund (UNICEF). www.unicef.org
Contact: Dr. Rainer Gross. E-mail: [email protected] Bank. www.worldbank.org Contact: Meera Shekar
E-mail: [email protected] Food Programme (WFP). www.wfp.org Contact: Dr.
Martin Bloem. E-mail: [email protected] Health Organization (WHO). www.who.int/enThe University is represented on the Standing Committee on
Nutrition (SCN) of the United Nations (www.unsystem.org/scn) Contact: Dr. Roger Shrimpton. E-mail: [email protected]
Research networks of INF/UNU
Global Cereal Fortification Initiative (GCFI)
Ajinomoto, Tokyo, Japan. Contact: Dr. Izuru Shinzato. E-mail: [email protected]
American University of Beirut. Central Research Science Laboratory, Beirut Lebanon. Contact: Dr. Youssef Mou-neimne. E-mail: [email protected]
UNU Food and Nutrition Program
90
Department of Immunology, Capital University of Medical Science, Beijing, China. Contact: Dr. Yunqing An
Health and Nutrition Section, Ministry of Health and Devel-opment, Government of Pakistan. Contact: Dr. Mushtaq Khan. E-mail: [email protected]
Henan Provincial Health and Anti-epidemic Station, Henan, China. Contact: Dr. Zhang Ding.
Institute of Nutrition and Food Hygiene, Chinese Academy of Preventive Medicine, Beijing, China. Contact: Dr. Wenhua Zhao. E-mail: [email protected]
Nutrition Research Centre, St. John’s Medical College, Ban-galore 560 034, India. Contact: Dr. Anura Kurpad. E-mail: [email protected]
Iron-deficiency Anemia
Center for Human Growth and Development, Department of Pediatrics and Communicable Diseases, University of Michigan Medical School, Ann Arbor, Michigan, USA Contact: Dr. Betsy Lozoff. E-mail: [email protected]
Department of Nutrition Sciences, 119 Morgan Hall, Univer-sity of California, Berkeley, CA 94270, USA. Tel: (510) 642-6900. Contact: Dr. Fernando Viteri. E-mail: [email protected]
Food and Nutrition Research Institute, Manila, Philippines. Contact: Dr. Rodolfo Florentino. E-mail: [email protected]
Institute for Medical Research, Kuala Lumpur, Malaysia. Contact: Dr. E-Siong Tee. E-mail: [email protected]
Institute of Nutrition and Food Technology (INTA), Univer-sity of Chile, Casilla 15138, Santiago 11, Chile. Contact: Dr. Tomas Walter. E-mail: [email protected]
Institute of Nutrition, Mahidol University (INMU), Salaya Campus, c/o Research Centre, Faculty of Medicine, Ram-athibodi Hospital, Rama VI Road, Bangkok 4, Thailand. Contact: Dr. Sakorn Dhanamitta. E-mail: [email protected]
Iron Deficiency Program Advisory Service (IDPAS), Interna-tional Nutrition Foundation, 150 Harrison Avenue, Room 221, Boston, USA. Tel 1-617-636-3770. Contact: Dr. Gary Gleason. E-mail: [email protected]
National Institute of Nutrition, ICMR, Hyderabad, India. Contact: Dr. Vinodini Reddy
National Research Centre, National Academy of Sciences, Cairo, Egypt. Contact: Dr. Sohair Salem
Nutrition Research and Development Centre, Komplek GIZI, Jalan Semboja, Bogor, Indonesia. Contact: Dr. Mahdin Husaini. E-mail: [email protected]
Venezuelan Institute of Scientific Research (IVIC), Apar-tado 1827, Caracas, Venezuela. Contact: Dr. Maria Nieves García-Casal
International Network of Food Data Systems (INFOODS)
Secretariat: Dr. Barbara Burlingame, Food and Agricul-ture Organization of the United Nations (FAO), Viale delle Terme di Caracalla 00100, Rome, Italy. Tel: (3906) 57053728. Fax: (396) 57054593. E-mail: [email protected]
Regional liaison groups
AFROFOODS. Coordinator: Prof. Hettie Schonfeldt, Depart-ment of Consumer Science, University of Pretoria, Pretoria, South Africa. E-mail: [email protected]
ASEANFOODS. Coordinator: Dr. Prapasri Puwastien, Insti-tute of Nutrition, Mahidol University of Salaya, Nakhon Pathom, Thailand. E-mail: [email protected]
CAFOODS. Coordinator: Dr. Mbome Lape, Institute of Nutrition, Cameroon
CAPFOODS. Coordinator: Ana Victoria Román, Unidad de Tecnología de Alimentos y Agroindustria, Instituto de Nutrición de Centroamérica y Panamá (INCAP), Guatemala City, Guatemala. E-mail: aroman@incap. ops-oms.gt
CARICOMFOODS. Coordinator: Dr. Fitzroy Henry, Carib-bean Food and Nutrition Institute, University of the West Indies, Kingston, Jamaica. E-mail: fhenry@uwimona. edu.jm
CARKFOODS. Coordinator: Dr. Musa Aidjanov, Institute of Nutrition, Almaty, Kazakhstan. E-mail: [email protected]
CEECFOODS. Coordinator: Dr. Fanny Ribarova, National Center of Hygiene, Medical Ecology and Nutrition, Department of Food Chemistry, 15, Dimitar Nestorov Street 1431 Sofia, Bulgaria. E-mail: [email protected]
ECAFOODS. Coordinator: Dr. Wilbad Lorri, Tanzania Food and Nutrition Centre (TFNC), Dar Es-Salaam, Tanzania. E-mail: [email protected]
E-mail: [email protected]. Coordinator: Paul M. Finglas, Senior Research
Scientist, Institute of Food Research, Norwich Research Park, Norwich, NR4 7UA, Norfolk, UK. E-mail: [email protected]
GULFOODS. Coordinator: Dr. Abdulrahman O. Musaiger, Bahrain Centre for Studies and Research, Manama, Bah-rain. E-mail: [email protected]
LATINFOODS. Coordinator: Dr. Elizabete Wenzel de Menezes, Departamento de Alimentos e Nutrição Experimental, Faculdade de Ciências Farmacêuticas Universidade de São Paulo, São Paulo, Brazil. E-mail: [email protected]
MEXCARIBEFOODS. Coordinator to be determined.NAFOODS. Coordinator: Dr. Gharbi Tahar, National Insti-
tute of Nutrition, Ministère de la Santé Publique,Tunis, Tunisia. E-mail: [email protected]
NEASIAFOODS (formerly MASIAFOODS). Coordina-tor: Professor Yang Yuexin, Institute of Nutrition and Food Safety, Chinese Center of Disease Prevention and Control, Beijing, People’s Republic of China. E-mail: [email protected]
NORAMFOODS. Coordinator: Dr. Joanne Holden, Nutrient Data Lab, USDA, Agricultural Research Service, Riverdale, Md., USA. E-mail: [email protected]
OCEANIAFOODS. Coordinator: Professor Bil Aalbersberg, University of the South Pacific, Box 1168, Suva, Fiji. E-mail: [email protected]
SAARCFOODS. Coordinator: Dr. Jehangir Khan Khalil, NWFP Agricultural University, Peshawar, Pakistan. E-mail: [email protected]; [email protected]; [email protected]
SAMFOODS. Coordinator: Prof. Saturnino de Pablo, Insti-tuto de Nutrición y Technología de los Alimentos (INTA), Universidad de Chile, Santiago, Chile
SOAFOODS. Coordinator: Ms. Pauline Zharare, Institute of Food, Nutrition and Family Science, University of Zimba-bwe, Harare, Zimbabwe. E-mail: [email protected]
WAFOODS. Coordinator: Dr. Esther Sakyi-Dawson, Depart-ment of Nutrition and Food Science, University of Ghana, Accra, Ghana. E-mail: [email protected]
UNU Food and Nutrition Program
Food and Nutrition Bulletin Support for Subscriptions to Developing Countries
International agencies
The United Nations University (UNU)The International Atomic Energy Agency (IAEA)The United Nations Children’s Fund (UNICEF)
Bilateral agencies
United States Agency for International Development (USAID)
Nongovernmental organizations
International Life Sciences Institute (ILSI)
Corporations
Akzo Nobel ChemicalsDSM Nutritional Products
Kraft FoodsProcter & Gamble Co.
Unilever
Useful web sites and free materials
Access to Global Online Research in Agriculture (AGORA) www.aginternetwork.org/en/about.phpFood and Agriculture Organization (FAO) www.fao.orgInternational Atomic Energy Agency (IAEA) www.iaea.orgInternational Life Sciences Institute (ILSI) www.ilsi.orgInternational Nutritional Anemia Consultative Group (INACG) http://inacg.ilsi.orgInternational Nutrition Foundation (INF) www.inffoundation.orgInternational Vitamin A Consultative Group (IVACG) http://ivacg.ilsi.orgInternational Union of Nutritional Sciences (IUNS) www.iuns.orgIron Deficiency Project Advisory Service (IDPAS) www.micronutrient.org/idpasThe Micronutrient Initiative www.micronutrient.orgPan American Health Organization (PAHO) www.paho.orgSave the Children www.savethechildren.orgUnilever www.unilever.comUnited Nations Children’s Fund (UNICEF) www.unicef.orgUnited Nations University (UNU) www.unu.orgUN Standing Committee on Nutrition (SCN) www.unsystem.org/scnWorld Bank www.worldbank.orgWorld Food Program www.wfp.orgWorld Health Organization (WHO) www.who.int/en
Note for contributors to the Food and Nutrition Bulletin
The editors of the Food and Nutrition Bulletin welcome contribu-tions of relevance to its concerns (see the statement of editorial policy). Submission of an article does not guarantee publication; acceptance depends on the judgment of the editors and reviewers as to its relevance and quality. All potentially acceptable manu-scripts are peer-reviewed. Contributors should examine recent issues of the Bulletin for content and style. Ethical approval of studies and informed consent. For investi-gations of human subjects, authors should state in the Methods section the manner in which informed consent was obtained from the study participants (i.e., oral or written), and describe how the study investigators protected the rights of participants as described in the Declaration of Helsinki. Language. Contributions must be submitted in English. Format. Manuscripts should be prepared on a computer, and submitted electronically via e-mail directly to the Managing Editor. Abstract. An abstract of not more than 250 words should be included at the beginning of the manuscript, in the following format:
» Background. The context of the problem you are investigat-ing, with relevant historical information.
» Objective. A one- or two-sentence description of the pur-pose of the study and what you expected to find.
» Methods. Outline of study design, subject selection, analyti-cal methods, data analysis.
» Results. What you found based on your data. Give specific data and their statistical significance here if possible.
» Conclusions. One- or two-sentence description of what you conclude from your results.
Emphasize new and important aspects of the study or obser-vations. Do not include any information that is not given in the body of the article. Do not cite references or use abbreviations or acronyms in the abstract. Key words. Authors should provide a minimum of four key words for the article. Tables and figures. Tables and figures should be placed on separate pages in the manuscript file. Footnotes should be keyed to the relevant data points by letters or symbols. Figures should be submitted electronically, as part of the manuscript file or as a separate electronic file. The original data files for figures that use bar graphs, scatterplots, or other graphic representations of data should be sent along with the manuscript. Please double-check your data for accuracy and consistency with the text. Photographs. Photographs may be mailed or submitted electronically. Mailed photographs will not be returned unless specifically requested. Units of measure. All measurements should be expressed in metric units. If other units are used, their metric equivalent should be indicated. Abbreviations. Please spell out all abbreviations used on the first reference. References. References should be listed at the end of the article. Unpublished papers should not be listed as references, nor should papers submitted for publication but not yet accepted. Please double-check that reference numbers correspond to the correct numbers in the text. Number references consecutively in the order in which they are first mentioned in the text. Identify references in the text and tables and figure legends by arabic numerals enclosed in square brackets. References cited only in tables or figure legends should be numbered in accordance with the first mention of the relevant table or figure in the text. Be sure references are complete and current.
Reference citations should follow the format below.Journal reference—standard journal article (list all authors):
1. Alvarez MI, Mikasic D, Ottenberger A, Salazar ME. Carac-teristicas de familias urbanas con lactante desnutrido: un análisis critico. Arch Latinoam Nutr 1979;29:220–30.
—corporate author:2. Committee on Enzymes of the Scandinavian Society for
Clinical Chemistry and Clinical Physiology. Recommended method for the determination of gammaglutamyltrans-ferase in blood. Scand J Clin Lab Invest 1976;36:119–25.
Book or other monograph reference—personal author(s):
3. Brozek J. Malnutrition and human behavior: experimental, clinical and community studies. New York: Van Nostrand Reinhold, 1985.
—corporate author:4. American Medical Association, Department of Drugs. AMA
drug evaluations, 3rd ed. Littleton, Mass, USA: Publishing Sciences Group, 1977.
—editor, compiler, chairman as author:5. Medioni J, Boesinger E, eds. Mécanismes éthologiques de
l’évolution. Paris: Masson, 1977. —chapter in book:
6. Barnett HG. Compatibility and compartmentalization in cultural change. In: Desai AR, ed. Essays on moderniza-tion of underdeveloped societies. Bombay: Thacker, 1971: 20–35.
World Wide Web reference7. WHO HIV infections page. WHO web site. Available at:
http://www.who.int/topics/hiv_infections/en/. Accessed 12 October 2004.
8. Nielsen J, Palle V-B, Martins C, Cabral F, Aaby P. Malnour-ished children and supplementary feeding during the war emergency in Guinea-Bissau in 1998–1999 [serial online]. Am J Clin Nutr; 2004; 80:1036-42. Available at: http://www.ajcn.org/cgi/content/full/80/4/1036. Accessed 12 October 2004.
Identification. Please give the full name of each author, the name of departments and institutions to which the work should be attributed, the name, address, fax number, and e-mail address of the corresponding author, and sources of support for the work. If the material in the article has been previously presented or is planned to be published elsewhere—in the same or modified form—a note should be included giving the details. Page charges. The Bulletin has a page charge of US$60 for unsolicited original research articles. One printed page in the Bulletin is equivalent to approximately 3 double-spaced manu-script pages. The Bulletin will waive these charges for authors in developing countries who do not have support that will cover page charges, but we require a formal letter requesting a waiver. Articles acknowledging major financial support, or from authors in industrialized countries, will not be eligible for waivers. This policy does not apply to solicited articles. Authors contributing to special issues and supplements are not responsible for page charges.
Contributions should be addressed to: Susan Karcz, Managing Editor Food and Nutrition Bulletin 150 Harrison Ave. Boston, MA 02111 USA [email protected]

Food and Nutrition Bulletin Subscription Form
Please enter my subscription to the Food and Nutrition Bulletin (4 issues).
Regular rates: 1 year, US$56 2 years, US$106 3 years, US$150All rates include delivery by surface mail.
Total payment enclosed:
Individuals are requested to enclose payment with their orders. Prices subject to change without notice. Payment must be made in US dollars only. Checks should be made payable to: International Nutrition Foundation, Inc. Subscriptions will begin with the issue following placement of the order.
Send to: Subscriptions International Nutrition Foundation, Inc. 150 Harrison Ave. Boston, MA 02111 USA
Name:
Address:
Subscribe to the Food and Nutrition Bulletin
Annual Subscriptions
The annual subscription cost of the Bulletin is US$56.00, which includes both the quarterly issues and supplements. To subscribe, write or email:
International Nutrition Foundation 150 Harrison Ave.Boston, MA, 02111, USATel: 617-636-3771Fax: 617-636-3727E-mail: [email protected]
Subsidized Subscriptions Available
The International Nutrition Foundation (INF) is raising funds to increase the subsidized distribution of the Food and Nutrition Bul-letin to nutrition scientists and institutions in developing countries. This effort has been supported by the United Nations University (UNU), the United Nations Children’s Fund (UNICEF), the Inter-national Atomic Energy Agency (IAEA), the United States Agency for International Development (USAID), The Micronutrient Initiative (MI), and the International Life Sciences Institute (ILSI). Contributions have also been received from Akzo Nobel Chemi-cals, DSM Nutritional Products, Kraft Foods, Procter & Gamble Co., and Unilever.
If you (or your organization) are working in the field of nutri-tion, and are from a developing country, you may be eligible for a donated or subsidized subscription. The extent to which requests for free subscriptions can be met depends on available funds. The Bulletin’s goal of promoting a wide geographic and institutional distribution will be taken into consideration. Individuals and insti-tutions working in developing countries and countries in transition may apply biannually for a subsidized subscription. Preference for subsidized subscriptions will be given to libraries. If you are affiliated with a university in a developing country, we encourage you to make this information available to the library of your institution. Normally, individuals holding international posts working with international and bilateral agencies, international nongovernmental organizations (NGOs), and private corporations are not eligible for free subscriptions. Subscription exchanges with journals of similar purposes and interests are welcome. To apply for a subsidized subscription, write or email:
International Nutrition Foundation 150 Harrison Ave. Boston, MA, 02111, USA Tel: 617-636-3771 Fax: 617-636-3727 E-mail: [email protected]