Slide 0 - Deutsche Bank
38
Research Deutsche Bank Deutsche Bank Research The House View: Common Sense Prevails October 18 2013 DISCLOSURES AND ANALYST CERTIFICATIONS ARE LOCATED IN APPENDIX 1. MICA(P) 054/04/2013.
Transcript of Slide 0 - Deutsche Bank

Research Deutsche Bank
Deutsche Bank Research The House View: Common Sense Prevails October 18 2013
DISCLOSURES AND ANALYST CERTIFICATIONS ARE LOCATED IN APPENDIX 1. MICA(P) 054/04/2013.

Deutsche Bank Research The House View – 18 October 2013, [email protected], +44 207 545 8465
2 Special report – Japan: The Great Escape
1 The House View – Common Sense Prevails

Deutsche Bank Research The House View – 18 October 2013, [email protected], +44 207 545 8465
The House View – October 18 2013: Common Sense Prevails
The much-awaited reopening of the US government and suspension of the debt ceiling marks an end,
albeit temporarily, to the political spectacle in Washington. While we were never in doubt that the US
would avoid default, the episode highlights that political brinkmanship and short-term fixes are
phenomena not unique to Europe. However, the resolution of this episode has inflicted deep wounds
on the Republican party and Congress. As a result, chances for meaningful progress in the upcoming
budget negotiations have improved. Another government shutdown and debt ceiling showdown next
year seem less likely
We expect the economic impact of the shutdown and political impasse to be relatively muted.
Somewhat perversely, the deadlock in Washington helped underpin risk appetite, as the elevated state
of uncertainty raised expectations that Fed tapering will be delayed, thus containing the recent rise in
borrowing costs
Although we remain constructive on equities, the majority of this year’s rally has been driven by
multiples normalising from depressed levels rather than higher earnings. As a result, Q3 reporting will
provide crucial insights as to whether the earnings inflection required to propel the rally is materialising
An exception to this trend is Japan, where multiples remain little changed despite earnings growth of
>60% this year. In a special report, we outline our conviction in Abenomics and why we think Japanese
equities could double over the coming years
David Folkerts-Landau, Group Chief Economist
The views in this publication are informed by Deutsche Bank’s Global Strategy Group, which advises management and clients on broad market risks and
global economic and financial developments. The views and forecasts of the group, which consists of senior research staff, may occasionally differ from
those disseminated by their research colleagues
Editors: Raj Hindocha, Marcos Arana,
Wolf von Rotberg, Sahil
Mahtani, Erin Urquhart
3

Deutsche Bank Research The House View – 18 October 2013, [email protected], +44 207 545 8465
Expect global growth to pick-up led by the US and Europe. See minimal impact from the US budget standoff
Fed: QE tapering to start by March-14 and QE to end in
2014, exact timing data dependent. No hikes until 2015
then Fed to surprise with faster hiking cycle than
currently priced by the market
ECB on hold with easing bias. Additional liquidity for
banks (LTROs) possible but not imminent
BoJ on hold but stands ready to ease further if needed
BoE on hold, using forward guidance on rate rises
PBoC on hold given inflation risk contained
EM mostly on hold with some countries (e.g., Brazil,
India) tightening to to counter inflation / outflow risk
Monetary policy shock: path to normal monetary policy
surprises markets, leads to volatility, hurts growth
Euro crisis reignites: politics lead to crisis escalation,
recovery stalls
Corporate earnings disappoint, fail to accelerate
EM growth slowdown: amid lack of reform and capital
outflows, or if export traction fails to materialise
US fiscal accident: around debt ceiling / budget
negotiations
Global growth of 2.8% in 2013, 3.7% in 2014
US growth of 1.8% in 2013, 3.2% in 2014. Recovery
remains intact, converging to 3% growth in 2014.
Strengthening labour market, housing sector recovery
and reduced fiscal drag to support economy
Eurozone growth at -0.2% in 2013 and 1.2% in 2014.
Growth to be supported by domestic demand, export
traction and slower pace of fiscal tightening
EM growth of 4.5% in 2013 and 5.4% in 2014. US /
Europe demand to support export-driven recovery
US fiscal negotiations: short-term deal is a mild positive that buys time for a more comprehensive solution, which should be easier to achieve next time around
Fed policy normalisation: tapering to begin by March, with Yellen taking over as chair (pending confirmation). Earlier taper possible if data strengthens materially and a real fiscal resolution is reached by December
Euro politics: expect Merkel-led Grand Coalition with SPD in Germany to be announced by mid-/ late-Nov, no change to crisis response approach. No escalation in Italy in next 18-24 months, political map improved
Economic outlook Central bank watch
Note: H / M / L indicates estimated probability of risk (High, Medium, Low)
Views on key themes Key risks to our view
4
M
L
M
M
L
Deutsche Bank Research The House View – 18 October 2013, [email protected], +44 207 545 8465
Downside risks
— Monetary policy shock: path to normal monetary policy
surprises markets, leads to volatility, hurts growth
— Crisis returns to Europe: return to recession; political
breakdown raises tensions, e.g., snap election in Italy,
weak government coalition in Germany
— Corporate earnings disappoint, fail to accelerate
— EM growth slowdown: export traction fails to materialise;
lack of structural reform limits growth potential
— US fiscal accident: unexpected slowdown in data; fiscal
uncertainty dents growth
— Geopolitical tensions escalate and push up oil prices or
slow economic activity, e.g., escalation of Syria conflict
Upside risks
— Global growth upside surprise: limited fiscal drag in the US,
sharper-than-expected recovery in Europe, reforms and
stronger growth in EM, effective policy stimulus in Japan
1
2
3
4
5
7
Lower Probability
Imp
act o
n o
ur
ba
se
ca
se
Higher
Lo
we
r H
igh
er
Higher risk
Lower risk
The House View - Risk Matrix
* Moves represent change in risk outlook over previous month
Major risks have receded as policy uncertainty fades and tapering is delayed
5
5
6
2
1 1
5
2
4 4
6
3
7

Deutsche Bank Research The House View – 18 October 2013, [email protected], +44 207 545 8465
41%
26% 23% 22%
20% 16% 16% 15%
6% 5% 0%
-8%
4% 1% 1%
-2%
5%
-2% -2% -4%
3% 2% 1% 0%
-4%
-10% -11% -12% -14%
1% 0%
-23% (25)%
(20)%
(15)%
(10)%
(5)%
0%
5%
10%
15%
20%
25%
30%
35%
40%
45%
Japan N
ikkei
Spain
IB
EX
35
US
S&
P 5
00
Italy
Mila
n
Fre
nchC
AC
40
Euro
pe S
toxx 6
00
Germ
an D
AX
30
UK
FT
SE
100
Hang S
eng
India
Nifty
MS
CI E
M
Bra
zil
Bovespa
US
Hig
h Y
ield
EU
IG
EU
IG
Fin
US
IG
Italy
Germ
any
US
UK
EU
R
RM
B
Dolla
r In
dex
MX
N
MY
R
TR
Y
INR
JP
Y
ZA
R
Com
modity Index
Bre
nt O
il
Gold
YTD 2013 Since October 1 shutdown
* October 1 is the first trading day after Fed postponed potential tapering
Note: Total return accounts for both income (interest or dividends) and capital appreciation.
Source: Bloomberg Finance LP, Deutsche Bank Research. Prices as of 16 Oct 2013, COB
Total returns YTD 2013, change since 1 October (start of shutdown)
Risk appetite has remained healthy despite the US government shutdown and debt ceiling impasse
6
Equities Corporate
credit
Sovereign
debt
Commodities FX

Deutsche Bank Research The House View – 18 October 2013, [email protected], +44 207 545 8465
0
3
6
9
12
15
18
1940 1950 1960 1970 1980 1990 2000 2010
Statutory debt limit
The deal: US debt ceiling suspended until 7-Feb. Treasury can fund
the government through May thanks to its extraordinary measures
USD tn
January 2012: +USD1.2tn
August 2011: +USD0.9tn
Source: US Treasury, Haver Analytics, Deutsche Bank Research
Debt Ceiling suspended until 7 Feb 2014
The US government went into partial shutdown at
the start of the new fiscal year on 1-October after
Congress failed to pass a budget for FY 2014, or a
continuing resolution (temporary budget extension)
to keep the government funded
Late on 16-October, Congress compromised on a
bill which included
− Continuing resolution though 15-Jan-2014, to
end the 3rd longest shutdown in US history
− Suspension of debt ceiling through 7-Feb-2014,
although Treasury retains extraordinary
measures that will enable it to borrow until mid-
May
Furthermore, agreement was reached between
House and Senate leaders to appoint negotiators to
reach a budget agreement by 13-Dec-2013
− A report must be issued by then – though
agreement is not necessary
10 12
8 8
18
11
2 1 3 3 2 1 1 1
5 5
21
16
0
5
10
15
20
25
US government shutdowns: 2013 was the third longest shutdown in
history
Number of days
Source: Deutsche Bank Research
7
Late on 16-Oct, US Congress agreed to suspend the debt ceiling and pass a continuing resolution to keep the government funded
Note: The debt ceiling is a limit on the amount that the US government can borrow for public spending

Deutsche Bank Research The House View – 18 October 2013, [email protected], +44 207 545 8465
8
Market distortions in the US Treasury market have normalised, while equity markets remain close to all-time highs
The equity market shrugged off the shutdown and
default fears
− S&P 500 up +2.4% over the course of the
shutdown
Risk appetite was supported as the elevated state
of uncertainty raised expectations that tapering will
be delayed into Q1
0.00
0.05
0.10
0.15
0.20
0.25
0.30
0.35
19/09 26/09 03/10 10/10 17/10
US 1M yield
US 12M yield
US Treasuries market: 1M yields rose above 1Y yields amid concern
that near-term payments could be disrupted
%
Source: Bloomberg Finance LP, Deutsche Bank Research
1,550
1,600
1,650
1,700
1,750
Jun-13 Jul-13 Aug-13 Sep-13 Oct-13
S&P500 closing prices: Equity market response was fairly benign
during the shutdown
Source: Bloomberg Finance LP, Deutsche Bank Research
All time closing high
The yield curve inverted as 1M yields surged above
1Y yields
− At height of the crisis, US 1M yields spiked to
45bp intraday (vs. 0bp a month ago)
− Investors were concerned about payment issues
with maturing short-term debt, rather than over
widespread fears of a default

Deutsche Bank Research The House View – 18 October 2013, [email protected], +44 207 545 8465
9
We expect the economic impact of the shutdown and political impasse to be relatively muted
Macro impact on the US economy will be small, as
in the August 2011 debt ceiling episode –
annualised rate of real GDP growth down by a few
tenths of 1% in Q4
Only a subset of federal government employees
initially classified as non-essential were affected by
the shutdown – and even for those, Congress
agreed early on to grant retroactive pay, so the
effect on consumer spending should be limited
While sentiment and confidence indicators declined
in the past few weeks levels still remained above
those seen in August 2011. We expect these
indicators to reverse sharply now a deal is in place
Equities remains relatively resilient, thus avoiding
any negative wealth effects for consumers
3.2mn 2.4mn
800k 350k
450k
0
1
2
3
4
Federal Gov Employees
Essential Initial "Furloughed" -
off work
Reclassified as 'essential'
Off work
US federal government: after initial shutdown of ~800k non-essential
employees, 350k DOD staff were reclassified as essential
Source: Deutsche Bank Research
Congress deal means workers
Will receive retroactive pay
-70
-60
-50
-40
-30
-20
-10
0
2008 2009 2010 2011 2012 2013
US Economic Confidence: shutdown and gridlock caused sharp
drop, but confidence remained above Aug-2011 levels
3d moving avg.
Source: Gallup, Deutsche Bank Research
Oct-15 shows
rebound as hopes
of a deal rose

Deutsche Bank Research The House View – 18 October 2013, [email protected], +44 207 545 8465
0
10
20
30
40
50
60
70
80
2007 2008 2009 2010 2011 2012 2013
VIX Volatility has diminished in response to recurring systemic threatss
VIX Index
Mar-11 Japan
earthquake
Italian elections
and Cyprus Bailout
Sep/Oct-08:
Financial Crisis:
Lehman, AIG,
TARP
Aug-11 US
downgrade and
debt ceiling crisis Nov-11 Euro
crisis spreads
to Italy / Spain,
2nd Greek
bailout
Greek elections
Apr/May-10 Euro crisis /
1st Greek bailout
US shutdown /
debt ceiling
debate
US Fiscal Cliff Tapering
10
Markets have become less volatile around systemic threats, as investors anticipate an official response to contain tail risks
Source: Bloomberg Finance LP, Deutsche Bank Research

Deutsche Bank Research The House View – 18 October 2013, [email protected], +44 207 545 8465
4.0 4.9
5.5 6.2
3.1
4.6
6.2
7.6
8.3
10.0
7.5
7.2
2.2
1.3 3.4
4.5
17.6
20.8
22.6
25.5
0
5
10
15
20
25
30
2000 2013 2025 2035
Net Interest Discretionary (including defense)
Medicare + Medicaid Social Security
US government spending is forecast to increase by approximately 5% of GDP by 2035
% of
GDP
Source: CBO, Deutsche Bank Research
Net Interest
3.5x
Change
since 2013
Discretionary
0.7x
Medicare +
Medicaid
1.7x
Social Security
1.3x
US government has a long-
term fiscal problem that
translates into recurring
fiscal deficits
On the spending side, the
Congressional Budget
Office estimates that
Government spending will
rise to over 25% of GDP by
2035, up from ~20% today
Discretionary spending
(including defense) will
come down, but will be
more than offset by
increases in health
(Medicare + Medicaid),
Social Security and cost of
debt
11
The US fiscal deal resolved the immediate issues (shutdown, debt ceiling), but long-term budget concerns remain unaddressed

Deutsche Bank Research The House View – 18 October 2013, [email protected], +44 207 545 8465
The US continues to follow the European approach to crisis resolution: brinkmanship followed by short-term fixes
12
“Governments and central banks have to take out the catastrophic
risk from markets, they have to definitively remove the threat of
…cascading defaults”
Tim Geithner, US Treasury Secretary, September 2011
"The sooner [leaders] act, the more decisive and concrete their
actions, the sooner people and markets will regain some
confidence, the cheaper the costs of cleanup will be down the
road.”
President Obama, June 2012
At the height of the euro crisis in 2011-2012, US
authorities urged their European counterparts to
make the necessary decisions to end uncertainty
− Europe’s ‘muddle through’ incremental
approach was criticised
US has taken a similar approach with its fiscal
negotiations, with successive deals only buying
time, multiplying deadlines and showdowns
Current deal is yet another example, with the
next installments on 13-Dec and 14-Jan
This episode was the third time since 2011 that US political paralysis over fiscal issues has dominated global markets
3-May-2011: Geithner: "Debt ceiling to be
breached by 2-Aug"
May -Jul 2011: “Grand Bargain” negotiations to reduce deficit by USD4tn
in 10 Y
1-Aug-2011: Debt ceiling lifted, introduction of
budget sequester and bipartisan Supercom-
mittee on LT fiscal reform
‘Do as I say, not as I do’ – comments on the euro crisis
5-Aug-2011: S&P strips US off AAA rating
21-Nov-2011: Super-committee fails to agree
on long-term fiscal reform, automatic
sequester cuts to kick-in in Jan-2013
Kicking the can down the road
Nov-Dec-2012: Fiscal cliff negotiations. Failure to reach agreement by
31-Dec, fiscal cliff kicks-in on 1-Jan
1-Jan-2013: 11th hour deal undoes fiscal cliff,
suspends sequester to 1-Mar
4-Feb-2013: Debt ceiling suspended until 18-May-
2013
19-May-2013: Debt ceiling reinstated, revised projection puts deadline
in Oct-2013
Through Sep: Budget / debt ceiling negotiations
25-Sep-2013: Lew*: "Debt ceiling to be
breached by 17-Oct"
1-Oct-2013: Failure to reach agreement on budget / debt ceiling
Government shuts down
17-Oct-2013: 11th hour deal. CR extended for 3
months, debt ceiling suspended to 7-Feb Government reopens
Note: (*) Current US Treasury Secretary Jack Lew
Episode 1: 2011 debt ceiling Episode 2: 2013 fiscal cliff Episode 3: 2013 budget and debt ceiling

Deutsche Bank Research The House View – 18 October 2013, [email protected], +44 207 545 8465
13
However this episode inflicted deep political wounds thus raising chances for meaningful progress in upcoming negotiations
“I guess that we could get lower in the polls. We’re down to
blood relatives and paid staffers now.”
Sen. John McCain (Republican, Arizona), Oct 13
“We fought the good fight; we just didn’t win.”
House Speaker Boehner (Republican), Oct 16
63%
70%
74%
56%
61% 61%
50% 51% 53%
Sept. 25-29 Oct. 2-6 Oct. 9-13
(Dis)approval ratings: political brinkmanship has cost all players,
although Republicans have suffered most
Republicans in Congress
Democrats in Congress
Barack Obama
Source: Washington Post-ABC News, Deutsche Bank Research
% disapproving of the way …is handling
negotiations over the federal budget
Despite repeated episodes of political deadlock,
public opinion was overwhelmingly negative this
time
− Approval ratings fell throughout the shutdown,
with Republicans hit the hardest
Chances for meaningful progress on upcoming
budget negotiations have improved significantly
− The difference between the two parties on
spending levels narrowed substantially during
the CR and debt ceiling negotiations
− Popular patience with intransigence in
Washington is wearing thin
− In an election year the cost of displeasing voters
is higher (mid-term elections Nov 2014)
Another government shutdown and debt ceiling
showdown next year seem less likely “The debt ceiling is a political weapon of mass destruction
and the threat of it is huge just like a nuclear weapon would
be a huge threat. (…) Don't use something that can destroy
a 237 year old asset of the United States.”
Warren Buffet, Oct 16

Deutsche Bank Research The House View – 18 October 2013, [email protected], +44 207 545 8465
14
In this context, the Fed should begin tapering by March 2014
US Economics Daily Note - 10th Oct 2013
0
1
2
3
4
5
6
7
8
132
134
136
138
140
142
144
146
148
2000 2002 2004 2006 2008 2010 2012
Civilian employment (lhs)
Civilians unemployed >6 months (rhs)
Some drivers behind unemployment are still weak, e.g., total
employment and number of unemployed for over 6 months
Source: BLS, Haver Analytics, Deutsche Bank Research
Million Million
FOMC Taper? Comment
Oct 29-30 Fed not more comfortable now than in Sep
Dec 17-18 ?
Possible, but “burden of proof” for data
high, e.g., payrolls above +200k
Chances of real long-term fiscal resolution
by December have risen
Jan 28-29 ? Possible; data will be stronger, political
uncertainty likely reduced
Last meeting under Bernanke
Mar 18-19
Market
pricing*
Fed publishes new forecasts, Chair holds
press conference – making it easy to
explain / justify taper
Note: (*) Based on US 10Y real curve
In September, the Fed’s decision not to taper was a
close call, and many FOMC members expected to
taper by year-end
As of now, the Fed’s reading of the recovery is no
clearer than in September
− Key data delayed due to shutdown (e.g.,
payrolls, inflation)
− Some data softness, including initial claims
− Uncertainty as to extent of shutdown impact
Yellen likely to remain concerned that some drivers
behind unemployment are still weak
− Labour participation at lowest since 1978, total #
of people employed still below pre-crisis
− Workers unemployed for over 6m still high
Fed will most likely begin tapering by March 2014,
barring negative shocks
− A December or January taper will require
significant data strength (labour market /
housing) and good progress on fiscal matters
− We expect QE to end in H2 2014

Deutsche Bank Research The House View – 18 October 2013, [email protected], +44 207 545 8465
Global economy continues to gain traction
− Global PMI points to global GDP growth of 4%
qoq saar in Q3 vs. +3.3% in Q2 – which was
already the best growth since the start of 2012
− PMIs for all major economies in expansion
US recovery remains robust, with both hard and
soft data generally pointing to faster growth
− Some mixed data (e.g., consumer confidence,
vehicle sales) but not a major cause for concern
Europe: signals of gradual recovery remain
− PMIs accelerated in September, with recovery
evident in both the core and periphery
− On the negative side, high employment and
subdued credit growth offer reasons for caution
EM, especially export oriented economies, to
benefit strongly from acceleration of global growth
and delay of Fed tapering
15
We expect global growth will continue to accelerate, led by the US and Europe
-8
-6
-4
-2
0
2
4
6
8
30
35
40
45
50
55
60
2001 2003 2005 2007 2009 2011 2013
Global Mfg PMI
Global GDP (qoq% saar, rhs)
Global manufacturing PMI points to annualised GDP growth of 4% in
Q3 2013
Source: IHS Global Insights, Deutsche Bank Research
Accelerating
PMIs suggest
stronger GDP
45
50
55
60
Jan-12 May-12 Sep-12 Jan-13 May-13 Sep-13
Rising composite PMIs (3mma) show that growth momentum is
strong, with major economies in expansion territory
Source: Haver Analytics, Deutsche Bank Research
US
Global
Eurozone
China
Expansion
Contraction

Deutsche Bank Research The House View – 18 October 2013, [email protected], +44 207 545 8465
Some data points have disappointed recently, but
we do not see a major cause for concern, e.g.,
− Services ISM -4.2pt mom in September, but level
remains consistent with above consensus growth
− Consumer, business confidence down in October
– but only marginally
Impact of the budget / debt ceiling debate on the
economy to be immaterial
The reduction in the pace of fiscal austerity in 2014
will further support growth – especially if part of the
sequester* is reduced during upcoming budget
negotiations
The consumer sector continues to contribute to the
recovery as deleveraging approaches completion
In housing, underlying drivers of the recovery are
robust enough to withstand rise in mortgage rates
16
In the US, mixed data and uncertainty surrounding the fiscal debate have raised concerns, but underlying strength is intact
Note: (*) Automatic spending cuts that came into force on 1-Jan-2013 as part of the fiscal cliff negotiations
-0.3
-2.1
-3.0
-0.2
1.0 1.1
2.3
0.7 0.4
-4
-3
-2
-1
0
1
2
3
2007 2008 2009 2010 2011 2012 2013 2014 2015
US fiscal stance (change in cyclically adjusted primary balance)
Fiscal tightening will continue in 2014, but at a much reduced pace
% of GDP
Source: IMF, Deutsche Bank Research
Positive = fiscal tightening
Negative = fiscal easing
Austerity will continue in
2014, but the incremental
tightening will be 1.6pp of
GDP less than in 2013
48
50
52
54
56
58
60
2010 2011 2012 2013
Manufacturing
Services
US ISM: data continues to point to robust growth. Decline in
Services ISM not a concern, September reading still very strong
Index
Source: Haver Analytics, Deutsche Bank Research
<50: contraction
>50: expansion

Deutsche Bank Research The House View – 18 October 2013, [email protected], +44 207 545 8465
The European recovery continues
− Euro-area composite PMI improved to 52.2 in
September, the highest since Jun-2011
− Recovery broad-based, with strength in both
core and periphery
− The four largest countries of the eurozone are
all expected to post positive growth in H2 –
ending recession in Italy and Spain
There are four main drivers of the recovery
− Global growth: export PMIs >50 in four largest
eurozone economies – 1st time since Sep-2011
− Slower austerity: fiscal stance of +0.3% in 2014,
vs. +0.8% in 2013 – i.e., austerity continues, but
incremental tightening less than in 2013
− Less scope for crisis escalation: threat of ECB
intervention (OMT) keeps yields in check
− Uptick in credit impulse: credit supply to be
consistent with 2% GDP growth in 2014, well
above our own and consensus forecasts
17
Europe continues to recover from its longest recession on record, on rising exports and slowing austerity
Focus Europe - The bank/sovereign nexus 11 Oct 2013
30
35
40
45
50
55
60
65
2006 2007 2008 2009 2010 2011 2012 2013
Germany+France Italy+Spain+Ireland
Euro Composite PMIs point to a broad based recovery across both
the core and the periphery
Index
Source: Haver Analytics, Deutsche Bank Research
<50: contraction
>50: expansion
0.8
0.3
-2.5
-2.0
-1.5
-1.0
-0.5
0.0
0.5
1.0
1.5
2001 2003 2005 2007 2009 2011 2013 2015 Source: Deutsche Bank Research
Slower austerity will support the recovery and enable stronger
growth in 2014
Fiscal Stance
(change in structural primary budget balance)
% of GDP
Forecast Positive = fiscal tightening
Negative = fiscal easing
Austerity will continue in
2014, but the incremental
tightening will be 0.5pp of
GDP less than in 2013

Deutsche Bank Research The House View – 18 October 2013, [email protected], +44 207 545 8465
18
While political concerns remain, they have become more manageable in recent months, especially in Spain and Italy
Greece: Pressured to stay on course
New PSI unlikely
Discussions on OSI* and additional
funding will not occur until mid 2014
when Greece has a primary surplus
IMF wants OSI but EU is resisting.
Without a major crisis, OSI-lite is
more likely, with maturity extensions
rather than writedowns
Germany: Merkel-led grand coalition with
SPD to be announced by mid-/late-November
Expect a CDU/SPD grand coalition, with
talks likely to last until mid-/late- November
Compromise to include the introduction of a
minimum wage (SPD demand) and no rise
in income tax (CDU demand)
Constitutional court ruling on OMT unlikely
to deliver a materially negative outcome
Spain: Political situation is manageable
following a turbulent summer
Questions over Rajoy’s involvement in a
funding scandal have weakened him, but…
…he still controls the majority in parliament
…near-term election unlikely as major
parties would lose out to fringe parties
Portugal: Weaker government, funding
uncertainty to linger
Austerity eroding support for adjustment
Constitutional court ruling on austerity
measures could impact exit negotiations /
government stability
Sovereign fully funded through year-end,
but future funding uncertainty will linger
Expect no PSI beyond voluntary rollover
of domestically held sovereign debt
Under Troika programme
Pursuing adjustment programme
Italy: Scope for material crisis escalation in the next
18-24 months has receded
Berlusconi losing control of PDL but will remain
an important right-wing figure
Unlikely to see progress on economic reforms
Economy to benefit from payment of state arrears
in 2014
Note: (*) Haircuts on debt held by official sector i.e., EFSF loans
Ireland: Crisis success story, but
potential uncertainty in 2014
Exit bailout programme in Dec-2013
and roll onto precautionary support
Having injected 40% of GDP in
banks, mid-2014 EBA stress test is
next significant challenge

Deutsche Bank Research The House View – 18 October 2013, [email protected], +44 207 545 8465
25
30
35
40
45
50
55
60
65
70
-30
-20
-10
0
10
20
30
40
50
2003 2005 2007 2009 2011 2013
EM
US,EU orders (rhs)
Source: Deutsche Bank Research
US & EU orders vs. EM exports: US and EU growth should help lift
EM exports
% yoy, 3mma 3mma,
6M lead
The Fed’s decision not to taper asset purchases in
September was a welcome respite for EMs
− EM currencies have stabilised against the USD
after the “taper shock”
− The hope is that when tapering does begin, EMs
will be on a firmer footing and better able to
withstand the pain of higher interest rates
EMs will also benefit from import demand from DMs
− From Q1 2009 to Q2 2013, exports were a net
drain on growth for most EMs
− Most growth in EM economies in this period was
due to public and private spending
− However, the recovery in the US and EU
suggests higher export growth is coming to EMs
in the next few months
− This will help export oriented economies, and
countries like China ease the transition to a
more consumption-led economy
19
EM are enjoying some respite after a turbulent summer. Export traction from the US and Europe recovery should support growth
-20
-10
0
10
20
30
40
50
BRA IND RUS* CHN**
Pr.cons. Pub.cons. Invest. Next exp. GDP
* Q2-2009
**Q4-2008/ Q4-2012/ breakdown of private/ public consumption not available
Source: National statistical offices, Haver Analytics, Deutsche Bank Research
Exports were a drag on BRIC GDP growth between Q1-2009 and
Q2-2013
% pts

Deutsche Bank Research The House View – 18 October 2013, [email protected], +44 207 545 8465
We expect more differentiation among EM
economies going forward
− Not all countries suffered from the summer
“taper shock” – e.g., some EMFX are up since
May 1, reflecting more positive investor
sentiment
− Broadly, countries with high current account
imbalances and inflation have fared worse
− Further tightening of liquidity would put more
pressure on these countries ( e.g., India,
Indonesia, Turkey, South Africa and Brazil)
− We expect Mexico, Philippines, South Korea
and some Central Europe countries to perform
better
Overall, we do not expect significant divestment
from EM assets, just more differentiation
20
EM will continue to benefit from inflows but going forward more differentiation is expected
Indonesia
India Turkey
Brazil
South Africa
Mexico
Philippines Korea
Taiwan
Poland
Hungary
-8
-4
0
4
8
12
0 1 2 3 4 5 6 7 8
Source: Deutsche Bank Research
Some countries are more vulnerable than others on balance of
payments and inflation indicators
CA, % GDP
Consumer prices (% avg, 2013F)
Better positioned
More vulnerable
3.9% 3.1% 2.8% 2.7%
0.9% 0.3%
-0.3% -1.1%
-3.1% -3.9%
-4.6% -4.9% -5.1%
-7.3%
-8.7% -9.3%
-11.0%
-12.5% -14% -12% -10%
-8% -6% -4% -2% 0% 2% 4% 6%
Since May 1st
Several EM currencies have depreciated significantly against USD
*As of Oct 16, COB
Source: Bloomberg Finance LP, Deutsche Bank Research
Deutsche Bank Research The House View – 18 October 2013, [email protected], +44 207 545 8465
-10
-5 -2 0
6 9
25
63
12 14
11 13
11
30
21
9
-20
-10
0
10
20
30
40
50
60
70
DA
X
CA
C
UK
SX
6E
S&
P
MIB
IBE
X
TO
PIX
2013F
2014F
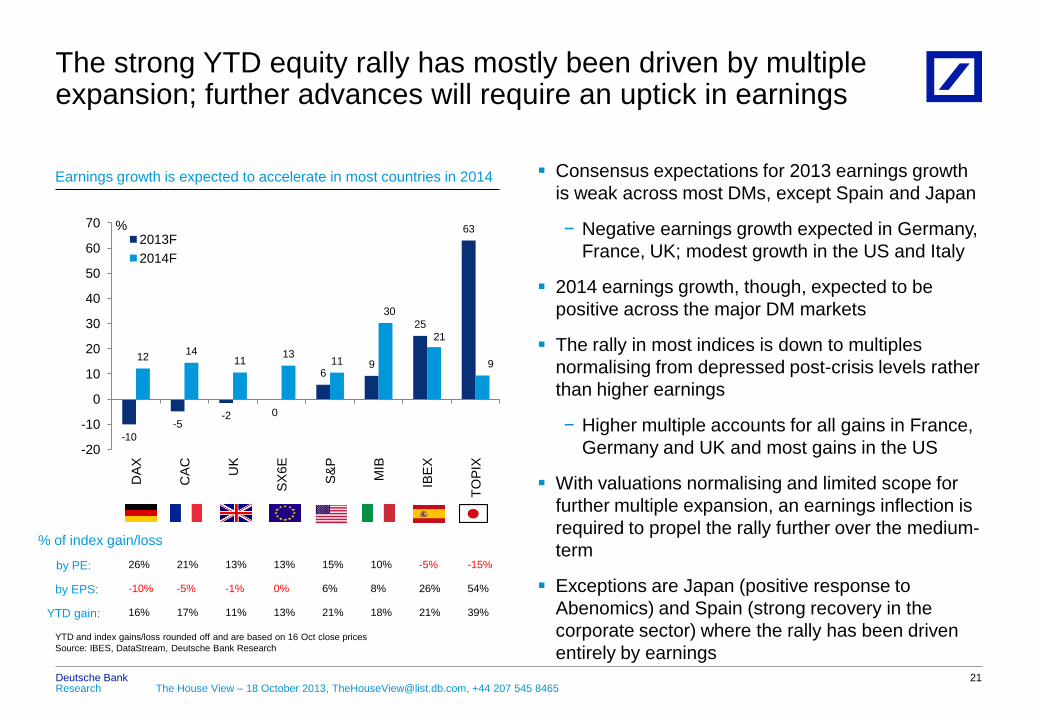
Earnings growth is expected to accelerate in most countries in 2014
YTD and index gains/loss rounded off and are based on 16 Oct close prices
Source: IBES, DataStream, Deutsche Bank Research
%
Consensus expectations for 2013 earnings growth
is weak across most DMs, except Spain and Japan
− Negative earnings growth expected in Germany,
France, UK; modest growth in the US and Italy
2014 earnings growth, though, expected to be
positive across the major DM markets
The rally in most indices is down to multiples
normalising from depressed post-crisis levels rather
than higher earnings
− Higher multiple accounts for all gains in France,
Germany and UK and most gains in the US
With valuations normalising and limited scope for
further multiple expansion, an earnings inflection is
required to propel the rally further over the medium-
term
Exceptions are Japan (positive response to
Abenomics) and Spain (strong recovery in the
corporate sector) where the rally has been driven
entirely by earnings
21
The strong YTD equity rally has mostly been driven by multiple expansion; further advances will require an uptick in earnings
% of index gain/loss
by PE: 26% 21% 13% 13% 15% 10% -5% -15%
by EPS: -10% -5% -1% 0% 6% 8% 26% 54%
YTD gain: 16% 17% 11% 13% 21% 18% 21% 39%
Deutsche Bank Research The House View – 18 October 2013, [email protected], +44 207 545 8465
-30
-10
10
30
50
70 S&P 500 S&P 500 non-Financials Financials
* 3Q13 based on actual for reported and estimate for others
Source: First Call, IBES, Deutsche Bank
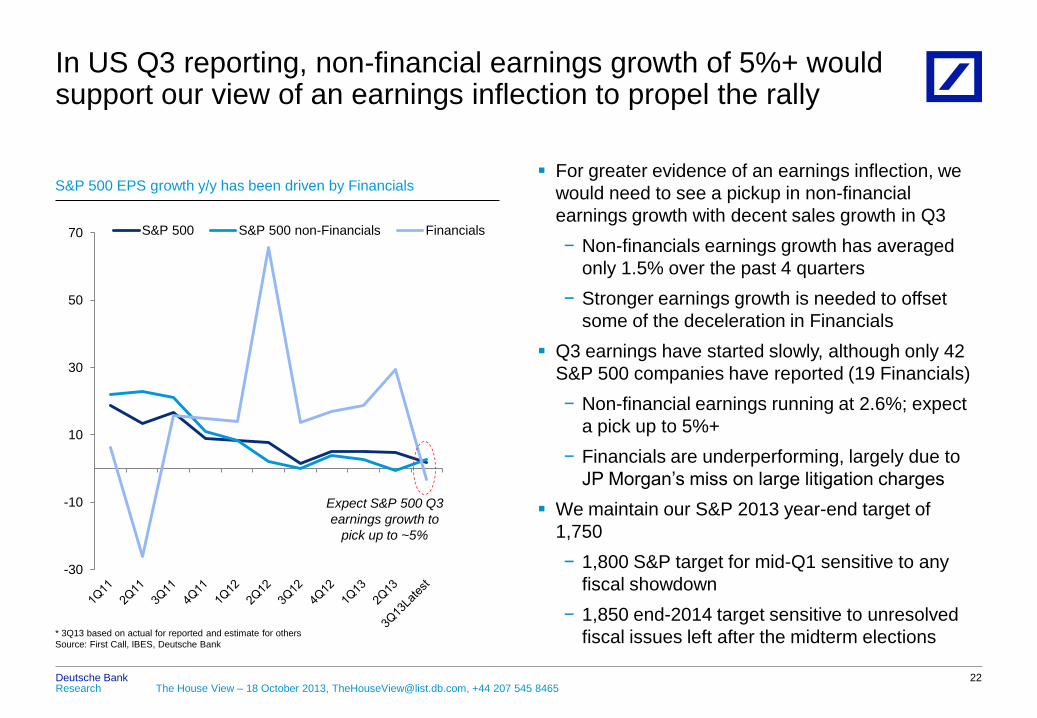
S&P 500 EPS growth y/y has been driven by Financials
Expect S&P 500 Q3
earnings growth to
pick up to ~5%
For greater evidence of an earnings inflection, we
would need to see a pickup in non-financial
earnings growth with decent sales growth in Q3
− Non-financials earnings growth has averaged
only 1.5% over the past 4 quarters
− Stronger earnings growth is needed to offset
some of the deceleration in Financials
Q3 earnings have started slowly, although only 42
S&P 500 companies have reported (19 Financials)
− Non-financial earnings running at 2.6%; expect
a pick up to 5%+
− Financials are underperforming, largely due to
JP Morgan’s miss on large litigation charges
We maintain our S&P 2013 year-end target of
1,750
− 1,800 S&P target for mid-Q1 sensitive to any
fiscal showdown
− 1,850 end-2014 target sensitive to unresolved
fiscal issues left after the midterm elections
22
In US Q3 reporting, non-financial earnings growth of 5%+ would support our view of an earnings inflection to propel the rally

Deutsche Bank Research The House View – 18 October 2013, [email protected], +44 207 545 8465
23
We expect the recent outperformance of European equities over their US counterparts will be short lived
European equities have outperformed US equities
by 8% since July, following a record 15 straight
weeks of inflows into European equities – improving
European data, US fiscal concerns
Expect this trend to reverse and US equities to
resume their long-run outperformance
− Weaker European earnings explain Europe’s
45% underperformance since 2010
− Relative valuations show European equities
near top of their trading range since the early
2000s – European valuations reflect above
consensus earnings growth
− Stronger US growth outlook relative to more
balanced European picture
Long US over Europe for stocks with global growth
exposure via Tech, Staples, Materials, Industrials
− Valuations in Europe relatively high as investors
favoured less-EU sectors during the crisis
Long Europe over US for stocks with domestic
exposure Financials, Discretionary, Telco, Utilities
− Sectors still trade at a notable discount vs. US
-0.4%
-0.2%
0.0%
0.2%
0.4%
0.6%
Oct-12 Jan-13 Apr-13 Jul-13
Weekly flows as a % of NAV 10-week average flows as a % of NAV
Western Europe equities have seen inflows for 15 straight weeks
60 70 80 90
100 110 120 130
2005 2007 2009 2011 2013
Relative price performance
Relative earnings
EMU vs. US price and earnings (Dec 2002 = 100)
Relative price performance has very closely tracked earnings
Europe underperformed US by 45% since
2010, driven by weaker earnings
Since July, EMU
equities outperformed
US by 8%
-4.0
-3.0
-2.0
-1.0
2005 2007 2009 2011 2013
EMU minus US NTM PE Average
Source: EPFR, IBES, Deutsche Bank Research
EMU relative to US 12m forward P/E
Relative valuations* show European equities near top of their trading range since the early 2000s
Europe: More Expensive Than It Looks 1 Oct 2013
Note: (*) Based on US 10Y real curve

Deutsche Bank Research The House View – 18 October 2013, [email protected], +44 207 545 8465
Asset price views
Asset Class View Rationale
Equities
US: bullish Bullish view on the back of improving macro backdrop, EPS, DPS and P/E expansion
Delay in tapering and low rates provide further support for equities
Q3 earnings showing growth (esp. in non-financials) will increase comfort in our targets
Europe: bullish Recovering growth and stronger global economy to translate into upward earnings revisions
Japan: bullish Abenomics could lead to a doubling of Japanese equities on a weaker JPY, higher
operational leverage and improving domestic economy
EM: least preferred vs. US
and Europe Relative to DM, EM to continue multi-year derating amid structural weakness, poor cash flow
generation and unwinding of central bank induced inflows – but delay in tapering is positive
Rates Neutral rates in short-term,
but fundamentally bearish
Fundamentally, as data strength continues, as we expect, on the back of favourable fiscal
and credit dynamics, the Fed will proceed with its exit strategy and rates will rise
Tapering delay will keep treasuries supported
FX Long USD
Entering a multi-year uptrend as a result of US growth resurgence, China economic
rebalancing, higher real yields and change in USD / risk correlation (to positive correl.)
Market substantially short USD
Sustained dollar strength will be dependent on US data
Credit Tapering delay favours
asset class
Asset class has repriced, currently trading at levels seen pre- signalling of tapering (22-May)
Stronger data will be positive for credit in long-term (fewer default rates)
In short-term, we expect further tightening as US fiscal deal brings renewed appetite for
carry trades – especially in higher beta; USD to outperform EUR credit
Tapering should see a widening of spreads as liquidity gets withdrawn
EM Long EM IG sovereign
credit
EM should benefit from returning risk appetite and ongoing respite from delayed QE tapering
EM IG sovereign credit has most value and is most likely to benefit from a return in fund
inflows. Favour high quality credits (Mexico, Philippines, Russia, Colombia)
Commodities Bearish crude oil Easing geopolitical risk and fading of supply disruptions negative for oil
24

Deutsche Bank Research The House View – 18 October 2013, [email protected], +44 207 545 8465
2 Special report – Japan: The Great Escape
1 The House View – Reason Prevails

Deutsche Bank Research The House View – 18 October 2013, [email protected], +44 207 545 8465
26
Japan has endured nearly two lost decades of growth
400
800
1200
1600
2000
2400
2800
3200
1981 1986 1991 1996 2001 2006 2011
Japanese equities remain significantly below their all-time peak as well as 2007 high
Source: Haver Analytics, Deutsche Bank Research
Topix Index
28
82 85 86 89 90 103
117 124 127
157
238
0
50
100
150
200
250 General Govt debt % of GDP (2012)
The lost decades have left Japan with the highest gross public debt among OECD countries
Source: IMF, Deutsche Bank Research
-10 -8 -6 -4 -2 0 2 4 6 8
10
88 90 92 94 96 98 00 02 04 06 08
GDP %YoY
Japan GDP growth was broadly range-bound between 1992 and 2008 after its epic asset bubble burst
Source: Haver Analytics, Deutsche Bank Research
-5
0
5
10
15
20
25
30
35
40
1996 2000 2004 2008 2012
Japan US
UK Germany
France
Japan has had the lowest cumulative GDP growth since 1996 of major developed economies
Source: Haver Analytics, Deutsche Bank Research
%
Japan +11%
US +39%
UK +33%
Fra +26%
Ger +22%
~60% below
all-time peak
~30% below
2007high

Deutsche Bank Research The House View – 18 October 2013, [email protected], +44 207 545 8465
-1
0
1
2
3
4
5
6
90 93 96 99 02 05 08 11
Real GDP 5Y trend
Real interest rate (10Y JGB - CPI) 5Y trend
In Japan, real rates exceeded real GDP growth, encouraging saving, discouraging spending and investment, underpinning deflation
Source: Haver Analytics, Deutsche Bank Research
Japan’s economy has not grown in nominal terms
since 1997
− Nominal GDP in 2012 was 10% lower than in
1997
Policy errors in response to the bursting of the
stock and land price bubble in the 1990s, caused
persistent deflation
− Policymakers kept real borrowing costs high
instead of using monetary policy to boost growth
− Banks were not recapitalised quickly enough,
impeding lending
− Fiscal tightening was premature (esp. in 1997)
As prices fell, the economy steadily contracted
− Falling prices are problematic because
consumers, expecting prices to fall, spend less
− Firms become reluctant to borrow and invest
− This creates a vicious circle of sagging demand
leading to more deflation leading to less demand
27
The Japanese economy has not grown in nominal terms since 1997 due to deflation
90
92
94
96
98
100
102
97 98 99 00 01 02 03 04 05 06 07 08 09 10 11 12
CPI: All Items excluding Food and Energy (SA, 11/97=100)
Deflation has seen core CPI trending downward since late ‘97
Source: Haver Analytics, Deutsche Bank Research

Deutsche Bank Research The House View – 18 October 2013, [email protected], +44 207 545 8465
PM Abe was elected in 2012 on a platform to end
deflation and revive Japan. This was spurred by:
− Impact of earthquake and tensions with China
encouraged a shift to a more activist policy
− Success of Fed and ECB crisis intervention
prompted a rethink of BoJ policy
− Decline in corporate profitability (i.e. Sony,
Sharp) raised concerns across Japan Inc.
Abenomics has three arrows:
− Monetary easing, to lower real interest rates and
approach a new BoJ inflation target of 2%
− Fiscal stimulus, to boost consumption
− Growth initiatives, to boost potential output
By increasing investment and consumption, the BoJ
aims to jump-start the economy
To reduce the debt burden, real GDP growth must
exceed real interest rates for a sustained period
i.e., if real GDP is 1% and real borrowing costs are
0%, debt/GDP falls over time
28
Abenomics is a policy to end deflation using a combination of monetary easing, fiscal stimulus and growth initiatives
Japan is entering a new steady state of positive inflation
Expected Steady
State
1998-2012
CPI, Overall (% yoy) 1.0% -0.22%
Nominal GDP (% yoy) 2.0% -0.6%
10-year JGB yield (%) 1.0% 1.4%
Note: Excluding the effect of the one-time consumption tax hike for new steady state
Source: MIC, Cabinet Office, BoJ, Deutsche Bank Research
Abenomics: Japan has successfully deployed monetary and fiscal
stimulus and is beginning to deliver on growth initiatives
Massive expansion of money base
Purchase of long-maturity JGBs
2% inflation target implemented
Supplementary budget for FY 2012
Tax incentives for labour, R&D
Corporate tax cuts
Free trade agreements
Labour, agriculture, health and
energy market deregulation
~
The 3 arrows
Fiscal Stimulus
Monetary Easing
Growth Initiatives

Deutsche Bank Research The House View – 18 October 2013, [email protected], +44 207 545 8465
The BoJ’s QE is massive by any standard
− Its balance sheet will grow by 20% of GDP by
2015
− By contrast, the Fed’s balance sheet has
expanded by 12% of GDP since 2008
The BoJ will buy around 70% of Japan’s gross JGB
issuance, boosting the domestic economy
− As the BoJ adds JGBs to its balance sheet,
private investors (e.g., Japanese insurance
companies and pension funds), will be pushed
into other asset classes, raising prices
− Rising asset prices create a wealth effect, which
encourages spending and increases overall
consumption
− Companies, seeing higher demand, will respond
through increased investment, hiring and wages
This creates a self-reinforcing circle of rising prices,
consumption, investment and growth
29
The Bank of Japan has promised to do “whatever it takes” to beat deflation
0
20
40
60
80
100
120
140
160
180
2007 2008 2009 2010 2011 2012 2013 2014
Fed BoJ
BoJ will increase its balance sheet dramatically over next 2 years
Forecast 100 = Sep 2013
Source: Haver Analytics, Deutsche Bank Research
~70%
86
126
BoJ Demand Gross issuance
BoJ purchases are around 70% of gross JGB issuance
2013-2014 supply and demand outlook (JPY trn)
Note: BoJ figures are from April 2013 to March 2014 (excludes JGB’s <1yr).
Source: Deutsche Bank Research

Deutsche Bank Research The House View – 18 October 2013, [email protected], +44 207 545 8465
30
Abenomics is slowly working - initially in financial markets, but now more convincingly in the domestic economy
65
70
75
80
85
90
95
100
105
110
200
250
300
350
400
450
500
550
1980 1985 1990 1995 2000 2005 2010 2015
Nominal GDP
CPI excl. food and energy (rhs)
Source: Cabinet Office, MIC, Deutsche Bank Research
Now, nominal GDP and prices are set to recover into 2014
JPY trn, saar Index, 2010 = 100
F’cast
96
106
116
126
136
146
156
Jan-13 Apr-13 Jul-13 Oct-13
Japanese equities have risen 40% YTD on expectations that Abenomics will succeed
Japan
Europe
MSCI Indices; 100= Jan 2013
Source: Bloomberg Finance LP, Deutsche Bank Research
US
Abenomics appears to be working, initially in
financial markets
− Equities are up 65% over the past 12 months
− Yen has weakened by 25% since Abe’s election
− Inflation expectations have risen by 100bp since
early 2012
Abenomics has triggered a domestic recovery
− After nearly 20 years of falling nominal GDP,
prices are set to recover in 2013
− Investment/GDP has risen for 3 quarters due to
falling long-term rates and higher asset prices
− Wages began to rise in Q3 2012, though via
bonuses (regular wages are still falling)
− However, we expect 2% nominal wage growth in
the years ahead, a significant change for Japan
− The recovery has been driven by domestic
activity rather than the typical export-led growth

Deutsche Bank Research The House View – 18 October 2013, [email protected], +44 207 545 8465
A common worry is that investors will dump JGBs if
real returns fall
− If JGBs sold off, interest rates would rise,
increasing Japan’s debt-service costs and
risking a sovereign debt crisis
But most of the debt is domestically funded in
contrast to many OECD countries
− The arrangement is stable, has substantial
inertia due to regulation and domestic bias, thus
preventing a sustained sell-off
− Capital flight is unlikely in large, developed,
socially stable economies
Furthermore, the BoJ is committed to stabilising
bond market volatility through asset purchases
− BoJ holdings as a percentage of total JGBs will
expand to 20% by end-2014 from the 16%
projected for end-2013
31
Slightly higher inflation is unlikely to prompt a sovereign debt crisis via domestic capital flight
727
140
Held by financial market
Held by BOJ
The Bank of Japan’s purchases of JGBs adds another major buyer
to the JGB market
Source: Deutsche Bank Research
December 2013 December 2014
747
190
60 58
32 30
5
0 10 20 30 40 50 60 70
Most Japanese debt is held by domestic financial institutions
Source: Haver Analytics, Deutsche Bank Research
% of Govt. Bonds held overseas Share of JGB holding (Q2 2013)
79%
5%
1%
2% 12% Financial Institutions (inc BoJ)
Overseas
Corporates
Households
Others
JPY tn

Deutsche Bank Research The House View – 18 October 2013, [email protected], +44 207 545 8465
0
50
100
150
200
250
300
350
71 74 77 80 83 86 89 92 95 98 01 04 07 10 13
TOPIX (in JPY)
TPX & long USDJPY*
Jan 2001=100
Even if a currency hedged Topix index* doubles, the index would
still be below 2007 levels
Source: Bloomberg Finance LP, Deutsche Bank Research
32
Japanese equities could double and the USD/JPY could reach 120 by 2015
If Abenomics continues to be successful, we
expect the Topix could double in the next few years
− Operational leverage is highest in Japan. For
every 1% revenue growth, earnings go up by
3% (vs. 1% in Europe and the US)
− Further JPY weakness will continue to be a
positive driver for Japanese profits
− Stocks remain cheap. More than 60% of
companies trade on a 'real' Price/Book of less
than 1x
The Yen will continue to remain under pressure
− BoJ easing exerts a powerful downward force
− Japan’s current account surplus has vanished
due to higher fuel imports after the nuclear
shutdown
− Expect USD/JPY at 120 by 2015 from 100 today
70
80
90
100
110
120
130
140
150
160 -1.0
-0.5
0.0
0.5
1.0
1.5
2.0
90 92 94 96 98 00 02 04 06 08 10 12
Narrow basic balance
USDJPY, inverted (rhs)
JPY tn
Source: Haver Analytics, DBResearch. Narrow basic balance is current account balance + FDI flows
An unfavourable external balance is set to drive JPY sharply lower

Deutsche Bank Research The House View – 18 October 2013, [email protected], +44 207 545 8465
33
Japan’s outbound M&A activity has increased substantially and will continue to rise on Abenomics
0
5000
10000
15000
20000
25000
30000
1995 1998 2001 2004 2007 2010 2013
Japanese outbound M&A has risen substantially in recent years
Source: Dealogic, Deutsche Bank Research
Deal value
(USD mn)
M&A picked up after the earthquake in 2011, but
much of it was defensive
− Purchase of energy assets overseas after
shutdown of nuclear supply
− To diversify supply chain away from Japan
Since the introduction of Abenomics, M&A activity
has been much more broad-based
− Purchase of Sprint Nextel by Softbank for USD
36bn; Japan’s largest outbound M&A deal
− Purchase of Thai bank Ayudhya by Mitsubishi
UFJ for USD 6bn
Inbound M&A is also occurring: Applied Materials
Inc. is completing a purchase of Tokyo Electron Ltd.
for USD 9.4bn
Expect M&A activity will continue to rise on
Abenomics
− Japanese firms can borrow much more cheaply
than corporates in other countries (as much as
3-4X lower)

Deutsche Bank Research The House View – 18 October 2013, [email protected], +44 207 545 8465
34
Five common objections to Abenomics can be countered
Objection Arguments in response
1. Japan’s demographics will curb
potential growth
Empirical evidence finds little correlation between demographics and economic
growth in developed economies
In some ways, Japan is returning to its historical norm with a dependency ratio that
prevailed during the mid-20th century
In general, demographic arguments can be too deterministic.
2. As inflation rises, investors will
flee the bond market, triggering a
sovereign debt crisis
Capital flight is unlikely in large and socially stable economies
95% of JGBs are owned by domestic institutions.
The BoJ has signaled its willingness to adjust asset purchases to cap JGB volatility
and curb an excessive rise in yields as long as the government delivers credible
fiscal consolidation
In fact, reflation is the key to debt stabilisation as higher growth leads to higher
government revenues. Yields will eventually rise, but along with growth, as in a
conventional recovery
3. Inflation without wage growth will
cripple household finances
Old people with fixed assets do not gain significantly from Abenomics and may even
lose. However, Japanese households have USD 16tn in assets (half of which is in
deposits and cash) to cushion them through the transition
Presently, deflationary expectations, not income, is the major constraint on spending
4. Structural reforms will not be
pursued with enough vigour to
boost growth
Reforms have failed to boost growth in the past due to a lack of aggregate demand
Conventional macro policy mistakes have been bigger drags on growth than
excessive regulation
5. Sales tax hikes in 2014* will
cause premature fiscal drag (as in
1997)
The 1997 fiscal drag was broader and coincided with the Asian financial crisis and
resurgent domestic financial instability. It was also implement at a time of much
weaker domestic growth than today
* Note: Planned sales tax increase of 3% in 2014

Deutsche Bank Research The House View – 18 October 2013, [email protected], +44 207 545 8465
DB forecasts
35
GDP growth (%)
2012 2013F 2014F 2015F
Global 3.0 2.8 3.7 3.9
US 2.8 1.8 3.2 3.5
Eurozone -0.6 -0.2 1.2 1.4
Germany 0.7 0.5 1.5 1.4
Japan 2.0 1.8 1.0 1.2
UK 0.2 1.5 2.5 2.0
China 7.8 7.8 8.6 8.2
India 4.1 3.7 5.3 6.0
EM (Asia) 5.9 5.9 6.9 6.7
EM (Lat Am) 2.8 2.5 2.9 3.2
EM (CEEMEA) 2.7 2.4 3.4 3.8
EM 4.7 4.5 5.4 5.5
DM 1.4 1.2 2.2 2.4
* CPI (%) forecasts are period averages
CEEMEA: Czech Rep., Hungary, Poland, Russia, Turkey, South Africa, Israel, Romania, Kazakhstan,
Ukraine, Egypt, Saudi Arabia and UAE
LATAM: Argentina, Brazil, Chile, Colombia, Mexico, Venezuela
ASIA: China, Hong Kong, India, Indonesia, Korea, Malaysia, Philippines, Singapore, Taiwan, Thailand
DM: US, Japan, Euro area, UK, Denmark, Norway, Sweden, Canada, Australia, New Zealand, Switzerland
Key market metrics
Current Q4-13 Q1-14 Q3-14
US 10Y yield (%) 2.59 2.50 2.75 3.00
EUR 10Y yield (%) 1.87 2.20 2.30 2.50
EUR/USD 1.367 1.25 1.23 1.18
USD/JPY 97.9 110 111 115
S&P 500 1,733 1,750 - 1,850#
Stoxx 600 316 315* - 345#
Gold (USD/oz) 1,320 1,350 1,350 1,325
Oil WTI (USD/bbl) 100.7 105 105 95
Oil Brent (USD/bbl) 109.0 110 110 105 #end 2014. * reached in September
Current prices as 22.00GMT, 17 October
CPI inflation, YoY* (%)
2012 2013F 2014F 2015F
US 2.1 1.7 2.6 2.3
Eurozone 2.5 1.5 1.4 1.5
Japan 0.0 0.2 2.7 1.5
UK 2.8 2.7 2.2 2.0
China 2.6 2.5 3.5 3.0
India 7.5 5.9 5.4 6.5
Central Bank policy rate (%)
Current Q4-13 Q1-14 Q3-14
US 0-0.25 0-0.25 0-0.25 0-0.25
Eurozone 0.50 0.50 0.50 0.50
Japan 0-0.1 0-0.1 0-0.1 0-0.1
UK 0.50 0.50 0.50 0.50
China 3.00 3.00 3.00 3.25
India 7.50 7.50 7.25 6.75

Deutsche Bank Research The House View – 18 October 2013, [email protected], +44 207 545 8465
Appendix 1 Important Disclosures Additional Information Available upon Request
Analyst Certification
This report covers more than one security and was contributed to by more than one analyst. The views expressed in this report accurately reflect the
views of each contributor to this compendium report. In addition, each contributor has not and will not receive any compensation for providing a specific
recommendation or view in this compendium report. Raj Hindocha/Marcos Arana
Attribution
The Author of this report wishes to acknowledge the contributions made by Shakun Guleria, Pravin Kumar and Varun Narang, employees of Infosys
Technologies Ltd., a third party provider to Deutsche bank offshore research support services.
For disclosures pertaining to recommendations or estimates made on a security mentioned in this report, please see the most recently
published company report or visit our global disclosure look-up page on our website at
http://gm.db.com/ger/disclosure/DisclosureDirectory.eqsr.
36

Deutsche Bank Research The House View – 18 October 2013, [email protected], +44 207 545 8465
37
Regulatory Disclosures
1. Important Additional Conflict Disclosures
Aside from within this report, important conflict disclosures can also be found at https://gm.db.com/equities under the “Disc losures Lookup” and “Legal” tabs. Investors are strongly
encouraged to review this information before investing.
2. Short-Term Trade Ideas Deutsche Bank equity research analysts sometimes have shorter-term trade ideas (known as SOLAR ideas) that are consistent or inconsistent with Deutsche Bank’s existing longer term
ratings. These trade ideas can be found at the SOLAR link at http://gm.db.com.
3. Country-Specific Disclosures
Australia and New Zealand: This research, and any access to it, is intended only for "wholesale clients" within the meaning of the Australian Corporations Act and New Zealand Financial
Advisors Act respectively.
Brazil: The views expressed above accurately reflect personal views of the authors about the subject company(ies) and its(their) securities, including in relation to Deutsche Bank. The
compensation of the equity research analyst(s) is indirectly affected by revenues deriving from the business and financial transactions of Deutsche Bank. In cases where at least one Brazil
based analyst (identified by a phone number starting with +55 country code) has taken part in the preparation of this research report, the Brazil based analyst whose name appears first
assumes primary responsibility for its content from a Brazilian regulatory perspective and for its compliance with CVM Instruction # 483
EU countries: Disclosures relating to our obligations under MiFiD can be found at http://www.globalmarkets.db.com/riskdisclosures.
Japan: Disclosures under the Financial Instruments and Exchange Law: Company name - Deutsche Securities Inc. Registration number - Registered as a financial instruments dealer by the
Head of the Kanto Local Finance Bureau (Kinsho) No. 117. Member of associations: JSDA, Type II Financial Instruments Firms Association, The Financial Futures Association of Japan,
Japan Securities Investment Advisers Association. This report is not meant to solicit the purchase of specific financial instruments or related services. We may charge commissions and fees
for certain categories of investment advice, products and services. Recommended investment strategies, products and services carry the risk of losses to principal and other losses as a
result of changes in market and/or economic trends, and/or fluctuations in market value. Before deciding on the purchase of financial products and/or services, customers should carefully
read the relevant disclosures, prospectuses and other documentation. "Moody's", "Standard & Poor's", and "Fitch" mentioned in this report are not registered credit rating agencies in Japan
unless “Japan” or "Nippon" is specifically designated in the name of the entity.
Malaysia: Deutsche Bank AG and/or its affiliate(s) may maintain positions in the securities referred to herein and may from t ime to time offer those securities for purchase or may have an
interest to purchase such securities. Deutsche Bank may engage in transactions in a manner inconsistent with the views discussed herein.
Russia: This information, interpretation and opinions submitted herein are not in the context of, and do not constitute, any appraisal or evaluation activity requiring a license in the Russian
Federation.
Risks to Fixed Income Positions Macroeconomic fluctuations often account for most of the risks associated with exposures to instruments that promise to pay f ixed or variable interest rates. For an investor that is long fixed
rate instruments (thus receiving these cash flows), increases in interest rates naturally lift the discount factors applied to the expected cash flows and thus cause a loss. The longer the
maturity of a certain cash flow and the higher the move in the discount factor, the higher will be the loss. Upside surprises in inflation, fiscal funding needs, and FX depreciation rates are
among the most common adverse macroeconomic shocks to receivers. But counterparty exposure, issuer creditworthiness, client segmentation, regulation (including changes in assets
holding limits for different types of investors), changes in tax policies, currency convertibility (which may constrain currency conversion, repatriation of profits and/or the liquidation of
positions), and settlement issues related to local clearing houses are also important risk factors to be considered. The sensitivity of fixed income instruments to macroeconomic shocks may
be mitigated by indexing the contracted cash flows to inflation, to FX depreciation, or to specified interest rates – these are common in emerging markets. It is important to note that the index
fixings may -- by construction -- lag or mis-measure the actual move in the underlying variables they are intended to track. The choice of the proper fixing (or metric) is particularly important
in swaps markets, where floating coupon rates (i.e., coupons indexed to a typically short-dated interest rate reference index) are exchanged for fixed coupons. It is also important to
acknowledge that funding in a currency that differs from the currency in which the coupons to be received are denominated carries FX risk. Naturally, options on swaps (swaptions) also bear
the risks typical to options in addition to the risks related to rates movements.

Deutsche Bank Research The House View – 18 October 2013, [email protected], +44 207 545 8465
38
Global Disclaimer The information and opinions in this report were prepared by Deutsche Bank AG or one of its affiliates (collectively "Deutsche Bank"). The information herein is believed to be reliable and has been obtained from public sources believed to be reliable.
Deutsche Bank makes no representation as to the accuracy or completeness of such information.
Deutsche Bank may engage in securities transactions, on a proprietary basis or otherwise, in a manner inconsistent with the view taken in this research report. In addition, others within Deutsche Bank, including strategists and sales staff, may take a view
that is inconsistent with that taken in this research report.
Opinions, estimates and projections in this report constitute the current judgment of the author as of the date of this report. They do not necessarily reflect the opinions of Deutsche Bank and are subject to change without notice. Deutsche Bank has no
obligation to update, modify or amend this report or to otherwise notify a recipient thereof in the event that any opinion, forecast or estimate set forth herein, changes or subsequently becomes inaccurate. Prices and availability of financial instruments are
subject to change without notice. This report is provided for informational purposes only. It is not an offer or a solicitation of an offer to buy or sell any financial instruments or to participate in any particular trading strategy. Target prices are inherently
imprecise and a product of the analyst judgment.
As a result of Deutsche Bank’s March 2010 acquisition of BHF-Bank AG, a security may be covered by more than one analyst within the Deutsche Bank group. Each of these analysts may use differing methodologies to value the security; as a result, the
recommendations may differ and the price targets and estimates of each may vary widely.
In August 2009, Deutsche Bank instituted a new policy whereby analysts may choose not to set or maintain a target price of certain issuers under coverage with a Hold rating. In particular, this will typically occur for "Hold" rated stocks having a market cap
smaller than most other companies in its sector or region. We believe that such policy will allow us to make best use of our resources. Please visit our website at http://gm.db.com to determine the target price of any stock.
The financial instruments discussed in this report may not be suitable for all investors and investors must make their own informed investment decisions. Stock transactions can lead to losses as a result of price fluctuations and other factors. If a financial
instrument is denominated in a currency other than an investor's currency, a change in exchange rates may adversely affect the investment. Past performance is not necessarily indicative of future results. Deutsche Bank may with respect to securities
covered by this report, sell to or buy from customers on a principal basis, and consider this report in deciding to trade on a proprietary basis.
Derivative transactions involve numerous risks including, among others, market, counterparty default and illiquidity risk. The appropriateness or otherwise of these products for use by investors is dependent on the investors' own circumstances including their
tax position, their regulatory environment and the nature of their other assets and liabilities and as such investors should take expert legal and financial advice before entering into any transaction similar to or inspired by the contents of this publication.
Trading in options involves risk and is not suitable for all investors. Prior to buying or selling an option investors must review the "Characteristics and Risks of Standardized Options," at http://www.theocc.com/components/docs/riskstoc.pdf . If you are unable
to access the website please contact Deutsche Bank AG at +1 (212) 250-7994, for a copy of this important document.
The risk of loss in futures trading and options, foreign or domestic, can be substantial. As a result of the high degree of leverage obtainable in futures and options trading losses may be incurred that are greater than the amount of funds initially deposited
Unless governing law provides otherwise, all transactions should be executed through the Deutsche Bank entity in the investor's home jurisdiction. In the U.S. this report is approved and/or distributed by Deutsche Bank Securities Inc., a member of the
NYSE, the NASD, NFA and SIPC. In Germany this report is approved and/or communicated by Deutsche Bank AG Frankfurt authorized by the BaFin. In the United Kingdom this report is approved and/or communicated by Deutsche Bank AG London, a
member of the London Stock Exchange and regulated by the Financial Conduct Authority for the conduct of investment business in the UK and authorized by the BaFin. This report is distributed in Hong Kong by Deutsche Bank AG, Hong Kong Branch, in
Korea by Deutsche Securities Korea Co. This report is distributed in Singapore by Deutsche Bank AG, Singapore Branch or Deutsche Securities Asia Limited, Singapore Branch, and recipients in Singapore of this report are to contact Deutsche Bank AG,
Singapore Branch or Deutsche Securities Asia Limited, Singapore Branch in respect of any matters arising from, or in connection with, this report. Where this report is issued or promulgated in Singapore to a person who is not an accredited investor, expert
investor or institutional investor (as defined in the applicable Singapore laws and regulations), Deutsche Bank AG, Singapore Branch or Deutsche Securities Asia Limited, Singapore Branch accepts legal responsibility to such person for the contents of this
report. In Japan this report is approved and/or distributed by Deutsche Securities Inc. The information contained in this report does not constitute the provision of investment advice. In Australia, retail clients should obtain a copy of a Product Disclosure
Statement (PDS) relating to any financial product referred to in this report and consider the PDS before making any decision about whether to acquire the product. Deutsche Bank AG Johannesburg is incorporated in the Federal Republic of Germany
(Branch Register Number in South Africa: 1998/003298/10). Additional information relative to securities, other financial products or issuers discussed in this report is available upon request. This report may not be reproduced, distributed or published by any
person for any purpose without Deutsche Bank's prior written consent. Please cite source when quoting.
Copyright © 2013 Deutsche Bank Securities Inc.