SHOOL OF GRADUATE STUDIES
94
SHOOL OF GRADUATE STUDIES HARAMAYA UNIVERSITY As Thesis Research advisor, I here by certify that I have read and evaluated this thesis Prepared, under my guidance, by ASHAGRE ABATE, entitled: EFFECT OF NITROGEN FERTILIZER AND HARVESTING STAGE ON YIELD AND QUALITY OF NATURAL PASTURE IN FOGERA DISTRICT, NORTH WESTERN ETHIOPIA. I recommend that it be submitted as fulfilling the Thesis Requirement. Solomon Mengistu (PhD ) __________________ _____________ Major Advisor Signature Date Tessema Zewdu (Ass.Prof) ___________________ ______________ Co-advisor Signature Date As member of the Board of examiners of the Msc Thesis Open Defense Examination. We certify that we have read evaluated the Thesis prepared by ASHAGRE ABATE and examined the candidate. We recommended that the Thesis be accepted as fulfilling the thesis requirement for the Degree of Master of Science in Agriculture (Range Ecology and Management). ________________ ____________________ _______________ Chair-person Signature Date ________________ _____________________ _______________ Internal examiner Signature Date ________________ _____________________ _______________ External examiner Signature Date ii
Transcript of SHOOL OF GRADUATE STUDIES
SHOOL OF GRADUATE STUDIES
HARAMAYA UNIVERSITY
As Thesis Research advisor, I here by certify that I have read and evaluated this thesis
Prepared, under my guidance, by ASHAGRE ABATE, entitled: EFFECT OF NITROGEN
FERTILIZER AND HARVESTING STAGE ON YIELD AND QUALITY OF NATURAL
PASTURE IN FOGERA DISTRICT, NORTH WESTERN ETHIOPIA. I recommend that
it be submitted as fulfilling the Thesis Requirement.
Solomon Mengistu (PhD) __________________ _____________
Major Advisor Signature Date
Tessema Zewdu (Ass.Prof) ___________________ ______________
Co-advisor Signature Date
As member of the Board of examiners of the Msc Thesis Open Defense Examination. We
certify that we have read evaluated the Thesis prepared by ASHAGRE ABATE and examined
the candidate. We recommended that the Thesis be accepted as fulfilling the thesis
requirement for the Degree of Master of Science in Agriculture (Range Ecology and
Management).
________________ ____________________ _______________
Chair-person Signature Date
________________ _____________________ _______________
Internal examiner Signature Date
________________ _____________________ _______________
External examiner Signature Date
ii
DEDICATION
This thesis is heartily dedicated to my wife, Abeba Wubetu and my daughter Beteliham
Ashagre for their moral support and encouragement during my work at Haramaya University.
iii
STATEMENT OF THE AUTHOR
First, I declare that this thesis is my bonafide work and that all sources of materials used for
this thesis has been duly acknowledge. This thesis has been submitted in partial fulfillment of
the requirement for M.Sc. degree at the Haramaya University and is deposited at the
University library to be made available to borrowers under rules of the library. I solemnly
declare that this thesis is not submitted to any other institution any where for the award of any
other academic degree, diploma or certificate.
Brief quotations from this thesis are allowable without special permission provided that
accurate acknowledgement of source is made. Request for permission for extended quotation
from or reproduction of this manuscript in whole or in part may be granted by the Head of the
Department of Animal Sciences or the Dean of the School of Graduate Studies when in his or
her judgment the proposed use of the material is in interests of scholar ship. In all other
instances, however, permission must be obtained from the author.
Name: Ashagre Abate Signature-------------------
Place: Haramaya University, Haramaya
Date of submission: April 17, 2008
iv
LIST OF ACRONYMS AND SYMBOLS
ADF Acid Detergent Fiber
ADL Acid Detergent Lignin
ANOVA Analysis of Variance
AOAC Association of Official Analytical Chemists
ARC Agricultural Research Council
BoRD Bureau of Agriculture and Rural Development
C Carbon
Co Degree Centigrade
CE Cellulose
CEC Cation Exchange Capacity
CF Crude Fiber
cm Centimeter
CP Crude Protein
CV Coefficient of Variation
DAP Diammonium Phosphate
DM Dry Matter
DWR Dry Weight Rank
Ece Electrical Conductivity of extracts
ETB Ethiopian Birr
FC Frequency of Cutting
FR Fertilizer
GR Grass
GTDW Grand Total Dry Weight
ha Hectare
HMC Hemi cellulose
HR Forbs
i.e. That is
ILCA International Livestock Center for Africa
v
ILRI International Livestock Research Institute
IPMS Improving Productivity and Market Success of Ethiopian Farmers
IVDMD In Vitro Dry Matter Digestibility
Kg Kilogram
LSD Least Significant Difference
LG Legume
m Meter
mS MilliSiemen
N Nitrogen
NDF Neutral Detergent Fiber
NI Net Income
NPN Non-Protein Nitrogen
NWZMS North Western Zone Meteorological Service
OC Organic Carbon
OM Organic Matter
P Phosphorus
PDMY Pasture Dry Matter Yield
ppm Parts per million
SAS Statistical Analysis Software
SDW Sub-sample Dry Weight
SE Standard Error
SFW Sub-sample Fresh Weight
SH Stage of Harvesting
SPSS Statistical Package for the Social Sciences
t Tone
TA Total Ash
TC Total production Cost
TDW Total Dry Weight
TFW Total Fresh Weight
TR Total Revenue
TVC Total Variable Cost
vi
BIOGRAPHICAL SKETCH
The author was born in December 1977 in South Gondar Zone of the Amhara Regional State,
Estie Mekaneyesus. He attended his elementary education at Mekaneyesus elementary and
secondary school. After successfully passing the Ethiopian School Leaving Certificate
Examination, he joined Alemaya University of Agriculture and Graduated with a B.Sc. degree in
Animal Science in July 2000.
Soon after graduation he was employed by the Ministry of Agriculture as Livestock Production
and Forage Development Expert in the woreda level of South Gondar Zone where he served from
August 2000 to 2006.
Finally, the author joined the post graduate studies of Haramaya University in October 2006 in
the Department of Animal Sciences to study for his Master of Science degree in Range Ecology
and Management.
vii
ACKNOWLEDGMENTS
I am highly indebted to Dr. Solomon Mengistu my major advisor, at Debre Zeit Agricultural
Research center for his tireless and careful guidance at every stage of my research work that this
piece of work attained its present status. I also wish to thank Mr. Tessema Zewdu, my co-advisor,
for his constructive comments from the original thesis research proposal up to the final thesis
write up.
I wish to express my sincere word of thanks to the Amhara Agricultural and Rural Development
Bureau for giving me the chance to pursue this study. Special thanks to Dr. Eshete Dejen, Amhara
Regional Research Institute (ARARI) Livestock Research Director and Ato Aynalem Gezahagn
Head of Amhara Agricultural Extension Department who have given me technical and moral
support through-out the study.
A special thank is also forwarded to Improving Productivity and Market Success for Ethiopian
Farmers (IPMS) for covering tuition fee and research costs and also Amhara Agricultural
Research Institute (ARARI) financed the cost for this study. All round support rendered by the
management and staff members of the Fogera woreda Agricultural and Rural Development
Office, IPMS staff of Fogera and Bahir Dar Soil Laboratory Center, especially Abeba Birhanu for
my field and laboratory works is highly appreciated.
I would also like to express my appreciation and thanks to farmers in Fogera woreda especially,
Ato Molla Belew and his family as a whole who expressed their willingness by providing their
field for the research carried out.
Lastly, my heartfelt gratitude goes to my wife, Abeba Wubetu and my daughter Beteliham for
their understanding, encouragement and love during my stay away from home.
viii
TABLE OF CONTENTS
STATEMENT OF THE AUTHOR iv
LIST OF ACRONYMS AND SYMBOLS v
BIOGRAPHICAL SKETCH vii
ACKNOWLEDGMENTS viii
TABLE OF CONTENTS ix
LIST OF TABLES xii
LIST OF FIGURES xiv
LIST OF TABLES IN THE APPENDIX xv
ABSTRACT xvi
1. INTRODUCTION 1
2. LITERATURE REVIEW 4
2.1. Major Species Components of Natural Pasture 4
2.1.1. Grasses 4
2.1.2. Legumes 5
2.2. Natural Pastures as Feed Resource for Livestock 5
2.3. Effect of Harvesting Stage on Yield and Quality of Natural Pasture 6
2.3.1. Botanical composition 6
2.3.2. Forage yield 7
2.3.3. Forage quality 7
2.4. Effect of Fertilizer Application on Yield and Quality of Natural Pasture 9
2.4.1. Botanical composition 10
2.4.2 Forage yield 10
2.4.3. Forage quality 11
3. MATERIALS AND METHODS 13
3.1. Description of the Study Area 13
3.1.1. Location and choice of the study area 13
3.1.2. Topography, climate, soil and land form 14
ix
TABLE OF CONTENTS (CONTINUED)
3.1.3. On-farm feed resources 16
3.1.4. Farming system 18
3.2. Experimental Design 19
3.3. Sampling Procedures 20
3.4. Measurements 20
3.4.1. Botanical composition 20
3.4.2. Pasture yield 21
3.4.3. Chemical analyses 22
3.4.4. Soil analysis 22
3.6. Statistical Analyses 23
4. RESULTS AND DISCUSSION 25
4.1. Physical and Chemical Characteristics of Soil of the Experimental Field 25
4.2. Botanical Composition 26
4.3. Pasture Yield as Affected by Nitrogen Fertilizer and Harvesting Regime 35
4.3.1. Effect of nitrogen fertilizer application on herbage yield 35
4.3.2. Effect of harvesting time and cutting intervals on herbage yield 37
4.4. Pasture Nutritive Value as Affected by Nitrogen Fertilizer and Harvesting Regime39
4.4.1. Crude protein 39
4.4.2. Neutral detergent fiber 41
4.4.3. Acid detergent fiber 42
4.4.4. Hemi-cellulose 43
4.4.5. Cellulose 44
4.4.6. Total ash 45
4.4.7. Phosphorous 47
4.4.8. In vitro dry matter digestibility 48
4.5. Correlation Coefficient between Dry Matter Yield and Nutritive Value of Natural
Pasture 50
4.5.1. Correlation analysis 50
5. SUMMARY AND CONCLUSIONS 52
x

TABLE OF CONTENTS (CONTINUED) 6. RECOMMENDATIONS 54
7. SCOPE FOR FUTURE WORK 55
8. REFERENCES 56
xi
LIST OF TABLES
Table 1. Land use pattern of the research district .................................................................... 15 Table 2.Major on farm feed resources, availability and their utilization in the research district
(in percentage).............................................................................................................. 17 Table 3. Livestock population and herd composition in the Fogera district............................ 19 Table 4. Physical properties of soil at the study site ................................................................ 25 Table 5.Major chemical properties of soil at the study site ..................................................... 26 Table 6.Grass, legumes and other herbaceous species in the research area............................. 27 Table 7.Percentage composition of legume component at different stages of harvesting and
levels of fertilizer application....................................................................................... 29 Table 8.Percentage composition of grass component at different stages of harvesting and
levels of fertilizer application....................................................................................... 30 Table 9.Percentage composition of forbs component at different stages of harvesting and
levels of fertilizer application....................................................................................... 31 Table 10.Dry matter yield (t/ha) of legume component at different stages of harvesting and
levels of fertilizer application.................................................................................... 32 Table 11.Dry matter yield (t/ha) of grass component at different stages of harvesting and
levels of fertilizer application.................................................................................... 33 Table 12.Dry matter yield (t/ha) of forbs component at different stages of harvesting and
levels of fertilizer application.................................................................................... 34 Table 13.Dry matter yield (t/ha) of natural pastureland at different stages of harvesting and
levels of fertilizer application.................................................................................... 35 Table 14.Pasture yield performance (t/ha) at different frequencies of cutting after 60 days
harvesting and levels of fertilizer application ........................................................... 37 Table 15.Mean total yield (t/ha) of pastureland at different frequencies of cutting
intervals (three cuttings at 30 days interval) ............................................................. 38 Table 16.Crude protein content (percentage) at different stages of harvesting and levels of
fertilizer application .................................................................................................. 39 Table 17.Neutral detergent fiber content (percentage) at different stages of harvesting and
levels of fertilizer application.................................................................................... 41 Table 18.Acid detergent fiber content (percentage) at different stages of harvesting and levels
of fertilizer application.............................................................................................. 42 Table 19.Hemi-cellulose content (percentage) at different stages of harvesting and levels of
fertilizer application .................................................................................................. 44 Table 20.Cellulose content (percentage) at different stages of harvesting and levels of
fertilizer application .................................................................................................. 45 Table 21.Total ash content (percentage) at different stages of harvesting and levels of
fertilizer application .................................................................................................. 46 Table 22.Phosphorus content (percentage) at different stages of harvesting and levels of
fertilizer application .................................................................................................. 47 Table 23.In vitro dry matter digestibility (percentage) at different stages of harvesting and
levels of fertilizer application.................................................................................... 48 Table 24.Effect of harvesting stage and fertilizer levels on the crude protein yield and
digestible dry matter yield......................................................................................... 49
xii

LIST OF TABLES (CONTINUED) Table 25.Correlation coefficients between stage of maturity, cutting frequency and
fertilizer application with DMY and quality parameters of natural pasturelands..... 51
xiii
LIST OF FIGURES Figure 1. Figure 1.Location Map of the study Area (Fogera district) 132 Figure 2. Monthly rainfall distribution at Woreta Station (data compiled for10 years) 14 Figure 3. Monthly Average minimum and maximum temperature in (oC) at woreta station
(data compiled for 10 years) 15 Figure 4. Percentage proportion of grasses, legumes and other forbs as influenced by
different stages of harvesting 32 Figure 5.The NDF, ADF, Hemi-cellulose and Cellulose contents as influenced by stages of
harvesting 45
xiv
LIST OF TABLES IN THE APPENDIX Appendix Table 1.Analysis of the effect of different stages of harvesting and levels of
fertilizer application on the percentage proportion of legume component.............................................................................................................. 70
Appendix Table 2.Analysis of the effect of different stages of harvesting and levels of fertilizer application on the percentage proportion of grass component70
Appendix Table 3.Analysis of the effect of different stages of harvesting and levels of fertilizer application on the percentage proportion of other forbs component.............................................................................................................. 71
Appendix Table 4.Analysis of the effect of different stages of harvesting and levels of fertilizer application on dry matter yield of legume component.......... 71
Appendix Table 5.Analysis of the effect of different stages of harvesting and levels of fertilizer application on dry matter yield of grass component ............. 72
Appendix Table 6.Analysis of the effect of different stages of harvesting and levels of fertilizer application on dry matter yield of forbs component ............. 72
Appendix Table 7.Analysis of the effect of different stages of harvesting and levels of fertilizer application on dry matter yield of natural pastureland.......... 73
Appendix Table 8.Analysis of the effect of frequent cutting on the pasture yield ............ 73 Appendix Table 9.Analysis of the effect of different stages of harvesting and levels of
fertilizer application on crude protein content of natural pasture ........ 74 Appendix Table 10.Analysis of the effect of different stages of harvesting and levels of
fertilizer application on neutral detergent fiber of natural pasture....... 74 Appendix Table 11.Analysis of the effect of different stages of harvesting and levels of
fertilizer application on acid detergent fiber on natural pasture .......... 75 Appendix Table 12.Analysis of the effect of stages of harvesting and levels of fertilizer
application on hemi-cellulose of natural pasture ................................. 75 Appendix Table 13.Analysis of the effect of stages of harvesting and levels of fertilizer
application on cellulose of natural pasture........................................... 76 Appendix Table 14.Analysis of the effect of different stages of harvesting and levels of
fertilizer application on the total ash content of natural pasture .......... 76 Appendix Table 15.Analysis of the effect of different stages of harvesting and levels of
fertilizer application on the phosphorus content .................................. 77 Appendix Table 16.Analysis of the effect of stages of harvesting and levels of fertilizer
application on in vitro dry matter digestibility..................................... 78 Appendix Table 18.The mean annual rainfall (mm), average minimum and maximum
temperature (0c) at Woreta Station....................................................... 78
xv
EFFECT OF NITROGEN FERTILIZER AND HARVESTING STAGE ON YIELD
AND QUALITY OF NATURAL PASTURES IN FOGERA DISTRICT, NORTH
WESTERN ETHIOPIA.
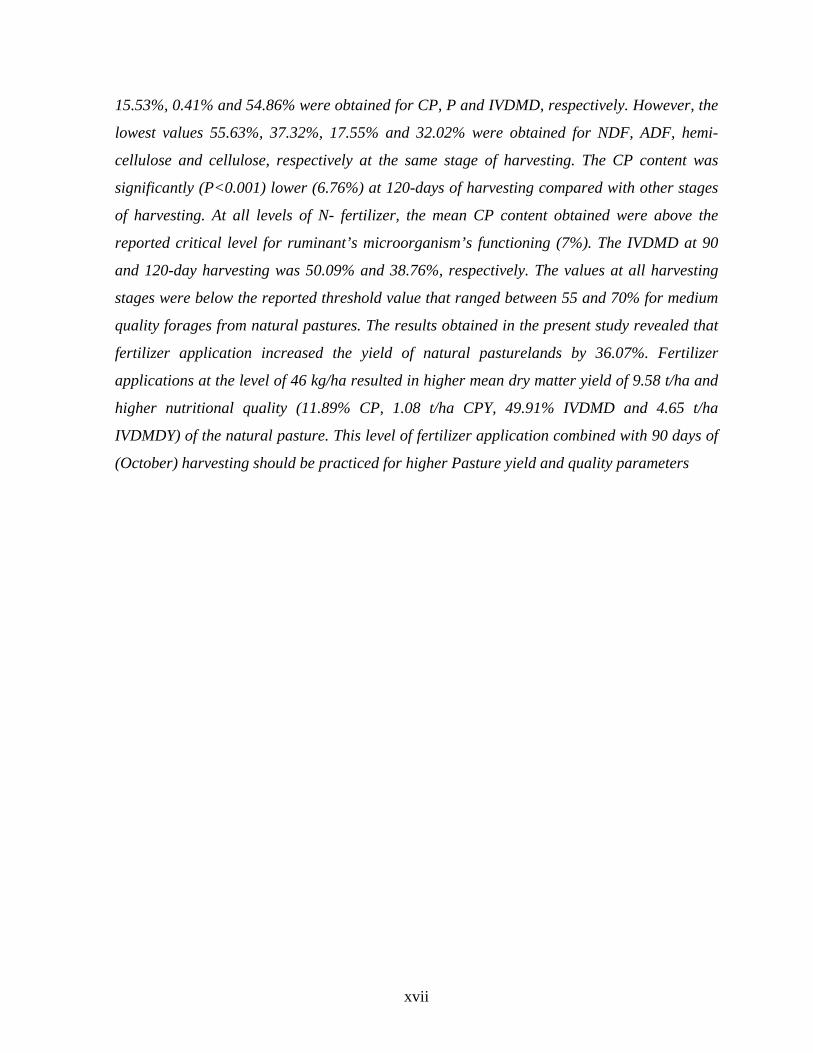
ABSTRACT This experiment was carried out to assess botanical composition, DMY and chemical
composition of Fogera upland natural pastureland under different application rates of N
fertilizer and harvesting stages of natural pasture at smallholder farmers condition. The
experiment was conducted using 3 x 4 factorial experiment arranged in a randomized
complete block design with three replications and the treatment consisted three stages of
harvesting (60, 90 and 120 days) and four levels of N fertilizer application (0, 23, 46 and 69
kg N/ha) on the natural pasture land.
The botanical composition of the natural pasture land that have been identified at the
experimental site included thirteen grasses, seven annual legumes and seven other
herbaceous species belonging to different families. The influence of stages of harvesting was
significant (P<0.05) but application of N fertilizer was not significant on total DMY of the
pasture. Natural pasture harvested at 120-days of harvesting and at a fertilizer application of
69 kg/ha results the highest DMY (9.97 t/ha) while the lowest level was (5.38 t/ha) from
unfertilized plots at 120-days of harvesting. The effect of stage of harvesting and fertilizer
level on DMY of legume components was highly significant (P<0.001) but for the grass
components stage of harvesting had non- significant effect, where as fertilizer had a highly
significant effect (P<0.001). The relative proportion of legumes in the pastureland reached
highest at 90-days of harvesting at all levels of fertilizer application. The proportion of
legumes varied from the highest mean of 56.18% to the lowest of 37.66% at 90 and 120-days
of harvesting, respectively while that of grasses ranged from 58.09% to 40.24% at 120 and
90-days of harvesting, respectively. The relative proportion of grasses increased with
increasing levels of N fertilizer and stage of harvesting up to 120-days. Significant effect of
stage of harvesting (P<0.001) on CP, NDF, ADF, hemi-cellulose, cellulose, P and IVDMD
were obtained at all levels of fertilizer application. At 60-days of harvesting, highest values of
xvi
15.53%, 0.41% and 54.86% were obtained for CP, P and IVDMD, respectively. However, the
lowest values 55.63%, 37.32%, 17.55% and 32.02% were obtained for NDF, ADF, hemi-
cellulose and cellulose, respectively at the same stage of harvesting. The CP content was
significantly (P<0.001) lower (6.76%) at 120-days of harvesting compared with other stages
of harvesting. At all levels of N- fertilizer, the mean CP content obtained were above the
reported critical level for ruminant’s microorganism’s functioning (7%). The IVDMD at 90
and 120-day harvesting was 50.09% and 38.76%, respectively. The values at all harvesting
stages were below the reported threshold value that ranged between 55 and 70% for medium
quality forages from natural pastures. The results obtained in the present study revealed that
fertilizer application increased the yield of natural pasturelands by 36.07%. Fertilizer
applications at the level of 46 kg/ha resulted in higher mean dry matter yield of 9.58 t/ha and
higher nutritional quality (11.89% CP, 1.08 t/ha CPY, 49.91% IVDMD and 4.65 t/ha
IVDMDY) of the natural pasture. This level of fertilizer application combined with 90 days of
(October) harvesting should be practiced for higher Pasture yield and quality parameters
xvii
1. INTRODUCTION
Livestock production is an integral part of the subsistence crop-livestock systems of the
Ethiopian highlands. It is a source of draught power, manure and transport to support the crop
sector. It is also a source of cash, nutrition and asset for the rural communities. Livestock is
considered as a mobile bank that could be hired, shared, inherited and contracted by rural
households. Although the contribution of livestock to facilitate the crop sector has been
recognized all along, its productivity in Ethiopia is declining to a level that may affect the
sustainability of synergism between the crop and livestock sectors. One of the major
constraints to livestock productivity is lack of feed, both in quality and quantity (Tilahun, et
al., 2005). Livestock feed in the country is based on natural pastures, fallow grazing, and
stubble grazing and crop residues. Alemu and Lemma (1991) reported that more than 90
percent of the livestock feed in Ethiopia come from crop residues and natural pasture. This
resource consists of a wide range of grasses, legumes and other herbaceous species.
Natural pasture and crop residues are poor in quality and provide inadequate protein, energy,
vitamins and minerals (Daniel, 1990). Thus, the existing feed resources do not meet the nutrient
requirements for growth and reproduction of animals. Adane and Berhan (2005) reported that the
herbage yield and nutritional quality of natural pasture is generally low. The herbage makes rapid
growth of fair quality early in the rainy season but during the dry season only over-matured
herbage of poor quality is available. This results in slow growth rates, poor fertility and high
mortality rates, especially in young stock. In certain areas where improved forage crops have
been introduced, farmers failed to utilize them at the optimum developmental stages, which
would ensure an appropriate balance between quality and quantity to satisfy livestock
requirements and support reasonable animal production (Taye, 2004). Forage resource
improvement with emphasis on management practices that promote yield and nutritive value are,
therefore, one of the important measures that have to be taken to reverse the prevailing scenario
of poor animal productivity.
In the Ethiopian highlands most pasturelands have suffered encroachment of crop production as a
consequence of the growing human population. The increase in human population and the decline
in land productivity demanded an expansion in arable land that led to a reduction in the amount of
land available for natural pasture and browse (Alemayehu, 1997). Thus, the pastures are
practically those available only on steep slopes, field margins and roadsides (Ali, 2004).
Consequently, the livestock are forced to concentrate on very limited pastureland. This results in
overgrazing, which in turn leads to invasion by unpalatable plant species and finally a decline in
the quality and quantity of pasture. The latter become worse as the dry season advances. The
overgrazing affects the botanical composition of the natural pasture which is the major factor
affecting the potential of the pasture to sustain livestock productivity. The changes in botanical
composition primarily brought about by animal activities that usually affect the nutritive value of
natural pastures and in turn influence the productivity of animals. Appropriate grazing
management must be practiced in order to maintain a favorable balance in the botanical
composition of the available natural pasture.
Although the natural grasslands constitute the major feed source of livestock in most developing
countries, these resources have several limitations. They have a sub-optimal nutritive value for
only a short period of the year and decline quickly on maturity (Zinash et al., 1995). Further-
more, prolonged harvesting time results in poor quality of the native hay (Gashaw et al., 1991;
Teshome et al., 1994). Forage yield and nutritional qualities of pasture are influenced by
numerous factors representing ecological conditions and management activities. Those factors
include frequency of cutting, species composition, stage of maturity of plants, climatic conditions,
soil fertility status and season of harvesting. As pasture gets mature it is characterized by high
content of fiber with a higher grade of lignifications and low protein content. Changes of quality
during the growing period of grasses are particularly high under tropical climatic conditions due
to the physiological, biochemical and anatomical adaptation of the tropical grasses (Carbon 4
grasses) to utilize the high temperature and high solar radiation regime prevailing in the tropics
(Nelson and Moser 1994).
Generally, in the high-lands of the country which contains high livestock and human population,
there is a severe shortage of grazing resource together with marked decline in the quality of the
natural pasture (Adane, 2003). Evidently there is paucity of information on improved
management and utilization of this resource at the smallholder farm level, including optimum
2
stage and frequency of harvesting of the herbage, levels of fertilizer application as strategies for
increasing pasture productivity.
Within the Ethiopian highland system occurs the Fogera plain, on which this study is focused,
is home to the well known Fogera cattle breed. The breed is large-framed and one of the best
indigenous milk animals in the country. It is also known for its meat production and traction
power. Unfortunately, cattle of this potential milk are suffering due to feed shortage both in
quality and quantity. Even though the study area has high potential contribution to the
smallholder’s livestock production in that area, poor productivity of the grazing lands both in
quality and quantity of the grazing resource poses a great problem in livestock farming. This
problem inevitably calls for improving the productivity of the grazing lands in that area.
One of the most viable and simple management interventions to avert the severe feed shortage is
to improve the quality and quantity of the natural pasture through employing improved
management and conservation practices. The management systems, particularly utilizing the
pasture at early stages of growth with proper growing management might improve the
productivity of pastures both quantitatively and qualitatively (Zinash etal., 1995). However,
information on botanical composition and optimum stage of harvesting of forages of natural
pasture as a strategy for increasing pasture productivity at smallholder farmers level in Fogera
district with high livestock and human population density and declining land holding is very
scanty. Thus, there is a need to determine botanical composition, DMY as well as optimum stage
of harvesting as a strategy to intervene the prevailing traditional pasture management systems at
smallholder farmers level.
The objective of this study was to achieve the following:-
To determine the botanical composition, dry matter yield and chemical composition of
the natural pasture under different nitrogen fertilizer application and stages of
harvesting in Fogera district.
3
2. LITERATURE REVIEW
2.1. Major Species Components of Natural Pasture
Natural pastures are composed of grasses (Poaceae), legumes (Fabaceae), sedges
(Cyperaceae), and other heterogenous plants in various families, which could be herbaceous
or woody forms (McIllroy, 1972). The first two plant groups; grasses and legumes, make up
the bulk of the herbage that are valuable as animal feed.
2.1.1. Grasses
Grass is a common word that generally describes a monocotyledonous green plant in the
family Poaceae. It occupies a greater area of the world’s surface than any other plant family,
occurring in almost every terrestrial environment and provides a vital source of food for
human and animals (Cheplick, 1998). Forage grasses can be either annuals or perennials with
a wide spectrum of adaptation and diverse growth habits and thus they are distributed in all
continents and climatic zones (Pamo and Piper, 2000). Both annual and perennial grasses are
herbaceous (non-woody) plants, made up of a grouping of units called tillers. Perennial
grasses often live for relatively a few or several seasons by succession of secondary tillers,
which replace the original tillers. However, annual grasses flower and die without producing
replacement tillers which will be the reason for the death of the whole plant (Wolfson and
Tainton, 2000).
According to Pamo and Piper (2000), at maturity, the grasses range in height from a few
centimeters to 20 meter or more. Despite having common morphological characteristics, some
grass species may show many modifications from the typical structure. The modifications
allow species to adapt to specific environmental conditions and provide a means for
identification.
4
2.1.2. Legumes
Legumes are classified under the family Fabaceae (Leguminoseae). The legume family
contains about 18,000 species, which are valued for their ability to grow in a symbiotic
relationship with nitrogen fixing bacteria, and for their drought resistance (McDonald et al.,
2002). It is composed of threee sub-families: Caesalpiniodeae, Mimosoideae and
Papilionoideae. The latter constitutes the majority of cultivated pasture legumes. Legumes are
widely spread in both temperate and tropical climates with numerous herbaceous species
which are grown on pasture or as fodder crops and are of considerable importance for natural
grazing (Bogdan, 1977). Leguminous plants in general can be annuals, biennials or
perennials. They have a narrower range of adaptation which requires a higher management
level than that for grasses (Pamo and Piper, 2000). Nutritionally, the legumes are superior to
grasses in protein and mineral content such as calcium and phosphorus. The increase in
animal production from use of legumes is therefore due to relatively high content of crude
protein and the high digestibility of forage legumes and to the high intake by animals feeding
on them (Whiteman, 1980).
2.2. Natural Pastures as Feed Resource for Livestock
In most areas of sub-Saharan Africa, the major even the sole feed source available for large
parts of the year in smallholder production systems are natural pastures (Smith, 1992;
Gylswyk, 1995). However, natural pastures mostly suffer from seasonally spells of dry
periods during which they drop in quality, which is characterized by high fiber content, low
digestibility and very low protein and energy content (Ndlovu, 1992; Topps, 1995).
In Ethiopia, it has been estimated that more than 90 percent of livestock feed requirement is
provided by natural pastures, which consist of a wide range of grasses, legumes and other
herbaceous species (Lulseged, 1985). The yield as well as quality of pasture is very low due
to poor management and over stocking. Natural pastures would be adequate for live weight
maintenance and weight gain during wet seasons, but would not support maintenance for the
rest of the year (Zinash et al., 1995). The productivity from grazing land is insufficient in both
5
quantity and quality for optimal livestock growth and production. Studies indicated that poor
production of grazing lands and large herd size on small farmlands caused overgrazing of
natural pasturelands resulting in serious land degradation. Consequently, soil fertility declines
causing lowered dry matter yields from the natural pasturelands. Moreover, prolonged
harvesting time impairs the quality of native hay (Varvikko, 1991; Gashaw, 1992).
2.3. Effect of Harvesting Stage on Yield and Quality of Natural Pasture
2.3.1. Botanical composition
Botanical composition refers to the proportion of grass, legume and other forage species
biomass in a given area. Natural pasture in the highland areas has relatively high proportion of
grass and legume species, but the proportion of legumes declines with decreasing altitude
(Alemayehu, 1985). Most legumes are often grown in mixtures with pasture grasses. Some of
the N that is fixed by legumes becomes available in the soil and increases the production and
quality of herbage (Bogdan, 1977). However, when a pure grass pasture is grown without a
legume component, it eventually suffers a reduction in yield through N defoliation. On the
other hand, a pure stand of legume pasture fixes N in excess of its requirement that attracts
invading non-legume weeds and grasses. Legumes contain more crude protein, calcium and
phosphorus, and often lower crude fiber values. They can improve the feeding value of
grasses (Webster and Wilson, 1980). Hence, the quality of a pasture can be improved by the
inclusion of forage legumes, which are not so bulky and maintain their high quality
throughout the year (Tarawali et al., 1991).
Pasture composition (irrespective of plant species) can be affected by the harvest date of first
cut and frequency of harvesting which consequently reduces the nutritive value (Rinne and
Nykannen, 2000). Hence, the main problem of legumes management in mixed pastures is that
of ensuring their persistence and maintaining their proportion with respect to stage of maturity
(Miller, 1984). Frequently, grazing can reduce the vigor of forage plants. Frequent grazing
particularly at early maturity reduces serious weed invasion in perennial rye grass pastures.
6
Furthermore, grazing reduces the ability of pastures to continue producing herbage while
frequent cutting can lead to change in botanical composition (McKenziel, 1997).
2.3.2. Forage yield
Stage of frequency of cutting significantly influence the yield and quality of herbage
produced. A significant linear increase in the dry matter yield (DM) has been reported in the
natural pasture with increasing stages of growth of grasses up to 90 days (Teshome, 1987;
Zinash et al., 1995). The dry matter yield of both unfertilized and fertilized pastures increased
with maturity. However, at the same stage of harvesting age, fertilizer application resulted in a
significant increase in dry matter yield at 60 and 90 days of harvest, while no significant
effect was observed at 30 days of harvesting (Adane, 2003; Teshome et al., 1994). Similarly,
Daniel (1996) reported that highest DM yield was attained on average at the 69th and 74th days
of growth with N application, respectively at 50 percent to 100 percent heading and seed
setting, respectively with and with out nitrogen application. The frequency and severity at
which pasture plants are defoliated have pronounced effects on the quality of available forage.
Harvesting early to get better nutritive value will reduce the DM yield, so the harvest time
should balance quality and yield (Tessema, 2003). In order to maximize production, the
pasture should retain sufficient leaf to allow for rapid growth for as much of the growing
season as possible. The more severely a plant is defoliated, the more slowly it will recover
and the less severely it is defoliated, the more rapid will be its re-growth. Hence, the more
frequently the pasture is severely defoliated the lower will be the overall dry matter yield
(Bartholomew, 2000).
2.3.3. Forage quality
Buxton (1996) reported that forage maturity stage at harvest is identified as the most
important factor affecting the composition and nutritive value of pastures. Effects of stage of
harvesting on forage digestibility are associated with increase in forage neutral detergent fiber
content and its lignification’s (Smith et al., 1972). Hence, increasing stage of maturity of
forages results in an increase in the indigestible fraction of forage. Moreover, crude protein
7
content and its rumen degradability decrease with increasing stage of maturity (Blade et al.,
1993). The crude protein content varies widely among forage plants, but in all species, it
declines with increasing age of forage plants (Sarwar et al., 1999). The aging of forage is
frequently associated with a decrease in leafiness and an increase in stem to leaf ratio
(Vansoest, 1982). The low nutritive value of native pastures cut at late maturity is identified
by its low crude protein and mineral, and high lignin contents (Teshome, 1987). Hence, the
decrease in the crude protein as grasses get matured is due to an increase in the proportion of
stem, which has lower crude protein content than the leaf fraction (Laredo and Minson, 1973).
The decrease in the content of crude protein in matured native pastures is also attributed to the
decline of the proportion of legumes in the pasture. Harvesting at advanced stage of maturity
caused a decrease in proportion of legumes in native pasture from 11 to 4 percent in dry
matter. Hence, to maintain the required percentage of crude protein, having high proportion of
legumes in the pasture is of paramount importance along with harvesting at optimum stage of
maturity (Kidane, 1993).
Tropical grasses are generally characterized by lower nutritive value even in their early stages
of growth due to lower levels of easily digested materials in their cell wall due to rapid rate of
achieving maturity (Minson, 1980). Harvesting stage of pasture forages is an important factor
significantly affecting digestibility. The digestibility of all grasses decreases as they mature
(Minson, 1977), with increasing age, the proportion of potentially digestible components
comprising soluble carbohydrates, cellulose, hemi-cellulose and other indigestible fractions
such as lignin, cuticle and silica increase, which result in lower digestibility leading to lower
rates of disappearance from the gastro intestinal tract (Van Soest, 1982). According to Minson
(1977), the dry matter digestibility in the plant parts also decreases with advancing plant
growth. The declining dry matter digestibility of stems at advanced maturity is attributed to
greater indigestible component, which increase with advancing stage of plant growth. The
digestibility of tropical grasses is lower than that of temperate grasses. They have higher
lingo-cellulose content and the digestibility of their cell wall material (fiber) is lower. This
lower digestibility gets worse with increase in maturity and greater lignifications of plant
species (Wilson, 1994).
8
The proportion of forage legume in the pasture is affected by stage of maturity (Kidane, 1993)
and this can also affect the digestibility of the pasture. The digestibility would probably
increase as the proportion of forage legume increases because the legumes often have higher
digestibility than grasses (Topps, 1995). Moreover, tropical and subtropical species have a
lower leaf to stem ratio than temperate species. The relevance of this is that stem material is
less digestible than leaf material, and its digestibility declines more rapidly than that of leaf
material (Mannetje, 1984).
2.4. Effect of Fertilizer Application on Yield and Quality of Natural Pasture
Both quantity and quality of natural pasturelands can be improved by application of fertilizer.
Hence, sufficient response to fertilizer application is one of the desirable characteristics
expected of natural pasturelands. The high nitrogen requirement of pastures, coupled with
their pervasive root system results in efficient absorption of nitrogen from the soil. Thus, in
grass dominated pastures about 50 to 70 percent of applied fertilizer nitrogen is normally
taken up, although this decreases at very high nitrogen levels (Miles and Minson, 2000) due to
deficiencies of some micronutrients in the soil and displacement of phosphate concentrations
at higher levels of nitrogen (Falade, 1975). Grasses can obtain their nitrogen in a number of
ways, but the most important sources are from fertilizers and associated legumes. Legumes
vary in their ability to produce nitrogen, and for the most responsive grasses no legumes can
adequately supply the needs of grass. Hence, the simplest way to achieve maximum
production from grass is to apply inorganic fertilizer with high nitrogen content (Skerman and
Riveros, 1990).
Adane (2003) reported that, the yield of the natural grasslands increases with increasing levels
of fertilizer application up to 125 kg/ha regardless of decline in overall production due to
frequent grazing and cuttings in one growing season. Moreover, fertilizers not only increase
yield but also influence species composition of natural pastures. Therefore, according to
Daniel (1987) application of phosphorus alone increases percentage of legumes while heavy
nitrogen application encourages grasses by suppressing legumes.
9
2.4.1. Botanical composition
The effect of fertilization on the botanical composition is very marked where legumes make
up a considerable part of the vegetation. In such areas, the amount of legumes and their
phosphorus content increases sharply with phosphorus fertilization (Gilbert et al., 1992). On
the other hand, nitrogen especially at higher level decreases the legumes even though
phosphorus was applied (Crowder and Chheda, 1982; Daniel, 1987). Hence, strategically
applying nitrogen to boost the grass component or phosphorus to boost the legume component
can achieve a balance between grass and clover (Bartholomew, 2000).
Application of nitrogen fertilizers to grass-legume pastures has dramatic effects on the legume
component by altering botanical composition. Presence of high levels of nitrate or ammonium
will inhibit nodulation and reduces rate of nitrogen fixation that leads to reduction in legume
content (Whiteman, 1980). When legumes are growing with grasses, the grasses are stronger
competitors for available nitrogen, and take up most of that applied. This will lead to an
increased rate of growth, leaf expansion and tillering in the grasses, often leading to
suppression of the legume owing to shading (Miles and Manson, 2000). In grass-legume
pastures, when legumes supply insufficient nitrogen, additional nitrogen generally needs to be
provided by strategic application of nitrogen fertilizer. This however, creates certain
management difficulties, since additional nitrogen reduces fixation by the legumes while it
improves the relative competitive ability of the associated grass. Hence, phosphorus fertilizer
must be applied to deficient soils for establishment and long-term maintenance of legumes in
the pasture (Miles and Manson, 2000).
2.4.2 Forage yield
The application of fertilizers on natural pasture has been clearly shown to improve the
herbage yields (Adane, 2003). When nitrogen is applied, there is usually an initial linear
response. But, there is a phase of diminishing response and a point beyond which nitrogen has
little or no effect on yield. The dry matter yield of fertilized plots of natural pasture has been
10
shown to be 9.47 ton/ha as compared to unfertilized plots 5.67 ton/ ha at 90 days of harvest
(Adane, 2003).Therefore, the amount of dry matter produced for each kilogram of nitrogen
applied depends largely on the species under consideration, frequency of defoliation and
growth condition (Miles and Manson, 2000). The importance of phosphorus for the survival
and nitrogen fixation by legumes in a natural pasture has also been widely recognized.
Phosphorus plays role in nodule development and in the activity of the associated Rhizobia
(Crowder and Chheda, 1982). However, in the tropics, the soils are generally deficient in
phosphorus. Hence, on well-managed legume enriched natural pastures, the application of
phosphate fertilizer often provides an effective factor in increasing productivity (Pagot, 1992).
2.4.3. Forage quality
Application of nitrogen to pasture usually results in marked increase in the level of crude
protein content. However, the great variability in crude protein content due to nitrogen applied
exists in early stages of growth. The crude protein content of most grass species is adequate to
meet minimum nutritional requirements for livestock in early stages of harvesting but reaches
levels below this requirement in later stages of harvesting. Hence, addition of nitrogen and
phosphorus results in considerably higher crude protein content (Goetz, 1975).
The increase in the crude protein content of grasses through fertilization depends on the
availability of soil nitrogen. Nitrogen fertilizer application and growing legumes in
association with grasses also increases the level of soil nitrogen. This has increased the crude
protein percentage of the grass but has no consistent effect on dry matter digestibility
(Minson, 1973). Fertilization at early stages of growth greatly influences the accumulation of
non-structural and insoluble carbohydrate levels. Insoluble carbohydrate decreased with
increasing nitrogen supply and soluble carbohydrate levels increase with increase in
phosphorus supply (Miles and Manson, 2000). Nitrogen fertilizer also improves the
concentrations of neutral detergent fiber (NDF) and acid detergent fiber (ADF) in early cut
pennisetum purpureum. However, according to studies of the same author, nitrogen fertilizer
could not reverse the adverse effects of maturity on the quality. Similarly, the lignin content
11

of the grass of fertilizer application was higher at late cutting. Thus, the digestibility value is
lower too (Sarwar et al., 1999).
12
3. MATERIALS AND METHODS
3.1. Description of the Study Area
3.1.1. Location and choice of the study area
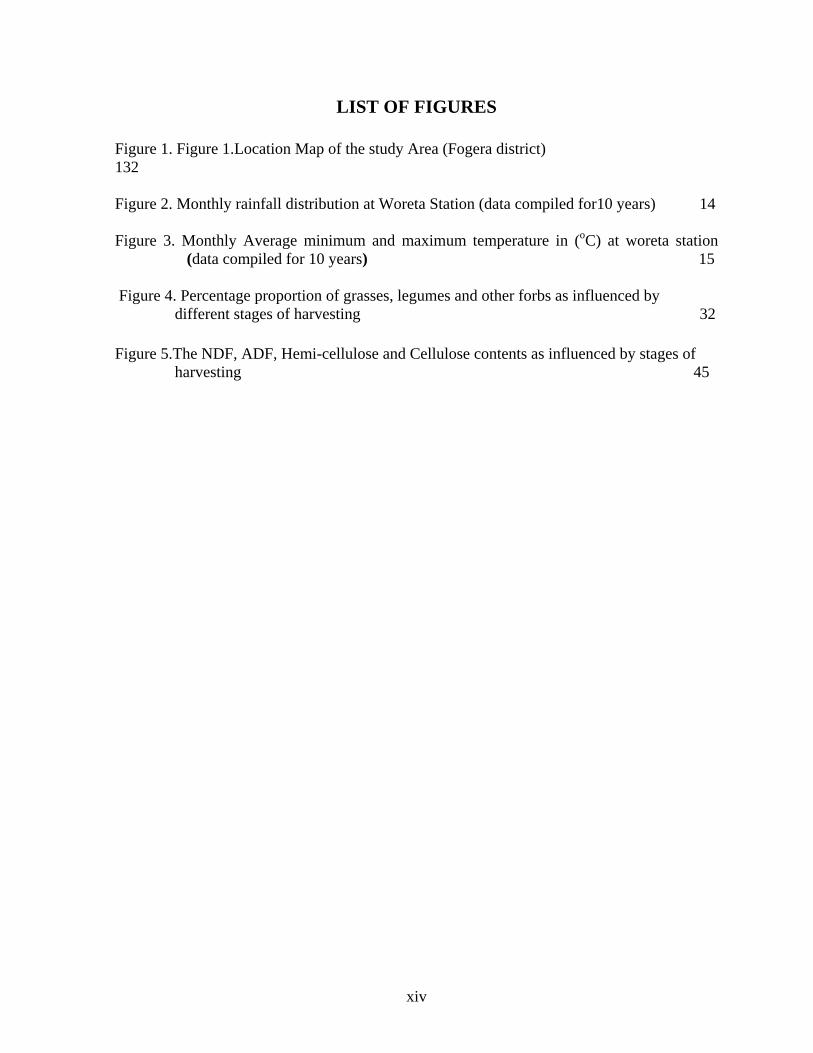
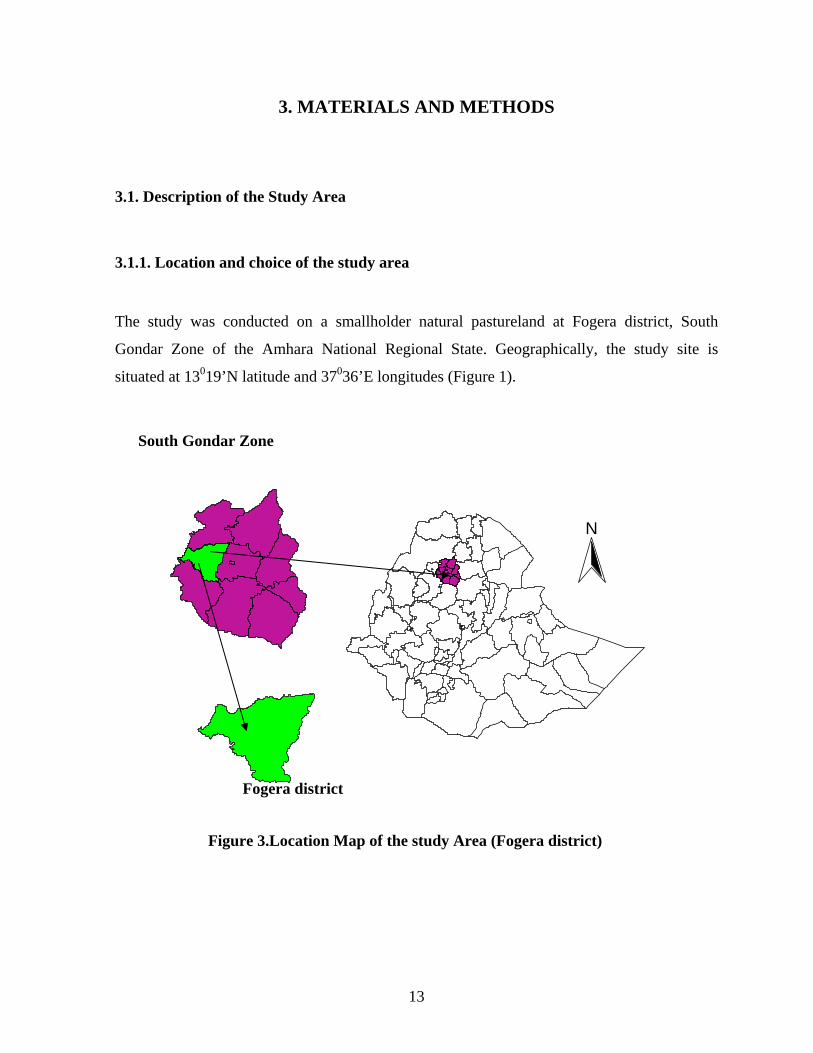
The study was conducted on a smallholder natural pastureland at Fogera district, South
Gondar Zone of the Amhara National Regional State. Geographically, the study site is
situated at 13019’N latitude and 37036’E longitudes (Figure 1).
South Gondar Zone
N
Fogera district Figure 3.Location Map of the study Area (Fogera district)
13
Woreta is the capital of the district and is found 625 Km from Addis Ababa and 55 Km from
the Regional capital, Bahirdar. The district was selected as the study area because it is the
home to the well known Fogera breed of cattle, which is localized to the Fogera Plains.
Livestock farming is an integral part of the agricultural activity in the district, which
determines the well being of smallholder farmers in the area.
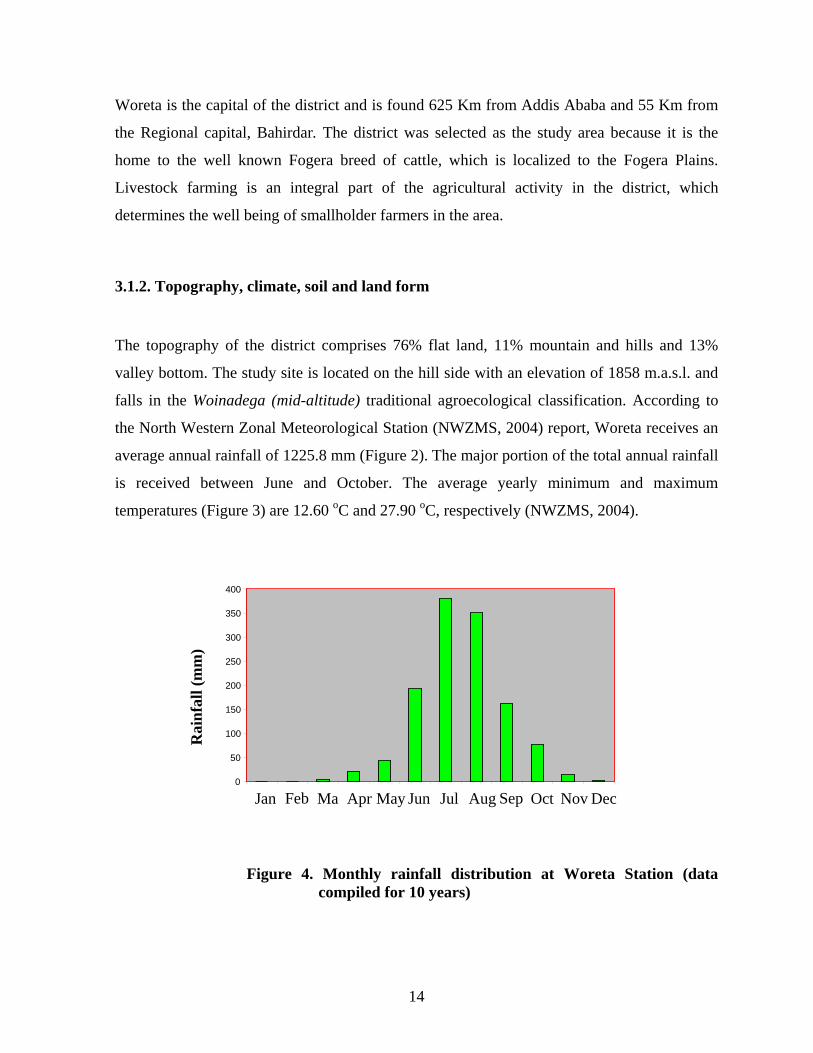
3.1.2. Topography, climate, soil and land form
The topography of the district comprises 76% flat land, 11% mountain and hills and 13%
valley bottom. The study site is located on the hill side with an elevation of 1858 m.a.s.l. and
falls in the Woinadega (mid-altitude) traditional agroecological classification. According to
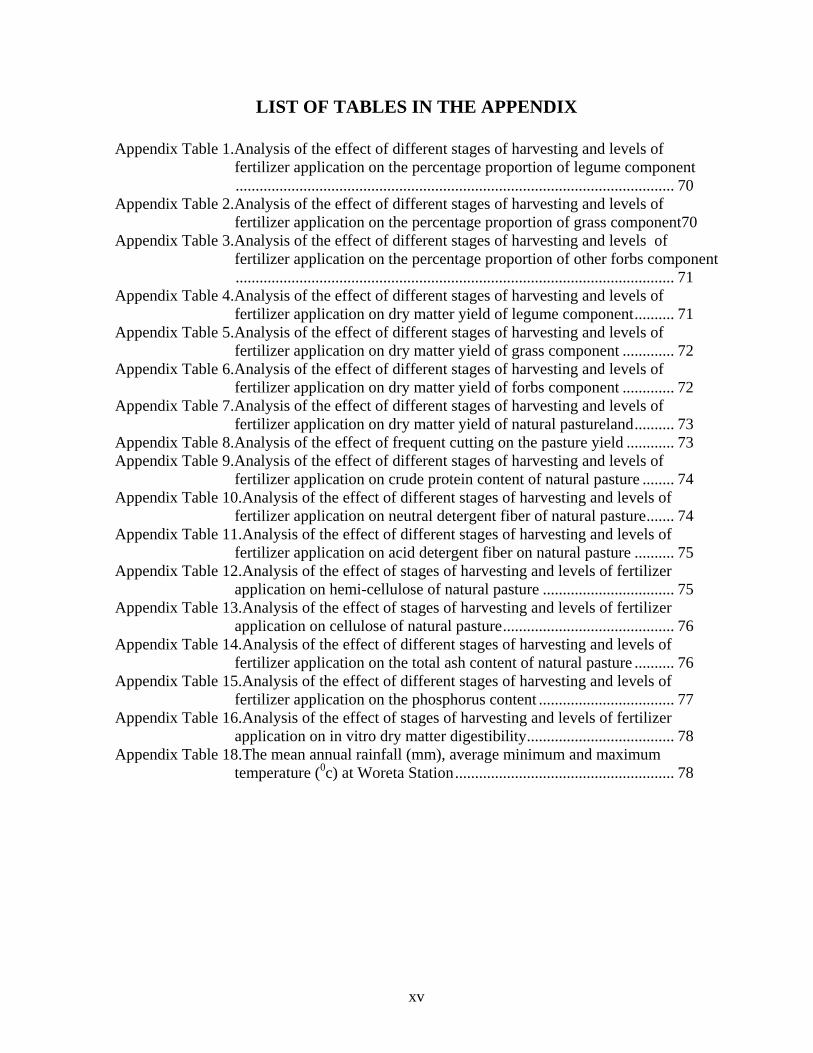
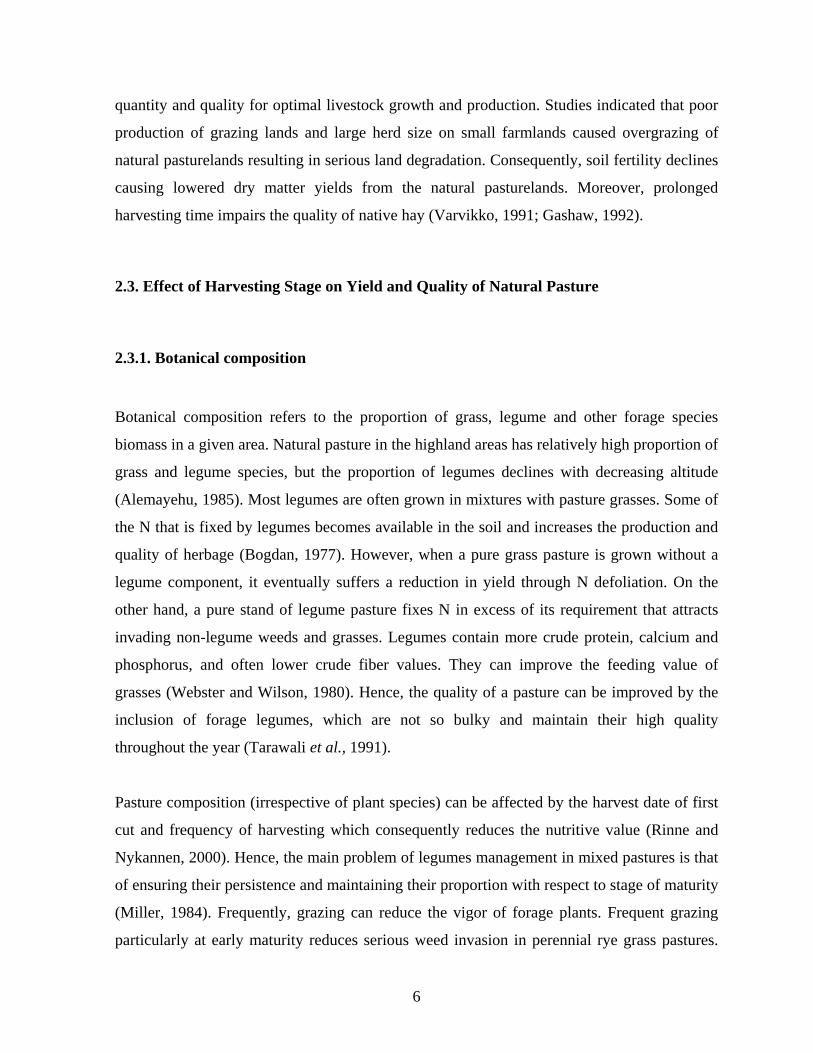
the North Western Zonal Meteorological Station (NWZMS, 2004) report, Woreta receives an
average annual rainfall of 1225.8 mm (Figure 2). The major portion of the total annual rainfall
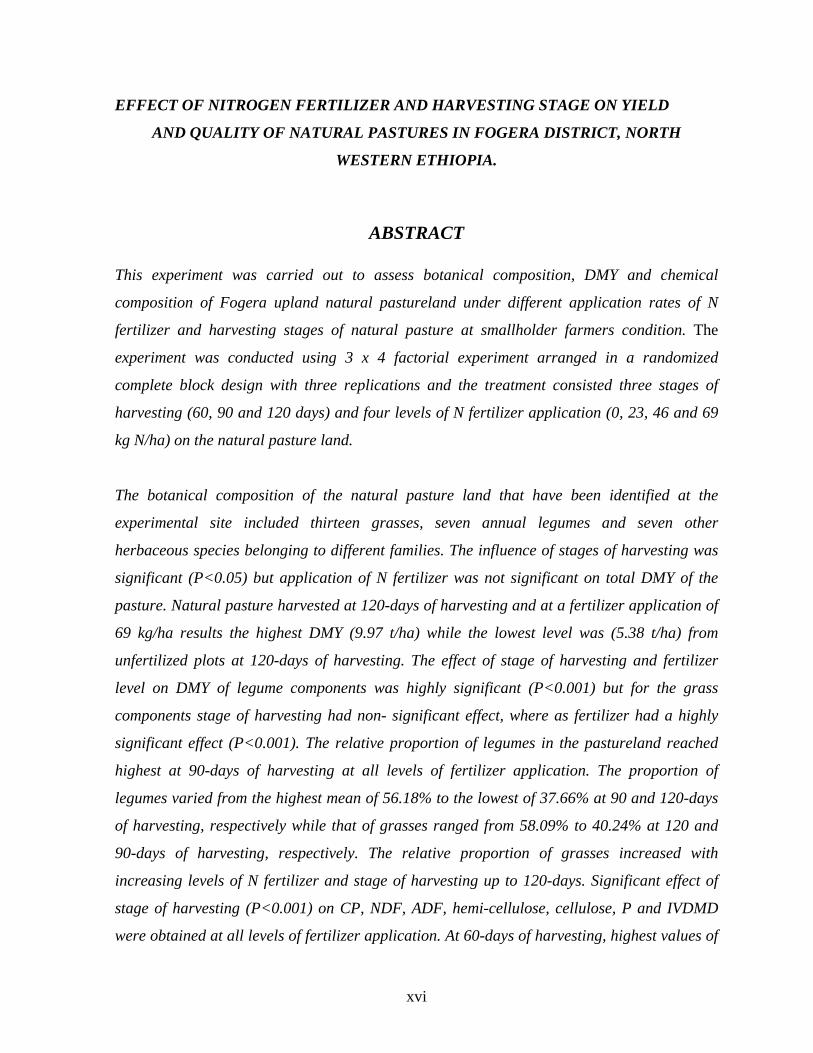
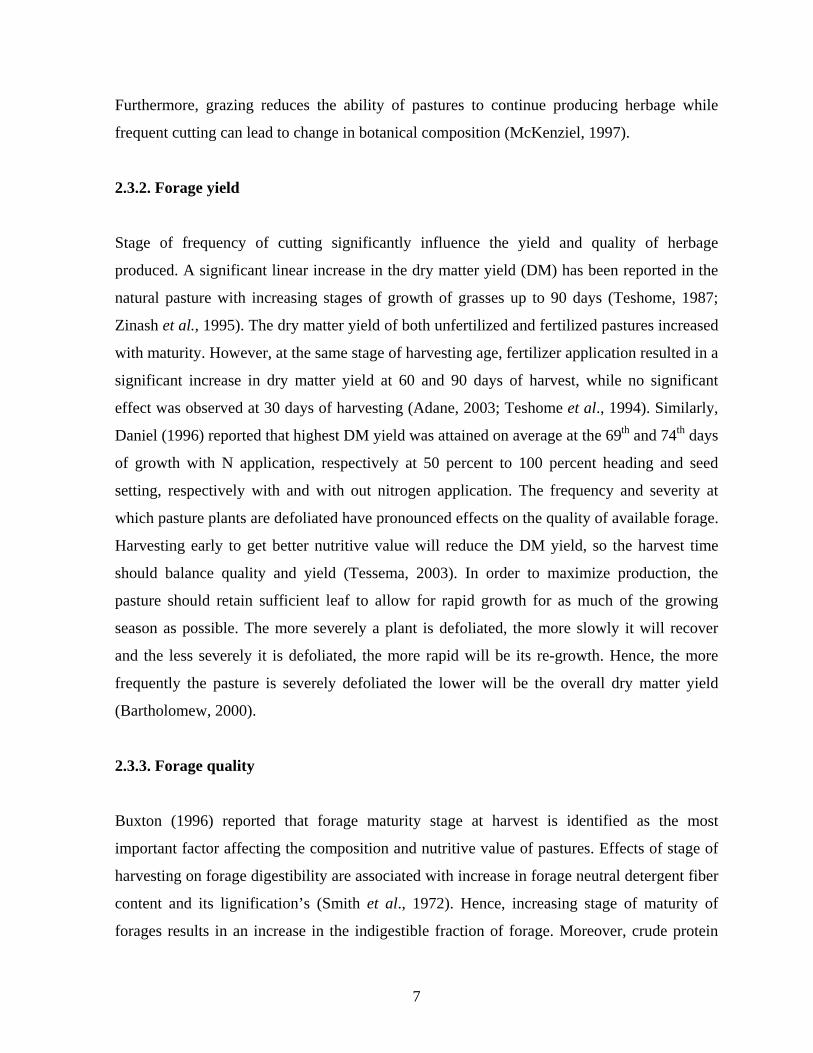
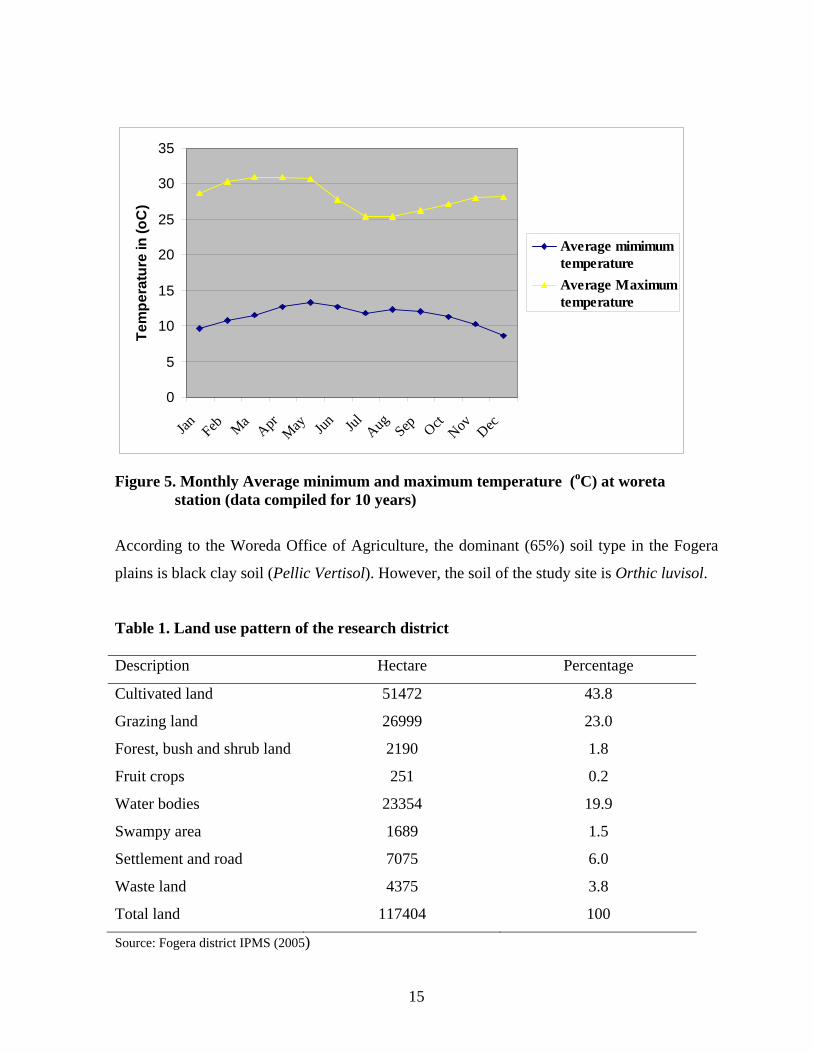
is received between June and October. The average yearly minimum and maximum
temperatures (Figure 3) are 12.60 oC and 27.90 oC, respectively (NWZMS, 2004).
400
350
300
Rai
nfal
l (m
m)
250
200
150
100
50
0
Feb SepMa Apr May Jun Jul Aug OctJan Nov Dec
Figure 4. Monthly rainfall distribution at Woreta Station (data compiled for 10 years)
14
0
5
10
15
20
25
30
35
Jan Feb MaApr
May Jun Jul Aug Sep OctNov Dec
Tem
pera
ture
in (o
C)
Average mimimumtemperatureAverage Maximumtemperature
Figure 5. Monthly Average minimum and maximum temperature (oC) at woreta
station (data compiled for 10 years)
According to the Woreda Office of Agriculture, the dominant (65%) soil type in the Fogera
plains is black clay soil (Pellic Vertisol). However, the soil of the study site is Orthic luvisol.
Table 1. Land use pattern of the research district Description Hectare Percentage
Cultivated land 51472 43.8
Grazing land 26999 23.0
Forest, bush and shrub land 2190 1.8
Fruit crops 251 0.2
Water bodies 23354 19.9
Swampy area 1689 1.5
Settlement and road 7075 6.0
Waste land 4375 3.8
Total land 117404 100
Source: Fogera district IPMS (2005)
15
3.1.3. On-farm feed resources
Natural pasture could be utilized as a grazing or green feed in the form of cut and carry
system. It is the major feed resources in Fogera district. The resource occupies about 23% of
the total land coverage. In the district, livestock production entirely depends on the use of
natural pasturelands, fallow croplands and crop residues (Table 2). In the area, the annual DM
yield of privately owned natural pasturelands was estimated to be 3.92-5.52 t/ha. However,
due to seasonality of rainfall distribution and the high stocking rate, DM yields from
communally owned natural pasturelands are highly reduced and cannot provide the nutritional
requirements for more than half of the year Continuous grazing and stall-feeding of mostly
oxen with crop residues are the common feeding systems in the highlands of Ethiopia. Free
grazing, sometimes under the control of herders, is also practiced with natural pasturelands,
fallows and stubble grazing. Zinash et al. (1995), Lemma (2002), and Alemayehu (2004)
reported that livestock in the central highlands graze on communal, fallow and permanent
pasturelands during cropping season and on croplands after harvest.
The contribution of crop residues to the feed resource base is significant (Getachew, 2002;
Solomon, 2004). Daniel (1988), Lemma (2002) reported that under the Ethiopian condition,
crop residues provide 40 to 50% of the annual livestock feed requirement. In most central
highlands of Ethiopia, crop residues account for 27% of the total annual feed supply during
the dry periods (Gashaw, 1992). The quantities of different crop residues produced depend on
the total area cultivated, the access of the season’s rainfall, crop species as well as other inputs
such as fertilizers (Daniel, 1988). Oxen are given priority for feeding crop residues mainly
during the peak period of ploughing and followed by weak animals and lactating cows
(Mohamed and Abate, 1995). Trees and shrubs play a significant role in livestock production
in very limited places. The importance and availability of trees and shrubs in tropical Africa
are influenced by the distribution, type and importance of livestock, their integration and role
within the farming systems and availability of alternative sources of feed (Getachew, 2002).
16
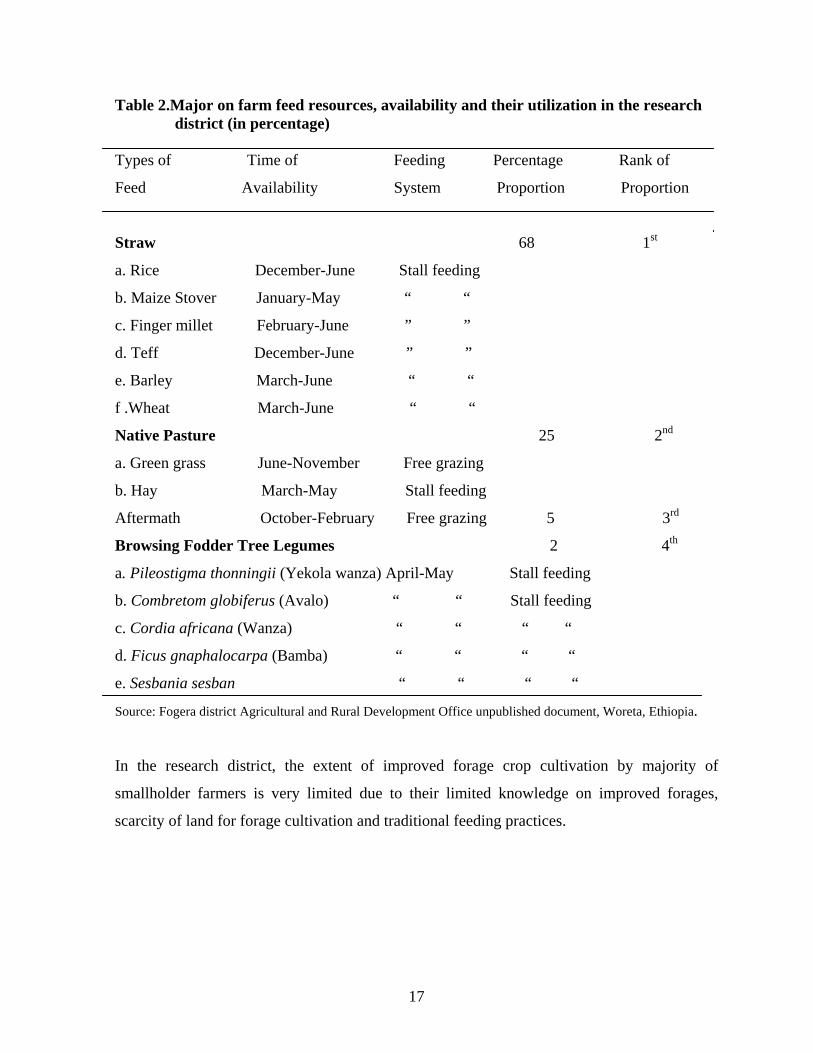
Table 2.Major on farm feed resources, availability and their utilization in the research district (in percentage)
Types of Time of Feeding Percentage Rank of
Feed Availability System Proportion Proportion
Straw 68 1st
a. Rice December-June Stall feeding
b. Maize Stover January-May “ “
c. Finger millet February-June ” ”
d. Teff December-June ” ”
e. Barley March-June “ “
f .Wheat March-June “ “
Native Pasture 25 2nd
a. Green grass June-November Free grazing
b. Hay March-May Stall feeding
Aftermath October-February Free grazing 5 3rd
Browsing Fodder Tree Legumes 2 4th
a. Pileostigma thonningii (Yekola wanza) April-May Stall feeding
b. Combretom globiferus (Avalo) “ “ Stall feeding
c. Cordia africana (Wanza) “ “ “ “
d. Ficus gnaphalocarpa (Bamba) “ “ “ “
e. Sesbania sesban “ “ “ “
Source: Fogera district Agricultural and Rural Development Office unpublished document, Woreta, Ethiopia.
In the research district, the extent of improved forage crop cultivation by majority of
smallholder farmers is very limited due to their limited knowledge on improved forages,
scarcity of land for forage cultivation and traditional feeding practices.
17
3.1.4. Farming system
Like most parts of South Gondar Zone, the predominant form of farming practice in Fogera
district is smallholder mixed crop livestock farming. Mixed farming systems are characterized
by interdependency between crop and livestock activities (Ostergaard, 1995). It is the main
system of production for smallholder farmers in many developing countries (Ostergaard,
1995; Blackburn, 1998). The largest share of the total milk and meat available in the country
is produced by mixed farming systems (Ostergaard, 1995). The principal objective of farmers
engaged in mixed farming is to gain complementary benefit from an optimum mixture of crop
and livestock farming and spreading income and risks over both crop and livestock production
(Lemma, 2002; Solomon, 2004). In the mixed crop livestock farming systems, livestock
provide important inputs to crop cultivation, especially manure and traction. Livestock are
often the major source of cash that farmers can use to buy agricultural inputs. In turn, crops
provide livestock with feed in the form of residues and by-products from crop production,
which are converted into valuable products like meat, milk, and traction (ILCA, 1992; BoRD,
2003).
Livestock rearing for milk, draught power and meat is a major part of the overall agricultural
activities in the research district. All types of livestock graze on the communal grazing land
with a high stocking rate that characterize the traditional system of grazing management
(Table 3). However, in recent years the natural pastureland is invaded by unwanted weed such
as Hygrophila auriculata (Amekala), which is estimated to be 10,000 hectares of the Woreda
grazing land is invaded by this weed species.
18
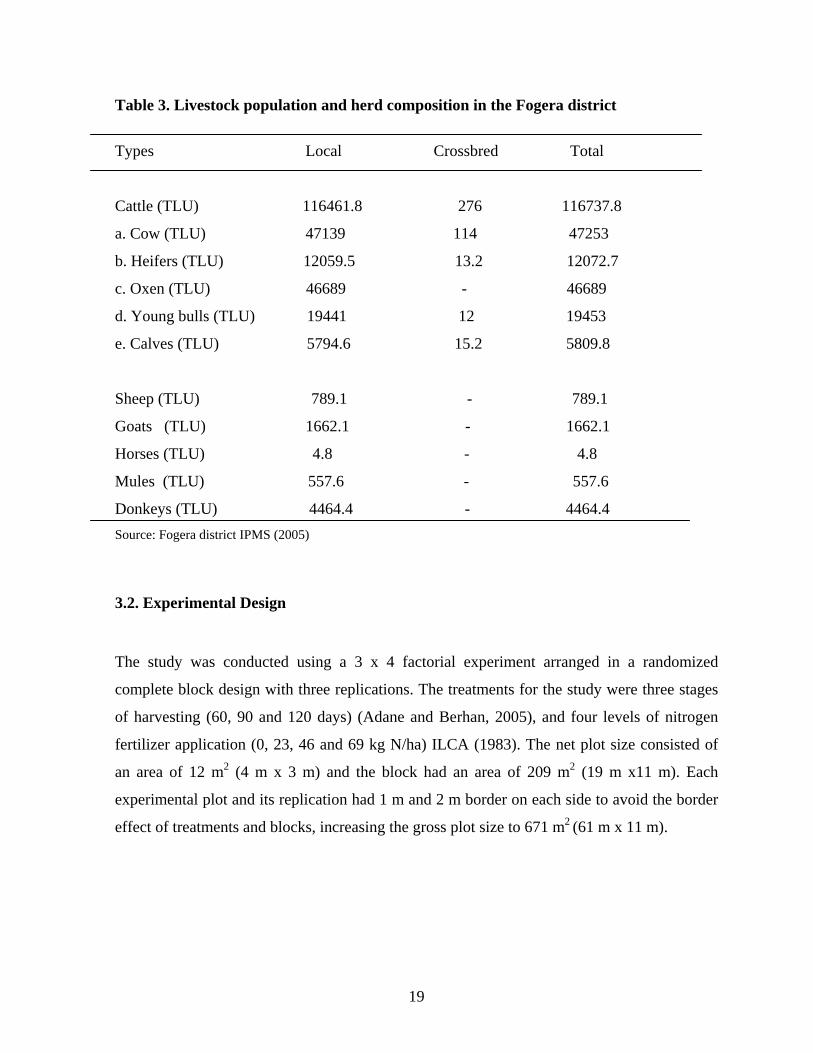
Table 3. Livestock population and herd composition in the Fogera district
Types Local Crossbred Total
Cattle (TLU) 116461.8 276 116737.8
a. Cow (TLU) 47139 114 47253
b. Heifers (TLU) 12059.5 13.2 12072.7
c. Oxen (TLU) 46689 - 46689
d. Young bulls (TLU) 19441 12 19453
e. Calves (TLU) 5794.6 15.2 5809.8
Sheep (TLU) 789.1 - 789.1
Goats (TLU) 1662.1 - 1662.1
Horses (TLU) 4.8 - 4.8
Mules (TLU) 557.6 - 557.6
Donkeys (TLU) 4464.4 - 4464.4 Source: Fogera district IPMS (2005)
3.2. Experimental Design
The study was conducted using a 3 x 4 factorial experiment arranged in a randomized
complete block design with three replications. The treatments for the study were three stages
of harvesting (60, 90 and 120 days) (Adane and Berhan, 2005), and four levels of nitrogen
fertilizer application (0, 23, 46 and 69 kg N/ha) ILCA (1983). The net plot size consisted of
an area of 12 m2 (4 m x 3 m) and the block had an area of 209 m2 (19 m x11 m). Each
experimental plot and its replication had 1 m and 2 m border on each side to avoid the border
effect of treatments and blocks, increasing the gross plot size to 671 m2 (61 m x 11 m).
19
3.3. Sampling Procedures
The vegetation from each treatment was sampled using a quadrat of 0.25 m2 (0.5 m x 0.5 m)
size during a predetermined sampling period. The material was harvested with a sickle at a
height of 10 cm above ground. The quadrat was randomly thrown three times per plot and the
average weight of the three harvests per plot was used for determination of pasture yield and
quality. Following harvesting the forage samples from each plot were weighed, labeled and
air dried under shade and kept in separate perforated bags for chemical analysis.
A total of thirty-six representative oven-dried forage sub-samples were taken to ILRI nutrition
laboratory for chemical analysis. The samples were dried in an oven at 65 -70oC for 72 hours
and ground using Willey mill to pass through 1 mm sieve. Ground samples were allowed to
equilibrate at room temperature for 24 hr and stored until required for chemical analysis.
For determination of species composition, forage samples were harvested at harvesting stages
of 60, 90 and 120 days and samples were weighed immediately and hand-sorted into botanical
components of grasses, legumes and others (weeds) and then each of these were weighed
separately.
3.4. Measurements
3.4.1. Botanical composition
The botanical composition with regard to relative proportion of the grasses, legumes and other
herbages in the treatment plots on weight basis was determined by relating the weights of
each group to the weight of the whole samples. The dry weight rank (DWR) procedure
(Tothill et al., 1978) that involves cutting and sorting by hand was used to measure percentage
proportion of each forage type.
20
TDW of species = TFW of a species X SDW of a species (1)
SFW of a species
% proportion of species = TDW of a species X 100 (2)
GTDW
Where, TFW = Total fresh weight of individual species, SFW = sub-sample fresh weight,
TDW = Total dry weight, SDW = sub- sample dry weight and GTDW = Grand total dry
weight.
Identification of species was undertaken in situ by using an illustrated field guide of Froman
and Persson (1974) for grasses and Thulin (1972) for legumes.
3.4.2. Pasture yield
The pasture yield was determined on dry matter basis by harvesting forage samples from an
area of 0.25 m2 (0.5 m x 0.5 m) quadrat which was randomly thrown three times per plot. The
average weight of the forage in the quadrat was used and extrapolated into dry matter yield
per hectare (t/ha).
Forage samples within the quadrat area were harvested by hand and weighed immediately.
Sub-samples representing 10% of the whole forage samples harvested from the treatments
were taken for DM determination. The effect of cutting frequency was investigated on plots
which already harvested at 60 days stage of harvesting. Cutting was made three times, each at
30 days interval, and the sum of the yields of the 1st and 2nd cutting was compared with the
yields of plots harvested once at 90 day. Similarly, the sum of the yields of the first, second
and third harvests was compared with the yield of the single harvest at 120 days interval.
21
3.4.3. Chemical analyses
The chemical analyses for determination of nutritional composition were carried out by the
proximate analyses method. Nitrogen content was determined by taking sub-samples from an
oven-dried forage sample employing the Kjeldhal method (AOAC, 1990). The protein content
was calculated by multiplying the nitrogen content by 6.25. The total ash content was
determined by igniting the forage samples in a muffle furnace at 550 oC for 5 hours (AOAC,
1990). The Van Soest method of forage analysis was applied to determine Neutral Detergent
Fiber (NDF) and Acid Detergent Fiber (ADF). The amount of hemi-cellulose was determined
as the difference between NDF and ADF, where as cellulose content was determined by
subtracting Acid Detergent Lignin (ADL) and Acid Detergent Fiber ash (ADF ash) from Acid
detergent fiber (ADF). Phosphorus content was determined by auto-analyzer (Chemlab,
1978). The modified Tiller and Terry method was used for the determination of in-vitro dry
matter digestibility of forage samples (Van Soest and Robertson, 1985).
The forage samples were dried to a constant dry weight in an oven at 100 ± 5 oc for 24 hrs to
determine percent dry weight before any analytical procedure. All the chemical analysis of the
samples was performed in duplicate. Finally, all results were calculated on a dry matter basis.
3.4.4. Soil analysis
Soil samples were collected randomly from12 spots within the experimental site at a depth of
0-10 cm before broadcasting of nitrogen fertilizer. The collected soil samples were dried and
thoroughly mixed (composited) and prepared for determination of pH, organic matter (OM),
electrical conductivity of extracts (ECe),available phosphorus (P), total nitrogen (N) and
texture. Total N and available P were estimated by the Kjeldahl procedure (Bremner and
Mulvaney, 1982) and Olsen method (Olsen, et al., 1954), respectively. The Walkley and
Black (1954) method as described by Anderson and Ingram (1993) was used to determine
OM. Organic matter percentage was obtained by multiplying organic carbon percentage with
1.724. The pH of the soil was measured potentiometrically using a digital pH meter in the
supernatant suspension of 1: 2.5 liquid ratios where the liquid was water. Soil texture was
22
determined by using the hydrometer method (Black et al., 1965). Determination of ECe of soil
water was made by an indirect measurement of soil salinity. The soil analyses were
undertaken at Haramaya University Soil Laboratory.
3.6. Statistical Analyses
Analysis of variance (ANOVA) was carried out using the General Linear Model Procedure of
SAS (SAS, 1998). Cutting frequency was analyzed by MSTATC (1989) Mean separations
were made using the Least Significant Difference (LSD). The association between (60, 90,
120), (0, 23, 46, 69), DMY and quality parameters of natural pasturelands was determined by
correlation analysis (SPSS, 1996).
1. The model for the design is as follows:
Yijk= µ+ Fi+ Hj + FHij + Rk+ EijkR
Where, Yijk= Observation in the jth harvesting stage and ith fertilizer application (the response
variable)
µ = Overall mean
Fi = the ith fertilizer effect
Hj = the effect of jth harvesting stage
Rk= the effect of kth replication
FHij = the effect of ijth interaction between fertilizer and harvesting stage
EijkR= Random error (residuals)
2. The model of cutting frequency is as follows:
Yijk= µ+ Fi + Cj + FCij + Rk+ EijkR
Where, Yijk= Observation in the jth cutting frequency and ith fertilizer application (the response
variable)
µ = Overall mean
Fi = the ith fertilizer effect
Cj = the effect of jth cutiing frequency
23
Rk= the effect of kth replication
FCij = the effect of ijth interaction between fertilizer and cutting frequency
Eijkl= Random error (residuals)
24
4. RESULTS AND DISCUSSION
4.1. Physical and Chemical Characteristics of Soil of the Experimental Field
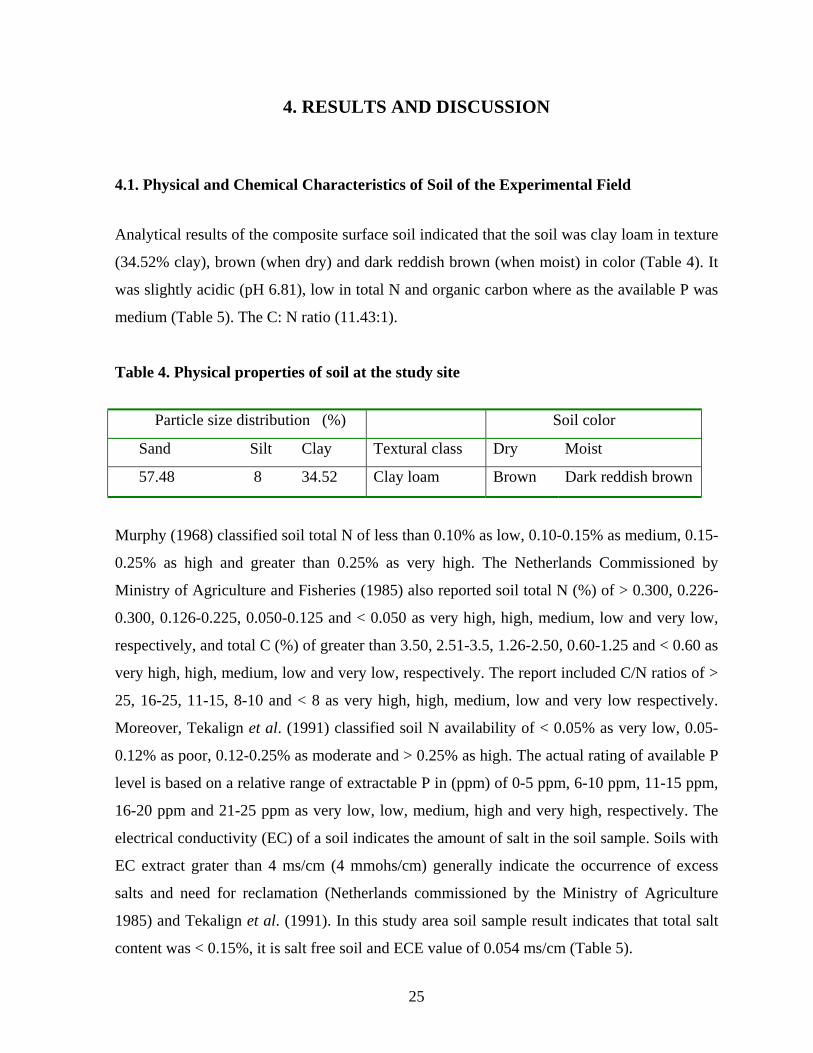
Analytical results of the composite surface soil indicated that the soil was clay loam in texture
(34.52% clay), brown (when dry) and dark reddish brown (when moist) in color (Table 4). It
was slightly acidic (pH 6.81), low in total N and organic carbon where as the available P was
medium (Table 5). The C: N ratio (11.43:1).
Table 4. Physical properties of soil at the study site
Particle size distribution (%) Soil color
Sand Silt Clay Textural class Dry Moist
57.48 8 34.52 Clay loam Brown Dark reddish brown
Murphy (1968) classified soil total N of less than 0.10% as low, 0.10-0.15% as medium, 0.15-
0.25% as high and greater than 0.25% as very high. The Netherlands Commissioned by
Ministry of Agriculture and Fisheries (1985) also reported soil total N (%) of > 0.300, 0.226-
0.300, 0.126-0.225, 0.050-0.125 and < 0.050 as very high, high, medium, low and very low,
respectively, and total C (%) of greater than 3.50, 2.51-3.5, 1.26-2.50, 0.60-1.25 and < 0.60 as
very high, high, medium, low and very low, respectively. The report included C/N ratios of >
25, 16-25, 11-15, 8-10 and < 8 as very high, high, medium, low and very low respectively.
Moreover, Tekalign et al. (1991) classified soil N availability of < 0.05% as very low, 0.05-
0.12% as poor, 0.12-0.25% as moderate and > 0.25% as high. The actual rating of available P
level is based on a relative range of extractable P in (ppm) of 0-5 ppm, 6-10 ppm, 11-15 ppm,
16-20 ppm and 21-25 ppm as very low, low, medium, high and very high, respectively. The
electrical conductivity (EC) of a soil indicates the amount of salt in the soil sample. Soils with
EC extract grater than 4 ms/cm (4 mmohs/cm) generally indicate the occurrence of excess
salts and need for reclamation (Netherlands commissioned by the Ministry of Agriculture
1985) and Tekalign et al. (1991). In this study area soil sample result indicates that total salt
content was < 0.15%, it is salt free soil and ECE value of 0.054 ms/cm (Table 5).
25
26
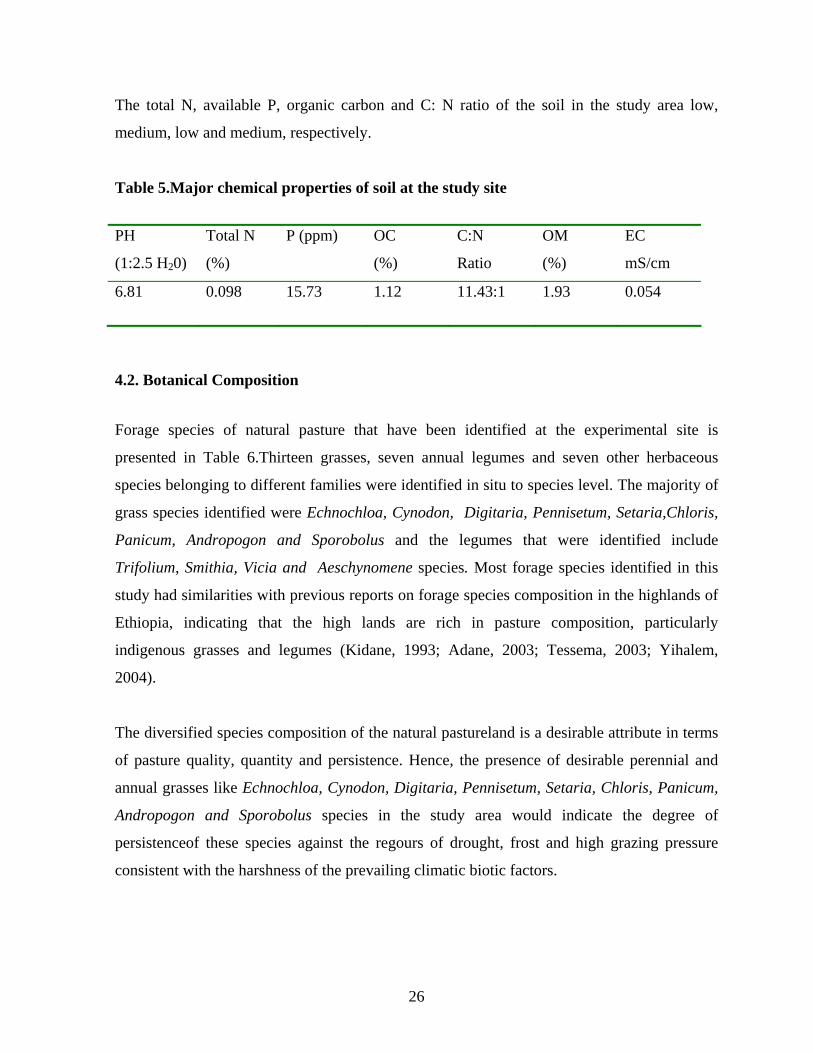
The total N, available P, organic carbon and C: N ratio of the soil in the study area low,
medium, low and medium, respectively.
Table 5.Major chemical properties of soil at the study site
PH
(1:2.5 H20)
Total N
(%)
P (ppm)
OC
(%)
C:N
Ratio
OM
(%)
EC
mS/cm
6.81 0.098 15.73 1.12 11.43:1 1.93 0.054
4.2. Botanical Composition
Forage species of natural pasture that have been identified at the experimental site is
presented in Table 6.Thirteen grasses, seven annual legumes and seven other herbaceous
species belonging to different families were identified in situ to species level. The majority of
grass species identified were Echnochloa, Cynodon, Digitaria, Pennisetum, Setaria,Chloris,
Panicum, Andropogon and Sporobolus and the legumes that were identified include
Trifolium, Smithia, Vicia and Aeschynomene species. Most forage species identified in this
study had similarities with previous reports on forage species composition in the highlands of
Ethiopia, indicating that the high lands are rich in pasture composition, particularly
indigenous grasses and legumes (Kidane, 1993; Adane, 2003; Tessema, 2003; Yihalem,
2004).
The diversified species composition of the natural pastureland is a desirable attribute in terms
of pasture quality, quantity and persistence. Hence, the presence of desirable perennial and
annual grasses like Echnochloa, Cynodon, Digitaria, Pennisetum, Setaria, Chloris, Panicum,
Andropogon and Sporobolus species in the study area would indicate the degree of
persistenceof these species against the regours of drought, frost and high grazing pressure
consistent with the harshness of the prevailing climatic biotic factors.
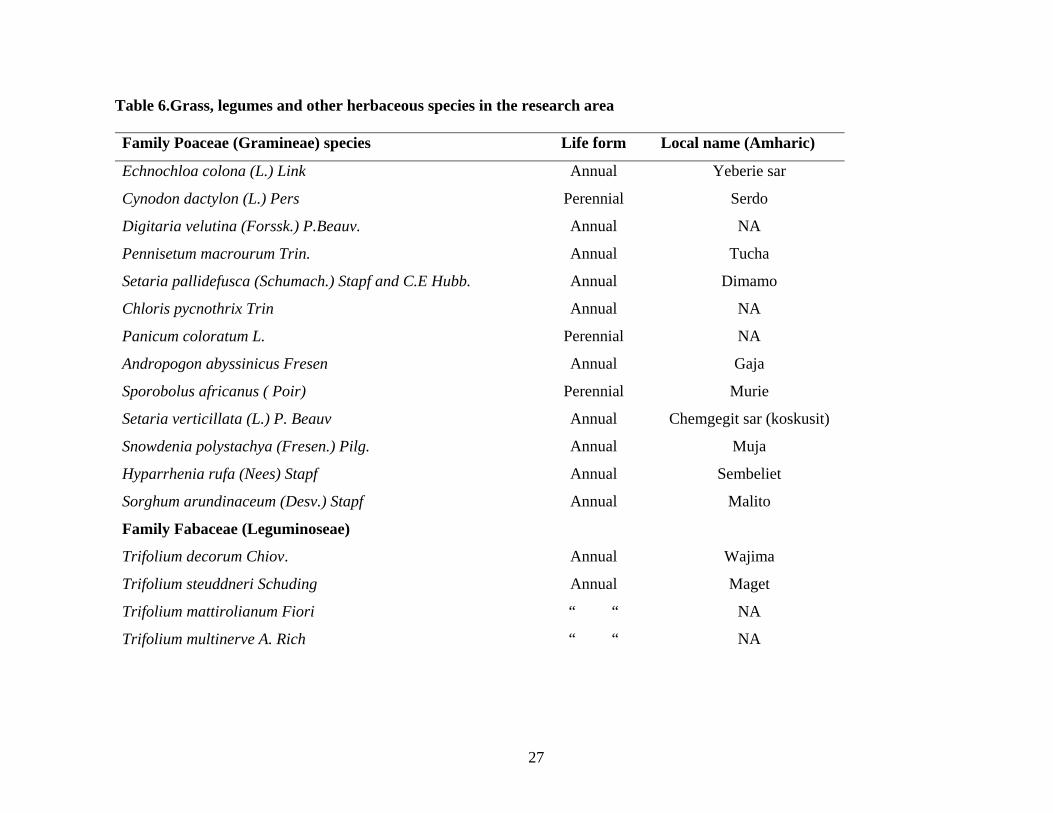
Table 6.Grass, legumes and other herbaceous species in the research area Family Poaceae (Gramineae) species Life form Local name (Amharic)
Echnochloa colona (L.) Link Annual Yeberie sar
Cynodon dactylon (L.) Pers Perennial
Serdo
Digitaria velutina (Forssk.) P.Beauv. Annual NA
Pennisetum macrourum Trin. Annual Tucha
Setaria pallidefusca (Schumach.) Stapf and C.E Hubb. Annual Dimamo
Chloris pycnothrix Trin Annual NA
Panicum coloratum L. Perennial NA
Andropogon abyssinicus Fresen Annual Gaja
Sporobolus africanus ( Poir) Perennial Murie
Setaria verticillata (L.) P. Beauv Annual Chemgegit sar (koskusit)
Snowdenia polystachya (Fresen.) Pilg. Annual Muja
Hyparrhenia rufa (Nees) Stapf Annual Sembeliet
Sorghum arundinaceum (Desv.) Stapf Annual Malito
Family Fabaceae (Leguminoseae)
Trifolium decorum Chiov. Annual Wajima
Trifolium steuddneri Schuding Annual Maget
Trifolium mattirolianum Fiori “ “ NA
Trifolium multinerve A. Rich “ “ NA
27
28
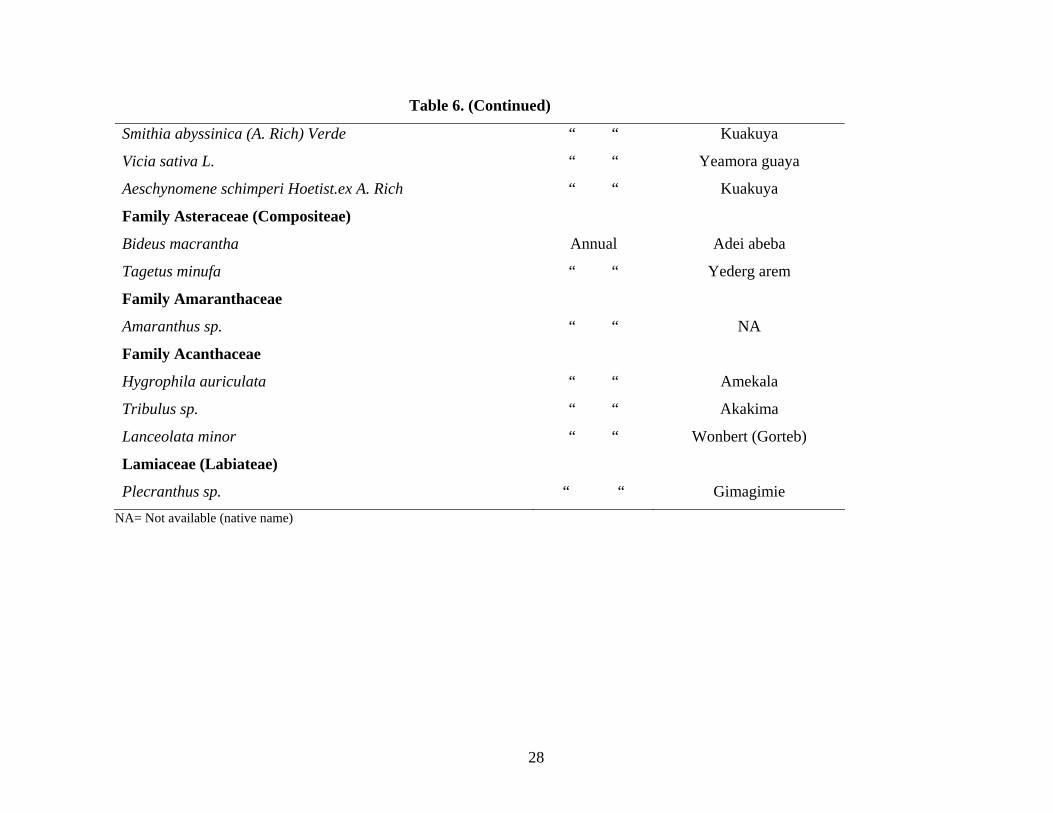
Table 6. (Continued)
Smithia abyssinica (A. Rich) Verde “ “ Kuakuya
Vicia sativa L. “ “ Yeamora guaya
Aeschynomene schimperi Hoetist.ex A. Rich “ “ Kuakuya
Family Asteraceae (Compositeae)
Bideus macrantha Annual Adei abeba
Tagetus minufa “ “ Yederg arem
Family Amaranthaceae
Amaranthus sp. “ “ NA
Family Acanthaceae
Hygrophila auriculata “ “ Amekala
Tribulus sp. “ “ Akakima
Lanceolata minor “ “ Wonbert (Gorteb)
Lamiaceae (Labiateae)
Plecranthus sp. “ “ Gimagimie NA= Not available (native name)
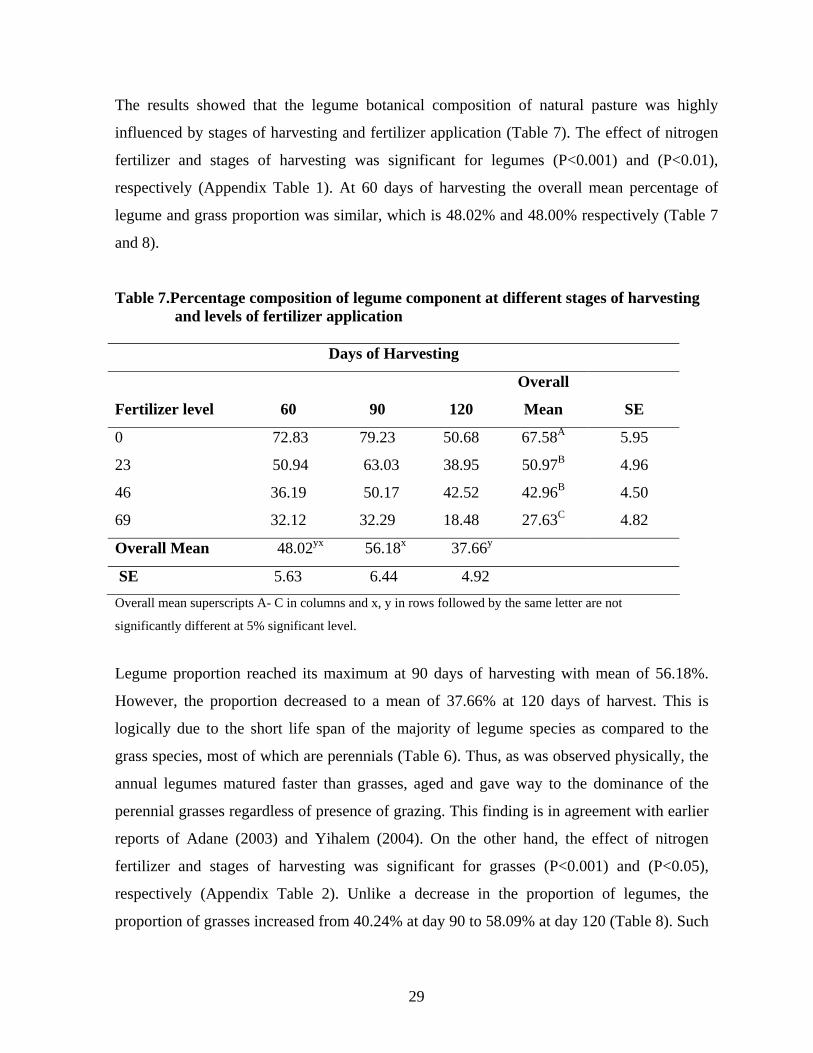
The results showed that the legume botanical composition of natural pasture was highly
influenced by stages of harvesting and fertilizer application (Table 7). The effect of nitrogen
fertilizer and stages of harvesting was significant for legumes (P<0.001) and (P<0.01),
respectively (Appendix Table 1). At 60 days of harvesting the overall mean percentage of
legume and grass proportion was similar, which is 48.02% and 48.00% respectively (Table 7
and 8).
Table 7.Percentage composition of legume component at different stages of harvesting and levels of fertilizer application
Days of Harvesting
Fertilizer level
60
90
120
Overall
Mean
SE
0 72.83 79.23 50.68 67.58A 5.95
23 50.94 63.03 38.95 50.97B 4.96
46 36.19 50.17 42.52 42.96B 4.50
69 32.12 32.29 18.48 27.63C 4.82
Overall Mean 48.02yx 56.18x 37.66y
SE 5.63 6.44 4.92 Overall mean superscripts A- C in columns and x, y in rows followed by the same letter are not
significantly different at 5% significant level.
Legume proportion reached its maximum at 90 days of harvesting with mean of 56.18%.
However, the proportion decreased to a mean of 37.66% at 120 days of harvest. This is
logically due to the short life span of the majority of legume species as compared to the
grass species, most of which are perennials (Table 6). Thus, as was observed physically, the
annual legumes matured faster than grasses, aged and gave way to the dominance of the
perennial grasses regardless of presence of grazing. This finding is in agreement with earlier
reports of Adane (2003) and Yihalem (2004). On the other hand, the effect of nitrogen
fertilizer and stages of harvesting was significant for grasses (P<0.001) and (P<0.05),
respectively (Appendix Table 2). Unlike a decrease in the proportion of legumes, the
proportion of grasses increased from 40.24% at day 90 to 58.09% at day 120 (Table 8). Such
29
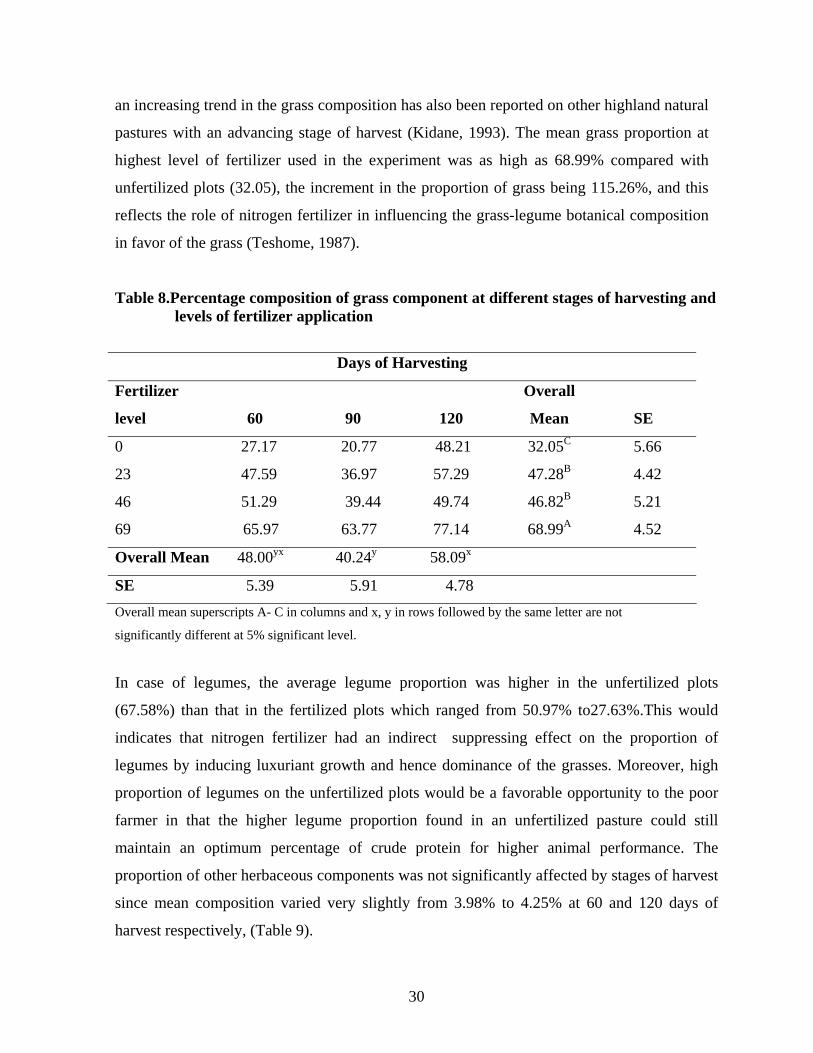
an increasing trend in the grass composition has also been reported on other highland natural
pastures with an advancing stage of harvest (Kidane, 1993). The mean grass proportion at
highest level of fertilizer used in the experiment was as high as 68.99% compared with
unfertilized plots (32.05), the increment in the proportion of grass being 115.26%, and this
reflects the role of nitrogen fertilizer in influencing the grass-legume botanical composition
in favor of the grass (Teshome, 1987).
Table 8.Percentage composition of grass component at different stages of harvesting and levels of fertilizer application
Days of Harvesting
Fertilizer
level
60
90
120
Overall
Mean
SE
0 27.17 20.77 48.21 32.05C 5.66
23 47.59 36.97 57.29 47.28B 4.42
46 51.29 39.44 49.74 46.82B 5.21
69 65.97 63.77 77.14 68.99A 4.52
Overall Mean 48.00yx 40.24y 58.09x
SE 5.39 5.91 4.78 Overall mean superscripts A- C in columns and x, y in rows followed by the same letter are not
significantly different at 5% significant level.
In case of legumes, the average legume proportion was higher in the unfertilized plots
(67.58%) than that in the fertilized plots which ranged from 50.97% to27.63%.This would
indicates that nitrogen fertilizer had an indirect suppressing effect on the proportion of
legumes by inducing luxuriant growth and hence dominance of the grasses. Moreover, high
proportion of legumes on the unfertilized plots would be a favorable opportunity to the poor
farmer in that the higher legume proportion found in an unfertilized pasture could still
maintain an optimum percentage of crude protein for higher animal performance. The
proportion of other herbaceous components was not significantly affected by stages of harvest
since mean composition varied very slightly from 3.98% to 4.25% at 60 and 120 days of
harvest respectively, (Table 9).
30
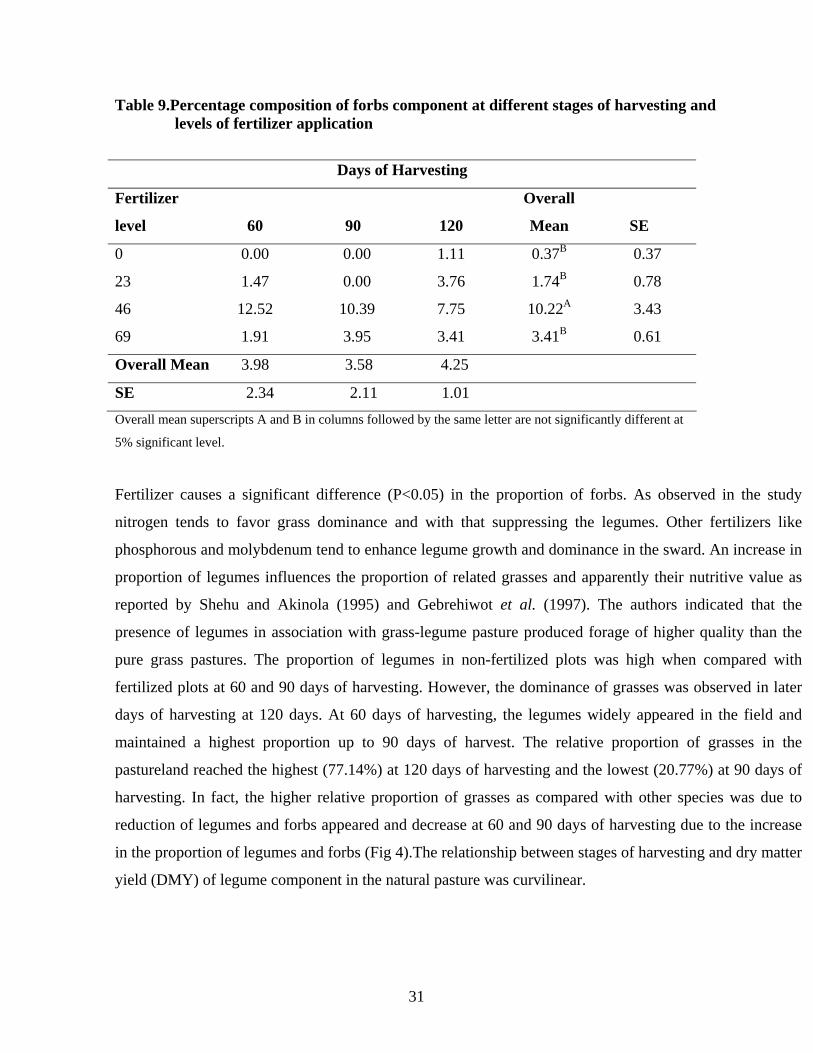
Table 9.Percentage composition of forbs component at different stages of harvesting and levels of fertilizer application
Days of Harvesting
Fertilizer
level
60
90
120
Overall
Mean
SE
0 0.00 0.00 1.11 0.37B 0.37
23 1.47 0.00 3.76 1.74B 0.78
46 12.52 10.39 7.75 10.22A 3.43
69 1.91 3.95 3.41 3.41B 0.61
Overall Mean 3.98 3.58 4.25
SE 2.34 2.11 1.01 Overall mean superscripts A and B in columns followed by the same letter are not significantly different at
5% significant level.
Fertilizer causes a significant difference (P<0.05) in the proportion of forbs. As observed in the study
nitrogen tends to favor grass dominance and with that suppressing the legumes. Other fertilizers like
phosphorous and molybdenum tend to enhance legume growth and dominance in the sward. An increase in
proportion of legumes influences the proportion of related grasses and apparently their nutritive value as
reported by Shehu and Akinola (1995) and Gebrehiwot et al. (1997). The authors indicated that the
presence of legumes in association with grass-legume pasture produced forage of higher quality than the
pure grass pastures. The proportion of legumes in non-fertilized plots was high when compared with
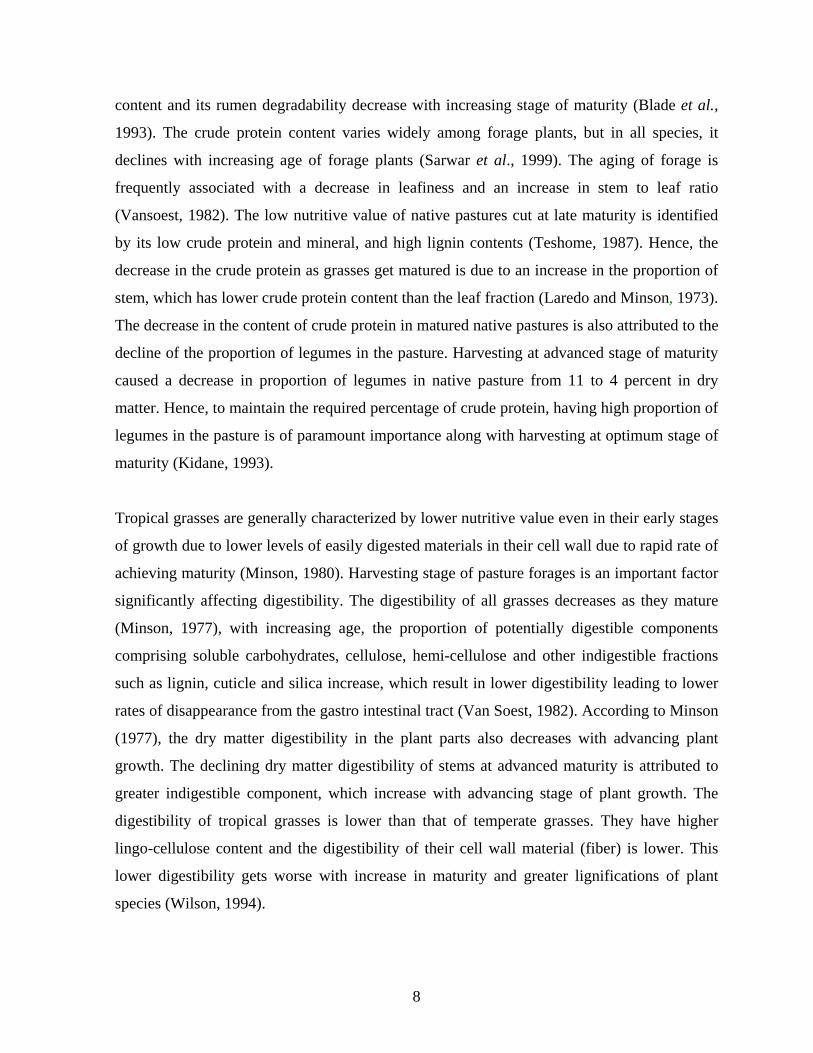
fertilized plots at 60 and 90 days of harvesting. However, the dominance of grasses was observed in later
days of harvesting at 120 days. At 60 days of harvesting, the legumes widely appeared in the field and
maintained a highest proportion up to 90 days of harvest. The relative proportion of grasses in the
pastureland reached the highest (77.14%) at 120 days of harvesting and the lowest (20.77%) at 90 days of
harvesting. In fact, the higher relative proportion of grasses as compared with other species was due to
reduction of legumes and forbs appeared and decrease at 60 and 90 days of harvesting due to the increase
in the proportion of legumes and forbs (Fig 4).The relationship between stages of harvesting and dry matter
yield (DMY) of legume component in the natural pasture was curvilinear.
31
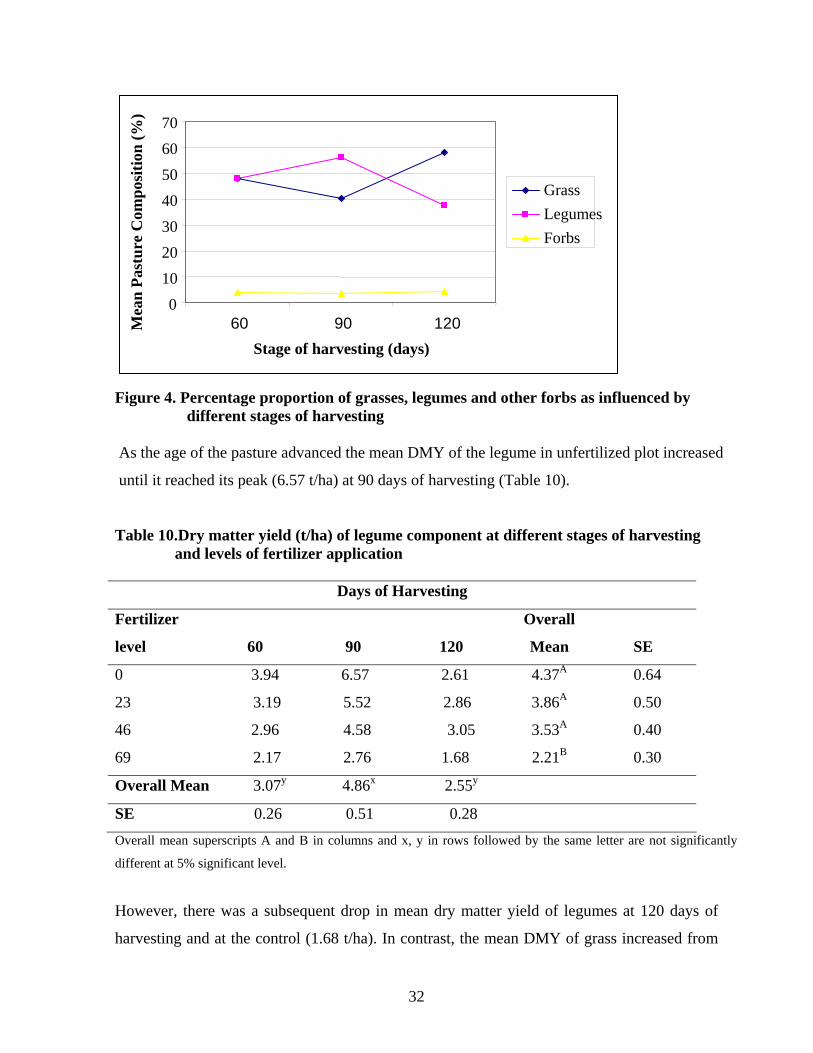
M
ean
Past
ure
Com
posi
tion
(%) 70
60 50
Grass40
Legumes 30 20 10 0
60 90 120Stage of harvesting (days)
Forbs
Figure 4. Percentage proportion of grasses, legumes and other forbs as influenced by
different stages of harvesting As the age of the pasture advanced the mean DMY of the legume in unfertilized plot increased
until it reached its peak (6.57 t/ha) at 90 days of harvesting (Table 10).
Table 10.Dry matter yield (t/ha) of legume component at different stages of harvesting and levels of fertilizer application
Days of Harvesting
Fertilizer
level
60
90
120
Overall
Mean
SE
0 3.94 6.57 2.61 4.37A 0.64
23 3.19 5.52 2.86 3.86A 0.50
46 2.96 4.58 3.05 3.53A 0.40
69 2.17 2.76 1.68 2.21B 0.30
Overall Mean 3.07y 4.86x 2.55y
SE 0.26 0.51 0.28 Overall mean superscripts A and B in columns and x, y in rows followed by the same letter are not significantly
different at 5% significant level.
However, there was a subsequent drop in mean dry matter yield of legumes at 120 days of
harvesting and at the control (1.68 t/ha). In contrast, the mean DMY of grass increased from
32
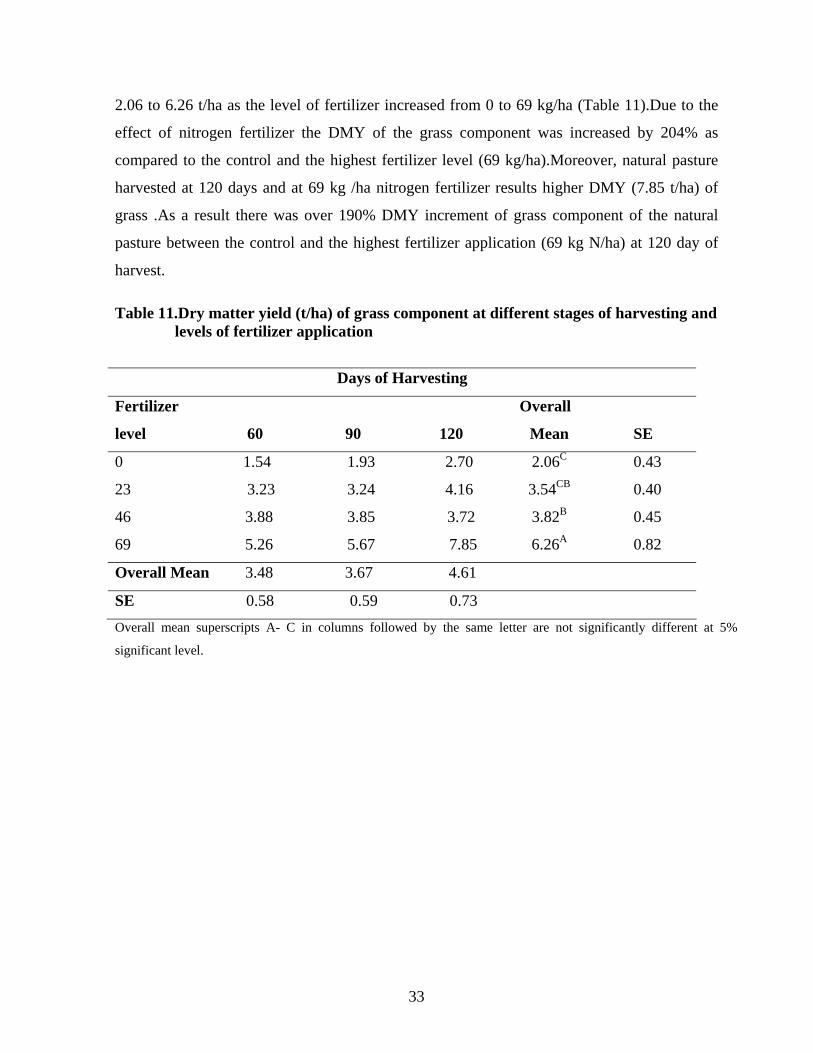
2.06 to 6.26 t/ha as the level of fertilizer increased from 0 to 69 kg/ha (Table 11).Due to the
effect of nitrogen fertilizer the DMY of the grass component was increased by 204% as
compared to the control and the highest fertilizer level (69 kg/ha).Moreover, natural pasture
harvested at 120 days and at 69 kg /ha nitrogen fertilizer results higher DMY (7.85 t/ha) of
grass .As a result there was over 190% DMY increment of grass component of the natural
pasture between the control and the highest fertilizer application (69 kg N/ha) at 120 day of
harvest. Table 11.Dry matter yield (t/ha) of grass component at different stages of harvesting and
levels of fertilizer application
Days of Harvesting
Fertilizer
level
60
90
120
Overall
Mean
SE
0 1.54 1.93 2.70 2.06C 0.43
23 3.23 3.24 4.16 3.54CB 0.40
46 3.88 3.85 3.72 3.82B 0.45
69 5.26 5.67 7.85 6.26A 0.82
Overall Mean 3.48 3.67 4.61
SE 0.58 0.59 0.73 Overall mean superscripts A- C in columns followed by the same letter are not significantly different at 5%
significant level.
33
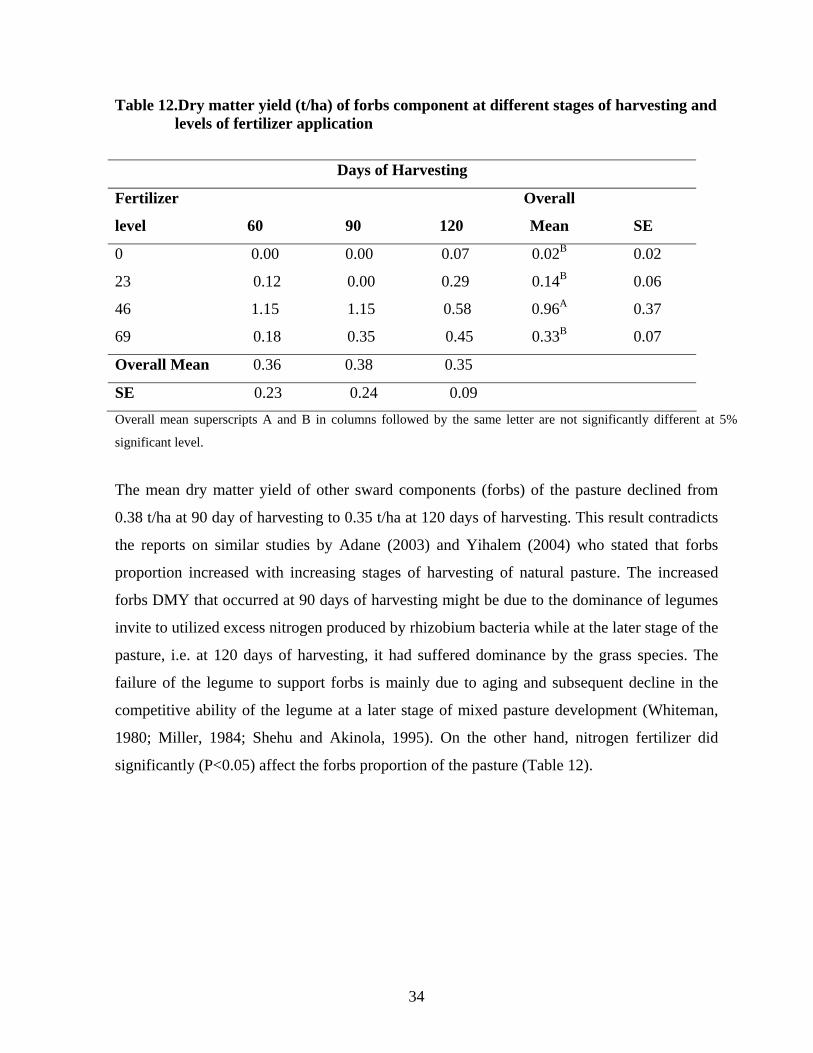
Table 12.Dry matter yield (t/ha) of forbs component at different stages of harvesting and levels of fertilizer application
Days of Harvesting
Fertilizer
level
60
90
120
Overall
Mean
SE
0 0.00 0.00 0.07 0.02B 0.02
23 0.12 0.00 0.29 0.14B 0.06
46 1.15 1.15 0.58 0.96A 0.37
69 0.18 0.35 0.45 0.33B 0.07
Overall Mean 0.36 0.38 0.35
SE 0.23 0.24 0.09 Overall mean superscripts A and B in columns followed by the same letter are not significantly different at 5%
significant level.
The mean dry matter yield of other sward components (forbs) of the pasture declined from
0.38 t/ha at 90 day of harvesting to 0.35 t/ha at 120 days of harvesting. This result contradicts
the reports on similar studies by Adane (2003) and Yihalem (2004) who stated that forbs
proportion increased with increasing stages of harvesting of natural pasture. The increased
forbs DMY that occurred at 90 days of harvesting might be due to the dominance of legumes
invite to utilized excess nitrogen produced by rhizobium bacteria while at the later stage of the
pasture, i.e. at 120 days of harvesting, it had suffered dominance by the grass species. The
failure of the legume to support forbs is mainly due to aging and subsequent decline in the
competitive ability of the legume at a later stage of mixed pasture development (Whiteman,
1980; Miller, 1984; Shehu and Akinola, 1995). On the other hand, nitrogen fertilizer did
significantly (P<0.05) affect the forbs proportion of the pasture (Table 12).
34
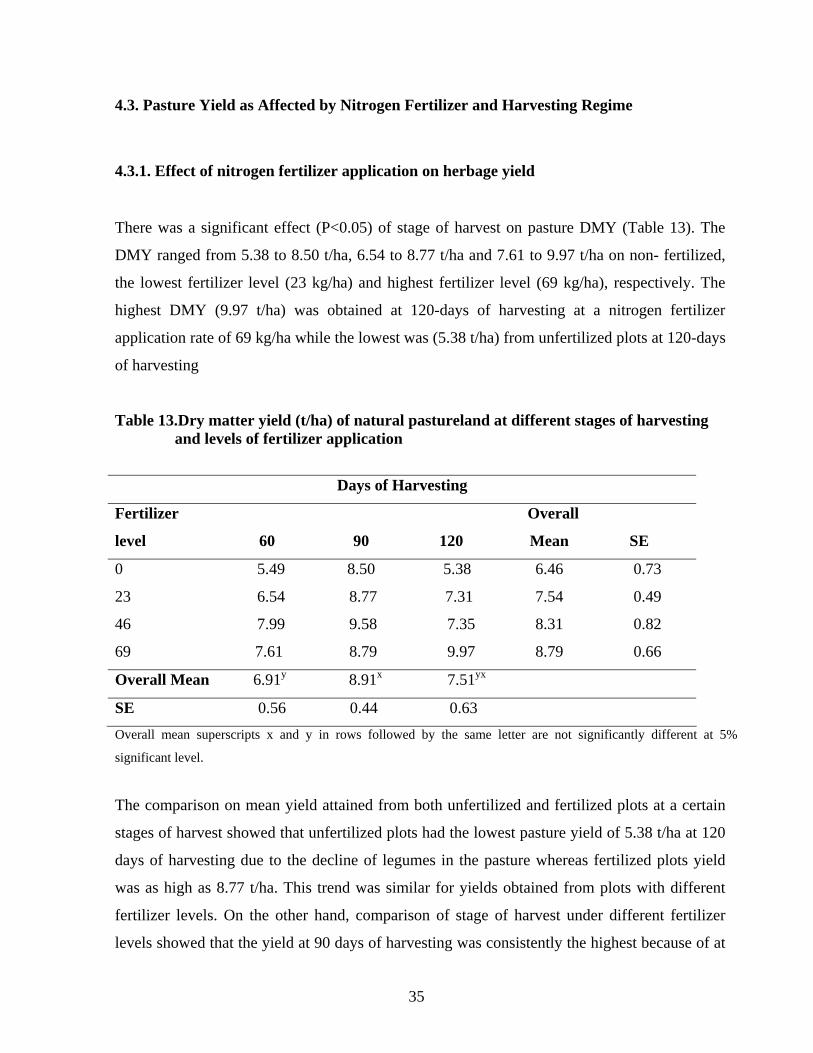
4.3. Pasture Yield as Affected by Nitrogen Fertilizer and Harvesting Regime
4.3.1. Effect of nitrogen fertilizer application on herbage yield
There was a significant effect (P<0.05) of stage of harvest on pasture DMY (Table 13). The
DMY ranged from 5.38 to 8.50 t/ha, 6.54 to 8.77 t/ha and 7.61 to 9.97 t/ha on non- fertilized,
the lowest fertilizer level (23 kg/ha) and highest fertilizer level (69 kg/ha), respectively. The
highest DMY (9.97 t/ha) was obtained at 120-days of harvesting at a nitrogen fertilizer
application rate of 69 kg/ha while the lowest was (5.38 t/ha) from unfertilized plots at 120-days
of harvesting
Table 13.Dry matter yield (t/ha) of natural pastureland at different stages of harvesting and levels of fertilizer application
Days of Harvesting
Fertilizer
level
60
90
120
Overall
Mean
SE
0 5.49 8.50 5.38 6.46 0.73
23 6.54 8.77 7.31 7.54 0.49
46 7.99 9.58 7.35 8.31 0.82
69 7.61 8.79 9.97 8.79 0.66
Overall Mean 6.91y 8.91x 7.51yx
SE 0.56 0.44 0.63 Overall mean superscripts x and y in rows followed by the same letter are not significantly different at 5%
significant level.
The comparison on mean yield attained from both unfertilized and fertilized plots at a certain
stages of harvest showed that unfertilized plots had the lowest pasture yield of 5.38 t/ha at 120
days of harvesting due to the decline of legumes in the pasture whereas fertilized plots yield
was as high as 8.77 t/ha. This trend was similar for yields obtained from plots with different
fertilizer levels. On the other hand, comparison of stage of harvest under different fertilizer
levels showed that the yield at 90 days of harvesting was consistently the highest because of at
35
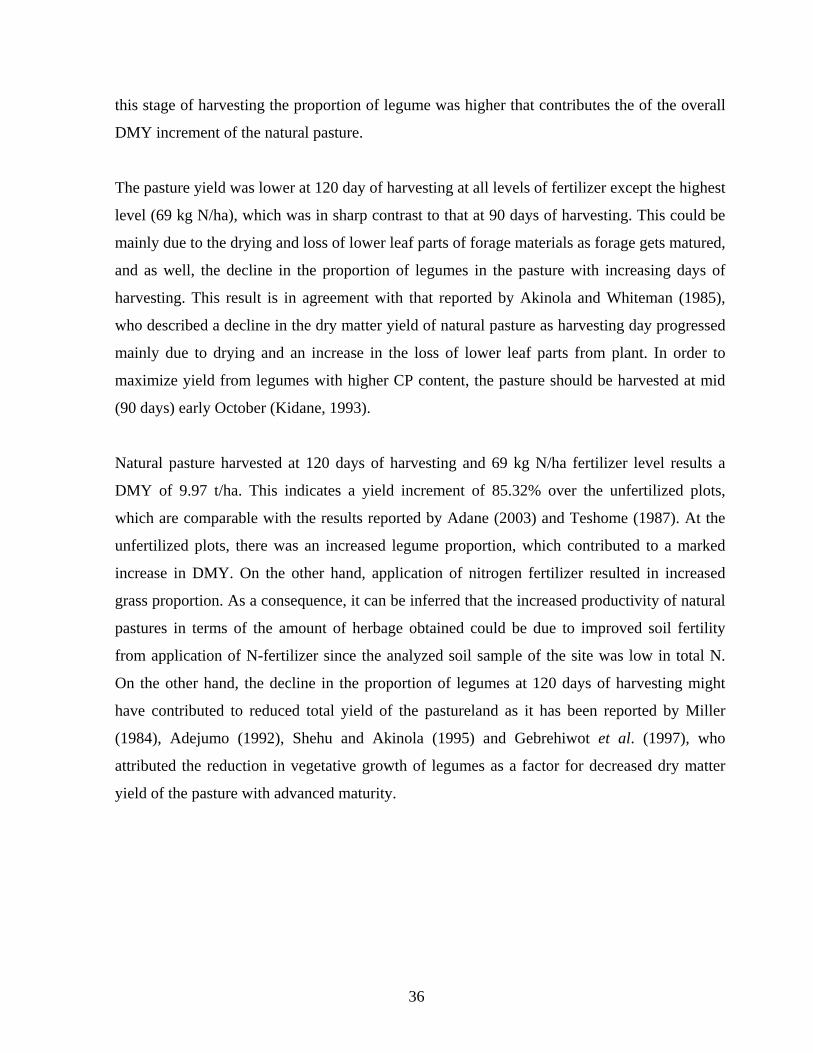
this stage of harvesting the proportion of legume was higher that contributes the of the overall
DMY increment of the natural pasture.
The pasture yield was lower at 120 day of harvesting at all levels of fertilizer except the highest
level (69 kg N/ha), which was in sharp contrast to that at 90 days of harvesting. This could be
mainly due to the drying and loss of lower leaf parts of forage materials as forage gets matured,
and as well, the decline in the proportion of legumes in the pasture with increasing days of
harvesting. This result is in agreement with that reported by Akinola and Whiteman (1985),
who described a decline in the dry matter yield of natural pasture as harvesting day progressed
mainly due to drying and an increase in the loss of lower leaf parts from plant. In order to
maximize yield from legumes with higher CP content, the pasture should be harvested at mid
(90 days) early October (Kidane, 1993).
Natural pasture harvested at 120 days of harvesting and 69 kg N/ha fertilizer level results a
DMY of 9.97 t/ha. This indicates a yield increment of 85.32% over the unfertilized plots,
which are comparable with the results reported by Adane (2003) and Teshome (1987). At the
unfertilized plots, there was an increased legume proportion, which contributed to a marked
increase in DMY. On the other hand, application of nitrogen fertilizer resulted in increased
grass proportion. As a consequence, it can be inferred that the increased productivity of natural
pastures in terms of the amount of herbage obtained could be due to improved soil fertility
from application of N-fertilizer since the analyzed soil sample of the site was low in total N.
On the other hand, the decline in the proportion of legumes at 120 days of harvesting might
have contributed to reduced total yield of the pastureland as it has been reported by Miller
(1984), Adejumo (1992), Shehu and Akinola (1995) and Gebrehiwot et al. (1997), who
attributed the reduction in vegetative growth of legumes as a factor for decreased dry matter
yield of the pasture with advanced maturity.
36
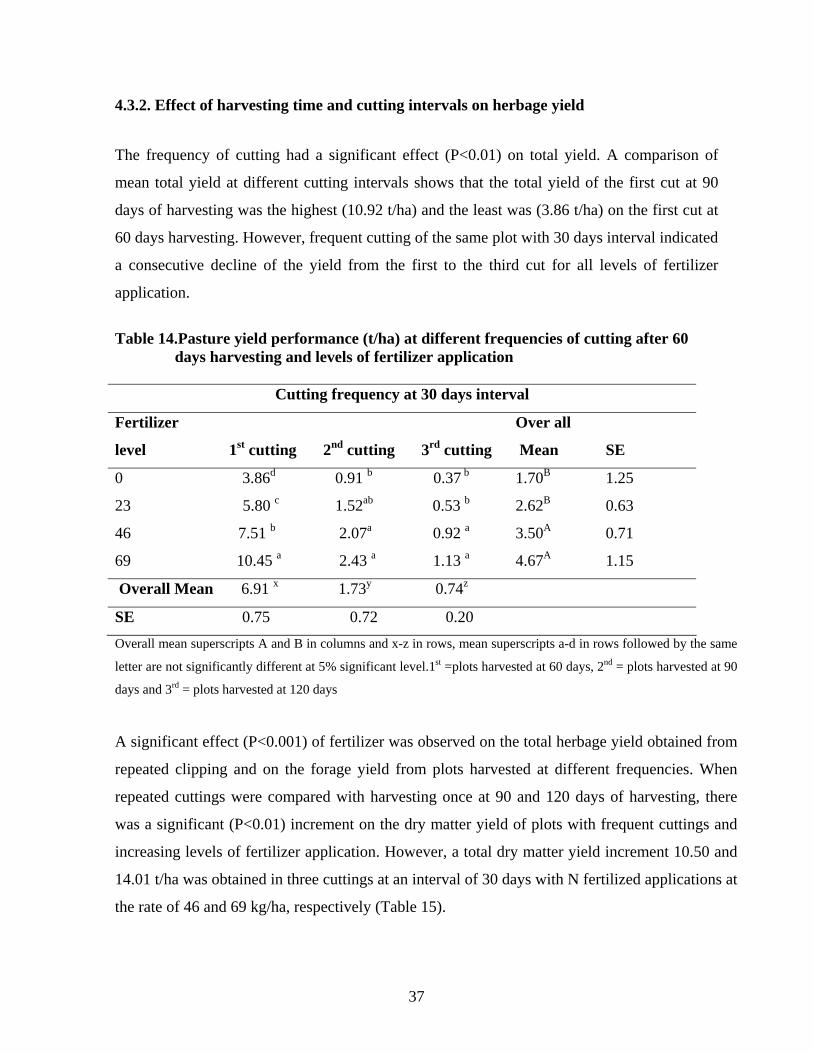
4.3.2. Effect of harvesting time and cutting intervals on herbage yield
The frequency of cutting had a significant effect (P<0.01) on total yield. A comparison of
mean total yield at different cutting intervals shows that the total yield of the first cut at 90
days of harvesting was the highest (10.92 t/ha) and the least was (3.86 t/ha) on the first cut at
60 days harvesting. However, frequent cutting of the same plot with 30 days interval indicated
a consecutive decline of the yield from the first to the third cut for all levels of fertilizer
application.
Table 14.Pasture yield performance (t/ha) at different frequencies of cutting after 60
days harvesting and levels of fertilizer application
Cutting frequency at 30 days interval
Fertilizer
level
1st cutting
2nd cutting
3rd cutting
Over all
Mean
SE
0 3.86d 0.91 b 0.37 b 1.70B 1.25
23 5.80 c 1.52ab 0.53 b 2.62B 0.63
46 7.51 b 2.07a 0.92 a 3.50A 0.71
69 10.45 a 2.43 a 1.13 a 4.67A 1.15
Overall Mean 6.91 x 1.73y 0.74z
SE 0.75 0.72 0.20 Overall mean superscripts A and B in columns and x-z in rows, mean superscripts a-d in rows followed by the same
letter are not significantly different at 5% significant level.1st =plots harvested at 60 days, 2nd = plots harvested at 90
days and 3rd = plots harvested at 120 days
A significant effect (P<0.001) of fertilizer was observed on the total herbage yield obtained from
repeated clipping and on the forage yield from plots harvested at different frequencies. When
repeated cuttings were compared with harvesting once at 90 and 120 days of harvesting, there
was a significant (P<0.01) increment on the dry matter yield of plots with frequent cuttings and
increasing levels of fertilizer application. However, a total dry matter yield increment 10.50 and
14.01 t/ha was obtained in three cuttings at an interval of 30 days with N fertilized applications at
the rate of 46 and 69 kg/ha, respectively (Table 15).
37
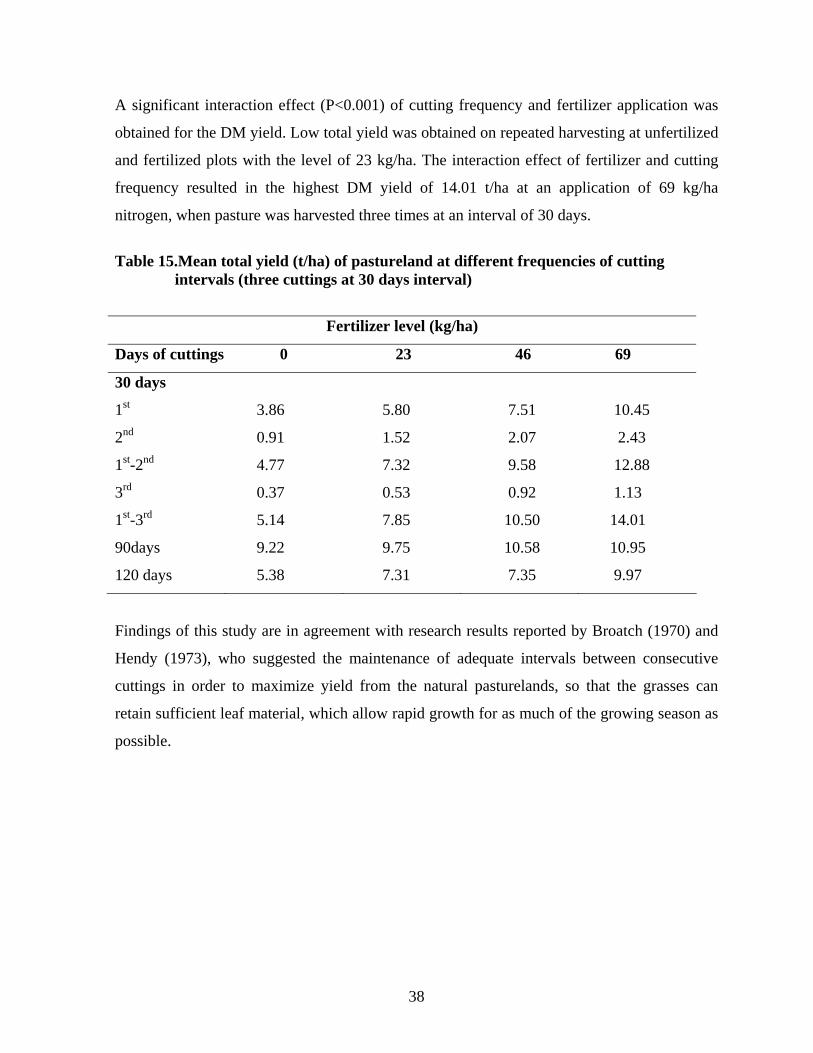
A significant interaction effect (P<0.001) of cutting frequency and fertilizer application was
obtained for the DM yield. Low total yield was obtained on repeated harvesting at unfertilized
and fertilized plots with the level of 23 kg/ha. The interaction effect of fertilizer and cutting
frequency resulted in the highest DM yield of 14.01 t/ha at an application of 69 kg/ha
nitrogen, when pasture was harvested three times at an interval of 30 days.
Table 15.Mean total yield (t/ha) of pastureland at different frequencies of cutting
intervals (three cuttings at 30 days interval)
Fertilizer level (kg/ha)
Days of cuttings 0 23 46 69
30 days
1st 3.86 5.80 7.51 10.45
2nd 0.91 1.52 2.07 2.43
1st-2nd 4.77 7.32 9.58 12.88
3rd 0.37 0.53 0.92 1.13
1st-3rd 5.14 7.85 10.50 14.01
90days 9.22 9.75 10.58 10.95
120 days 5.38 7.31 7.35 9.97
Findings of this study are in agreement with research results reported by Broatch (1970) and
Hendy (1973), who suggested the maintenance of adequate intervals between consecutive
cuttings in order to maximize yield from the natural pasturelands, so that the grasses can
retain sufficient leaf material, which allow rapid growth for as much of the growing season as
possible.
38
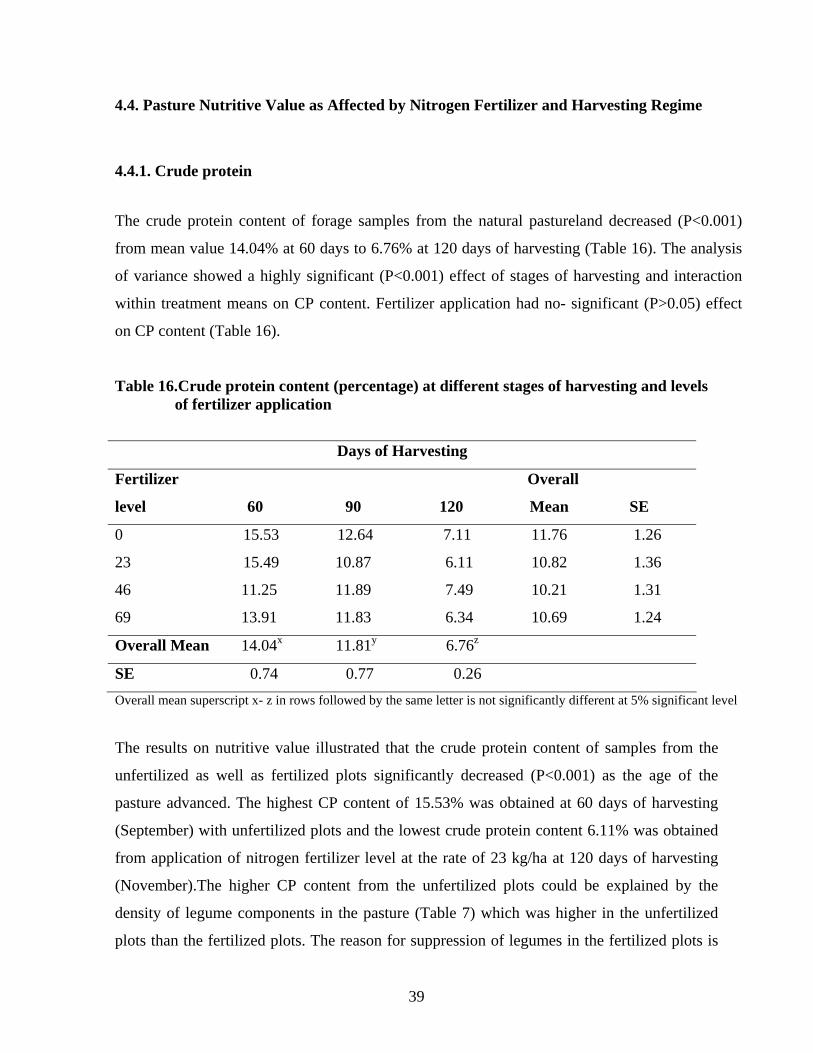
4.4. Pasture Nutritive Value as Affected by Nitrogen Fertilizer and Harvesting Regime
4.4.1. Crude protein
The crude protein content of forage samples from the natural pastureland decreased (P<0.001)
from mean value 14.04% at 60 days to 6.76% at 120 days of harvesting (Table 16). The analysis
of variance showed a highly significant (P<0.001) effect of stages of harvesting and interaction
within treatment means on CP content. Fertilizer application had no- significant (P>0.05) effect
on CP content (Table 16).
Table 16.Crude protein content (percentage) at different stages of harvesting and levels of fertilizer application
Days of Harvesting
Fertilizer
level
60
90
120
Overall
Mean
SE
0 15.53 12.64 7.11 11.76 1.26
23 15.49 10.87 6.11 10.82 1.36
46 11.25 11.89 7.49 10.21 1.31
69 13.91 11.83 6.34 10.69 1.24
Overall Mean 14.04x 11.81y 6.76z
SE 0.74 0.77 0.26 Overall mean superscript x- z in rows followed by the same letter is not significantly different at 5% significant level
The results on nutritive value illustrated that the crude protein content of samples from the
unfertilized as well as fertilized plots significantly decreased (P<0.001) as the age of the
pasture advanced. The highest CP content of 15.53% was obtained at 60 days of harvesting
(September) with unfertilized plots and the lowest crude protein content 6.11% was obtained
from application of nitrogen fertilizer level at the rate of 23 kg/ha at 120 days of harvesting
(November).The higher CP content from the unfertilized plots could be explained by the
density of legume components in the pasture (Table 7) which was higher in the unfertilized
plots than the fertilized plots. The reason for suppression of legumes in the fertilized plots is
39
partly the indirect effect of nitrogen by inducing dominance of the grass component which
tends to suppress the legume. Nitrogen may also influence legume growth through its
inhibitory effect on Rhizobial nitrogen fixation. Therefore, the high CP content from
unfertilized plots is most probably brought about by higher composition of legumes in the
sward, and legumes generally have high content of CP. As has been observed in the study site
and elsewhere in the northern part of Ethiopia, native clovers (Trifolium) tend to dominate the
natural pasture in the fallows and crop borders. The higher CP content from pastures early-
harvested than late-harvested herbage is expectable in that CP content of pastures generally
declines with maturity. The results obtained in this study were in agreement with those
reported by Zinash et al. (1995), Adane (2003), Adane and Berhan (2005) and Yihalem
(2004), who indicated that the decline in CP content of the pasture along with increasing stage
of harvesting. This might be due to the dilution of the crude protein content by an increasing
amount of structural carbohydrates in the late harvested forage materials (Hassan et al., 1990).
The CP content of forage at 120 days of harvesting was significantly lower (P<0.001) than the
other two stages of harvesting. On non- fertilized plots the CP content of forage decreased
from the herbage harvested at 60 days to that harvesting at 120 days. Similarly, the
differences in CP content among the rest of harvesting stages were all significant (P<0.001).
Considering the CP content under different levels of nitrogen application, the means for the
stages of harvesting on crude protein content indicated significant difference (P<0.001)
among 60, 90 and 120 days of harvesting.
On the other hand, considering similar stages of harvesting the pasture had considerably
higher CP content at zero fertilizer level and subsequently there was no significance increase
in crude protein content as the levels of fertilizer application increased. As explained above,
the increased CP content at unfertilized plots might be due to increased proportion of legumes
in the pasture, which generally contain high accumulation of nitrogen in the plant tissue. This
is in line with the report of Shehu and Akinola (1995), whose findings proved the high
contribution of legumes in maintaining the CP content of grass-legume mixed pastures and
associated depression in crude protein content with advancing stages of growth, consistent
with the reduction in the proportion of legumes in the pasture due to defoliation.
40
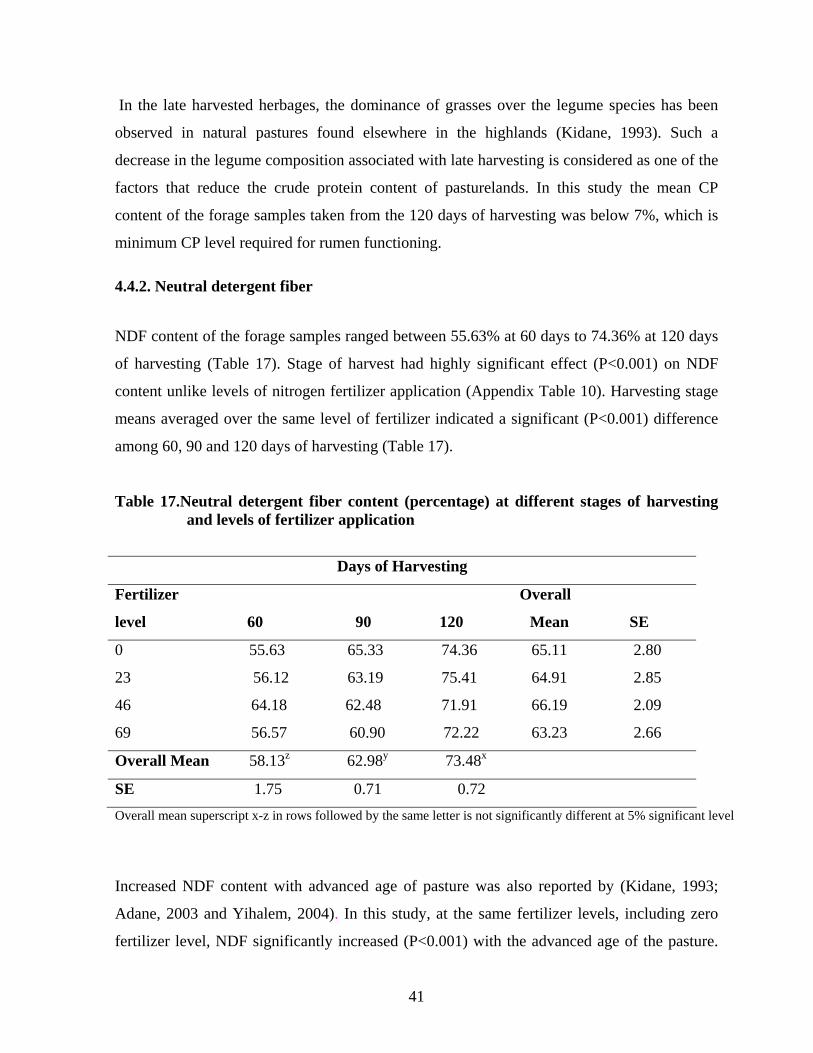
In the late harvested herbages, the dominance of grasses over the legume species has been
observed in natural pastures found elsewhere in the highlands (Kidane, 1993). Such a
decrease in the legume composition associated with late harvesting is considered as one of the
factors that reduce the crude protein content of pasturelands. In this study the mean CP
content of the forage samples taken from the 120 days of harvesting was below 7%, which is
minimum CP level required for rumen functioning.
4.4.2. Neutral detergent fiber
NDF content of the forage samples ranged between 55.63% at 60 days to 74.36% at 120 days
of harvesting (Table 17). Stage of harvest had highly significant effect (P<0.001) on NDF
content unlike levels of nitrogen fertilizer application (Appendix Table 10). Harvesting stage
means averaged over the same level of fertilizer indicated a significant (P<0.001) difference
among 60, 90 and 120 days of harvesting (Table 17).
Table 17.Neutral detergent fiber content (percentage) at different stages of harvesting and levels of fertilizer application
Days of Harvesting
Fertilizer
level
60
90
120
Overall
Mean
SE
0 55.63 65.33 74.36 65.11 2.80
23 56.12 63.19 75.41 64.91 2.85
46 64.18 62.48 71.91 66.19 2.09
69 56.57 60.90 72.22 63.23 2.66
Overall Mean 58.13z 62.98y 73.48x
SE 1.75 0.71 0.72 Overall mean superscript x-z in rows followed by the same letter is not significantly different at 5% significant level
Increased NDF content with advanced age of pasture was also reported by (Kidane, 1993;
Adane, 2003 and Yihalem, 2004). In this study, at the same fertilizer levels, including zero
fertilizer level, NDF significantly increased (P<0.001) with the advanced age of the pasture.
41
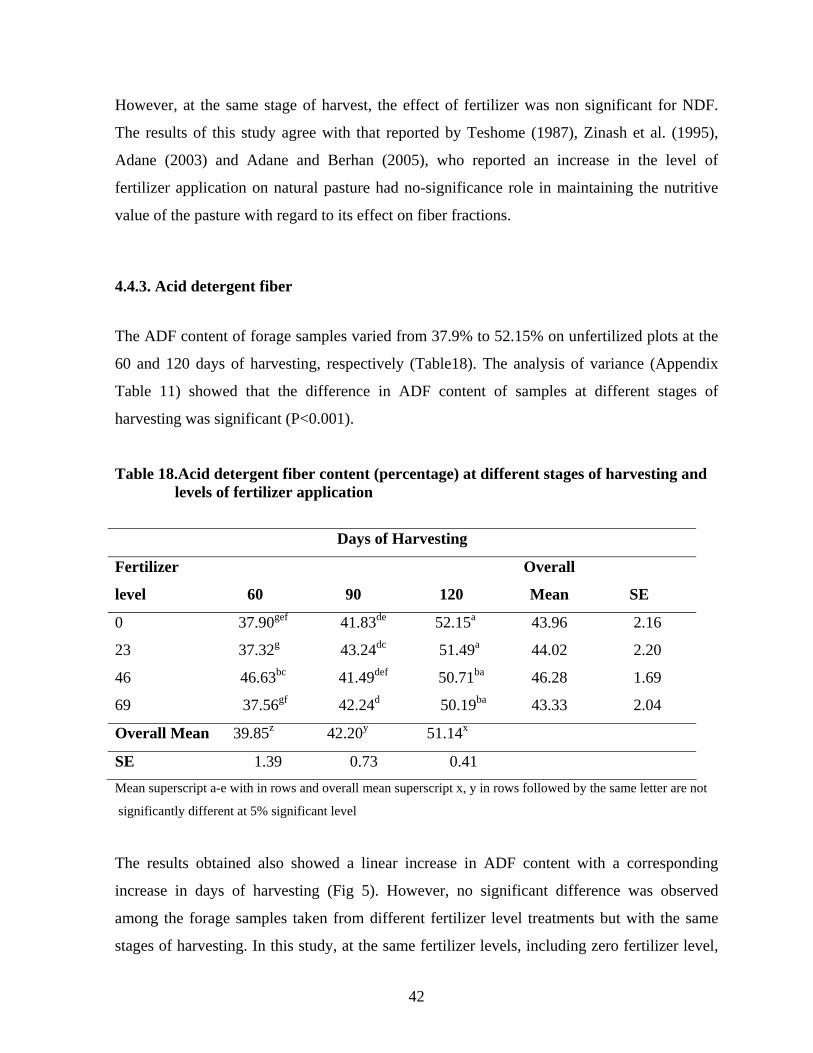
However, at the same stage of harvest, the effect of fertilizer was non significant for NDF.
The results of this study agree with that reported by Teshome (1987), Zinash et al. (1995),
Adane (2003) and Adane and Berhan (2005), who reported an increase in the level of
fertilizer application on natural pasture had no-significance role in maintaining the nutritive
value of the pasture with regard to its effect on fiber fractions.
4.4.3. Acid detergent fiber
The ADF content of forage samples varied from 37.9% to 52.15% on unfertilized plots at the
60 and 120 days of harvesting, respectively (Table18). The analysis of variance (Appendix
Table 11) showed that the difference in ADF content of samples at different stages of
harvesting was significant (P<0.001).
Table 18.Acid detergent fiber content (percentage) at different stages of harvesting and levels of fertilizer application
Days of Harvesting
Fertilizer
level
60
90
120
Overall
Mean
SE
0 37.90gef 41.83de 52.15a 43.96 2.16
23 37.32g 43.24dc 51.49a 44.02 2.20
46 46.63bc 41.49def 50.71ba 46.28 1.69
69 37.56gf 42.24d 50.19ba 43.33 2.04
Overall Mean 39.85z 42.20y 51.14x
SE 1.39 0.73 0.41 Mean superscript a-e with in rows and overall mean superscript x, y in rows followed by the same letter are not
significantly different at 5% significant level
The results obtained also showed a linear increase in ADF content with a corresponding
increase in days of harvesting (Fig 5). However, no significant difference was observed
among the forage samples taken from different fertilizer level treatments but with the same
stages of harvesting. In this study, at the same fertilizer levels, including zero fertilizer level,
42
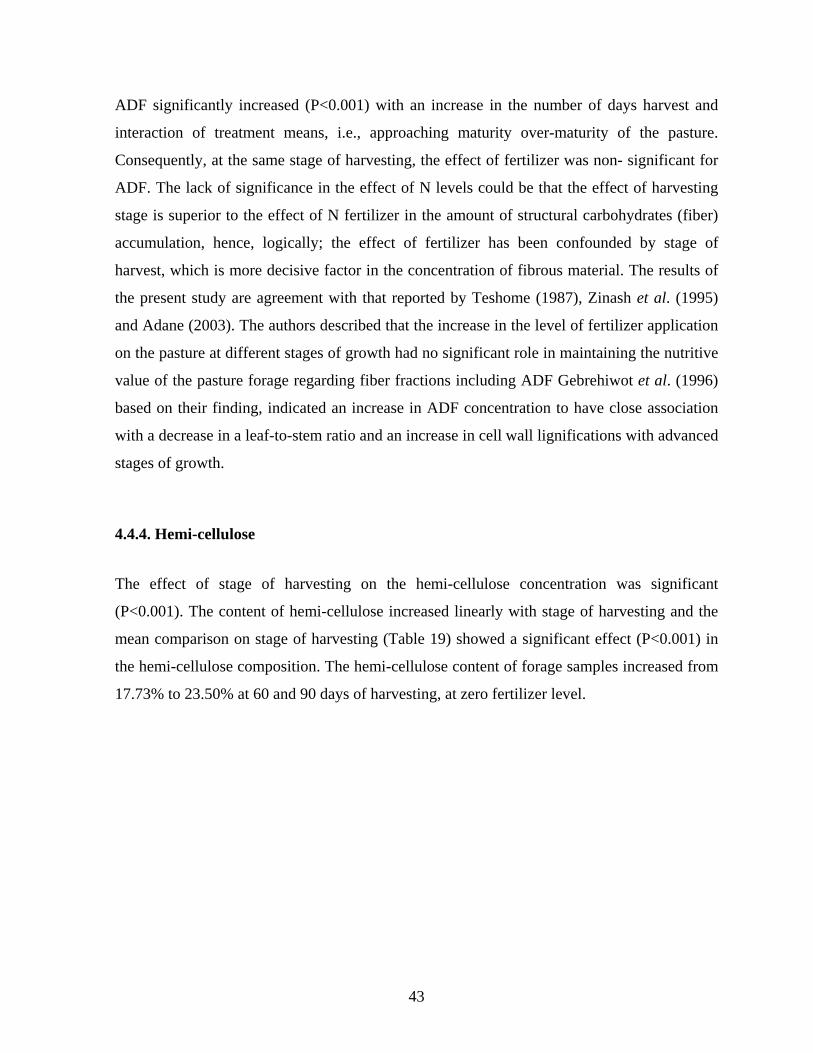
ADF significantly increased (P<0.001) with an increase in the number of days harvest and
interaction of treatment means, i.e., approaching maturity over-maturity of the pasture.
Consequently, at the same stage of harvesting, the effect of fertilizer was non- significant for
ADF. The lack of significance in the effect of N levels could be that the effect of harvesting
stage is superior to the effect of N fertilizer in the amount of structural carbohydrates (fiber)
accumulation, hence, logically; the effect of fertilizer has been confounded by stage of
harvest, which is more decisive factor in the concentration of fibrous material. The results of
the present study are agreement with that reported by Teshome (1987), Zinash et al. (1995)
and Adane (2003). The authors described that the increase in the level of fertilizer application
on the pasture at different stages of growth had no significant role in maintaining the nutritive
value of the pasture forage regarding fiber fractions including ADF Gebrehiwot et al. (1996)
based on their finding, indicated an increase in ADF concentration to have close association
with a decrease in a leaf-to-stem ratio and an increase in cell wall lignifications with advanced
stages of growth.
4.4.4. Hemi-cellulose
The effect of stage of harvesting on the hemi-cellulose concentration was significant
(P<0.001). The content of hemi-cellulose increased linearly with stage of harvesting and the
mean comparison on stage of harvesting (Table 19) showed a significant effect (P<0.001) in
the hemi-cellulose composition. The hemi-cellulose content of forage samples increased from
17.73% to 23.50% at 60 and 90 days of harvesting, at zero fertilizer level.
43
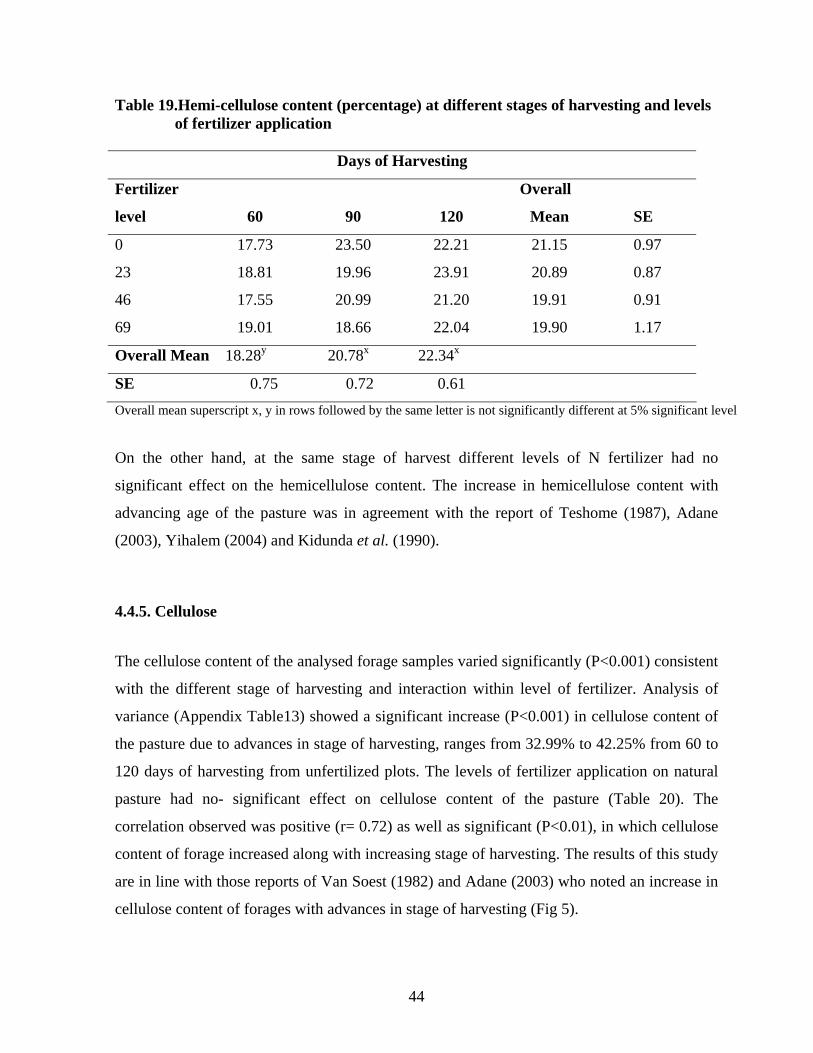
Table 19.Hemi-cellulose content (percentage) at different stages of harvesting and levels of fertilizer application
Days of Harvesting
Fertilizer
level
60
90
120
Overall
Mean
SE
0 17.73 23.50 22.21 21.15 0.97
23 18.81 19.96 23.91 20.89 0.87
46 17.55 20.99 21.20 19.91 0.91
69 19.01 18.66 22.04 19.90 1.17
Overall Mean 18.28y 20.78x 22.34x
SE 0.75 0.72 0.61 Overall mean superscript x, y in rows followed by the same letter is not significantly different at 5% significant level
On the other hand, at the same stage of harvest different levels of N fertilizer had no
significant effect on the hemicellulose content. The increase in hemicellulose content with
advancing age of the pasture was in agreement with the report of Teshome (1987), Adane
(2003), Yihalem (2004) and Kidunda et al. (1990).
4.4.5. Cellulose
The cellulose content of the analysed forage samples varied significantly (P<0.001) consistent
with the different stage of harvesting and interaction within level of fertilizer. Analysis of
variance (Appendix Table13) showed a significant increase (P<0.001) in cellulose content of
the pasture due to advances in stage of harvesting, ranges from 32.99% to 42.25% from 60 to
120 days of harvesting from unfertilized plots. The levels of fertilizer application on natural
pasture had no- significant effect on cellulose content of the pasture (Table 20). The
correlation observed was positive (r= 0.72) as well as significant (P<0.01), in which cellulose
content of forage increased along with increasing stage of harvesting. The results of this study
are in line with those reports of Van Soest (1982) and Adane (2003) who noted an increase in
cellulose content of forages with advances in stage of harvesting (Fig 5).
44
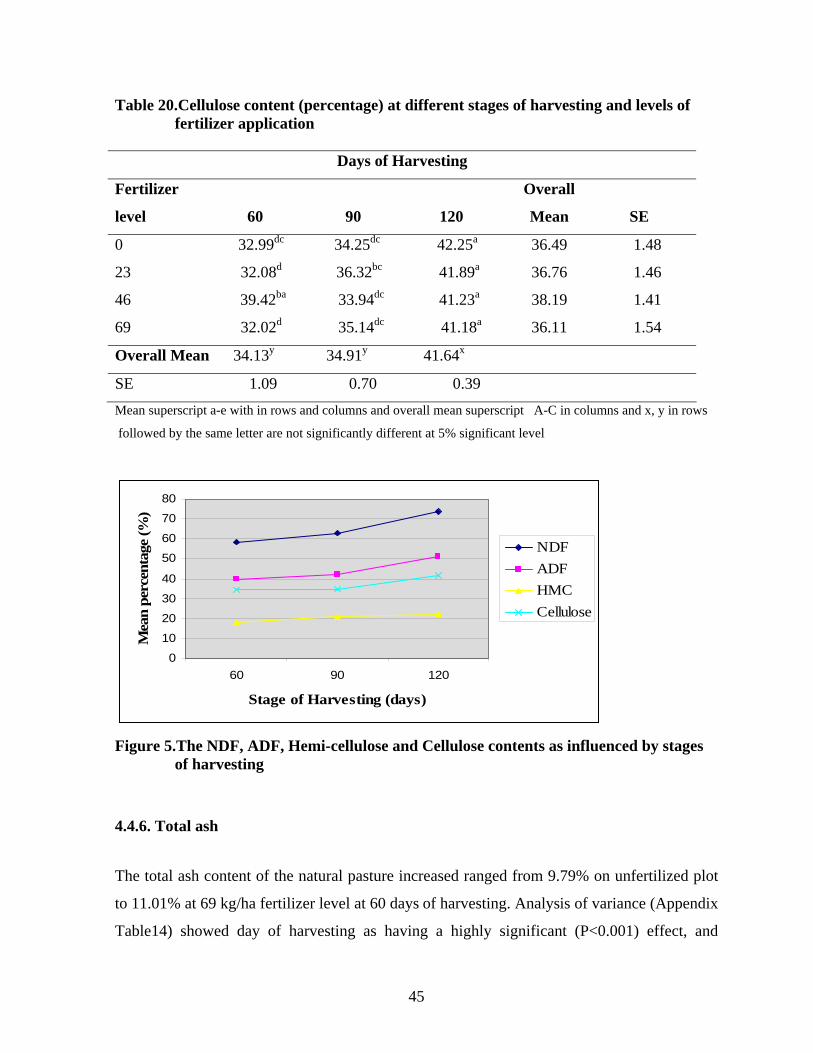
Table 20.Cellulose content (percentage) at different stages of harvesting and levels of fertilizer application
Days of Harvesting
Fertilizer
level
60
90
120
Overall
Mean
SE
0 32.99dc 34.25dc 42.25a 36.49 1.48
23 32.08d 36.32bc 41.89a 36.76 1.46
46 39.42ba 33.94dc 41.23a 38.19 1.41
69 32.02d 35.14dc 41.18a 36.11 1.54
Overall Mean 34.13y 34.91y 41.64x
SE 1.09 0.70 0.39 Mean superscript a-e with in rows and columns and overall mean superscript A-C in columns and x, y in rows
followed by the same letter are not significantly different at 5% significant level
0
10
20
30
40
50
60
70
80
60 90 120
Stage of Harvesting (days)
Mea
n pe
rcen
tage
(%)
NDFADFHMCCellulose
Figure 5.The NDF, ADF, Hemi-cellulose and Cellulose contents as influenced by stages
of harvesting
4.4.6. Total ash
The total ash content of the natural pasture increased ranged from 9.79% on unfertilized plot
to 11.01% at 69 kg/ha fertilizer level at 60 days of harvesting. Analysis of variance (Appendix
Table14) showed day of harvesting as having a highly significant (P<0.001) effect, and
45
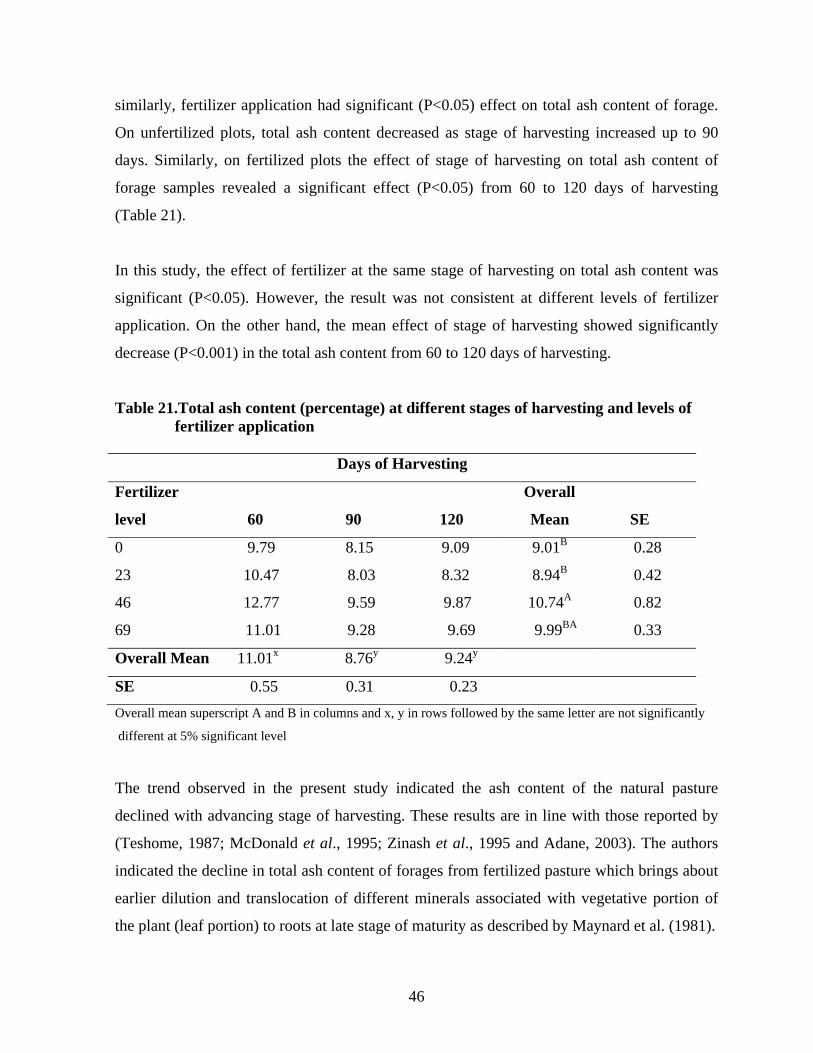
similarly, fertilizer application had significant (P<0.05) effect on total ash content of forage.
On unfertilized plots, total ash content decreased as stage of harvesting increased up to 90
days. Similarly, on fertilized plots the effect of stage of harvesting on total ash content of
forage samples revealed a significant effect (P<0.05) from 60 to 120 days of harvesting
(Table 21).
In this study, the effect of fertilizer at the same stage of harvesting on total ash content was
significant (P<0.05). However, the result was not consistent at different levels of fertilizer
application. On the other hand, the mean effect of stage of harvesting showed significantly
decrease (P<0.001) in the total ash content from 60 to 120 days of harvesting.
Table 21.Total ash content (percentage) at different stages of harvesting and levels of fertilizer application
Days of Harvesting
Fertilizer
level
60
90
120
Overall
Mean
SE
0 9.79 8.15 9.09 9.01B 0.28
23 10.47 8.03 8.32 8.94B 0.42
46 12.77 9.59 9.87 10.74A 0.82
69 11.01 9.28 9.69 9.99BA 0.33
Overall Mean 11.01x 8.76y 9.24y
SE 0.55 0.31 0.23 Overall mean superscript A and B in columns and x, y in rows followed by the same letter are not significantly
different at 5% significant level
The trend observed in the present study indicated the ash content of the natural pasture
declined with advancing stage of harvesting. These results are in line with those reported by
(Teshome, 1987; McDonald et al., 1995; Zinash et al., 1995 and Adane, 2003). The authors
indicated the decline in total ash content of forages from fertilized pasture which brings about
earlier dilution and translocation of different minerals associated with vegetative portion of
the plant (leaf portion) to roots at late stage of maturity as described by Maynard et al. (1981).
46
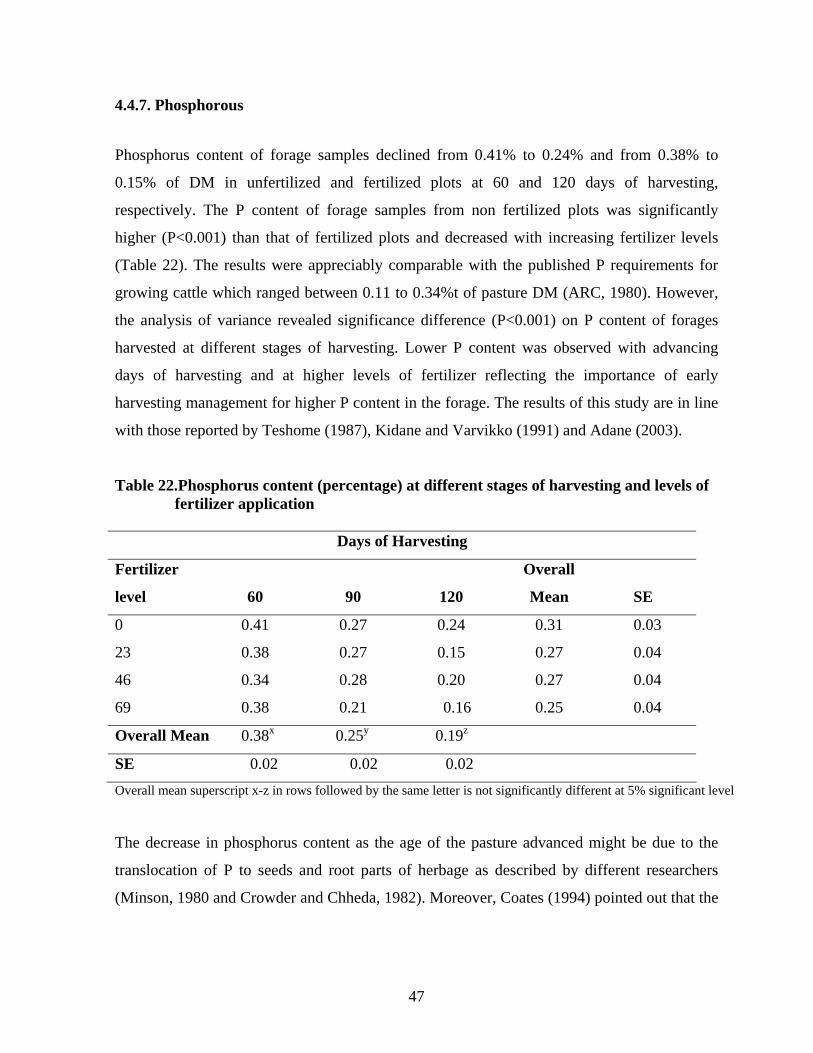
4.4.7. Phosphorous
Phosphorus content of forage samples declined from 0.41% to 0.24% and from 0.38% to
0.15% of DM in unfertilized and fertilized plots at 60 and 120 days of harvesting,
respectively. The P content of forage samples from non fertilized plots was significantly
higher (P<0.001) than that of fertilized plots and decreased with increasing fertilizer levels
(Table 22). The results were appreciably comparable with the published P requirements for
growing cattle which ranged between 0.11 to 0.34%t of pasture DM (ARC, 1980). However,
the analysis of variance revealed significance difference (P<0.001) on P content of forages
harvested at different stages of harvesting. Lower P content was observed with advancing
days of harvesting and at higher levels of fertilizer reflecting the importance of early
harvesting management for higher P content in the forage. The results of this study are in line
with those reported by Teshome (1987), Kidane and Varvikko (1991) and Adane (2003).
Table 22.Phosphorus content (percentage) at different stages of harvesting and levels of fertilizer application
Days of Harvesting
Fertilizer
level
60
90
120
Overall
Mean
SE
0 0.41 0.27 0.24 0.31 0.03
23 0.38 0.27 0.15 0.27 0.04
46 0.34 0.28 0.20 0.27 0.04
69 0.38 0.21 0.16 0.25 0.04
Overall Mean 0.38x 0.25y 0.19z
SE 0.02 0.02 0.02 Overall mean superscript x-z in rows followed by the same letter is not significantly different at 5% significant level
The decrease in phosphorus content as the age of the pasture advanced might be due to the
translocation of P to seeds and root parts of herbage as described by different researchers
(Minson, 1980 and Crowder and Chheda, 1982). Moreover, Coates (1994) pointed out that the
47
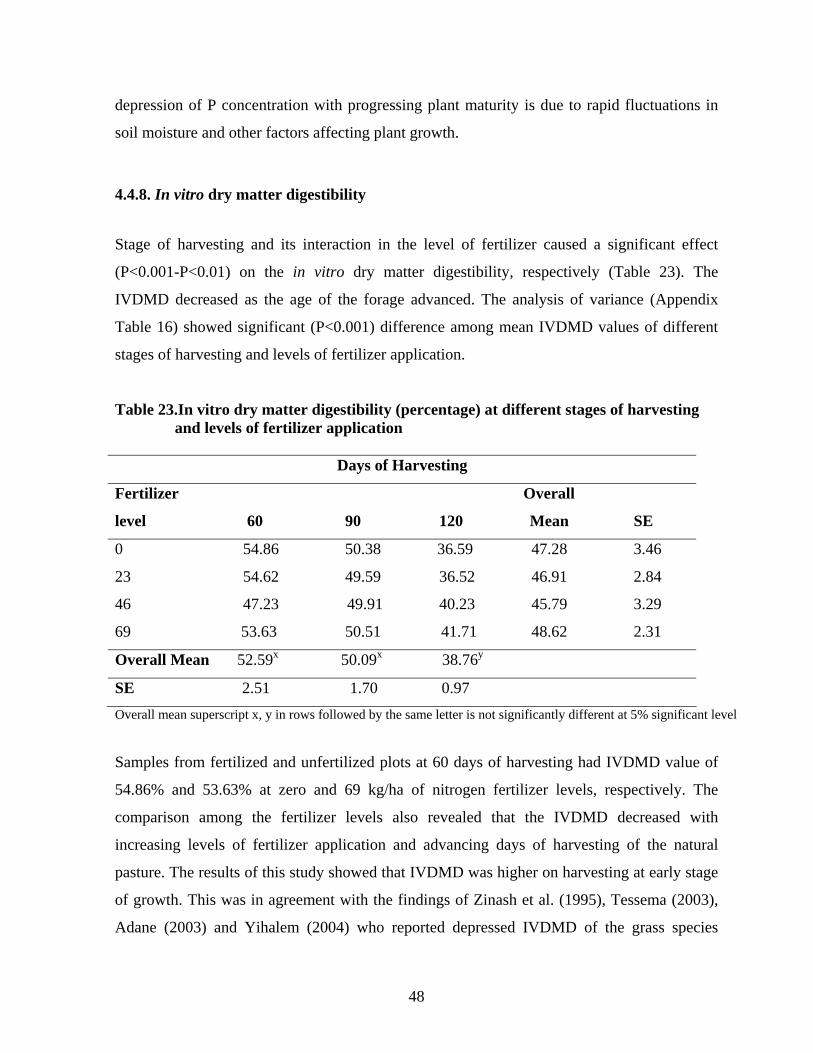
depression of P concentration with progressing plant maturity is due to rapid fluctuations in
soil moisture and other factors affecting plant growth.
4.4.8. In vitro dry matter digestibility
Stage of harvesting and its interaction in the level of fertilizer caused a significant effect
(P<0.001-P<0.01) on the in vitro dry matter digestibility, respectively (Table 23). The
IVDMD decreased as the age of the forage advanced. The analysis of variance (Appendix
Table 16) showed significant (P<0.001) difference among mean IVDMD values of different
stages of harvesting and levels of fertilizer application.
Table 23.In vitro dry matter digestibility (percentage) at different stages of harvesting and levels of fertilizer application
Days of Harvesting
Fertilizer
level
60
90
120
Overall
Mean
SE
0 54.86 50.38 36.59 47.28 3.46
23 54.62 49.59 36.52 46.91 2.84
46 47.23 49.91 40.23 45.79 3.29
69 53.63 50.51 41.71 48.62 2.31
Overall Mean 52.59x 50.09x 38.76y
SE 2.51 1.70 0.97 Overall mean superscript x, y in rows followed by the same letter is not significantly different at 5% significant level
Samples from fertilized and unfertilized plots at 60 days of harvesting had IVDMD value of
54.86% and 53.63% at zero and 69 kg/ha of nitrogen fertilizer levels, respectively. The
comparison among the fertilizer levels also revealed that the IVDMD decreased with
increasing levels of fertilizer application and advancing days of harvesting of the natural
pasture. The results of this study showed that IVDMD was higher on harvesting at early stage
of growth. This was in agreement with the findings of Zinash et al. (1995), Tessema (2003),
Adane (2003) and Yihalem (2004) who reported depressed IVDMD of the grass species
48
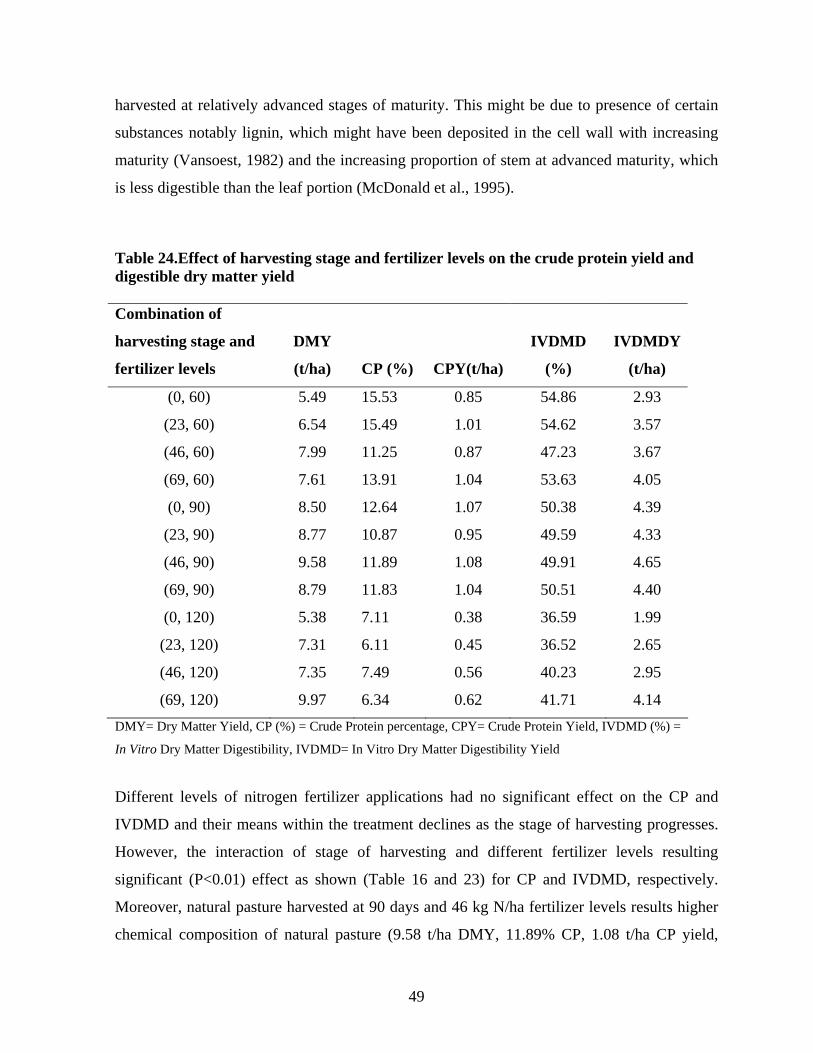
harvested at relatively advanced stages of maturity. This might be due to presence of certain
substances notably lignin, which might have been deposited in the cell wall with increasing
maturity (Vansoest, 1982) and the increasing proportion of stem at advanced maturity, which
is less digestible than the leaf portion (McDonald et al., 1995).
Table 24.Effect of harvesting stage and fertilizer levels on the crude protein yield and digestible dry matter yield Combination of
harvesting stage and
fertilizer levels
DMY
(t/ha)
CP (%)
CPY(t/ha)
IVDMD
(%)
IVDMDY
(t/ha)
(0, 60) 5.49 15.53 0.85 54.86 2.93
(23, 60) 6.54 15.49 1.01 54.62 3.57
(46, 60) 7.99 11.25 0.87 47.23 3.67
(69, 60) 7.61 13.91 1.04 53.63 4.05
(0, 90) 8.50 12.64 1.07 50.38 4.39
(23, 90) 8.77 10.87 0.95 49.59 4.33
(46, 90) 9.58 11.89 1.08 49.91 4.65
(69, 90) 8.79 11.83 1.04 50.51 4.40
(0, 120) 5.38 7.11 0.38 36.59 1.99
(23, 120) 7.31 6.11 0.45 36.52 2.65
(46, 120) 7.35 7.49 0.56 40.23 2.95
(69, 120) 9.97 6.34 0.62 41.71 4.14 DMY= Dry Matter Yield, CP (%) = Crude Protein percentage, CPY= Crude Protein Yield, IVDMD (%) =
In Vitro Dry Matter Digestibility, IVDMD= In Vitro Dry Matter Digestibility Yield
Different levels of nitrogen fertilizer applications had no significant effect on the CP and
IVDMD and their means within the treatment declines as the stage of harvesting progresses.
However, the interaction of stage of harvesting and different fertilizer levels resulting
significant (P<0.01) effect as shown (Table 16 and 23) for CP and IVDMD, respectively.
Moreover, natural pasture harvested at 90 days and 46 kg N/ha fertilizer levels results higher
chemical composition of natural pasture (9.58 t/ha DMY, 11.89% CP, 1.08 t/ha CP yield,
49
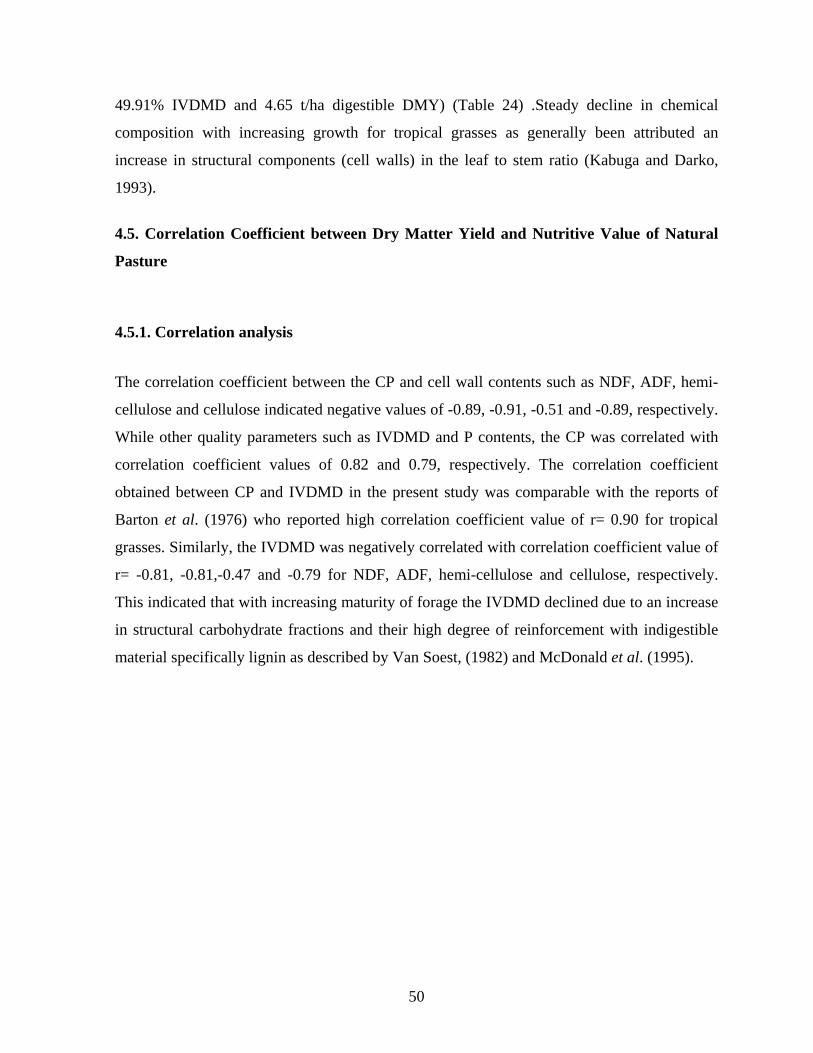
49.91% IVDMD and 4.65 t/ha digestible DMY) (Table 24) .Steady decline in chemical
composition with increasing growth for tropical grasses as generally been attributed an
increase in structural components (cell walls) in the leaf to stem ratio (Kabuga and Darko,
1993).
4.5. Correlation Coefficient between Dry Matter Yield and Nutritive Value of Natural
Pasture
4.5.1. Correlation analysis
The correlation coefficient between the CP and cell wall contents such as NDF, ADF, hemi-
cellulose and cellulose indicated negative values of -0.89, -0.91, -0.51 and -0.89, respectively.
While other quality parameters such as IVDMD and P contents, the CP was correlated with
correlation coefficient values of 0.82 and 0.79, respectively. The correlation coefficient
obtained between CP and IVDMD in the present study was comparable with the reports of
Barton et al. (1976) who reported high correlation coefficient value of r= 0.90 for tropical
grasses. Similarly, the IVDMD was negatively correlated with correlation coefficient value of
r= -0.81, -0.81,-0.47 and -0.79 for NDF, ADF, hemi-cellulose and cellulose, respectively.
This indicated that with increasing maturity of forage the IVDMD declined due to an increase
in structural carbohydrate fractions and their high degree of reinforcement with indigestible
material specifically lignin as described by Van Soest, (1982) and McDonald et al. (1995).
50
Table 25.Correlation coefficients between stage of maturity, cutting frequency and fertilizer application with DMY and quality parameters of natural pasturelands
PDMY CP NDF ADF HMC CE P PDMY 1
CP -0.25 1
NDF 0.11 -0.89** 1
ADF 0.04 -0.91** 0.94** 1
HMC 0.20 -0.51** 0.72** 0.44** 1
CE -0.003 -0.89** 0.90** 0.99** 0.37* 1
P -0.42* 0.79** -0.73** -0.71** -0.49** -0.67** 1
IVDMD -.116 0.82** -0.81** -0.81** -0.47** -0.79** 0.74**
** = P<0.01, *= P<0.05, PDMY= Pasture Dry Matter Yield; CP= crude Protein; NDF= Neutral Detergent Fiber; ADF= Acid Detergent Fiber; HMC= Hemi-cellulose; CE= Cellulose; P= Phosphorus; IVDMD= In Vitro Dry Matter Digestibility
51
5. SUMMARY AND CONCLUSIONS
The study was conducted in Fogera district of South Gondar Zone of Amhara Regional Sate.
In the area, insufficient supply and poor quality of feeds constitute the major technical
constraint to livestock production. The objectives of this study were to determine the
botanical composition, dry matter yield and chemical composition of the Fogera upland
natural pasture under different application rates of nitrogen fertilizer and harvesting stages of
natural pasture at smallholder farmer condition.
A native pastureland reserved as a source of hay production and managed by a smallholder
farmer was selected for the field experiment. Nitrogen fertilizer with varying rates was
applied on the research plots as recommended by ILCA (1983) for the fertilization of
pasturelands in central highlands of Ethiopia. Three stages of harvesting (60, 90 and 120
days) as practiced by smallholder farmers in other central highlands were chosen as
harvesting time. The forage samples were harvested at the fixed stages of harvest, weighed in
the field and dried in an oven to make it ready for chemical analysis at ILRI nutrition
laboratory.
The data recorded from weighing of the forage samples for the different stages of harvesting
indicated that overall mean DMY of 7.54 and 8.79 t/ha were attained at 23 and 69 kg/ha of
nitrogen fertilizer levels, respectively. The DMY attained from unfertilized plots was only
6.46 t/ha. On the other hand, natural pasture harvested at high fertilizer level (69 kg/ha) and
stage of harvesting at 60 and 120 days resulted in a dry matter yield of 7.61 t/ha and 9.97 t/ha,
respectively, with an overall mean DMY of 8.79 t/ha for fertilized plots.
Fertilization of the pasture plots up to the level of 69 kg/ha improved the DMY to 36.07%
over the non fertilized plot. The results of this study indicated reduced nutritive values of
forages with advancing stage of harvesting of plants. Harvesting pasture forages at 60 days
provided the highest feeding values as measured by feed quality parameters. The CP content
of forages harvested from unfertilized plots was higher than fertilized plots, but decreased
from 15.53% at 60 days of harvesting to 7.11% at 120 days. As the application of fertilizer
52
increased from the lowest (23 kg/ha) to the highest (69 kg/ha), even if, the over all CP
percentage decreased from 11.76% to 6.34% statistically there was no significant difference
with in the control and fertilized plots. Generally, the crude protein content of natural pasture
of the study area is higher as compared to the previous reports in the central highlands of the
country which is a mean of 5.6% (Adane, 2003). This indicates that natural pasture in the
north western highlands is richer in legume proportions. The crude protein content declined as
the stage of harvesting exceeded 60 days.
Stage of harvesting and levels of fertilizer application affected species composition in terms
of grass-legume proportion. At 60 days of harvesting the proportion of grasses and legumes is
equivalent, increasing legume proportion at 90 days of harvesting. The legume contributed
56.18% of the biomass. Even though the relative proportion of legume was the highest at 90
days of harvesting, the period under flowering stage was very short that it started declining at
120 days of harvesting till the percentage of legume proportion reached 37.66%.
The slight reduction in DMY recorded at 120 days of harvesting might not be only due to the
defoliation of some forage parts alone, but also due to the reduction of legume proportion
which affected the contribution of the legumes by weight to the total forage DMY of the
pastureland. Application of nitrogen fertilizer did not promote the proportion of legumes in
the natural pastureland; rather it promoted the proportion of grasses as the result of
fertilization with increasing stage of harvesting. The correlation among the quality parameters
CP and IVDMD was positive, whereas the correlation coefficient values of both CP and
IVDMD with NDF, ADF, hemi-cellulose and cellulose indicated negative relationship.
53
6. RECOMMENDATIONS
Relatively high crude protein content (15.53%) and moderate DMY of (7.99 t/ha)
were achieved when forages from natural pasture were harvested at 60 days
(September). Therefore, harvesting of forages on the pastureland for feeding and
preserving in the form of hay should be practiced at this stage of harvesting, instead of
harvesting at prolonged stage
Natural pasture harvested at 90 days of harvesting (October) and fertilizer applications
at the level of 46 kg/ha at resulted in higher mean dry matter yield of 9.58 t/ha and
higher nutritional quality (11.89% CP, 49.91% IVDMD) and 1.08 t/ha crude protein
yield and 4.65 t/ha in vitro dry matter digestibility of the natural pasture. This level of
fertilizer application should be practiced for higher pasture yield and feed quality
parameters.
Frequent harvesting of forages from plots with fertilizer application levels above 46
kg/ha produced higher total DM yield as compared to yields from single harvest.
Therefore, frequent harvesting of forages should be practiced from plots with higher
levels of fertilizer application for higher pasture yield and forage quality parameters.
Evaluation of indigenous species from natural pastureland may prove to be useful for
future forage development schemes and pasture improvement programs because they
are well adapted to the local environment.
Provision of strong extension services about pasture improvement strategies and
training farmers on in harvesting and storage of hay is very important
54
7. SCOPE FOR FUTURE WORK
Hay obtained from grazing lands is a major feed resource on which livestock
production of the area relies. Most grazing lands in the area consist of forages of
grass-legume mixtures. Therefore, detailed studies on nutritive values of the identified
grass and legume species will be of paramount importance for their promotion and
optimizing stages of harvesting and levels of fertilizer for high DM yield and
nutritional quality of the pastureland should be studied in different years and in
different seasons.
The magnitude of improving of the quality of natural pasture by stages of harvesting
and fertilizer application should be assessed along with the effects on feed intake and
animal productivity in terms of milk yield and body weight gain. Therefore, feeding
trials need to be undertaken to substantiate the results of the present study
The degree of invasion of Hygrophila auriculata weed (Amekalla) and its relation to
the natural pastureland degradation should be given due attention.
Since this study was carried out only at one location representing the research district,
it is important to conduct similar studies on different locations with varying climatic
conditions and soil types, different feed resource types and grazing management
practices in the north-western highlands which have higher livestock population but a
declining land size per household.
55
8. REFERENCES
Adane Kitaba, 2003. Effects of stage of harvesting and fertilizer application on dry matter
yield and quality of natural grass land in the high lands of north Showa MSc Thesis.The
School of Graduate Studies, Alemaya University, Alemaya, Ethiopia. 96p.
Adane Kitaba and Berhan Tamir, 2005. Effect of harvesting frequency and nutrient levels on
natural pasture in the central high lands of Ethiopia. Trop.Sci. 45: 77-82.
Adejumo, J.O., 1992. Effect of plant age and harvest date in the dry season on yield and
quality of Gliricida sepium in Southern Nigeria. Tropical Grassland, 26: 21-24.
Akinola, J.O. and P.C., Whiteman, 1985. Agronomic studies of pigeon pea (Cajanus cajan).
Response to defoliation. Australian Journal of Agriculture Research, 26: 67-79.
Alemayehu Mengistu, 1985. Feed resource in Ethiopia. Pp 35. Proceedings of the second
PANESA Workshop on Animal Feed Resources for Small Scale Livestock Producers.
Nairobi, Kenya, 11-15 November 1985.
Alemayehu Mengistu, 1997. Conservation based forage development for Ethiopia: Institute
for Sustainable Development. Addis Ababa, Ethiopia. Pp 1-2.
Alemayehu Mengistu, 2004. Pasture and Forage Resource profiles of Ethiopia. Pp19.
Ethiopia/FAO. Addis Ababa, Ethiopia.
Alemu Tadesse and Lemma Gizachew, 1991. Botanical composition and productivity of
natural pasture in the Arjo Awraja, western Ethiopia. In: Proceedings of the Fourth National
Livestock Improvement Conference held at Addis Ababa, 13-15 Nov. Pp. 205-210.
Ali Said, 2004. The effect of stubble height, Row spacing and subsequent harvests on dry
matter yield, nutrient composition and In vitro organic matter digestibility of alfalfa
56
(Medicago sativa L.) at South Wollo MSc Thesis. The School of Graduate Studies, Alemaya
University, Alemaya, Ethiopia .114p.
Anderson, J.M., and Ingram, J.S.I., 1993. Tropical soil biology and fertility: A hand book of
methods, second edition. CAB international, U.K.
AOAC (Association of Official Analytical Chemists), 1990. Official Method of Analysis. 5th
ed. AOAC. Inc. Arington, Virginia, USA.1298p.
ARC (Agricultural Research Council), 1980. The nutrient requirements of ruminant livestock.
Common Wealth Agricultural Bureau, Faraham Royal, London, U.K.
Bartholomew, P.E., 2000. The management of planted pastures. In: Tainton, N.M. (eds.).
Pasture management in South Africa. University of Natal Press. Pietermaritzburg, South
Africa.
Barton, F.E., H.E., Amos, D. Burdick and R.L., Wilson, 1976. Relationship of chemical
analysis to in vitro digestibility for selected tropical and temperate grasses. J.Anim. Sci., 43
(2): 504-512.
Blackburn, H., 1998. Livestock production, the environment and mixed farming systems. Pp.
114-123. In: A. J. Nell (eds).Livestock and the environment. Proceeding of an International
Conference. International Agricultural Center, Wageningen, the Netherlands; IBRD,
Washington, D.C., USA. FAO, Rome Italy.
Black, C.A., Evans, D.D., White, J.L., Ensininger, L.E. and Clark, F.E. (eds.). 1965. Methods
of soil analysis, part 2. Am.Soc. of Agronomy Inc., Madison, Wisconsin, pp. 771-1572.
Blade, T.A., J.H. Vandersall, R.A.Erdman, J.M. Reeves and P.G. Barbara, 1993. Effect of
stage of maturity of alfalfa and Orchard grass on in situ dry matter and crude protein
degradability and amino acid composition. Animal feed Sci. and Tech., 44: 29-43.
57
Bogdan, A.V., 1977. Tropical pasture and fodder plants (Grasses and Legumes).Tropical
Agricultural Series. Longman Inc., New York.
Bremner, J.M. and Mulvaney, C.S., 1982. Total nitrogen. In: Page, P.L., Miller, R.H. and
Keeney, D.R. (eds.).Methods of soil analysis II. Chemical and microbiological properties.
American Society of Agronomy. Madison Wisconsin. Agronomy Monograph No-9 (2nd ed.).
pp. 595-624.
Broatch, R.F., 1970. An investigation into the optimum stocking rate on the natural pasture in
coastal region of Tanga. Annual Report of Research and Training Institute. Tanga, Tanzania.
Bureau of Agriculture and Rural Development (BoARD), 2003. Rural Household
Socioeconomic Baseline Survey. Amhara Region. Bahir Dare. Ethiopia.
Buxton, D.R., 1996. Quality-related characteristics of forage as influenced by environment
and agronomic factors. Animal feed science and Tech., 59(3): 37-49.
Chemlab, 1978. Continuous Flow Analysis method. Determination of orthophosphate in
water and waste water. Chemlab Instruments Ltd. Horn church, Essex, UK.
Cheplick, G.P., 1998. Population biology of grasses. Cambridge University press, Cambridge.
Coates, D.B, 1994. Effect of phosphorus as fertilizer or supplement on pasture and cattle
productivity in semi-arid tropics of North Queenland. Tropical Grassland, 28: 90-108.
Crowder, L.V. and H.R. Chheda, 1982. Tropical Grass land Husbandry. Longman, U.K.
Daniel Keftassa, 1987. Improvement and management of natural grass lands. In: IAR
proceeding of 1st National Livestock Improvement Conference. 11-13.February1987, pp.170-
172.Addis Ababa, Ethiopia.
58
Daniel Kiftassa, 1988. Role of crop residues as livestock feeds in Ethiopian Highlands. pp.
430-439. In: B.H. Dzzowela (eds.). Proceedings of a Workshop on African Forage Plant
Genetic Resources, Evaluation of Forage Germplasm and Extensive Livestock Production
Systems. Arusha, Tanzania, 27-30 April 1987
Daniel Keftassa, 1990. Effect of development stages of at harvest, nitrogen application and
moisture availability on the yield and nutritional value of Rhodes grass (Chloris gayana)
Lucerne (Medicago sativa) pastures. Ph.D.Thesis. Swedish University of Agricultural
Sciences, Uppsala, Sweden.
Daniel keftassa, 1996. Effects of nitrogen application and stage of development on yield and
nutritional value of Rhodes Grass (Chloris gayana). Ethiopian Journal of Agricultural Sci.,
15: 86-101.Addis Ababa, Ethiopia.
Forman, B. and S. Persson., 1974. An illustrated guide to grasses of Ethiopia. Chilalo
Agricultural Development Unit. Assela, Ethiopia.
Falade, J.A., 1975. The effect of phosphorus on growth and mineral composition of five
Tropical grasses. East African Agricultural and Forestry J., 40 (4): 342-350.
Gashaw Geda, T. Varivkko and H .Khalili, 1991. Assessment of feed resource in relation to
the requirements on a small holder farm. In: development of appropriate feeding systems for
dairy cattle in the Ethiopian high lands. ILCA, Addis Ababa, Ethiopia.
Gashaw Geda, 1992. Assessment of feed resource base and performance of crossbred dairy
cows distributed to small holders in Degem dairy development project area. MSc Thesis the
School of Graduate Studies of Alemaya University, Alemaya, Ethiopia. 171p.
Gebrehiwot Lulseged, R.L., McGraw and Getnet Assefa, 1996. Forage yield and quality
profile of three annual legumes in tropical highlands of Ethiopia. Trop. Agric. (Trindad), 73
(1): 83-89.
59
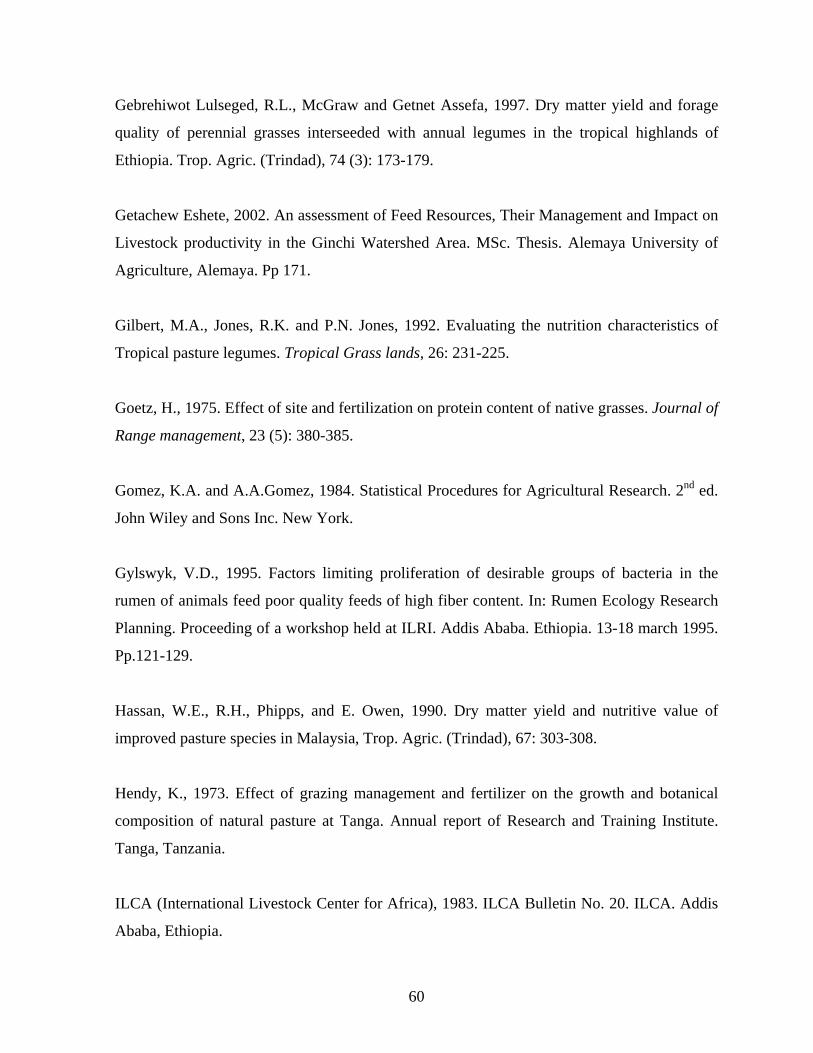
Gebrehiwot Lulseged, R.L., McGraw and Getnet Assefa, 1997. Dry matter yield and forage
quality of perennial grasses interseeded with annual legumes in the tropical highlands of
Ethiopia. Trop. Agric. (Trindad), 74 (3): 173-179.
Getachew Eshete, 2002. An assessment of Feed Resources, Their Management and Impact on
Livestock productivity in the Ginchi Watershed Area. MSc. Thesis. Alemaya University of
Agriculture, Alemaya. Pp 171.
Gilbert, M.A., Jones, R.K. and P.N. Jones, 1992. Evaluating the nutrition characteristics of
Tropical pasture legumes. Tropical Grass lands, 26: 231-225.
Goetz, H., 1975. Effect of site and fertilization on protein content of native grasses. Journal of
Range management, 23 (5): 380-385.
Gomez, K.A. and A.A.Gomez, 1984. Statistical Procedures for Agricultural Research. 2nd ed.
John Wiley and Sons Inc. New York.
Gylswyk, V.D., 1995. Factors limiting proliferation of desirable groups of bacteria in the
rumen of animals feed poor quality feeds of high fiber content. In: Rumen Ecology Research
Planning. Proceeding of a workshop held at ILRI. Addis Ababa. Ethiopia. 13-18 march 1995.
Pp.121-129.
Hassan, W.E., R.H., Phipps, and E. Owen, 1990. Dry matter yield and nutritive value of
improved pasture species in Malaysia, Trop. Agric. (Trindad), 67: 303-308.
Hendy, K., 1973. Effect of grazing management and fertilizer on the growth and botanical
composition of natural pasture at Tanga. Annual report of Research and Training Institute.
Tanga, Tanzania.
ILCA (International Livestock Center for Africa), 1983. ILCA Bulletin No. 20. ILCA. Addis
Ababa, Ethiopia.
60
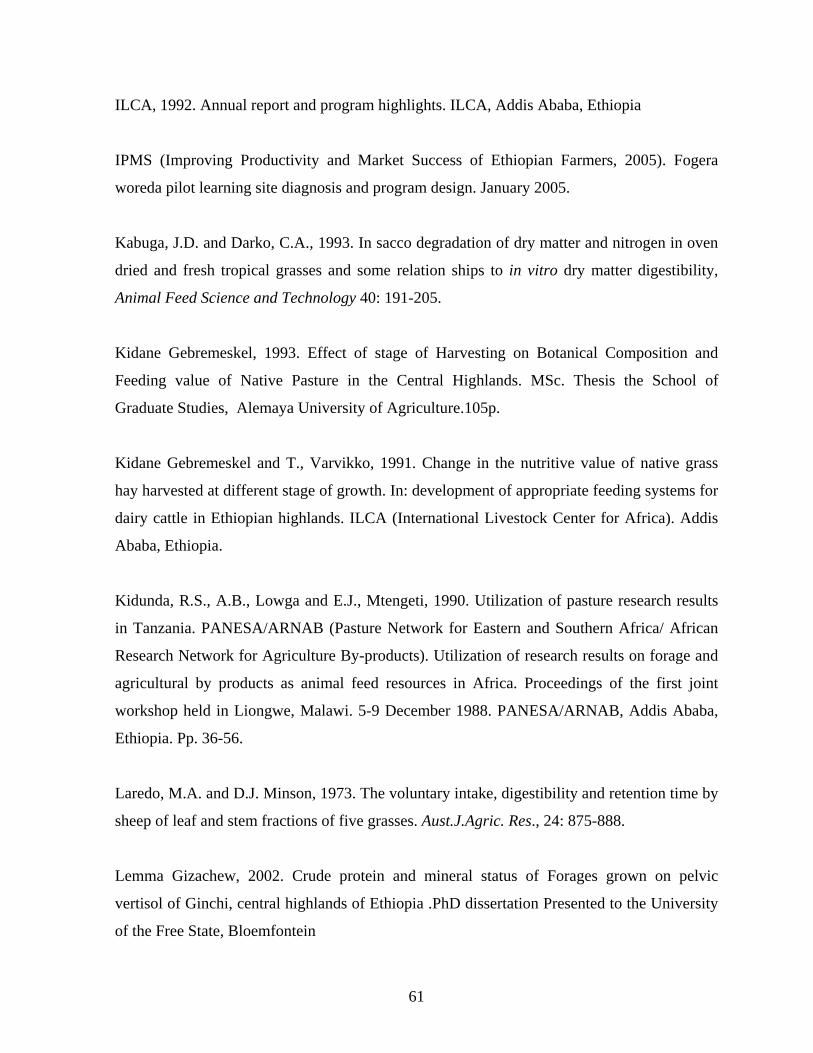
ILCA, 1992. Annual report and program highlights. ILCA, Addis Ababa, Ethiopia
IPMS (Improving Productivity and Market Success of Ethiopian Farmers, 2005). Fogera
woreda pilot learning site diagnosis and program design. January 2005.
Kabuga, J.D. and Darko, C.A., 1993. In sacco degradation of dry matter and nitrogen in oven
dried and fresh tropical grasses and some relation ships to in vitro dry matter digestibility,
Animal Feed Science and Technology 40: 191-205.
Kidane Gebremeskel, 1993. Effect of stage of Harvesting on Botanical Composition and
Feeding value of Native Pasture in the Central Highlands. MSc. Thesis the School of
Graduate Studies, Alemaya University of Agriculture.105p.
Kidane Gebremeskel and T., Varvikko, 1991. Change in the nutritive value of native grass
hay harvested at different stage of growth. In: development of appropriate feeding systems for
dairy cattle in Ethiopian highlands. ILCA (International Livestock Center for Africa). Addis
Ababa, Ethiopia.
Kidunda, R.S., A.B., Lowga and E.J., Mtengeti, 1990. Utilization of pasture research results
in Tanzania. PANESA/ARNAB (Pasture Network for Eastern and Southern Africa/ African
Research Network for Agriculture By-products). Utilization of research results on forage and
agricultural by products as animal feed resources in Africa. Proceedings of the first joint
workshop held in Liongwe, Malawi. 5-9 December 1988. PANESA/ARNAB, Addis Ababa,
Ethiopia. Pp. 36-56.
Laredo, M.A. and D.J. Minson, 1973. The voluntary intake, digestibility and retention time by
sheep of leaf and stem fractions of five grasses. Aust.J.Agric. Res., 24: 875-888.
Lemma Gizachew, 2002. Crude protein and mineral status of Forages grown on pelvic
vertisol of Ginchi, central highlands of Ethiopia .PhD dissertation Presented to the University
of the Free State, Bloemfontein
61
Lulseged Gebrehiwot, 1985. The status of pastures and forage research and development in
Ethiopia. IN: The status of livestock, pasture and forage research and development in
Ethiopia. IAR, Addis Ababa, Ethiopia.
Mannetje, L.’t., 1984. Nutritive of tropical and sub tropical pastures with special reference to
protein and energy deficiency in relation to animal production. In: Gilchrist, F.M. and R.I.
Mackie (eds.). Herbivore Nutrition in the subtropics and Tropics. The science press. Craig
hall. pp. 51-66
McDonald, P., R.A Edwards, J.F., Greenhalgh and C.A. Morgan, 1995. Animal Nutrition 5th
edition. United Kingdom.
Maynard, A.L., K.L., Loosli and F.H., Hintz, 1981. Animal Nutrition. 7th edition. Tata
McGraw-Hill Publishing Company Limited. New Delihi, India.
McDonald, P., R.A., Edwards, J.F., Greenhalgh and C.A., Morgan, 1995. Animal Nutrition 5th
edition. Longman. United Kingdom.
McDonald, P., R.A., Edwards, J.F.D., Greenhalgh and C.A., Morgan, 2002. Animal Nutrition,
6th edition.506p.
McIllroy, R.J, 1972. An introduction to tropical grassland husbandry. Oxford University
Press, London. P.140.
McKenzie, F.R., 1997. Influence of grazing management on weed invasion of lolium perenne
pastures under sub-tropical conditions. Tropical Grass lands, 31: 24-30.
Miles, N. and A.D. Manson, 2000. Nutrition of planted pastures. In: Tainton, N.M. (eds.).
Pasture Management in South Africa.Tainton, N.M. (ed.) university of Natal press.
Pietermaritzburg, South Africa.
62
Miller, D.A., 1984. Forage crops. McGraw-Hill, Inc.USA. New York.
Minson, D.J., 1973. Effect of fertilizer nitrogen on digestibility and voluntary intake of
Chloris gayana, Digitarya decumbens and Pennisetum calandestinum.Aust.J. Exp.Agric.and
Anima.Husb., 13: 153-157.
Minson, D.J., 1977. The chemical composition and Nutritive value of Tropical Legumes. In:
Tropical forage legumes. FAO. Plant production series 2. Skerman, P.J. (Ed). FAO, Rome.
Pp. 186-218.
Minson, D.J., 1980. Nutritional differences and temperate pastures. In: F.H.W. Morley (ed.)
Grazing animals. Elsevier scientific publishing Co. Amsterdam.
Mohammed-Saleem, M. A. and Abate Tedla, 1995. Feed improvement to support
intensification of ruminant production systems in the Ethiopian highlands. Pp.296-306. In:
Proceedings of the 3rd Annual Conference of the Ethiopian Society of Animal Production.
Addis Ababa, Ethiopia, 27-29 April 1995.
MSTAT, 1989. A Microcomputer Statistical Program for Experimental Design, Data
Management and Data Analysis. Michigan State University, Crop and Soil Science,
Agricultural Economics and Institute of International Agriculture, U.S.A.
Murphy, F.H., 1968. A report on the fertility status and other data on some soils of Ethiopia.
P. 551. Experiment Station Bulletin No. 44. College of Agriculture, Haile-Silasie University.
Nelson, C.J. and Moser, I. E., 1994 Plant factors affecting forage quality. In: Forage quality
evaluation and utilization, Edited by G C Fakey, Madison, Wisconsin, USA, 115-142.
63
Netherlands Commissioned by Ministry of Agriculture and Fisheries, 1985. Agricultural
compendium for rural development in the tropics and sub-tropics. The Netherlands ministry
of agriculture and fisheries Amsterdam, The Netherlands.
Ndolovu, L.R., 1992. Complementarity of forages in ruminant digestion. Theoretical
considerations. In: John E.S.S., N.S. N.S.Abdullah and K.A.Jackson (eds.).The
complementarity of feed resources for animal production in Africa. Proceedings of the joint
feed resources net works, workshop held in Gabone, Botswana 4-8 March 1991, African Feed
Resource Network. April 1992. Pp. 17-23.
NWZMS (North Western Zone Meteorological Service), 2004. Rainfall and temperature
records for Woreta station.Amhara Region, Bahir Dar.
Olsen, F.J. and G.L. Santos, 1975. Effect of lime and fertilizer on natural pastures in Brazil.
Experimental Agriculture, 11(3): 173-176.
Olsen, S.R., Cole, C.V., Watanable, F.S. and Dean, L.A., 1954. Estimation of available
phosphorus in soils by extraction with sodium bicarbonate. USDA circular 939.pp. 1-19.
Ostergaard, V., 1995. The evaluation of livestock production systems in developing countries.
pp. 108-121. In: W. Y. Kim and K. Ha (eds.). Proceedings of a Conference on Supply of
livestock products to rapidly expanding urban populations. World Assessment for Animal
Production, Seoul, Korea; FAO, Rome, Italy
Pagot, J., 1992. Animal production in the Tropics and Subtropics. Mac Millan press Ltd.CTA.
Wageningen, the Netherlands.
Pamo, E.T and R.D. Piper, 2000. Introduction to range management in free and open access
environments of sub-Saharan Africa.Sitmex and Express services.pp.17-33.
64
Rinne, M. and A. Nykannen. 2000. Timing of primary growth harvesting affects the yield and
nutritive value of timothy-red clover mixtures. Agric. Food.Sci. Finland, 9 (2): 121-134.
Sarwar, M., K.Nisa and M.N.Saeed, 1999. Influence of nitrogen fertilization and stage of
maturity of Mott grass (P. purpureum) on its composition, dry matter intake, ruminal
characteristics and digestion kinetics in cannulated buffalo bulls. Animal feed Sci. and tech.,
82: 121-130.
SAS, 1998.SAS/ STAT Version 7. Guide to personal computers, Statistical Analysis Systems,
Institute Inc., NC.U.S.A.
Shehu, Y. and J.O., Akinola, 1995. The productivity of pure and mixed grass-legume pastures
in the North Guinea Savana zone of Nigeria. Tropical Grassland, 29 (2): 115-121.
Skerman, P.J. and F. Riveros, 1990. Tropical Grasses. FAO. Rome.
Smith, L.W., H.K.Goering and C.H. Gordon, 1972. Relation ships of forage compositions
with rates of cell wall digestion and indigestibility of cell walls. J.Dairy Sci., 55:1140.
Smith, O.B., 1992. Small ruminant feeding systems for small scale farmers in humid West
Africa. In: John E.S.S., N.S.Abdullah and K.A.Jackson (eds.).The complementarity of feed
resources for animal production in Africa. Proceedings of the joint feed resources net works,
workshop held in Gabone, Botswana 4-8 March 1991, African Feed Resource Network. April
1992.
Solomon Bogale, 2004. Assessment of Livestock Production Systems Feed Resource base in
Sinana Dinsho district of bale highlands, Southeast Oromya, MSc.Thesis, Alemaya
University, Dire Dawa, Ethiopia
SPSS (Statistical Packages for the Social Sciences, version 12), 1996. Cary, North Carolina.
65
Tarawali, S.A., M. Peters and R. Schultze-Kraft, 1999. Forage legumes for sustainable
agriculture and Livestock production in sub humid West Africa. ILRI project Report. ILRI
(International Livestock Research Institute), Nirobi.Kenya.132p.
Taye Bayable, 2004. Effect of Days of harvesting on yield chemical composition and In vitro
organic matter digestibility of Pennisetum purpureum sole or intercropped with Desmodium
intortum or Lablab purpureus. , MSc Thesis the School of Graduate Studies of Alemaya
University, Alemaya, Ethiopia. 69p.
Tekalign Mamo, I. Haque and E.A. Aduayi, 1991. Soil, plant, water, fertilizer, animal manure
and compost analysis manual. Plant science division working document 13, ILCA, Addis
Ababa, Ethiopia.
Tessema Zewdu, 2003. Identification of indigenous pasture and the effect of time of
harvesting and nitrogen fertilizer in the north western Ethiopian high lands. Trop.sci.45: 73-
77.
Teshome Shenkoru, 1987. Nutritive values, dry matter yield and in vitro digestibility as
affected by cutting interval and fertilizer application on native natural pastures growing on
three soil types at Alemaya University campus. , MSc Thesis the School of Graduate Studies
of Alemaya University, Alemaya, Ethiopia. 160p.
Teshome Shenkoru, Beyene chichaibelu and J.D. Reed, 1994. Effect of days of maturity and
fertilizer on composition and in Vitro digestibility of indigenous pasture in the eastern high
lands of Ethiopia. Ethiopian Journal of Agricultural sci., 14(1): 60-69.
Tilahun Amede, Solomon Mengistu and Ralph Roothaert, 2005. Identification of Livestock
Feed Production in Ethiopian Highlands: Potential and Experiences of the African Highlands
Initiative. Presented at the 19th EVA Annual conference, 8 June 2005, ECA, Addis Ababa.
66
Topps, J.H., 1995. Forage legumes as protein supplements to poor quality diets in semi-arid
tropics. In: Wallace, R.J., A. Lahloukassi (eds.). Rumen Ecology Research Planning.
Proceeding of a workshop held at ILRI. Addis Ababa. Ethiopia. 13-18 march 1995. Pp.183-
190.
Tothill, J.C., R.M. Jone and N.G. Hargreaves, 1978. BOTANAL: A field and computing
package for assessment of plant biomass and botanical composition. Ecology and
Management of World savannas.
Thulin, M., 1972.An agro botanical investigation of leguminous species in Chilalo Awraja,
especially at higher altitudes. Asella, Chilalo Agricultural Development Unit.
Van Soest, P.J., 1982. Ruminant metabolism, nutritional strategies, the cellulose fermentation
and the chemistry of forage and plant fibers. In: Nutritional Ecology of the Ruminant.
Comstock publishing Associates, Cornell University press. London. 373p.
Van Soest, P.J. and J.B. Robertson, 1985. Analysis of forage and fibrous feeds. A laboratory
manual for Animal science, 613. Department of Animal Science, Cornell University, Ithaca,
NY. 202p.
Varvikko, T., 1991. Nutrition constraint to provide small holder milk production in the
Ethiopian high lands. The Selale experience: In proceeding of 4th national livestock
Improvement Conference. 13-15 November 1991. Addis Ababa, Ethiopia.
Walkley, A. and Black, C.A., 1954. An examination of Degtjareff method for determining
soil organic matter and proposed modification of the chromic acid titration method. J. Soil
Sci. 37: 29-38.
Webster, C.C. and P.N. Wilson, 1980. Variation in composition and feeding value herbage
with stage of growth. Agriculture in the Tropics. 2nd ed. 320p.
67
Whiteman, P.C., 1980. Tropical pasture science. Oxford university press. New York.
Wilson, J.R., 1994. Cell wall characteristics in relation to forage digestion by ruminants.
Journal of Agricultural Science, 122: 177-182.
Wolfson, M.M. and N.M.Tainton, 2000. The morphology and physiology of the major forage
plants. In Tainton, N.M. (eds.). Pasture Management in South Africa. Pp. 14-33. University of
Natal Press. Pietermaritzburg, South Africa.
Yihalem Denekew, 2004. Assessment of Botanical Composition and Stage of Harvesting of
selected Natural Pasture for Optimum Utilization as Hay at Andassa Livestock Research
Center, Northwestern Ethiopia. MSc. Thesis the School of Graduate Studies, Alemaya
University. 99p.
Zinash Sileshi, Seyoum Bediye, Lulseged Gebrehiwot and Tadesse Tekletasdik, 1995. Effect
of harvesting stage on yield and quality of natural pasture in the central high lands of
Ethiopia. In: Proceedings of 3rd national conference of the Ethiopian society of animal
production. 27-29, April 1995.pp.316-322. Addis Ababa, Ethiopia.
68

9. APPENDIX
69
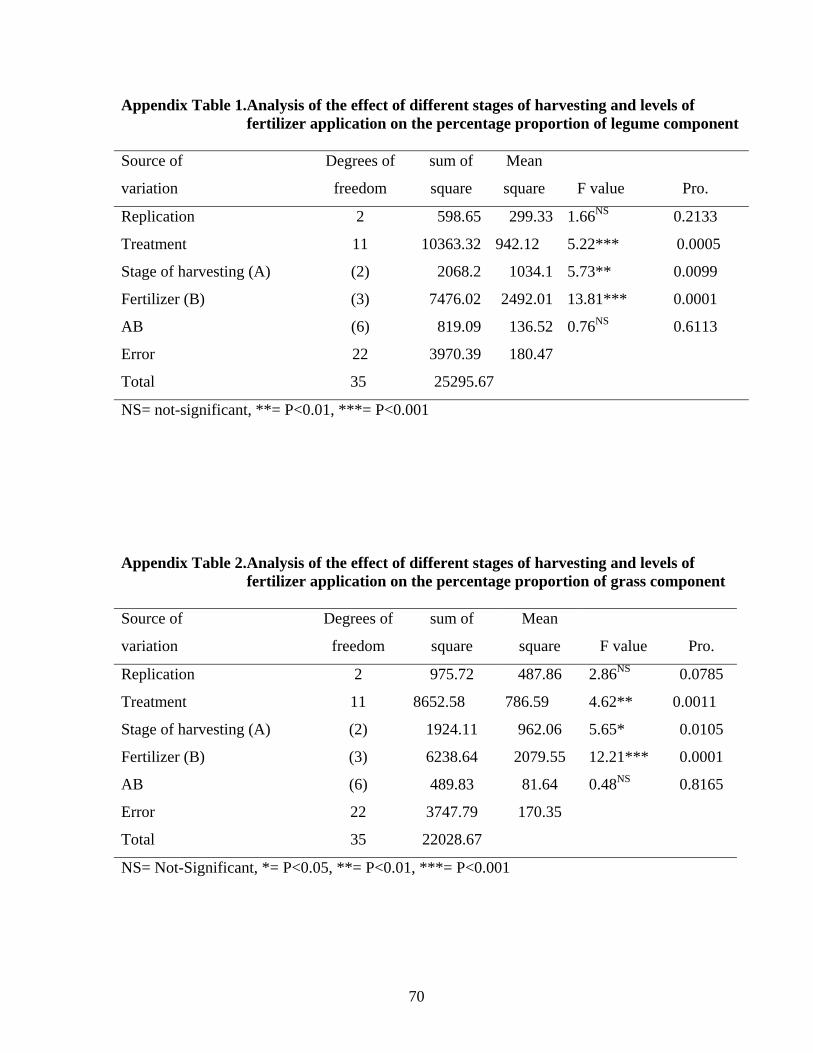
Appendix Table 1.Analysis of the effect of different stages of harvesting and levels of fertilizer application on the percentage proportion of legume component
Source of
variation
Degrees of
freedom
sum of
square
Mean
square F value Pro.
Replication 2 598.65 299.33 1.66NS 0.2133
Treatment 11 10363.32 942.12 5.22*** 0.0005
Stage of harvesting (A) (2) 2068.2 1034.1 5.73** 0.0099
Fertilizer (B) (3) 7476.02 2492.01 13.81*** 0.0001
AB (6) 819.09 136.52 0.76NS 0.6113
Error 22 3970.39 180.47
Total 35 25295.67
NS= not-significant, **= P<0.01, ***= P<0.001
Appendix Table 2.Analysis of the effect of different stages of harvesting and levels of
fertilizer application on the percentage proportion of grass component Source of
variation
Degrees of
freedom
sum of
square
Mean
square F value Pro.
Replication 2 975.72 487.86 2.86NS 0.0785
Treatment 11 8652.58 786.59 4.62** 0.0011
Stage of harvesting (A) (2) 1924.11 962.06 5.65* 0.0105
Fertilizer (B) (3) 6238.64 2079.55 12.21*** 0.0001
AB (6) 489.83 81.64 0.48NS 0.8165
Error 22 3747.79 170.35
Total 35 22028.67
NS= Not-Significant, *= P<0.05, **= P<0.01, ***= P<0.001
70
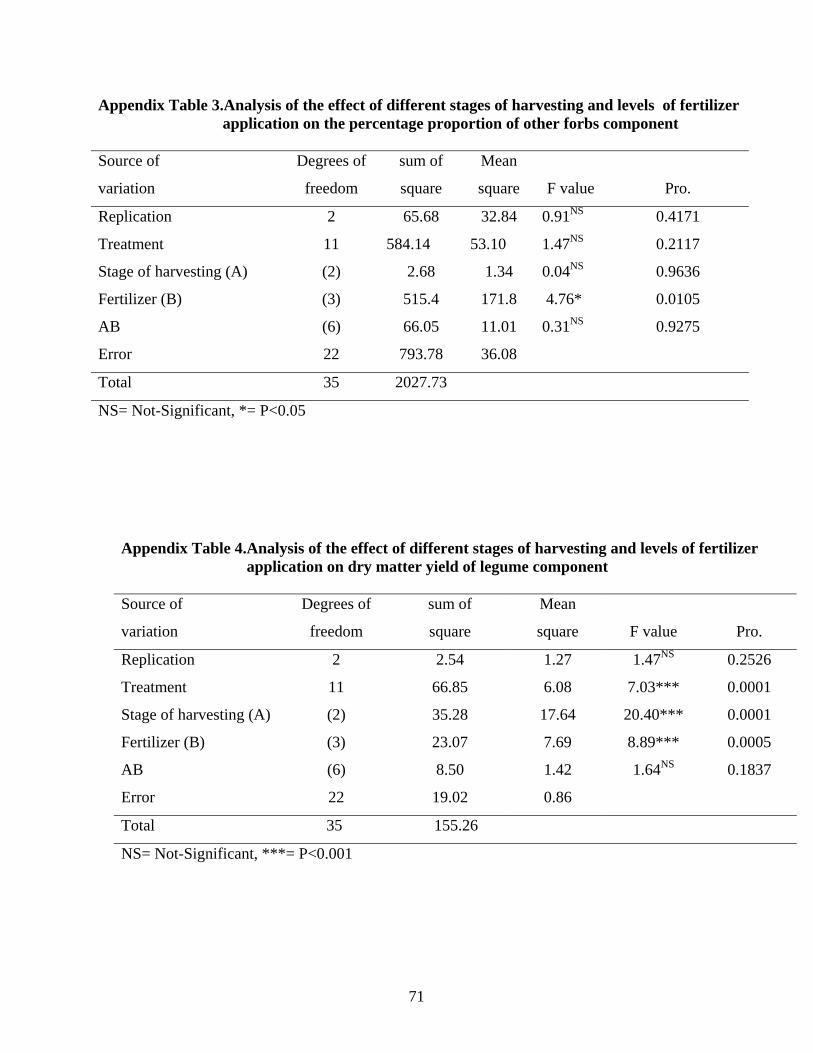
Appendix Table 3.Analysis of the effect of different stages of harvesting and levels of fertilizer application on the percentage proportion of other forbs component
Source of
variation
Degrees of
freedom
sum of
square
Mean
square F value Pro.
Replication 2 65.68 32.84 0.91NS 0.4171
Treatment 11 584.14 53.10 1.47NS 0.2117
Stage of harvesting (A) (2) 2.68 1.34 0.04NS 0.9636
Fertilizer (B) (3) 515.4 171.8 4.76* 0.0105
AB (6) 66.05 11.01 0.31NS 0.9275
Error 22 793.78 36.08
Total 35 2027.73
NS= Not-Significant, *= P<0.05
Appendix Table 4.Analysis of the effect of different stages of harvesting and levels of fertilizer application on dry matter yield of legume component
Source of
variation
Degrees of
freedom
sum of
square
Mean
square F value Pro.
Replication 2 2.54 1.27 1.47NS 0.2526
Treatment 11 66.85 6.08 7.03*** 0.0001
Stage of harvesting (A) (2) 35.28 17.64 20.40*** 0.0001
Fertilizer (B) (3) 23.07 7.69 8.89*** 0.0005
AB (6) 8.50 1.42 1.64NS 0.1837
Error 22 19.02 0.86
Total 35 155.26
NS= Not-Significant, ***= P<0.001
71
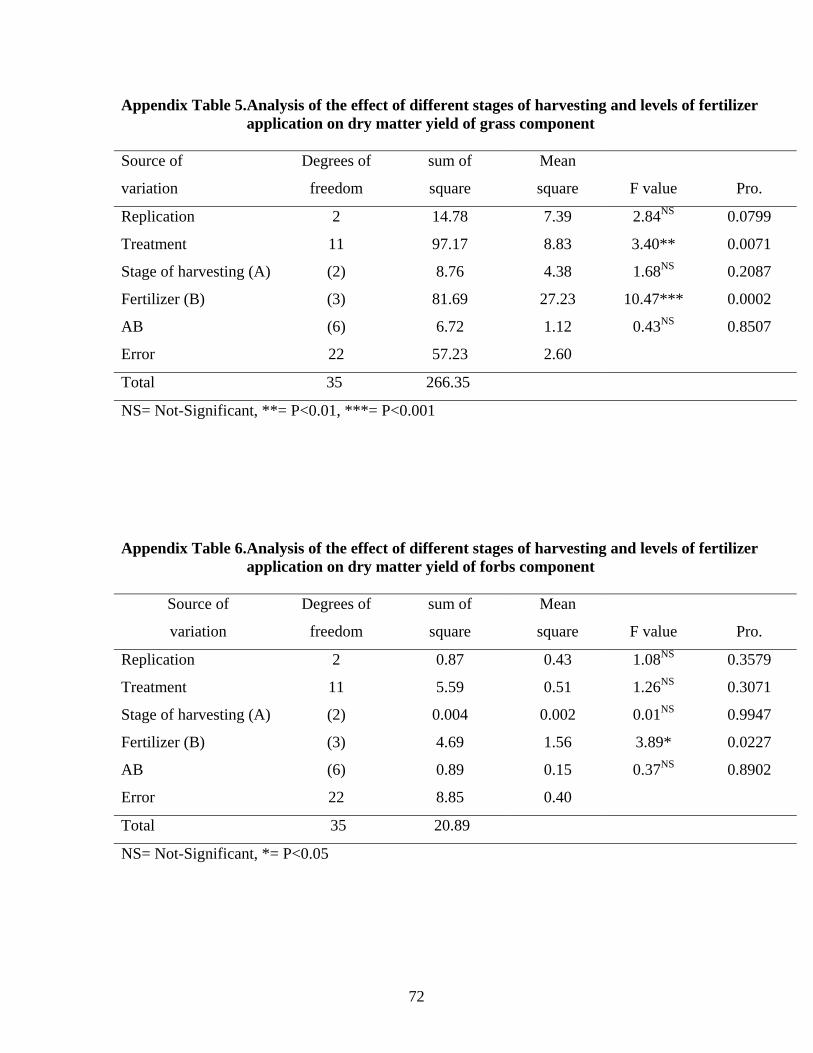
Appendix Table 5.Analysis of the effect of different stages of harvesting and levels of fertilizer application on dry matter yield of grass component
Source of
variation
Degrees of
freedom
sum of
square
Mean
square F value Pro.
Replication 2 14.78 7.39 2.84NS 0.0799
Treatment 11 97.17 8.83 3.40** 0.0071
Stage of harvesting (A) (2) 8.76 4.38 1.68NS 0.2087
Fertilizer (B) (3) 81.69 27.23 10.47*** 0.0002
AB (6) 6.72 1.12 0.43NS 0.8507
Error 22 57.23 2.60
Total 35 266.35
NS= Not-Significant, **= P<0.01, ***= P<0.001
Appendix Table 6.Analysis of the effect of different stages of harvesting and levels of fertilizer application on dry matter yield of forbs component
Source of
variation
Degrees of
freedom
sum of
square
Mean
square F value Pro.
Replication 2 0.87 0.43 1.08NS 0.3579
Treatment 11 5.59 0.51 1.26NS 0.3071
Stage of harvesting (A) (2) 0.004 0.002 0.01NS 0.9947
Fertilizer (B) (3) 4.69 1.56 3.89* 0.0227
AB (6) 0.89 0.15 0.37NS 0.8902
Error 22 8.85 0.40
Total 35 20.89
NS= Not-Significant, *= P<0.05
72
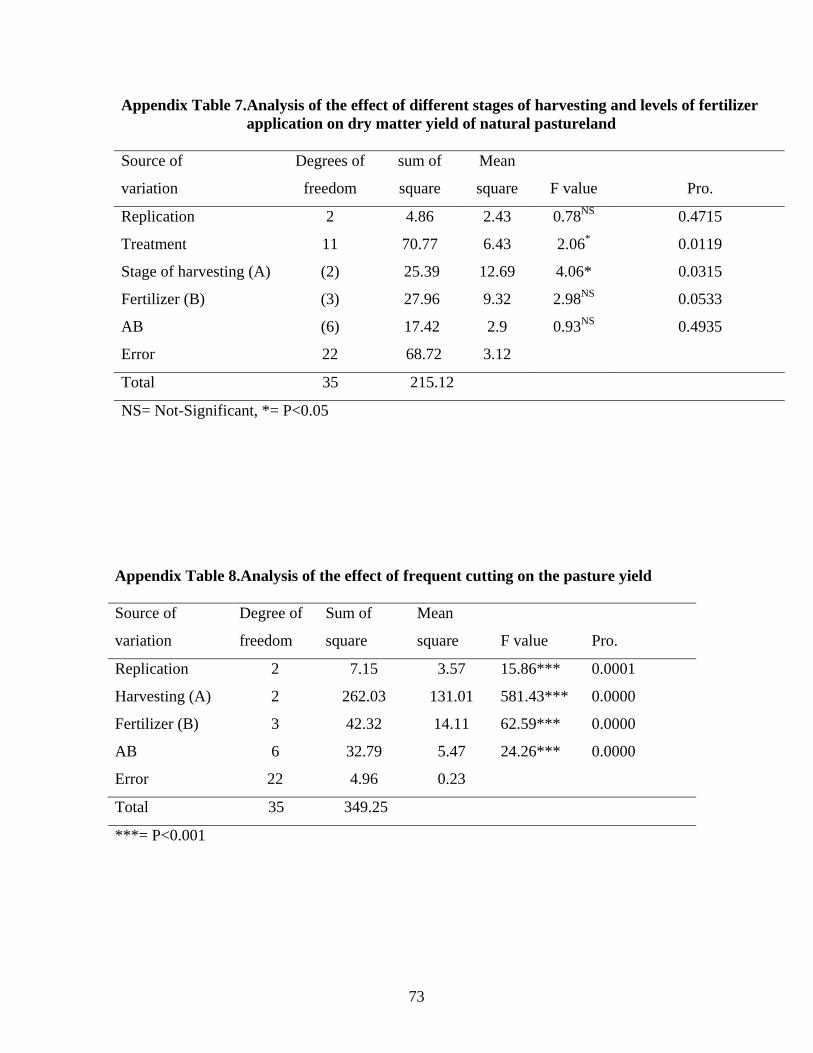
Appendix Table 7.Analysis of the effect of different stages of harvesting and levels of fertilizer application on dry matter yield of natural pastureland
Source of
variation
Degrees of
freedom
sum of
square
Mean
square F value Pro.
Replication 2 4.86 2.43 0.78NS 0.4715
Treatment 11 70.77 6.43 2.06* 0.0119
Stage of harvesting (A) (2) 25.39 12.69 4.06* 0.0315
Fertilizer (B) (3) 27.96 9.32 2.98NS 0.0533
AB (6) 17.42 2.9 0.93NS 0.4935
Error 22 68.72 3.12
Total 35 215.12
NS= Not-Significant, *= P<0.05
Appendix Table 8.Analysis of the effect of frequent cutting on the pasture yield Source of
variation
Degree of
freedom
Sum of
square
Mean
square
F value
Pro.
Replication 2 7.15 3.57 15.86*** 0.0001
Harvesting (A) 2 262.03 131.01 581.43*** 0.0000
Fertilizer (B) 3 42.32 14.11 62.59*** 0.0000
AB 6 32.79 5.47 24.26*** 0.0000
Error 22 4.96 0.23
Total 35 349.25
***= P<0.001
73
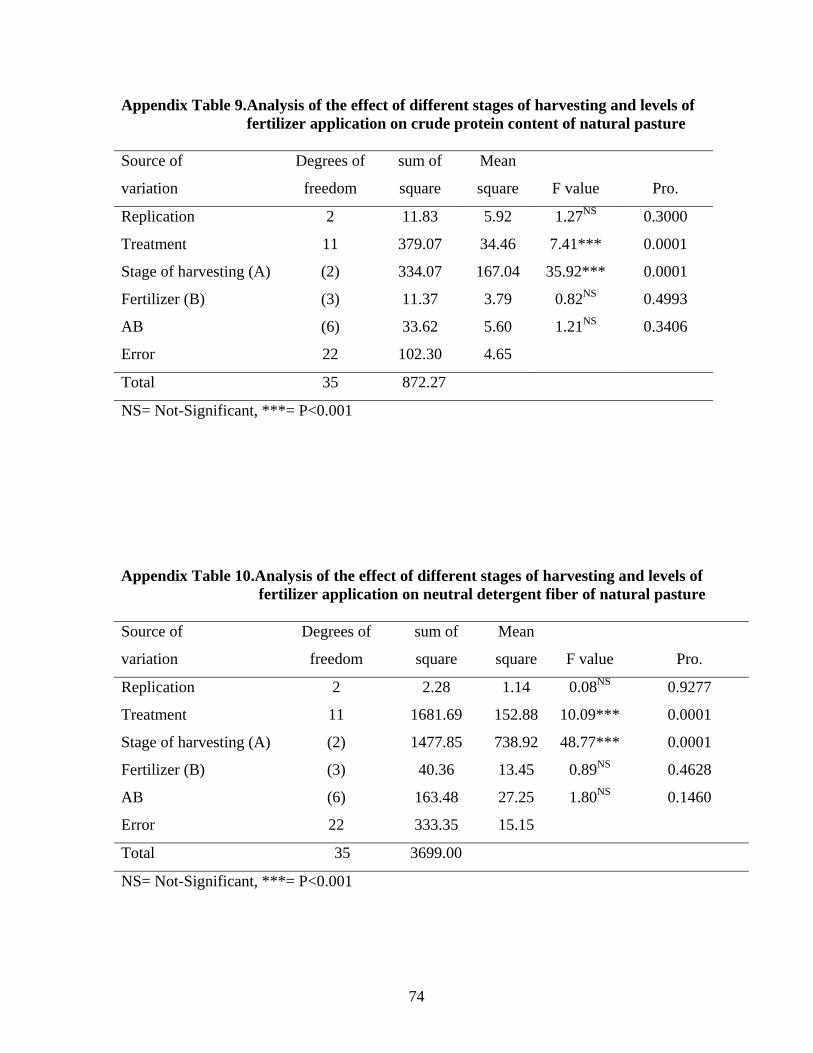
Appendix Table 9.Analysis of the effect of different stages of harvesting and levels of fertilizer application on crude protein content of natural pasture
Source of
variation
Degrees of
freedom
sum of
square
Mean
square F value Pro.
Replication 2 11.83 5.92 1.27NS 0.3000
Treatment 11 379.07 34.46 7.41*** 0.0001
Stage of harvesting (A) (2) 334.07 167.04 35.92*** 0.0001
Fertilizer (B) (3) 11.37 3.79 0.82NS 0.4993
AB (6) 33.62 5.60 1.21NS 0.3406
Error 22 102.30 4.65
Total 35 872.27
NS= Not-Significant, ***= P<0.001
Appendix Table 10.Analysis of the effect of different stages of harvesting and levels of fertilizer application on neutral detergent fiber of natural pasture
Source of
variation
Degrees of
freedom
sum of
square
Mean
square F value Pro.
Replication 2 2.28 1.14 0.08NS 0.9277
Treatment 11 1681.69 152.88 10.09*** 0.0001
Stage of harvesting (A) (2) 1477.85 738.92 48.77*** 0.0001
Fertilizer (B) (3) 40.36 13.45 0.89NS 0.4628
AB (6) 163.48 27.25 1.80NS 0.1460
Error 22 333.35 15.15
Total 35 3699.00
NS= Not-Significant, ***= P<0.001
74
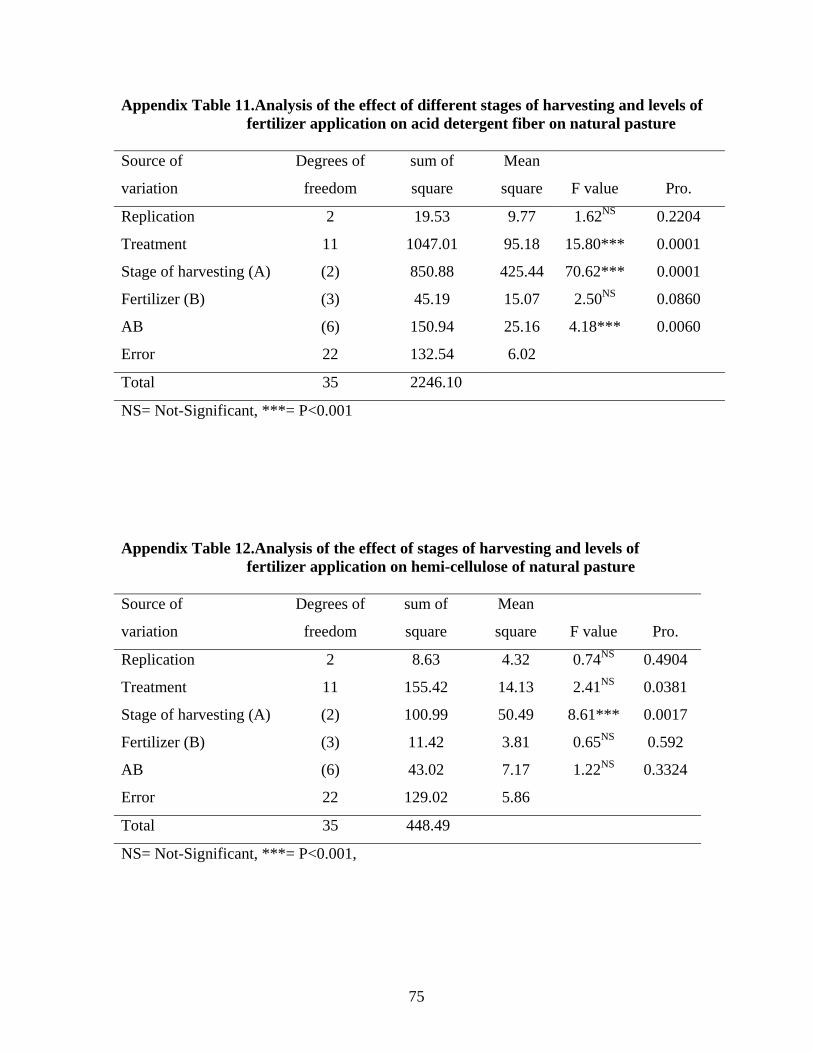
Appendix Table 11.Analysis of the effect of different stages of harvesting and levels of fertilizer application on acid detergent fiber on natural pasture
Source of
variation
Degrees of
freedom
sum of
square
Mean
square F value Pro.
Replication 2 19.53 9.77 1.62NS 0.2204
Treatment 11 1047.01 95.18 15.80*** 0.0001
Stage of harvesting (A) (2) 850.88 425.44 70.62*** 0.0001
Fertilizer (B) (3) 45.19 15.07 2.50NS 0.0860
AB (6) 150.94 25.16 4.18*** 0.0060
Error 22 132.54 6.02
Total 35 2246.10
NS= Not-Significant, ***= P<0.001
Appendix Table 12.Analysis of the effect of stages of harvesting and levels of fertilizer application on hemi-cellulose of natural pasture
Source of
variation
Degrees of
freedom
sum of
square
Mean
square F value Pro.
Replication 2 8.63 4.32 0.74NS 0.4904
Treatment 11 155.42 14.13 2.41NS 0.0381
Stage of harvesting (A) (2) 100.99 50.49 8.61*** 0.0017
Fertilizer (B) (3) 11.42 3.81 0.65NS 0.592
AB (6) 43.02 7.17 1.22NS 0.3324
Error 22 129.02 5.86
Total 35 448.49
NS= Not-Significant, ***= P<0.001,
75
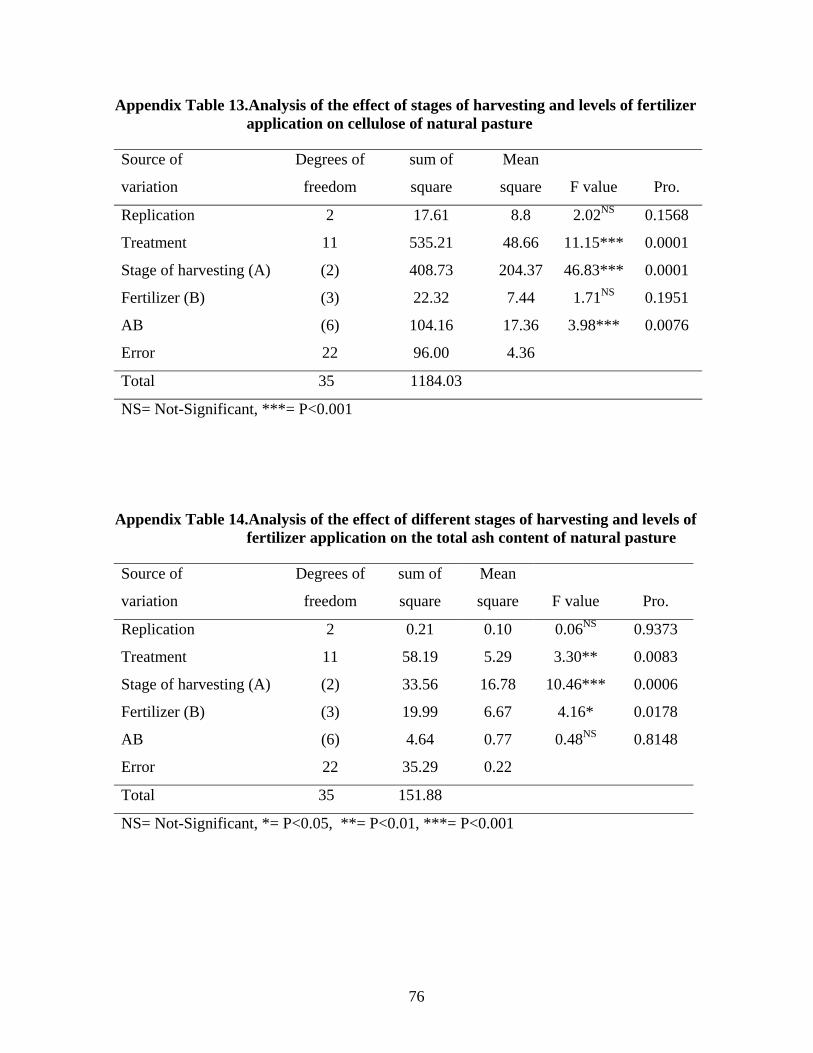
Appendix Table 13.Analysis of the effect of stages of harvesting and levels of fertilizer application on cellulose of natural pasture
Source of
variation
Degrees of
freedom
sum of
square
Mean
square F value Pro.
Replication 2 17.61 8.8 2.02NS 0.1568
Treatment 11 535.21 48.66 11.15*** 0.0001
Stage of harvesting (A) (2) 408.73 204.37 46.83*** 0.0001
Fertilizer (B) (3) 22.32 7.44 1.71NS 0.1951
AB (6) 104.16 17.36 3.98*** 0.0076
Error 22 96.00 4.36
Total 35 1184.03
NS= Not-Significant, ***= P<0.001
Appendix Table 14.Analysis of the effect of different stages of harvesting and levels of fertilizer application on the total ash content of natural pasture
Source of
variation
Degrees of
freedom
sum of
square
Mean
square F value Pro.
Replication 2 0.21 0.10 0.06NS 0.9373
Treatment 11 58.19 5.29 3.30** 0.0083
Stage of harvesting (A) (2) 33.56 16.78 10.46*** 0.0006
Fertilizer (B) (3) 19.99 6.67 4.16* 0.0178
AB (6) 4.64 0.77 0.48NS 0.8148
Error 22 35.29 0.22
Total 35 151.88
NS= Not-Significant, *= P<0.05, **= P<0.01, ***= P<0.001
76
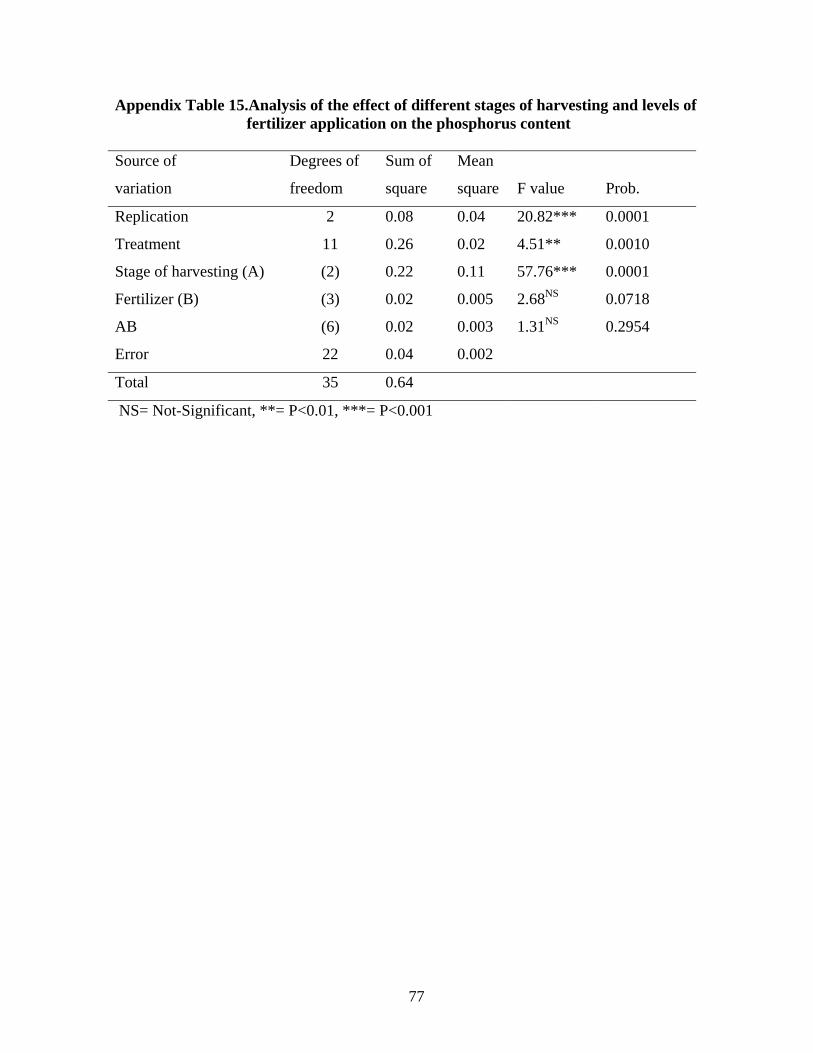
Appendix Table 15.Analysis of the effect of different stages of harvesting and levels of fertilizer application on the phosphorus content
Source of
variation
Degrees of
freedom
Sum of
square
Mean
square
F value
Prob.
Replication 2 0.08 0.04 20.82*** 0.0001
Treatment 11 0.26 0.02 4.51** 0.0010
Stage of harvesting (A) (2) 0.22 0.11 57.76*** 0.0001
Fertilizer (B) (3) 0.02 0.005 2.68NS 0.0718
AB (6) 0.02 0.003 1.31NS 0.2954
Error 22 0.04 0.002
Total 35 0.64
NS= Not-Significant, **= P<0.01, ***= P<0.001
77
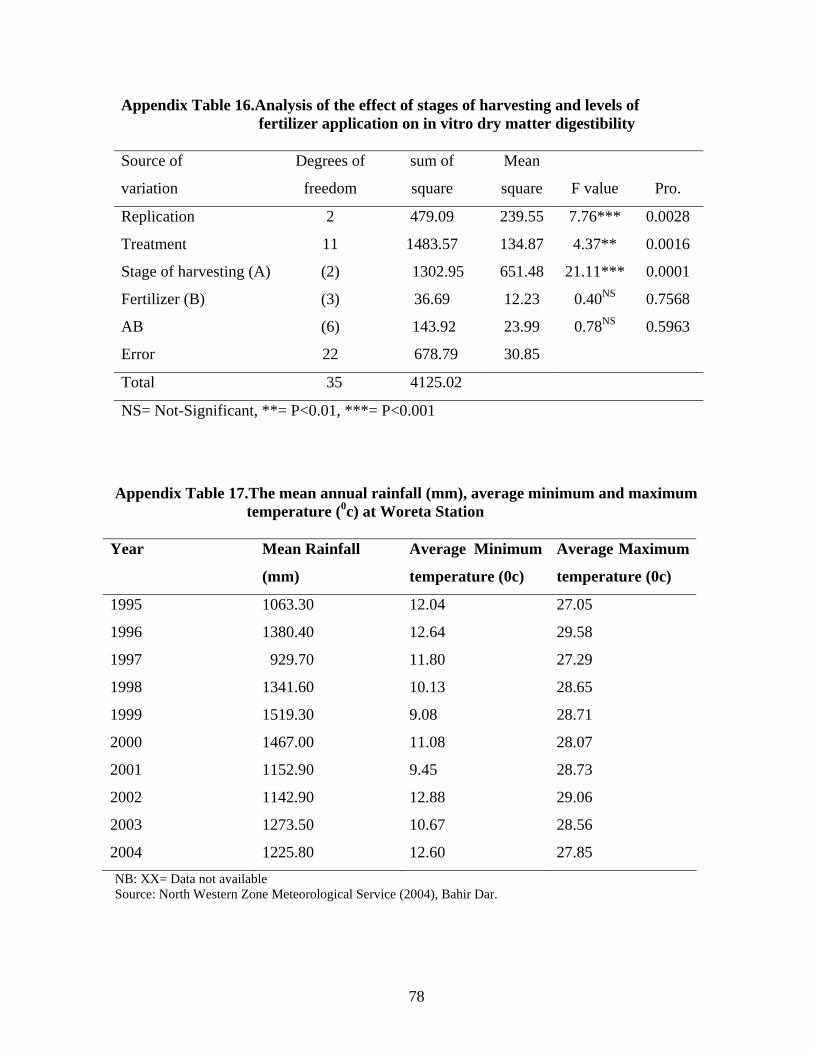
Appendix Table 16.Analysis of the effect of stages of harvesting and levels of fertilizer application on in vitro dry matter digestibility
Source of
variation
Degrees of
freedom
sum of
square
Mean
square F value Pro.
Replication 2 479.09 239.55 7.76*** 0.0028
Treatment 11 1483.57 134.87 4.37** 0.0016
Stage of harvesting (A) (2) 1302.95 651.48 21.11*** 0.0001
Fertilizer (B) (3) 36.69 12.23 0.40NS 0.7568
AB (6) 143.92 23.99 0.78NS 0.5963
Error 22 678.79 30.85
Total 35 4125.02
NS= Not-Significant, **= P<0.01, ***= P<0.001
Appendix Table 17.The mean annual rainfall (mm), average minimum and maximum temperature (0c) at Woreta Station
Year Mean Rainfall
(mm)
Average Minimum
temperature (0c)
Average Maximum
temperature (0c)
1995 1063.30 12.04 27.05
1996 1380.40 12.64 29.58
1997 929.70 11.80 27.29
1998 1341.60 10.13 28.65
1999 1519.30 9.08 28.71
2000 1467.00 11.08 28.07
2001 1152.90 9.45 28.73
2002 1142.90 12.88 29.06
2003 1273.50 10.67 28.56
2004 1225.80 12.60 27.85 NB: XX= Data not available Source: North Western Zone Meteorological Service (2004), Bahir Dar.
78