
Share Capital Increase - Bank of Cyprus
18
Share Capital Increase Additional Information Pack – Part 1 July 2014 HIGHLY RESTRICTED
Transcript of Share Capital Increase - Bank of Cyprus

Share Capital Increase
Additional Information Pack – Part 1
July 2014
HIGHLY RESTRICTED
2 HIGHLY RESTRICTED
Exposures
- Loan portfolio performance analysis by customer type 3
Capital
- Reconciliation of Group equity to CET1 4
- Breakdown of RWA by geography 5
- Basel III fully loaded computation 6
Asset quality
- Top 30 customer groups by exposure (aggregated) 7
- Top 50 individual 90+DPD exposures (aggregated) 8
- Other asset quality metrics 9
Funding
- Deposits breakdown 10
- Calculation of liquidity ratio 11
Margins & profitability
- Yields by segment 12
- Cost of deposits 13
- Net interest income computation 14
Other information
- Property valuation policy 15
- Additional key information 16 – 17
Table of contents

49
133
156
255
192
0
127
127
127
0
153
204
191
191
191
203
224
230
234
234
234
0
97
114
Loan portfolio performance analysis by customer type
3 HIGHLY RESTRICTED
As at March 31, 2014; €m
Group
Total loans and
advances
Performing loans and advances
Non-performing
credit facilities
Not restructured
loans and
advances
Restructured
loans and
advances
Total performing
loans and
advances
1. Corporate legal entities 15,022 3,962 1,396 5,358 9,665
Construction 3,872 494 327 822 3,050
Real estate activities 3,320 840 332 1,172 2,148
Wholesale and retail trade: repair of motor vehicles and motorcycles 2,137 819 177 996 1,141
Accommodation and food service activities 1,638 492 172 663 974
Electricity, gas, steam and air-conditioning supply 49 37 9 46 3
All other sectors 4,007 1,279 380 1,659 2,349
2. Retail legal entities 2,230 1,030 156 1,187 1,043
Wholesale and retail trade: repair of motor vehicles and motorcycles 574 287 37 325 250
Real estate activities 382 153 22 175 207
Construction 282 76 25 102 180
Manufacturing 213 92 13 104 109
Service activities 126 78 6 84 42
All other sectors 653 344 53 397 256
3. Private individuals 9,011 4,125 1,157 5,282 3,729
Credit facilities for the purchase/construction of immovable property: 5,802 2,784 926 3,710 2,092
(a) Owner occupied 3,374 1,670 562 2,232 1,142
(b) For other purposes 2,428 1,114 364 1,478 950
Consumer loans 2,030 701 190 891 1,139
Credit cards 262 184 0 184 78
Current accounts 366 207 0 207 159
Credit facilities to sole traders 550 249 40 290 261
4. Total credit facilities 26,2631 9,117 2,710 11,826 14,437
Provisions for impairment and fair value adjustment on initial recognition 5,0291 213 93 307 4,722
Exposures
Note:
1. Includes fair value adjustment on initial recognition of €1,813m relating to the loans and advances to customers acquired as part of the Laiki Bank acquisition in 2013

49
133
156
255
192
0
127
127
127
0
153
204
191
191
191
203
224
230
234
234
234
0
97
114
Reconciliation of Group equity to CET1
4 HIGHLY RESTRICTED
Capital
€bn, March 31, 2014
Group equity ‐ per financial statements 2.76
Less: Intangibles (0.02)
Less: In-force value (insurance companies) (0.09)
Less: Non banking subsidiaries reserves, adjustments on MI and other items (0.10)
Less: Unrealised gains from available for sale debt and equity instruments transferred to
T2 (as per transitional provisions) (0.05)
CET1 2.50

49
133
156
255
192
0
127
127
127
0
153
204
191
191
191
203
224
230
234
234
234
0
97
114
Breakdown of RWA by geography
5 HIGHLY RESTRICTED
€bn; as at March 31, 2014
Country of operation Credit risk1 Market risk1 Operational
risk1 Total1
Cyprus 18.59 87% 0.16 1.66 20.40 87%
Russia 1.04 5% 0.28 1.32 6%
United Kingdom 0.93 4% 0.04 0.98 4%
Romania 0.33 2% 0.04 0.37 2%
Greece 0.24 1% 0.00 0.24 1%
Ukraine 0.15 1% 0.04 0.18 1%
Channel Islands 0.04 0% 0.00 0.04 0%
Netherlands 0.00 0% 0.00 0.00 0%
Grand Total 21.31 100% 0.16 2.06 23.53 100%
Capital
Note:
1. Based on CRD IV provisional calculations

49
133
156
255
192
0
127
127
127
0
153
204
191
191
191
203
224
230
234
234
234
0
97
114
Basel III fully loaded computation
6 HIGHLY RESTRICTED
€bn
Pro forma March 31, 2014
Variance CET1
Transition
al estimate
Movement of
transitional
to fully
loaded
CET1
Fully
loaded
Share capital (net of treasury shares) 4.68 4.68
Retained earnings (2.17) (2.17)
OCI and other reserves (Property revaluation, FX and AFS reserves) (0.01) (0.01)
Minority interest 0.06 (0.01) 0.05
Deduction of intangibles (0.02) (0.02)
Adjustments impacted by transitional provisions -
Amount exceeding the 10% threshold deductions for deferred tax assets and financial sector entities (0.21) (0.21)
Amount exceeding the 15% threshold deductions for deferred tax assets and financial sector entities (0.05) (0.05)
Unrealised available-for-sale debt and equity instruments (0.05) 0.05 -
CET1 2.50 (0.22) 2.27
RWA 23.53 (0.08) 23.45
CET1 ratio 10.6% 9.7% 0.9%
Q2 actions 0.7%
Proforma FL-pre capital increase 10.4%
Expected capital increase (1bln) 4.3%
Proforma FL (post capital increase)1 14.7%
Positive net impact due to reduction of CET1 deduction due to DTAs 0.4%
Proforma FL (post accounting for reduction in DTA deduction) 15.1%
Note:
1. Excluding further capital benefit under 10% / 15% thresholds
Capital
The Bank intends to operate at a 12% CET1 ratio in the medium term and intends to measure returns on a normalised capital base
7 HIGHLY RESTRICTED
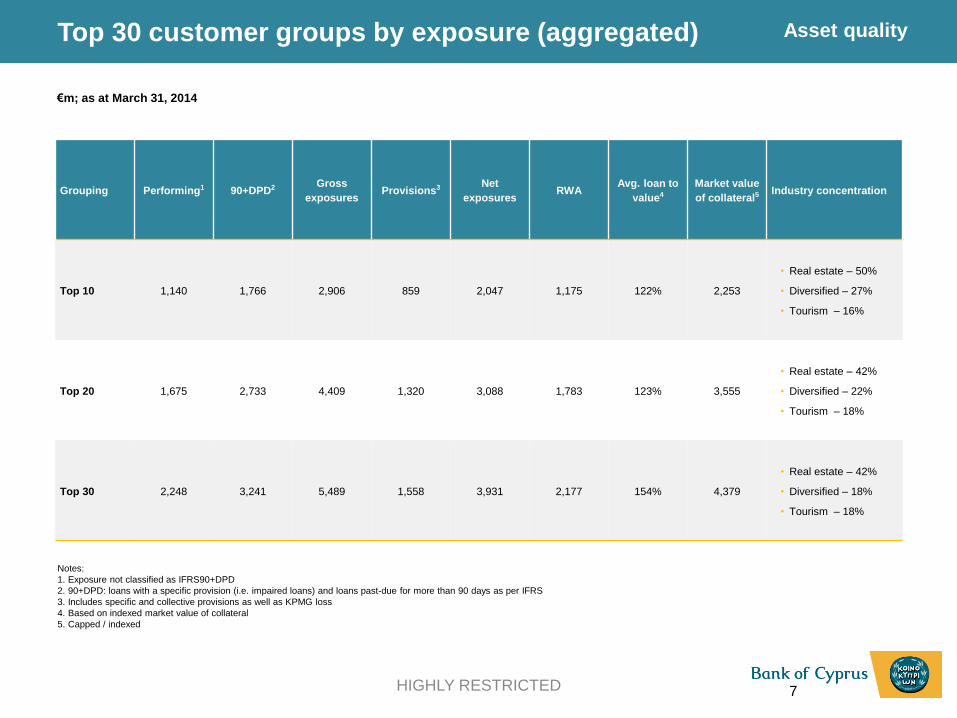
Top 30 customer groups by exposure (aggregated)
Grouping Performing1 90+DPD2 Gross
exposures Provisions3 Net
exposures RWA
Avg. loan to
value4
Market value
of collateral5 Industry concentration
Top 10 1,140 1,766 2,906 859 2,047 1,175 122% 2,253
• Real estate – 50%
• Diversified – 27%
• Tourism – 16%
Top 20 1,675 2,733 4,409 1,320 3,088 1,783 123% 3,555
• Real estate – 42%
• Diversified – 22%
• Tourism – 18%
Top 30 2,248 3,241 5,489 1,558 3,931 2,177 154% 4,379
• Real estate – 42%
• Diversified – 18%
• Tourism – 18%
Notes:
1. Exposure not classified as IFRS90+DPD
2. 90+DPD: loans with a specific provision (i.e. impaired loans) and loans past-due for more than 90 days as per IFRS
3. Includes specific and collective provisions as well as KPMG loss
4. Based on indexed market value of collateral
5. Capped / indexed
€m; as at March 31, 2014
Asset quality

8 HIGHLY RESTRICTED
Top 50 individual 90+DPD exposures (aggregated)
Grouping Balance1 Recoverable amount of
collaterals2 Provisions3
Industry concentration
(% within groupings)
Top 10 1,312 831 504
• Real estate – 40%
• Development – 18%
• Trade – 14%
Top 20 2,005 1,495 704
• Real estate – 41%
• Development – 26%
• Trade – 9%
Top 30 2,450 1,791 921
• Real estate – 37%
• Development – 23%
• Tourism – 14%
Top 50 3,076 2,262 1,190
• Real estate – 36%
• Development – 18%
• Tourism – 18%
Notes:
1. Excludes any income not recognised in the P&L
2. Recoverable amount of collateral as per CBC directive i.e. for mortgages the amount is based
on the Forced Sale value of the property which usually is 75%-80% of the market value
3. Includes specific and collective provisions as well as KPMG loss
€m; as at March 31, 2014
Asset quality

49
133
156
255
192
0
127
127
127
0
153
204
191
191
191
203
224
230
234
234
234
0
97
114
Other asset quality metrics
9 HIGHLY RESTRICTED
3Q13 4Q13 1Q141
% of Specific P&L charge on new (NPLs / 90+DPD) 61% 60% 89%
% of Specific P&L charge on existing (NPLs / 90+DPD) 39% 40% 11%
Note:
1. Sum of 1Q14 %s is > 100% due to a recovery in collective provisions
Share of provisions going towards new vs. existing NPLs
To past due but not impaired
(>5 dpd) To impaired
Neither past due nor impaired (< 5dpd) 1,043.1 88.0
% of loans 11% 1%
Portfolio roll over (€m)
To >90dpd To impaired To neither past due not
impaired (0-5dpd) o/w Rescheduled
Past due but not impaired (between 5-90dpd) 472.7 141.4 565.9 191.7
% of loans 26% 8% 32% 34%
Reference Portfolio Segment Cure rate
1 BoC Corporate 10.80%
2 BoC International 6.30%
3 BoC Retail 8.48%
4 BoC SME 5.15%
5 ex-Laiki Corporate 12.55%
6 ex-Laiki International 0.11%
7 ex-Laiki Retail 6.10%
8 ex-Laiki SME 7.20%
Historical cure rates
Asset quality

49
133
156
255
192
0
127
127
127
0
153
204
191
191
191
203
224
230
234
234
234
0
97
114
Deposits breakdown
10 HIGHLY RESTRICTED
Deposits breakdown (€m) Dec-2013 Mar-2014
Total customer deposits, split by: 14,971 14,066
o/w retail deposits 9,437 9,011
o/w corporate deposits 5,534 5,055
Total customer deposits, split by: 14,971 14,066
o/w demand and savings 4,418 4,478
o/w time deposits 10,553 9,588
Total customer deposits, split by: 14,971 14,066
o/w domestic deposits 12,705 11,985
o/w non-domestic deposits 2,266 2,081
Total customer deposits1, split by: 12,705 11,985
o/w insured by the Deposit Guarantee Fund 7,468 7,435
o/w un-insured by the Deposit Guarantee Fund 5,237 4,550
% of depositors below 100k 58.8% 62.0%
Funding
Note:
1. Pertains to domestic deposits

49
133
156
255
192
0
127
127
127
0
153
204
191
191
191
203
224
230
234
234
234
0
97
114
Calculation of liquidity ratio
11 HIGHLY RESTRICTED
Funding
Liquidity ratio as at March 31, 2014 €m
Assets/Liabilities Less than 1 Year Maturity Balance
Cash and balances with CB 964
Placements with banks 699
Unencumbered investments at market value net of haircut (analysed below) 122
Total assets 1,785
Liabilities < 1 year maturity 6,120
(-) Deposits < 1 year (5,165)
(+) Total deposits 14,066
(-) Repos (582)
Near-term liabilities (assuming all deposits included) 14,438
Liquidity ratio 12.4%
Analysis of unencumbered investments
Unencumbered investments at market value net of haircut
Balance sheet value of all Investments 3,475
Balance sheet value of encumbered investments (3,279)
Diff. between B/S value and market value and to other illiquid assets and haircuts (74)
122

49
133
156
255
192
0
127
127
127
0
153
204
191
191
191
203
224
230
234
234
234
0
97
114
Yields by segment
12 HIGHLY RESTRICTED
As of 1Q14 YTD effective yield
Core bank – Cyprus 5.10%
Consumer 4.85%1
SME 6.07%
Corporate 5.54%
IBU 3.55%
Wealth management division 3.09%
Restructuring & recovery division – Cyprus 4.87%
Total Cyprus 4.98%
Note:
1. Includes housing loans with average Yield of around 4.45%
Margins & profitability
49
133
156
255
192
0
127
127
127
0
153
204
191
191
191
203
224
230
234
234
234
0
97
114
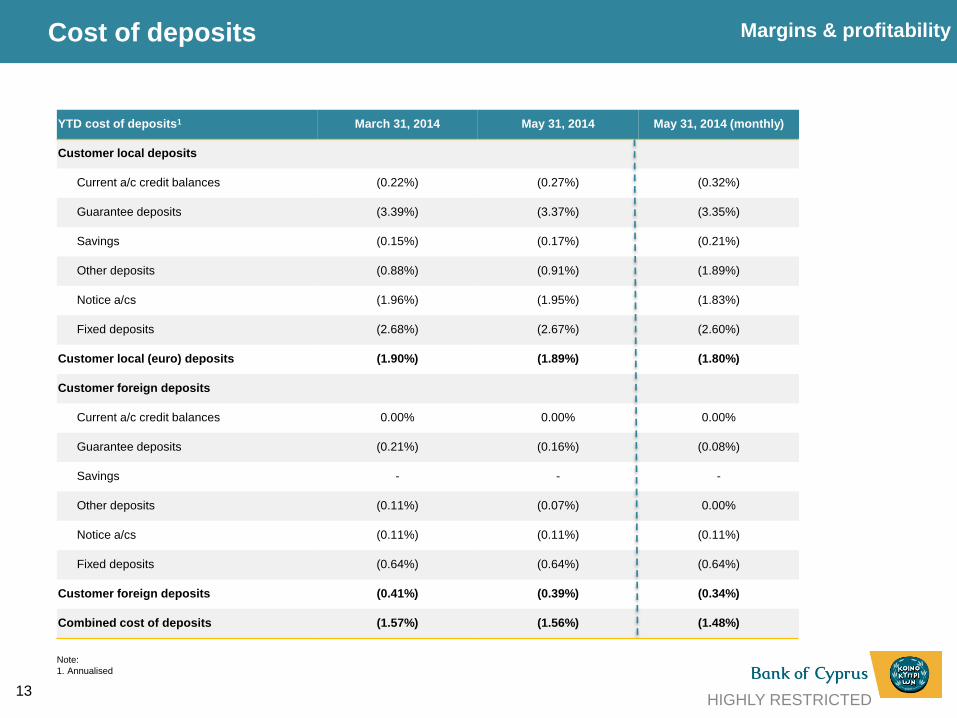
Cost of deposits
13 HIGHLY RESTRICTED
YTD cost of deposits1 March 31, 2014 May 31, 2014 May 31, 2014 (monthly)
Customer local deposits
Current a/c credit balances (0.22%) (0.27%) (0.32%)
Guarantee deposits (3.39%) (3.37%) (3.35%)
Savings (0.15%) (0.17%) (0.21%)
Other deposits (0.88%) (0.91%) (1.89%)
Notice a/cs (1.96%) (1.95%) (1.83%)
Fixed deposits (2.68%) (2.67%) (2.60%)
Customer local (euro) deposits (1.90%) (1.89%) (1.80%)
Customer foreign deposits
Current a/c credit balances 0.00% 0.00% 0.00%
Guarantee deposits (0.21%) (0.16%) (0.08%)
Savings - - -
Other deposits (0.11%) (0.07%) 0.00%
Notice a/cs (0.11%) (0.11%) (0.11%)
Fixed deposits (0.64%) (0.64%) (0.64%)
Customer foreign deposits (0.41%) (0.39%) (0.34%)
Combined cost of deposits (1.57%) (1.56%) (1.48%)
Margins & profitability
Note:
1. Annualised

49
133
156
255
192
0
127
127
127
0
153
204
191
191
191
203
224
230
234
234
234
0
97
114
Net interest income computation
14 HIGHLY RESTRICTED
In €’000s Total NII
(1Q14) NII-performing NII 90+DPD NIM (total)
NIM -
Performing NIM - 90+DPD
Core Bank - Cyprus 91,773 65,029 26,744 2.67% 2.44% 3.48%
Consumer 40,378 25,222 15,157 2.64% 2.30% 3.51%
SME 19,599 10,162 9,438 4.46% 4.00% 5.11%
Corporate 20,995 20,132 863 3.85% 3.81% 4.86%
IBU 10,336 9,103 1,233 1.20% 1.23% 1.01%
Wealth management division 463 410 53 0.67% 0.74% 0.39%
Restructuring & Recovery Division – Cyprus 84,021 26,845 57,175 3.11% 4.35% 2.74%
Total Cyprus 175,793 91,875 83,919 2.86% 2.79% 2.94%
Plus Interest income from bonds and other liquids1 60,007
Total NII Cyprus 235,800 91,875 83,919 3.84%
Greece 614 614 1.83%
UK 7,333 7,333 1.46%
Uniastrum 18,675 18,675 6.05%
Romania 4,535 4,535 4.66%
Total BoC Group 266,958 123,032 83,919 3.99% 3.20%
Group NIM excluding income from bonds 3.09%
Notes: Working has been prepared based on latest available information and after taking into account the following assumptions
1. Interest income from bonds, including Cy government bond has been excluded from the NIM calculations by line.
2.ELA and ECB funding allocated to RRD
3.A notional FTP equals to average funding cost (around 1.73%) was allocated between the Core lines based on the variation of their Loans
to deposits ratio
4.For simplicity overseas units included in performing column
Margins & profitability
49
133
156
255
192
0
127
127
127
0
153
204
191
191
191
203
224
230
234
234
234
0
97
114
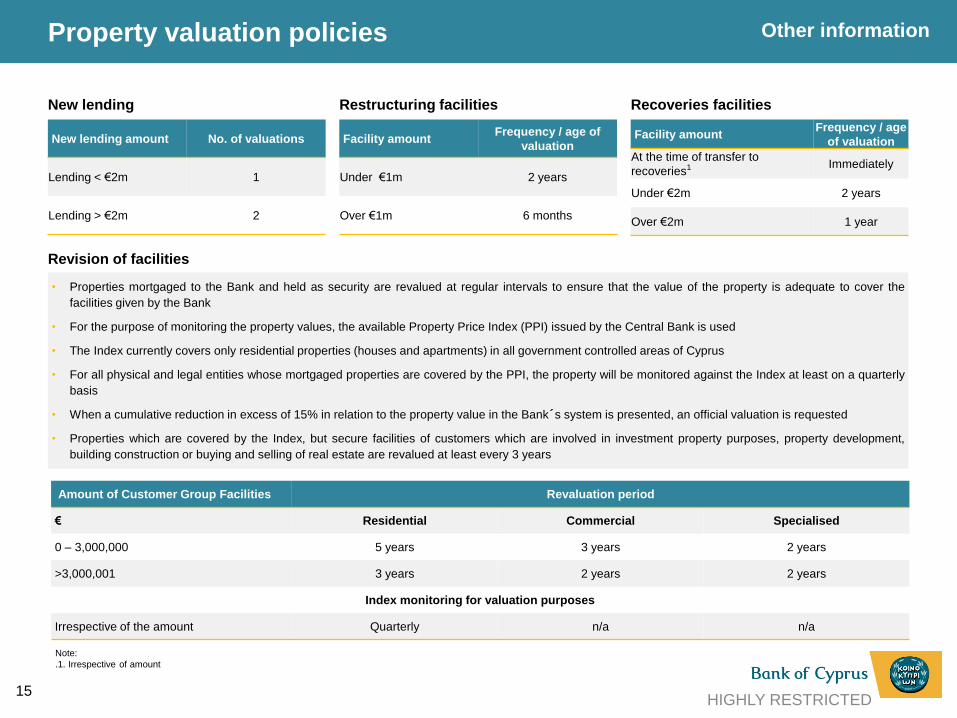
Property valuation policies
15 HIGHLY RESTRICTED
New lending amount No. of valuations
Lending < €2m 1
Lending > €2m 2
New lending
Facility amount Frequency / age of
valuation
Under €1m 2 years
Over €1m 6 months
Restructuring facilities
Facility amount Frequency / age
of valuation
At the time of transfer to
recoveries1 Immediately
Under €2m 2 years
Over €2m 1 year
Recoveries facilities
Note:
.1. Irrespective of amount
Revision of facilities
• Properties mortgaged to the Bank and held as security are revalued at regular intervals to ensure that the value of the property is adequate to cover the
facilities given by the Bank
• For the purpose of monitoring the property values, the available Property Price Index (PPI) issued by the Central Bank is used
• The Index currently covers only residential properties (houses and apartments) in all government controlled areas of Cyprus
• For all physical and legal entities whose mortgaged properties are covered by the PPI, the property will be monitored against the Index at least on a quarterly
basis
• When a cumulative reduction in excess of 15% in relation to the property value in the Bank´s system is presented, an official valuation is requested
• Properties which are covered by the Index, but secure facilities of customers which are involved in investment property purposes, property development,
building construction or buying and selling of real estate are revalued at least every 3 years
Amount of Customer Group Facilities Revaluation period
€ Residential Commercial Specialised
0 – 3,000,000 5 years 3 years 2 years
>3,000,001 3 years 2 years 2 years
Index monitoring for valuation purposes
Irrespective of the amount Quarterly n/a n/a
Other information
49
133
156
255
192
0
127
127
127
0
153
204
191
191
191
203
224
230
234
234
234
0
97
114
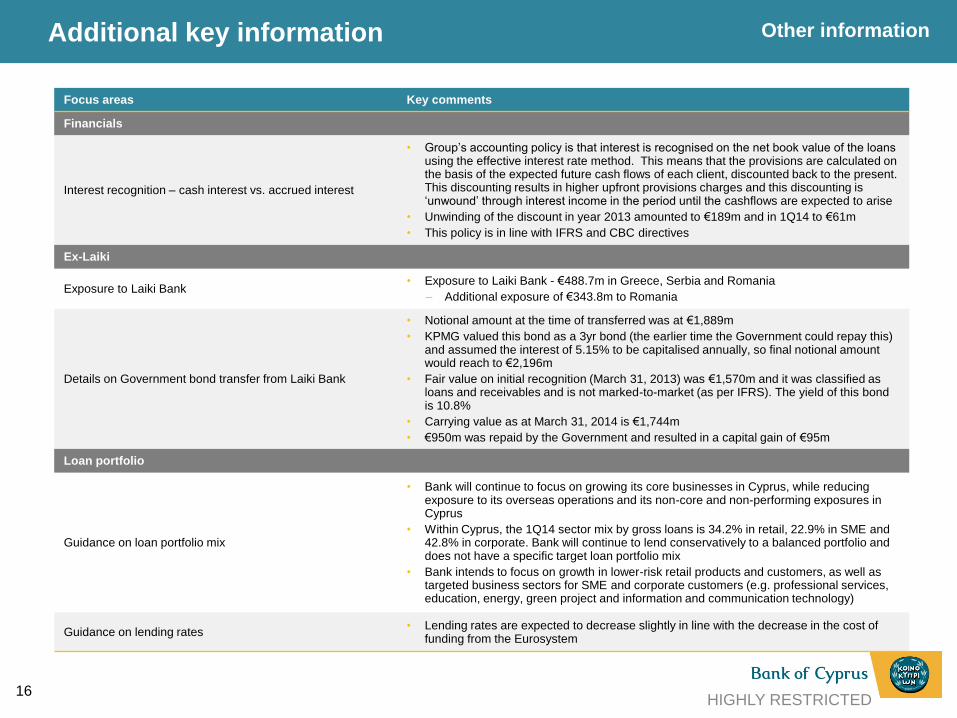
Additional key information
16 HIGHLY RESTRICTED
Focus areas Key comments
Financials
Interest recognition – cash interest vs. accrued interest
• Group’s accounting policy is that interest is recognised on the net book value of the loans using the effective interest rate method. This means that the provisions are calculated on the basis of the expected future cash flows of each client, discounted back to the present. This discounting results in higher upfront provisions charges and this discounting is ‘unwound’ through interest income in the period until the cashflows are expected to arise
• Unwinding of the discount in year 2013 amounted to €189m and in 1Q14 to €61m
• This policy is in line with IFRS and CBC directives
Ex-Laiki
Exposure to Laiki Bank • Exposure to Laiki Bank - €488.7m in Greece, Serbia and Romania
– Additional exposure of €343.8m to Romania
Details on Government bond transfer from Laiki Bank
• Notional amount at the time of transferred was at €1,889m
• KPMG valued this bond as a 3yr bond (the earlier time the Government could repay this) and assumed the interest of 5.15% to be capitalised annually, so final notional amount would reach to €2,196m
• Fair value on initial recognition (March 31, 2013) was €1,570m and it was classified as loans and receivables and is not marked-to-market (as per IFRS). The yield of this bond is 10.8%
• Carrying value as at March 31, 2014 is €1,744m
• €950m was repaid by the Government and resulted in a capital gain of €95m
Loan portfolio
Guidance on loan portfolio mix
• Bank will continue to focus on growing its core businesses in Cyprus, while reducing exposure to its overseas operations and its non-core and non-performing exposures in Cyprus
• Within Cyprus, the 1Q14 sector mix by gross loans is 34.2% in retail, 22.9% in SME and 42.8% in corporate. Bank will continue to lend conservatively to a balanced portfolio and does not have a specific target loan portfolio mix
• Bank intends to focus on growth in lower-risk retail products and customers, as well as targeted business sectors for SME and corporate customers (e.g. professional services, education, energy, green project and information and communication technology)
Guidance on lending rates • Lending rates are expected to decrease slightly in line with the decrease in the cost of
funding from the Eurosystem
Other information

49
133
156
255
192
0
127
127
127
0
153
204
191
191
191
203
224
230
234
234
234
0
97
114
Additional key information (contd.)
17 HIGHLY RESTRICTED
Other information
Focus areas Key comments
Investments
Yields on bond portfolio • Yield of bond portfolio was c.7% as at 1Q14; current yield (following repayment of part of
recapitalisation bond ) is c.5.6%
Collaterals
Collateral composition
• Real estate represents 85%, Cash 4%, Bank and Government guarantees 2%, Fixed and Floating 1% and other collateral the rest
• General practice in Cyprus is to take personal guarantees which are considered over and above of any other tangible collateral
Collateral valuation
• Collaterals consist mainly of mortgages as well as other tangible collaterals such as cash, bank/government guarantees etc.
• Mortgages which comprise the vast majority of collateral, an independent valuation is always requested at the inception of the loan; subsequent revaluations occur as per the guidelines provided in the restructuring and valuations policies
• For provisioning purposes as well as for disclosure in the FS, these are always indexed to current values based on the RICS property index
• Bank follows the CBC guidelines for the calculation of recovery values
Others
Restructuring costs
• Restructuring cost for 2014 are estimated to be much lower than the last year costs (€168m) which included voluntary retirement compensations and branch closure expenses
• As per current estimates such costs for 2014 are not expected to exceed €30m; actual costs for 1Q14 were €5m, restructuring costs exclude disposal losses but relate only to advisors and branch closure costs
Branches & employees
Dec-2013 Mar-2014 Medium-term target
Dec-2017
Number of branches in Cyprus 133 130 125
Group employees in Cyprus 4,247 4,240 <4,100
49
133
156
255
192
0
127
127
127
0
153
204
191
191
191
203
224
230
234
234
234
0
97
114
Disclaimer
HIGHLY RESTRICTED 18
This presentation has been prepared for information and background purposes only. It is confidential and neither it nor
any part of it may be reproduced (electronically or otherwise) or redistributed, passed on, or the contents otherwise
divulged, directly or indirectly, to any other person (excluding the recipient's professional advisers) or published in whole
or in part for any purpose without the prior written consent of the Bank of Cyprus Public Company Ltd (the "Bank"). This
presentation does not purport to be all-inclusive or to contain all of the information that a person considering the
purchase of any offered securities may require to make a full analysis of the matters referred to herein. Certain
statements, beliefs and opinions in this presentation are forward-looking. Such statements can be generally identified
by the use of terms such as “believes”, “expects”, “may”, “will”, “should”, “would”, “could”, “plans”, “anticipates” and
comparable terms and the negatives of such terms. By their nature, forward-looking statements involve risks and
uncertainties and assumptions about the Group that could cause actual results and developments to differ materially
from those expressed in or implied by such forward-looking statements. These risks, uncertainties and assumptions
could adversely affect the outcome and financial effects of the plans and events described herein. We have based
these forward-looking statements on our current expectations and projections about future events. Any statements
regarding past trends or activities should not be taken as a representation that such trends or activities will continue in
the future. Readers are cautioned not to place undue reliance on forward-looking statements, which are based on facts
known to and/ or assumptions made by the Group only as of the date of this presentation. The Bank's ability to achieve
its projected results depends on many factors which are outside management's control. Actual results may differ
materially from those contained or implied in the forward-looking statements. We assume no obligation to update such
forward -looking statements or to update the reasons that actual results could differ materially from those anticipated in
such forward-looking statements. This presentation does not constitute an offer to sell, or a solicitation of an offer to
buy, any security in the United States, or any other jurisdiction. The delivery of this presentation shall under no
circumstances imply that there has been no change in the affairs of the Group or that the information set forth herein is
complete or correct as of any date. This presentation shall not be used in connection with any investment decision
regarding any of our securities, which should only be made based on expressly authorised materials from us identified
as such, nor in connection with any decision whether or how to vote on any matter submitted to our stockholders. The
securities issued by the Bank have not been, and will not be, registered under the US Securities Act of 1933 (“the
Securities Act”), or under the applicable securities laws of any other jurisdiction and may only be offered or sold in the
United States to “qualified institutional buyers” as defined in Rule 144A under the Securities Act and outside the United
States in compliance with Regulation S under the Securities Act.


