EPSRC-SFI Lead Agency Agreement Guidance and SFI Documentation

2009
SALT LAKE COUNTYWIDE WATER QUALITY STEWARDSHIP PLAN
ADDENDUM
STREAM FUNCTION INDEX REPORT
West Valley City Report
PREPARED BY:
Flood Control and Water Quality Division Salt Lake County
2001 South State Street Suite N3100
Salt Lake City, UT 84190
April 2010
Printed on 10% Recycled Paper Elemental Chlorine-Free (ECF) FSC Certified (mixed sources)

This page intentionally blank.

Salt Lake County—Stream Function Index (SFI) West Valley City
West Valley City - i 2009
TABLE OF CONTENTS
1.0 Introduction ................................................................................................................................. 1 1.1 Components of the Stream Function Index (SFI) and Ecosystem Health Index (EHI) ................. 1 1.2 Data Collection .............................................................................................................................. 1 2.0 West Valley City—Information ................................................................................................... 3 2.1 Water Quality Stressors in West Valley City ................................................................................. 3 3.0 Stream Function Index (SFI) ...................................................................................................... 4 4.0 Watershed Function Groups ...................................................................................................... 4 4.1 Water Quality Functional Group Score ......................................................................................... 4 4.2 Habitat Functional Group Score .................................................................................................... 6 4.2.1 Pool/Riffle Ratio in West Valley City ................................................................................ 7 4.2.2 Water Depth in West Valley City ...................................................................................... 8 4.2.3 Fish Passage in West Valley City .................................................................................... 9 4.2.4 Habitat Structure in West Valley City ............................................................................. 10 4.2.5 Flow Diversion in West Valley City ................................................................................ 11 4.2.6 Riparian Width in West Valley City ................................................................................ 12 4.2.7 Riparian Density in West Valley City ............................................................................. 13 4.3 Hydraulics Functional Group Score ............................................................................................ 14 4.3.1 Floodplain Development in West Valley City ................................................................. 15 4.3.2 Floodplain Connectivity in West Valley City ................................................................... 16 4.3.3 Hydraulic Alteration in West Valley City ......................................................................... 17 4.3.4 Bank Stability in West Valley City .................................................................................. 18 4.4 Social Functional Group Score ................................................................................................... 19 5.0 Ecosystem Health Index (EHI) - West Valley City ................................................................... 20 6.0 Stream Function Index (SFI) - West Valley City....................................................................... 21 7.0 Implementation ........................................................................................................................... 22 7.1 Site Identification ......................................................................................................................... 22 7.2 Plan Development ....................................................................................................................... 22 7.3 Funding ....................................................................................................................................... 22 7.4 Plan Implementation ................................................................................................................... 23 7.5 Post Construction ........................................................................................................................ 23
LIST OF FIGURES
1 Water Quality Functional Group Scores Countywide ................................................................... 5 2 Habitat Functional Group Scores Countywide ............................................................................. 6 3 Habitat Function—Pool/Riffle Ratio in West Valley City ............................................................... 7 4 Habitat Function—Water Depth in West Valley City ..................................................................... 8 5 Habitat Function—Fish Passage in West Valley City ................................................................... 9 6 Habitat Function—Habitat Structures in West Valley City ......................................................... 10 7 Habitat Function—Flow Diversion in West Valley City ............................................................... 11 8 Habitat Function—Riparian Width in West Valley City ............................................................... 12 9 Habitat Function—Riparian Density in West Valley City ............................................................ 13

Salt Lake County—Stream Function Index (SFI) West Valley City
West Valley City - ii 2009
10 Hydraulics Functional Group Scores Countywide ...................................................................... 14 11 Hydraulics Function—Floodplain Development in West Valley City .......................................... 15 12 Hydraulics Function—Floodplain Connectivity in West Valley City ............................................ 16 13 Hydraulics Function—Hydraulic Alteration in West Valley City .................................................. 17 14 Hydraulics Function—Bank Stability in West Valley City ........................................................... 18 15 Social Functional Group Scores Countywide ............................................................................. 19 16 Ecosystem Health Index (EHI) Final Score 2009 ...................................................................... 20 17 Stream Function Index (SFI) Final Score 2009 ......................................................................... 21 18 Diagram of Emergent Bench Design .......................................................................................... 22
LIST OF TABLES
1 Stream Function Index Metrics Flow Chart .................................................................................. 2 2 West Valley City Watershed Areas and Stream Lengths ............................................................. 3 3 Grants for Stream and river Restoration Projects....................................................................... 24

Salt Lake County—Stream Function Index (SFI) West Valley City
West Valley City - 1 2009
Armed with the widely supported 2009 Salt Lake Countywide Water Quality Stewardship Plan (WaQSP), regulatory and municipal authorities in Salt Lake County seek to work collaboratively to monitor and improve watershed and stream health. After examining the current conditions, numerous water quality and watershed improvement recommendations were made in the 2009 WaQSP. However, written recommendations and well laid plans are only as good as the implementation efforts that result. With the completion of the WaQSP, Salt Lake County and its partners now enter the most challenging and rewarding phase of watershed management—implementation. A key challenge in the implementation phase is to measure the success and/or failure of implementation efforts. Therefore, to inform future planning decisions, and to assure a successful, iterative, planning and implementation process, Salt Lake County developed a monitoring tool for the WaQSP known as the Stream Function Index (SFI). The SFI was developed in 2006 with the assistance of several environmental consulting firms. The primary consultant on this effort was Cirrus Ecological, based in Logan, UT.
It is anticipated that SFI data will be collected along with each update of the WaQSP that will occur every six years. It is also anticipated that reports, such as this one, will be written for each municipal government at that same frequency. Successful implementation of WaQSP recommendations should lead to improved SFI scores. However, if BMPs do not lead to improved SFI scores, they will be re-examined for effectiveness in the local environment.
1.1 COMPONENTS OF THE STREAM FUNCTION INDEX (SFI) AND ECOSYSTEM HEALTH INDEX (EHI) Streams and rivers, although single components of the larger watershed, may serve as indicators of overall watershed health. To maximize resources and time, Salt Lake County decided to focus on monitoring stream and river corridors to indicate overall watershed function. However, a broader examination of watershed function may be accomplished in the future with increased funds and staff. For the purposes of this document, data collected in stream and river corridors are used to indicate watershed function. To monitor stream and river health, the SFI measures physical, chemical, biological, and social functions of stream and river corridors in Salt Lake County. The four watershed functions that are examined in the SFI include: habitat (aquatic and terrestrial), hydraulics (flood conveyance and stream stability), water quality and social (recreation and aesthetics). Metrics used to determine scores for each of the four watershed functions are included in Table 1. Recreation and aesthetics monitoring is included in the SFI to indicate the degree to which stream and river corridors provide appropriate, or resource compatible, recreation and aesthetic opportunities. However, recreational facilities may, if incompatible with the resource, detrimentally effect stream ecology. In order to examine ecological health independent of social function, Salt Lake County created an Ecological Health Index (EHI). The EHI is a sub-component of the SFI that includes habitat, hydraulics, and water quality evaluations. The EHI may be compared with the SFI to determine possible effects of social (i.e. recreational and aesthetic) functions on stream ecology. See the “Stream Function Index Main Report” Appendices for the complete SFI Methodology Report. 1.2 DATA COLLECTION The majority of 2009 SFI numbers were based on data gathered between 2007 and 2008. However, water quality data spans a greater time period (2001 to 2008). In future SFI updates, it is anticipated that water quality data collected between updates will be used to assess stream health. Although previous stream stability and fish
1.0 INTRODUCTION
White faced ibis feeding in restored wetlands of Redwood Nature Park along the Jordan River in West Valley City.

Salt Lake County—Stream Function Index (SFI) West Valley City
West Valley City - 2 2009
habitat assessments were conducted on a few streams and the Jordan River in the mid 1980’s, the 2009 SFI represents the first comprehensive assessment of all major waterways in Salt Lake County. Therefore, this dataset is considered a baseline. The SFI is intended to give watershed and stream managers an overview of current stream conditions. However, as improvement projects are identified, more detailed studies may be required to fully assess the condition of the stream.
Jordan River Parkway pedestrian bridge crosses from West Valley City to neighboring South Salt Lake.
Table 1. Stream Function Index Metrics Flow Chart

Salt Lake County—Stream Function Index (SFI) West Valley City
West Valley City - 3 2009
West Valley City, located in the northwest portion of Salt Lake County, is a relatively new city (incorporated in 1980) and is home to approximately 120,000 residents. Portions of five sub-watersheds are found within West Valley City boundaries: Barney’s Creek, Coon Creek, Decker Lake, Great Salt Lake, and the Jordan River Corridor. Also contained within the City boundaries are sections of Coon Creek, Harkers Canyon Creek, Lee Creek and the Jordan River. This report summarizes the health of the river and stream sections within West Valley City and provides guidance for future water quality improvement and watershed preservation efforts. West Valley City will also receive a copy of the 2009 WaQSP Addendum Stream Function Index Main Report, and will receive electronic files of the report and Geographic Information System (GIS) shapefiles depicting information collected as part of the SFI. 2.1 WATER QUALITY STRESSORS IN WEST VALLEY CITY Although the SFI is a measure of stream corridor health, it is imperative that water quality and w a t e r s h e d h e a l t h b e a p p r o a c h e d comprehensively. Therefore, this section is provided to review water quality stressors identified in the 2009 WaQSP for the sub-watersheds in West Valley City. As part of the 2009 WaQSP, a computer-based GIS analysis was conducted for each of the 27 sub-watersheds in Salt Lake County to determine
existing and potential future water quality stressors. In Chapter 5 of the WaQSP document, these water quality stressors are outlined and Best Management Practices (BMPs) recommended to address potential concerns. Below are examples of water quality stressors and associated BMPs. To determine water quality stressors identified in sub-watersheds that intersect West Valley City boundaries, please consult the 2009 WaQSP. Water quality stressors may include: Stream channel modification Lack of developed recreation Stream flow diversions Loss of open space High number of Industrial Stormwater
Discharge Permits Floodplain encroachment Densification of residential land use Urban development and redevelopment
pressures
2.0 WEST VALLEY CITY—INFORMATION
Table 2. West Valley City Watershed Areas and Stream Lengths
Jordan River
West Valley City 22,929 Acres
Sub -Watersheds Barney’s Creek 2,106 Acres
Coon Creek 724 Acres
Decker Lake 3,968 Acres
Great Salt Lake 14,425 Acres
Jordan River Corridor 1,707 Acres
Coon Creek 12,251 Feet
Harkers Canyon Creek 4,881 Feet
Lee Creek 3,425 Feet
Jordan River 19,957 Feet
Streams
Salt Lake County—Stream Function Index (SFI) West Valley City
West Valley City - 4 2009
3.0 STREAM FUNCTION INDEX (SFI)
4.0 WATERSHED FUNCTION GROUPS
This section summarizes scores for the four watershed functions countywide and reviews data and scores within West Valley City boundaries. Additional information on SFI methodology can be found in the SFI Main Report. 4.1 WATER QUALITY FUNCTIONAL GROUP SCORE The SFI water quality functional group is comprised of seven metrics or measures: 303(d) list status, macroinvertebrates, Total Phosphorus, Temperature, Total Dissolved Solids (TDS), Dissolved Oxygen (DO), and Coliform (E. Coli). Based on 2009 SFI scores, the streams with the best water quality are concentrated in the upper regions of both the Wasatch and Oquirrh streams, with the notable exception of upper Little Cottonwood Creek (currently listed as water quality impaired by the State Division of Water Quality) for zinc. Additionally, lower Emigration Creek and Red Butte Creek received high rankings for water quality. Notably, these scores are based entirely on data contained in the Environmental Protection Agency’s STORET database. Although this data represents a large portion of water quality data collected in Salt Lake County, it does not represent all data. However, it was decided that the SFI
Similar to the 2009 WaQSP effort to identify water quality/watershed stressors, four watershed functions were examined for each stream: water quality, habitat, hydraulics, and social/aesthetics services. In order to assess the ability of streams
to provide these four functions, Salt Lake County developed what is called the Stream Function Index (SFI). The SFI is a rapid assessment protocol that assesses stream habitat, hydraulics, water quality and social factors. Based on established methodology, the SFI measures 27 metrics to determine overall stream health. These metrics are categorized by watershed function (water quality, habitat, hydraulics, social/aesthetic) and can therefore be examined individually or by functional group. The SFI is a tool to help identify the results of water quality stressors along main stream channels and the Jordan River. These areas are candidates for enhancement projects. The SFI provides the framework for a more detailed baseline and monitoring techniques that may be used on those projects. The first complete dataset was collected during the 2007 and 2008 field seasons and is considered the baseline. The SFI will be repeated every 6 years in conjunction with the Water Quality Stewardship Plan Update.
Examples of Management Practices (BMPs) to address potential water quality stressors include: Bioengineered bank stabilization Grade control structures Channel restoration/enhancement Streambank revegetation Diversion structures modification Canal water diversion Leadership in Energy and Environmental Design criteria Minimum flow protection Water rights acquisition Identify community recreation needs and
opportunities Wetlands restoration/enhancement Manufactured treatment systems Participate in new/existing planning efforts Floodplain re-establishment Trash racks Land acquisition for preservation Volunteer programs Recreational facilities that are accessible and
resource compatible.
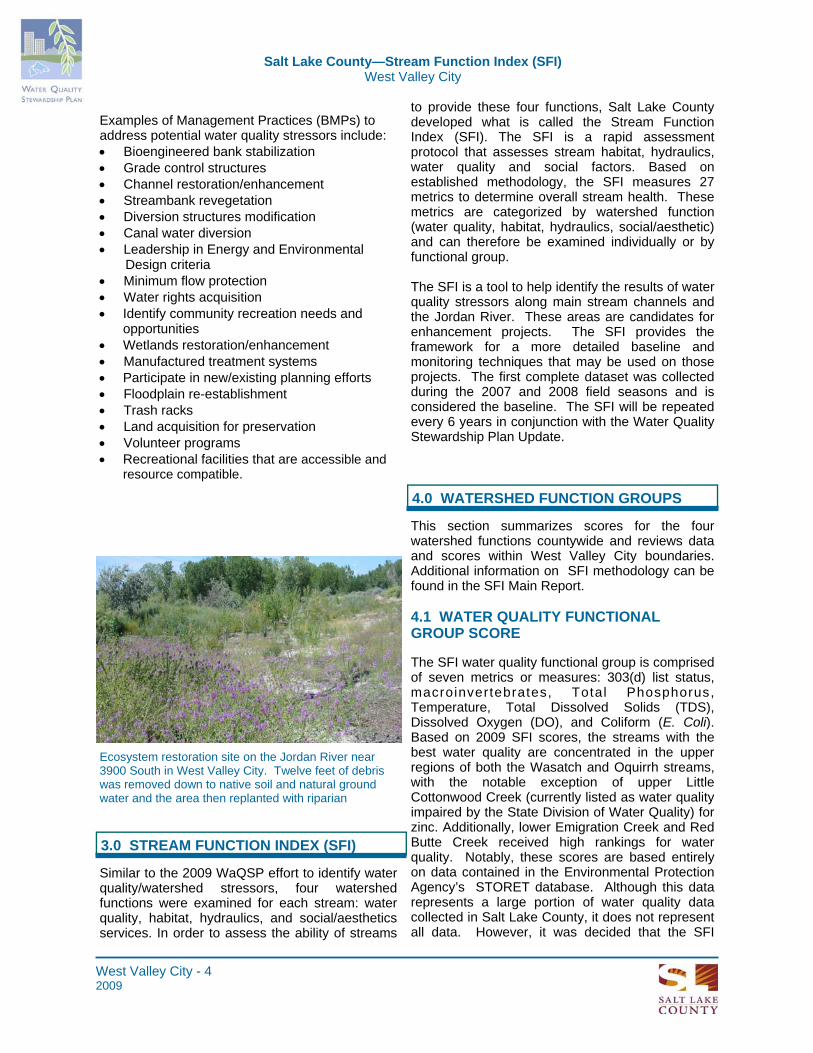
Ecosystem restoration site on the Jordan River near 3900 South in West Valley City. Twelve feet of debris was removed down to native soil and natural ground water and the area then replanted with riparian

Salt Lake County—Stream Function Index (SFI) West Valley City
West Valley City - 5 2009
Figure 1. Water Quality Functional Group Scores Countywide
would rely on STORET data to assure consistent methodologies and that certified water quality assurance (QA) and water quality control (QC) measures were taken. In addition to noting areas of high, or good, water quality, it is important to note areas of low, or poor water quality. As can be seen from the Countywide data presented in Figure 1, segments with low water quality values include: upper and lower Jordan River, lower and upper Little Cottonwood Creek, lower Big Cottonwood Creek, and upper Emigration Creek. All of these segments scored as meeting water quality standards in <50% of samples taken. Many of these water quality concerns are currently being addressed through the State Division of Water Quality’s (DWQ) Total Maximum Daily Load
(TMDL) program. TMDL studies are currently underway for the Jordan River, Upper Emigration Creek, and Upper Little Cottonwood Creek. Additionally, Lower Big and Little Cottonwood Creeks are listed as impaired on DWQ’s 303(d) list of impaired water bodies. Water quality concerns in West Valley City are focused on the Jordan River. Pollutants of concern include Total Dissolved Solids (TDS), Dissolved Oxygen (DO), E. Coli, and temperature. In order to address these concerns, it is recommended that West Valley City actively participate in the Jordan River TMDL process by attending Jordan River Watershed Council (JRWC) meetings and reviewing documents that are published in conjunction with the Jordan River TMDL.

Salt Lake County—Stream Function Index (SFI) West Valley City
West Valley City - 6 2009
Figure 2. Habitat Functional Group Scores Countywide
Oquirrh Mountain streams rank high for habitat. Of note, Copper Creek and Rose Creek both scored <60% for overall habitat function. Other areas of particular habitat concern include lower Big and Little Cottonwood Creeks and the section of Butterfield Creek upstream from its confluence with Midas Creek. As can be seen from Figure 2, West Valley City does contain sections of Coon, Lee, and Harkers Creeks that received overall habitat function scores between 60 and 89.9. The section of the Jordan River within West Valley City’s boundary scored between 50 and 59.9 for overall habitat function. A review of habitat metric scores and recommendations to improve specific habitat functions are contained in the following sections.
4.2 HABITAT FUNCTIONAL GROUP SCORE In the SFI, the habitat function was characterized by: pool/riffle ratio, fish passage, habitat structure, flow diversion, riparian width, and riparian density. Of note, stream channel habitat metrics were only assessed for streams that have been identified, by the State Division of Wildlife Resources (DWR) as supporting fish habitat. Flow diversion and riparian metrics were assessed for all streams. Similar to the Water Quality Functional Group Score, streams with the best, or highest scores, are concentrated in the upper regions of both the Wasatch and Oquirrh mountains. However, in contrast to water quality, not all sections of upper

Salt Lake County—Stream Function Index (SFI) West Valley City
West Valley City - 7 2009
4.2.1 Pool/Riffle Ratio in West Valley City An important component of stream habitat function is the ratio between pools and riffles. For the SFI, the number of pools and riffles were counted for each stream reach. Pools were defined as mid-channel areas with low velocity that were at least 1 foot deep. Riffles were defined as mid-channel shallow turbulent areas of higher velocity. The number of pools was compared to the expected number for the given stream type (see SFI Main Report for an explanation of stream type.) Subsequently, the pool/riffle ratio was determined. A score of “Not Applicable” (N/A) indicates that the stream does not support a fishery.
The Jordan River section within West Valley City’s boundary scored between 1 and 25 for pool/riffle ratios. Lee, Harkers, and Coon Creeks are not designated as fishery supporting streams by the State Division of Wildlife Resources and therefore were not scored for metrics related to fish habitat. Recommended actions to improve pool/riffle ratio in the Jordan River include: working with local land owners, State agencies, and Salt Lake County Flood Control Division to identify opportunities to improve instream habitat by channel reconstruction.
Figure 3. Habitat Function—Pool/Riffle Ratio in West Valley City

Salt Lake County—Stream Function Index (SFI) West Valley City
West Valley City - 8 2009
4.2.2 Water Depth in West Valley City In Salt Lake County, many streams have experienced altered or reduced stream flow or may naturally have minimal stream flow. In order to assess the extent to which streams have sufficient water depth to support aquatic habitat, Salt Lake County staff measured stream depth at representative locations within each stream reach during late summer low flow. Targets for this metric were set based on minimum depth requirements for trout and native sucker species established by the Utah Division of Wildlife Resources (DWR). As can be seen in Figure 4, the section of the Jordan River within West Valley City’s boundary scored 100 for water depth. Lee, Harkers, and
Coon Creeks are not designated as fishery supporting streams by the State Division of Wildlife Resources and therefore were not scored for metrics related to fish habitat. Although the flow through this section of the Jordan River is highly altered, the remaining water depth appears sufficient to support fish habitat. Therefore, no immediate action is required for this metric; however, it is recommended that West Valley City monitor any water right activities that may alter water depth within this section of the Jordan River and seek to sustain existing water depths.
Figure 4. Habitat Function—Water Depth in West Valley City

Salt Lake County—Stream Function Index (SFI) West Valley City
West Valley City - 9 2009
Figure 5. Habitat Function—Fish Passage in West Valley City
4.2.3 Fish Passage in West Valley City For the purposes of the SFI, fish passage was scored based on the distance between barriers to fish passage. Barriers were tallied for each stream reach and analyzed for overall function during late summer low flow. Barrier criteria included height of barrier, depth of plunge pool, water depth, and beaver dam density. The optimum value for this metric was to have at least 1/4 of a mile between barriers. As can be seen from Figure 5, the section of the Jordan River within West Valley City’s boundary received a high score for fish passage (100). Lee, Harkers, and Coon Creeks are not designated as fishery supporting streams by the State Division of
Wildlife Resources and therefore were not scored for metrics related to fish habitat. No immediate action is recommended for this metric. However, it is recommended that West Valley City closely monitor any future stream alterations that may occur in this section of the Jordan River to assure that fish passage is sufficiently accommodated in any new structure.

Salt Lake County—Stream Function Index (SFI) West Valley City
West Valley City - 10 2009
Jordan River within West Valley City’s boundary scored lower (0) for this metric. The creeks are not designated as fishery supporting streams by the State Division of Wildlife Resources and therefore were not scored for metrics related to fish habitat. Recommended actions to improve habitat structure resources in West Valley City include: participating in river restoration projects that incorporate habitat enhancement measures, participate in discussions regarding opportunities to accommodate flood control, water rights, recreation, and habitat needs. As with many metrics, habitat structures are essential to stream function, but need to be balanced with other stream functions.
4.2.4 Habitat Structure in West Valley City For the purposes of the SFI, habitat structures are defined as instream natural, or man-made, objects that provide cover, resting, and feeding resources for fish species. To measure the function of habitat structures, the number of embedded logs, rootwads, boulders, undercut banks, beaver dams, and man-made structures were tallied for each reach. Targets were set based on the number of habitat structures anticipated to occur in specific stream types. As can be seen from Figure 6, the southern portion of the Jordan River within West Valley City’s boundary scored between 26 and 50 for habitat structure. The northern portion of the
Figure 6. Habitat Function—Habitat Structures in West Valley City

Salt Lake County—Stream Function Index (SFI) West Valley City
West Valley City - 11 2009
Figure 7. Habitat Function—Flow Diversion in West Valley City
4.2.5 Flow Diversion in West Valley City In the arid environment of Salt Lake County, many streams have been greatly impacted due to altered surface and groundwater flows. To include potential effects on habitat in the SFI, Salt Lake County developed a flow diversion metric. The flow diversion metric measured the degree to which natural surface stream flows have been reduced or interrupted. This metric includes both the amount of time over a year and the length of stream that is maintaining natural flows. The target for this metric was set at 100%, i.e. a natural flow for 100% of the year. As can be seen in Figure 7, the section of the Jordan River within West Valley City’s boundary scored 0 for flow diversion. Whereas, the streams
in West Valley City scored 100 for this metric. Of note, the 2009 WaQSP document calls for a comprehensive review of Jordan River flow management. However, no immediate action is anticipated to restore natural flows in this section of the Jordan River. It is therefore recommended that West Valley City participate in discussions that may be facilitated by the JRWC or the State Engineer’s office to examine flow management of the Jordan River and monitor any requests to divert waters from the tributaries in West Valley City.

Salt Lake County—Stream Function Index (SFI) West Valley City
West Valley City - 12 2009
Figure 8. Habitat Function—Riparian Width in West Valley City
4.2.6 Riparian Width in West Valley City The SFI also examined habitat beyond the stream channel with Riparian habitat metrics. The first metric examined was the width of riparian corridors. For the purposes of the SFI, riparian width was measured as the continuous and contiguous areas of uninterrupted vegetation growth along streams. The target riparian width was established by Salt Lake County to be 100 feet, i.e. ideally, all streams/river in the County would be bordered on both sides by 100 feet of uninterrupted vegetative growth. The actual amount of riparian vegetation was then compared with the target. As can be seen in Figure 8, the southern section of the Jordan River along West Valley City’s
boundary scored between 76 and 99 for riparian width. Whereas, the northern river section scored between 1 and 25 and the middle river section scored between 51 and 75. The streams in West Valley City ranged between 0 and 50 for this metric. To improve riparian habitat function, and protect existing habitat, of the streams and river in West Valley City, it is recommended that: the City pass a land use ordinance to limit development within 100 feet of streams and river (this may also be included in development codes), and again work with other authorities to promote vegetative growth along the streams and river.

Salt Lake County—Stream Function Index (SFI) West Valley City
West Valley City - 13 2009
Figure 9. Habitat Function—Riparian Density in West Valley City
4.2.7 Riparian Density in West Valley City In addition to riparian width, the density of riparian vegetation is a strong indicator of overall stream health. This metric scores the percent coverage of the canopy, middle story, and understory to determine overall riparian density. As opposed to examining species, this metric assumes that the highest functioning riparian areas will have at least 80% coverage at all levels of the canopy. As can be seen in Figure 9, riparian density in West Valley City showed a similar pattern to that observed for riparian width. The southern section of the Jordan River along West Valley City’s boundary scored 100 for riparian density. Whereas, the northern river section scored lower
(between 51 and 75.) The streams in the City all ranged between 26 and 50 for this metric. To improve stream function and augment habitat resources, it is recommended that West Valley City participate with other State and local authorities to: sponsor river/stream restoration efforts that incorporate robust re-vegetation and irrigation efforts, notify residents of tree planting efforts and encourage their participation. In addition to working with other authorities and nonprofit organizations, it is recommended that West Valley City actively manage recreation areas to encourage riparian vegetation growth.

Salt Lake County—Stream Function Index (SFI) West Valley City
West Valley City - 14 2009
Figure 10. Hydraulics Functional Group Scores Countywide
4.3 HYDRAULICS FUNCTIONAL GROUP SCORE The third watershed function examined for the purposes of the SFI was hydraulics function. This functional group is comprised of four metrics: floodplain development, floodplain connectivity, bank stability, and hydraulic alteration. As can be seen in Figure 10, the majority of streams in Salt Lake County scored > 50 for the hydraulics function; however, an appropriate target for this functional group is closer to 75. Countywide, the streams with low hydraulics function scores were concentrated in the lower sections of the Wasatch Mountain streams. Namely, City Creek, Red Butte Creek, Emigration
Creek, and Parley’s Creek showed low hydraulics function. This may be due to the highly developed nature of these streams and the extensive culverts on each of them. The Jordan River within West Valley City’s boundary showed hydraulic function scores between 60 and 69.9. The streams in West Valley scored higher (between 80 and 100) for this metric. The following information is provided to review hydraulic function metrics within West Valley City and identify opportunities to improve stream function by addressing concerns.

Salt Lake County—Stream Function Index (SFI) West Valley City
West Valley City - 15 2009
4.3.1 Floodplain Development in West Valley City The floodplain development metric evaluates the percent of impervious surface within the 100 year floodplain as defined by the FEMA Flood Insurance Program. For the purposes of the SFI, the target was that 100% of the floodplain be pervious, or free from development that would limit groundwater infiltration. As can be seen in Figure 11, the majority of the Jordan River within West Valley City’s boundary scored between 51 and 75 for floodplain development. However, a smaller section did score lower (between 1 and 25). The streams within West Valley City scored higher (between 76 and 100 for this metric.
Therefore, it is recommended that West Valley City focus restoration efforts on the Jordan River to assure that pervious surfaces are preserved along the streams within their City boundaries. Although much of the Jordan River Corridor has been developed, it is recommended that West Valley City adopt ordinances and/or requirements in their development codes that will limit impervious surface development along stream and river corridors within their city. Of note, the 2009 WaQSP recommends that all cities within Salt Lake County develop and adopt similar land use requirements.
Figure 11. Hydraulics Function—Floodplain Development in West Valley City

Salt Lake County—Stream Function Index (SFI) West Valley City
West Valley City - 16 2009
4.3.2 Floodplain Connectivity in West Valley City The floodplain connectivity metric is essentially a measure of stream entrenchment (or eroded streambed). Entrenchment disconnects the stream from its historic floodplain, lowers the water table, and increases the intensity of flood events. For the purposes of the SFI, floodplain connectivity was measured and scored against targets established by stream type (see SFI Main Report.) Any score falling within the appropriate entrenchment range for a stream type was given a score of 100. If the entrenchment ratio was outside the appropriate range, the reach was given a score of 0.
As can be seen in Figure 12, the section of the Jordan River within West Valley City’s boundary was seen to have appropriate entrenchment ratios (100). Sections of the streams within the City boundaries had entrenchment values outside the recommended range. To address concerns observed in the streams within West Valley City, it is recommended that the City partner with local land owners, State agencies, nonprofit organizations, and Salt Lake County Flood Control to conduct stream/river restoration efforts that may reconnect the stream with its historic floodplain. Salt Lake County has successfully used an emergent bench design for similar sections of the Jordan River (see Figure 18 on page 22).
Figure 12. Hydraulics Function—Floodplain Connectivity in West Valley City
Salt Lake County—Stream Function Index (SFI) West Valley City
West Valley City - 17 2009
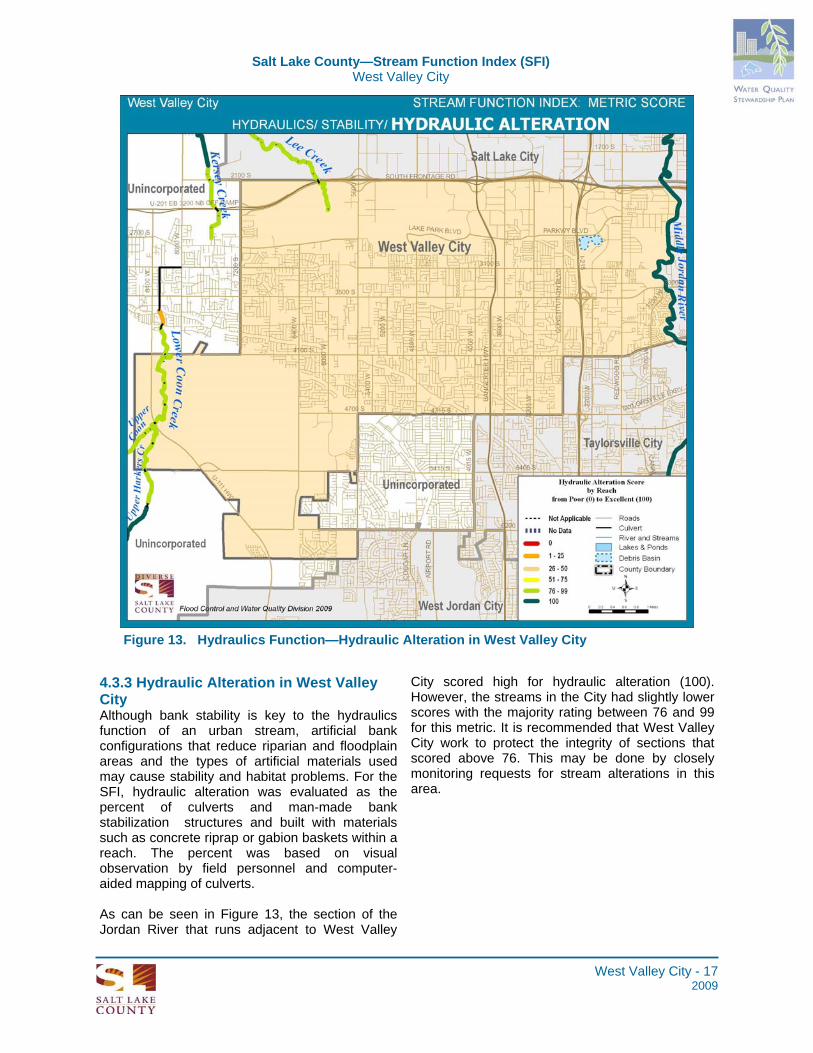
Figure 13. Hydraulics Function—Hydraulic Alteration in West Valley City
4.3.3 Hydraulic Alteration in West Valley City Although bank stability is key to the hydraulics function of an urban stream, artificial bank configurations that reduce riparian and floodplain areas and the types of artificial materials used may cause stability and habitat problems. For the SFI, hydraulic alteration was evaluated as the percent of culverts and man-made bank stabilization structures and built with materials such as concrete riprap or gabion baskets within a reach. The percent was based on visual observation by field personnel and computer-aided mapping of culverts. As can be seen in Figure 13, the section of the Jordan River that runs adjacent to West Valley
City scored high for hydraulic alteration (100). However, the streams in the City had slightly lower scores with the majority rating between 76 and 99 for this metric. It is recommended that West Valley City work to protect the integrity of sections that scored above 76. This may be done by closely monitoring requests for stream alterations in this area.

Salt Lake County—Stream Function Index (SFI) West Valley City
West Valley City - 18 2009
Figure 14. Hydraulics Function—Bank Stability in West Valley City
4.3.4 Bank Stability in West Valley City In addition to measuring the condition and frequency of man-made stability structures in Salt Lake County’s streams and river, an established bank stability method was also employed to characterize overall stream stability.
The Pfankuch Stream Stability Evaluation protocol—developed for the U.S. Forest Service—was slightly modified for use on the urban streams of Salt Lake County. Although the Pfankuch rating is only one of the metrics contained in the SFI, it, in itself, examines 18 stream characteristics. This metric therefore contains abundant information that may be used in stream restoration and enhancement projects. “Hot spots”, or actively eroding sites, were also identified and mapped. Although the presence of a hot spot did not contribute directly to the score, they give an
indication of where to perhaps prioritize bank stabilization projects.
As can be seen in Figure 14, all three creeks in West Valley City scored “Good” for bank stability; however, the section of the Jordan River within the City boundaries scored “Fair” for this metric. Additionally, one “hot spot” was observed along Lower Coon Creek where active erosion is occurring.
In order to improve bank stability and enhance hydraulic function in West Valley City, it is recommended that the City work with local land owners, Salt Lake County Flood Control, and other regulatory and nonprofit organizations to identify opportunities for stream enhancement through restoration efforts. This data may guide the City in its efforts.
Salt Lake County—Stream Function Index (SFI) West Valley City
West Valley City - 19 2009
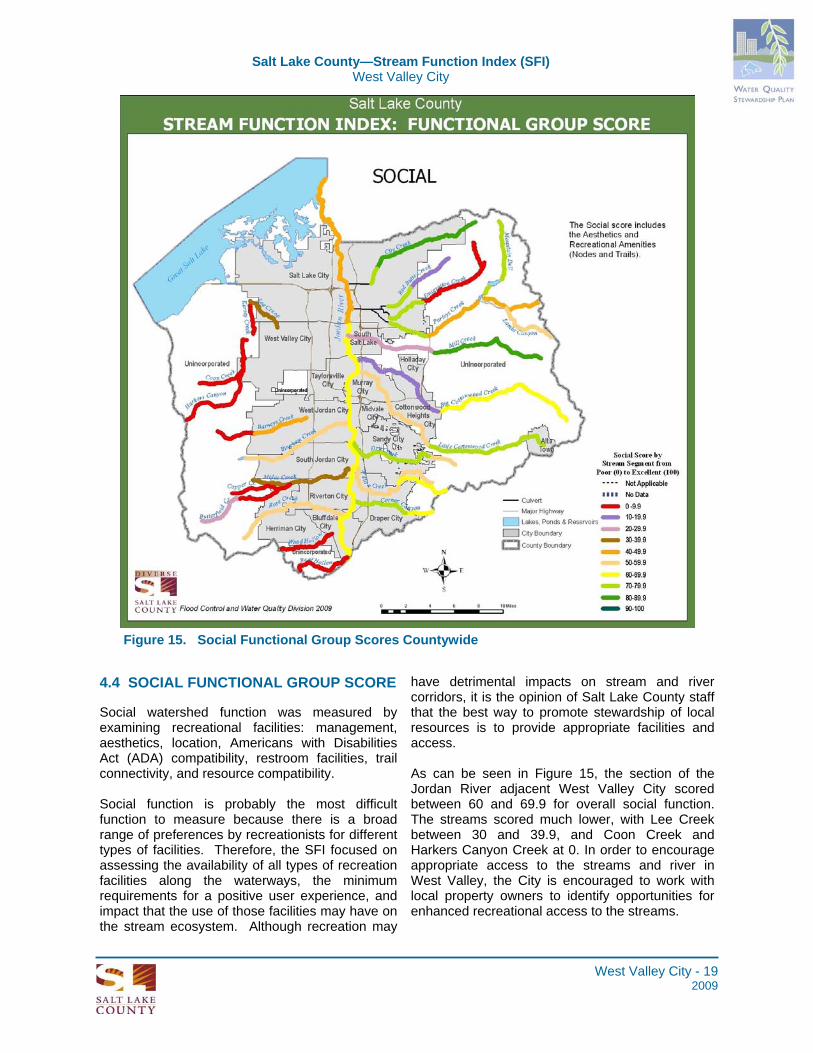
4.4 SOCIAL FUNCTIONAL GROUP SCORE Social watershed function was measured by examining recreational facilities: management, aesthetics, location, Americans with Disabilities Act (ADA) compatibility, restroom facilities, trail connectivity, and resource compatibility. Social function is probably the most difficult function to measure because there is a broad range of preferences by recreationists for different types of facilities. Therefore, the SFI focused on assessing the availability of all types of recreation facilities along the waterways, the minimum requirements for a positive user experience, and impact that the use of those facilities may have on the stream ecosystem. Although recreation may
have detrimental impacts on stream and river corridors, it is the opinion of Salt Lake County staff that the best way to promote stewardship of local resources is to provide appropriate facilities and access. As can be seen in Figure 15, the section of the Jordan River adjacent West Valley City scored between 60 and 69.9 for overall social function. The streams scored much lower, with Lee Creek between 30 and 39.9, and Coon Creek and Harkers Canyon Creek at 0. In order to encourage appropriate access to the streams and river in West Valley, the City is encouraged to work with local property owners to identify opportunities for enhanced recreational access to the streams.
Figure 15. Social Functional Group Scores Countywide

Salt Lake County—Stream Function Index (SFI) West Valley City
West Valley City - 20 2009
In order to determine the physical, chemical, and biological health of streams in Salt Lake County, the County has developed an Ecosystem Health Index (EHI) score. This score is meant to reflect the ecological health of the stream. Although the County’s position is to promote responsible and appropriate recreational access along the stream corridors, it is also understood that recreational activities may counteract ecological function. Therefore, it is important to examine the combined EHI score outside of the overall Stream Function Index (SFI) score which includes the Social Function.
As can be seen in Figure 16, the Jordan River scored between 60 and 69.9 within West Valley City’s boundary. The streams scored higher (between 70 and 89.9). In review of the EHI components, it appears that these scores are largely driven by low water quality and habitat scores. To address these concerns, it is recommended that West Valley City partner with adjacent cities and other agencies to complete and implement the Jordan River TMDL in an efficient and timely manner. It is also recommended that West Valley City seek partners and explore stream/river restoration efforts. Additionally, it is recommended that West Valley City establish zoning ordinances and/or regulations that will limit development along their streams and river.
Figure 16. Ecosystem Health Index (EHI) Final Score 2009
5.0 ECOSYSTEM HEALTH INDEX (EHI) - WEST VALLEY CITY

Salt Lake County—Stream Function Index (SFI) West Valley City
West Valley City - 21 2009
To include social/recreational functions in the overall SFI score, Salt Lake County combined the EHI with social scores. As can be seen in Figure 17, the Jordan River and three streams within West Valley City had SFI scores between 60 and 69.9. In review of the SFI components, it appears that these scores are largely driven by low water quality and habitat scores along the Jordan River and little recreational access along the tributaries in West Valley City.
Figure 17. Stream Function Index (SFI) Final Score 2009
To address these concerns, it is recommended that West Valley City partner with adjacent cities and other agencies to complete and implement the Jordan River TMDL in an efficient and timely manner. It is also recommended that West Valley City seek partners and explore stream/river restoration efforts. Additionally, it is recommended that West Valley City establish zoning ordinances and/or regulations that will limit development along their streams and river. It is also recommended that West Valley City make efforts to include recreational facilities in development along both the Jordan River and the other streams within the City boundaries.
6.0 STREAM FUNCTION INDEX (SFI) - WEST VALLEY CITY

Salt Lake County—Stream Function Index (SFI) West Valley City
West Valley City - 22 2009
Because many of the recommendations included in this document suggest stream/river restoration efforts, this section is written to provide some general guidelines/suggestions with such projects. 7.1 SITE IDENTIFICATION Salt Lake County encourages local cities to consult the data collected as part of the SFI effort to identify appropriate restoration sites. In addition to the GIS data that each city will be provided, Salt Lake County staff are available for consultation and assistance with grant application efforts. 7.2 PLAN DEVELOPMENT Salt Lake County has used an “Emergent Bench” design for restoration projects along the Jordan River (Figure 18). This design is appropriate for
reaches with large easements/access. If easements are not available, other designs may need to be developed. Currently, Salt Lake County is working to develop ideas for entrenched, urban reaches. 7.3 FUNDING As with most municipal functions, a major hurdle to stream/river restoration projects is funding. Some municipalities have elected to use stormwater utility fees or bond efforts to fund such projects. However, the majority of projects that have been completed in Salt Lake County have relied heavily on Federal grants. Fortunately, numerous Federal grants are available to support stream restoration efforts. However, the cost of site identification and plan development usually fall to the sponsoring agency. Although application deadlines and typical amounts awarded vary greatly, there are some common characteristics of successful grant applications:
7.0 IMPLEMENTATION
Figure 18. Diagram of Emergent Bench design used along the Jordan River

Salt Lake County—Stream Function Index (SFI) West Valley City
West Valley City - 23 2009
A clear, precise workplan Demonstrated involvement of many partners Inclusion of a monitoring effort Strong financial match A list of some grants that may be appropriate are provided in Table 3, Grants for Stream and river Restoration Projects. 7.4 PLAN IMPLEMENTATION With robust planning, established partnerships, and sufficient funding, stream and river restoration efforts may be highly successful. However, some pitfalls do exist. Things to be aware of during a stream restoration effort: Flow diversions may occur unexpectedly.
Please assure that all permits (namely stream alteration and flood control permits) have been acquired and appropriate entities notified to avoid the unexpected destruction of restoration work.
Order your plant and rock material early as
many of these materials are in high demand. Notify the public. Although stream and river
restoration efforts are a great benefit to the
local stream health, the process of restoration may at times appear destructive. Post notices explaining the project in order to prevent public misunderstanding.
Allow enough time. As with most projects,
stream and river restoration projects may take longer than expected. Be sure to plan for unexpected delays in your scheduling.
We’re not the only ones that love trees. In
many of the restoration efforts that Salt Lake County has overseen, beaver activity has been highly destructive. Be sure to consult local experts to prevent the destruction of your newly planted trees.
7.5 POST-CONSTRUCTION One of the most important components of a successful stream or river restoration project is the long-term maintenance of the restoration site. Especially in the arid Salt Lake Valley, be sure to plan for irrigation of planted vegetation, and weed control to assure that the monies spent on the restoration project are used to their fullest extent; budgeting for a two-year establishment period is ideal.
Example of before (above) and after (right) river restoration project completed in 2009 using Emergent Bench model along the Jordan River. This site in Riverton will be irrigated for 2 years to establish vegetation.

Tab
le 3
. G
ran
ts f
or
Str
eam
an
d R
iver
Res
tora
tio
n P
roje
cts
GR
AN
T
SP
ON
SO
R
EL
IGIB
LE
T
YP
ES
OF
PR
OJE
CT
S
MA
TC
H
$ R
AN
GE
M
OR
E
INF
OR
MA
TIO
N
Tar
gete
d W
ater
shed
G
rant
Env
ironm
enta
l P
rote
ctio
n A
genc
y (E
PA
)
Sta
tes,
loca
l gov
ernm
ents
, pu
blic
an
d pr
ivat
e no
npro
fit in
stitu
tions
/or
gani
zatio
ns, f
eder
ally
rec
ogni
zed
Indi
an t
ribal
gov
ernm
ents
, U
.S.
terr
itorie
s or
pos
sess
ions
, and
in
ters
tate
age
ncie
s.
Eli
gib
le A
ctiv
itie
s
A
ctiv
ities
that
will
res
ult
in t
he
prot
ectio
n, a
nd r
esto
ratio
n of
a
wat
ersh
ed th
at in
corp
orat
es a
w
ater
shed
-bas
ed a
ppro
ach,
and
m
eets
the
pres
crib
ed c
riter
ia.
In
elig
ible
- D
evel
opm
ent
of T
MD
Ls
- P
hase
II S
torm
wat
er P
roje
cts
- C
onst
ruct
ion
of b
uild
ings
or
maj
or s
truc
ture
s
- P
urch
ase
of e
quip
men
t of
m
achi
nery
NO
TE
: Wat
ersh
ed n
omin
atio
ns
mus
t be
sub
mitt
ed b
y ei
ther
a
Gov
erno
r or
a T
ribal
Lea
der.
25%
Non
-fed
eral
m
atch
20
05 G
rant
s ra
nged
fr
om $
600,
000
to
$850
,00
http
://w
ww
.epa
.gov
/tw
g
Env
ironm
enta
l E
duca
tion
Gra
nts
Env
ironm
enta
l P
rote
ctio
n A
genc
y (E
PA
)
Loca
l edu
catio
n ag
ency
, st
ate
educ
atio
n or
env
ironm
enta
l age
ncy,
co
llege
, or
univ
ersi
ty,
not-
for-
prof
it or
gani
zatio
n as
des
crib
ed in
sec
tion
501(
C)(
3) o
f th
e In
tern
al R
even
ue
Cod
e, n
onco
mm
erci
al e
duca
tiona
l br
oadc
astin
g en
tity,
trib
al e
duca
tion
agen
cy (
whi
ch in
clud
es s
choo
l and
co
mm
unity
col
lege
s co
ntro
lled
by a
n In
dian
trib
e, b
and,
or
natio
n)
Env
ironm
enta
l edu
catio
n pr
ojec
ts
that
enh
ance
the
publ
ic's
aw
aren
ess,
kno
wle
dge,
and
ski
lls
to h
elp
peop
le m
ake
info
rmed
de
cisi
ons
that
affe
ct
envi
ronm
enta
l qua
lity.
25%
Non
-fed
eral
m
atch
A
pplic
atio
ns m
ay b
e up
to
$50
,000
; ho
wev
er,
ty
pica
l aw
ards
are
be
twee
n $1
5,00
0 an
d $2
0,00
0
http
://w
ww
.epa
.gov
/en
viro
ed/g
rant
s.ht
ml
Aqu
atic
E
cosy
stem
R
esto
ratio
n (S
ectio
n 20
6 of
W
RD
A)
N
onpr
ofit
Gro
ups,
Con
serv
atio
n D
istr
ict,
Wat
er a
nd W
aste
wat
er
Util
ities
, Lo
cal G
over
nmen
t, S
tate
/T
errit
oria
l Age
ncy
35
% N
on-f
eder
al
mat
ch
Typ
ical
aw
ards
are
~
$300
,000
w
ww
.usa
ce.a
rmy.
mil/
cw/
DE
AD
LIN
E
Typ
ical
ly O
ctob
er th
roug
h N
ove
mbe
r
Typ
ical
ly in
Dec
embe
r
Non
e -
thes
e al
loca
tions
ar
e th
roug
h S
ectio
n 20
6 of
the
WR
DA
Con
serv
atio
n S
ecur
ity
Pro
gram
Not
e: U
pper
W
eber
has
re
ceiv
ed t
his
The
agr
icul
tura
l ope
ratio
n m
ust
be
priv
atel
y o
wne
d la
nd o
r T
ribal
land
, th
e m
ajor
ity o
f w
hich
mus
t be
loca
ted
with
in a
sel
ecte
d pr
iorit
y w
ater
shed
. T
he a
pplic
ant
mus
t be
in
com
plia
nce
with
hig
hly
erod
ible
and
w
etla
nd c
ompl
ianc
e pr
ovis
ions
, ha
ve a
n ac
tive
inte
rest
in t
he
agric
ultu
ral o
pera
tion,
and
hav
e co
ntro
l of
the
land
for
the
life
of th
e co
ntra
ct.
The
app
lican
t m
ust s
hare
in
the
ris
k of
pro
duci
ng a
ny c
rop
or
lives
tock
and
be
entit
led
to a
sha
re
in t
he c
rop
or li
vest
ock
mar
kete
d fr
om th
e
Fin
anci
al a
nd t
echn
ical
ass
ista
nce
to p
rom
ote
the
cons
erva
tion
and
impr
ovem
ent
of s
oil,
wat
er,
air,
en
ergy
, pl
ant
and
anim
al li
fe,
and
othe
r co
nser
vatio
n pu
rpos
es o
n T
ribal
and
priv
ate
wor
king
land
s.
Non
e re
quire
d N
ot a
vaila
ble;
how
ever
, in
FY
200
7 th
is
prog
ram
was
aw
arde
d $2
59 M
illio
n
1. T
he C
SP
sig
n-up
will
be
offe
red
in s
elec
ted
prio
rity
wat
ersh
eds
acro
ss th
e N
atio
n.
2. P
rodu
cers
com
plet
ed a
se
lf-as
sess
men
t to
dete
rmin
e el
igib
ility
.
3. E
ligib
le p
rodu
cers
w
ithin
the
se w
ater
shed
s su
bmit
an a
pplic
atio
n.
4.
Bas
e on
the
ap
plic
atio
n, d
escr
iptio
n of
co
nser
vatio
n ac
tiviti
es,
and
a fo
llow
up
inte
rvie
w,
the
Nat
ural
Res
ourc
es
Con
serv
atio
n S
ervi
ce
ww
w.n
rcs.
usda
.gov
/pr
ogra
ms/
csp

GR
AN
T
SP
ON
SO
R
EL
IGIB
LE
T
YP
ES
OF
PR
OJE
CT
S
MA
TC
H
$ R
AN
GE
D
EA
DL
INE
M
OR
E
INF
OR
MA
TIO
N
Con
serv
atio
n S
ecur
ity
Pro
gram
-C
ontin
ued
op
erat
ion.
The
re a
re c
erta
in ti
er
elig
ibili
ty a
nd c
ontr
act
requ
irem
ents
, as
w
ell:
-F
or T
ier
I, th
e pr
oduc
er m
ust h
ave
addr
esse
d so
il qu
ality
and
wat
er
qual
ity f
or e
ligib
le la
nd u
ses
on p
art o
f th
e ag
ricul
tura
l ope
ratio
n pr
ior
to
appl
icat
ion.
-For
Tie
r II,
the
pro
duce
r m
ust
have
ad
dres
sed
soil
qual
ity a
nd w
ater
qu
ality
for
elig
ible
land
use
s on
the
entir
e ag
ricul
tura
l ope
ratio
n pr
ior
to
appl
icat
ion
and
agre
e to
add
ress
one
ad
ditio
nal r
esou
rce
conc
ern
by t
he e
nd
of th
e co
ntra
ct p
erio
d.
-F
or T
ier
III, t
he p
rodu
cer
mus
t ha
ve
addr
esse
d al
l res
ourc
e co
ncer
ns t
o a
reso
urce
man
agem
ent s
yste
m le
vel
for
all e
ligib
le la
nd u
ses
on th
e en
tire
agric
ultu
ral o
pera
tion
and
adeq
uate
ly
trea
t rip
aria
n zo
nes
befo
re a
pplic
atio
n in
to th
e pr
ogra
m.
(N
RC
S)
will
det
erm
ine
whi
ch p
rogr
am t
ier
and
enro
llmen
t ca
tego
ry a
re a
vaila
ble
for
the
appl
ican
t.
Env
ironm
enta
l Q
ualit
y In
cent
ives
P
rogr
am
(EQ
IP)
B
usin
ess,
Com
mun
ity/W
ater
shed
G
roup
, N
onpr
ofit
Gro
ups,
Edu
catio
nal
Inst
itutio
n, P
rivat
e La
ndow
ner,
Wat
er
and
Was
tew
ater
Util
ities
, S
tate
/T
erri
tori
al A
gen
cy, T
riba
l Ag
enc
y,
Agr
icul
tura
l pro
duce
rs w
ho f
ace
serio
us t
hrea
ts to
soi
l, w
ater
, an
d re
late
d na
tura
l res
ourc
es,
or w
ho n
eed
assi
stan
ce w
ith c
ompl
ying
with
Fed
eral
an
d S
tate
env
ironm
enta
l law
s. A
pa
rtic
ipan
t m
ay b
e an
ow
ner,
land
lord
, op
erat
or,
or t
enan
t of
elig
ible
ag
ricul
tura
l lan
ds.
Lim
ited
reso
urce
pr
oduc
ers,
sm
all-s
cale
pro
duce
rs,
prod
ucer
s of
min
ority
gro
ups,
Fed
eral
ly
reco
gniz
ed I
ndia
n tr
ibal
gov
ernm
ents
, A
lask
a na
tives
, an
d P
acifi
c Is
land
ers
are
enco
urag
ed to
app
ly.
The
se c
ontr
acts
pro
vide
ince
ntiv
e pa
ymen
ts a
nd c
ost-
shar
es to
im
plem
ent c
onse
rvat
ion
prac
tices
. P
erso
ns w
ho a
re e
ngag
ed in
liv
esto
ck o
r ag
ricul
tura
l pro
duct
ion
on e
ligib
le la
nd m
ay p
artic
ipat
e in
th
e E
QIP
pro
gram
.
Typ
ical
ly 2
5 to
50%
Li
mite
d to
$10
,000
pe
r pe
rson
per
yea
r an
d to
$50
,000
ove
r th
e le
ngth
of t
he
cont
ract
.
N
ot a
vaila
ble
in F
Y
2007
this
pro
gram
w
as a
war
ded
$739
M
illio
n
h
ttp:
//w
ww
.nrc
s.us
da.g
ov/
prog
ram
s/eq
uip
Fiv
e-S
tar
Res
tora
tion
Pro
gram
B
usin
ess,
Com
mun
ity/W
ater
shed
G
roup
, N
onpr
ofit
Gro
ups,
Edu
catio
nal
Inst
itutio
n, P
rivat
e La
ndow
ner,
C
onse
rvat
ion
Dis
tric
t, W
ater
and
W
aste
wat
er U
tiliti
es,
Loca
l G
over
nmen
t, S
tate
/Ter
ritor
ial A
genc
y,
Trib
al A
genc
y
T
ypic
al p
roje
cts
incl
ude
at le
ast f
ive
dive
rse
part
ners
. M
ost
part
ners
hips
co
ntrib
ute
mor
e th
an $
40,0
00 fo
r ev
ery
$10,
000
Fiv
e S
tar
gran
t.
Typ
ical
ly r
ange
be
twee
n $5
,000
and
$2
0,00
0
Typ
ical
ly in
Feb
ruar
y or
Mar
ch
http
://w
ww
.epa
.gov
/ow
ow
/wet
land
s/re
stor
e/5s
tar/
inde
x.ht
ml
Tab
le 3
. G
ran
ts f
or
Str
eam
an
d R
iver
Res
tora
tio
n P
roje
cts
(co
nti
nu
ed)

GR
AN
T
SP
ON
SO
R
EL
IGIB
LE
T
YP
ES
OF
PR
OJE
CT
S
MA
TC
H
$ R
AN
GE
D
EA
DL
INE
M
OR
E
INF
OR
MA
TIO
N
Land
and
W
ater
C
onse
rvat
ion
Fun
d (O
utdo
or
Rec
reat
ion,
A
cqui
sitio
n,
Dev
elop
men
t an
d P
lann
ing
Gra
nts)
Nat
iona
l Par
k S
ervi
ce (
NP
S)
Loca
l Gov
ernm
ent,
Sta
te/
Ter
ritor
ial A
genc
y, T
ribal
Age
ncy
Typ
ical
ly r
ange
be
twee
n $1
,000
and
$3
mill
ion
- m
edia
n is
$1
50,0
00
ht
tp://
ww
wnp
s.go
v/nr
c/pr
ogra
ms/
lwcf
/
Nat
ural
R
esou
rces
C
onse
rvat
ion
Ser
vice
: C
onse
rvat
ion
on P
rivat
e La
nds
Nat
iona
l Fis
h an
d W
ildlif
e F
ound
atio
n (N
FW
S)
Com
mun
ity/W
ater
shed
Gro
up,
Non
prof
it G
roup
s, E
duca
tiona
l In
stitu
tion,
Con
serv
atio
n D
istr
ict,
Loca
l Gov
ernm
ent,
Sta
te/
Ter
ritor
ial A
genc
y, T
ribal
A
genc
y, F
eder
al A
genc
y
Gra
nts
are
awar
ded
to p
roje
cts
that
: (1
) ad
dres
s pr
iorit
y ac
tions
pr
omot
ing
fish
and
wild
life
cons
erva
tion
and
the
habi
tats
on
whi
ch t
hey
depe
nd;
(2)
wor
k pr
oact
ivel
y to
invo
lve
othe
r co
nser
vatio
n an
d co
mm
unity
in
tere
sts;
(3)
leve
rage
ava
ilabl
e fu
ndin
g; a
nd (
4) e
valu
ate
proj
ect
outc
omes
.
NF
WF
fun
ds
mus
t be
mat
ched
on
at
leas
t a
1:1
basi
s,
alth
ough
2:1
is
enco
urag
ed,
and
high
er r
atio
s ar
e m
ore
com
petit
ive.
Typ
ical
ly r
ange
be
twee
n $1
0,00
0 an
d 15
0,00
0 -
med
ian
is
$60,
000
Var
ies
each
yea
r.
http
://w
ww
.nfw
f.or
g/A
M/T
empl
ate.
cfm
?S
ectio
n=H
ome
Nor
th
Am
eric
an
Wet
land
s C
onse
rvat
ion
Act
Gra
nts
Pro
gram
Uni
ted
Sta
tes
Fis
h an
d W
ildlif
e S
ervi
ce
(US
FW
S)
Bus
ines
s, N
onpr
ofit
Gro
ups,
P
rivat
e La
ndow
ner,
Loc
al
Gov
ernm
ent,
Sta
te/T
errit
oria
l A
genc
y, F
eder
al A
genc
y
Long
-ter
m p
rote
ctio
n, r
esto
ratio
n,
and/
or e
nhan
cem
ent
of w
etla
nds
and
asso
ciat
ed u
plan
ds h
abita
ts.
Cos
t-sh
are
part
ners
m
ust m
atch
gra
nt
fund
s 1:
1 w
ith U
.S.
non-
fede
ral d
olla
rs
Fun
ding
am
ount
s va
ry;
how
eve
r in
200
7 th
is
prog
ram
was
aw
arde
d 39
.4 M
illio
n
Typ
ical
ly in
ear
ly s
prin
g (M
arch
) h
ttp:
//w
ww
.fw
s.g
ove
/bi
rdha
bita
t/Gra
nts/
NA
WC
/inde
x.sh
tm
Non
poin
t S
ourc
e Im
plem
enta
tion
Gra
nts
(319
P
rogr
ams)
Env
ironm
enta
l P
rote
ctio
n A
genc
y (E
PA
) th
roug
h th
e U
tah
Div
isio
n of
Wat
er
Qua
lity
Bus
ines
s, C
omm
unity
/W
ater
shed
Gro
up, N
onpr
ofit
Gro
ups,
Edu
catio
nal I
nstit
utio
n,
Con
serv
atio
n D
istr
ict,
Loca
l G
over
nmen
t, S
tate
/Ter
ritor
ial
Age
ncy,
Trib
al A
genc
y, F
eder
al
Age
ncy
Res
tora
tion,
Inf
orm
atio
n &
E
duca
tion,
Pla
nnin
g, T
MD
L im
plem
enta
tion
Sta
tes
requ
ired
to
prov
ide
40%
non
-F
eder
al m
atch
for
who
le g
rant
. R
ecip
ient
s w
ithin
st
ate
typi
cally
re
quire
d to
pro
vide
40
% m
atch
for
each
pr
ojec
t, bu
t thi
s m
ay
be n
egot
iabl
e w
ith a
gi
ven
stat
e.
Var
ies
M
ike
Rei
cher
t; U
tah
Div
isio
n of
Wat
er
Qua
lity
(DW
Q)
Not
-for
-Pro
fit
Aci
d M
ine
Dra
inag
e R
ecla
mat
ion
U.S
. D
epar
tmen
t of
th
e In
terio
r O
ffic
e of
S
urfa
ce
Min
ing,
D
ivis
ion
of
Rec
lam
atio
n S
uppo
rt
Com
mun
ity/W
ater
shed
Gro
up,
Non
prof
it G
roup
s, C
onse
rvat
ion
Dis
tric
t
Sup
port
the
effo
rts
of lo
cal n
ot-f
or-
prof
it or
gani
zatio
ns,
espe
cial
ly
wat
ersh
ed g
roup
s, to
com
plet
e co
nstr
uctio
n pr
ojec
ts d
esig
ned
to
clea
n st
ream
s im
pact
ed b
y A
cid
Min
e D
rain
age
Par
tner
s ar
e en
cour
aged
to m
ake
mon
etar
y co
ntrib
utio
ns o
r pr
ovid
e in
-kin
d se
rvic
es;
how
eve
r, a
sp
ecifi
c m
atch
is n
ot
spec
ified
.
Typ
ical
ly r
ange
be
twee
n $2
5,00
0 an
d $1
50,0
00 -
med
ian
is
$50,
000
App
licat
ions
will
be
acce
pted
unt
il al
l av
aila
ble
fund
s ha
ve
been
aw
arde
d
htt
p://
ww
w.o
smre
.go
v/o
smam
l.htm
Tab
le 3
. G
ran
ts f
or
Str
eam
an
d R
iver
Res
tora
tio
n P
roje
cts
(co
nti
nu
ed)

GR
AN
T
SP
ON
SO
R
EL
IGIB
LE
T
YP
ES
OF
PR
OJE
CT
S
MA
TC
H
$ R
AN
GE
D
EA
DL
INE
M
OR
E
INF
OR
MA
TIO
N
Par
tner
s fo
r F
ish
and
Wild
life
Pro
gram
U.S
. D
epar
tmen
t of
the
Inte
rior
, U
.S.
Fis
h an
d W
ildlif
e S
ervi
ce
Bra
nch
of H
abita
t R
esto
ratio
n,
Div
isio
n of
Fis
h an
d W
ildlif
e M
anag
emen
t an
d H
abita
t R
esto
ratio
n
Bus
ines
s, C
omm
unity
/W
ater
shed
Gro
up, N
onpr
ofit
Gro
ups,
Edu
catio
nal I
nstit
utio
n,
Priv
ate
Land
owne
r,
Con
serv
atio
n D
istr
ict,
Loca
l G
over
nmen
t, T
ribal
Age
ncy
The
par
tner
s fo
r F
ish
and
Wild
life
Pro
gram
pro
vide
s te
chni
cal a
nd
finan
cial
ass
ista
nce
to p
riva
te
land
owne
rs to
res
tore
fis
h an
d w
ildlif
e ha
bita
ts o
n th
eir
land
s.
Typ
ical
ly a
n ap
plic
ant
cont
ribut
es 5
0% o
f th
e to
tal p
roje
ct c
ost
thro
ugh
mat
chin
g fu
nds
or in
-kin
d se
rvic
es b
ut th
is
amou
nt is
ne
gotia
ble.
Typ
ical
ly r
ange
be
twee
n $3
00 a
nd
$25,
000
- m
edia
n is
$2
5,00
0
Fun
ds a
vaila
ble
year
-rou
nd
htt
p://
ecos
.fws.
go
v/pa
rtne
rs/
vie
wC
onte
nt.d
o?vi
ew
Pag
e=ho
me
Urb
an a
nd
Com
mun
ity
For
estr
y C
halle
nge
Cos
t-S
hare
Gra
nts
US
DA
For
est
Ser
vice
B
usin
ess,
Com
mun
ity/
Wat
ersh
ed G
roup
, Non
prof
it G
roup
s, E
duca
tiona
l Ins
titut
ion,
C
onse
rvat
ion
Dis
tric
t, W
ater
and
W
aste
wat
er U
tiliti
es,
Loca
l G
over
nmen
t, S
tate
/Ter
ritor
ial
Age
ncy,
Trib
al A
genc
y
The
pro
gram
wor
ks t
o ac
hiev
e a
num
ber
of g
oals
, in
clud
ing
(1
) ef
fect
ivel
y co
mm
unic
atin
g in
form
atio
n ab
out t
he s
ocia
l, ec
onom
ic,
and
ecol
ogic
al v
alue
s of
ur
ban
and
com
mun
ity f
ores
ts;
(2)
invo
lvin
g di
vers
e re
sour
ce
prof
essi
onal
s in
urb
an a
nd
com
mun
ity f
ores
try
issu
es; a
nd
(3)
supp
ortin
g a
holis
tic v
iew
of
urba
n an
d co
mm
unity
for
estr
y. I
n pa
rtic
ular
, th
e pr
ogra
m s
uppo
rts
an e
cosy
stem
ap
proa
ch to
man
agin
g ur
ban
fore
sts
for
thei
r be
nefit
s to
air
qual
ity,
stor
mw
ater
run
off,
wild
life
and
fish
habi
tat,
and
othe
r re
late
d ec
osys
tem
co
ncer
ns.
All
gran
t fun
ds m
ust
be m
atch
ed a
t le
ast
equa
lly (
dolla
r fo
r do
llar)
with
non
-fe
dera
l sou
rce
fund
s.
Typ
ical
ly r
ange
be
twee
n $3
,000
and
$2
50,0
00 -
med
ian
is
$125
,000
The
ann
ual R
eque
st
for
Pre
-Pro
posa
ls is
re
leas
ed th
e fir
st
wee
k in
Sep
tem
ber.
P
re-p
ropo
sals
are
du
e th
e se
cond
T
uesd
ay o
f N
ove
mbe
r
http
://w
ww
.fre
elin
k.or
g/nu
cfac
Wat
er 2
025
Cha
lleng
e G
rant
Pro
gram
Bur
eau
of
Rec
lam
atio
n,
Offi
ce o
f P
rogr
am
& P
olic
y S
ervi
ces
Non
prof
it G
roup
s, E
duca
tiona
l In
stitu
tion,
Con
serv
atio
n D
istr
ict,
Wat
er a
nd W
aste
wat
er U
tiliti
es,
Loca
l Gov
ernm
ent,
Sta
te/
Ter
ritor
ial A
genc
y, T
ribal
Age
ncy
The
goa
l of W
ater
202
5 is
to p
reve
nt
cris
es a
nd c
onfli
ct o
ver
wat
er in
the
w
este
rn U
nite
d S
tate
s. T
he
Cha
lleng
e G
rant
Pro
gram
is
adm
inis
tere
d by
the
Bur
eau
of
Rec
lam
atio
n an
d is
des
igne
d to
co
ntrib
ute
to t
his
goal
by
prov
idin
g 50
% fu
ndin
g fo
r pr
ojec
ts t
hat
will
co
nser
ve w
ater
, in
crea
se w
ater
use
ef
ficie
ncy,
or
enha
nce
wat
er
man
agem
ent,
usin
g ad
vanc
ed
tech
nolo
gy,
impr
ovem
ents
to e
xist
ing
faci
litie
s, a
nd w
ater
ban
ks a
nd
mar
kets
.
A m
atch
is r
equi
red,
bu
t the
% is
not
sp
ecifi
ed.
Typ
ical
ly r
ange
be
twee
n $1
9,00
0 an
d $3
00,0
00 m
edia
n is
$1
40,0
00
Vis
it th
e D
epar
tmen
t o
f th
e In
teri
or W
ater
20
25 w
ebsi
te,
ww
w.d
oi.g
ov/
wat
er20
25/,
for
curr
ent i
nfor
mat
ion
on a
ny u
pcom
ing
RF
P d
ates
and
de
adlin
es
htt
p://
ww
w.d
oi.g
ov/
wat
er20
25
Wat
er
Res
ourc
es
Res
earc
h N
atio
nal
Com
petit
ive
Gra
nts
Pro
gram
U.S
. G
eolo
gica
l S
urve
y E
duca
tiona
l Ins
titut
ion
Pro
posa
ls a
re s
ough
t in
not
onl
y th
e ph
ysic
al d
imen
sion
s of
sup
ply
and
dem
and,
but
als
o qu
ality
tre
nds
in
raw
wat
er s
uppl
ies,
the
rol
e of
ec
onom
ics
and
inst
itutio
ns in
wat
er
supp
ly a
nd d
eman
d, in
stitu
tiona
l ar
rang
emen
ts f
or tr
acki
ng a
nd
repo
rtin
g w
ater
sup
ply
and
avai
labi
lity,
and
inst
itutio
nal
arra
ngem
ents
for
cop
ing
with
ex
trem
e hy
drol
ogic
con
ditio
ns.
A m
atch
is r
equi
red,
bu
t the
% is
not
sp
ecifi
ed.
Typ
ical
ly r
ange
be
twee
n $5
,000
and
$2
50,0
00 -
med
ian
is
$120
,000
Feb
ruar
y 16
, 20
07
(for
inve
stig
atio
ns);
M
arch
2,
2007
(fo
r in
stitu
tes)
http
://w
ater
.usg
s.go
v/w
rri/i
nst
itute
s.ht
ml
Tab
le 3
. G
ran
ts f
or
Str
eam
an
d R
iver
Res
tora
tio
n P
roje
cts
(co
nti
nu
ed)

GR
AN
T
SP
ON
SO
R
EL
IGIB
LE
T
YP
ES
OF
PR
OJE
CT
S
MA
TC
H
$ R
AN
GE
D
EA
DL
INE
M
OR
E
INF
OR
MA
TIO
N
Wat
ersh
ed
Pro
tect
ion
and
Flo
od
Pre
vent
ion
Pro
gram
US
DA
C
onse
rvat
ion
Dis
tric
t, Lo
cal
Gov
ernm
ent,
Sta
te/T
errit
oria
l A
genc
y, T
ribal
Age
ncy
Pro
ject
s re
late
d to
wat
ersh
ed p
rote
ctio
n,
flood
miti
gatio
n, w
ater
sup
ply,
wat
er q
ualit
y,
eros
ion
and
sedi
men
t con
trol
, w
etla
nd
crea
tion
and
rest
orat
ion,
fish
and
wild
life
habi
tat
enha
ncem
ent,
agric
ultu
ral w
ater
co
nser
vatio
n, a
nd p
ublic
rec
reat
ion
are
elig
ible
for
assi
stan
ce.
Tec
hnic
al a
nd
finan
cial
ass
ista
nce
is a
lso
avai
labl
e fo
r pl
anni
ng n
ew w
ater
shed
sur
veys
.
App
roxi
mat
ely
75%
T
ypic
ally
ran
ge
betw
een
$5,0
00
and
$2.1
6 M
illio
n -
med
ian
is $
650,
000
Elig
ible
pro
ject
sp
onso
rs m
ay
subm
it fo
rmal
re
ques
ts fo
r as
sist
ance
to t
he
NR
CS
sta
te
cons
erva
tioni
sts
in
each
sta
te a
t any
tim
e.
htt
p://
ww
w.n
rcs.
usda
.gov
/pr
ogra
ms/
wat
ersh
ed/
Wet
land
s P
rogr
am
Dev
elop
men
t G
rant
s
EP
A
Non
prof
it G
roup
s, L
ocal
G
over
nmen
t, S
tate
/Ter
ritor
ial
Age
ncy,
Trib
al A
genc
y
The
EP
A's
Wet
land
Pro
gram
Dev
elop
men
t G
rant
s ar
e in
tend
ed t
o en
cour
age
com
preh
ensi
ve w
etla
nds
prog
ram
de
velo
pmen
t by
pro
mot
ing
the
coor
dina
tion
and
acce
lera
tion
of r
esea
rch,
inve
stig
atio
ns,
expe
rimen
ts,
trai
ning
, de
mon
stra
tions
, su
rve
ys,
and
stud
ies
rela
ting
to t
he c
ause
s,
effe
cts,
ext
ent,
prev
entio
n, r
educ
tion,
and
el
imin
atio
n of
wat
er p
ollu
tion.
Pro
ject
s bu
ild
the
capa
city
of s
tate
s, tr
ibes
and
loca
l go
vern
men
ts to
effe
ctiv
ely
prot
ect
wet
land
an
d rip
aria
n re
sour
ces.
Pro
ject
s fu
nded
un
der
this
pro
gram
sup
port
the
initi
al
deve
lopm
ent
of a
wet
land
s pr
otec
tion,
re
stor
atio
n or
man
agem
ent p
rogr
am o
r su
ppor
t enh
ance
men
t/ref
inem
ent
of a
n ex
istin
g pr
ogra
m.
25%
Non
-fed
eral
m
atch
T
ypic
ally
ran
ge
betw
een
$11,
000
and
$500
,000
-
med
ian
is $
250,
000
Dea
dlin
es a
re
dete
rmin
ed
annu
ally
and
var
y fr
om r
egio
n to
re
gion
.
http
://w
ww
.epa
.gov
/ow
ow
/wet
land
s/gr
antg
uide
lines
/
Wet
land
s R
eser
ve
Pro
gram
US
DA
- N
RC
S
Bus
ines
s, C
omm
unity
/W
ater
shed
Gro
up, N
onpr
ofit
Gro
ups,
Edu
catio
nal I
nstit
utio
n,
priv
ate
Land
owne
r,
Con
serv
atio
n D
istr
ict,
Wat
er
and
Was
tew
ater
Util
ities
, Lo
cal
Gov
ernm
ent,
Sta
te/T
errit
oria
l A
genc
y, T
ribal
Age
ncy
Thr
ough
this
vol
unta
ry p
rogr
am, t
he U
SD
A
Nat
ural
Res
ourc
es C
onse
rvat
ion
Ser
vice
(N
RC
S)
prov
ides
land
owne
rs w
ith f
inan
cial
in
cent
ives
to
rest
ore
and
prot
ect
wet
land
s in
ex
chan
ge f
or r
etiri
ng m
argi
nal a
gric
ultu
ral
land
.
For
res
tora
tion
cost
-sh
are
agre
emen
ts
and
30 y
ear
ease
men
t pa
rtic
ipan
ts,
up to
25
% o
f the
cos
t of
rest
orin
g th
e ac
reag
e m
ust
be
prov
ided
.
A
pplic
atio
ns a
re
acce
pted
yea
r-ro
und.
htt
p://
ww
w.n
rcs.
usda
.gov
/
Wild
life
Hab
itat
Ince
ntiv
es
Pro
gram
US
DA
- N
RC
S
Non
prof
it G
roup
s, P
rivat
e La
ndow
ners
T
he W
ildlif
e H
abita
t In
cent
ive
Pro
gram
(W
HIP
) is
a v
olun
tary
pro
gram
for
peo
ple
who
wan
t to
dev
elop
and
impr
ove
wild
life
habi
tat
on p
rivat
e la
nds.
It p
rovi
des
both
te
chni
cal a
ssis
tanc
e an
d co
st s
harin
g to
hel
p es
tabl
ish
and
impr
ove
fish
and
wild
life
habi
tat.
Par
ticip
ants
wor
k w
ith U
SD
A's
N
atur
al R
esou
rces
Con
serv
atio
n S
ervi
ce to
pr
epar
e a
wild
life
habi
tat
deve
lopm
ent p
lan
in
cons
ulta
tion
with
a lo
cal c
onse
rvat
ion
dist
rict.
The
pla
n de
scrib
es th
e la
ndow
ner's
goa
ls fo
r im
prov
ing
wild
life
habi
tat,
incl
udes
a li
st o
f pr
actic
es a
nd a
sch
edul
e fo
r in
stal
ling
them
, an
d de
tails
the
step
s ne
cess
ary
to m
aint
ain
the
habi
tat
for
the
life
of t
he a
gree
men
t.
25%
Non
-fed
eral
m
atch
N
ot a
vaila
ble;
ho
we
ver,
in F
Y
2007
this
pro
gram
w
as a
war
ded
$259
M
illio
n
Con
tinuo
us s
ign-
up
pro
cess
h
ttp:
//w
ww
.nrc
s.us
da.g
ov/
prog
ram
s/w
hip/
Tab
le 3
. G
ran
ts f
or
Str
eam
an
d R
iver
Res
tora
tio
n P
roje
cts
(co
nti
nu
ed)