SERVICE DELIVERY STATEMENTS VOLUME 3
178
budget.qld.gov.au QUEENSLAND BUDGET 2020-21 SERVICE DELIVERY STATEMENTS VOLUME 3
Transcript of SERVICE DELIVERY STATEMENTS VOLUME 3

budget.qld.gov.au
QUEENSLAND BUDGET 2020-21
SERVICE DELIVERY STATEMENTS VOLUME 3
© The State of Queensland (Queensland Treasury) 2020
Copyright
This publication is protected by the Copyright Act 1968
Licence
This document is licensed by the State of Queensland (Queensland Treasury) under a Creative Commons Attribution
(CC BY 4.0) International licence.
In essence, you are free to copy, communicate and adapt this publication, as long as you attribute the work to the State of
Queensland (Queensland Treasury). To view a copy of this licence, visit http://creativecommons.org/licenses/by/4.0/
Attribution
Content from this publication should be attributed to:
© The State of Queensland (Queensland Treasury) - 2020–21 Queensland Budget
Translating and interpreting assistance
The Queensland Government is committed to providing accessible services to Queenslanders from all cultural and
linguistic backgrounds. If you have difficulty in understanding this publication, you can contact us on telephone
(07) 3035 3503 and we will arrange an interpreter to effectively communicate the report to you.
Service Delivery Statements
ISSN 1445-4890 (Print)
ISSN 1445-4904 (Online)
2020–21 Queensland Budget Papers1. Budget Speech
2. Budget Strategy and Outlook
3. Capital Statement
Service Delivery Statements
Appropriation Bills
Budget Highlights
Regional Action Plans
The Budget Papers are available online at budget.qld.gov.au
Service Delivery Statements
Volume 3 includes the following:
Department of Energy and Public Works
Department of Employment, Small Business and Training
Department of Regional Development, Manufacturing and Water
Department of Resources
Health Portfolio
Ceasing Departments

Table of Contents
Department of Energy and Public Works ........................................................... 3-1
Department of Employment, Small Business and Training .............................. 3-22
Department of Regional Development, Manufacturing and Water ................... 3-3
Department of Resources ............................................................................... 3-4
Health Portfolio ................................................................................................ 3-5
Ceasing Departments .................................................................................... 3-16
Department of Energy and Public Works
The Minister for Energy, Renewables and Hydrogen and the Minister for Public Works and Procurement the Honourable Mic de BrenniMP is responsible for:
The Department of Energy and Public Works (Director-General: JamesPurtill)
Queensland Building and Construction Commission (Commissioner:Brett Bassett)
QBuild (Assistant Director-General: Paige Ridgewell)
QFleet (General Manager: Vince White)
Additional information about these agencies can be sourced from (list websites):
www.dnrm.qld.gov.auwww.hpw.qld.gov.auwww.qbcc.qld.gov.au

Departmental overviewAs part of the Machinery-of-Government changes, effective 12 November 2020:
the Department of Energy and Public Works was createdthe following functions were transferred to Department of Energy and Public Works:- from the former Department of Natural Resources, Mines and Energy: Energy- from the Department of State Development, Infrastructure, Local Government and Planning: Hydrogen Energy- from the former Department of Housing and Public Works: Building Policy and Asset Management and
Queensland Government Procurement. This includes the Queensland Building and Construction Commission,QBuild, and QFleet.
The Department of Energy and Public Works contributes to the implementation of Queensland’s Economic Recovery Plan and is working to protect Queenslanders and save lives, to Unite & Recover for Queensland jobs.
We work together to benefit all Queenslanders now and in the future by optimising sustainability, economic growth, safety and fairness in Queensland’s energy and building sectors and through procurement that prospers Queensland businesses. We lead efforts to help the community and government to make the best use of our energy resourcesincluding integration of renewable hydrogen production, deliver a safer, fairer, and sustainable building and construction industry, support Government asset management and provide procurement services that support jobs and regional economies.
In 2020-21, the Department of Energy and Public Works is working towards its objectives to:
manage Queensland’s energy resources to optimise customer outcomesposition Queensland to capitalise on emerging opportunities for domestic hydrogen use and long-term exportdeliver safe, secure, affordable and sustainable energy resourcesadvance government’s economic, social and environmental objectives, benefit local economies and support localjobs through procurement of government goods, services and capital infrastructuresupport the building and construction industry and government through design excellence, building legislation andpolicy, major government projects and asset management services that boost Queensland’s growing communities.
The Department of Energy and Public Works is contributing to the Queensland’s Economic Recovery Plan by protecting and creating jobs within the building and construction industry, continuing investment in energy resources to drive sustainable economic prosperity and promoting growth opportunities and investment in Queensland.
The Department of Energy and Public Works will deliver the following services in 2020-21:
Energy Services: ensuring Queensland’s energy sector is efficient, equitable and sustainableBuilding and Procurement Services: providing effective and efficient services and support to industry and governmentto benefit Queensland communities including procurement, design excellence, building legislation and policy, majorgovernment projects and government accommodation.

Service Performance
Energy Services
Service Area Highlights
In 2020-21, the service area will support government and departmental commitments and priorities by:
delivering programs that:- help large businesses understand their electricity use and transition to appropriate tariffs- help agricultural businesses (farms) realise energy savings through energy audits and transition to appropriate
new tariffs
supporting ongoing progress towards the Queensland Renewable Energy Target, including by delivering the $145million investment in Queensland Renewable Energy Zones to boost renewable energy investment and attract industrial energy users. In achieving the target, the Queensland Government will maintain an affordable, secure and reliable electricity system for consumers and ensure workforces and communities are treated equitably as the electricity system transitions
continuing to support CleanCo Queensland Limited’s delivery of an additional 1400MW of renewable energy and itsrole as the State’s third publicly owned power generation company, including the development of Australia's first government owned wind farm - Karara Wind Farm supporting and growing Queensland’s emerging renewable energy sector, so that by 2030 Queensland will be at theforefront of renewable hydrogen production in Australiadeveloping options for energy storage to complement large scale solar and wind deploymentcontinuing to regulate and provide strategic oversight of Queensland’s electricity and gas supply industries, and bio-based petrol and diesel mandatescontinuing to maintain the system for fuel price reporting to help motorists shop around and save at the bowsercontinuing to lead Queensland’s engagement with the National Energy Cabinet (and associated forums) as itprogresses market reforms for energy security and reliability, energy affordability and long-term energy marketdesignsupporting Queensland electricity customers dealing with COVID-19 by facilitating the delivery of the Government’s$50 Asset Ownership Dividend and utility relief payment to all households and small business (utility relief paymentonly), and address emerging hardship issues as a result of COVID-19 and its economic impactsensuring preparedness, response and recovery to disasters or emergency events through the development of plans,processes and procedures in support of Queensland's Disaster Management Arrangements.
Energy Services1 2019-20Target/Est
2019-20Actual
2020-21Target/Est
Service standardsEffectiveness measuresRenewable energy as % of total energy consumed in Queensland2 9.9% 17.9% 20%
Average time of energy (electricity and gas) licensing assessments3
90% <4 months 100%
90% <4 months
Efficiency measureCost per biofuels exemption application assessed4 <$4680 $3200 <$4680
Notes:1. This service area was transferred to Department of Energy and Public Works from the Department of Natural Resources, Mines and
Energy as part of Machinery-of-Government changes effective from 12 November 2020. Energy Services now includes hydrogen energy which transferred to Department of Energy and Public Works from the Department of State Development, Infrastructure, Local Government and Planning as part of Machinery-of-Government changes.
2. This service standard measures the effectiveness of renewable energy produced as a percentage of total energy consumed, and relates tothe Queensland Government’s energy objectives. The transition to 50% renewable generation by 2030 is a key commitment for theGovernment in the transition to a low carbon sector. The Government has not set annual targets for the 50% target by 2030 and the 2020-21 target/estimate represents projected output level given the existing and committed renewable energy projects in the pipeline. Output ofrenewable energy generation on an annual basis is a market outcome and can vary year-to-year depending on a range of factors includingelectricity demand, the rate of deployment of projects and climatic variations (for example, resulting in higher or lower solar/wind/waterresource availability).
3. This service standard is a proxy measure of effectiveness of the Queensland Government’s renewable energy objectives by optimisingcustomer outcomes through an efficient energy licensing process. Providing certainty on regulatory timeframes is key to industryinvestment and project certainty, leading to optimised economic outcomes. The timeframe for assessments is within 4 months of receipt ofall necessary information to enable a regulatory decision.
4. This service standard measures the efficiency of the service area in supporting exemption application decisions. It is measured based onthe full-time equivalent staff cost to administer exemption applications. Administration tasks include supporting eligible applicants,arranging the pre-lodgement meeting (noting this stage is optional for applicants), registering and tracking application documentation,information assessments, preparation of draft and final decision documentation, liaison with legal services and correspondence with theapplicant. While this measure does not incorporate time taken to finalise an exemption, faster turnaround times are a factor that increasesthe number of exemptions issued in the quarter, and therefore improved decision times will contribute to an improved efficiency result. Theservice area will continuously improve its assessment practices and education of regulated businesses.
Building and Procurement Services
Service Area Highlights
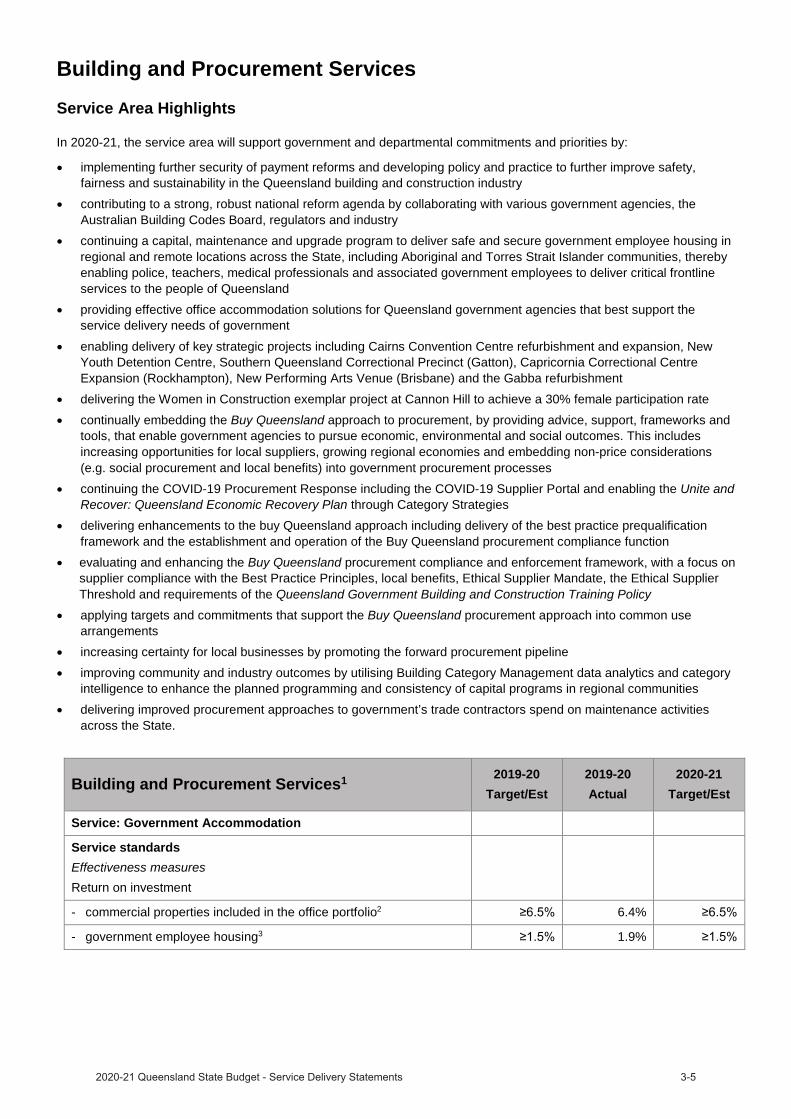
In 2020-21, the service area will support government and departmental commitments and priorities by:
implementing further security of payment reforms and developing policy and practice to further improve safety,fairness and sustainability in the Queensland building and construction industrycontributing to a strong, robust national reform agenda by collaborating with various government agencies, theAustralian Building Codes Board, regulators and industrycontinuing a capital, maintenance and upgrade program to deliver safe and secure government employee housing inregional and remote locations across the State, including Aboriginal and Torres Strait Islander communities, therebyenabling police, teachers, medical professionals and associated government employees to deliver critical frontlineservices to the people of Queenslandproviding effective office accommodation solutions for Queensland government agencies that best support theservice delivery needs of government
enabling delivery of key strategic projects including Cairns Convention Centre refurbishment and expansion, NewYouth Detention Centre, Southern Queensland Correctional Precinct (Gatton), Capricornia Correctional CentreExpansion (Rockhampton), New Performing Arts Venue (Brisbane) and the Gabba refurbishmentdelivering the Women in Construction exemplar project at Cannon Hill to achieve a 30% female participation ratecontinually embedding the Buy Queensland approach to procurement, by providing advice, support, frameworks andtools, that enable government agencies to pursue economic, environmental and social outcomes. This includesincreasing opportunities for local suppliers, growing regional economies and embedding non-price considerations(e.g. social procurement and local benefits) into government procurement processescontinuing the COVID-19 Procurement Response including the COVID-19 Supplier Portal and enabling the Unite andRecover: Queensland Economic Recovery Plan through Category Strategiesdelivering enhancements to the buy Queensland approach including delivery of the best practice prequalificationframework and the establishment and operation of the Buy Queensland procurement compliance functionevaluating and enhancing the Buy Queensland procurement compliance and enforcement framework, with a focus onsupplier compliance with the Best Practice Principles, local benefits, Ethical Supplier Mandate, the Ethical SupplierThreshold and requirements of the Queensland Government Building and Construction Training Policy
applying targets and commitments that support the Buy Queensland procurement approach into common usearrangementsincreasing certainty for local businesses by promoting the forward procurement pipelineimproving community and industry outcomes by utilising Building Category Management data analytics and categoryintelligence to enhance the planned programming and consistency of capital programs in regional communitiesdelivering improved procurement approaches to government’s trade contractors spend on maintenance activitiesacross the State.
Building and Procurement Services1 2019-20Target/Est
2019-20Actual
2020-21Target/Est
Service: Government Accommodation
Service standardsEffectiveness measuresReturn on investment
- commercial properties included in the office portfolio2 6.4%
- government employee housing3 1.9%

Building and Procurement Services1 2019-20Target/Est
2019-20Actual
2020-21Target/Est
Vacancy rate4
- office portfolio5 2.1%
- government employee housing6 3.3%
Percentage of government-owned employee housing with an acceptable facility condition index rating7 98%
Energy performance – percentage of occupied government office
Australian Built Environmental Rating System >80% 83% >80%
Efficiency measureWork point density
- average13.5m² per
person12.26m² per
person13.5m² per
person
- new fitout12m² per
person11.54m² per
person 12m² per
person
Service: Procurement
Efficiency measures8
Operating cost per $1,000 of managed spend on general goods and services9 $1.24
Notes:1. This service area comprises the building and procurement business from the ‘Services for Government’ service area in the former
Department of Housing and Public Works. Building and procurement services transferred to the new Department of Energy and Public Works as part of Machinery-of-Government changes effective from 12 November 2020.
2. This service standard monitors the return (net profit) to the Queensland Government on the level of assets employed/owned by thedepartment for providing office accommodation. Variance between 2019-20 Target/Estimate and 2019-20 Actual is mainly due to the provision of rent relief to non-government tenants between April and June 2020 due to COVID-19.
3. This service standard monitors the return (net profit) to the Queensland Government on the level of assets employed/owned by thedepartment for providing accommodation to government departments for employee housing. Variance between 2019-20 Target/Estimate and 2019-20 Actual is mainly due to delays in expenditure for the property condition assessment program, with access to residences restricted due to COVID-19.
4. Vacancy rate data is used as an indicator of the effectiveness of the service area's ability to strategically manage its leased and ownedportfolios.
5. Variance between 2019-20 Target/Estimate and 2019-20 Actual is principally due to the ongoing strategic management of the officeportfolio and delivery of a number of departmentally funded projects in the CBD and regional locations to secure tenants into existing portfolio vacancies. Vacancy rate further reduced in the fourth quarter of 2019-20 with the establishment of a number of initiatives across the state to address COVID-19 impacts.
6. Variance between 2019-20 Target/Estimate and 2019-20 Actual is due to the increased use of the vacant residences by private tenantsand also the divestment of vacant residences that are surplus to employee housing requirements.
7. Variance between 2019-20 Target/Estimate and 2019-20 Actual is due to the low level of maintenance liability at the end of the financialyear following delivery of most of the identified maintenance works in 2019-20.
8. An effectiveness measure is being developed and will be included in a future Service Delivery Statement9. This service standard demonstrates the efficiency in the management of procurement services related to general goods and services. This
measure is calculated by total operating costs (i.e. expenses such as labour and supplies/services) of the General Goods and Servicesbusiness unit, as a ratio of every $1,000 whole-of-government spend awarded under the procurement categories managed by the unit.Note that the figure reported does not include data from Queensland Health, Queensland Treasury and former Department of NaturalResources, Mines and Energy. Data from those agencies will be included and reported in the department’s Annual Report 2020-21.
Budgeted financial statement
Departmental income statementAs a result of Machinery-of-Government changes there is no corresponding agency representative to show actuals and therefore comparatives for 2019-20 and 2020-21.
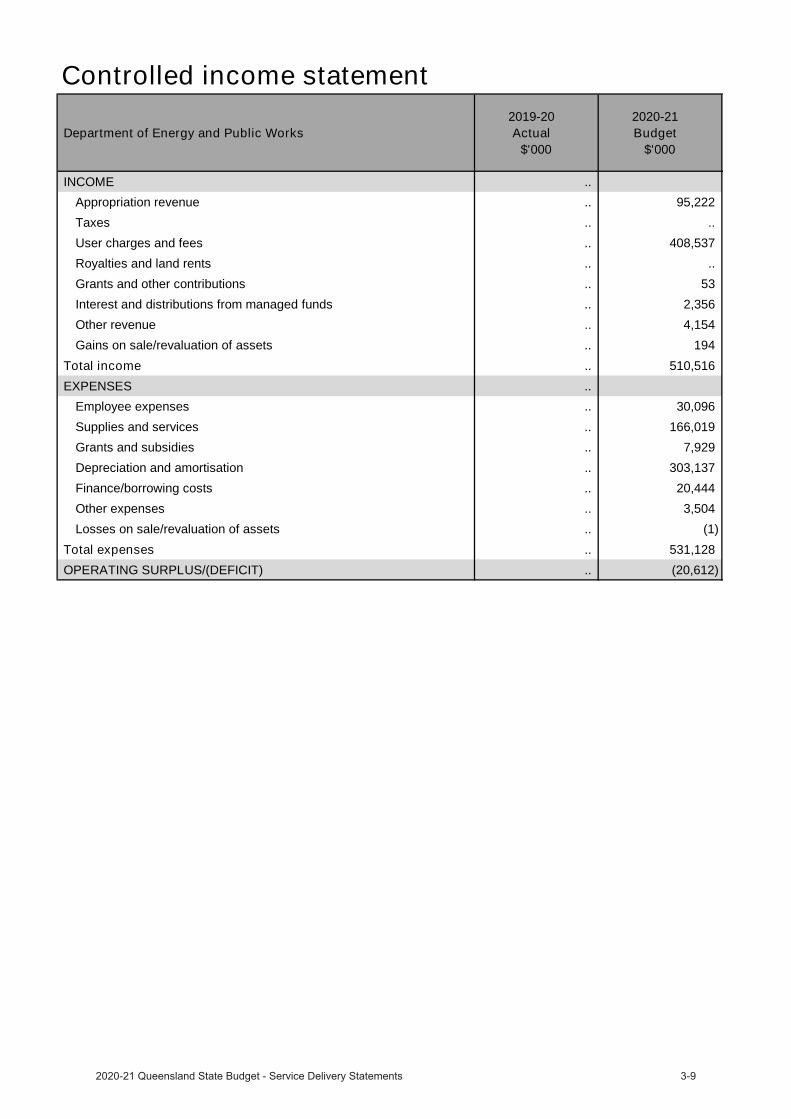
Controlled income statement
Department of Energy and Public Works 2019-20
Actual$'000
2020-21 Budget
$'000
INCOME .. Appropriation revenue .. 95,222 Taxes .. .. User charges and fees .. 408,537 Royalties and land rents .. .. Grants and other contributions .. 53 Interest and distributions from managed funds .. 2,356 Other revenue .. 4,154 Gains on sale/revaluation of assets .. 194
Total income .. 510,516 EXPENSES ..
Employee expenses .. 30,096 Supplies and services .. 166,019 Grants and subsidies .. 7,929 Depreciation and amortisation .. 303,137 Finance/borrowing costs .. 20,444 Other expenses .. 3,504 Losses on sale/revaluation of assets .. (1)
Total expenses .. 531,128 OPERATING SURPLUS/(DEFICIT) .. (20,612)
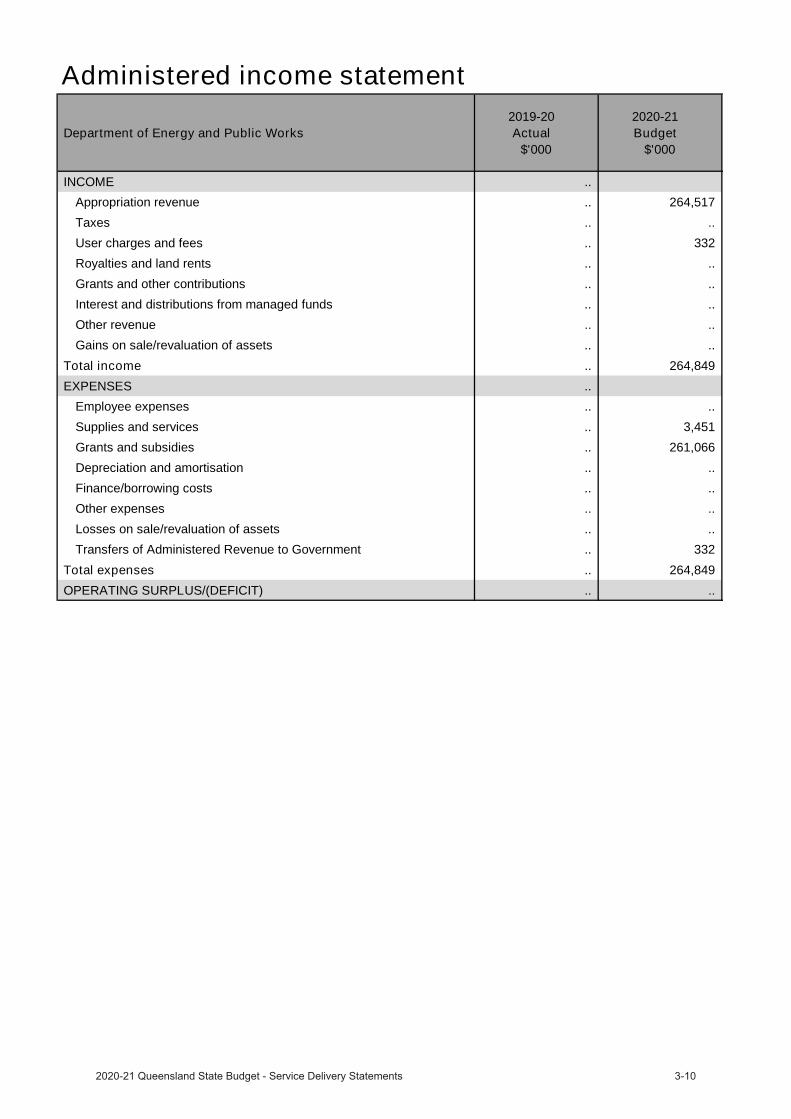
Administered income statement
Department of Energy and Public Works 2019-20
Actual$'000
2020-21 Budget
$'000
INCOME .. Appropriation revenue .. 264,517 Taxes .. .. User charges and fees .. 332 Royalties and land rents .. .. Grants and other contributions .. .. Interest and distributions from managed funds .. .. Other revenue .. .. Gains on sale/revaluation of assets .. ..
Total income .. 264,849 EXPENSES ..
Employee expenses .. .. Supplies and services .. 3,451 Grants and subsidies .. 261,066 Depreciation and amortisation .. .. Finance/borrowing costs .. .. Other expenses .. .. Losses on sale/revaluation of assets .. .. Transfers of Administered Revenue to Government .. 332
Total expenses .. 264,849 OPERATING SURPLUS/(DEFICIT) .. ..
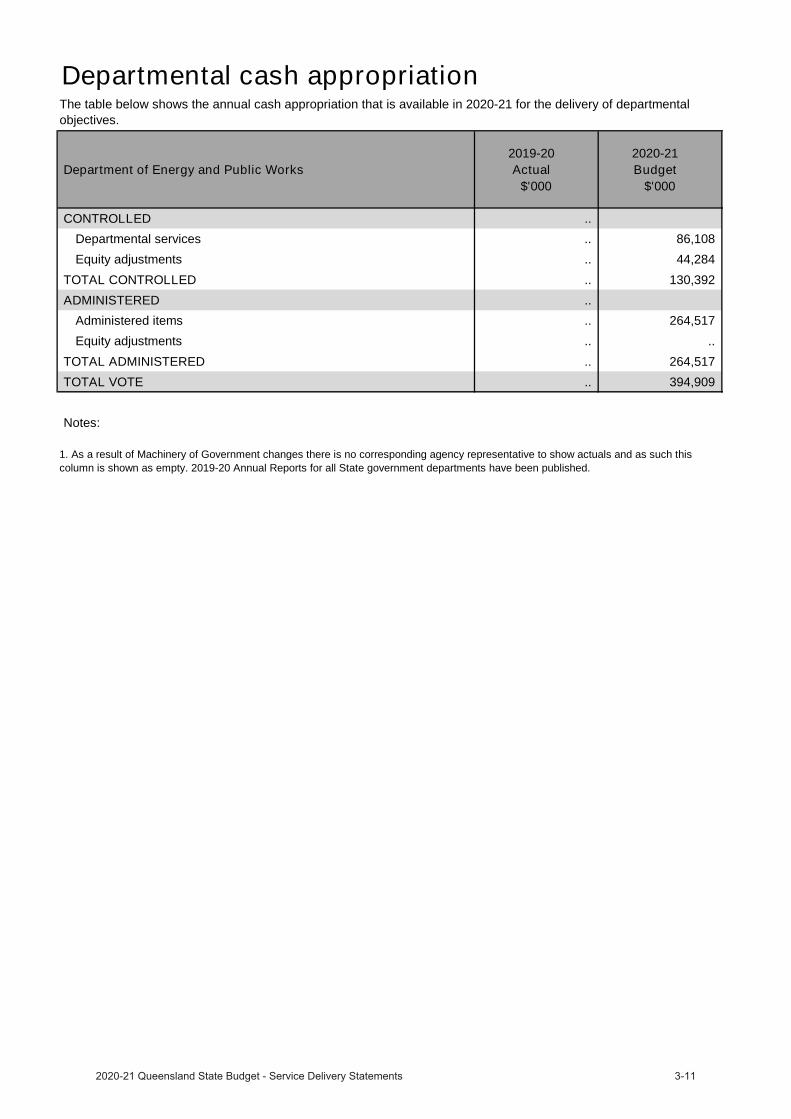
Departmental cash appropriation
Department of Energy and Public Works 2019-20
Actual$'000
2020-21 Budget
$'000
CONTROLLED .. Departmental services .. 86,108 Equity adjustments .. 44,284
TOTAL CONTROLLED .. 130,392 ADMINISTERED ..
Administered items .. 264,517 Equity adjustments .. ..
TOTAL ADMINISTERED .. 264,517 TOTAL VOTE .. 394,909
Notes:
The table below shows the annual cash appropriation that is available in 2020-21 for the delivery of departmental objectives.
1. As a result of Machinery of Government changes there is no corresponding agency representative to show actuals and as such this column is shown as empty. 2019-20 Annual Reports for all State government departments have been published.
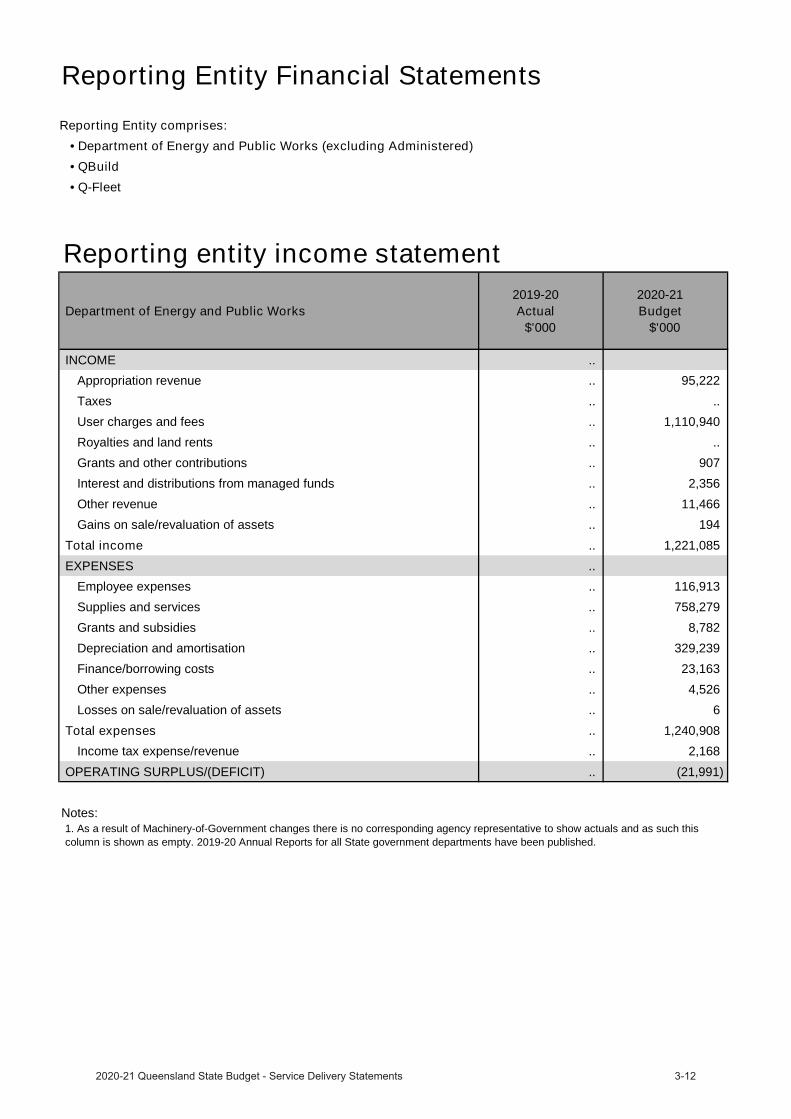
Reporting Entity Financial StatementsReporting Entity comprises:
• Department of Energy and Public Works (excluding Administered)• QBuild• Q-Fleet
Reporting entity income statement
Department of Energy and Public Works 2019-20
Actual$'000
2020-21 Budget
$'000
INCOME .. Appropriation revenue .. 95,222
Taxes .. ..
User charges and fees .. 1,110,940
Royalties and land rents .. ..
Grants and other contributions .. 907
Interest and distributions from managed funds .. 2,356
Other revenue .. 11,466
Gains on sale/revaluation of assets .. 194
Total income .. 1,221,085 EXPENSES ..
Employee expenses .. 116,913
Supplies and services .. 758,279
Grants and subsidies .. 8,782
Depreciation and amortisation .. 329,239
Finance/borrowing costs .. 23,163
Other expenses .. 4,526
Losses on sale/revaluation of assets .. 6
Total expenses .. 1,240,908 Income tax expense/revenue .. 2,168
OPERATING SURPLUS/(DEFICIT) .. (21,991)
Notes:1. As a result of Machinery-of-Government changes there is no corresponding agency representative to show actuals and as such thiscolumn is shown as empty. 2019-20 Annual Reports for all State government departments have been published.
Statutory bod
Queensland Building and Construction Commission
OverviewThe Queensland Building and Construction Commission (QBCC) is a statutory body established under the Queensland Building and Construction Commission Act 1991 to regulate the building and construction industry. The QBCC’s vision is to be a regulator that builds trust and confidence in all we do.
The QBCC focuses on customers, both consumers and contractors, by improving service quality and access to information and advice and increasing awareness of QBCC’s regulatory role.
QBCC contributes to the implementation of Queensland’s Economic Recovery Plan and is working to protect Queenslanders and save lives, to Unite & Recover for Queensland jobs.
QBCC will deliver services in 2020-21 to build trust and confidence in the building and construction industry by promoting integrity and probity in the industry and providing effective and efficient regulatory and customer services.
New capital initiatives in 2020-21 includes $1.944 million in relation to regional office alterations and fit outs.
Service Performance
Service Area Highlights
In 2020-21, the service area will support government and departmental commitments and priorities by:
implementing changes arising from the Building Industry Fairness (Security of Payment) and Other LegislationAmendment Bill 2020 that includes legislative changes to extend protections against non-payment in the buildingindustry and enhance the QBCC’s enforcement abilitiescontinuing to build capabilities and capacities as part of the Insights Driven Regulator program to better enable theQBCC to take a more proactive approach in enforcing the legislation it administersimplementing recommendations arising from the Queensland Audit Office’s performance audit of the QBCC toenable more effective and efficient operations.

Queensland Building and Construction Commission
2019-20Target/Est
2019-20Actual
2020-21Target/Est
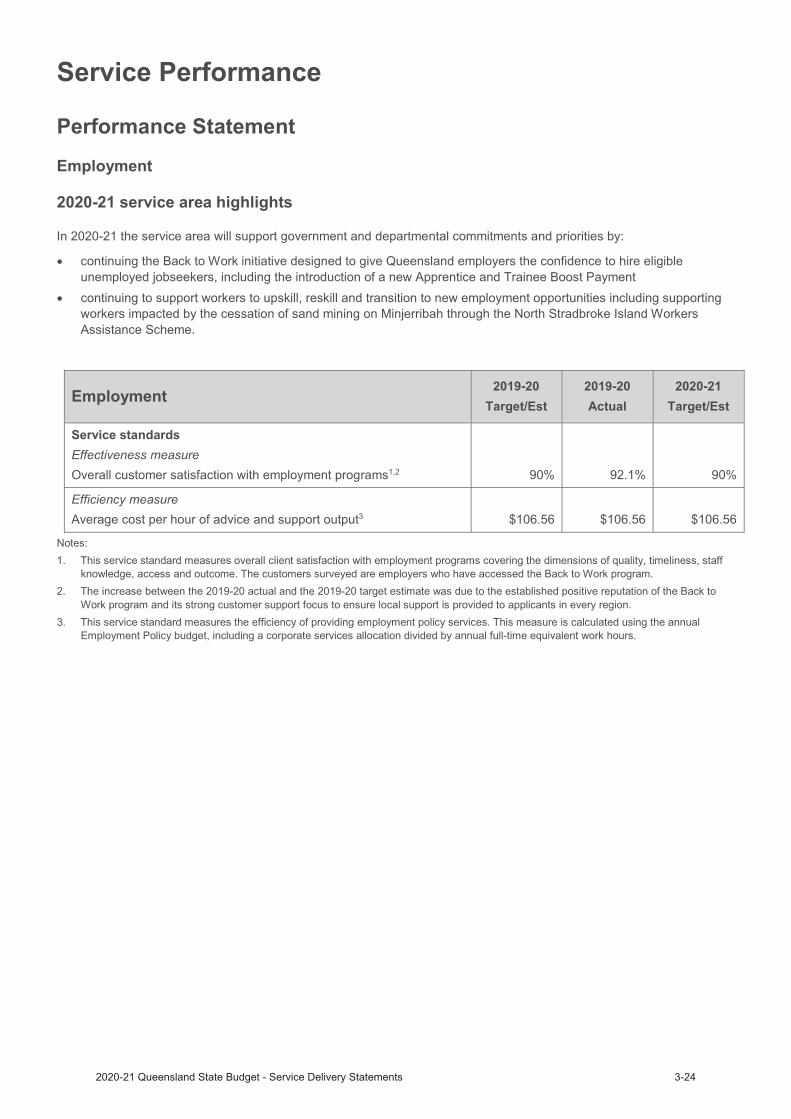
Service standardsEffectiveness measuresPerception of fairness in decision-making: percentage of survey respondents agree the final decision was fair1 65% 55.8% 65%
Percentage of decisions set aside by the Queensland Civil and Administrative Tribunal2 4% 6.5% 5%
Efficiency measureCost of recovering $1.00 of funds owed to creditors3 $0.70 $0.44 $0.60
Other measuresPercentage of early dispute resolution cases finalised within 28 days4,5 80% 83% 80%
Average number of days to process licence applications 30 days 17 days 30 days
Percentage of owner builder permits approved within 15 working days4,5 90% 100% 90%
Percentage of adjudication applications referred to an adjudicator within 4 business days4,5 100% 100% 100%
Percentage of insurance claims for defective work assessed and response provided within 35 business days4 50% 55% 50%
Average processing time for an early dispute resolution case4 28 working days
18 working days
28 working days
Average approval time for defects claims less than $20,0004 35 working days
36 working days
35 working days
Percentage of internal review applicants contacted within 2 business days4 95% 95.9% 95%
Notes:1. Variance between the 2019-20 Actual and the 2019-20 Target/Estimate is due to survey responses correlating strongly with stakeholder
expectations of a favourable decision and as such are affected by negative outcomes for stakeholders. These surveys are conducted shortly after a decision is communicated.
2. The wording of the service standard has been amended from ‘Percentage of decisions overturned by the Queensland Civil andAdministrative Tribunal’ in line with the language used in section 24 of the Queensland Civil and Administrative Tribunal Act 2009. The calculation methodology has not changed. Variance between the 2019-20 Actual and the 2019-20 Target/Estimate was due to 14 decisions out of 213 matters being set aside by the Queensland Civil and Administrative Tribunal (QCAT). Of those decisions set aside by the QCAT, three related to a decision to decline an insurance claim, three related to excluded individual decisions and the remaining eight related to decisions to either issue or not issue a direction to rectify for defective building work. Variance between 2019-20 Target/Estimate and 2020-21 Target/Estimate is due to the QBCC expecting a higher number of matters available to go the QCAT with future legislative changes.
3. This service standard is calculated by using the cost of operating the areas involved in recovering funds under the Minimum FinancialRequirements Regulation, divided by the sum of monies recovered. The QBCC has no control over the value of monies owed on complaints received, which in turn has an impact on the level of monies recovered. Variance between 2019-20 Target/Estimate and 2020-21 Target/Estimate is due to extra initiatives being implemented to further support payment in the industry, with the objective to reduce monies owed, thereby reducing the larger volumes of monies owed on complaints received by the QBCC for investigation. The 2020-21Target/Estimate of $0.60 shows an increase in efficiency in QBCC operations in this service.
4. This service standard has been reclassified as ‘other’ as it is a measure of timeliness and does not meet the definition of ‘efficiency’ asdescribed in the Queensland Government Performance Management Framework policy. However, these measures are retained to demonstrate QBCC’s commitment to improve the timeliness of its services to customers to align with industry expectations.
5. The wording of the service standard has been amended to include the words “business days” as per section 79(4) of the Building IndustryFairness (Security of Payment) Act 2017. The calculation methodology has not changed.

Income statement
Queensland Building and Construction Commission 2019-20
Actual$'000
2020-21 Budget
$'000
INCOMETaxes .. ..
User charges and fees 141,307 150,507
Grants and other contributions .. ..
Interest and distributions from managed funds 5,736 2,463
Other revenue 56,747 83,658
Gains on sale/revaluation of assets 48,365 5,424
Total income 252,155 242,052 EXPENSES
Employee expenses 61,972 66,957
Supplies and services 30,506 42,339
Grants and subsidies .. ..
Depreciation and amortisation 6,800 6,262
Finance/borrowing costs 421 396
Other expenses 60,065 99,209
Losses on sale/revaluation of assets 90,579 41,489
Total expenses 250,343 256,652 OPERATING SURPLUS/(DEFICIT) 1,812 (14,600)
Commercialised business units
QBuild
OverviewQBuild’s role is to deliver state-wide building, construction and maintenance programs supporting QueenslandGovernment agencies to deliver their core services to Queenslanders.
QBuild’s vision is to ensure customers benefit from better operating efficiencies, greater value for money and strong business partnerships.
Our extensive geographic presence across Queensland, including six regional offices and a network of district offices, operational service centres and depots, enables QBuild to work directly with industry to maximise local supplier participation and create jobs state-wide through the QBuild apprenticeship program, building Queensland’s regional capability. This geographic presence positions QBuild to provide immediate response to communities affected by natural disasters and other major events by working with government agencies to ensure assets become operational quickly and services are returned to Queenslanders.
QBuild contributes to the implementation of Queensland’s Economic Recovery Plan and is working to protect Queenslanders and save lives, to Unite & Recover for Queensland jobs.
QBuild will deliver services in 2020-21 to partner with and support Queensland Government agencies to effectively and efficiently deliver their core services to Queenslanders, by strategically managing and delivering their building, construction and maintenance activities and programs state-wide.
Service Performance
Service Area Highlights
In 2020-21, the service area will support government and departmental commitments and priorities by:
expanding the QBuild apprenticeship program, creating employment opportunities for apprentices and tradespersons state-wide working cohesively with Queensland Government agencies to effectively manage asset portfolios, creating value for money partnerships and enabling agencies to deliver more services to Queenslanders supporting the Queensland Procurement Policy by delivering maintenance and facilities management with local/regional contractors/suppliers to advance the government’s economic, environmental and social objectivesstrengthening our capability to oversight and deliver capital works projects and programs for Queensland Government agencies
broadening and integrate our workplace health and safety strategies at the interface of our partnerships with Queensland Government agencies.
QBuild1 2019-20Target/Est
2019-20Actual
2020-21Target/Est
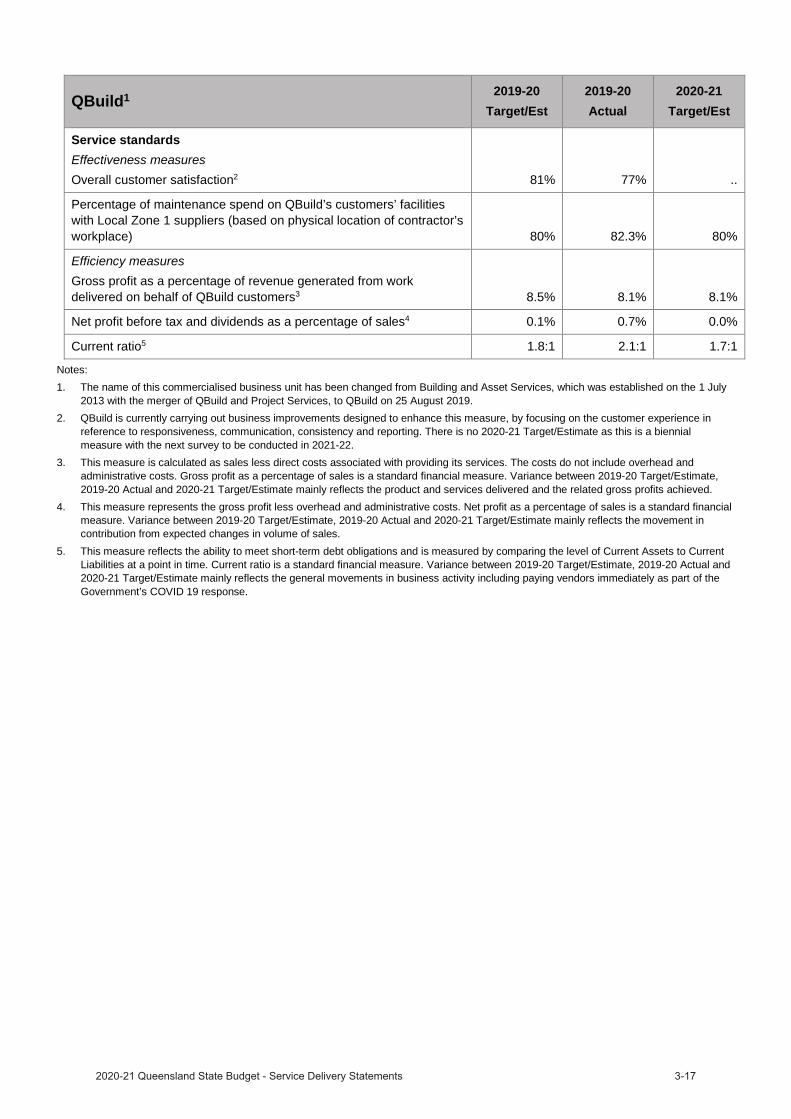
Service standardsEffectiveness measuresOverall customer satisfaction2 81% 77% ..
Percentage of maintenance spend on QBuild’s customers’ facilities with Local Zone 1 suppliers (based on physical location of contractor’s workplace) 80% 82.3% 80%
Efficiency measuresGross profit as a percentage of revenue generated from work delivered on behalf of QBuild customers3 8.5% 8.1% 8.1%
Net profit before tax and dividends as a percentage of sales4 0.1% 0.7% 0.0%
Current ratio5 1.8:1 2.1:1 1.7:1
Notes:1. The name of this commercialised business unit has been changed from Building and Asset Services, which was established on the 1 July
2013 with the merger of QBuild and Project Services, to QBuild on 25 August 2019.2. QBuild is currently carrying out business improvements designed to enhance this measure, by focusing on the customer experience in
reference to responsiveness, communication, consistency and reporting. There is no 2020-21 Target/Estimate as this is a biennial measure with the next survey to be conducted in 2021-22.
3. This measure is calculated as sales less direct costs associated with providing its services. The costs do not include overhead and administrative costs. Gross profit as a percentage of sales is a standard financial measure. Variance between 2019-20 Target/Estimate, 2019-20 Actual and 2020-21 Target/Estimate mainly reflects the product and services delivered and the related gross profits achieved.
4. This measure represents the gross profit less overhead and administrative costs. Net profit as a percentage of sales is a standard financial measure. Variance between 2019-20 Target/Estimate, 2019-20 Actual and 2020-21 Target/Estimate mainly reflects the movement in contribution from expected changes in volume of sales.
5. This measure reflects the ability to meet short-term debt obligations and is measured by comparing the level of Current Assets to Current Liabilities at a point in time. Current ratio is a standard financial measure. Variance between 2019-20 Target/Estimate, 2019-20 Actual and 2020-21 Target/Estimate mainly reflects the general movements in business activity including paying vendors immediately as part of the Government’s COVID 19 response.

Income statement
QBuild 2019-20
Actual$'000
2020-21 Budget
$'000
INCOMEUser charges and fees 1,113,854 1,076,886
Grants and other contributions 878 1,373
Interest and distributions from managed funds 58 ..
Other revenue 3,997 13,059
Gains on sale/revaluation of assets 3 ..
Total income 1,118,790 1,091,318 EXPENSES
Employee expenses 126,603 140,062
Supplies and services 978,499 946,707
Grants and subsidies 709 1,200
Depreciation and amortisation 1,281 1,480
Finance/borrowing costs .. ..
Other expenses 3,283 1,468
Losses on sale/revaluation of assets 107 7
Total expenses 1,110,482 1,090,924 Income tax expense/revenue 2,493 118
OPERATING SURPLUS/(DEFICIT) 5,815 276
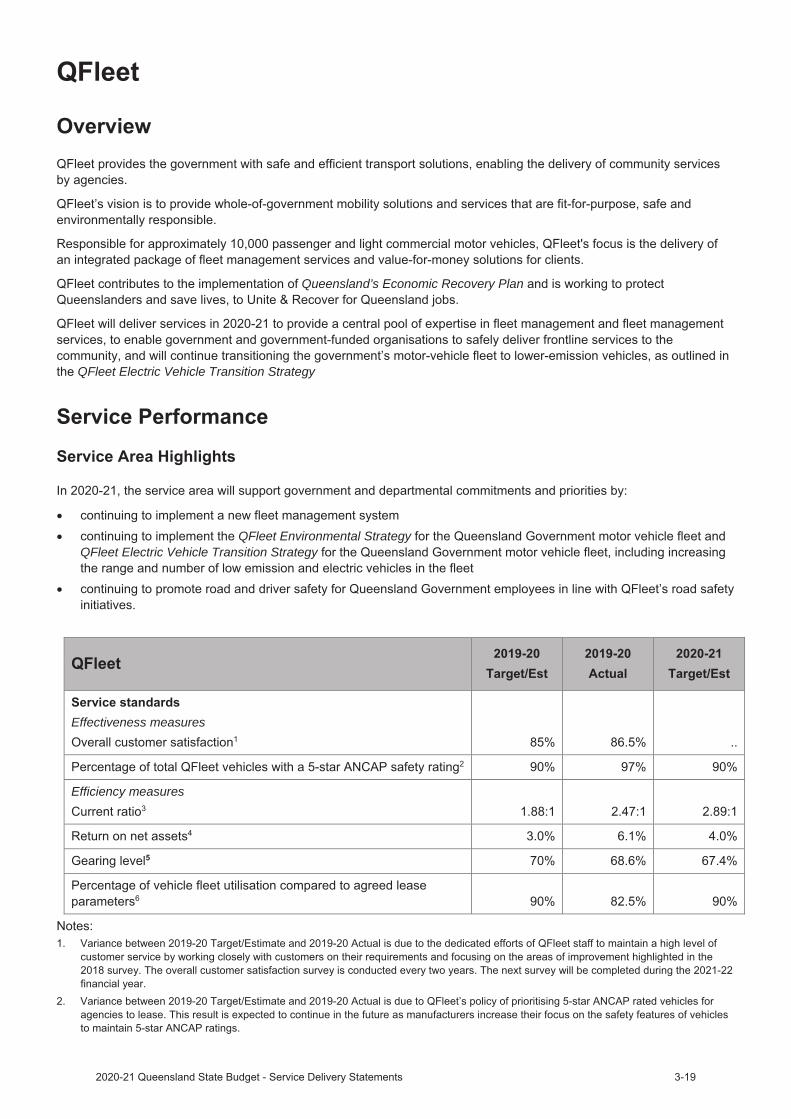
Queensland’s Economic Recovery Plan
QFleet Electric Vehicle Transition Strategy
QFleet Environmental StrategyQFleet Electric Vehicle Transition Strategy
Effectiveness measures
Efficiency measures

Income statement
QFleet 2019-20
Actual$'000
2020-21 Budget
$'000
INCOMEUser charges and fees 152,289 157,708
Grants and other contributions .. ..
Interest and distributions from managed funds 16 ..
Other revenue 490 397
Gains on sale/revaluation of assets .. ..
Total income 152,795 158,105 EXPENSES
Employee expenses 4,750 5,413
Supplies and services 89,125 97,835
Grants and subsidies .. ..
Depreciation and amortisation 42,007 43,263
Finance/borrowing costs 6,130 4,617
Other expenses 40 143
Losses on sale/revaluation of assets .. ..
Total expenses 142,052 151,271 Income tax expense/revenue 3,223 2,050
OPERATING SURPLUS/(DEFICIT) 7,520 4,784

Department of Employment, Small Business and
Training
The Minister for Employment and Small Business and Minister for
Training and Skills Development, the Honourable Dianne Farmer
MP is responsible for:
• The Department of Employment, Small Business and Training(Director-General: Warwick Agnew)
• TAFE Queensland (Chief Executive Officer: Mary Campbell)
Additional information about these agencies can be sourced from:
www.desbt.qld.gov.au
www.tafeqld.edu.au


Notes:1. The 2019-20 actual amounts vary across expenditure categories from amounts published in the department`s 2019-20 annual report as a result of differing disclosure requirements at a whole of government reporting level.


Department of Regional Development, Manufacturing and Water
The Minister for Regional Development and Manufacturing andMin ster for Water, the Honourable Glenn Butcher MP is responsiblefor:
The Department of Regional Development, Manufacturing and Water(Director-General: Frankie Carroll)
Additional information about these agencies can be sourced from www.drdm.qld.gov.au and www.dnrme.qld.gov.au.
Departmental overviewAs part of the Machinery of Government changes, effective 12 November 2020,
the former Department of Regional Development and Manufacturing (DRDM) was renamed Department of RegionalDevelopment, Manufacturing and Water (DRDMW)the Water function was transferred to DRDMW from the former Department of Natural Resources, Mines and Energy.
The Department of Regional Development, Manufacturing and Water contributes to the implementation of Queensland’s Economic Recovery Plan and is working to protect Queenslanders and save lives, to Unite & Recover for Queensland jobs. The department’s vision is for a strong, resilient and inclusive Queensland with thriving regional economies, aninnovative manufacturing sector and considered management of our water resources to deliver sustainable benefits for current and future generations of Queenslanders. The department’s purpose is to generate economic growth and jobs of the future through competitive regional economies and creating a sustainable and innovative manufacturing sector as well as to help the community and government make the best use of Queensland’s water resources.
In 2020-21, the department is working towards its objectives to:
create competitive regional economiescreate an innovative and resilient manufacturing sectorattract private sector investment and create jobs by supporting priority industriesmanage Queensland’s water resources to optimise sustainable development outcomesdeliver safe, secure, affordable and sustainable water resourcesengage the combined expertise of Traditional Owners, community, industry and government to optimise themanagement and use of our water resources.
In 2020-21 the department is underpinning delivery of the Queensland’s Economic Recovery Plan by delivering on key priorities to support advanced technology adoption and workforce development for regional manufacturers; optimise reshoring opportunities; develop local manufacturers and suppliers’ capabilities; deliver sustainable rural water management and continue to ensure Queensland’s catchment-based water plans provide sustainable water allocation for the environment, agriculture, industries and population centres.
The Department of Regional Development, Manufacturing and Water will deliver the following services in 2020-21:
Develop the economy – Create jobs that provide enduring economic benefit by delivering regional economicdevelopment opportunities and supporting the manufacturing industry in QueenslandWater resource management services – The sustainable management of Queensland’s water resources as well asoversight of water service providers and water infrastructure owners.
Service Performance
Develop the economy
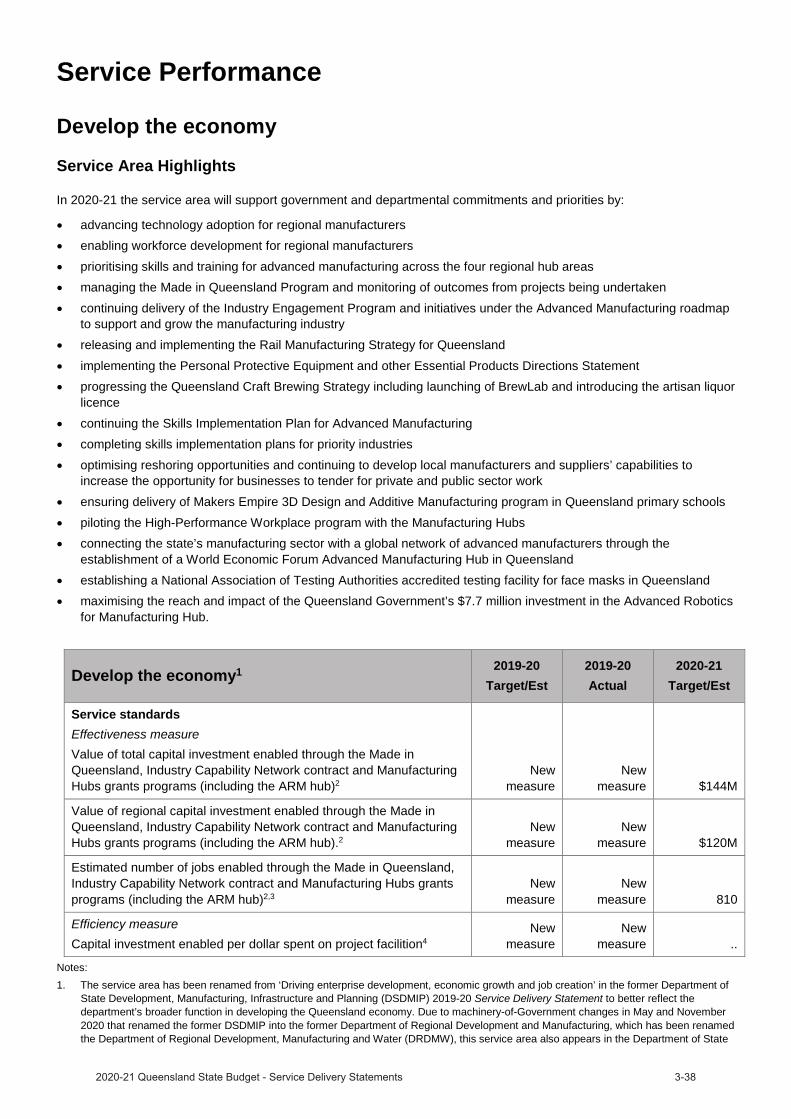
Service Area Highlights
In 2020-21 the service area will support government and departmental commitments and priorities by:
advancing technology adoption for regional manufacturersenabling workforce development for regional manufacturersprioritising skills and training for advanced manufacturing across the four regional hub areasmanaging the Made in Queensland Program and monitoring of outcomes from projects being undertakencontinuing delivery of the Industry Engagement Program and initiatives under the Advanced Manufacturing roadmapto support and grow the manufacturing industryreleasing and implementing the Rail Manufacturing Strategy for Queenslandimplementing the Personal Protective Equipment and other Essential Products Directions Statementprogressing the Queensland Craft Brewing Strategy including launching of BrewLab and introducing the artisan liquorlicencecontinuing the Skills Implementation Plan for Advanced Manufacturingcompleting skills implementation plans for priority industriesoptimising reshoring opportunities and continuing to develop local manufacturers and suppliers’ capabilities toincrease the opportunity for businesses to tender for private and public sector workensuring delivery of Makers Empire 3D Design and Additive Manufacturing program in Queensland primary schoolspiloting the High-Performance Workplace program with the Manufacturing Hubsconnecting the state’s manufacturing sector with a global network of advanced manufacturers through theestablishment of a World Economic Forum Advanced Manufacturing Hub in Queenslandestablishing a National Association of Testing Authorities accredited testing facility for face masks in Queenslandmaximising the reach and impact of the Queensland Government’s $7.7 million investment in the Advanced Roboticsfor Manufacturing Hub.
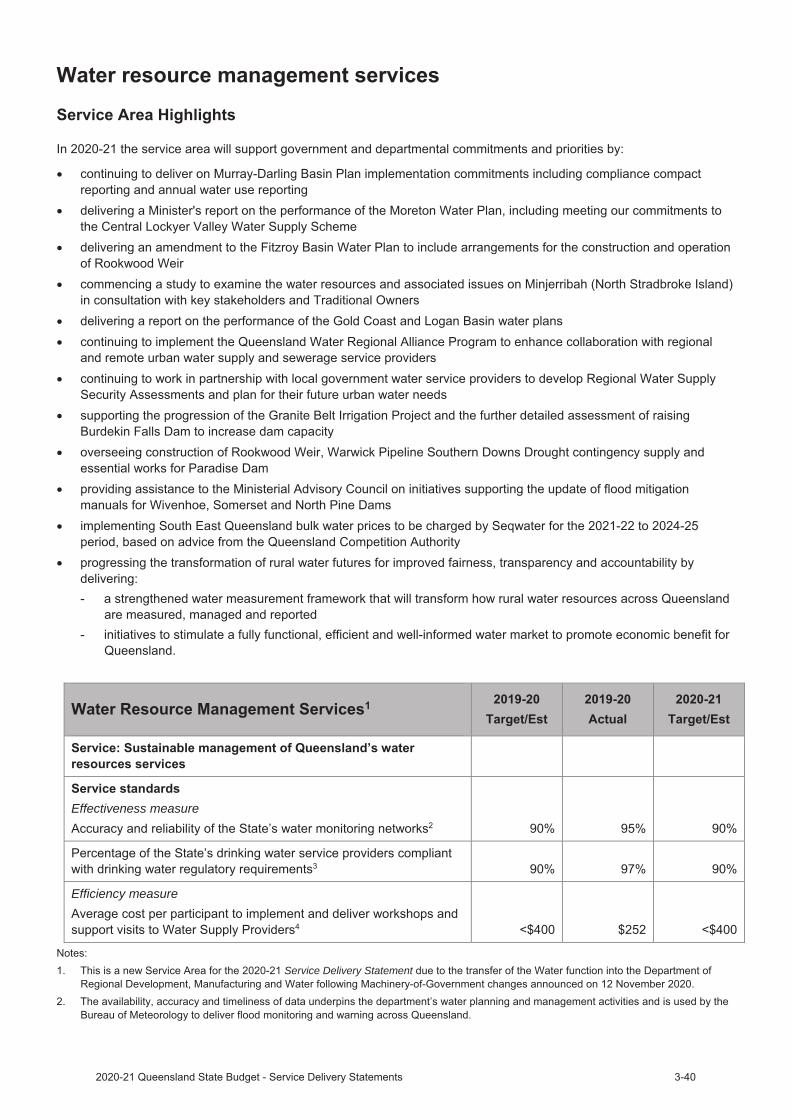
Develop the economy1 2019-20Target/Est
2019-20Actual
2020-21Target/Est
Service standardsEffectiveness measureValue of total capital investment enabled through the Made in Queensland, Industry Capability Network contract and Manufacturing Hubs grants programs (including the ARM hub)2
New measure
New measure $144M
Value of regional capital investment enabled through the Made in Queensland, Industry Capability Network contract and Manufacturing Hubs grants programs (including the ARM hub).2
New measure
New measure $120M
Estimated number of jobs enabled through the Made in Queensland, Industry Capability Network contract and Manufacturing Hubs grants programs (including the ARM hub)2,3
New measure
New measure 810
Efficiency measureCapital investment enabled per dollar spent on project facilition4
New measure
New measure ..
Notes:1. The service area has been renamed from ‘Driving enterprise development, economic growth and job creation’ in the former Department of
State Development, Manufacturing, Infrastructure and Planning (DSDMIP) 2019-20 Service Delivery Statement to better reflect the department’s broader function in developing the Queensland economy. Due to machinery-of-Government changes in May and November 2020 that renamed the former DSDMIP into the former Department of Regional Development and Manufacturing, which has been renamed the Department of Regional Development, Manufacturing and Water (DRDMW), this service area also appears in the Department of State
Development, Infrastructure, Local Government and Planning (DSDILGP)’s performance statement as there is joint responsibility in the delivery of some of the functions of state development and manufacturing across the two departments.
2. This is a new service standard for the 2020-21 Service Delivery Statement due to the formation of the DRDMW.3. The number of jobs reported in this measure refers to the number of jobs expected to be enabled by all in-scope projects over their entire
project life, even where these jobs will occur over several financial years. Jobs enabled are reported once in the year that the in-scopeprojects are reported in the ‘value of total capital investment enabled through the Made in Queensland, Industry Capability Networkcontract and Manufacturing Hubs grants programs (including the ARM hub)’ measure.
4. This service standard captures the capital investment on Queensland projects being facilitated for every dollar invested in annual staffexpenses (salaries and on costs) which relate to the delivery of these projects. This service standard also appears in the DSDILGP’s andQueensland Treasury’s 2020-21 Service Delivery Statements due to machinery-of-Government changes in November 2020. As a result ofthe machinery-of-Government changes it is not practical to provide a 2020-21 target/estimate.
Effectiveness measure
Efficiency measure
Service Delivery Statement
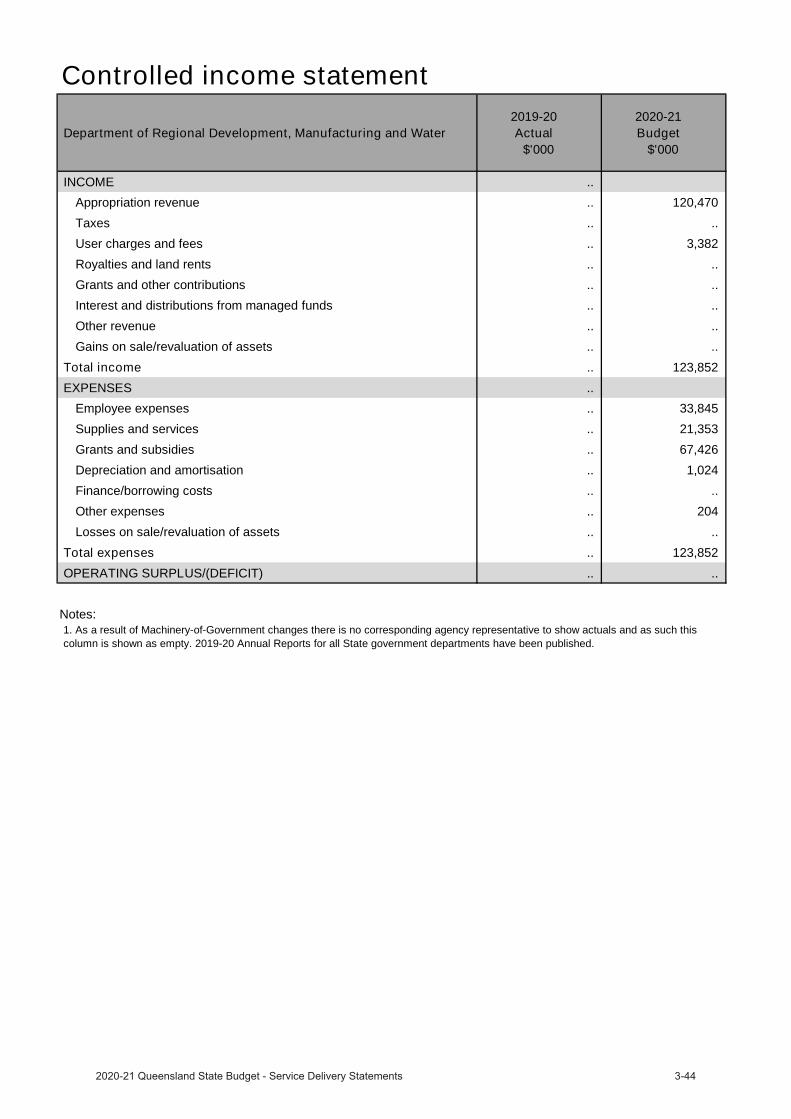
Budgeted financial statementDepartmental income statementThe total budgeted expenses are estimated to be $123.9 million in 2020-21. This largely incorporates seven months of Water function transferring in from the former Department of Natural Resources, Mines and Energy following the November 2020 achinery-of-Government changes. The major budgeted programs are:
• $50.2 million for water grants• $9.5 million for Made in Queensland• $7.5 million for Manufacturing Hubs
As a result of machinery-of-Government changes there is no corresponding agency representative to show actuals and as such the 2019-20 Actual column is shown as empty. 2019-20 Annual Reports for all State Government departments have been published.
Controlled income statement
Department of Regional Development, Manufacturing and Water 2019-20
Actual$'000
2020-21 Budget
$'000
INCOME .. Appropriation revenue .. 120,470 Taxes .. .. User charges and fees .. 3,382 Royalties and land rents .. .. Grants and other contributions .. .. Interest and distributions from managed funds .. .. Other revenue .. .. Gains on sale/revaluation of assets .. ..
Total income .. 123,852 EXPENSES ..
Employee expenses .. 33,845 Supplies and services .. 21,353 Grants and subsidies .. 67,426 Depreciation and amortisation .. 1,024 Finance/borrowing costs .. .. Other expenses .. 204 Losses on sale/revaluation of assets .. ..
Total expenses .. 123,852 OPERATING SURPLUS/(DEFICIT) .. ..
Notes:1. As a result of Machinery-of-Government changes there is no corresponding agency representative to show actuals and as such thiscolumn is shown as empty. 2019-20 Annual Reports for all State government departments have been published.
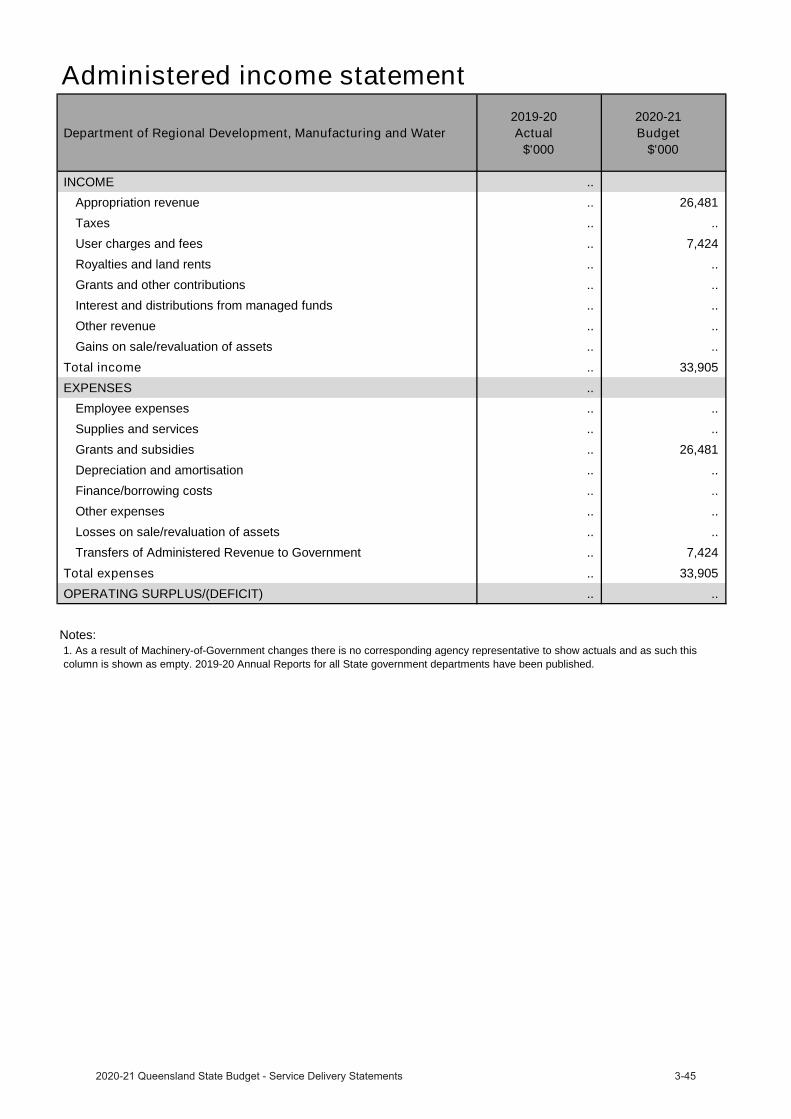
Administered income statement
Department of Regional Development, Manufacturing and Water 2019-20
Actual$'000
2020-21 Budget
$'000
INCOME .. Appropriation revenue .. 26,481 Taxes .. .. User charges and fees .. 7,424 Royalties and land rents .. .. Grants and other contributions .. .. Interest and distributions from managed funds .. .. Other revenue .. .. Gains on sale/revaluation of assets .. ..
Total income .. 33,905 EXPENSES ..
Employee expenses .. .. Supplies and services .. .. Grants and subsidies .. 26,481 Depreciation and amortisation .. .. Finance/borrowing costs .. .. Other expenses .. .. Losses on sale/revaluation of assets .. .. Transfers of Administered Revenue to Government .. 7,424
Total expenses .. 33,905 OPERATING SURPLUS/(DEFICIT) .. ..
Notes:1. As a result of Machinery-of-Government changes there is no corresponding agency representative to show actuals and as such thiscolumn is shown as empty. 2019-20 Annual Reports for all State government departments have been published.
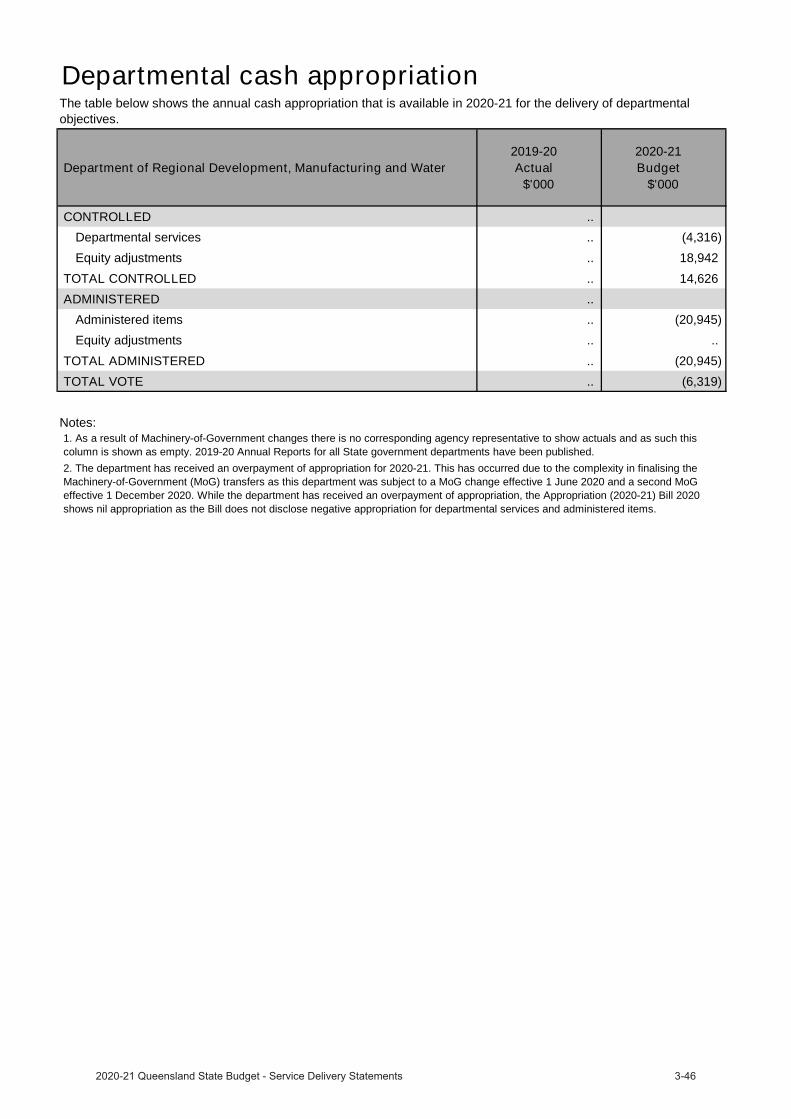
Departmental cash appropriation
Department of Regional Development, Manufacturing and Water 2019-20
Actual$'000
2020-21 Budget
$'000
CONTROLLED .. Departmental services .. (4,316)Equity adjustments .. 18,942
TOTAL CONTROLLED .. 14,626 ADMINISTERED ..
Administered items .. (20,945)Equity adjustments .. ..
TOTAL ADMINISTERED .. (20,945)TOTAL VOTE .. (6,319)
Notes:
The table below shows the annual cash appropriation that is available in 2020-21 for the delivery of departmental objectives.
2. The department has received an overpayment of appropriation for 2020-21. This has occurred due to the complexity in finalising theMachinery-of-Government (MoG) transfers as this department was subject to a MoG change effective 1 June 2020 and a second MoG effective 1 December 2020. While the department has received an overpayment of appropriation, the Appropriation (2020-21) Bill 2020 shows nil appropriation as the Bill does not disclose negative appropriation for departmental services and administered items.
1. As a result of Machinery-of-Government changes there is no corresponding agency representative to show actuals and as such thiscolumn is shown as empty. 2019-20 Annual Reports for all State government departments have been published.
`
Department of Resources
The Minister for Resources, the Honourable Scott Stewart MP isresponsible for:
The Department of Resources (A/Director-General: James Purtill)
Additional information about these agencies can be sourced from: www.dnrme.qld.gov.au
Departmental overviewAs part of the Machinery-of-Government changes, effective 12 November 2020:
the Department of Natural Resources, Mines and Energy was renamed Department of Resourcesthe following functions were transferred from the Department of Resources:- Energy Services has transferred to Department of Energy and Public Works- Water Resources Management Services has transferred to Department of Regional Development,
Manufacturing and Water.
The Department of Resources contributes to the implementation of Queensland’s Economic Recovery Plan and is working to protect Queenslanders and save lives, to Unite & Recover for Queensland jobs.
The department’s vision is that together our land, mineral and energy resources will deliver sustainable benefits for current and future generations of Queenslanders. The department’s purpose is helping the community and government make the best use of our land, mineral and energy resources.
In 2020-21 the Department of Resources is working towards its objectives:
manage Queensland's land, mineral and energy resources to optimise sustainable development outcomesengage the combined expertise of Traditional Owners, community, industry and government to optimise themanagement and use of our natural resourcesbuild a contemporary workforce that demonstrates high levels of expertise, innovation, collaboration and leadershipto improve service quality and responsiveness to customers and communities.
The department’s objectives contribute to the Queensland Government’s Economic Recovery Plan by:
driving investment in the infrastructure that supports our recovery, resilience and future prosperity, and helpingQueensland’s regions grow.
The Department of Resources will deliver the following services in 2020-21:
Natural Resources Management Services – sustainable management of Queensland’s land and native vegetationresources and the provision of the department’s property and spatial information servicesMinerals and Energy Resources Services – Responsible use of our minerals and energy resources.
Service Performance
Natural Resource Management Services
Service Area Highlights
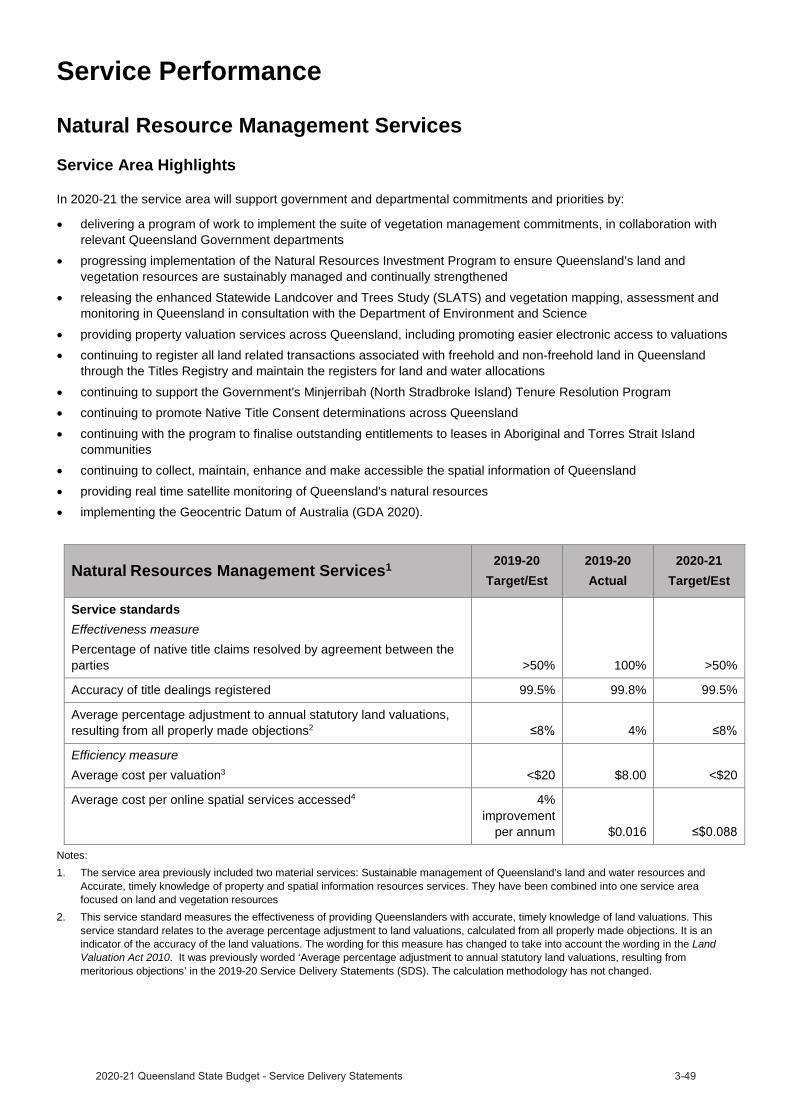
In 2020-21 the service area will support government and departmental commitments and priorities by:
delivering a program of work to implement the suite of vegetation management commitments, in collaboration withrelevant Queensland Government departmentsprogressing implementation of the Natural Resources Investment Program to ensure Queensland’s land andvegetation resources are sustainably managed and continually strengthenedreleasing the enhanced Statewide Landcover and Trees Study (SLATS) and vegetation mapping, assessment andmonitoring in Queensland in consultation with the Department of Environment and Science
providing property valuation services across Queensland, including promoting easier electronic access to valuationscontinuing to register all land related transactions associated with freehold and non-freehold land in Queenslandthrough the Titles Registry and maintain the registers for land and water allocations
continuing to support the Government's Minjerribah (North Stradbroke Island) Tenure Resolution Programcontinuing to promote Native Title Consent determinations across Queenslandcontinuing with the program to finalise outstanding entitlements to leases in Aboriginal and Torres Strait Islandcommunitiescontinuing to collect, maintain, enhance and make accessible the spatial information of Queenslandproviding real time satellite monitoring of Queensland's natural resourcesimplementing the Geocentric Datum of Australia (GDA 2020).
Natural Resource Management Services1 2019-20Target/Est
2019-20Actual
2020-21Target/Est
Service standardsEffectiveness measurePercentage of native title claims resolved by agreement between the parties >50% 100% >50%
Accuracy of title dealings registered 99.5% 99.8% 99.5%
Average percentage adjustment to annual statutory land valuations, resulting from all properly made objections2 4%
Efficiency measureAverage cost per valuation3 <$20 $8.00 <$20
Average cost per online spatial services accessed4 4% improvement
per annum $0.016
Notes:1. The service area previously included two material services: Sustainable management of Queensland’s land and water resources and
Accurate, timely knowledge of property and spatial information resources services. They have been combined into one service area focused on land and vegetation resources
2. This service standard measures the effectiveness of providing Queenslanders with accurate, timely knowledge of land valuations. Thisservice standard relates to the average percentage adjustment to land valuations, calculated from all properly made objections. It is an indicator of the accuracy of the land valuations. The wording for this measure has changed to take into account the wording in the LandValuation Act 2010. It was previously worded ‘Average percentage adjustment to annual statutory land valuations, resulting from meritorious objections’ in the 2019-20 Service Delivery Statements (SDS). The calculation methodology has not changed.

3. This service standard measures the efficiency of this service to fulfil its intended outcome of Queenslanders having access to reliable andaccurate statutory land valuations. The average cost/valuation is an overall efficiency measure of the area’s output. The budgeted baseexpenditure is reported on a unit cost (per valuation) basis and measures the cost to deliver the volume increases in the valuation rollbased on the total budget for State Valuation Services for the financial year. The budgeted base expenditure includes the State ValuationService base expenditure (excluding the Client Valuations unit), the capital expenditure budget for the Queensland Valuation and Salesdatabase and estimated accommodation costs. The valuation roll grows every year, between June 2018 to June 2019 they increased byabout 14,000 records. This effectively means that each year the cost to complete a single valuation goes down.
4. This service standard measures the efficiency of this service based on the average cost to provide online spatial services (salary costsonly). The average cost depends on the number of web services accessed. The number of web services accessed is dependent upon staffand customer usage. The 2020-21 target/estimate has been amended to reflect the wording of the service standard as a measure of cost.The amendment changes the target from ‘4% per cent improvement per annum’ presented in the 2019-20 SDS to $0.088 for the 2020-21SDS (the actual cost for 2019-20 was $0.092). The calculation methodology has not changed. The 19/20 actual for the average cost peronline spatial service accessed, has been $0.16. This is due to an increase in the number of accesses made to services (including externalaccess) during the first 6 months of the year. Customer usage is expected to continue to grow and therefore lower cost per service isexpected during the next 12 months. Capturing and managing foundation spatial data is critical to support Queensland as it providesconsistent and reliable land and spatial information for business planning and decision making.

Minerals and Energy Resources Services
Service Area Highlights
In 2020-21 the service area will:
deliver the Strategic Resources Exploration Program, and key projects from the New Economy Minerals Initiativespecifically the Northeast Queensland deposit atlas, new economy minerals compilation and Queensland’s rare earthelement prospectivity
progress the Bowen Basin gas pipeline pre-feasibility studyrelease the Geoscience Open Data Portal for industry to use for submission of geoscience reportingpublish performance data for resource tenure assessment processespublish operational policy and guidance materials to support the implementation of relevant regulatory reformsincluding the Mineral and Energy Resources and Other Legislation Amendment Bill 2020facilitate coexistence between landholders and the resources sector including fostering effective workingrelationships with the Land Access Ombudsman and the Gasfields Commission Queensland and delivery of theResource Community Information Sessions program to relevant mineral, coal and gas communities across the staterelease abandoned mines spatial data and other information as well as the Abandoned Mines Risk and AssessmentPrioritisation Framework.
Mineral and Energy Resources Services1 2019-20Target/Est
2019-20Actual
2020-21Target/Est
Service standardsEffectiveness measureNotification of directly impacted stakeholders prior to the release of new areas for resource exploration or production by competitive tender2 90% 100% 90%
Efficiency measureAverage cost of all tenure processing transactions3 $2,200 $963 $2,200
Notes:1. This service area used to include Resources Safety and Health services which has now been removed as the responsibility for oversight of
the safety and health of workers in Queensland’s mining, quarrying, petroleum, gas and explosives industries has transferred to Resources Safety & Health Queensland (RSHQ), established on 1 July 2020.
2. This proxy measure of effectiveness measures the provision to directly affected stakeholders of notification of the future release of areasfor resources activities and access to information about how this might impact them. The intent of these notifications is to proactively help communities and individuals prepare for future resource activities through early engagement and provision of pathways to information, and has been implemented to directly address their feedback on historic release processes.
3. This service standard measures the efficiency in tenure processing dealings of all transactions lodged manually and throughMyMinesOnline, and all fossicking-related transactions. This is calculated based on the total budget for the relevant business area.

Discontinued measures Performance measures included in the 2019-20 Service Delivery Statements that have been discontinued or replaced are reported in the following table with estimated actual results.
Minerals and Energy Resources Services2019-20
Target/Est2019-20Actual
2020-21Target/Est
Effectiveness measureLost time injury frequency rate (injuries per million hours) in the mining and quarrying industries1 <3.1 2.9
Discontinued measure
Efficiency measureAverage cost per mine safety licence issued ($/Licence) 1
2.5% improvement
per annum 3.1%Discontinued
measure
Notes: 1. This service standard has been discontinued as responsibility for oversight of the safety and health of workers in Queensland’s mining,
quarrying, petroleum, gas and explosives industries has transferred to Resources Safety & Health Queensland (RSHQ), established on 1 July 2020.

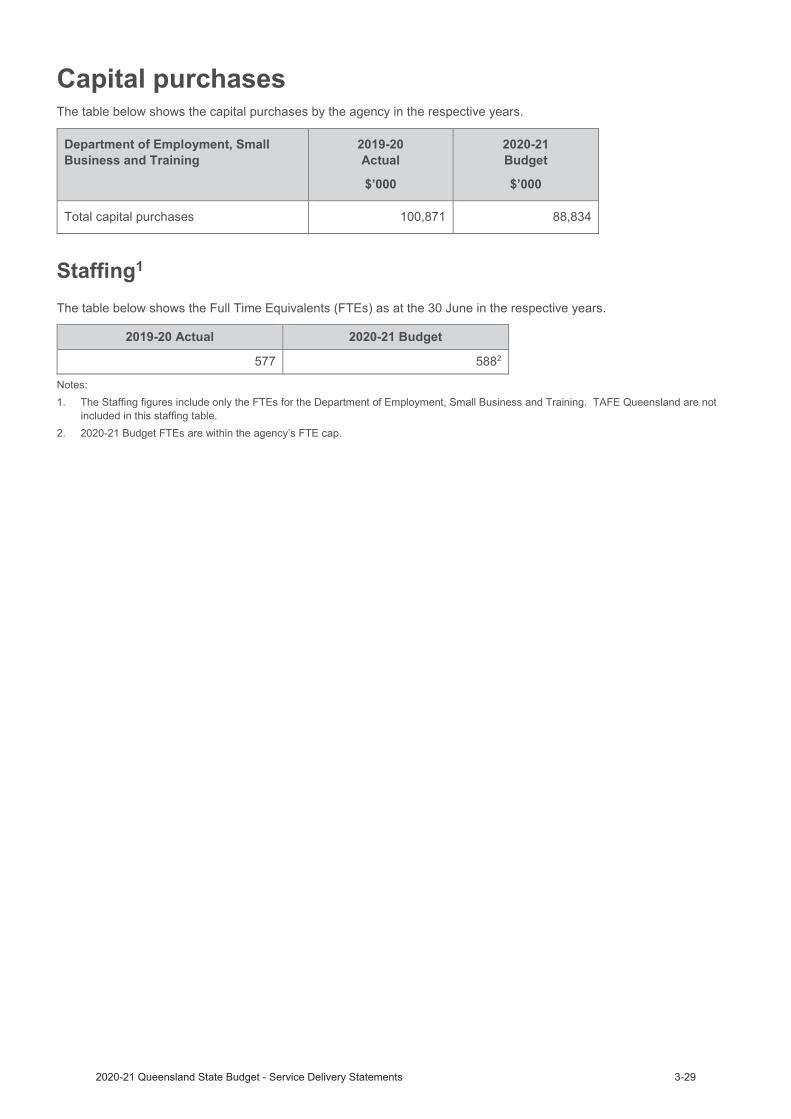
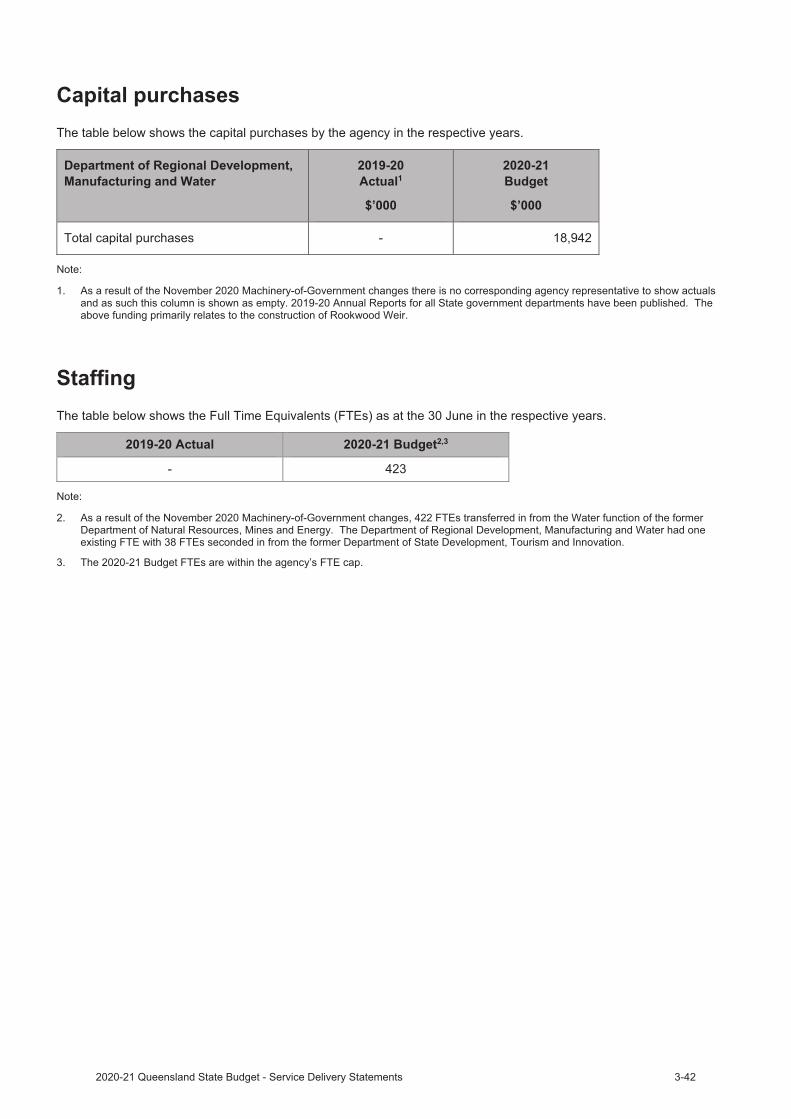
Capital purchases In 2020-21, the Department of Resources has a capital investment plan of $109.8 million. This budget consists of $96.6 million for Rookwood Weir which relates to the water resources services which has transferred to the Department of Regional Development, Manufacturing and Water. Other capital investments include:
$2.3 million for the Hopeland (Linc Energy) Management and Remediation Project.$0.8 million for the Geoscience Data Modernisation Project (Strategic Resources Exploration Program).$0.8 million for the stock route network.other property, plant and equipment.
The table below shows the capital purchases by the agency.
Department of Resources 2019-20Actual1
$’000
2020-21Budget
$’000
Total capital purchases .. 109,775
Note:
1. As a result of Machinery of Government changes there is no corresponding agency representative to show actuals and as such thiscolumn is shown as empty. 2019-20 Annual Reports for all State government departments have been published.
StaffingThe table below shows the Full Time Equivalents (FTEs) as at 30 June in the respective years.
2019-20 Actual1 2020-21 Budget
.. 1,668
Note:
1. As a result of Machinery of Government changes there is no corresponding agency representative to show actuals and as such thiscolumn is shown as empty. 2019-20 Annual Reports for all State government departments have been published.
• $13 million over five years for the New Economy Minerals Initiative
• $10 million over four years for the Collaborative Exploration Initiative
• $5 million over two years for the Bowen Basin gas pipeline pre-feasibility study.
• user charges and fees revenue predominantly for valuation services, maps, cadastral and titles searches
• funding from the Australian Government in relation to specific initiatives.
• Titles Lodgement Revenue
• Revenue from State Land
• Mineral and Petroleum Rentals
• Resource Tenure Application Processing Fees.
Administered Income Statement
Administered activities are those undertaken by departments on behalf of the Government. The departmentadministers funds on behalf of the State for:
Budgeted financial statement
Departmental income statementControlled Income Statement
The department's total expenses are estimated to be $403 million in 2020-21. New budget measures since the 2019-20 Published Budget include:
The department raises a portion of its revenue from sources other than State appropriation, including:
The 2020-21 Budget includes 5 months of expenditure relating to the energy services which have transferred to the Department of Energy and Public Works and 5 months of expenditure relating to the water resources management services which have transferred to the Department of Regional Development, Manufacturing and Water.

Controlled income statement
Department of Resources 2019-20
Actual$'000
2020-21 Budget
$'000
INCOME ..
Appropriation revenue .. 328,703 Taxes .. .. User charges and fees .. 56,839 Royalties and land rents .. 160 Grants and other contributions .. 11,900 Interest and distributions from managed funds .. .. Other revenue .. 5,797 Gains on sale/revaluation of assets .. ..
Total income .. 403,399
EXPENSES ..
Employee expenses .. 232,275 Supplies and services .. 108,774 Grants and subsidies .. 44,038 Depreciation and amortisation .. 14,084 Finance/borrowing costs .. .. Other expenses .. 4,228 Losses on sale/revaluation of assets .. ..
Total expenses .. 403,399
OPERATING SURPLUS/(DEFICIT) .. ..
Notes:1. As a result of Machinery-of-Government changes there is no corresponding agency representative to show actuals and as such this column is shown as empty. 2019-20 Annual Reports for all State government departments have been published.
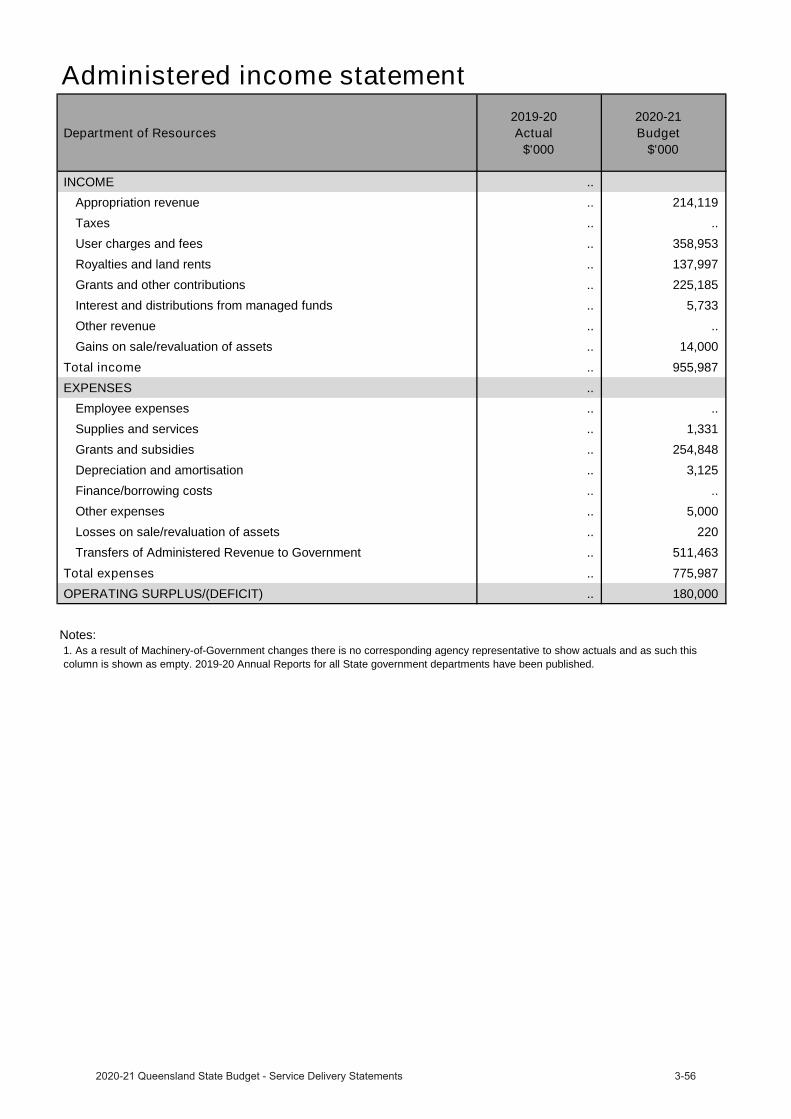
Administered income statement
Department of Resources 2019-20
Actual$'000
2020-21 Budget
$'000
INCOME ..
Appropriation revenue .. 214,119 Taxes .. .. User charges and fees .. 358,953 Royalties and land rents .. 137,997 Grants and other contributions .. 225,185 Interest and distributions from managed funds .. 5,733 Other revenue .. .. Gains on sale/revaluation of assets .. 14,000
Total income .. 955,987
EXPENSES ..
Employee expenses .. .. Supplies and services .. 1,331 Grants and subsidies .. 254,848 Depreciation and amortisation .. 3,125 Finance/borrowing costs .. .. Other expenses .. 5,000 Losses on sale/revaluation of assets .. 220 Transfers of Administered Revenue to Government .. 511,463
Total expenses .. 775,987
OPERATING SURPLUS/(DEFICIT) .. 180,000
Notes:1. As a result of Machinery-of-Government changes there is no corresponding agency representative to show actuals and as such this column is shown as empty. 2019-20 Annual Reports for all State government departments have been published.

Departmental cash appropriation
Department of Resources 2019-20
Actual$'000
2020-21 Budget
$'000
CONTROLLED ..
Departmental services .. 315,357 Equity adjustments .. 92,025
TOTAL CONTROLLED .. 407,382
ADMINISTERED ..
Administered items .. 214,119 Equity adjustments .. (9,740)
TOTAL ADMINISTERED .. 204,379
TOTAL VOTE .. 611,761
Notes:
The table below shows the annual cash appropriation that is available in 2020-21 for the delivery of departmental objectives.
1. As a result of Machinery-of-Government changes there is no corresponding agency representative to show actuals and as such this column is shown as empty. 2019-20 Annual Reports for all State government departments have been published.
Health Portfolio
The Minister for Health and Ambulance Services, the Honourable Yvette D’Ath MP is responsible for:
The Department of Health (Director-General: Dr John Wakefield)
Queensland Ambulance Service (Commissioner: Russell Bowles)
Cairns and Hinterland Hospital and Health Service (Chief ExecutiveOfficer: Tina Chinery)
Central Queensland Hospital and Health Service (Chief Executive Officer:Steve Williamson)
Central West Hospital and Health Service (Chief Executive Officer: JaneHancock)
Children’s Health Queensland Hospital and Health Service (ChiefExecutive Officer: Frank Tracey)
Darling Downs Hospital and Health Service (Chief Executive Officer: DrPeter Gillies)
Gold Coast Hospital and Health Service (Chief Executive Officer: RonCalvert)
Mackay Hospital and Health Service (Acting Chief Executive Officer: LisaDavies Jones)
Metro North Hospital and Health Service (Chief Executive Officer: ShaunDrummond)
Metro South Hospital and Health Service (Chief Executive Officer: Dr PeterBristow)
North West Hospital and Health Service (Acting Chief Executive Officer: DrKaren Murphy)
South West Hospital and Health Service (Acting Chief Executive Officer: Matthew Boyd)
Sunshine Coast Hospital and Health Service (Chief Executive Officer: Naomi Dwyer)
Torres and Cape Hospital and Health Service (Chief Executive Officer: Beverley Hamerton)
Townsville Hospital and Health Service (Chief Executive Officer: Kieran Keyes)
West Moreton Hospital and Health Service (Chief Executive Officer: Dr Kerrie Freeman)
Wide Bay Hospital and Health Service (Chief Executive Officer: Deborah Carroll)
The Council of the Queensland Institute of Medical Research (Director and Chief Executive Officer: Prof Fabienne Mackay)
Queensland Mental Health Commission (Commissioner: Ivan Frkovic)
Office of the Health Ombudsman (Chief Executive Officer: Andrew Brown)
Health and Wellbeing Queensland (Chief Executive Officer: Robyn Littlewood)
Additional information about these agencies can be sourced from:
www.health.qld.gov.au
www.ambulance.qld.gov.au
www.qimrberghofer.edu.au
www.qmhc.qld.gov.au
www.oho.qld.gov.au
www.hw.qld.gov.au
Queensland’s Economic Recovery Plan
Queensland’s Economic Recovery Plan

Service Performance
Acute Inpatient Care
Queensland Health 2019-20Target/Est
2019-20Actual
2020-21Target/Est
Service Area: Acute Inpatient Care
Service standardsEffectiveness measures Rate of healthcare associated Staphylococcus aureus (including MRSA) bloodstream (SAB) infections/10,000 acute public hospital patient days1 <2 0.7 <2
Percentage of elective surgery patients treated within clinically recommended times2
>98% 96.4% >98%3 >95% 87.5% ..
3 >95% 91.1% ..
Median wait time for elective surgery treatment (days)4
.. 15 ..
.. 63 ..
.. 244 ..
.. 40 ..
Percentage of admitted patients discharged against medical advice5
-Aboriginal and Torres Strait Islander patients 0.8% 1.0% 0.8%
1% 3.0% 1%
Efficiency measureAverage cost per weighted activity unit for Activity Based Funding facilities6 $ 4,827 $5,281 $4,866
Other measures
Number of elective surgery patients treated within clinically recommended times7
48,555 47,411 48,5558 54,242 47,380 ..
8 36,325 27,144 ..
Total weighted activity units – acute inpatients9 1,347,667 1,319,224 1,448,698
Notes:1. This is a National Performance Agreement indicator and a measure of effectiveness of infection control programs and services in hospitals.
The Target/Estimate for this measure aligns with the national benchmark of two cases per 10,000 acute public hospital patient days. Actuals for 2019-20 are based on actual performance from 1 July 2019 to 31 March 2020.
2. This is a measure of effectiveness that shows how hospitals perform in providing elective surgery services within the clinically recommended timeframe for each urgency category. Note consistent with the National Cabinet decision, Queensland Health temporarily suspended non urgent elective surgery in preparation for COVID-19, this has impacted the seen in time performance.
3. Given the System’s focus on reducing the volume of patients waiting longer than clinically recommended for elective surgery, as a result ofpreparing for COVID-19, seen in time performance targets for category 2 and 3 patients are not applicable for 2020-21.
4. There are no Target/Estimates as there is no national benchmark target for this measure, and the median wait time varies depending on theproportion of patients in each urgency category. Performance was impacted by the temporary suspension of non urgent elective surgery in preparation for COVID-19.
5. This service standard is a proxy measure for Aboriginal and Torres Strait Islander cultural appropriateness of inpatient services. Current performance for Aboriginal and Torres Strait Islander patients is not meeting the target and is likely to take longer than initially projected to achieve. However, given statewide rates have historically been above 3.5 per cent and approaching four per cent, the 2019-20 Estimated Actual is encouraging and progressing in the right direction. Estimated Actuals for 2019-20 are based on the period 1 July 2019 to 30 June 2020.
6. Actual data for 2019-20 is financial year to June 2020. Cost per WAU excludes Prevention and Primary Care, Specified Grants, and Clinical Education and Training. The introduction of a revised Australian Coding Standard “0002 Additional diagnoses” from 1 July 2019, resulted in lower weighted activity units being calculated for admitted patients relative to the same casemix for the 2018-19 year. Furthermore, the additional costs of the COVID-19 pandemic and the temporary suspension of non urgent planned care services which reduced the volume of patient activity have both contributed to the difference in Cost per WAU. The 2019-20 Target/Estimate varies from the published 2019-20 Service Delivery Statement due to a change in the WAU phase. All measures are reported in WAU phase Q22.
7. This is a measure of activity that reports the number of elective surgery patients who were treated within the clinically recommended time in each category. It shows the volume and timeliness of elective surgery services. Consistent with the National Cabinet decision, Queensland Health temporarily suspended non urgent elective surgery in preparation for COVID-19, this has impacted the volume of elective surgery performed in time.
8. Given the System’s focus on reducing the volume of patients waiting longer than clinically recommended for elective surgery, as a result of preparing for COVID-19, the volume of patients treated within clinically recommended time performance targets for category 2 and 3 patients are not applicable for 2020-21.
9. A WAU is a measure of complexity and volume (i.e. activity) and provides a common unit of comparison so that fairer comparisons can be made across differing clinical services. Service Agreements between the Department of Health and HHSs and other organisations specify the activity to be provided in WAUs by service type. The service agreement category ‘Total WAUs—Interventions and procedures’ has been reallocated between ‘Total WAUs—Acute Inpatient Care’ and ‘Total WAUs—Outpatient Care’ based on individual HHS Inpatient vs Outpatient proportions. Delivery of activity and weighted activity units was impacted by two significant factors in 2019-20; the introduction of a revised Australian Coding Standard “0002 Additional diagnoses” from 1 July 2019, (which resulted in lower weighted activity units being calculated for admitted patients relative to the same casemix period of 2018-19 year) and COVID-19 preparation, (for example the temporary suspension of non urgent planned care services) reduced the volume of patient activity. The 2019-20 Target/Estimate varies from the published 2019-20 Service Delivery Statement due to a change in the WAU phase. All measures are reported in WAU phase Q22.
Outpatient Care
Queensland Health 2019-20Target/Est
2019-20Actual
2020-21Target/Est
Service Area: Outpatient Care
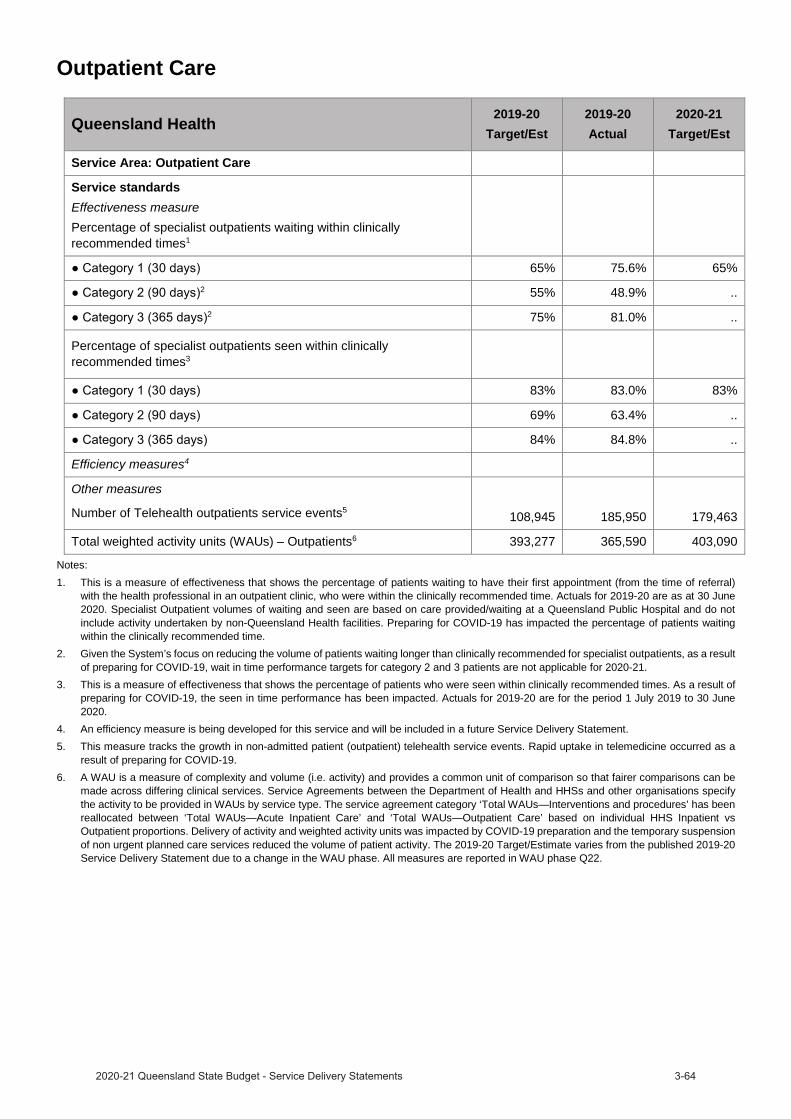
Service standardsEffectiveness measurePercentage of specialist outpatients waiting within clinically recommended times1
65% 75.6% 65%2 55% 48.9% ..
2 75% 81.0% ..
Percentage of specialist outpatients seen within clinically recommended times3
83% 83.0% 83%
69% 63.4% ..
84% 84.8% ..
Efficiency measures4
Other measures
Number of Telehealth outpatients service events5 108,945 185,950 179,463
Total weighted activity units (WAUs) – Outpatients6 393,277 365,590 403,090
Notes:1. This is a measure of effectiveness that shows the percentage of patients waiting to have their first appointment (from the time of referral)
with the health professional in an outpatient clinic, who were within the clinically recommended time. Actuals for 2019-20 are as at 30 June 2020. Specialist Outpatient volumes of waiting and seen are based on care provided/waiting at a Queensland Public Hospital and do not include activity undertaken by non-Queensland Health facilities. Preparing for COVID-19 has impacted the percentage of patients waiting within the clinically recommended time.
2. Given the System’s focus on reducing the volume of patients waiting longer than clinically recommended for specialist outpatients, as a result of preparing for COVID-19, wait in time performance targets for category 2 and 3 patients are not applicable for 2020-21.
3. This is a measure of effectiveness that shows the percentage of patients who were seen within clinically recommended times. As a result of preparing for COVID-19, the seen in time performance has been impacted. Actuals for 2019-20 are for the period 1 July 2019 to 30 June 2020.
4. An efficiency measure is being developed for this service and will be included in a future Service Delivery Statement. 5. This measure tracks the growth in non-admitted patient (outpatient) telehealth service events. Rapid uptake in telemedicine occurred as a
result of preparing for COVID-19. 6. A WAU is a measure of complexity and volume (i.e. activity) and provides a common unit of comparison so that fairer comparisons can be
made across differing clinical services. Service Agreements between the Department of Health and HHSs and other organisations specify the activity to be provided in WAUs by service type. The service agreement category ‘Total WAUs—Interventions and procedures’ has been reallocated between ‘Total WAUs—Acute Inpatient Care’ and ‘Total WAUs—Outpatient Care’ based on individual HHS Inpatient vs Outpatient proportions. Delivery of activity and weighted activity units was impacted by COVID-19 preparation and the temporary suspension of non urgent planned care services reduced the volume of patient activity. The 2019-20 Target/Estimate varies from the published 2019-20 Service Delivery Statement due to a change in the WAU phase. All measures are reported in WAU phase Q22.
Emergency Care
Queensland Health 2019-20Target/Est
2019-20Actual
2020-21Target/Est
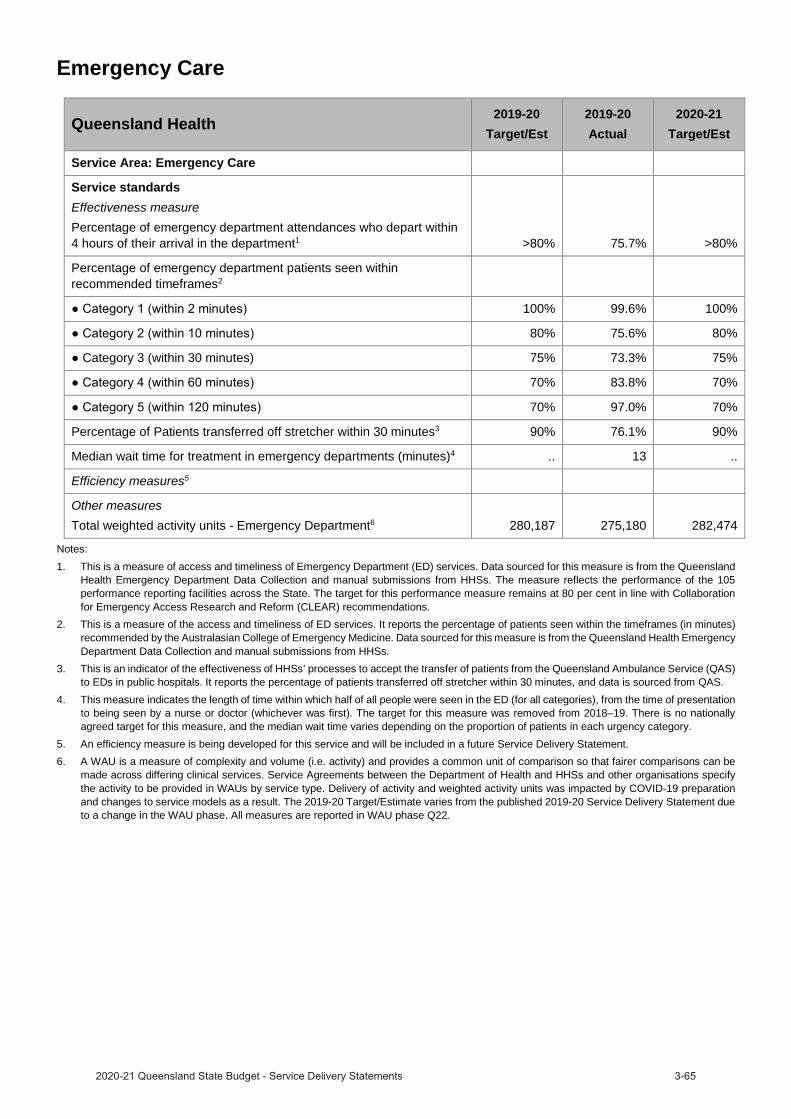
Service Area: Emergency Care
Service standardsEffectiveness measurePercentage of emergency department attendances who depart within 4 hours of their arrival in the department1 >80% 75.7% >80%
Percentage of emergency department patients seen within recommended timeframes2
100% 99.6% 100%
80% 75.6% 80%
Category 3 (within 30 minutes) 75% 73.3% 75%
70% 83.8% 70%
70% 97.0% 70%
Percentage of Patients transferred off stretcher within 30 minutes3 90% 76.1% 90%
Median wait time for treatment in emergency departments (minutes)4 .. 13 ..
Efficiency measures5
Other measuresTotal weighted activity units - Emergency Department6 280,187 275,180 282,474
Notes:1. This is a measure of access and timeliness of Emergency Department (ED) services. Data sourced for this measure is from the Queensland
Health Emergency Department Data Collection and manual submissions from HHSs. The measure reflects the performance of the 105performance reporting facilities across the State. The target for this performance measure remains at 80 per cent in line with Collaboration for Emergency Access Research and Reform (CLEAR) recommendations.
2. This is a measure of the access and timeliness of ED services. It reports the percentage of patients seen within the timeframes (in minutes) recommended by the Australasian College of Emergency Medicine. Data sourced for this measure is from the Queensland Health Emergency Department Data Collection and manual submissions from HHSs.
3. This is an indicator of the effectiveness of HHSs’ processes to accept the transfer of patients from the Queensland Ambulance Service (QAS) to EDs in public hospitals. It reports the percentage of patients transferred off stretcher within 30 minutes, and data is sourced from QAS.
4. This measure indicates the length of time within which half of all people were seen in the ED (for all categories), from the time of presentation to being seen by a nurse or doctor (whichever was first). The target for this measure was removed from 2018–19. There is no nationally agreed target for this measure, and the median wait time varies depending on the proportion of patients in each urgency category.
5. An efficiency measure is being developed for this service and will be included in a future Service Delivery Statement.6. A WAU is a measure of complexity and volume (i.e. activity) and provides a common unit of comparison so that fairer comparisons can be
made across differing clinical services. Service Agreements between the Department of Health and HHSs and other organisations specify the activity to be provided in WAUs by service type. Delivery of activity and weighted activity units was impacted by COVID-19 preparation and changes to service models as a result. The 2019-20 Target/Estimate varies from the published 2019-20 Service Delivery Statement due to a change in the WAU phase. All measures are reported in WAU phase Q22.
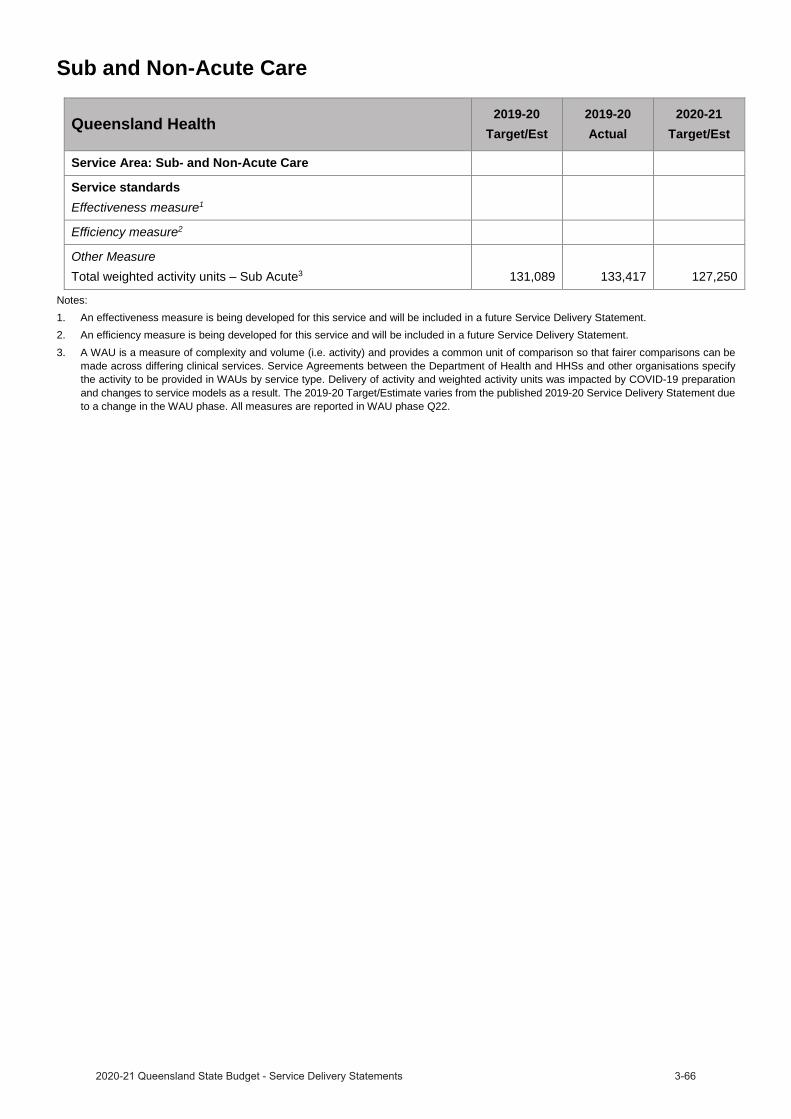
Sub and Non-Acute Care
Queensland Health 2019-20Target/Est
2019-20Actual
2020-21Target/Est
Service Area: Sub- and Non-Acute Care
Service standardsEffectiveness measure1
Efficiency measure2
Other Measure Total weighted activity units – Sub Acute3 131,089 133,417 127,250
Notes:1. An effectiveness measure is being developed for this service and will be included in a future Service Delivery Statement.2. An efficiency measure is being developed for this service and will be included in a future Service Delivery Statement.3. A WAU is a measure of complexity and volume (i.e. activity) and provides a common unit of comparison so that fairer comparisons can be
made across differing clinical services. Service Agreements between the Department of Health and HHSs and other organisations specify the activity to be provided in WAUs by service type. Delivery of activity and weighted activity units was impacted by COVID-19 preparation and changes to service models as a result. The 2019-20 Target/Estimate varies from the published 2019-20 Service Delivery Statement due to a change in the WAU phase. All measures are reported in WAU phase Q22.
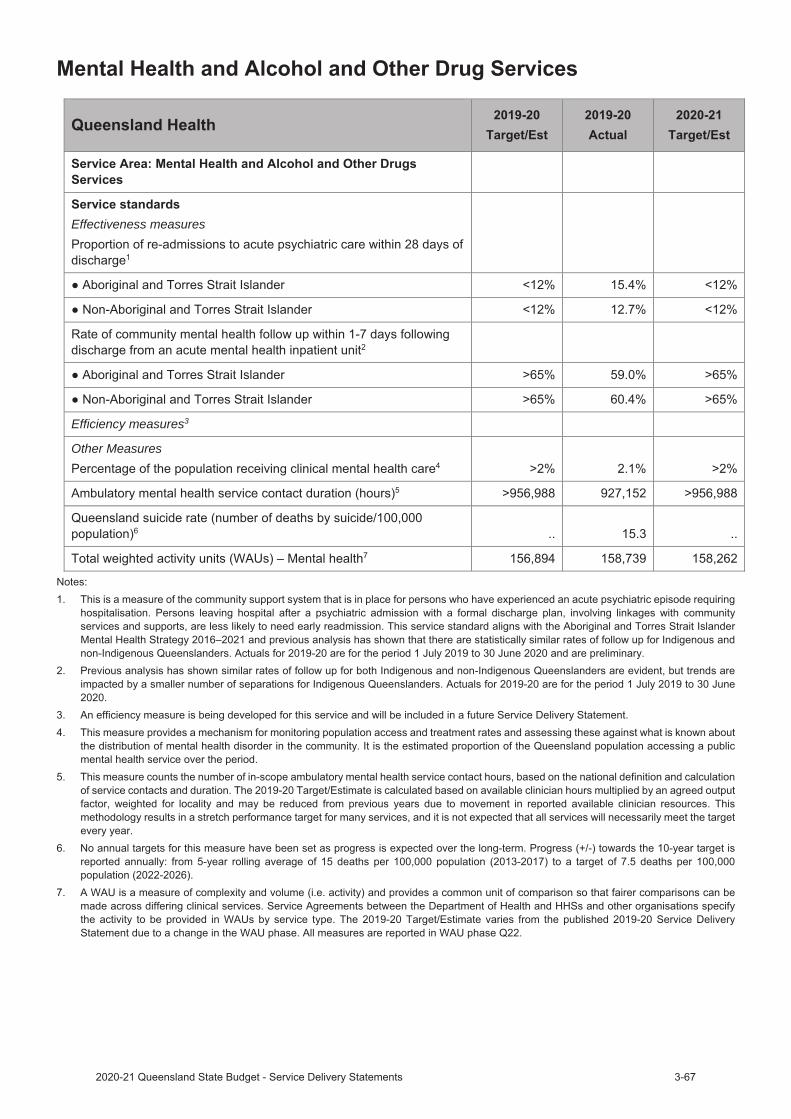
Effectiveness measures
Efficiency measures3
Other Measures
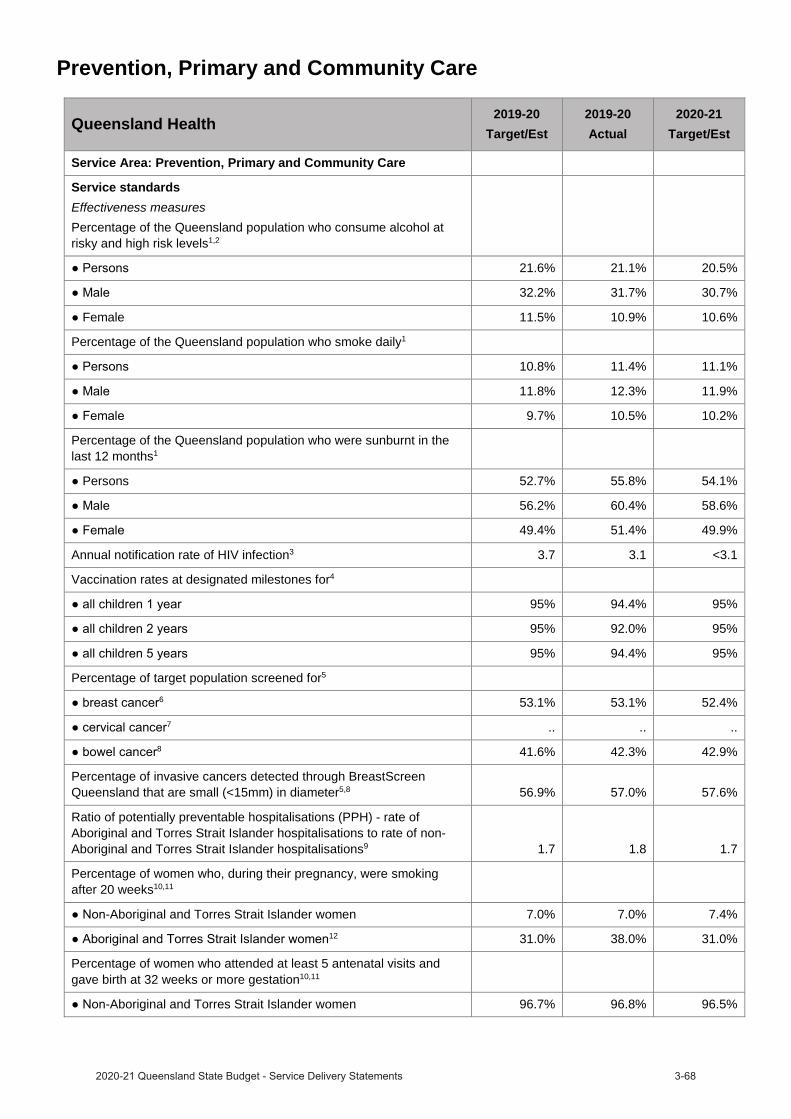
Prevention, Primary and Community Care
Queensland Health 2019-20Target/Est
2019-20Actual
2020-21Target/Est
Service Area: Prevention, Primary and Community Care
Service standardsEffectiveness measuresPercentage of the Queensland population who consume alcohol at risky and high risk levels1,2
21.6% 21.1% 20.5%
32.2% 31.7% 30.7%
Female 11.5% 10.9% 10.6%
Percentage of the Queensland population who smoke daily1
10.8% 11.4% 11.1%
11.8% 12.3% 11.9%
9.7% 10.5% 10.2%
Percentage of the Queensland population who were sunburnt in the last 12 months1
Persons 52.7% 55.8% 54.1%
56.2% 60.4% 58.6%
49.4% 51.4% 49.9%
Annual notification rate of HIV infection3 3.7 3.1 <3.1
Vaccination rates at designated milestones for4
95% 94.4% 95%
95% 92.0% 95%
95% 94.4% 95%
Percentage of target population screened for5
6 53.1% 53.1% 52.4%7 .. .. ..
8 41.6% 42.3% 42.9%
Percentage of invasive cancers detected through BreastScreen Queensland that are small (<15mm) in diameter5,8 56.9% 57.0% 57.6%
Ratio of potentially preventable hospitalisations (PPH) - rate of Aboriginal and Torres Strait Islander hospitalisations to rate of non-Aboriginal and Torres Strait Islander hospitalisations9 1.7 1.8 1.7
Percentage of women who, during their pregnancy, were smoking after 20 weeks10,11
-Aboriginal and Torres Strait Islander women 7.0% 7.0% 7.4%12 31.0% 38.0% 31.0%
Percentage of women who attended at least 5 antenatal visits and gave birth at 32 weeks or more gestation10,11
-Aboriginal and Torres Strait Islander women 96.7% 96.8% 96.5%
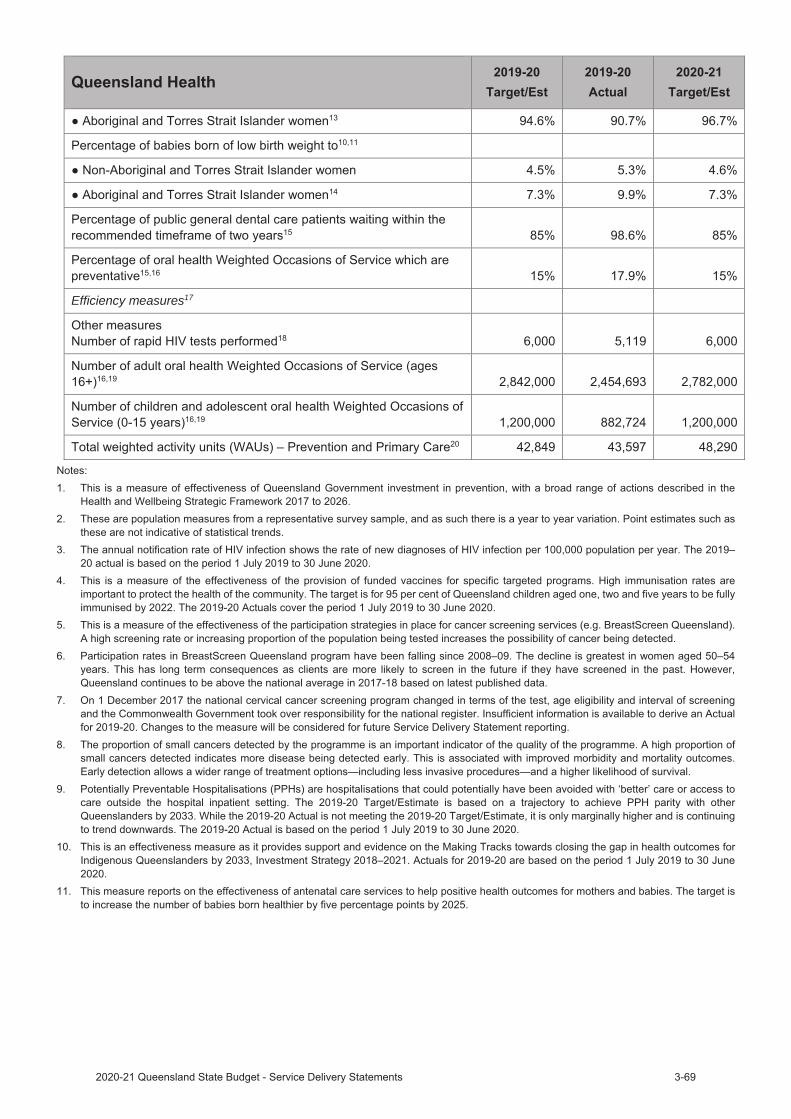
Efficiency measures17
12. While the 2019-20 Actual is not in line with the 2019-20 Target/Estimate, rates of smoking in pregnant Aboriginal and Torres Strait Islander women post 20 weeks gestation have been decreasing since 2005–06 when the rate was 51.8 per cent, representing an average decrease of approximately one per cent per annum. If the current rate of decline continues, the target rate will be achieved in the mid 2020s. Reducing rates of smoking during pregnancy remains a challenge due to high rates of smoking in the broader Aboriginal and Torres Strait Islander population. Initiatives underway to accelerate the rate of change include the Smoking Cessation Quality Improvement Payment (QIP) and Making Tracks smoking cessation investment.
13. While the 2019-20 Actual is not in line with the 2019-20 Target/Estimate, a number of the HHSs have reached the target and overtime there has been sustained long term improvement in the proportion of Aboriginal and Torres Strait Islander women attending five or more antenatal appointments since 2002–03 when the rate was 76.7 per cent. To improve the statewide rate of access to antenatal care, there will be a renewed focus on those HHSs which are currently not meeting the target through existing Making Tracks investment in maternal health services.
14. Low birth weight of babies born to Aboriginal and Torres Strait Islander mothers remains a significant challenge. To achieve sustainable gains in birth weight outcomes a focus must remain on supporting women and communities to addressing risk factors before and during pregnancy, including maternal smoking, infections and hypertension. As smoking rates in Aboriginal and Torres Strait Islander women who are pregnant are declining, it is likely this will have a positive impact on the percentage of babies born of low birth weight. The 2019-20Estimated Actual is based on the period 1 July 2019 to 30 June 2020.
15. This is a measure of effectiveness for improving and maintaining the health of teeth, gums and soft tissues within the mouth, which has general health benefits. A higher rate suggests effective strategies are in place for ensuring access to preventive oral health.
16. An oral health Weighted Occasion of Service (WOoS) is a measure of activity and weights occasions of service based on their complexity to provide a common unit of comparison for oral health services.
17. An efficiency measure is being developed for this service and will be included in a future Service Delivery Statement.18. The rapid test is used for screening for HIV and produces a result in 30 minutes or less. The 2019-20 actual is based on the period 1 July
2019 to 30 June 2020.19. Actuals for 2019-20 are based on actual performance from 1 July 2019 to 30 June 2020. 2019-20 Actual were significantly lower than 2019-
20 Targets/Estimates primarily due to the impact of the COVID-19 pandemic from late March 2020. The Australian Health Protection Principal Committee issued a number of national restrictions of dental services from 25 March 2020. Even with easing of restrictions from 11 May 2020, additional patient screening. social distancing, infection control and other COVID-19-related measures continued to impact on the delivery of oral health services.
20. A WAU is a measure of complexity and volume (i.e. activity) and provides a common unit of comparison so that fairer comparisons can be made across differing clinical services. Service Agreements between the Department of Health and HHSs and other organisations specify the activity to be provided in WAUs by service type. The 2019-20 Target/Estimate varies from the published 2019-20 Service Delivery Statement due to a change in the WAU phase. All measures are reported in WAU phase Q22.

2019–20 Service Delivery Statements
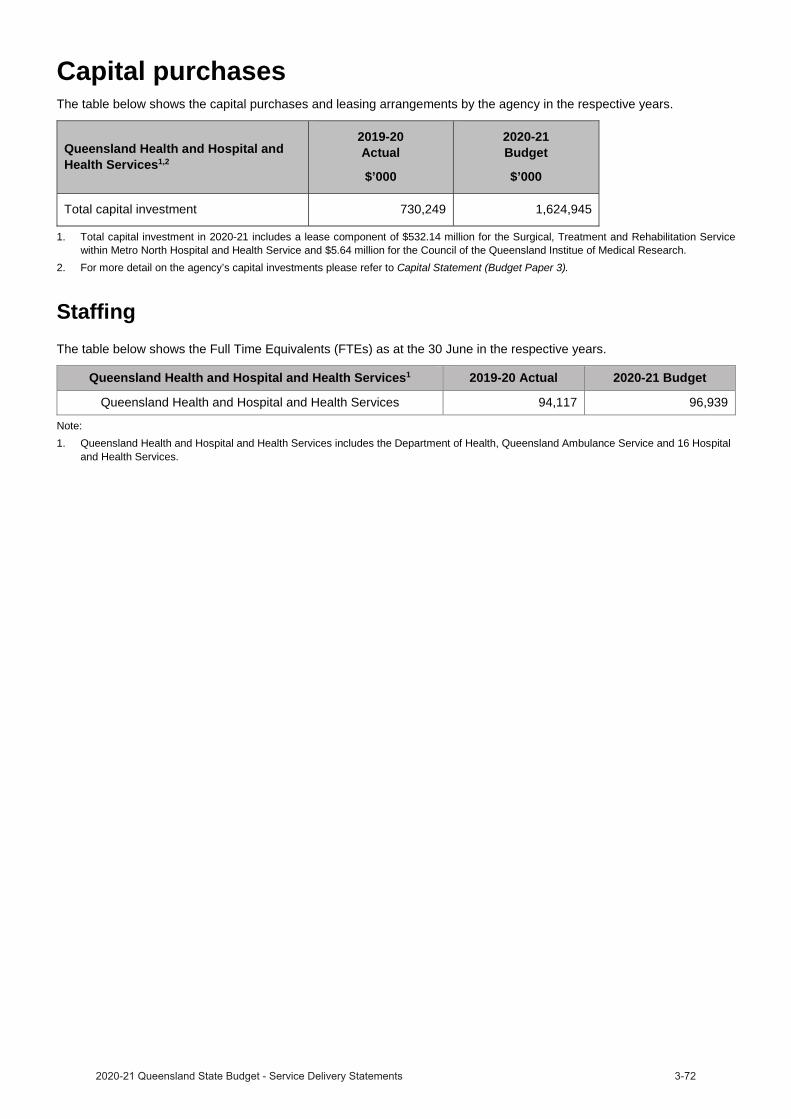
Capital purchasesThe table below shows the capital purchases and leasing arrangements by the agency in the respective years.
Queensland Health and Hospital and Health Services1,2
2019-20Actual
$’000
2020-21Budget
$’000
Total capital investment 730,249 1,624,945
1. Total capital investment in 2020-21 includes a lease component of $532.14 million for the Surgical, Treatment and Rehabilitation Service within Metro North Hospital and Health Service and $5.64 million for the Council of the Queensland Institue of Medical Research.
2. For more detail on the agency’s capital investments please refer to Capital Statement (Budget Paper 3).
StaffingThe table below shows the Full Time Equivalents (FTEs) as at the 30 June in the respective years.
Queensland Health and Hospital and Health Services1 2019-20 Actual 2020-21 Budget
Queensland Health and Hospital and Health Services 94,117 96,939
Note:1. Queensland Health and Hospital and Health Services includes the Department of Health, Queensland Ambulance Service and 16 Hospital
and Health Services.
Budgeted financial statement
tatement2020-21 total expenses are estimated to be $20.199 billion, representing an increase of $743.488 million or 3.8 per cent, from the 2019-20 actual.
The 2020-21 budget supports the growing demand for public hospital and health services along with meeting critical service needs. Increased expenditure includes the workforce requirements to meet the ongoing growth in demand for frontline health services, including the ongoing response to COVID-19 and depreciation.
The department's revenue has grown since the end of 2019-20 due to ongoing COVID-19 response funding, general growth funding in response to increasing service demands and the reprovision of prior year's funding.
Queensland Health's budgeted Income Statement, inclusive of the Department of Health, Queensland Ambulance Service and the Hospital and Health Services, is provided below.
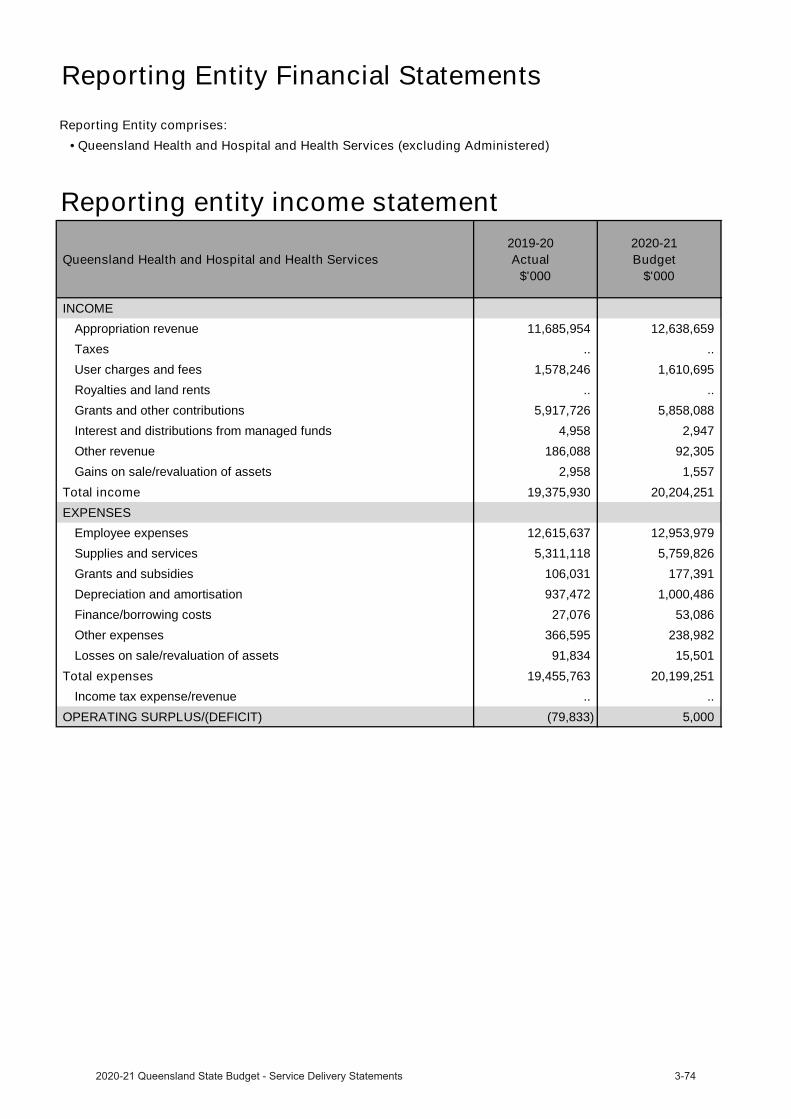
Reporting Entity Financial StatementsReporting Entity comprises:
• Queensland Health and Hospital and Health Services (excluding Administered)
Reporting entity income statement
Queensland Health and Hospital and Health Services 2019-20
Actual$'000
2020-21 Budget
$'000
INCOMEAppropriation revenue 11,685,954 12,638,659 Taxes .. .. User charges and fees 1,578,246 1,610,695 Royalties and land rents .. .. Grants and other contributions 5,917,726 5,858,088 Interest and distributions from managed funds 4,958 2,947 Other revenue 186,088 92,305 Gains on sale/revaluation of assets 2,958 1,557
Total income 19,375,930 20,204,251 EXPENSES
Employee expenses 12,615,637 12,953,979 Supplies and services 5,311,118 5,759,826 Grants and subsidies 106,031 177,391 Depreciation and amortisation 937,472 1,000,486 Finance/borrowing costs 27,076 53,086 Other expenses 366,595 238,982 Losses on sale/revaluation of assets 91,834 15,501
Total expenses 19,455,763 20,199,251 Income tax expense/revenue .. ..
OPERATING SURPLUS/(DEFICIT) (79,833) 5,000
Department of Health overviewThe Department of Health’s (the department) vision for healthier Queenslanders is being achieved by providing leadership, direction, and working collaboratively to enable the health system to deliver quality services that are safe and responsive for all Queenslanders.
The Department of Health contributes to the implementation of Queensland’s Economic Recovery Plan and is working to protect Queenslanders and save lives, to Unite & Recover for Queensland jobs.
The Department of Health is working towards Safeguarding the health of Queenslanders through:
the activation of the State Health Emergency Coordination Centre (SHECC) as the emergency coordination centre, with a central role in coordination of information, reporting, planning and logistic support to operations.
the restoration of planned care performance, with Hospital and Health Services developing plans and strategies to utilise funding and restore planned care performance to pre COVID-19 levels.
expanding the digital platform capability to support effective implementation and compliance of public health directions relating to COVID-19, as well as establishing Queensland Health fever clinics throughout the state.
enhancing SARS-CoV-2 testing capability in Queensland Health laboratories.
the establishment of a temporary COVID-19 Supply Chain Surety Division to coordinate and focus the department’s efforts to the supply response for personal protective equipment and other critical medical supplies.
supporting the implementation of the Border restrictions Direction by processing enquiries and exemption requests, which require careful assessment or clinical consideration, across a large number of affected stakeholders and sectors.
In 2020-21, the Department of Health is working towards its objectives:
promote and protect the health of Queenslanders where they live, work and play.
drive the safest and highest quality services possible.
improve access to health services for disadvantaged Queenslanders.
pursue partnerships with consumers, communities, health and other organisations to help achieve our goals.
empower consumers and health professionals through the availability and use of data and digital innovations.
set the agenda through integrated policy, planning, funding and implementation efforts.
lead a workforce which is excellent and has a vibrant culture and workplace environment.
The Department of Health will deliver the following services in 2020-21 for Queensland Health Corporate and Clinical Support – to support the delivery of safe and responsive services for Queenslanders.
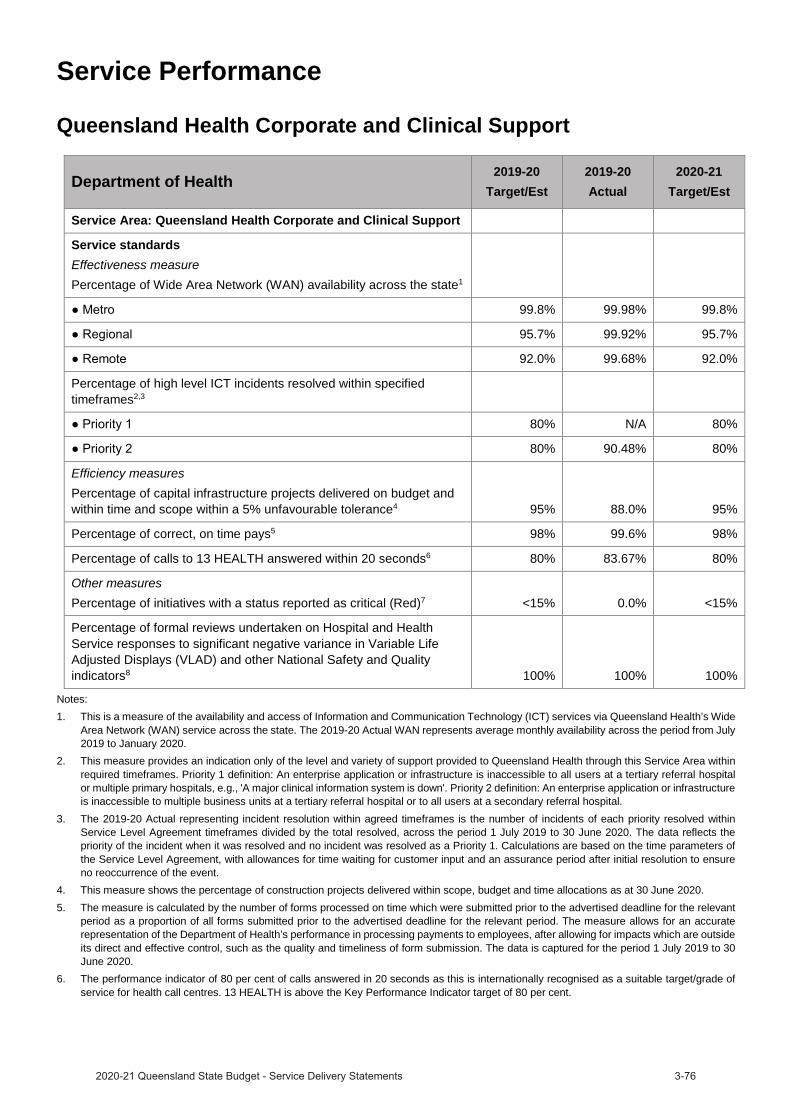
Service Performance
Queensland Health Corporate and Clinical Support
Department of Health 2019-20Target/Est
2019-20Actual
2020-21Target/Est
Service Area: Queensland Health Corporate and Clinical Support
Service standardsEffectiveness measurePercentage of Wide Area Network (WAN) availability across the state1
99.8% 99.98% 99.8%
95.7% 99.92% 95.7%
92.0% 99.68% 92.0%
Percentage of high level ICT incidents resolved within specified timeframes2,3
80% N/A 80%
80% 90.48% 80%
Efficiency measuresPercentage of capital infrastructure projects delivered on budget and within time and scope within a 5% unfavourable tolerance4 95% 88.0% 95%
Percentage of correct, on time pays5 98% 99.6% 98%
Percentage of calls to 13 HEALTH answered within 20 seconds6 80% 83.67% 80%
Other measuresPercentage of initiatives with a status reported as critical (Red)7 <15% 0.0% <15%
Percentage of formal reviews undertaken on Hospital and Health Service responses to significant negative variance in Variable Life Adjusted Displays (VLAD) and other National Safety and Quality indicators8 100% 100% 100%
Notes:1. This is a measure of the availability and access of Information and Communication Technology (ICT) services via Queensland Health’s Wide
Area Network (WAN) service across the state. The 2019-20 Actual WAN represents average monthly availability across the period from July 2019 to January 2020.
2. This measure provides an indication only of the level and variety of support provided to Queensland Health through this Service Area withinrequired timeframes. Priority 1 definition: An enterprise application or infrastructure is inaccessible to all users at a tertiary referral hospital or multiple primary hospitals, e.g., 'A major clinical information system is down'. Priority 2 definition: An enterprise application or infrastructure is inaccessible to multiple business units at a tertiary referral hospital or to all users at a secondary referral hospital.
3. The 2019-20 Actual representing incident resolution within agreed timeframes is the number of incidents of each priority resolved within Service Level Agreement timeframes divided by the total resolved, across the period 1 July 2019 to 30 June 2020. The data reflects the priority of the incident when it was resolved and no incident was resolved as a Priority 1. Calculations are based on the time parameters of the Service Level Agreement, with allowances for time waiting for customer input and an assurance period after initial resolution to ensure no reoccurrence of the event.
4. This measure shows the percentage of construction projects delivered within scope, budget and time allocations as at 30 June 2020. 5. The measure is calculated by the number of forms processed on time which were submitted prior to the advertised deadline for the relevant
period as a proportion of all forms submitted prior to the advertised deadline for the relevant period. The measure allows for an accurate representation of the Department of Health’s performance in processing payments to employees, after allowing for impacts which are outside its direct and effective control, such as the quality and timeliness of form submission. The data is captured for the period 1 July 2019 to 30 June 2020.
6. The performance indicator of 80 per cent of calls answered in 20 seconds as this is internationally recognised as a suitable target/grade of service for health call centres. 13 HEALTH is above the Key Performance Indicator target of 80 per cent.
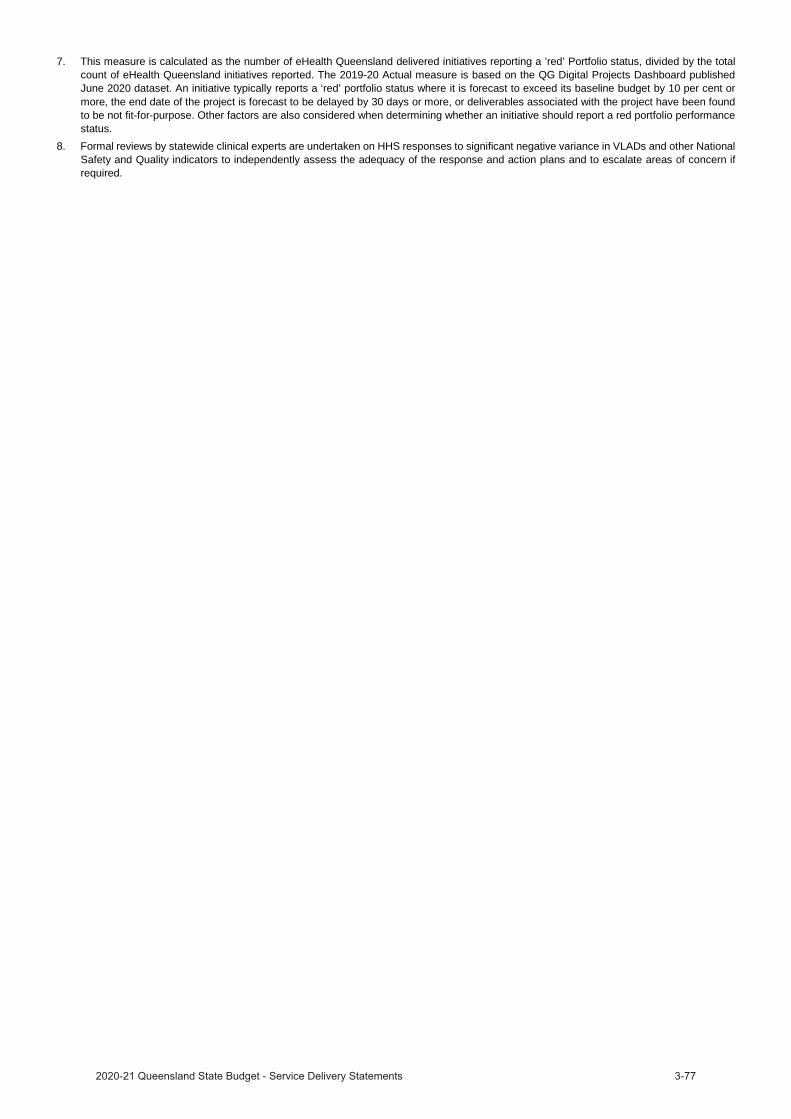
7. This measure is calculated as the number of eHealth Queensland delivered initiatives reporting a ’red’ Portfolio status, divided by the total count of eHealth Queensland initiatives reported. The 2019-20 Actual measure is based on the QG Digital Projects Dashboard published June 2020 dataset. An initiative typically reports a ‘red’ portfolio status where it is forecast to exceed its baseline budget by 10 per cent or more, the end date of the project is forecast to be delayed by 30 days or more, or deliverables associated with the project have been found to be not fit-for-purpose. Other factors are also considered when determining whether an initiative should report a red portfolio performance status.
8. Formal reviews by statewide clinical experts are undertaken on HHS responses to significant negative variance in VLADs and other National Safety and Quality indicators to independently assess the adequacy of the response and action plans and to escalate areas of concern if required.

Controlled income statement
Queensland Health 2019-20
Actual$'000
2020-21 Budget
$'000
INCOMEAppropriation revenue 11,685,954 12,638,659
Taxes .. ..
User charges and fees 4,344,187 11,416,636
Royalties and land rents .. ..
Grants and other contributions 5,570,018 5,645,020
Interest and distributions from managed funds 2,581 617
Other revenue 114,410 25,796
Gains on sale/revaluation of assets 1,022 1,243
Total income 21,718,172 29,727,971 EXPENSES
Employee expenses 4,352,047 11,146,252
Supplies and services 16,968,713 18,067,555
Grants and subsidies 90,764 162,857
Depreciation and amortisation 144,624 170,434
Finance/borrowing costs 735 1,165
Other expenses 105,606 173,364
Losses on sale/revaluation of assets 53,508 1,344
Total expenses 21,715,997 29,722,971 OPERATING SURPLUS/(DEFICIT) 2,175 5,000
Notes:Effective 25 June 2020, the Director-General Queensland Health became the employer of all non-executive Hospital and Health Service(HHS) staff.
2. 2020-21 Total Income and Total Expenditure is higher due to the change in prescribed employer arrangements. These entries areeliminated in the Queensland Health and consolidated entity.
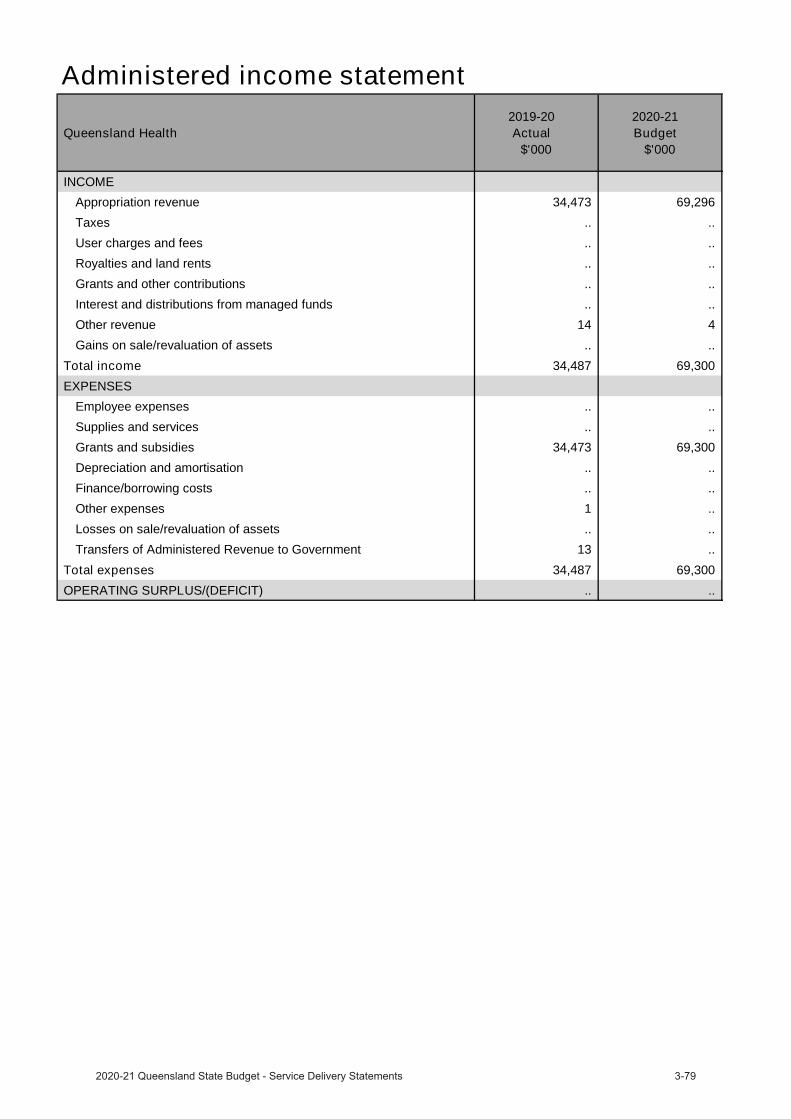
Administered income statement
Queensland Health 2019-20
Actual$'000
2020-21 Budget
$'000
INCOMEAppropriation revenue 34,473 69,296
Taxes .. ..
User charges and fees .. ..
Royalties and land rents .. ..
Grants and other contributions .. ..
Interest and distributions from managed funds .. ..
Other revenue 14 4
Gains on sale/revaluation of assets .. ..
Total income 34,487 69,300 EXPENSES
Employee expenses .. ..
Supplies and services .. ..
Grants and subsidies 34,473 69,300
Depreciation and amortisation .. ..
Finance/borrowing costs .. ..
Other expenses 1 ..
Losses on sale/revaluation of assets .. ..
Transfers of Administered Revenue to Government 13 ..
Total expenses 34,487 69,300 OPERATING SURPLUS/(DEFICIT) .. ..
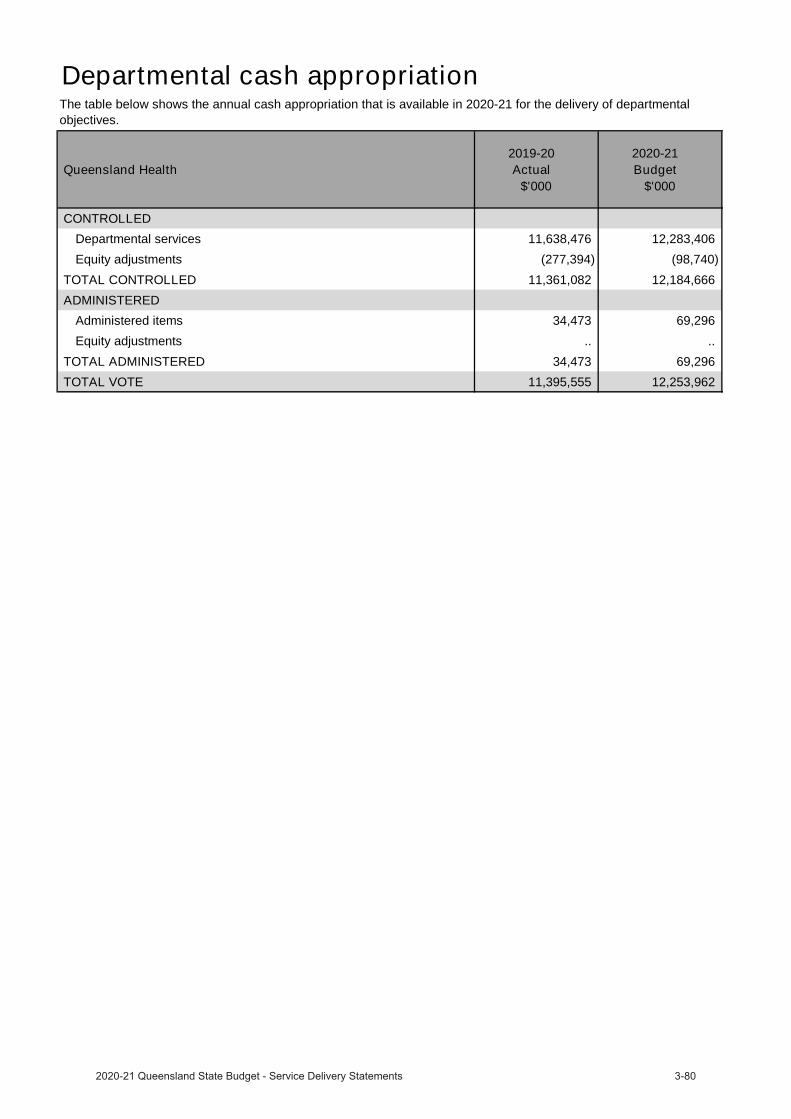
Departmental cash appropriation
Queensland Health 2019-20
Actual$'000
2020-21 Budget
$'000
CONTROLLEDDepartmental services 11,638,476 12,283,406
Equity adjustments (277,394) (98,740)
TOTAL CONTROLLED 11,361,082 12,184,666 ADMINISTERED
Administered items 34,473 69,296
Equity adjustments .. ..
TOTAL ADMINISTERED 34,473 69,296 TOTAL VOTE 11,395,555 12,253,962
The table below shows the annual cash appropriation that is available in 2020-21 for the delivery of departmental objectives.
Queensland Ambulance Service
OverviewThe Queensland Ambulance Service (QAS) is an integral part of the primary health care sector in Queensland. The QAS’s mission is to deliver timely, quality and appropriate, patient-focused ambulance services to the Queensland community. Established by the Ambulance Service Act 1991, the QAS operates as a statewide service within Queensland Health, and is accountable for the delivery of pre-hospital ambulance response services, emergency and non-emergency pre-hospital patient care and transport services, inter-facility ambulance transport, casualty room services, and planning and coordination of multi-casualty incidents and disasters.
The QAS delivers ambulance services from 301 response locations across Queensland. Statewide ambulance services are coordinated through operations centres (OpCens). There are eight OpCens throughout Queensland that are responsible for emergency call taking, operational deployment and dispatch and coordination of non-urgent patient transport services.
The QAS contributes to the implementation of Queensland’s Economic Recovery Plan and is working to protect Queenslanders and save lives, to Unite & Recover for Queensland jobs.
The QAS will deliver services in 2020-21 to provide timely, quality and appropriate, patient-focused ambulance services to the Queensland community.

Service Performance
Queensland Ambulance Service 2019-20Target/Est
2019-20Actual
2020-21Target/Est
Service standardsEffectiveness measuresTime within which code 1 incidents are attended1,2,3
Code 1A 8.2 7.5 8.2
Code 1B 8.2 9.1 8.2
Code 1C 8.2 9.7 8.2
Code 1A 16.5 14.3 16.5
Code 1B 16.5 17.4 16.5
Code 1C 16.5 19.0 16.5
Percentage of Triple Zero (000) calls answered within 10 seconds 90% 91.3% 90%
Percentage of non-urgent incidents attended to by the appointment time2
70% 82.5% 70%
Percentage of patients who report a clinically meaningful pain reduction4
85% 82.9% 85%
Patient experience5,6 97% 96.0% 97%
Efficiency measureGross cost per incident7 $744 $760 $760
Notes:1. The time within which Code 1 incidents are attended is referred to as the ‘Response time’. Response time is defined as the time taken
between the initial receipt of the call for an emergency ambulance at the communications centre and the arrival of the first responding ambulance resource at the scene of an incident: 1A—Acute time critical, where a patient presents with abnormal or absent vital signs; or1B—Emergent time critical, where a patient has a pattern of injury or significant illness that has a high probability of deterioration; or1C—Potential time critical, where a patient does not present with a pattern of injury or significant illness but has a significant mechanism of injury or history that indicates a high potential for deterioration.
2. An incident is an event that results in one or more responses by the ambulance service.3. In 2019–20, the QAS responded to 417,677 Code 1 incidents, representing a 4.2 per cent increase from 2018–19. 4. Clinically meaningful pain reduction is defined as a minimum two-point reduction in pain score from first to final recorded measurement.
Includes patients aged 16 years and over who received care from the ambulance service which included the administration of pain medication (analgesia). Includes patients where at least two pain scores (pre- and post-treatment) were recorded and, on a numeric rating scale of one to 10, the initial pain score was at least seven.
5. Prior reporting periods have utilised ‘Patient Satisfaction’ as the service standard, which was amended to ‘Patient Experience’ in 2018–19reporting period to better clarify what is being measured. This is a change to wording only, the calculation methodology remains unchanged.
6. Overall satisfaction score is reported as ‘Patient Satisfaction’ from one single question from the Council of Ambulance Authorities National Patient Satisfaction Survey Questionnaire (Q10. How satisfied were you overall with your last experience using the Ambulance Service). This is the total number of patients who were either 'satisfied' or 'very satisfied' with ambulance services they had received, divided by the total number of patients that responded to the National Patient Satisfaction Survey of the Council of Ambulance Authorities. However, it should be noted that internal reporting of satisfaction is undertaken across multiple separate components of the patient’s experience to indicate the factors impacting on the overall satisfaction score on a year-by-year basis. The 2019–20 Actual figure was obtained from the CAA Report released in November 2019.
7. This measure reports ambulance service expenditure divided by the number of incidents. The increase in the 2019-20 Actual for cost per incident relates to additional costs incurred due to Covid-19 resourcing and preparations coupled with reduced overall demand in the period March to June 2020.
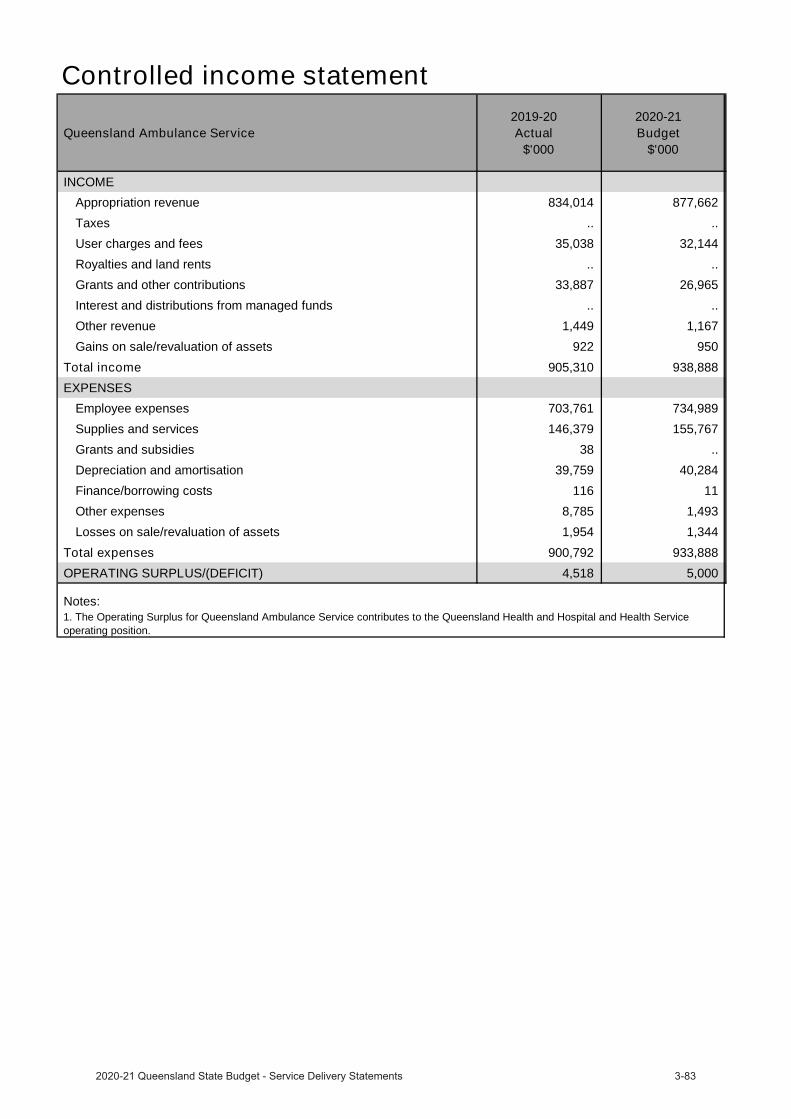
Controlled income statement
Queensland Ambulance Service 2019-20
Actual$'000
2020-21 Budget
$'000
INCOMEAppropriation revenue 834,014 877,662
Taxes .. ..
User charges and fees 35,038 32,144
Royalties and land rents .. ..
Grants and other contributions 33,887 26,965
Interest and distributions from managed funds .. ..
Other revenue 1,449 1,167
Gains on sale/revaluation of assets 922 950
Total income 905,310 938,888 EXPENSES
Employee expenses 703,761 734,989
Supplies and services 146,379 155,767
Grants and subsidies 38 ..
Depreciation and amortisation 39,759 40,284
Finance/borrowing costs 116 11
Other expenses 8,785 1,493
Losses on sale/revaluation of assets 1,954 1,344
Total expenses 900,792 933,888 OPERATING SURPLUS/(DEFICIT) 4,518 5,000
Notes:1. The Operating Surplus for Queensland Ambulance Service contributes to the Queensland Health and Hospital and Health Service operating position.
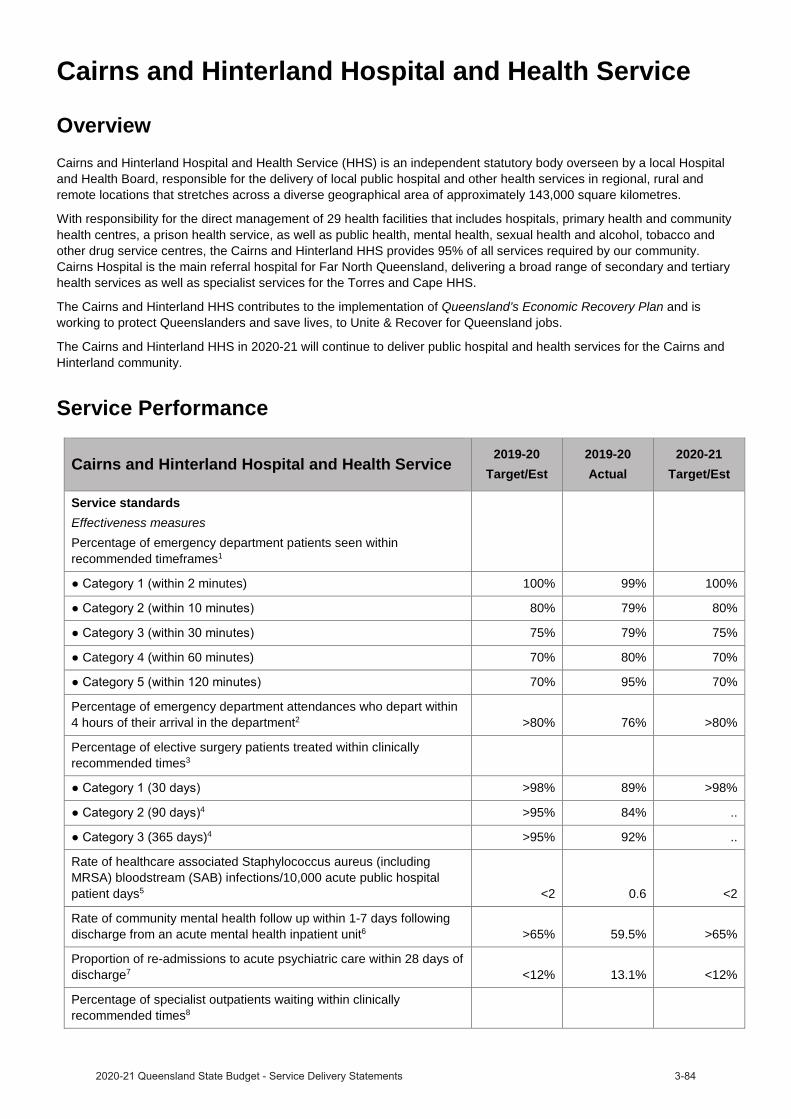
Cairns and Hinterland Hospital and Health Service
OverviewCairns and Hinterland Hospital and Health Service (HHS) is an independent statutory body overseen by a local Hospital and Health Board, responsible for the delivery of local public hospital and other health services in regional, rural and remote locations that stretches across a diverse geographical area of approximately 143,000 square kilometres.
With responsibility for the direct management of 29 health facilities that includes hospitals, primary health and community health centres, a prison health service, as well as public health, mental health, sexual health and alcohol, tobacco and other drug service centres, the Cairns and Hinterland HHS provides 95% of all services required by our community. Cairns Hospital is the main referral hospital for Far North Queensland, delivering a broad range of secondary and tertiary health services as well as specialist services for the Torres and Cape HHS.
The Cairns and Hinterland HHS contributes to the implementation of Queensland’s Economic Recovery Plan and is working to protect Queenslanders and save lives, to Unite & Recover for Queensland jobs.
The Cairns and Hinterland HHS in 2020-21 will continue to deliver public hospital and health services for the Cairns and Hinterland community.
Service Performance
Cairns and Hinterland Hospital and Health Service2019-20
Target/Est2019-20Actual
2020-21Target/Est
Service standardsEffectiveness measuresPercentage of emergency department patients seen within recommended timeframes1
minutes) 100% 99% 100%
80% 79% 80%
75% 79% 75%
Category 4 (within 60 minutes) 70% 80% 70%
70% 95% 70%
Percentage of emergency department attendances who depart within 4 hours of their arrival in the department2 >80% 76% >80%
Percentage of elective surgery patients treated within clinically recommended times3
>98% 89% >98%4 >95% 84% ..
(365 days)4 >95% 92% ..
Rate of healthcare associated Staphylococcus aureus (including MRSA) bloodstream (SAB) infections/10,000 acute public hospital patient days5 <2 0.6 <2
Rate of community mental health follow up within 1-7 days following discharge from an acute mental health inpatient unit6 >65% 59.5% >65%
Proportion of re-admissions to acute psychiatric care within 28 days of discharge7 <12% 13.1% <12%
Percentage of specialist outpatients waiting within clinically recommended times8
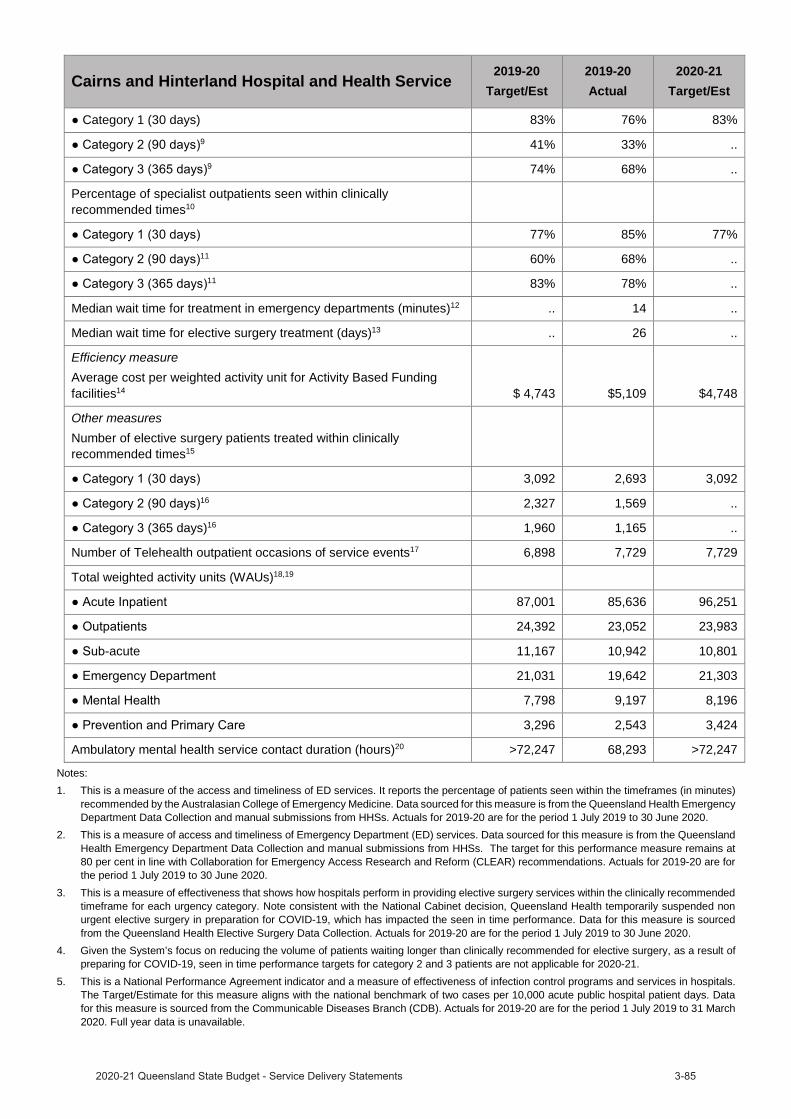
Cairns and Hinterland Hospital and Health Service2019-20
Target/Est2019-20Actual
2020-21Target/Est
Category 1 (30 days) 83% 76% 83%9 41% 33% ..
9 74% 68% ..
Percentage of specialist outpatients seen within clinically recommended times10
77% 85% 77%11 60% 68% ..
11 83% 78% ..
Median wait time for treatment in emergency departments (minutes)12 .. 14 ..
Median wait time for elective surgery treatment (days)13 .. 26 ..
Efficiency measureAverage cost per weighted activity unit for Activity Based Funding facilities14 $ 4,743 $5,109 $4,748
Other measuresNumber of elective surgery patients treated within clinically recommended times15
3,092 2,693 3,09216 2,327 1,569 ..
(365 days)16 1,960 1,165 ..
Number of Telehealth outpatient occasions of service events17 6,898 7,729 7,729
Total weighted activity units (WAUs)18,19
87,001 85,636 96,251
24,392 23,052 23,983
-acute 11,167 10,942 10,801
21,031 19,642 21,303
7,798 9,197 8,196
3,296 2,543 3,424
Ambulatory mental health service contact duration (hours)20 >72,247 68,293 >72,247
Notes:1. This is a measure of the access and timeliness of ED services. It reports the percentage of patients seen within the timeframes (in minutes)
recommended by the Australasian College of Emergency Medicine. Data sourced for this measure is from the Queensland Health Emergency Department Data Collection and manual submissions from HHSs. Actuals for 2019-20 are for the period 1 July 2019 to 30 June 2020.
2. This is a measure of access and timeliness of Emergency Department (ED) services. Data sourced for this measure is from the Queensland Health Emergency Department Data Collection and manual submissions from HHSs. The target for this performance measure remains at 80 per cent in line with Collaboration for Emergency Access Research and Reform (CLEAR) recommendations. Actuals for 2019-20 are for the period 1 July 2019 to 30 June 2020.
3. This is a measure of effectiveness that shows how hospitals perform in providing elective surgery services within the clinically recommended timeframe for each urgency category. Note consistent with the National Cabinet decision, Queensland Health temporarily suspended non urgent elective surgery in preparation for COVID-19, which has impacted the seen in time performance. Data for this measure is sourced from the Queensland Health Elective Surgery Data Collection. Actuals for 2019-20 are for the period 1 July 2019 to 30 June 2020.
4. Given the System’s focus on reducing the volume of patients waiting longer than clinically recommended for elective surgery, as a result of preparing for COVID-19, seen in time performance targets for category 2 and 3 patients are not applicable for 2020-21.
5. This is a National Performance Agreement indicator and a measure of effectiveness of infection control programs and services in hospitals. The Target/Estimate for this measure aligns with the national benchmark of two cases per 10,000 acute public hospital patient days. Data for this measure is sourced from the Communicable Diseases Branch (CDB). Actuals for 2019-20 are for the period 1 July 2019 to 31 March 2020. Full year data is unavailable.
6. This is a measure of the community support system that is in place for persons who have experienced an acute psychiatric episode requiring hospitalisation. Persons leaving hospital after a psychiatric admission with a formal discharge plan, involving linkages with community services and supports, are less likely to need early readmission. This service standard aligns with the Aboriginal and Torres Strait Islander Mental Health Strategy 2016–2021 and previous analysis has shown that there are statistically similar rates of follow up for Indigenous and non-Indigenous Queenslanders. Data for this measure is sourced from the Mental Health Alcohol and Other Drugs Branch. Actuals for 2019-20 are for the period 1 July 2019 to 30 June 2020.
7. Persons leaving hospital after a psychiatric admission with a formal discharge plan, involving linkages with community services and supports, are less likely to need early readmission. Previous analysis has shown similar rates of follow up for both Indigenous and non-Indigenous Queenslander’s are evident, but trends are impacted by a smaller number of separations for Indigenous Queenslanders. Data for this measure is sourced from the Mental Health Alcohol and Other Drugs Branch. Actuals for 2019-20 are for the period 1 July 2019 to 30 June 2020.
8. This is a measure of effectiveness that shows the percentage of patients waiting to have their first appointment (from the time of referral) with the health professional in an outpatient clinic, who were within the clinically recommended time. Specialist Outpatient volumes of waiting and seen are based on care provided/waiting at a Queensland Public Hospital and do not include activity undertaken by non-Queensland Health facilities. In preparation for COVID-19, Queensland Health temporarily suspended non urgent specialist outpatient services, which has impacted the percentage of patients waiting within the clinically recommended time. Data for this measure was sourced from the Queensland Health Specialist Outpatient Data Collection. Actuals for 2019-20 are as at 1 July 2020.
9. Given the System’s focus on reducing the volume of patients waiting longer than clinically recommended for specialist outpatients, as a result of preparing for COVID-19, wait in time performance targets for category 2 and 3 patients are not applicable for 2020-21.
10. This is a measure of effectiveness that shows the percentage of patients who were seen within clinically recommended times. As a result of preparing for COVID-19, the seen in time performance has been impacted. Actuals for 2019-20 are for the period 1 July 2019 to 30 June 2020.
11. Given the System’s focus on reducing the volume of patients waiting longer than clinically recommended for specialist outpatients, as a result of preparing for COVID-19, seen in time performance targets for category 2 and 3 patients are not applicable for 2020-21.
12. This measure indicates the length of time within which half of all people were seen in the ED (for all categories), from the time of presentation to being seen by a nurse or doctor (whichever was first). The target for this measure was removed from 2018–19. There is no nationally agreed target for this measure, and the median wait time varies depending on the proportion of patients in each urgency category. Data for this measure was sourced from the Queensland Health Emergency Department Data Collection. Actuals for 2019-20 are for the period 1 July 2019 to 30 June 2020.
13. There are no Target/Estimates as there is no national benchmark target for this measure, and the median wait time varies depending on the proportion of patients in each urgency category. Performance was impacted by the temporary suspension of non urgent elective surgery in preparation for COVID-19. Data for this measure is sourced from the Queensland Health Elective Surgery Data Collection. Actuals for 2019-20 are for the period 1 July 2019 to 30 June 2020.
14. Cost per WAU excludes Prevention and Primary Care, Specified Grants, and Clinical Education and Training. The introduction of a revised Australian Coding Standard “0002 Additional diagnoses” from 1 July 2019, resulted in lower weighted activity units being calculated for admitted patients relative to the same casemix of 2018-19 year. Furthermore, the additional costs of the COVID-19 pandemic costs and the temporary suspension of non urgent planned care services which reduced the volume of patient activity, contributed to the difference in Cost per WAU. The 2019-20 Actual is based on 1 July 2019 to 30 June 2020 ABF cost per WAU. The 2020-21 Target/Estimate is based on 2020-21 ABF funding per WAU.
15. This is a measure of activity that reports the number of elective surgery patients who were treated within the clinically recommended time in each category. It shows the volume and timeliness of elective surgery services. Consistent with the National Cabinet decision, Queensland Health temporarily suspended non urgent elective surgery in preparation for COVID-19, which has impacted the volume of elective surgery performed. Data for this measure is sourced from the Queensland Elective Surgery Data Collection. Actuals for 2019-20 are for the period 1 July 2019 to 30 June 2020.
16. Given the System’s focus on reducing the volume of patients waiting longer than clinically recommended for elective surgery, as a result of preparing for COVID-19, the volume of patients treated within clinically recommended time performance targets for category 2 and 3 patients are not applicable for 2020-21.
17. This measure tracks the growth in non-admitted patient (outpatient) telehealth service events. Rapid uptake in telemedicine occurred as a result of preparing for COVID-19. Data for this measure is sourced from the Monthly Activity Collection. Actuals for 2019-20 are for the period 1 July 2019 to 30 June 2020.
18. A WAU is a measure of complexity and volume (i.e. activity) and provides a common unit of comparison so that fairer comparisons can be made across differing clinical services. Service Agreements between the Department of Health and HHSs and other organisations specify the activity to be provided in WAUs by service type. Actual data for 2019-20 is preliminary. The service agreement category ‘Total WAUs—Interventions and procedures’ has been reallocated between ‘Total WAUs—Acute Inpatient Care’ and ‘Total WAUs—Outpatient Care’ based on individual HHS Inpatient vs Outpatient proportions. Delivery of activity and weighted activity units was impacted by two significant factors in 2019-20; the introduction of a revised Australian Coding Standard “0002 Additional diagnoses” from 1 July 2019 (which resulted in lower weighted activity units being calculated for admitted patients relative to the same casemix period of 2018-19 year) and COVID-19 preparation, (for example the temporary suspension of non urgent planned care services) reduced the volume of patient activity. Data for this measure is sourced from GENWAU. Actuals for 2019-20 are for the period 1 July 2019 to 30 June 2020.
19. The activity targets in 2020-21 are in QWAU Phase 22 and include activity that will be generated from the $250 million Planned Care Recovery Investment Strategy.
20. This measure counts the number of in-scope ambulatory mental health service contact hours, based on the national definition and calculation of service contacts and duration. The 2019-20 Target/Estimate is calculated based on available clinician hours multiplied by an agreed output factor and weighted for locality. Data for this measure is sourced from the Mental Health Alcohol and Other Drugs Branch. Actuals for 2019-20 are for the period 1 July 2019 to 30 June 2020.

Income statement
Cairns and Hinterland Hospital and Health Service 2019-20
Actual$'000
2020-21 Budget
$'000
INCOMEUser charges and fees 1,031,617 1,032,802
Grants and other contributions 15,145 11,548
Interest and distributions from managed funds 47 41
Other revenue 9,958 6,920
Gains on sale/revaluation of assets .. ..
Total income 1,056,767 1,051,311 EXPENSES
Employee expenses 123,674 126,489
Supplies and Services:
Other supplies and services 236,587 224,929
Department of Health contract staff 618,766 623,097
Grants and subsidies .. ..
Depreciation and amortisation 58,111 56,274
Finance/borrowing costs .. ..
Other expenses 18,368 18,736
Losses on sale/revaluation of assets 1,206 1,786
Total expenses 1,056,712 1,051,311 OPERATING SURPLUS/(DEFICIT) 55 ..

Central Queensland Hospital and Health Service
OverviewCentral Queensland Hospital and Health Service (HHS) is an independent statutory body overseen by a local Hospital and Health Board. The Central Queensland HHS is responsible for providing public hospital and health services including medical, surgical, emergency, obstetrics, paediatrics, specialist outpatient clinics, mental health, critical care, clinical support services and older person accommodation.
The Central Queensland HHS contributes to the implementation of Queensland’s Economic Recovery Plan and is working to protect Queenslanders and save lives, to Unite & Recover for Queensland jobs.
The Central Queensland HHS strategic vision is Great Care for Central Queenslanders. Our purpose is to have great people, delivering great quality care and improving health. The HHS’s strategy shapes the future of healthcare across the region and supports our aim for Central Queenslanders to be amongst the healthiest in the world.
The Central Queensland HHS in 2020-21 will continue to deliver public hospital and health services for the Central Queensland community.
Great staff delivering great care closer to home will continue to be a key focus during 2020–21.
Service Performance
Central Queensland Hospital and Health Service2019-20
Target/Est2019-20Actual
2020-21Target/Est
Service standardsEffectiveness measuresPercentage of emergency department patients seen within recommended timeframes1
minutes) 100% 100% 100%
80% 82% 80%
75% 79% 75%
Category 4 (within 60 minutes) 70% 87% 70%
70% 98% 70%
Percentage of emergency department attendances who depart within 4 hours of their arrival in the department2 >80% 81% >80%
Percentage of elective surgery patients treated within clinically recommended times3
>98% 99% >98%4 >95% 97% ..
(365 days)4 >95% 96% ..
Rate of healthcare associated Staphylococcus aureus (including MRSA) bloodstream (SAB) infections/10,000 acute public hospital patient days5 <2 0.4 <2
Rate of community mental health follow up within 1-7 days following discharge from an acute mental health inpatient unit6 >65% 65.3% >65%
Proportion of re-admissions to acute psychiatric care within 28 days of discharge7 <12% 9.5% <12%
Percentage of specialist outpatients waiting within clinically recommended times8

Central Queensland Hospital and Health Service2019-20
Target/Est2019-20Actual
2020-21Target/Est
1 (30 days) 98% 89% 98%9 95% 65% ..
9 95% 78% ..
Percentage of specialist outpatients seen within clinically recommended times10
98% 94% 98%11 95% 81% ..
11 95% 92% ..
Median wait time for treatment in emergency departments (minutes)12 .. 10 ..
Median wait time for elective surgery treatment (days)13 .. 49 ..
Efficiency measureAverage cost per weighted activity unit for Activity Based Funding facilities14 $ 4,850 $5,257 $4,794
Other measuresNumber of elective surgery patients treated within clinically recommended times15
1,876 1,725 1,87616 2,037 1,677 ..
days)16 2,160 1,322 ..
Number of Telehealth outpatient occasions of service events17 14,411 17,133 17,133
Total weighted activity units (WAUs)18,19
45,955 45,959 51,613
12,737 11,722 12,707
-acute 5,584 4,922 4,628
15,092 16,648 17,217
5,748 5,141 4,938
2,878 2,384 2,863
Ambulatory mental health service contact duration (hours)20 >38,352 43,439 >38,352
Notes:1. This is a measure of the access and timeliness of ED services. It reports the percentage of patients seen within the timeframes (in minutes)
recommended by the Australasian College of Emergency Medicine. Data sourced for this measure is from the Queensland Health Emergency Department Data Collection and manual submissions from HHSs. Actuals for 2019-20 are for the period 1 July 2019 to 30 June 2020.
2. This is a measure of access and timeliness of Emergency Department (ED) services. Data sourced for this measure is from the QueenslandHealth Emergency Department Data Collection and manual submissions from HHSs. The target for this performance measure remains at 80 per cent in line with Collaboration for Emergency Access Research and Reform (CLEAR) recommendations. Actuals for 2019-20 are for the period 1 July 2019 to 30 June 2020.
3. This is a measure of effectiveness that shows how hospitals perform in providing elective surgery services within the clinically recommendedtimeframe for each urgency category. Note consistent with the National Cabinet decision, Queensland Health temporarily suspended non urgent elective surgery in preparation for COVID-19, which has impacted the seen in time performance. Data for this measure is sourced from the Queensland Health Elective Surgery Data Collection. Actuals for 2019-20 are for the period 1 July 2019 to 30 June 2020.
4. Given the System’s focus on reducing the volume of patients waiting longer than clinically recommended for elective surgery, as a result ofpreparing for COVID-19, seen in time performance targets for category 2 and 3 patients are not applicable for 2020-21.
5. This is a National Performance Agreement indicator and a measure of effectiveness of infection control programs and services in hospitals.The Target/Estimate for this measure aligns with the national benchmark of two cases per 10,000 acute public hospital patient days. Data for this measure is sourced from the Communicable Diseases Branch (CDB). Actuals for 2019-20 are for the period 1 July 2019 to 31 March 2020. Full year data is unavailable.


Income statement
Central Queensland Hospital and Health Service 2019-20
Actual$'000
2020-21 Budget
$'000
INCOMEUser charges and fees 626,466 637,275
Grants and other contributions 21,482 20,922
Interest and distributions from managed funds 59 3
Other revenue 3,392 3,133
Gains on sale/revaluation of assets 63 ..
Total income 651,462 661,333 EXPENSES
Employee expenses 75,038 77,640
Supplies and Services:
Other supplies and services 198,983 177,859
Department of Health contract staff 355,894 364,791
Grants and subsidies 557 552
Depreciation and amortisation 24,451 31,697
Finance/borrowing costs 7 5
Other expenses 8,330 8,384
Losses on sale/revaluation of assets 3,024 405
Total expenses 666,284 661,333 OPERATING SURPLUS/(DEFICIT) (14,822) ..

Central West Hospital and Health Service
OverviewCentral West Hospital and Health Service (HHS) is a statutory body enabled under the Hospital and Health Boards Act 2011 (QLD) as the principal provider of public sector health services to the communities of Central West Queensland. Central West HHS’ vision is to be a leader in far-reaching healthcare. It is achieving this by prioritising resourcefulness to meet challenges and by demonstrating dependable and dedicated health responses in times of need. The 2019-2023Central West HHS Strategic Plan (2020 update) details priority strategies and relevant measures of success which actively support Central West HHS’s ability to meet the Vision with integrity, safety, inclusivity, diversity and innovation to achieve our priorities including but not limited to:
Strengthen partnerships with staff, communities, residents, patients and consumers to improve health outcomes. Deliver high quality, consumer focused health services. Achieve long term organisational sustainability.
The HHS supports the implementation of Queensland’s Economic Recovery Plan and is working to protect Queenslanders and save lives, to Unite & Recover for Queensland jobs.
The Central West HHS in 2020-21 will continue to deliver public hospital and health services for the Central Westcommunity.
Central West HHS has focused its planning to support the safeguarding of health whilst remaining ready to respond to any change brought about by the continuing pandemic. Central West HHS continues to review and refine its approach to attract a skilled workforce which, we recognise, is not only the basis of providing safe, quality healthcare but also the foundation of supporting our rural and remote communities in improving their future sustainability.
Service Performance
Central West Hospital and Health Service 2019-20Target/Est
2019-20Actual
2020-21Target/Est
Service standardsEffectiveness measuresPercentage of emergency department patients seen within recommended timeframes1
100% 100% 100%
80% 97% 80%
75% 97% 75%
Category 4 (within 60 minutes) 70% 99% 70%
minutes) 70% 99% 70%
Percentage of emergency department attendances who depart within 4 hours of their arrival in the department2 >80% 95% >80%
Percentage of elective surgery patients treated within clinically recommended times3
days) >98% 94% >98%4 >95% 84% ..
4 >95% 99% ..
Median wait time for treatment in emergency departments (minutes)5 .. 2 ..
Median wait time for elective surgery treatment (days)6 .. 84 ..
Efficiency measure7

Central West Hospital and Health Service2019-20
Target/Est2019-20Actual
2020-21Target/Est
Other measuresNumber of elective surgery patients treated within clinically recommended times8
41 29 419 64 48 ..
9 163 82 ..
Number of Telehealth outpatient occasions of service events10 3,592 4,211 4,211
Total weighted activity units (WAUs)11,12
1,964 1,910 2,172
1,943 1,106 1,792
-acute 244 313 259
962 985 966
90 104 91
- 168 142
Ambulatory mental health service contact duration (hours)13 >2,016 2,585 >2,016
Notes:1. This is a measure of the access and timeliness of ED services. It reports the percentage of patients seen within the timeframes (in minutes)
recommended by the Australasian College of Emergency Medicine. Data sourced for this measure is from the Queensland Health Emergency Department Data Collection and manual submissions from HHSs. Actuals for 2019-20 are for the period 1 July 2019 to 30 June 2020.
2. This is a measure of access and timeliness of Emergency Department (ED) services. Data sourced for this measure is from the Queensland Health Emergency Department Data Collection and manual submissions from HHSs. The target for this performance measure remains at 80 per cent in line with Collaboration for Emergency Access Research and Reform (CLEAR) recommendations. Actuals for 2019-20 are for the period 1 July 2019 to 30 June 2020.
3. This is a measure of effectiveness that shows how hospitals perform in providing elective surgery services within the clinically recommended timeframe for each urgency category. Note consistent with the National Cabinet decision, Queensland Health temporarily suspended non urgent elective surgery in preparation for COVID-19, which has impacted the seen in time performance. Data for this measure is sourced from the Queensland Health Elective Surgery Data Collection. Actuals for 2019-20 are for the period 1 July 2019 to 30 June 2020.
4. Given the System’s focus on reducing the volume of patients waiting longer than clinically recommended for elective surgery, as a result of preparing for COVID-19, seen in time performance targets for category 2 and 3 patients are not applicable for 2020-21.
5. This is a National Performance Agreement indicator and a measure of effectiveness of infection control programs and services in hospitals. The Target/Estimate for this measure aligns with the national benchmark of two cases per 10,000 acute public hospital patient days. Data for this measure is sourced from the Communicable Diseases Branch (CDB). Actuals for 2019-20 are for the period 1 July 2019 to 31 March 2020. Full year data is unavailable.
6. There are no Target/Estimates as there is no national benchmark target for this measure, and the median wait time varies depending on the proportion of patients in each urgency category. Performance was impacted by the temporary suspension of non urgent elective surgery in preparation for COVID-19. Data for this measure is sourced from the Queensland Health Elective Surgery Data Collection. Actuals for 2019-20 are for the period 1 July 2019 to 30 June 2020.
7. An efficiency measure is being investigated for this service area and will be included in a future Service Delivery Statement.8. This is a measure of activity that reports the number of elective surgery patients who were treated within the clinically recommended time in
each category. It shows the volume and timeliness of elective surgery services. Consistent with the National Cabinet decision, Queensland Health temporarily suspended non urgent elective surgery in preparation for COVID-19, which has impacted the volume of elective surgery performed. Data for this measure is sourced from the Queensland Elective Surgery Data Collection. Actuals for 2019-20 are for the period 1 July 2019 to 30 June 2020.
9. Given the System’s focus on reducing the volume of patients waiting longer than clinically recommended for elective surgery, as a result of preparing for COVID-19, the volume of patients treated within clinically recommended time performance targets for category 2 and 3 patients are not applicable for 2020-21.
10. This measure tracks the growth in non-admitted patient (outpatient) telehealth service events. Rapid uptake in telemedicine occurred as a result of preparing for COVID-19. Data for this measure is sourced from the Monthly Activity Collection. Actuals for 2019-20 are for the period 1 July 2019 to 30 June 2020.

11. A WAU is a measure of complexity and volume (i.e. activity) and provides a common unit of comparison so that fairer comparisons can be made across differing clinical services. Service Agreements between the Department of Health and HHSs and other organisations specify the activity to be provided in WAUs by service type. Actual data for 2019-20 is preliminary. The service agreement category ‘Total WAUs—Interventions and procedures’ has been reallocated between ‘Total WAUs—Acute Inpatient Care’ and ‘Total WAUs—Outpatient Care’ based on individual HHS Inpatient vs Outpatient proportions. Delivery of activity and weighted activity units was impacted by two significant factors in 2019-20; the introduction of a revised Australian Coding Standard “0002 Additional diagnoses” from 1 July 2019 (which resulted in lower weighted activity units being calculated for admitted patients relative to the same casemix period of 2018-19 year) and COVID-19 preparation, (for example the temporary suspension of non urgent planned care services) reduced the volume of patient activity. Data for this measure is sourced from GENWAU. Actuals for 2019-20 are for the period 1 July 2019 to 30 June 2020.
12. The activity targets in 2020-21 are in QWAU Phase 22.13. This measure counts the number of in-scope ambulatory mental health service contact hours, based on the national definition and calculation
of service contacts and duration. The 2019-20 Target/Estimate is calculated based on available clinician hours multiplied by an agreed output factor and weighted for locality. Data for this measure is sourced from the Mental Health Alcohol and Other Drugs Branch. Actuals for 2019-20 are for the period 1 July 2019 to 30 June 2020.

Income statement
Central West Hospital and Health Service 2019-20
Actual$'000
2020-21 Budget
$'000
INCOMEUser charges and fees 83,124 82,367
Grants and other contributions 3,265 3,321
Interest and distributions from managed funds 1 3
Other revenue 551 380
Gains on sale/revaluation of assets .. ..
Total income 86,941 86,071 EXPENSES
Employee expenses 9,698 9,685
Supplies and Services:
Other supplies and services 27,342 23,060
Department of Health contract staff 43,415 45,089
Grants and subsidies .. ..
Depreciation and amortisation 6,147 6,528
Finance/borrowing costs 41 43
Other expenses 1,564 1,601
Losses on sale/revaluation of assets 222 65
Total expenses 88,429 86,071 OPERATING SURPLUS/(DEFICIT) (1,488) ..
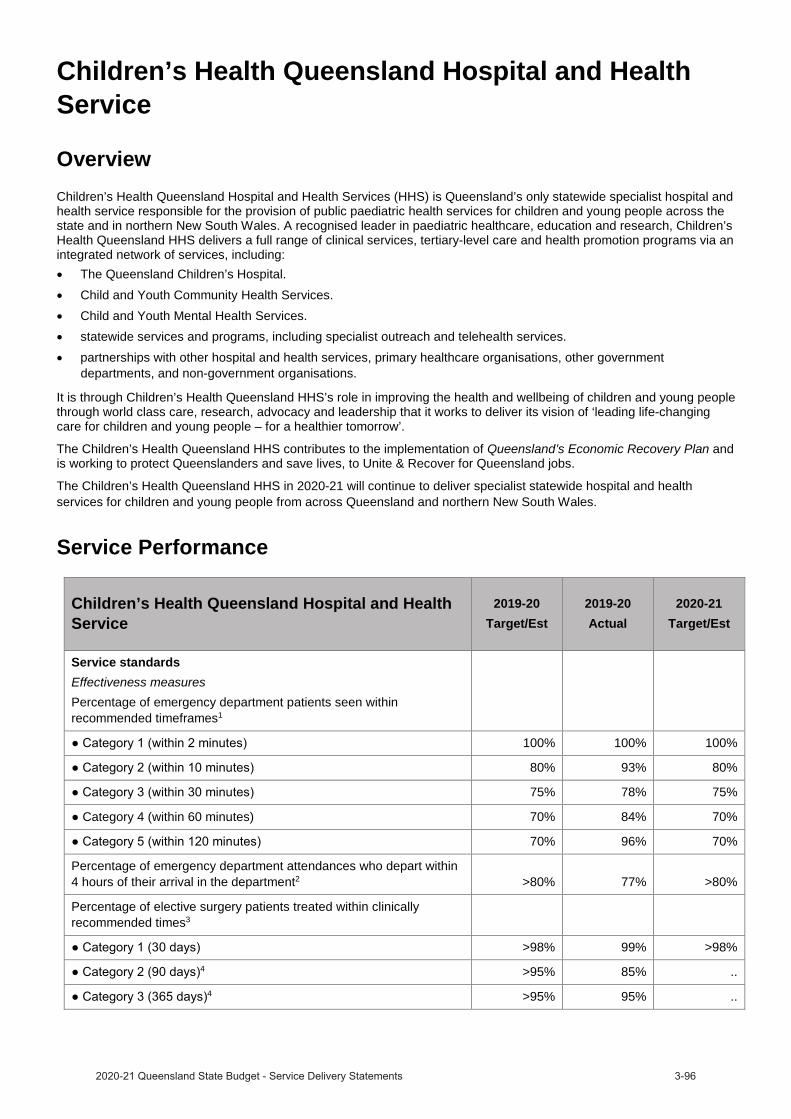
Children’s Health Queensland Hospital and Health Service
OverviewChildren’s Health Queensland Hospital and Health Services (HHS) is Queensland’s only statewide specialist hospital and health service responsible for the provision of public paediatric health services for children and young people across the state and in northern New South Wales. A recognised leader in paediatric healthcare, education and research, Children’s Health Queensland HHS delivers a full range of clinical services, tertiary-level care and health promotion programs via an integrated network of services, including:
The Queensland Children’s Hospital. Child and Youth Community Health Services. Child and Youth Mental Health Services. statewide services and programs, including specialist outreach and telehealth services.partnerships with other hospital and health services, primary healthcare organisations, other government departments, and non-government organisations.
It is through Children’s Health Queensland HHS’s role in improving the health and wellbeing of children and young people through world class care, research, advocacy and leadership that it works to deliver its vision of ‘leading life-changing care for children and young people – for a healthier tomorrow’.
The Children’s Health Queensland HHS contributes to the implementation of Queensland’s Economic Recovery Plan andis working to protect Queenslanders and save lives, to Unite & Recover for Queensland jobs.
The Children’s Health Queensland HHS in 2020-21 will continue to deliver specialist statewide hospital and health services for children and young people from across Queensland and northern New South Wales.
Service Performance
Children’s Health Queensland Hospital and Health Service
2019-20Target/Est
2019-20Actual
2020-21Target/Est
Service standardsEffectiveness measuresPercentage of emergency department patients seen within recommended timeframes1
100% 100% 100%
80% 93% 80%
75% 78% 75%
Category 4 (within 60 minutes) 70% 84% 70%
70% 96% 70%
Percentage of emergency department attendances who depart within 4 hours of their arrival in the department2 >80% 77% >80%
Percentage of elective surgery patients treated within clinically recommended times3
>98% 99% >98%4 >95% 85% ..
4 >95% 95% ..
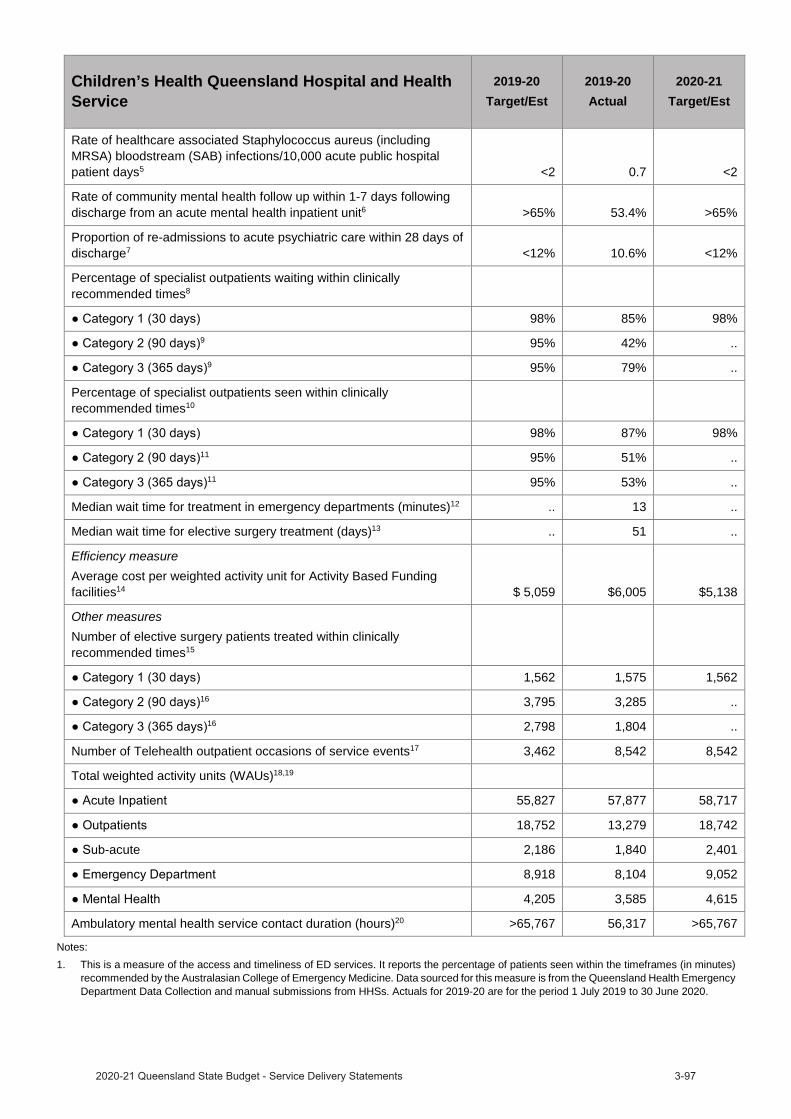
Children’s Health Queensland Hospital and Health Service
2019-20Target/Est
2019-20Actual
2020-21Target/Est
Rate of healthcare associated Staphylococcus aureus (including MRSA) bloodstream (SAB) infections/10,000 acute public hospital patient days5 <2 0.7 <2
Rate of community mental health follow up within 1-7 days following discharge from an acute mental health inpatient unit6 >65% 53.4% >65%
Proportion of re-admissions to acute psychiatric care within 28 days of discharge7 <12% 10.6% <12%
Percentage of specialist outpatients waiting within clinically recommended times8
98% 85% 98%9 95% 42% ..
9 95% 79% ..
Percentage of specialist outpatients seen within clinically recommended times10
98% 87% 98%11 95% 51% ..
11 95% 53% ..
Median wait time for treatment in emergency departments (minutes)12 .. 13 ..
Median wait time for elective surgery treatment (days)13 .. 51 ..
Efficiency measureAverage cost per weighted activity unit for Activity Based Funding facilities14 $ 5,059 $6,005 $5,138
Other measuresNumber of elective surgery patients treated within clinically recommended times15
1,562 1,575 1,56216 3,795 3,285 ..
16 2,798 1,804 ..
Number of Telehealth outpatient occasions of service events17 3,462 8,542 8,542
Total weighted activity units (WAUs)18,19
55,827 57,877 58,717
18,752 13,279 18,742
-acute 2,186 1,840 2,401
8,918 8,104 9,052
4,205 3,585 4,615
Ambulatory mental health service contact duration (hours)20 >65,767 56,317 >65,767
Notes:1. This is a measure of the access and timeliness of ED services. It reports the percentage of patients seen within the timeframes (in minutes)
recommended by the Australasian College of Emergency Medicine. Data sourced for this measure is from the Queensland Health Emergency Department Data Collection and manual submissions from HHSs. Actuals for 2019-20 are for the period 1 July 2019 to 30 June 2020.
2. This is a measure of access and timeliness of Emergency Department (ED) services. Data sourced for this measure is from the Queensland Health Emergency Department Data Collection and manual submissions from HHSs. The target for this performance measure remains at 80 per cent in line with Collaboration for Emergency Access Research and Reform (CLEAR) recommendations. Actuals for 2019-20 are for the period 1 July 2019 to 30 June 2020.
3. This is a measure of effectiveness that shows how hospitals perform in providing elective surgery services within the clinically recommended timeframe for each urgency category. Note consistent with the National Cabinet decision, Queensland Health temporarily suspended non urgent elective surgery in preparation for COVID-19, which has impacted the seen in time performance. Data for this measure is sourced from the Queensland Health Elective Surgery Data Collection. Actuals for 2019-20 are for the period 1 July 2019 to 30 June 2020.
4. Given the System’s focus on reducing the volume of patients waiting longer than clinically recommended for elective surgery, as a result of preparing for COVID-19, seen in time performance targets for category 2 and 3 patients are not applicable for 2020-21.
5. This is a National Performance Agreement indicator and a measure of effectiveness of infection control programs and services in hospitals. The Target/Estimate for this measure aligns with the national benchmark of two cases per 10,000 acute public hospital patient days. Data for this measure is sourced from the Communicable Diseases Branch (CDB). Actuals for 2019-20 are for the period 1 July 2019 to 31 March 2020. Full year data is unavailable.
6. This is a measure of the community support system that is in place for persons who have experienced an acute psychiatric episode requiring hospitalisation. Persons leaving hospital after a psychiatric admission with a formal discharge plan, involving linkages with community services and supports, are less likely to need early readmission. This service standard aligns with the Aboriginal and Torres Strait Islander Mental Health Strategy 2016–2021 and previous analysis has shown that there are statistically similar rates of follow up for Indigenous and non-Indigenous Queenslanders. Data for this measure is sourced from the Mental Health Alcohol and Other Drugs Branch. Actuals for 2019-20 are for the period 1 July 2019 to 30 June 2020.
7. Persons leaving hospital after a psychiatric admission with a formal discharge plan, involving linkages with community services and supports, are less likely to need early readmission. Previous analysis has shown similar rates of follow up for both Indigenous and non-Indigenous Queenslander’s are evident, but trends are impacted by a smaller number of separations for Indigenous Queenslanders. Data for this measure is sourced from the Mental Health Alcohol and Other Drugs Branch. Actuals for 2019-20 are for the period 1 July 2019 to 30 June 2020.
8. This is a measure of effectiveness that shows the percentage of patients waiting to have their first appointment (from the time of referral) with the health professional in an outpatient clinic, who were within the clinically recommended time. Specialist Outpatient volumes of waiting and seen are based on care provided/waiting at a Queensland Public Hospital and do not include activity undertaken by non-Queensland Health facilities. In preparation for COVID-19, Queensland Health temporarily suspended non urgent specialist outpatient services, which has impacted the percentage of patients waiting within the clinically recommended time. Data for this measure was sourced from theQueensland Health Specialist Outpatient Data Collection. Actuals for 2019-20 are as at 1 July 2020.
9. Given the System’s focus on reducing the volume of patients waiting longer than clinically recommended for specialist outpatients, as a result of preparing for COVID-19, wait in time performance targets for category 2 and 3 patients are not applicable for 2020-21.
10. This is a measure of effectiveness that shows the percentage of patients who were seen within clinically recommended times. As a result of preparing for COVID-19, the seen in time performance has been impacted. Actuals for 2019-20 are for the period 1 July 2019 to 30 June 2020.
11. Given the System’s focus on reducing the volume of patients waiting longer than clinically recommended for specialist outpatients, as a result of preparing for COVID-19, seen in time performance targets for category 2 and 3 patients are not applicable for 2020-21.
12. This measure indicates the length of time within which half of all people were seen in the ED (for all categories), from the time of presentation to being seen by a nurse or doctor (whichever was first). The target for this measure was removed from 2018–19. There is no nationally agreed target for this measure, and the median wait time varies depending on the proportion of patients in each urgency category. Data for this measure was sourced from the Queensland Health Emergency Department Data Collection. Actuals for 2019-20 are for the period 1 July 2019 to 30 June 2020.
13. There are no Target/Estimates as there is no national benchmark target for this measure, and the median wait time varies depending on the proportion of patients in each urgency category. Performance was impacted by the temporary suspension of non urgent elective surgery in preparation for COVID-19. Data for this measure is sourced from the Queensland Health Elective Surgery Data Collection. Actuals for 2019-20 are for the period 1 July 2019 to 30 June 2020.
14. Cost per WAU excludes Prevention and Primary Care, Specified Grants, and Clinical Education and Training. The introduction of a revised Australian Coding Standard “0002 Additional diagnoses” from 1 July 2019, resulted in lower weighted activity units being calculated for admitted patients relative to the same casemix of 2018-19 year. Furthermore, the additional costs of the COVID-19 pandemic costs and the temporary suspension of non urgent planned care services which reduced the volume of patient activity, contributed to the difference in Cost per WAU. The 2019-20 Actual is based on 1 July 2019 to 30 June 2020 ABF cost per WAU. The 2020-21 Target/Estimate is based on 2020-21 ABF funding per WAU.
15. This is a measure of activity that reports the number of elective surgery patients who were treated within the clinically recommended time in each category. It shows the volume and timeliness of elective surgery services. Consistent with the National Cabinet decision, Queensland Health temporarily suspended non urgent elective surgery in preparation for COVID-19, which has impacted the volume of elective surgery performed. Data for this measure is sourced from the Queensland Elective Surgery Data Collection. Actuals for 2019-20 are for the period 1 July 2019 to 30 June 2020.
16. Given the System’s focus on reducing the volume of patients waiting longer than clinically recommended for elective surgery, as a result of preparing for COVID-19, the volume of patients treated within clinically recommended time performance targets for category 2 and 3 patients are not applicable for 2020-21.
17. This measure tracks the growth in non-admitted patient (outpatient) telehealth service events. Rapid uptake in telemedicine occurred as a result of preparing for COVID-19. Data for this measure is sourced from the Monthly Activity Collection. Actuals for 2019-20 are for the period 1 July 2019 to 30 June 2020.
18. A WAU is a measure of complexity and volume (i.e. activity) and provides a common unit of comparison so that fairer comparisons can be made across differing clinical services. Service Agreements between the Department of Health and HHSs and other organisations specify the activity to be provided in WAUs by service type. Actual data for 2019-20 is preliminary. The service agreement category ‘Total WAUs—Interventions and procedures’ has been reallocated between ‘Total WAUs—Acute Inpatient Care’ and ‘Total WAUs—Outpatient Care’ based on individual HHS Inpatient vs Outpatient proportions. Delivery of activity and weighted activity units was impacted by two significant factors in 2019-20; the introduction of a revised Australian Coding Standard “0002 Additional diagnoses” from 1 July 2019 (which resulted in lower weighted activity units being calculated for admitted patients relative to the same casemix period of 2018-19 year) and COVID-19 preparation, (for example the temporary suspension of non urgent planned care services) reduced the volume of patient activity. Data for this measure is sourced from GENWAU. Actuals for 2019-20 are for the period 1 July 2019 to 30 June 2020.
19. The activity targets in 2020-21 are in QWAU Phase 22 and include activity that will be generated from the $250 million Planned Care Recovery Investment Strategy.
20. This measure counts the number of in-scope ambulatory mental health service contact hours, based on the national definition and calculation of service contacts and duration. The 2019-20 Target/Estimate is calculated based on available clinician hours multiplied by an agreed output factor and weighted for locality. Data for this measure is sourced from the Mental Health Alcohol and Other Drugs Branch. Actuals for 2019-20 are for the period 1 July 2019 to 30 June 2020.
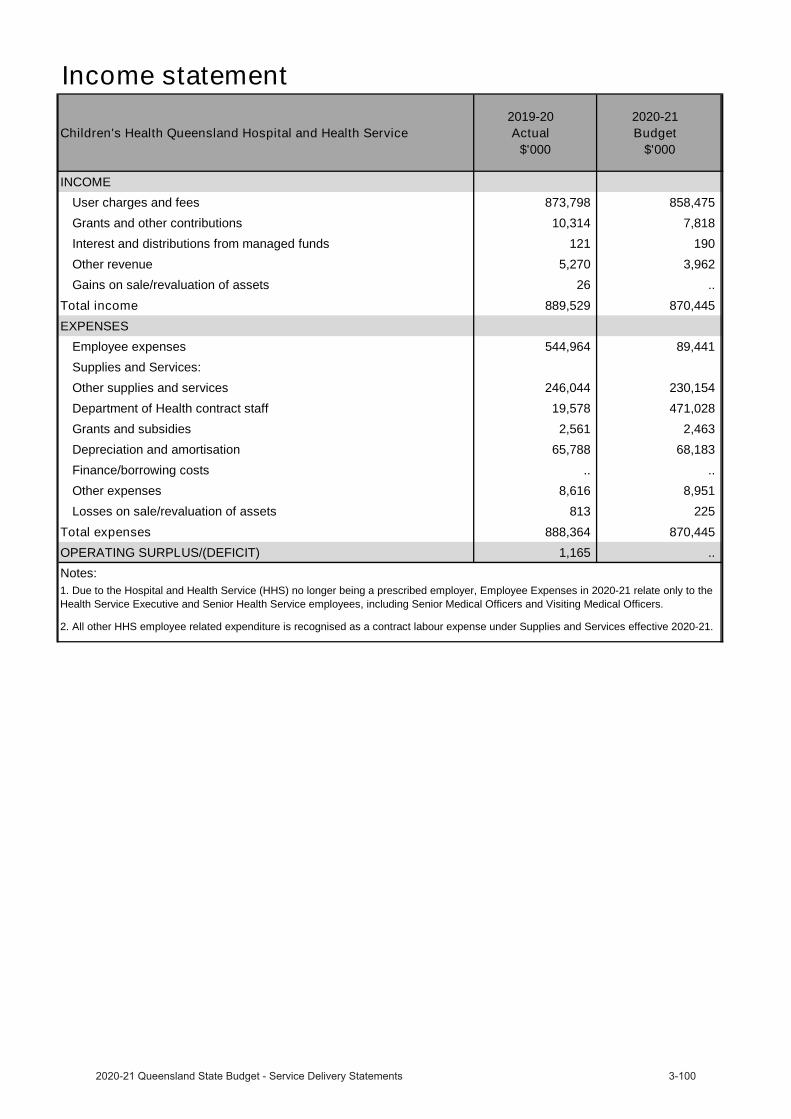
Income statement
Children's Health Queensland Hospital and Health Service 2019-20
Actual$'000
2020-21 Budget
$'000
INCOMEUser charges and fees 873,798 858,475
Grants and other contributions 10,314 7,818
Interest and distributions from managed funds 121 190
Other revenue 5,270 3,962
Gains on sale/revaluation of assets 26 ..
Total income 889,529 870,445 EXPENSES
Employee expenses 544,964 89,441
Supplies and Services:
Other supplies and services 246,044 230,154
Department of Health contract staff 19,578 471,028
Grants and subsidies 2,561 2,463
Depreciation and amortisation 65,788 68,183
Finance/borrowing costs .. ..
Other expenses 8,616 8,951
Losses on sale/revaluation of assets 813 225
Total expenses 888,364 870,445 OPERATING SURPLUS/(DEFICIT) 1,165 .. Notes:1. Due to the Hospital and Health Service (HHS) no longer being a prescribed employer, Employee Expenses in 2020-21 relate only to the Health Service Executive and Senior Health Service employees, including Senior Medical Officers and Visiting Medical Officers.
2. All other HHS employee related expenditure is recognised as a contract labour expense under Supplies and Services effective 2020-21.
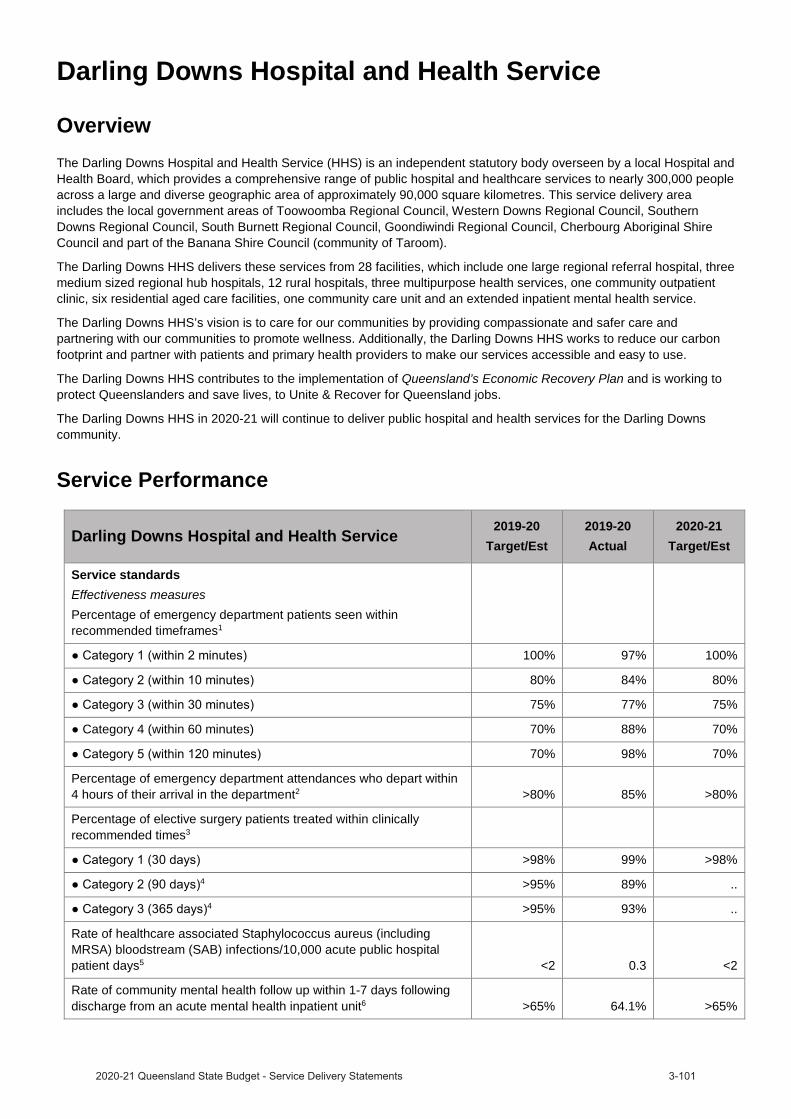
Darling Downs Hospital and Health Service
OverviewThe Darling Downs Hospital and Health Service (HHS) is an independent statutory body overseen by a local Hospital and Health Board, which provides a comprehensive range of public hospital and healthcare services to nearly 300,000 people across a large and diverse geographic area of approximately 90,000 square kilometres. This service delivery area includes the local government areas of Toowoomba Regional Council, Western Downs Regional Council, Southern Downs Regional Council, South Burnett Regional Council, Goondiwindi Regional Council, Cherbourg Aboriginal Shire Council and part of the Banana Shire Council (community of Taroom).
The Darling Downs HHS delivers these services from 28 facilities, which include one large regional referral hospital, three medium sized regional hub hospitals, 12 rural hospitals, three multipurpose health services, one community outpatient clinic, six residential aged care facilities, one community care unit and an extended inpatient mental health service.
The Darling Downs HHS’s vision is to care for our communities by providing compassionate and safer care and partnering with our communities to promote wellness. Additionally, the Darling Downs HHS works to reduce our carbon footprint and partner with patients and primary health providers to make our services accessible and easy to use.
The Darling Downs HHS contributes to the implementation of Queensland’s Economic Recovery Plan and is working to protect Queenslanders and save lives, to Unite & Recover for Queensland jobs.
The Darling Downs HHS in 2020-21 will continue to deliver public hospital and health services for the Darling Downs community.
Service Performance
Darling Downs Hospital and Health Service 2019-20Target/Est
2019-20Actual
2020-21Target/Est
Service standardsEffectiveness measuresPercentage of emergency department patients seen within recommended timeframes1
100% 97% 100%
80% 84% 80%
75% 77% 75%
Category 4 (within 60 minutes) 70% 88% 70%
70% 98% 70%
Percentage of emergency department attendances who depart within 4 hours of their arrival in the department2 >80% 85% >80%
Percentage of elective surgery patients treated within clinically recommended times3
>98% 99% >98%4 >95% 89% ..
4 >95% 93% ..
Rate of healthcare associated Staphylococcus aureus (including MRSA) bloodstream (SAB) infections/10,000 acute public hospital patient days5 <2 0.3 <2
Rate of community mental health follow up within 1-7 days following discharge from an acute mental health inpatient unit6 >65% 64.1% >65%
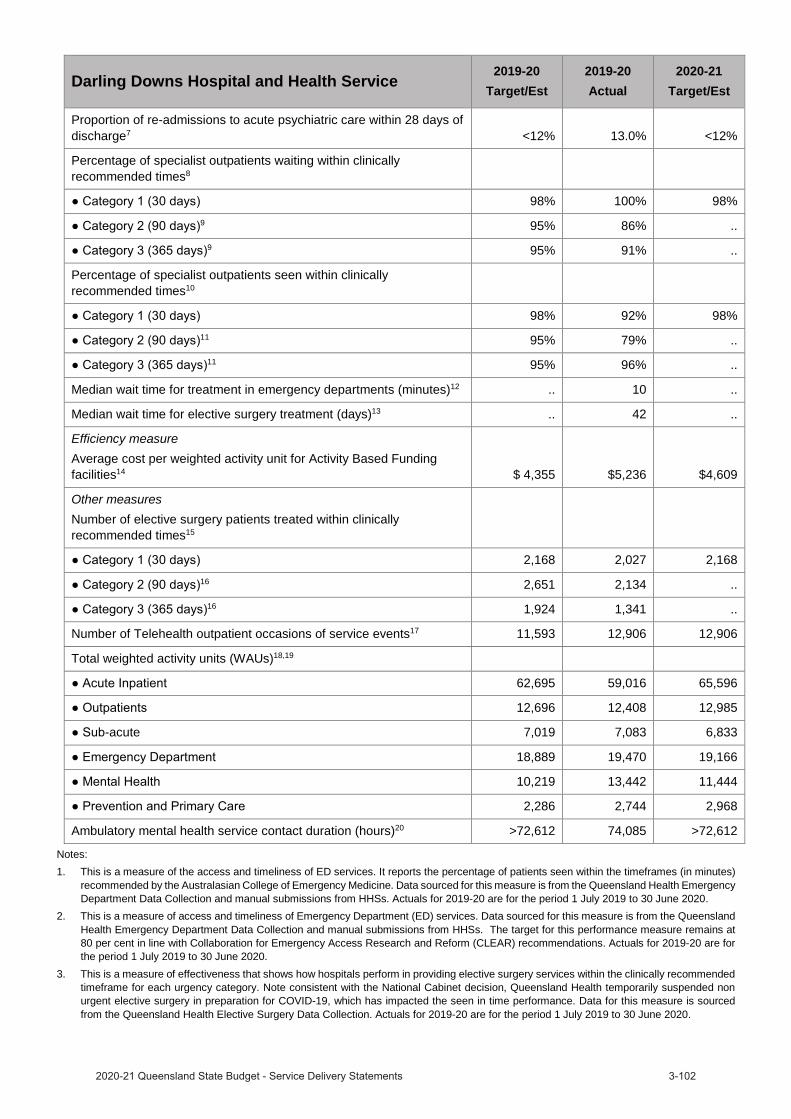
Darling Downs Hospital and Health Service2019-20
Target/Est2019-20Actual
2020-21Target/Est
Proportion of re-admissions to acute psychiatric care within 28 days of discharge7 <12% 13.0% <12%
Percentage of specialist outpatients waiting within clinically recommended times8
98% 100% 98%9 95% 86% ..
9 95% 91% ..
Percentage of specialist outpatients seen within clinically recommended times10
98% 92% 98%11 95% 79% ..
11 95% 96% ..
Median wait time for treatment in emergency departments (minutes)12 .. 10 ..
Median wait time for elective surgery treatment (days)13 .. 42 ..
Efficiency measureAverage cost per weighted activity unit for Activity Based Funding facilities14 $ 4,355 $5,236 $4,609
Other measuresNumber of elective surgery patients treated within clinically recommended times15
2,168 2,027 2,16816 2,651 2,134 ..
16 1,924 1,341 ..
Number of Telehealth outpatient occasions of service events17 11,593 12,906 12,906
Total weighted activity units (WAUs)18,19
62,695 59,016 65,596
12,696 12,408 12,985
-acute 7,019 7,083 6,833
18,889 19,470 19,166
10,219 13,442 11,444
2,286 2,744 2,968
Ambulatory mental health service contact duration (hours)20 >72,612 74,085 >72,612
Notes:1. This is a measure of the access and timeliness of ED services. It reports the percentage of patients seen within the timeframes (in minutes)
recommended by the Australasian College of Emergency Medicine. Data sourced for this measure is from the Queensland Health Emergency Department Data Collection and manual submissions from HHSs. Actuals for 2019-20 are for the period 1 July 2019 to 30 June 2020.
2. This is a measure of access and timeliness of Emergency Department (ED) services. Data sourced for this measure is from the Queensland Health Emergency Department Data Collection and manual submissions from HHSs. The target for this performance measure remains at 80 per cent in line with Collaboration for Emergency Access Research and Reform (CLEAR) recommendations. Actuals for 2019-20 are for the period 1 July 2019 to 30 June 2020.
3. This is a measure of effectiveness that shows how hospitals perform in providing elective surgery services within the clinically recommended timeframe for each urgency category. Note consistent with the National Cabinet decision, Queensland Health temporarily suspended non urgent elective surgery in preparation for COVID-19, which has impacted the seen in time performance. Data for this measure is sourced from the Queensland Health Elective Surgery Data Collection. Actuals for 2019-20 are for the period 1 July 2019 to 30 June 2020.

4. Given the System’s focus on reducing the volume of patients waiting longer than clinically recommended for elective surgery, as a result of preparing for COVID-19, seen in time performance targets for category 2 and 3 patients are not applicable for 2020-21.
5. This is a National Performance Agreement indicator and a measure of effectiveness of infection control programs and services in hospitals. The Target/Estimate for this measure aligns with the national benchmark of two cases per 10,000 acute public hospital patient days. Data for this measure is sourced from the Communicable Diseases Branch (CDB). Actuals for 2019-20 are for the period 1 July 2019 to 31 March 2020. Full year data is unavailable.
6. This is a measure of the community support system that is in place for persons who have experienced an acute psychiatric episode requiring hospitalisation. Persons leaving hospital after a psychiatric admission with a formal discharge plan, involving linkages with community services and supports, are less likely to need early readmission. This service standard aligns with the Aboriginal and Torres Strait Islander Mental Health Strategy 2016–2021 and previous analysis has shown that there are statistically similar rates of follow up for Indigenous and non-Indigenous Queenslanders. Data for this measure is sourced from the Mental Health Alcohol and Other Drugs Branch. Actuals for 2019-20 are for the period 1 July 2019 to 30 June 2020.
7. Persons leaving hospital after a psychiatric admission with a formal discharge plan, involving linkages with community services and supports, are less likely to need early readmission. Previous analysis has shown similar rates of follow up for both Indigenous and non-Indigenous Queenslander’s are evident, but trends are impacted by a smaller number of separations for Indigenous Queenslanders. Data for this measure is sourced from the Mental Health Alcohol and Other Drugs Branch. Actuals for 2019-20 are for the period 1 July 2019 to 30 June 2020.
8. This is a measure of effectiveness that shows the percentage of patients waiting to have their first appointment (from the time of referral) with the health professional in an outpatient clinic, who were within the clinically recommended time. Specialist Outpatient volumes of waiting and seen are based on care provided/waiting at a Queensland Public Hospital and do not include activity undertaken by non-Queensland Health facilities. In preparation for COVID-19, Queensland Health temporarily suspended non urgent specialist outpatient services, which has impacted the percentage of patients waiting within the clinically recommended time. Data for this measure was sourced from theQueensland Health Specialist Outpatient Data Collection. Actuals for 2019-20 are as at 1 July 2020.
9. Given the System’s focus on reducing the volume of patients waiting longer than clinically recommended for specialist outpatients, as a result of preparing for COVID-19, wait in time performance targets for category 2 and 3 patients are not applicable for 2020-21.
10. This is a measure of effectiveness that shows the percentage of patients who were seen within clinically recommended times. As a result of preparing for COVID-19, the seen in time performance has been impacted. Actuals for 2019-20 are for the period 1 July 2019 to 30 June 2020.
11. Given the System’s focus on reducing the volume of patients waiting longer than clinically recommended for specialist outpatients, as a result of preparing for COVID-19, seen in time performance targets for category 2 and 3 patients are not applicable for 2020-21.
12. This measure indicates the length of time within which half of all people were seen in the ED (for all categories), from the time of presentation to being seen by a nurse or doctor (whichever was first). The target for this measure was removed from 2018–19. There is no nationally agreed target for this measure, and the median wait time varies depending on the proportion of patients in each urgency category. Data for this measure was sourced from the Queensland Health Emergency Department Data Collection. Actuals for 2019-20 are for the period 1 July 2019 to 30 June 2020.
13. There are no Target/Estimates as there is no national benchmark target for this measure, and the median wait time varies depending on the proportion of patients in each urgency category. Performance was impacted by the temporary suspension of non urgent elective surgery in preparation for COVID-19. Data for this measure is sourced from the Queensland Health Elective Surgery Data Collection. Actuals for 2019-20 are for the period 1 July 2019 to 30 June 2020.
14. Cost per WAU excludes Prevention and Primary Care, Specified Grants, and Clinical Education and Training. The introduction of a revised Australian Coding Standard “0002 Additional diagnoses” from 1 July 2019, resulted in lower weighted activity units being calculated for admitted patients relative to the same casemix of 2018-19 year. Furthermore, the additional costs of the COVID-19 pandemic costs and the temporary suspension of non urgent planned care services which reduced the volume of patient activity, contributed to the difference in Cost per WAU. The 2019-20 Actual is based on 1 July 2019 to 30 June 2020 ABF cost per WAU. The 2020-21 Target/Estimate is based on 2020-21 ABF funding per WAU.
15. This is a measure of activity that reports the number of elective surgery patients who were treated within the clinically recommended time in each category. It shows the volume and timeliness of elective surgery services. Consistent with the National Cabinet decision, Queensland Health temporarily suspended non urgent elective surgery in preparation for COVID-19, which has impacted the volume of elective surgery performed. Data for this measure is sourced from the Queensland Elective Surgery Data Collection. Actuals for 2019-20 are for the period 1 July 2019 to 30 June 2020.
16. Given the System’s focus on reducing the volume of patients waiting longer than clinically recommended for elective surgery, as a result of preparing for COVID-19, the volume of patients treated within clinically recommended time performance targets for category 2 and 3 patients are not applicable for 2020-21.
17. This measure tracks the growth in non-admitted patient (outpatient) telehealth service events. Rapid uptake in telemedicine occurred as a result of preparing for COVID-19. Data for this measure is sourced from the Monthly Activity Collection. Actuals for 2019-20 are for the period 1 July 2019 to 30 June 2020.

18. A WAU is a measure of complexity and volume (i.e. activity) and provides a common unit of comparison so that fairer comparisons can be made across differing clinical services. Service Agreements between the Department of Health and HHSs and other organisations specify the activity to be provided in WAUs by service type. Actual data for 2019-20 is preliminary. The service agreement category ‘Total WAUs—Interventions and procedures’ has been reallocated between ‘Total WAUs—Acute Inpatient Care’ and ‘Total WAUs—Outpatient Care’ based on individual HHS Inpatient vs Outpatient proportions. Delivery of activity and weighted activity units was impacted by two significant factors in 2019-20; the introduction of a revised Australian Coding Standard “0002 Additional diagnoses” from 1 July 2019 (which resulted in lower weighted activity units being calculated for admitted patients relative to the same casemix period of 2018-19 year) and COVID-19 preparation, (for example the temporary suspension of non urgent planned care services) reduced the volume of patient activity. Data for this measure is sourced from GENWAU. Actuals for 2019-20 are for the period 1 July 2019 to 30 June 2020.
19. The activity targets in 2020-21 are in QWAU Phase 22 and include activity that will be generated from the $250 million Planned Care Recovery Investment Strategy.
20. This measure counts the number of in-scope ambulatory mental health service contact hours, based on the national definition and calculation of service contacts and duration. The 2019-20 Target/Estimate is calculated based on available clinician hours multiplied by an agreed output factor and weighted for locality. Data for this measure is sourced from the Mental Health Alcohol and Other Drugs Branch. Actuals for 2019-20 are for the period 1 July 2019 to 30 June 2020.
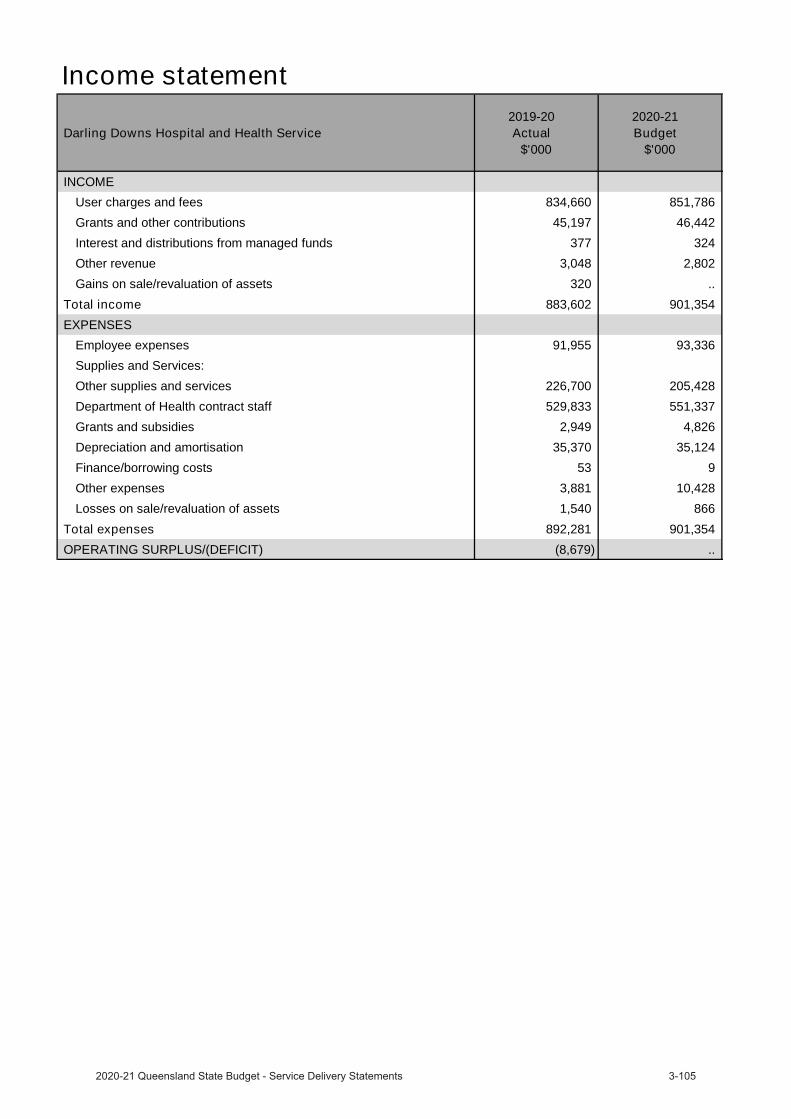
Income statement
Darling Downs Hospital and Health Service 2019-20
Actual$'000
2020-21 Budget
$'000
INCOMEUser charges and fees 834,660 851,786
Grants and other contributions 45,197 46,442
Interest and distributions from managed funds 377 324
Other revenue 3,048 2,802
Gains on sale/revaluation of assets 320 ..
Total income 883,602 901,354 EXPENSES
Employee expenses 91,955 93,336
Supplies and Services:
Other supplies and services 226,700 205,428
Department of Health contract staff 529,833 551,337
Grants and subsidies 2,949 4,826
Depreciation and amortisation 35,370 35,124
Finance/borrowing costs 53 9
Other expenses 3,881 10,428
Losses on sale/revaluation of assets 1,540 866
Total expenses 892,281 901,354 OPERATING SURPLUS/(DEFICIT) (8,679) ..
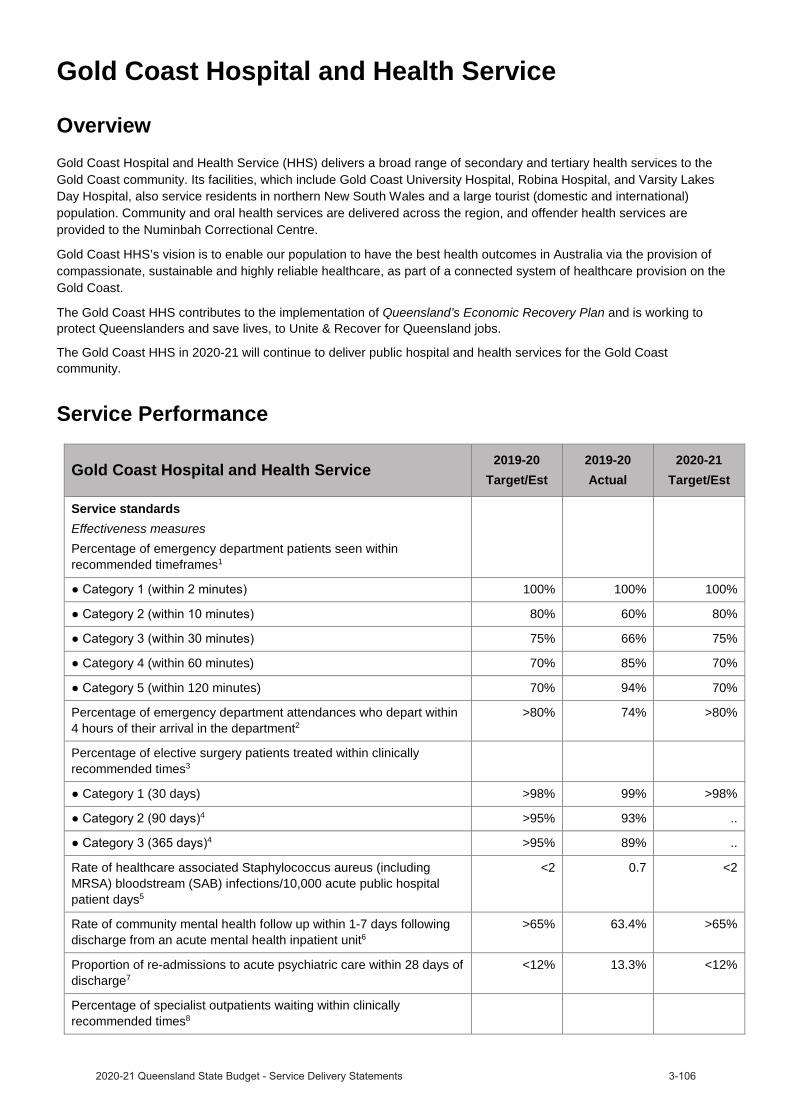
Gold Coast Hospital and Health Service
OverviewGold Coast Hospital and Health Service (HHS) delivers a broad range of secondary and tertiary health services to the Gold Coast community. Its facilities, which include Gold Coast University Hospital, Robina Hospital, and Varsity Lakes Day Hospital, also service residents in northern New South Wales and a large tourist (domestic and international) population. Community and oral health services are delivered across the region, and offender health services are provided to the Numinbah Correctional Centre.
Gold Coast HHS’s vision is to enable our population to have the best health outcomes in Australia via the provision of compassionate, sustainable and highly reliable healthcare, as part of a connected system of healthcare provision on the Gold Coast.
The Gold Coast HHS contributes to the implementation of Queensland’s Economic Recovery Plan and is working to protect Queenslanders and save lives, to Unite & Recover for Queensland jobs.
The Gold Coast HHS in 2020-21 will continue to deliver public hospital and health services for the Gold Coast community.
Service Performance
Gold Coast Hospital and Health Service 2019-20Target/Est
2019-20Actual
2020-21Target/Est
Service standardsEffectiveness measuresPercentage of emergency department patients seen within recommended timeframes1
100% 100% 100%
80% 60% 80%
75% 66% 75%
Category 4 (within 60 minutes) 70% 85% 70%
5 (within 120 minutes) 70% 94% 70%
Percentage of emergency department attendances who depart within 4 hours of their arrival in the department2
>80% 74% >80%
Percentage of elective surgery patients treated within clinically recommended times3
Category 1 (30 days) >98% 99% >98%4 >95% 93% ..
4 >95% 89% ..
Rate of healthcare associated Staphylococcus aureus (including MRSA) bloodstream (SAB) infections/10,000 acute public hospital patient days5
<2 0.7 <2
Rate of community mental health follow up within 1-7 days following discharge from an acute mental health inpatient unit6
>65% 63.4% >65%
Proportion of re-admissions to acute psychiatric care within 28 days of discharge7
<12% 13.3% <12%
Percentage of specialist outpatients waiting within clinically recommended times8

Gold Coast Hospital and Health Service2019-20
Target/Est2019-20Actual
2020-21Target/Est
66% 84% 66%9 56% 33% ..
9 94% 58% ..
Percentage of specialist outpatients seen within clinically recommended times10
84% 70% 84%11 62% 47% ..
11 67% 73% ..
Median wait time for treatment in emergency departments (minutes)12 .. 14 ..
Median wait time for elective surgery treatment (days)13 .. 43 ..
Efficiency measureAverage cost per weighted activity unit for Activity Based Funding facilities14 $ 5,005 $5,516 $5,087
Other measuresNumber of elective surgery patients treated within clinically recommended times15
Category 1 (30 days) 6,805 6,012 6,80516 7,278 6,294 ..
16 3,966 2,731 ..
Number of Telehealth outpatient occasions of service events17 2,176 5,876 5,876
Total weighted activity units (WAUs)18,19
Acute Inpatient 145,787 139,765 160,675
36,575 35,783 36,752
-acute 11,537 11,044 11,031
28,632 26,669 27,377
16,786 15,987 17,010
3,263 3,672 3,881
Ambulatory mental health service contact duration (hours)20 >90,125 86,300 >90,125
Notes:1. This is a measure of the access and timeliness of ED services. It reports the percentage of patients seen within the timeframes (in minutes)
recommended by the Australasian College of Emergency Medicine. Data sourced for this measure is from the Queensland Health Emergency Department Data Collection and manual submissions from HHSs. Actuals for 2019-20 are for the period 1 July 2019 to 30 June 2020.
2. This is a measure of access and timeliness of Emergency Department (ED) services. Data sourced for this measure is from the Queensland Health Emergency Department Data Collection and manual submissions from HHSs. The target for this performance measure remains at 80 per cent in line with Collaboration for Emergency Access Research and Reform (CLEAR) recommendations. Actuals for 2019-20 are for the period 1 July 2019 to 30 June 2020.
3. This is a measure of effectiveness that shows how hospitals perform in providing elective surgery services within the clinically recommended timeframe for each urgency category. Note consistent with the National Cabinet decision, Queensland Health temporarily suspended non urgent elective surgery in preparation for COVID-19, which has impacted the seen in time performance. Data for this measure is sourced from the Queensland Health Elective Surgery Data Collection. Actuals for 2019-20 are for the period 1 July 2019 to 30 June 2020.
4. Given the System’s focus on reducing the volume of patients waiting longer than clinically recommended for elective surgery, as a result of preparing for COVID-19, seen in time performance targets for category 2 and 3 patients are not applicable for 2020-21.
5. This is a National Performance Agreement indicator and a measure of effectiveness of infection control programs and services in hospitals. The Target/Estimate for this measure aligns with the national benchmark of two cases per 10,000 acute public hospital patient days. Data for this measure is sourced from the Communicable Diseases Branch (CDB). Actuals for 2019-20 are for the period 1 July 2019 to 31 March 2020. Full year data is unavailable.
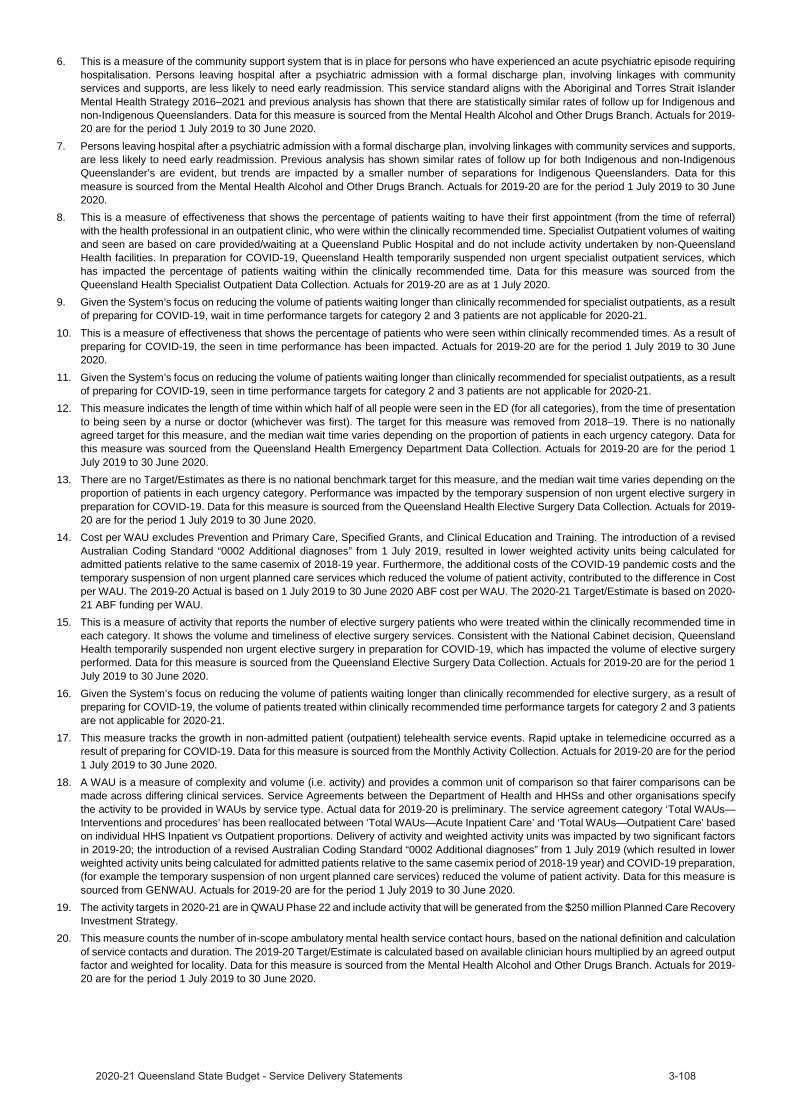
6. This is a measure of the community support system that is in place for persons who have experienced an acute psychiatric episode requiring hospitalisation. Persons leaving hospital after a psychiatric admission with a formal discharge plan, involving linkages with community services and supports, are less likely to need early readmission. This service standard aligns with the Aboriginal and Torres Strait Islander Mental Health Strategy 2016–2021 and previous analysis has shown that there are statistically similar rates of follow up for Indigenous and non-Indigenous Queenslanders. Data for this measure is sourced from the Mental Health Alcohol and Other Drugs Branch. Actuals for 2019-20 are for the period 1 July 2019 to 30 June 2020.
7. Persons leaving hospital after a psychiatric admission with a formal discharge plan, involving linkages with community services and supports, are less likely to need early readmission. Previous analysis has shown similar rates of follow up for both Indigenous and non-Indigenous Queenslander’s are evident, but trends are impacted by a smaller number of separations for Indigenous Queenslanders. Data for this measure is sourced from the Mental Health Alcohol and Other Drugs Branch. Actuals for 2019-20 are for the period 1 July 2019 to 30 June 2020.
8. This is a measure of effectiveness that shows the percentage of patients waiting to have their first appointment (from the time of referral) with the health professional in an outpatient clinic, who were within the clinically recommended time. Specialist Outpatient volumes of waiting and seen are based on care provided/waiting at a Queensland Public Hospital and do not include activity undertaken by non-Queensland Health facilities. In preparation for COVID-19, Queensland Health temporarily suspended non urgent specialist outpatient services, which has impacted the percentage of patients waiting within the clinically recommended time. Data for this measure was sourced from the Queensland Health Specialist Outpatient Data Collection. Actuals for 2019-20 are as at 1 July 2020.
9. Given the System’s focus on reducing the volume of patients waiting longer than clinically recommended for specialist outpatients, as a result of preparing for COVID-19, wait in time performance targets for category 2 and 3 patients are not applicable for 2020-21.
10. This is a measure of effectiveness that shows the percentage of patients who were seen within clinically recommended times. As a result of preparing for COVID-19, the seen in time performance has been impacted. Actuals for 2019-20 are for the period 1 July 2019 to 30 June 2020.
11. Given the System’s focus on reducing the volume of patients waiting longer than clinically recommended for specialist outpatients, as a result of preparing for COVID-19, seen in time performance targets for category 2 and 3 patients are not applicable for 2020-21.
12. This measure indicates the length of time within which half of all people were seen in the ED (for all categories), from the time of presentation to being seen by a nurse or doctor (whichever was first). The target for this measure was removed from 2018–19. There is no nationally agreed target for this measure, and the median wait time varies depending on the proportion of patients in each urgency category. Data for this measure was sourced from the Queensland Health Emergency Department Data Collection. Actuals for 2019-20 are for the period 1 July 2019 to 30 June 2020.
13. There are no Target/Estimates as there is no national benchmark target for this measure, and the median wait time varies depending on the proportion of patients in each urgency category. Performance was impacted by the temporary suspension of non urgent elective surgery in preparation for COVID-19. Data for this measure is sourced from the Queensland Health Elective Surgery Data Collection. Actuals for 2019-20 are for the period 1 July 2019 to 30 June 2020.
14. Cost per WAU excludes Prevention and Primary Care, Specified Grants, and Clinical Education and Training. The introduction of a revised Australian Coding Standard “0002 Additional diagnoses” from 1 July 2019, resulted in lower weighted activity units being calculated for admitted patients relative to the same casemix of 2018-19 year. Furthermore, the additional costs of the COVID-19 pandemic costs and the temporary suspension of non urgent planned care services which reduced the volume of patient activity, contributed to the difference in Cost per WAU. The 2019-20 Actual is based on 1 July 2019 to 30 June 2020 ABF cost per WAU. The 2020-21 Target/Estimate is based on 2020-21 ABF funding per WAU.
15. This is a measure of activity that reports the number of elective surgery patients who were treated within the clinically recommended time in each category. It shows the volume and timeliness of elective surgery services. Consistent with the National Cabinet decision, Queensland Health temporarily suspended non urgent elective surgery in preparation for COVID-19, which has impacted the volume of elective surgery performed. Data for this measure is sourced from the Queensland Elective Surgery Data Collection. Actuals for 2019-20 are for the period 1 July 2019 to 30 June 2020.
16. Given the System’s focus on reducing the volume of patients waiting longer than clinically recommended for elective surgery, as a result of preparing for COVID-19, the volume of patients treated within clinically recommended time performance targets for category 2 and 3 patients are not applicable for 2020-21.
17. This measure tracks the growth in non-admitted patient (outpatient) telehealth service events. Rapid uptake in telemedicine occurred as a result of preparing for COVID-19. Data for this measure is sourced from the Monthly Activity Collection. Actuals for 2019-20 are for the period 1 July 2019 to 30 June 2020.
18. A WAU is a measure of complexity and volume (i.e. activity) and provides a common unit of comparison so that fairer comparisons can be made across differing clinical services. Service Agreements between the Department of Health and HHSs and other organisations specify the activity to be provided in WAUs by service type. Actual data for 2019-20 is preliminary. The service agreement category ‘Total WAUs—Interventions and procedures’ has been reallocated between ‘Total WAUs—Acute Inpatient Care’ and ‘Total WAUs—Outpatient Care’ based on individual HHS Inpatient vs Outpatient proportions. Delivery of activity and weighted activity units was impacted by two significant factors in 2019-20; the introduction of a revised Australian Coding Standard “0002 Additional diagnoses” from 1 July 2019 (which resulted in lower weighted activity units being calculated for admitted patients relative to the same casemix period of 2018-19 year) and COVID-19 preparation, (for example the temporary suspension of non urgent planned care services) reduced the volume of patient activity. Data for this measure is sourced from GENWAU. Actuals for 2019-20 are for the period 1 July 2019 to 30 June 2020.
19. The activity targets in 2020-21 are in QWAU Phase 22 and include activity that will be generated from the $250 million Planned Care Recovery Investment Strategy.
20. This measure counts the number of in-scope ambulatory mental health service contact hours, based on the national definition and calculation of service contacts and duration. The 2019-20 Target/Estimate is calculated based on available clinician hours multiplied by an agreed output factor and weighted for locality. Data for this measure is sourced from the Mental Health Alcohol and Other Drugs Branch. Actuals for 2019-20 are for the period 1 July 2019 to 30 June 2020.
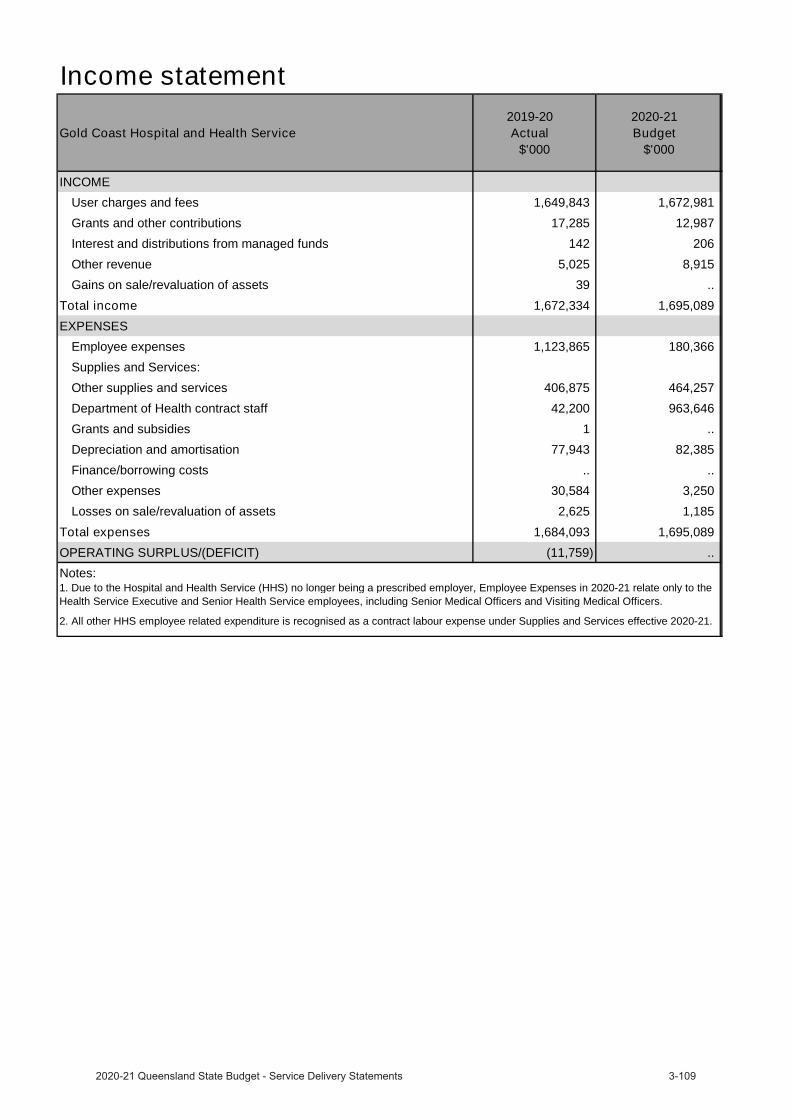
Gold Coast Hospital and Health Service 2019-20
Actual$'000
2020-21 Budget
$'000
INCOMEUser charges and fees 1,649,843 1,672,981
Grants and other contributions 17,285 12,987
Interest and distributions from managed funds 142 206
Other revenue 5,025 8,915
Gains on sale/revaluation of assets 39 ..
Total income 1,672,334 1,695,089 EXPENSES
Employee expenses 1,123,865 180,366
Supplies and Services:
Other supplies and services 406,875 464,257
Department of Health contract staff 42,200 963,646
Grants and subsidies 1 ..
Depreciation and amortisation 77,943 82,385
Finance/borrowing costs .. ..
Other expenses 30,584 3,250
Losses on sale/revaluation of assets 2,625 1,185
Total expenses 1,684,093 1,695,089 OPERATING SURPLUS/(DEFICIT) (11,759) .. Notes:1. Due to the Hospital and Health Service (HHS) no longer being a prescribed employer, Employee Expenses in 2020-21 relate only to theHealth Service Executive and Senior Health Service employees, including Senior Medical Officers and Visiting Medical Officers.
2. All other HHS employee related expenditure is recognised as a contract labour expense under Supplies and Services effective 2020-21.
Income statement
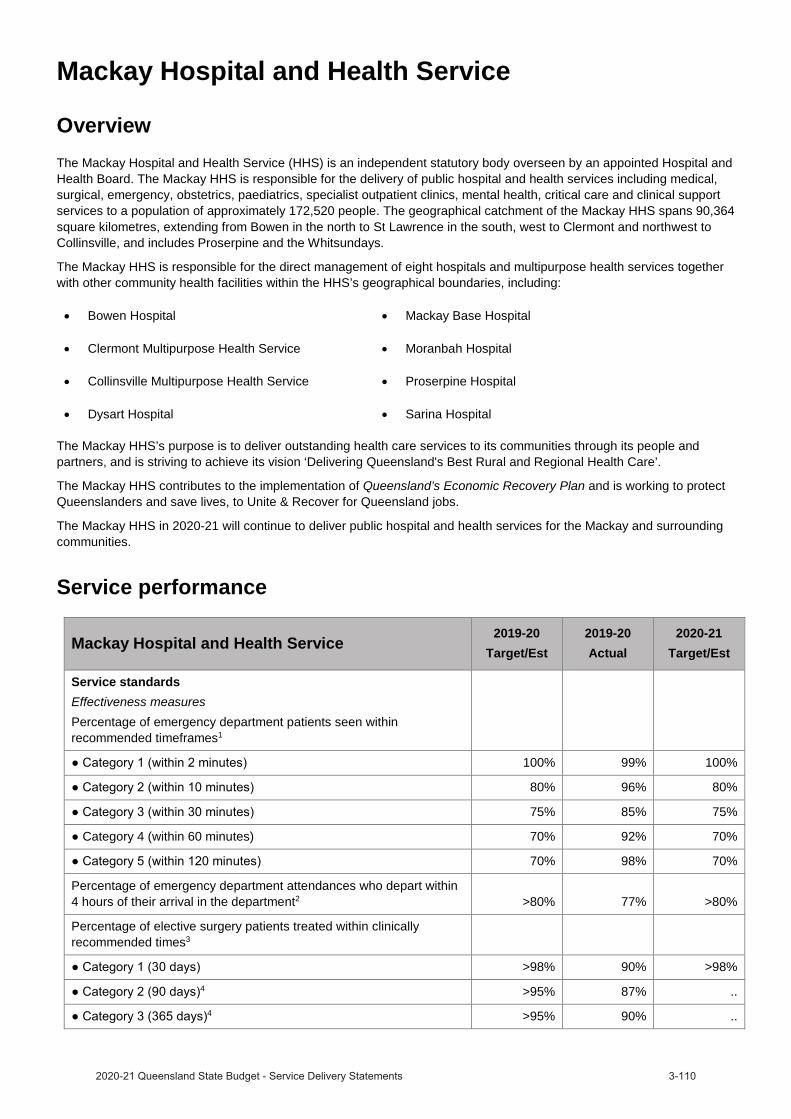
Mackay Hospital and Health Service
OverviewThe Mackay Hospital and Health Service (HHS) is an independent statutory body overseen by an appointed Hospital and Health Board. The Mackay HHS is responsible for the delivery of public hospital and health services including medical, surgical, emergency, obstetrics, paediatrics, specialist outpatient clinics, mental health, critical care and clinical support services to a population of approximately 172,520 people. The geographical catchment of the Mackay HHS spans 90,364 square kilometres, extending from Bowen in the north to St Lawrence in the south, west to Clermont and northwest to Collinsville, and includes Proserpine and the Whitsundays.
The Mackay HHS is responsible for the direct management of eight hospitals and multipurpose health services togetherwith other community health facilities within the HHS’s geographical boundaries, including:
Bowen Hospital Mackay Base Hospital
Clermont Multipurpose Health Service Moranbah Hospital
Collinsville Multipurpose Health Service Proserpine Hospital
Dysart Hospital Sarina Hospital
The Mackay HHS’s purpose is to deliver outstanding health care services to its communities through its people and partners, and is striving to achieve its vision ‘Delivering Queensland's Best Rural and Regional Health Care’.
The Mackay HHS contributes to the implementation of Queensland’s Economic Recovery Plan and is working to protect Queenslanders and save lives, to Unite & Recover for Queensland jobs.
The Mackay HHS in 2020-21 will continue to deliver public hospital and health services for the Mackay and surrounding communities.
Service performance
Mackay Hospital and Health Service2019-20
Target/Est2019-20Actual
2020-21Target/Est
Service standardsEffectiveness measuresPercentage of emergency department patients seen within recommended timeframes1
100% 99% 100%
80% 96% 80%
75% 85% 75%
Category 4 (within 60 minutes) 70% 92% 70%
70% 98% 70%
Percentage of emergency department attendances who depart within 4 hours of their arrival in the department2 >80% 77% >80%
Percentage of elective surgery patients treated within clinically recommended times3
>98% 90% >98%4 >95% 87% ..
4 >95% 90% ..

Mackay Hospital and Health Service2019-20
Target/Est2019-20Actual
2020-21Target/Est
Rate of healthcare associated Staphylococcus aureus (including MRSA) bloodstream (SAB) infections/10,000 acute public hospital patient days5 <2 0.3 <2
Rate of community mental health follow up within 1-7 days following discharge from an acute mental health inpatient unit6 >65% 64.1% >65%
Proportion of re-admissions to acute psychiatric care within 28 days of discharge7 <12% 14.4% <12%
Percentage of specialist outpatients waiting within clinically recommended times8
70% 70% 70%9 70% 58% ..
9 90% 90% ..
Percentage of specialist outpatients seen within clinically recommended times10
Category 1 (30 days) 81% 71% 81%11 75% 56% ..
11 97% 89% ..
Median wait time for treatment in emergency departments (minutes)12 .. 10 ..
Median wait time for elective surgery treatment (days)13 .. 45 ..
Efficiency measureAverage cost per weighted activity unit for Activity Based Funding facilities14 $ 4,590 $5,640 $4,642
Other measuresNumber of elective surgery patients treated within clinically recommended times15
1,179 1,028 1,17916 1,189 1,248 ..
16 403 410 ..
Number of Telehealth outpatient occasions of service events17 8,974 10,895 10,895
Total weighted activity units (WAUs)18,19
41,895 39,427 46,085
10,951 10,409 10,415
-acute 2,781 3,306 3,071
11,169 11,141 11,741
4,205 3,722 3,624
1,776 1,485 1,698
Ambulatory mental health service contact duration (hours)20 >27,854 34,015 >27,854
Notes:1. This is a measure of the access and timeliness of ED services. It reports the percentage of patients seen within the timeframes (in minutes)
recommended by the Australasian College of Emergency Medicine. Data sourced for this measure is from the Queensland Health Emergency Department Data Collection and manual submissions from HHSs. Actuals for 2019-20 are for the period 1 July 2019 to 30 June 2020.
2. This is a measure of access and timeliness of Emergency Department (ED) services. Data sourced for this measure is from the Queensland Health Emergency Department Data Collection and manual submissions from HHSs. The target for this performance measure remains at 80 per cent in line with Collaboration for Emergency Access Research and Reform (CLEAR) recommendations. Actuals for 2019-20 are for the period 1 July 2019 to 30 June 2020.
3. This is a measure of effectiveness that shows how hospitals perform in providing elective surgery services within the clinically recommended timeframe for each urgency category. Note consistent with the National Cabinet decision, Queensland Health temporarily suspended non urgent elective surgery in preparation for COVID-19, which has impacted the seen in time performance. Data for this measure is sourced from the Queensland Health Elective Surgery Data Collection. Actuals for 2019-20 are for the period 1 July 2019 to 30 June 2020.
4. Given the System’s focus on reducing the volume of patients waiting longer than clinically recommended for elective surgery, as a result of preparing for COVID-19, seen in time performance targets for category 2 and 3 patients are not applicable for 2020-21.
5. This is a National Performance Agreement indicator and a measure of effectiveness of infection control programs and services in hospitals. The Target/Estimate for this measure aligns with the national benchmark of two cases per 10,000 acute public hospital patient days. Data for this measure is sourced from the Communicable Diseases Branch (CDB). Actuals for 2019-20 are for the period 1 July 2019 to 31 March 2020. Full year data is unavailable.
6. This is a measure of the community support system that is in place for persons who have experienced an acute psychiatric episode requiring hospitalisation. Persons leaving hospital after a psychiatric admission with a formal discharge plan, involving linkages with communityservices and supports, are less likely to need early readmission. This service standard aligns with the Aboriginal and Torres Strait Islander Mental Health Strategy 2016–2021 and previous analysis has shown that there are statistically similar rates of follow up for Indigenous and non-Indigenous Queenslanders. Data for this measure is sourced from the Mental Health Alcohol and Other Drugs Branch. Actuals for 2019-20 are for the period 1 July 2019 to 30 June 2020.
7. Persons leaving hospital after a psychiatric admission with a formal discharge plan, involving linkages with community services and supports, are less likely to need early readmission. Previous analysis has shown similar rates of follow up for both Indigenous and non-Indigenous Queenslander’s are evident, but trends are impacted by a smaller number of separations for Indigenous Queenslanders. Data for this measure is sourced from the Mental Health Alcohol and Other Drugs Branch. Actuals for 2019-20 are for the period 1 July 2019 to 30 June 2020.
8. This is a measure of effectiveness that shows the percentage of patients waiting to have their first appointment (from the time of referral) with the health professional in an outpatient clinic, who were within the clinically recommended time. Specialist Outpatient volumes of waiting and seen are based on care provided/waiting at a Queensland Public Hospital and do not include activity undertaken by non-Queensland Health facilities. In preparation for COVID-19, Queensland Health temporarily suspended non urgent specialist outpatient services, which has impacted the percentage of patients waiting within the clinically recommended time. Data for this measure was sourced from the Queensland Health Specialist Outpatient Data Collection. Actuals for 2019-20 are as at 1 July 2020.
9. Given the System’s focus on reducing the volume of patients waiting longer than clinically recommended for specialist outpatients, as a result of preparing for COVID-19, wait in time performance targets for category 2 and 3 patients are not applicable for 2020-21.
10. This is a measure of effectiveness that shows the percentage of patients who were seen within clinically recommended times. As a result of preparing for COVID-19, the seen in time performance has been impacted. Actuals for 2019-20 are for the period 1 July 2019 to 30 June 2020.
11. Given the System’s focus on reducing the volume of patients waiting longer than clinically recommended for specialist outpatients, as a result of preparing for COVID-19, seen in time performance targets for category 2 and 3 patients are not applicable for 2020-21.
12. This measure indicates the length of time within which half of all people were seen in the ED (for all categories), from the time of presentation to being seen by a nurse or doctor (whichever was first). The target for this measure was removed from 2018–19. There is no nationally agreed target for this measure, and the median wait time varies depending on the proportion of patients in each urgency category. Data for this measure was sourced from the Queensland Health Emergency Department Data Collection. Actuals for 2019-20 are for the period 1 July 2019 to 30 June 2020.
13. There are no Target/Estimates as there is no national benchmark target for this measure, and the median wait time varies depending on the proportion of patients in each urgency category. Performance was impacted by the temporary suspension of non urgent elective surgery in preparation for COVID-19. Data for this measure is sourced from the Queensland Health Elective Surgery Data Collection. Actuals for 2019-20 are for the period 1 July 2019 to 30 June 2020.
14. Cost per WAU excludes Prevention and Primary Care, Specified Grants, and Clinical Education and Training. The introduction of a revised Australian Coding Standard “0002 Additional diagnoses” from 1 July 2019, resulted in lower weighted activity units being calculated for admitted patients relative to the same casemix of 2018-19 year. Furthermore, the additional costs of the COVID-19 pandemic costs and the temporary suspension of non urgent planned care services which reduced the volume of patient activity, contributed to the difference in Cost per WAU. The 2019-20 Actual is based on 1 July 2019 to 30 June 2020 ABF cost per WAU. The 2020-21 Target/Estimate is based on 2020-21 ABF funding per WAU.
15. This is a measure of activity that reports the number of elective surgery patients who were treated within the clinically recommended time in each category. It shows the volume and timeliness of elective surgery services. Consistent with the National Cabinet decision, Queensland Health temporarily suspended non urgent elective surgery in preparation for COVID-19, which has impacted the volume of elective surgery performed. Data for this measure is sourced from the Queensland Elective Surgery Data Collection. Actuals for 2019-20 are for the period 1 July 2019 to 30 June 2020.
16. Given the System’s focus on reducing the volume of patients waiting longer than clinically recommended for elective surgery, as a result of preparing for COVID-19, the volume of patients treated within clinically recommended time performance targets for category 2 and 3 patients are not applicable for 2020-21.
17. This measure tracks the growth in non-admitted patient (outpatient) telehealth service events. Rapid uptake in telemedicine occurred as a result of preparing for COVID-19. Data for this measure is sourced from the Monthly Activity Collection. Actuals for 2019-20 are for the period 1 July 2019 to 30 June 2020.

18. A WAU is a measure of complexity and volume (i.e. activity) and provides a common unit of comparison so that fairer comparisons can be made across differing clinical services. Service Agreements between the Department of Health and HHSs and other organisations specify the activity to be provided in WAUs by service type. Actual data for 2019-20 is preliminary. The service agreement category ‘Total WAUs—Interventions and procedures’ has been reallocated between ‘Total WAUs—Acute Inpatient Care’ and ‘Total WAUs—Outpatient Care’ based on individual HHS Inpatient vs Outpatient proportions. Delivery of activity and weighted activity units was impacted by two significant factors in 2019-20; the introduction of a revised Australian Coding Standard “0002 Additional diagnoses” from 1 July 2019 (which resulted in lower weighted activity units being calculated for admitted patients relative to the same casemix period of 2018-19 year) and COVID-19 preparation,(for example the temporary suspension of non urgent planned care services) reduced the volume of patient activity. Data for this measure is sourced from GENWAU. Actuals for 2019-20 are for the period 1 July 2019 to 30 June 2020.
19. The activity targets in 2020-21 are in QWAU Phase 22 and include activity that will be generated from the $250 million Planned Care Recovery Investment Strategy.
20. This measure counts the number of in-scope ambulatory mental health service contact hours, based on the national definition and calculation of service contacts and duration. The 2019-20 Target/Estimate is calculated based on available clinician hours multiplied by an agreed output factor and weighted for locality. Data for this measure is sourced from the Mental Health Alcohol and Other Drugs Branch. Actuals for 2019-20 are for the period 1 July 2019 to 30 June 2020.

Income statement
Mackay Hospital and Health Service 2019-20
Actual$'000
2020-21 Budget
$'000
INCOMEUser charges and fees 473,600 472,875
Grants and other contributions 15,481 14,893
Interest and distributions from managed funds 51 ..
Other revenue 4,463 5,270
Gains on sale/revaluation of assets .. ..
Total income 493,595 493,038 EXPENSES
Employee expenses 50,136 49,265
Supplies and Services:
Other supplies and services 136,762 122,705
Department of Health contract staff 278,561 287,392
Grants and subsidies .. 10
Depreciation and amortisation 29,016 28,261
Finance/borrowing costs 9 ..
Other expenses 6,845 5,091
Losses on sale/revaluation of assets 1,044 314
Total expenses 502,373 493,038 OPERATING SURPLUS/(DEFICIT) (8,778) ..

Metro North Hospital and Health Service
Overview
Metro North Hospital and Health Service (HHS) is the largest public hospital and health service in Australia, with a major clinical and research campus in Herston, on the northern CBD fringe of Brisbane. Metro North HHS operates Royal Brisbane and Women’s Hospital, The Prince Charles Hospital, Redcliffe Hospital, Caboolture Hospital, Kilcoy Hospital, as well as the Brighton Health Campus and a range of subacute, mental health, community health and oral health facilities. Metro North HHS also provides offender health services to the Woodford Correctional Centre.
With annual revenues of approximately $3 billion and some 19,000 staff, Metro North HHS is responsible for the delivery of medical, surgical, emergency, obstetrics, paediatrics, specialist outpatient clinics, mental health, critical careand clinical support services to a catchment population of over 1 million people residing in a geographic area extending from the Brisbane River to north of Kilcoy. Metro North HHS also provides a range of regional and statewide services to the broader Queensland population as well as people from northern New South Wales and Northern Territory.
Metro North HHS contributes to the implementation of Queensland’s Economic Recovery Plan and is working to protect Queenslanders and save lives, to Unite & Recover for Queensland jobs.
Metro North HHS’s vision is “excellent healthcare, working together, strong and healthy communities”. Together with our community and partners, we will deliver services informed by research and innovation to improve the health outcomes of our community.
Metro North HHS in 2020-21 will continue to deliver public hospital and health services for the Metro North community and the people referred to Metro North HHS services from across the State.
Service performance
Metro North Hospital and Health Service 2019-20Target/Est
2019-20Actual
2020-21Target/Est
Service standardsEffectiveness measuresPercentage of emergency department patients seen within recommended timeframes1
100% 100% 100%
80% 74% 80%
Category 3 (within 30 minutes) 75% 63% 75%
Category 4 (within 60 minutes) 70% 80% 70%
70% 97% 70%
Percentage of emergency department attendances who depart within 4 hours of their arrival in the department2
>80% 70% >80%
Percentage of elective surgery patients treated within clinically recommended times3
>98% 96% >98%4 >95% 91% ..
4 >95% 93% ..
Rate of healthcare associated Staphylococcus aureus (including MRSA) bloodstream (SAB) infections/10,000 acute public hospital patient days5
<2 0.8 <2
Rate of community mental health follow up within 1-7 days following discharge from an acute mental health inpatient unit6
>65% 57.9% >65%

Metro North Hospital and Health Service2019-20
Target/Est2019-20Actual
2020-21Target/Est
Proportion of re-admissions to acute psychiatric care within 28 days of discharge7
<12% 13.2% <12%
Percentage of specialist outpatients waiting within clinically recommended times8
56% 83% 56%9 70% 61% ..
Category 3 (365 days)9 94% 86% ..
Percentage of specialist outpatients seen within clinically recommended times10
81% 82% 81%11 62% 64% ..
11 89% 88% ..
Median wait time for treatment in emergency departments (minutes)12 .. 18 ..
Median wait time for elective surgery treatment (days)13 .. 36 ..
Efficiency measureAverage cost per weighted activity unit for Activity Based Funding facilities14 $ 4,549 $4,988 $4,595
Other measuresNumber of elective surgery patients treated within clinically recommended times15
10,276 10,190 10,27616 11,184 9,446 ..
16 6,123 5,465 ..
Number of Telehealth outpatient occasions of service events17 18,442 28,112 28,112
Total weighted activity units (WAUs)18,19
283,939 277,777 301,493
101,656 86,838 109,388
-acute 23,835 26,600 21,370
42,612 43,504 40,421
37,438 35,159 38,856
9,741 8,170 9,788
Ambulatory mental health service contact duration (hours)20 >171,919 149,138 >171,919
Notes:1. This is a measure of the access and timeliness of ED services. It reports the percentage of patients seen within the timeframes (in minutes)
recommended by the Australasian College of Emergency Medicine. Data sourced for this measure is from the Queensland Health Emergency Department Data Collection and manual submissions from HHSs. Actuals for 2019-20 are for the period 1 July 2019 to 30 June 2020.
2. This is a measure of access and timeliness of Emergency Department (ED) services. Data sourced for this measure is from the Queensland Health Emergency Department Data Collection and manual submissions from HHSs. The target for this performance measure remains at 80 per cent in line with Collaboration for Emergency Access Research and Reform (CLEAR) recommendations. Actuals for 2019-20 are for the period 1 July 2019 to 30 June 2020.
3. This is a measure of effectiveness that shows how hospitals perform in providing elective surgery services within the clinically recommended timeframe for each urgency category. Note consistent with the National Cabinet decision, Queensland Health temporarily suspended non urgent elective surgery in preparation for COVID-19, which has impacted the seen in time performance. Data for this measure is sourced from the Queensland Health Elective Surgery Data Collection. Actuals for 2019-20 are for the period 1 July 2019 to 30 June 2020.
4. Given the System’s focus on reducing the volume of patients waiting longer than clinically recommended for elective surgery, as a result of preparing for COVID-19, seen in time performance targets for category 2 and 3 patients are not applicable for 2020-21.
5. This is a National Performance Agreement indicator and a measure of effectiveness of infection control programs and services in hospitals. The Target/Estimate for this measure aligns with the national benchmark of two cases per 10,000 acute public hospital patient days. Data for this measure is sourced from the Communicable Diseases Branch (CDB). Actuals for 2019-20 are for the period 1 July 2019 to 31 March 2020. Full year data is unavailable.
6. This is a measure of the community support system that is in place for persons who have experienced an acute psychiatric episode requiring hospitalisation. Persons leaving hospital after a psychiatric admission with a formal discharge plan, involving linkages with community services and supports, are less likely to need early readmission. This service standard aligns with the Aboriginal and Torres Strait Islander Mental Health Strategy 2016–2021 and previous analysis has shown that there are statistically similar rates of follow up for Indigenous and non-Indigenous Queenslanders. Data for this measure is sourced from the Mental Health Alcohol and Other Drugs Branch. Actuals for 2019-20 are for the period 1 July 2019 to 30 June 2020.
7. Persons leaving hospital after a psychiatric admission with a formal discharge plan, involving linkages with community services and supports, are less likely to need early readmission. Previous analysis has shown similar rates of follow up for both Indigenous and non-Indigenous Queenslander’s are evident, but trends are impacted by a smaller number of separations for Indigenous Queenslanders. Data for this measure is sourced from the Mental Health Alcohol and Other Drugs Branch. Actuals for 2019-20 are for the period 1 July 2019 to 30 June 2020.
8. This is a measure of effectiveness that shows the percentage of patients waiting to have their first appointment (from the time of referral) with the health professional in an outpatient clinic, who were within the clinically recommended time. Specialist Outpatient volumes of waiting and seen are based on care provided/waiting at a Queensland Public Hospital and do not include activity undertaken by non-Queensland Health facilities. In preparation for COVID-19, Queensland Health temporarily suspended non urgent specialist outpatient services, which has impacted the percentage of patients waiting within the clinically recommended time. Data for this measure was sourced from the Queensland Health Specialist Outpatient Data Collection. Actuals for 2019-20 are as at 1 July 2020.
9. Given the System’s focus on reducing the volume of patients waiting longer than clinically recommended for specialist outpatients, as a result of preparing for COVID-19, wait in time performance targets for category 2 and 3 patients are not applicable for 2020-21.
10. This is a measure of effectiveness that shows the percentage of patients who were seen within clinically recommended times. As a result of preparing for COVID-19, the seen in time performance has been impacted. Actuals for 2019-20 are for the period 1 July 2019 to 30 June 2020.
11. Given the System’s focus on reducing the volume of patients waiting longer than clinically recommended for specialist outpatients, as a result of preparing for COVID-19, seen in time performance targets for category 2 and 3 patients are not applicable for 2020-21.
12. This measure indicates the length of time within which half of all people were seen in the ED (for all categories), from the time of presentation to being seen by a nurse or doctor (whichever was first). The target for this measure was removed from 2018–19. There is no nationally agreed target for this measure, and the median wait time varies depending on the proportion of patients in each urgency category. Data for this measure was sourced from the Queensland Health Emergency Department Data Collection. Actuals for 2019-20 are for the period 1 July 2019 to 30 June 2020.
13. There are no Target/Estimates as there is no national benchmark target for this measure, and the median wait time varies depending on the proportion of patients in each urgency category. Performance was impacted by the temporary suspension of non urgent elective surgery in preparation for COVID-19. Data for this measure is sourced from the Queensland Health Elective Surgery Data Collection. Actuals for 2019-20 are for the period 1 July 2019 to 30 June 2020.
14. Cost per WAU excludes Prevention and Primary Care, Specified Grants, and Clinical Education and Training. The introduction of a revised Australian Coding Standard “0002 Additional diagnoses” from 1 July 2019, resulted in lower weighted activity units being calculated for admitted patients relative to the same casemix of 2018-19 year. Furthermore, the additional costs of the COVID-19 pandemic costs and the temporary suspension of non urgent planned care services which reduced the volume of patient activity, contributed to the difference in Cost per WAU. The 2019-20 Actual is based on 1 July 2019 to 30 June 2020 ABF cost per WAU. The 2020-21 Target/Estimate is based on 2020-21 ABF funding per WAU.
15. This is a measure of activity that reports the number of elective surgery patients who were treated within the clinically recommended time in each category. It shows the volume and timeliness of elective surgery services. Consistent with the National Cabinet decision, Queensland Health temporarily suspended non urgent elective surgery in preparation for COVID-19, which has impacted the volume of elective surgery performed. Data for this measure is sourced from the Queensland Elective Surgery Data Collection. Actuals for 2019-20 are for the period 1 July 2019 to 30 June 2020.
16. Given the System’s focus on reducing the volume of patients waiting longer than clinically recommended for elective surgery, as a result of preparing for COVID-19, the volume of patients treated within clinically recommended time performance targets for category 2 and 3 patients are not applicable for 2020-21.
17. This measure tracks the growth in non-admitted patient (outpatient) telehealth service events. Rapid uptake in telemedicine occurred as a result of preparing for COVID-19. Data for this measure is sourced from the Monthly Activity Collection. Actuals for 2019-20 are for the period 1 July 2019 to 30 June 2020.

18. A WAU is a measure of complexity and volume (i.e. activity) and provides a common unit of comparison so that fairer comparisons can be made across differing clinical services. Service Agreements between the Department of Health and HHSs and other organisations specify the activity to be provided in WAUs by service type. Actual data for 2019-20 is preliminary. The service agreement category ‘Total WAUs—Interventions and procedures’ has been reallocated between ‘Total WAUs—Acute Inpatient Care’ and ‘Total WAUs—Outpatient Care’ based on individual HHS Inpatient vs Outpatient proportions. Delivery of activity and weighted activity units was impacted by two significant factors in 2019-20; the introduction of a revised Australian Coding Standard “0002 Additional diagnoses” from 1 July 2019 (which resulted in lower weighted activity units being calculated for admitted patients relative to the same casemix period of 2018-19 year) and COVID-19 preparation, (for example the temporary suspension of non urgent planned care services) reduced the volume of patient activity. Data for this measure is sourced from GENWAU. Actuals for 2019-20 are for the period 1 July 2019 to 30 June 2020.
19. The activity targets in 2020-21 are in QWAU Phase 22 and include activity that will be generated from the $250 million Planned Care Recovery Investment Strategy.
20. This measure counts the number of in-scope ambulatory mental health service contact hours, based on the national definition and calculation of service contacts and duration. The 2019-20 Target/Estimate is calculated based on available clinician hours multiplied by an agreed output factor and weighted for locality. Data for this measure is sourced from the Mental Health Alcohol and Other Drugs Branch. Actuals for 2019-20 are for the period 1 July 2019 to 30 June 2020.

Metro North Hospital and Health Service 2019-20
Actual$'000
2020-21 Budget
$'000
INCOMEUser charges and fees 3,171,724 3,164,721
Grants and other contributions 56,430 45,877
Interest and distributions from managed funds 594 574
Other revenue 6,864 6,023
Gains on sale/revaluation of assets 1,007 314
Total income 3,236,619 3,217,509 EXPENSES
Employee expenses 2,152,876 362,193
Supplies and Services:
Other supplies and services 721,090 677,037
Department of Health contract staff 79,314 1,976,922
Grants and subsidies 1,963 2,083
Depreciation and amortisation 146,302 159,837
Finance/borrowing costs 120 9,209
Other expenses 89,005 27,041
Losses on sale/revaluation of assets 14,146 3,187
Total expenses 3,204,816 3,217,509 OPERATING SURPLUS/(DEFICIT) 31,803 .. Notes:1. Due to the Hospital and Health Service (HHS) no longer being a prescribed employer, Employee Expenses in 2020-21 relate only to theHealth Service Executive and Senior Health Service employees, including Senior Medical Officers and Visiting Medical Officers.
2. All other HHS employee related expenditure is recognised as a contract labour expense under Supplies and Services effective 2020-21.
Income statement
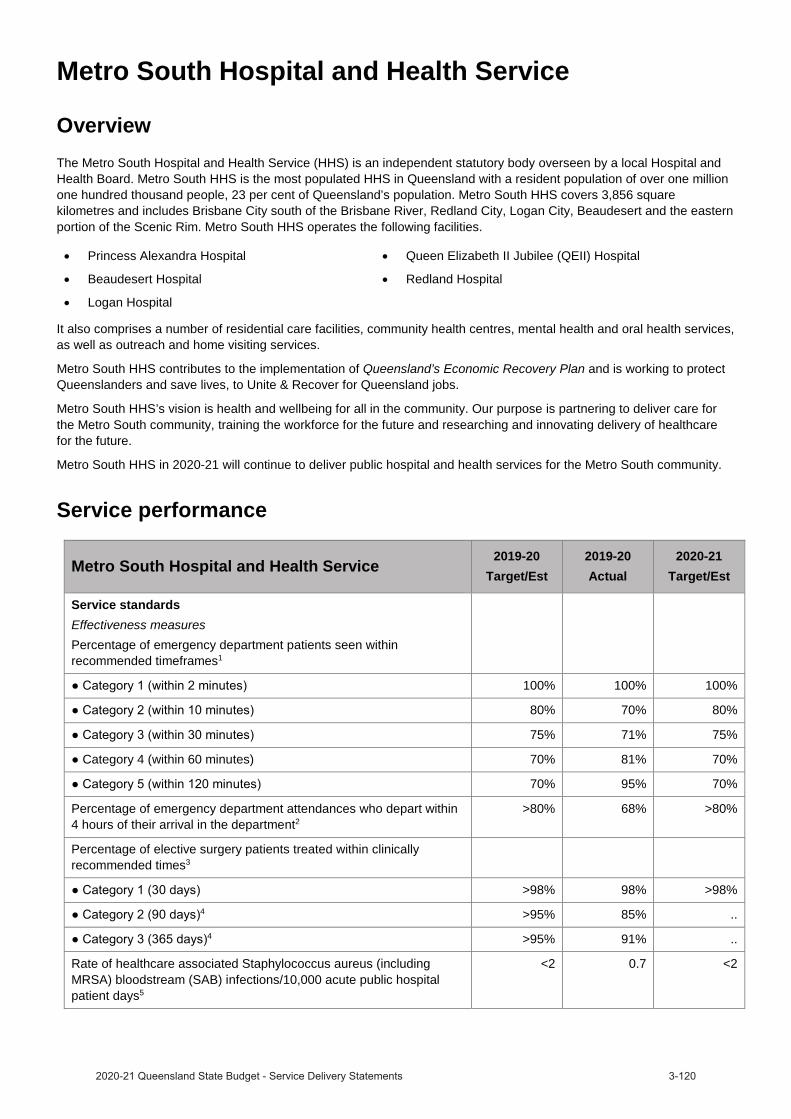
Metro South Hospital and Health Service
OverviewThe Metro South Hospital and Health Service (HHS) is an independent statutory body overseen by a local Hospital and Health Board. Metro South HHS is the most populated HHS in Queensland with a resident population of over one million one hundred thousand people, 23 per cent of Queensland’s population. Metro South HHS covers 3,856 square kilometres and includes Brisbane City south of the Brisbane River, Redland City, Logan City, Beaudesert and the eastern portion of the Scenic Rim. Metro South HHS operates the following facilities.
Princess Alexandra Hospital Queen Elizabeth II Jubilee (QEII) Hospital
Beaudesert Hospital Redland Hospital
Logan Hospital
It also comprises a number of residential care facilities, community health centres, mental health and oral health services, as well as outreach and home visiting services.
Metro South HHS contributes to the implementation of Queensland’s Economic Recovery Plan and is working to protect Queenslanders and save lives, to Unite & Recover for Queensland jobs.
Metro South HHS’s vision is health and wellbeing for all in the community. Our purpose is partnering to deliver care for the Metro South community, training the workforce for the future and researching and innovating delivery of healthcare for the future.
Metro South HHS in 2020-21 will continue to deliver public hospital and health services for the Metro South community.
Service performance
Metro South Hospital and Health Service2019-20
Target/Est2019-20Actual
2020-21Target/Est
Service standardsEffectiveness measuresPercentage of emergency department patients seen within recommended timeframes1
100% 100% 100%
80% 70% 80%
75% 71% 75%
Category 4 (within 60 minutes) 70% 81% 70%
70% 95% 70%
Percentage of emergency department attendances who depart within 4 hours of their arrival in the department2
>80% 68% >80%
Percentage of elective surgery patients treated within clinically recommended times3
>98% 98% >98%4 >95% 85% ..
4 >95% 91% ..
Rate of healthcare associated Staphylococcus aureus (including MRSA) bloodstream (SAB) infections/10,000 acute public hospital patient days5
<2 0.7 <2

Metro South Hospital and Health Service2019-20
Target/Est2019-20Actual
2020-21Target/Est
Rate of community mental health follow up within 1-7 days following discharge from an acute mental health inpatient unit6
>65% 51.1% >65%
Proportion of re-admissions to acute psychiatric care within 28 days of discharge7
<12% 13.1% <12%
Percentage of specialist outpatients waiting within clinically recommended times8
45% 57% 45%9 47% 38% ..
9 86% 82% ..
Percentage of specialist outpatients seen within clinically recommended times10
75% 76% 75%11 70% 60% ..
(365 days)11 85% 85% ..
Median wait time for treatment in emergency departments (minutes)12 .. 13 ..
Median wait time for elective surgery treatment (days)13 .. 35 ..
Efficiency measureAverage cost per weighted activity unit for Activity Based Fundingfacilities14
$ 4,998 $5,202 $4,930
Other measuresNumber of elective surgery patients treated within clinically recommended times15
9,105 8,919 9,10516 10,400 9,270 ..
16 5,391 4,013 ..
Number of Telehealth outpatient occasions of service events17 5,646 11,750 11,750
Total weighted activity units (WAUs)18,19
219,930 220,009 239,602
72,890 74,673 76,002
-acute 29,522 29,472 29,713
45,768 43,517 46,101
28,904 28,164 29,495
8,967 7,968 9,373
Ambulatory mental health service contact duration (hours)20 >174,933 164,017 >174,933
Notes:1. This is a measure of the access and timeliness of ED services. It reports the percentage of patients seen within the timeframes (in minutes)
recommended by the Australasian College of Emergency Medicine. Data sourced for this measure is from the Queensland Health Emergency Department Data Collection and manual submissions from HHSs. Actuals for 2019-20 are for the period 1 July 2019 to 30 June 2020.
2. This is a measure of access and timeliness of Emergency Department (ED) services. Data sourced for this measure is from the Queensland Health Emergency Department Data Collection and manual submissions from HHSs. The target for this performance measure remains at 80 per cent in line with Collaboration for Emergency Access Research and Reform (CLEAR) recommendations. Actuals for 2019-20 are for the period 1 July 2019 to 30 June 2020.
3. This is a measure of effectiveness that shows how hospitals perform in providing elective surgery services within the clinically recommended timeframe for each urgency category. Note consistent with the National Cabinet decision, Queensland Health temporarily suspended non urgent elective surgery in preparation for COVID-19, which has impacted the seen in time performance. Data for this measure is sourced from the Queensland Health Elective Surgery Data Collection. Actuals for 2019-20 are for the period 1 July 2019 to 30 June 2020.
4. Given the System’s focus on reducing the volume of patients waiting longer than clinically recommended for elective surgery, as a result of preparing for COVID-19, seen in time performance targets for category 2 and 3 patients are not applicable for 2020-21.
5. This is a National Performance Agreement indicator and a measure of effectiveness of infection control programs and services in hospitals. The Target/Estimate for this measure aligns with the national benchmark of two cases per 10,000 acute public hospital patient days. Data for this measure is sourced from the Communicable Diseases Branch (CDB). Actuals for 2019-20 are for the period 1 July 2019 to 31 March 2020. Full year data is unavailable.
6. This is a measure of the community support system that is in place for persons who have experienced an acute psychiatric episode requiring hospitalisation. Persons leaving hospital after a psychiatric admission with a formal discharge plan, involving linkages with community services and supports, are less likely to need early readmission. This service standard aligns with the Aboriginal and Torres Strait Islander Mental Health Strategy 2016–2021 and previous analysis has shown that there are statistically similar rates of follow up for Indigenous and non-Indigenous Queenslanders. Data for this measure is sourced from the Mental Health Alcohol and Other Drugs Branch. Actuals for 2019-20 are for the period 1 July 2019 to 30 June 2020.
7. Persons leaving hospital after a psychiatric admission with a formal discharge plan, involving linkages with community services and supports, are less likely to need early readmission. Previous analysis has shown similar rates of follow up for both Indigenous and non-Indigenous Queenslander’s are evident, but trends are impacted by a smaller number of separations for Indigenous Queenslanders. Data for this measure is sourced from the Mental Health Alcohol and Other Drugs Branch. Actuals for 2019-20 are for the period 1 July 2019 to 30 June 2020.
8. This is a measure of effectiveness that shows the percentage of patients waiting to have their first appointment (from the time of referral) with the health professional in an outpatient clinic, who were within the clinically recommended time. Specialist Outpatient volumes of waiting and seen are based on care provided/waiting at a Queensland Public Hospital and do not include activity undertaken by non-Queensland Health facilities. In preparation for COVID-19, Queensland Health temporarily suspended non urgent specialist outpatient services, which has impacted the percentage of patients waiting within the clinically recommended time. Data for this measure was sourced from theQueensland Health Specialist Outpatient Data Collection. Actuals for 2019-20 are as at 1 July 2020.
9. Given the System’s focus on reducing the volume of patients waiting longer than clinically recommended for specialist outpatients, as a result of preparing for COVID-19, wait in time performance targets for category 2 and 3 patients are not applicable for 2020-21.
10. This is a measure of effectiveness that shows the percentage of patients who were seen within clinically recommended times. As a result of preparing for COVID-19, the seen in time performance has been impacted. Actuals for 2019-20 are for the period 1 July 2019 to 30 June 2020.
11. Given the System’s focus on reducing the volume of patients waiting longer than clinically recommended for specialist outpatients, as a result of preparing for COVID-19, seen in time performance targets for category 2 and 3 patients are not applicable for 2020-21.
12. This measure indicates the length of time within which half of all people were seen in the ED (for all categories), from the time of presentation to being seen by a nurse or doctor (whichever was first). The target for this measure was removed from 2018–19. There is no nationally agreed target for this measure, and the median wait time varies depending on the proportion of patients in each urgency category. Data for this measure was sourced from the Queensland Health Emergency Department Data Collection. Actuals for 2019-20 are for the period 1 July 2019 to 30 June 2020.
13. There are no Target/Estimates as there is no national benchmark target for this measure, and the median wait time varies depending on the proportion of patients in each urgency category. Performance was impacted by the temporary suspension of non urgent elective surgery in preparation for COVID-19. Data for this measure is sourced from the Queensland Health Elective Surgery Data Collection. Actuals for 2019-20 are for the period 1 July 2019 to 30 June 2020.
14. Cost per WAU excludes Prevention and Primary Care, Specified Grants, and Clinical Education and Training. The introduction of a revised Australian Coding Standard “0002 Additional diagnoses” from 1 July 2019, resulted in lower weighted activity units being calculated for admitted patients relative to the same casemix of 2018-19 year. Furthermore, the additional costs of the COVID-19 pandemic costs and the temporary suspension of non urgent planned care services which reduced the volume of patient activity, contributed to the difference in Cost per WAU. The 2019-20 Actual is based on 1 July 2019 to 30 June 2020 ABF cost per WAU. The 2020-21 Target/Estimate is based on 2020-21 ABF funding per WAU.
15. This is a measure of activity that reports the number of elective surgery patients who were treated within the clinically recommended time in each category. It shows the volume and timeliness of elective surgery services. Consistent with the National Cabinet decision, Queensland Health temporarily suspended non urgent elective surgery in preparation for COVID-19, which has impacted the volume of elective surgery performed. Data for this measure is sourced from the Queensland Elective Surgery Data Collection. Actuals for 2019-20 are for the period 1 July 2019 to 30 June 2020.
16. Given the System’s focus on reducing the volume of patients waiting longer than clinically recommended for elective surgery, as a result of preparing for COVID-19, the volume of patients treated within clinically recommended time performance targets for category 2 and 3 patients are not applicable for 2020-21.
17. This measure tracks the growth in non-admitted patient (outpatient) telehealth service events. Rapid uptake in telemedicine occurred as a result of preparing for COVID-19. Data for this measure is sourced from the Monthly Activity Collection. Actuals for 2019-20 are for the period 1 July 2019 to 30 June 2020.

18. A WAU is a measure of complexity and volume (i.e. activity) and provides a common unit of comparison so that fairer comparisons can be made across differing clinical services. Service Agreements between the Department of Health and HHSs and other organisations specify the activity to be provided in WAUs by service type. Actual data for 2019-20 is preliminary. The service agreement category ‘Total WAUs—Interventions and procedures’ has been reallocated between ‘Total WAUs—Acute Inpatient Care’ and ‘Total WAUs—Outpatient Care’ based on individual HHS Inpatient vs Outpatient proportions. Delivery of activity and weighted activity units was impacted by two significant factors in 2019-20; the introduction of a revised Australian Coding Standard “0002 Additional diagnoses” from 1 July 2019 (which resulted in lower weighted activity units being calculated for admitted patients relative to the same casemix period of 2018-19 year) and COVID-19 preparation, (for example the temporary suspension of non urgent planned care services) reduced the volume of patient activity. Data for this measure is sourced from GENWAU. Actuals for 2019-20 are for the period 1 July 2019 to 30 June 2020.
19. The activity targets in 2020-21 are in QWAU Phase 22 and include activity that will be generated from the $250 million Planned Care Recovery Investment Strategy.
20. This measure counts the number of in-scope ambulatory mental health service contact hours, based on the national definition and calculation of service contacts and duration. The 2019-20 Target/Estimate is calculated based on available clinician hours multiplied by an agreed output factor and weighted for locality. Data for this measure is sourced from the Mental Health Alcohol and Other Drugs Branch. Actuals for 2019-20 are for the period 1 July 2019 to 30 June 2020.

Income statement
Metro South Hospital and Health Service 2019-20
Actual$'000
2020-21 Budget
$'000
INCOMEUser charges and fees 2,613,241 2,618,696
Grants and other contributions 53,093 50,977
Interest and distributions from managed funds 394 302
Other revenue 3,034 1,181
Gains on sale/revaluation of assets 207 ..
Total income 2,669,969 2,671,156 EXPENSES
Employee expenses 1,828,415 291,742
Supplies and Services:
Other supplies and services 662,471 652,386
Department of Health contract staff 65,915 1,600,156
Grants and subsidies 2,906 712
Depreciation and amortisation 84,481 91,476
Finance/borrowing costs 343 265
Other expenses 29,369 32,708
Losses on sale/revaluation of assets 5,503 1,711
Total expenses 2,679,403 2,671,156 (9,434) .. OPERATING SURPLUS/(DEFICIT)
Notes:1. Due to the Hospital and Health Service (HHS) no longer being a prescribed employer, Employee Expenses in 2020-21 relate only to theHealth Service Executive and Senior Health Service employees, including Senior Medical Officers and Visiting Medical Officers.
2. All other HHS employee related expenditure is recognised as a contract labour expense under Supplies and Services effective 2020-21.
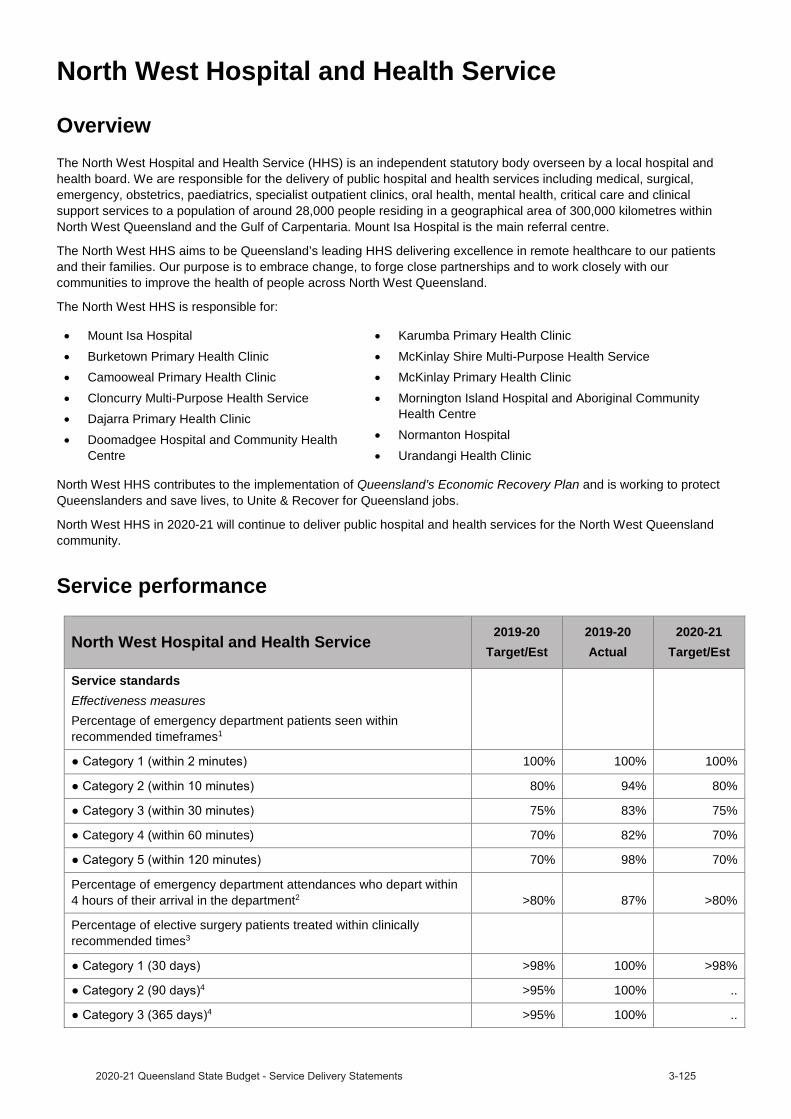
North West Hospital and Health Service
OverviewThe North West Hospital and Health Service (HHS) is an independent statutory body overseen by a local hospital and health board. We are responsible for the delivery of public hospital and health services including medical, surgical, emergency, obstetrics, paediatrics, specialist outpatient clinics, oral health, mental health, critical care and clinical support services to a population of around 28,000 people residing in a geographical area of 300,000 kilometres within North West Queensland and the Gulf of Carpentaria. Mount Isa Hospital is the main referral centre.
The North West HHS aims to be Queensland’s leading HHS delivering excellence in remote healthcare to our patients and their families. Our purpose is to embrace change, to forge close partnerships and to work closely with our communities to improve the health of people across North West Queensland.
The North West HHS is responsible for:
Mount Isa HospitalBurketown Primary Health ClinicCamooweal Primary Health ClinicCloncurry Multi-Purpose Health ServiceDajarra Primary Health ClinicDoomadgee Hospital and Community Health Centre
Karumba Primary Health ClinicMcKinlay Shire Multi-Purpose Health ServiceMcKinlay Primary Health ClinicMornington Island Hospital and Aboriginal Community Health CentreNormanton HospitalUrandangi Health Clinic
North West HHS contributes to the implementation of Queensland’s Economic Recovery Plan and is working to protect Queenslanders and save lives, to Unite & Recover for Queensland jobs.
North West HHS in 2020-21 will continue to deliver public hospital and health services for the North West Queensland community.
Service performance
North West Hospital and Health Service2019-20
Target/Est2019-20Actual
2020-21Target/Est
Service standardsEffectiveness measuresPercentage of emergency department patients seen within recommended timeframes1
100% 100% 100%
80% 94% 80%
75% 83% 75%
Category 4 (within 60 minutes) 70% 82% 70%
70% 98% 70%
Percentage of emergency department attendances who depart within 4 hours of their arrival in the department2 >80% 87% >80%
Percentage of elective surgery patients treated within clinically recommended times3
>98% 100% >98%4 >95% 100% ..
4 >95% 100% ..

North West Hospital and Health Service2019-20
Target/Est2019-20Actual
2020-21Target/Est
Rate of healthcare associated Staphylococcus aureus (including MRSA) bloodstream (SAB) infections/10,000 acute public hospital patient days5 <2 0.0 <2
Percentage of specialist outpatients waiting within clinically recommended times6
98% 66% 98%7 95% 87% ..
7 95% 94% ..
Percentage of specialist outpatients seen within clinically recommended times8
98% 97% 98%9 95% 97% ..
9 95% 99% ..
Median wait time for treatment in emergency departments (minutes)10 .. 10 ..
Median wait time for elective surgery treatment (days)11 .. 26 ..
Efficiency measureAverage cost per weighted activity unit for Activity Based Funding facilities12 $ 5,019 $5,565 $4,827
Other measuresNumber of elective surgery patients treated within clinically recommended times13
230 208 23014 253 277 ..
14 231 190 ..
Number of Telehealth outpatient occasions of service events15 5,579 5,482 5,482
Total weighted activity units (WAUs)16,17
10,966 11,672 11,848
2,945 2,840 2,828
-acute 966 983 839
5,600 5,902 5,699
351 300 189
333 283 344
Ambulatory mental health service contact duration (hours)18 >7,591 7,104 >7,591
Notes:1. This is a measure of the access and timeliness of ED services. It reports the percentage of patients seen within the timeframes (in minutes)
recommended by the Australasian College of Emergency Medicine. Data sourced for this measure is from the Queensland Health Emergency Department Data Collection and manual submissions from HHSs. Actuals for 2019-20 are for the period 1 July 2019 to 30 June 2020.
2. This is a measure of access and timeliness of Emergency Department (ED) services. Data sourced for this measure is from the Queensland Health Emergency Department Data Collection and manual submissions from HHSs. The target for this performance measure remains at 80 per cent in line with Collaboration for Emergency Access Research and Reform (CLEAR) recommendations. Actuals for 2019-20 are for the period 1 July 2019 to 30 June 2020.
3. This is a measure of effectiveness that shows how hospitals perform in providing elective surgery services within the clinically recommended timeframe for each urgency category. Note consistent with the National Cabinet decision, Queensland Health temporarily suspended non urgent elective surgery in preparation for COVID-19, which has impacted the seen in time performance. Data for this measure is sourced from the Queensland Health Elective Surgery Data Collection. Actuals for 2019-20 are for the period 1 July 2019 to 30 June 2020.

4. Given the System’s focus on reducing the volume of patients waiting longer than clinically recommended for elective surgery, as a result of preparing for COVID-19, seen in time performance targets for category 2 and 3 patients are not applicable for 2020-21.
5. This is a National Performance Agreement indicator and a measure of effectiveness of infection control programs and services in hospitals. The Target/Estimate for this measure aligns with the national benchmark of two cases per 10,000 acute public hospital patient days. Data for this measure is sourced from the Communicable Diseases Branch (CDB). Actuals for 2019-20 are for the period 1 July 2019 to 31 March 2020. Full year data is unavailable.
6. This is a measure of effectiveness that shows the percentage of patients waiting to have their first appointment (from the time of referral) with the health professional in an outpatient clinic, who were within the clinically recommended time. Specialist Outpatient volumes of waiting and seen are based on care provided/waiting at a Queensland Public Hospital and do not include activity undertaken by non-Queensland Health facilities. In preparation for COVID-19, Queensland Health temporarily suspended non urgent specialist outpatient services, which has impacted the percentage of patients waiting within the clinically recommended time. Data for this measure was sourced from the Queensland Health Specialist Outpatient Data Collection. Actuals for 2019-20 are as at 1 July 2020.
7. Given the System’s focus on reducing the volume of patients waiting longer than clinically recommended for specialist outpatients, as a result of preparing for COVID-19, wait in time performance targets for category 2 and 3 patients are not applicable for 2020-21.
8. This is a measure of effectiveness that shows the percentage of patients who were seen within clinically recommended times. As a result of preparing for COVID-19, the seen in time performance has been impacted. Actuals for 2019-20 are for the period 1 July 2019 to 30 June 2020.
9. Given the System’s focus on reducing the volume of patients waiting longer than clinically recommended for specialist outpatients, as a result of preparing for COVID-19, seen in time performance targets for category 2 and 3 patients are not applicable for 2020-21.
10. This measure indicates the length of time within which half of all people were seen in the ED (for all categories), from the time of presentation to being seen by a nurse or doctor (whichever was first). The target for this measure was removed from 2018–19. There is no nationally agreed target for this measure, and the median wait time varies depending on the proportion of patients in each urgency category. Data for this measure was sourced from the Queensland Health Emergency Department Data Collection. Actuals for 2019-20 are for the period 1 July 2019 to 30 June 2020.
11. There are no Target/Estimates as there is no national benchmark target for this measure, and the median wait time varies depending on the proportion of patients in each urgency category. Performance was impacted by the temporary suspension of non urgent elective surgery in preparation for COVID-19. Data for this measure is sourced from the Queensland Health Elective Surgery Data Collection. Actuals for 2019-20 are for the period 1 July 2019 to 30 June 2020.
12. Cost per WAU excludes Prevention and Primary Care, Specified Grants, and Clinical Education and Training. The introduction of a revised Australian Coding Standard “0002 Additional diagnoses” from 1 July 2019, resulted in lower weighted activity units being calculated for admitted patients relative to the same casemix of 2018-19 year. Furthermore, the additional costs of the COVID-19 pandemic costs and the temporary suspension of non urgent planned care services which reduced the volume of patient activity, contributed to the difference in Cost per WAU. The 2019-20 Actual is based on 1 July 2019 to 30 June 2020 ABF cost per WAU. The 2020-21 Target/Estimate is based on 2020-21 ABF funding per WAU.
13. This is a measure of activity that reports the number of elective surgery patients who were treated within the clinically recommended time in each category. It shows the volume and timeliness of elective surgery services. Consistent with the National Cabinet decision, Queensland Health temporarily suspended non urgent elective surgery in preparation for COVID-19, which has impacted the volume of elective surgery performed. Data for this measure is sourced from the Queensland Elective Surgery Data Collection. Actuals for 2019-20 are for the period 1 July 2019 to 30 June 2020.
14. Given the System’s focus on reducing the volume of patients waiting longer than clinically recommended for elective surgery, as a result of preparing for COVID-19, the volume of patients treated within clinically recommended time performance targets for category 2 and 3 patients are not applicable for 2020-21.
15. This measure tracks the growth in non-admitted patient (outpatient) telehealth service events. Rapid uptake in telemedicine occurred as a result of preparing for COVID-19. Data for this measure is sourced from the Monthly Activity Collection. Actuals for 2019-20 are for the period 1 July 2019 to 30 June 2020.
16. A WAU is a measure of complexity and volume (i.e. activity) and provides a common unit of comparison so that fairer comparisons can be made across differing clinical services. Service Agreements between the Department of Health and HHSs and other organisations specify the activity to be provided in WAUs by service type. Actual data for 2019-20 is preliminary. The service agreement category ‘Total WAUs—Interventions and procedures’ has been reallocated between ‘Total WAUs—Acute Inpatient Care’ and ‘Total WAUs—Outpatient Care’ based on individual HHS Inpatient vs Outpatient proportions. Delivery of activity and weighted activity units was impacted by two significant factors in 2019-20; the introduction of a revised Australian Coding Standard “0002 Additional diagnoses” from 1 July 2019 (which resulted in lowerweighted activity units being calculated for admitted patients relative to the same casemix period of 2018-19 year) and COVID-19 preparation, (for example the temporary suspension of non urgent planned care services) reduced the volume of patient activity. Data for this measure is sourced from GENWAU. Actuals for 2019-20 are for the period 1 July 2019 to 30 June 2020.
17. The activity targets in 2020-21 are in QWAU Phase 22.18. This measure counts the number of in-scope ambulatory mental health service contact hours, based on the national definition and calculation
of service contacts and duration. The 2019-20 Target/Estimate is calculated based on available clinician hours multiplied by an agreed output factor and weighted for locality. Data for this measure is sourced from the Mental Health Alcohol and Other Drugs Branch. Actuals for 2019-20 are for the period 1 July 2019 to 30 June 2020.

Income statement
North West Hospital and Health Service 2019-20
Actual$'000
2020-21 Budget
$'000
INCOMEUser charges and fees 195,739 192,904
Grants and other contributions 4,277 5,405
Interest and distributions from managed funds 6 7
Other revenue 1,193 1,354
Gains on sale/revaluation of assets .. ..
Total income 201,215 199,670 EXPENSES
Employee expenses 110,421 25,435
Supplies and Services:
Other supplies and services 82,101 71,621
Department of Health contract staff 3,611 90,570
Grants and subsidies 1,015 423
Depreciation and amortisation 9,970 9,049
Finance/borrowing costs 29 ..
Other expenses 2,069 2,329
Losses on sale/revaluation of assets 354 243
Total expenses 209,570 199,670 OPERATING SURPLUS/(DEFICIT) (8,355) .. Notes:1. Due to the Hospital and Health Service (HHS) no longer being a prescribed employer, Employee Expenses in 2020-21 relate only to the Health Service Executive and Senior Health Service employees, including Senior Medical Officers and Visiting Medical Officers.
2. All other HHS employee related expenditure is recognised as a contract labour expense under Supplies and Services effective 2020-21.
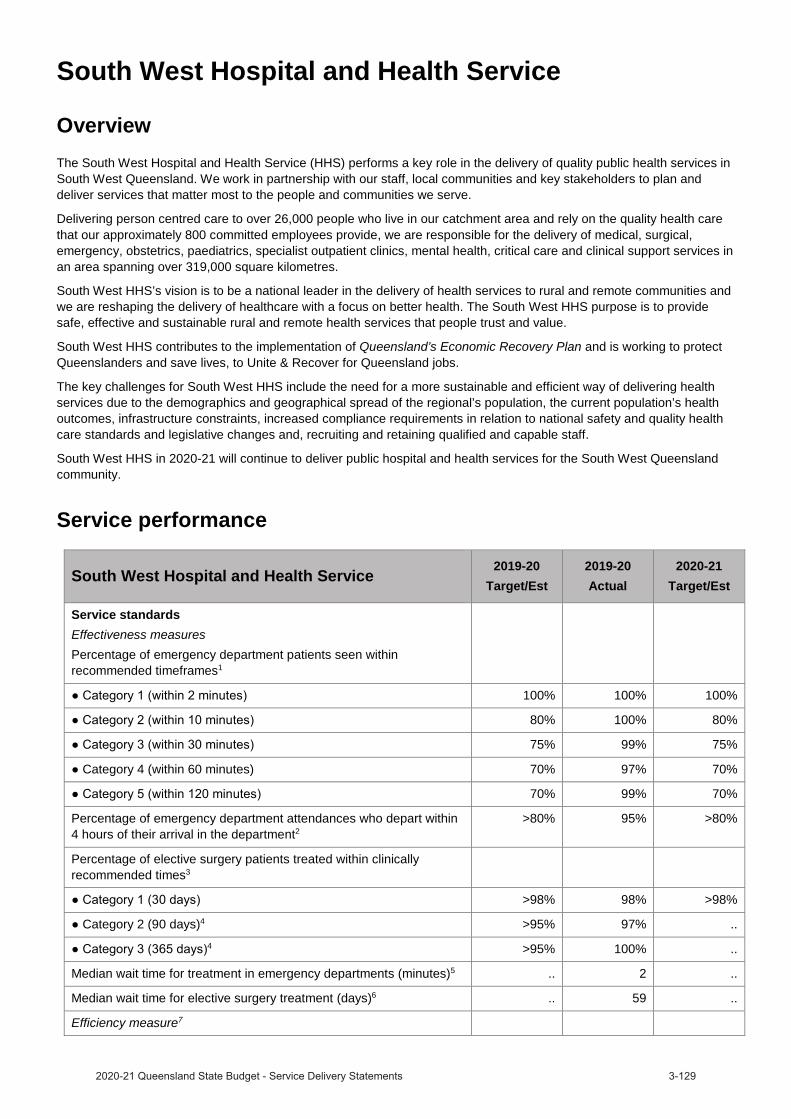
South West Hospital and Health Service
OverviewThe South West Hospital and Health Service (HHS) performs a key role in the delivery of quality public health services in South West Queensland. We work in partnership with our staff, local communities and key stakeholders to plan and deliver services that matter most to the people and communities we serve.
Delivering person centred care to over 26,000 people who live in our catchment area and rely on the quality health care that our approximately 800 committed employees provide, we are responsible for the delivery of medical, surgical, emergency, obstetrics, paediatrics, specialist outpatient clinics, mental health, critical care and clinical support services in an area spanning over 319,000 square kilometres.
South West HHS’s vision is to be a national leader in the delivery of health services to rural and remote communities and we are reshaping the delivery of healthcare with a focus on better health. The South West HHS purpose is to provide safe, effective and sustainable rural and remote health services that people trust and value.
South West HHS contributes to the implementation of Queensland’s Economic Recovery Plan and is working to protect Queenslanders and save lives, to Unite & Recover for Queensland jobs.
The key challenges for South West HHS include the need for a more sustainable and efficient way of delivering health services due to the demographics and geographical spread of the regional’s population, the current population’s health outcomes, infrastructure constraints, increased compliance requirements in relation to national safety and quality health care standards and legislative changes and, recruiting and retaining qualified and capable staff.
South West HHS in 2020-21 will continue to deliver public hospital and health services for the South West Queensland community.
Service performance
South West Hospital and Health Service 2019-20Target/Est
2019-20Actual
2020-21Target/Est
Service standardsEffectiveness measuresPercentage of emergency department patients seen within recommended timeframes1
100% 100% 100%
80% 100% 80%
75% 99% 75%
Category 4 (within 60 minutes) 70% 97% 70%
70% 99% 70%
Percentage of emergency department attendances who depart within 4 hours of their arrival in the department2
>80% 95% >80%
Percentage of elective surgery patients treated within clinically recommended times3
>98% 98% >98%
Category 2 (90 days)4 >95% 97% ..4 >95% 100% ..
Median wait time for treatment in emergency departments (minutes)5 .. 2 ..
Median wait time for elective surgery treatment (days)6 .. 59 ..
Efficiency measure7
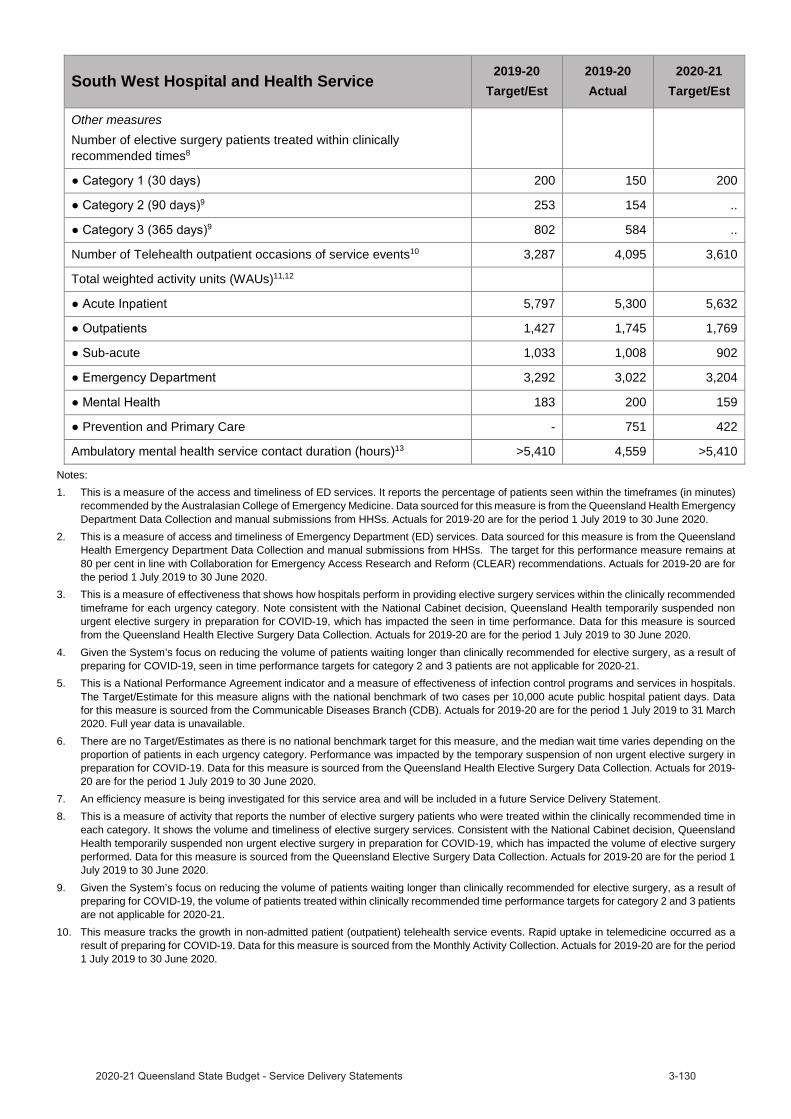
South West Hospital and Health Service2019-20
Target/Est2019-20Actual
2020-21Target/Est
Other measuresNumber of elective surgery patients treated within clinically recommended times8
200 150 2009 253 154 ..
9 802 584 ..
Number of Telehealth outpatient occasions of service events10 3,287 4,095 3,610
Total weighted activity units (WAUs)11,12
5,797 5,300 5,632
1,427 1,745 1,769
-acute 1,033 1,008 902
3,292 3,022 3,204
183 200 159
Prevention and Primary Care - 751 422
Ambulatory mental health service contact duration (hours)13 >5,410 4,559 >5,410
Notes:1. This is a measure of the access and timeliness of ED services. It reports the percentage of patients seen within the timeframes (in minutes)
recommended by the Australasian College of Emergency Medicine. Data sourced for this measure is from the Queensland Health Emergency Department Data Collection and manual submissions from HHSs. Actuals for 2019-20 are for the period 1 July 2019 to 30 June 2020.
2. This is a measure of access and timeliness of Emergency Department (ED) services. Data sourced for this measure is from the Queensland Health Emergency Department Data Collection and manual submissions from HHSs. The target for this performance measure remains at 80 per cent in line with Collaboration for Emergency Access Research and Reform (CLEAR) recommendations. Actuals for 2019-20 are for the period 1 July 2019 to 30 June 2020.
3. This is a measure of effectiveness that shows how hospitals perform in providing elective surgery services within the clinically recommended timeframe for each urgency category. Note consistent with the National Cabinet decision, Queensland Health temporarily suspended non urgent elective surgery in preparation for COVID-19, which has impacted the seen in time performance. Data for this measure is sourced from the Queensland Health Elective Surgery Data Collection. Actuals for 2019-20 are for the period 1 July 2019 to 30 June 2020.
4. Given the System’s focus on reducing the volume of patients waiting longer than clinically recommended for elective surgery, as a result of preparing for COVID-19, seen in time performance targets for category 2 and 3 patients are not applicable for 2020-21.
5. This is a National Performance Agreement indicator and a measure of effectiveness of infection control programs and services in hospitals. The Target/Estimate for this measure aligns with the national benchmark of two cases per 10,000 acute public hospital patient days. Data for this measure is sourced from the Communicable Diseases Branch (CDB). Actuals for 2019-20 are for the period 1 July 2019 to 31 March 2020. Full year data is unavailable.
6. There are no Target/Estimates as there is no national benchmark target for this measure, and the median wait time varies depending on the proportion of patients in each urgency category. Performance was impacted by the temporary suspension of non urgent elective surgery in preparation for COVID-19. Data for this measure is sourced from the Queensland Health Elective Surgery Data Collection. Actuals for 2019-20 are for the period 1 July 2019 to 30 June 2020.
7. An efficiency measure is being investigated for this service area and will be included in a future Service Delivery Statement.8. This is a measure of activity that reports the number of elective surgery patients who were treated within the clinically recommended time in
each category. It shows the volume and timeliness of elective surgery services. Consistent with the National Cabinet decision, Queensland Health temporarily suspended non urgent elective surgery in preparation for COVID-19, which has impacted the volume of elective surgery performed. Data for this measure is sourced from the Queensland Elective Surgery Data Collection. Actuals for 2019-20 are for the period 1 July 2019 to 30 June 2020.
9. Given the System’s focus on reducing the volume of patients waiting longer than clinically recommended for elective surgery, as a result of preparing for COVID-19, the volume of patients treated within clinically recommended time performance targets for category 2 and 3 patients are not applicable for 2020-21.
10. This measure tracks the growth in non-admitted patient (outpatient) telehealth service events. Rapid uptake in telemedicine occurred as a result of preparing for COVID-19. Data for this measure is sourced from the Monthly Activity Collection. Actuals for 2019-20 are for the period 1 July 2019 to 30 June 2020.
11. A WAU is a measure of complexity and volume (i.e. activity) and provides a common unit of comparison so that fairer comparisons can be made across differing clinical services. Service Agreements between the Department of Health and HHSs and other organisations specify the activity to be provided in WAUs by service type. Actual data for 2019-20 is preliminary. The service agreement category ‘Total WAUs—Interventions and procedures’ has been reallocated between ‘Total WAUs—Acute Inpatient Care’ and ‘Total WAUs—Outpatient Care’ based on individual HHS Inpatient vs Outpatient proportions. Delivery of activity and weighted activity units was impacted by two significant factors in 2019-20; the introduction of a revised Australian Coding Standard “0002 Additional diagnoses” from 1 July 2019 (which resulted in lower weighted activity units being calculated for admitted patients relative to the same casemix period of 2018-19 year) and COVID-19 preparation, (for example the temporary suspension of non urgent planned care services) reduced the volume of patient activity. Data for this measure is sourced from GENWAU. Actuals for 2019-20 are for the period 1 July 2019 to 30 June 2020.
12. The activity targets in 2020-21 are in QWAU Phase 22.13. This measure counts the number of in-scope ambulatory mental health service contact hours, based on the national definition and calculation
of service contacts and duration. The 2019-20 Target/Estimate is calculated based on available clinician hours multiplied by an agreed output factor and weighted for locality. Data for this measure is sourced from the Mental Health Alcohol and Other Drugs Branch. Actuals for 2019-20 are for the period 1 July 2019 to 30 June 2020.

Income statement
South West Hospital and Health Service 2019-20
Actual$'000
2020-21 Budget
$'000
INCOMEUser charges and fees 150,561 158,863
Grants and other contributions 8,753 7,065
Interest and distributions from managed funds 38 20
Other revenue 503 334
Gains on sale/revaluation of assets 17 ..
Total income 159,872 166,282 EXPENSES
Employee expenses 13,385 12,991
Supplies and Services:
Other supplies and services 47,958 52,731
Department of Health contract staff 86,912 88,988
Grants and subsidies .. ..
Depreciation and amortisation 7,700 10,620
Finance/borrowing costs 19 ..
Other expenses 2,658 802
Losses on sale/revaluation of assets 241 150
Total expenses 158,873 166,282 OPERATING SURPLUS/(DEFICIT) 999 ..

Sunshine Coast Hospital and Health Service
OverviewSunshine Coast Hospital and Health Service (HHS) is the major provider of public health services, health education and research in the Sunshine Coast, Gympie and Noosa local government areas. Established in 2012, Sunshine Coast HHS is an independent statutory body governed by the Sunshine Coast Hospital and Health Board.
The Sunshine Coast HHS covers approximately 10,020 square kilometres, stretching to Gympie at its northern boundary, south to Caloundra and out to Kilkivan in the west. The Sunshine Coast HHS operates the following facilities:
Sunshine Coast University Hospital
Nambour General Hospital
Gympie Hospital
Caloundra Health Service
Maleny Soldiers Memorial Hospital
Glenbrook Residential Aged Care Facility
Maroochydore Community Hub
Janelle Killick Community Care Unit
Through a new 10-year partnership, which began July 2020, public patients have access to care at the private Noosa Hospital, providing a broad range of public health services including intensive and critical care, inpatient medical services, elective surgery, emergency department and outpatient clinics.
The Sunshine Coast HHS contributes to the implementation of Queensland’s Economic Recovery Plan and is working to protect Queenslanders and save lives, to Unite & Recover for Queensland jobs.
The Sunshine Coast HHS in 2020-21 will continue to deliver public hospital and health services for the Sunshine Coast community.
Service performance
Sunshine Coast Hospital and Health Service 2019-20Target/Est
2019-20Actual
2020-21Target/Est
Service standardsEffectiveness measuresPercentage of emergency department patients seen within recommended timeframes1
100% 100% 100%
80% 76% 80%
75% 74% 75%
Category 4 (within 60 minutes) 70% 82% 70%
70% 98% 70%
Percentage of emergency department attendances who depart within 4 hours of their arrival in the department2 >80% 73% >80%
Percentage of elective surgery patients treated within clinically recommended times3
>98% 89% >98%4 >95% 70% *
4 >95% 70% *
Rate of healthcare associated Staphylococcus aureus (including MRSA) bloodstream (SAB) infections/10,000 acute public hospital patient days5 <2 0.9 <2
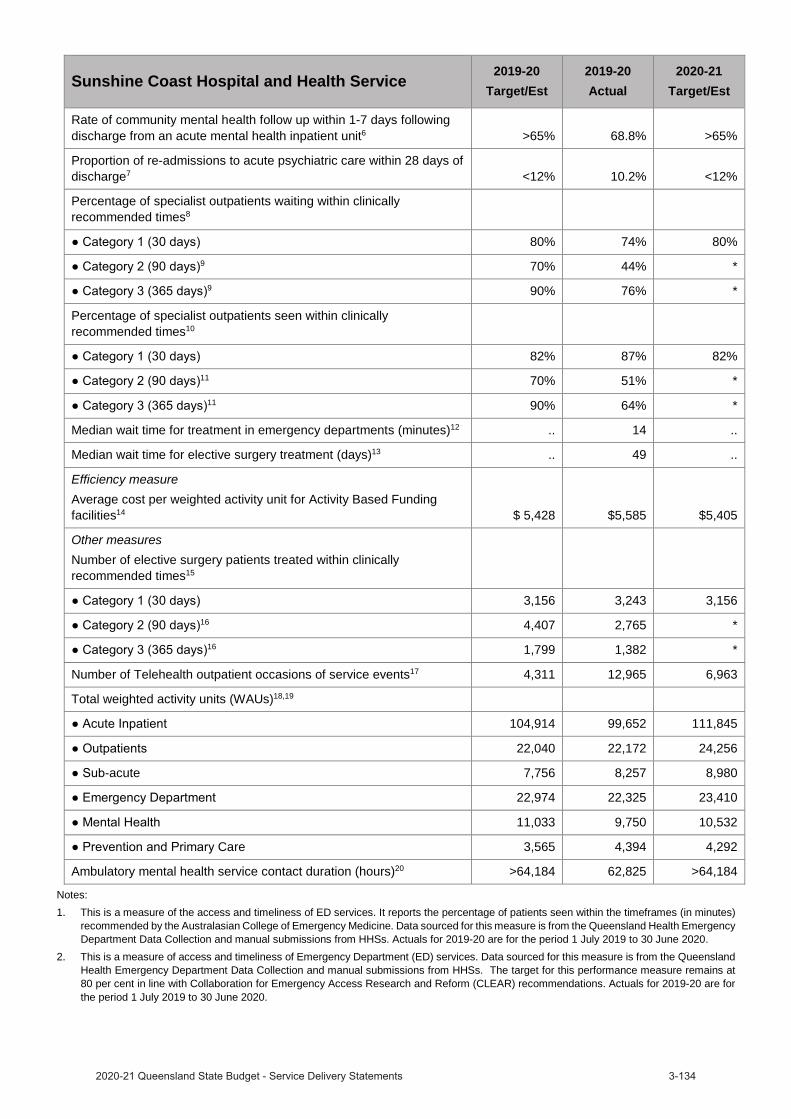
Sunshine Coast Hospital and Health Service2019-20
Target/Est2019-20Actual
2020-21Target/Est
Rate of community mental health follow up within 1-7 days following discharge from an acute mental health inpatient unit6 >65% 68.8% >65%
Proportion of re-admissions to acute psychiatric care within 28 days of discharge7 <12% 10.2% <12%
Percentage of specialist outpatients waiting within clinically recommended times8
80% 74% 80%9 70% 44% *
9 90% 76% *
Percentage of specialist outpatients seen within clinically recommended times10
82% 87% 82%11 70% 51% *
11 90% 64% *
Median wait time for treatment in emergency departments (minutes)12 .. 14 ..
Median wait time for elective surgery treatment (days)13 .. 49 ..
Efficiency measureAverage cost per weighted activity unit for Activity Based Funding facilities14 $ 5,428 $5,585 $5,405
Other measuresNumber of elective surgery patients treated within clinically recommended times15
3,156 3,243 3,15616 4,407 2,765 *
16 1,799 1,382 *
Number of Telehealth outpatient occasions of service events17 4,311 12,965 6,963
Total weighted activity units (WAUs)18,19
104,914 99,652 111,845
22,040 22,172 24,256
-acute 7,756 8,257 8,980
22,974 22,325 23,410
11,033 9,750 10,532
Care 3,565 4,394 4,292
Ambulatory mental health service contact duration (hours)20 >64,184 62,825 >64,184
Notes:1. This is a measure of the access and timeliness of ED services. It reports the percentage of patients seen within the timeframes (in minutes)
recommended by the Australasian College of Emergency Medicine. Data sourced for this measure is from the Queensland Health Emergency Department Data Collection and manual submissions from HHSs. Actuals for 2019-20 are for the period 1 July 2019 to 30 June 2020.
2. This is a measure of access and timeliness of Emergency Department (ED) services. Data sourced for this measure is from the Queensland Health Emergency Department Data Collection and manual submissions from HHSs. The target for this performance measure remains at 80 per cent in line with Collaboration for Emergency Access Research and Reform (CLEAR) recommendations. Actuals for 2019-20 are for the period 1 July 2019 to 30 June 2020.

3. This is a measure of effectiveness that shows how hospitals perform in providing elective surgery services within the clinically recommended timeframe for each urgency category. Note consistent with the National Cabinet decision, Queensland Health temporarily suspended non urgent elective surgery in preparation for COVID-19, which has impacted the seen in time performance. Data for this measure is sourced from the Queensland Health Elective Surgery Data Collection. Actuals for 2019-20 are for the period 1 July 2019 to 30 June 2020.
4. Given the System’s focus on reducing the volume of patients waiting longer than clinically recommended for elective surgery, as a result of preparing for COVID-19, seen in time performance targets for category 2 and 3 patients are not applicable for 2020-21.
5. This is a National Performance Agreement indicator and a measure of effectiveness of infection control programs and services in hospitals. The Target/Estimate for this measure aligns with the national benchmark of two cases per 10,000 acute public hospital patient days. Data for this measure is sourced from the Communicable Diseases Branch (CDB). Actuals for 2019-20 are for the period 1 July 2019 to 31 March 2020. Full year data is unavailable.
6. This is a measure of the community support system that is in place for persons who have experienced an acute psychiatric episode requiring hospitalisation. Persons leaving hospital after a psychiatric admission with a formal discharge plan, involving linkages with community services and supports, are less likely to need early readmission. This service standard aligns with the Aboriginal and Torres Strait Islander Mental Health Strategy 2016–2021 and previous analysis has shown that there are statistically similar rates of follow up for Indigenous and non-Indigenous Queenslanders. Data for this measure is sourced from the Mental Health Alcohol and Other Drugs Branch. Actuals for 2019-20 are for the period 1 July 2019 to 30 June 2020.
7. Persons leaving hospital after a psychiatric admission with a formal discharge plan, involving linkages with community services and supports, are less likely to need early readmission. Previous analysis has shown similar rates of follow up for both Indigenous and non-Indigenous Queenslander’s are evident, but trends are impacted by a smaller number of separations for Indigenous Queenslanders. Data for this measure is sourced from the Mental Health Alcohol and Other Drugs Branch. Actuals for 2019-20 are for the period 1 July 2019 to 30 June 2020.
8. This is a measure of effectiveness that shows the percentage of patients waiting to have their first appointment (from the time of referral) with the health professional in an outpatient clinic, who were within the clinically recommended time. Specialist Outpatient volumes of waiting and seen are based on care provided/waiting at a Queensland Public Hospital and do not include activity undertaken by non-Queensland Health facilities. In preparation for COVID-19, Queensland Health temporarily suspended non urgent specialist outpatient services, which has impacted the percentage of patients waiting within the clinically recommended time. Data for this measure was sourced from theQueensland Health Specialist Outpatient Data Collection. Actuals for 2019-20 are as at 1 July 2020.
9. Given the System’s focus on reducing the volume of patients waiting longer than clinically recommended for specialist outpatients, as a result of preparing for COVID-19, wait in time performance targets for category 2 and 3 patients are not applicable for 2020-21.
10. This is a measure of effectiveness that shows the percentage of patients who were seen within clinically recommended times. As a result of preparing for COVID-19, the seen in time performance has been impacted. Actuals for 2019-20 are for the period 1 July 2019 to 30 June 2020.
11. Given the System’s focus on reducing the volume of patients waiting longer than clinically recommended for specialist outpatients, as a result of preparing for COVID-19, seen in time performance targets for category 2 and 3 patients are not applicable for 2020-21.
12. This measure indicates the length of time within which half of all people were seen in the ED (for all categories), from the time of presentation to being seen by a nurse or doctor (whichever was first). The target for this measure was removed from 2018–19. There is no nationally agreed target for this measure, and the median wait time varies depending on the proportion of patients in each urgency category. Data for this measure was sourced from the Queensland Health Emergency Department Data Collection. Actuals for 2019-20 are for the period 1 July 2019 to 30 June 2020.
13. There are no Target/Estimates as there is no national benchmark target for this measure, and the median wait time varies depending on the proportion of patients in each urgency category. Performance was impacted by the temporary suspension of non urgent elective surgery in preparation for COVID-19. Data for this measure is sourced from the Queensland Health Elective Surgery Data Collection. Actuals for 2019-20 are for the period 1 July 2019 to 30 June 2020.
14. Cost per WAU excludes Prevention and Primary Care, Specified Grants, and Clinical Education and Training. The introduction of a revised Australian Coding Standard “0002 Additional diagnoses” from 1 July 2019, resulted in lower weighted activity units being calculated for admitted patients relative to the same casemix of 2018-19 year. Furthermore, the additional costs of the COVID-19 pandemic costs and the temporary suspension of non urgent planned care services which reduced the volume of patient activity, contributed to the difference in Cost per WAU. The 2019-20 Actual is based on 1 July 2019 to 30 June 2020 ABF cost per WAU. The 2020-21 Target/Estimate is based on 2020-21 ABF funding per WAU.
15. This is a measure of activity that reports the number of elective surgery patients who were treated within the clinically recommended time in each category. It shows the volume and timeliness of elective surgery services. Consistent with the National Cabinet decision, Queensland Health temporarily suspended non urgent elective surgery in preparation for COVID-19, which has impacted the volume of elective surgery performed. Data for this measure is sourced from the Queensland Elective Surgery Data Collection. Actuals for 2019-20 are for the period 1 July 2019 to 30 June 2020.
16. Given the System’s focus on reducing the volume of patients waiting longer than clinically recommended for elective surgery, as a result of preparing for COVID-19, the volume of patients treated within clinically recommended time performance targets for category 2 and 3 patients are not applicable for 2020-21.
17. This measure tracks the growth in non-admitted patient (outpatient) telehealth service events. Rapid uptake in telemedicine occurred as a result of preparing for COVID-19. Data for this measure is sourced from the Monthly Activity Collection. Actuals for 2019-20 are for the period 1 July 2019 to 30 June 2020.

18. A WAU is a measure of complexity and volume (i.e. activity) and provides a common unit of comparison so that fairer comparisons can be made across differing clinical services. Service Agreements between the Department of Health and HHSs and other organisations specify the activity to be provided in WAUs by service type. Actual data for 2019-20 is preliminary. The service agreement category ‘Total WAUs—Interventions and procedures’ has been reallocated between ‘Total WAUs—Acute Inpatient Care’ and ‘Total WAUs—Outpatient Care’ based on individual HHS Inpatient vs Outpatient proportions. Delivery of activity and weighted activity units was impacted by two significant factors in 2019-20; the introduction of a revised Australian Coding Standard “0002 Additional diagnoses” from 1 July 2019 (which resulted in lower weighted activity units being calculated for admitted patients relative to the same casemix period of 2018-19 year) and COVID-19 preparation, (for example the temporary suspension of non urgent planned care services) reduced the volume of patient activity. Data for this measure is sourced from GENWAU. Actuals for 2019-20 are for the period 1 July 2019 to 30 June 2020.
19. The activity targets in 2020-21 are in QWAU Phase 22 and include activity that will be generated from the $250 million Planned Care Recovery Investment Strategy.
20. This measure counts the number of in-scope ambulatory mental health service contact hours, based on the national definition and calculation of service contacts and duration. The 2019-20 Target/Estimate is calculated based on available clinician hours multiplied by an agreed output factor and weighted for locality. Data for this measure is sourced from the Mental Health Alcohol and Other Drugs Branch. Actuals for 2019-20 are for the period 1 July 2019 to 30 June 2020.
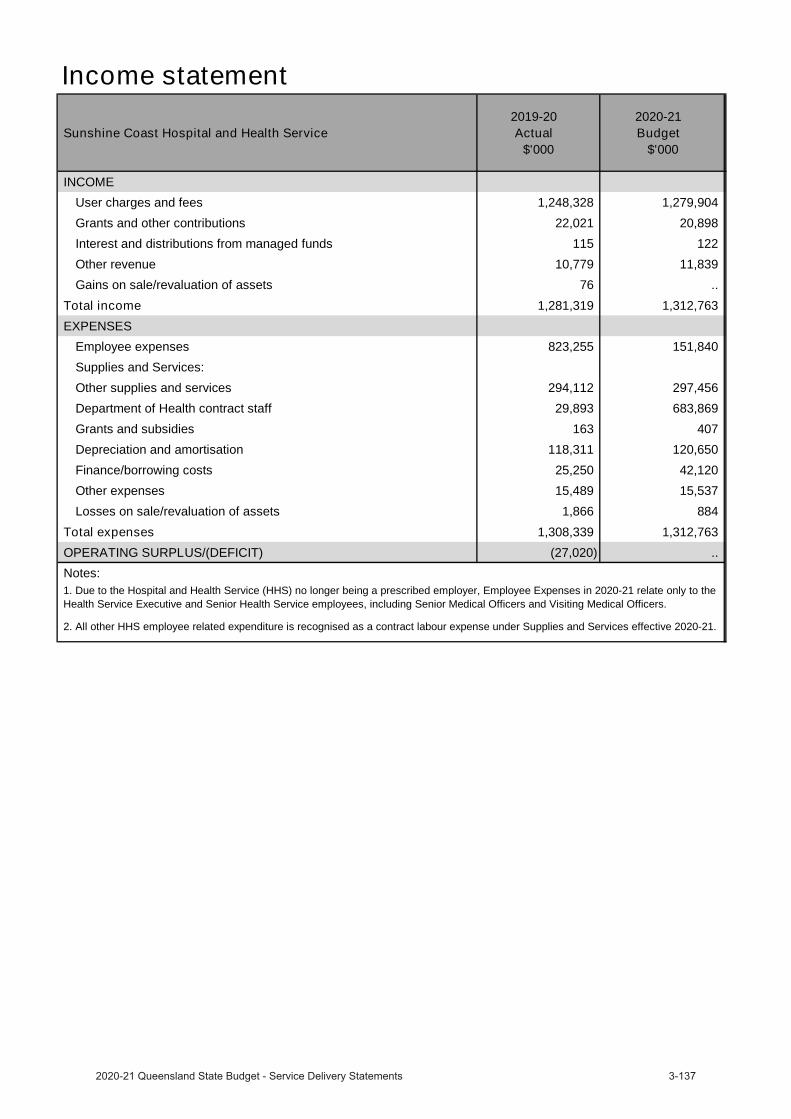
Income statement
Sunshine Coast Hospital and Health Service 2019-20
Actual$'000
2020-21 Budget
$'000
INCOMEUser charges and fees 1,248,328 1,279,904
Grants and other contributions 22,021 20,898
Interest and distributions from managed funds 115 122
Other revenue 10,779 11,839
Gains on sale/revaluation of assets 76 ..
Total income 1,281,319 1,312,763 EXPENSES
Employee expenses 823,255 151,840
Supplies and Services:
Other supplies and services 294,112 297,456
Department of Health contract staff 29,893 683,869
Grants and subsidies 163 407
Depreciation and amortisation 118,311 120,650
Finance/borrowing costs 25,250 42,120
Other expenses 15,489 15,537
Losses on sale/revaluation of assets 1,866 884
Total expenses 1,308,339 1,312,763 OPERATING SURPLUS/(DEFICIT) (27,020) .. Notes:1. Due to the Hospital and Health Service (HHS) no longer being a prescribed employer, Employee Expenses in 2020-21 relate only to the Health Service Executive and Senior Health Service employees, including Senior Medical Officers and Visiting Medical Officers.
2. All other HHS employee related expenditure is recognised as a contract labour expense under Supplies and Services effective 2020-21.

Torres and Cape Hospital and Health Service
OverviewTorres and Cape Hospital and Health Service (HHS) is an independent statutory body governed by a single Board established under the Hospital and Health Boards Act 2011. It is the largest provider of public healthcare services across 180,000 square kilometres of the most northern and remote areas of Queensland including 18 islands in the Torres Strait, two rural towns and nine remote communities in Cape York. The Torres and Cape HHS delivers care to a resident population of approximately 27,000 – 67 per cent of whom identify as First Nations people.
The Torres and Cape HHS provides health services across four hospitals and 31 primary healthcare centres and has more than 1,000 staff. The health services provided include accident and emergency care, general surgery, medical imaging, primary health care, chronic disease management, midwifery led pregnancy care with obstetric oversight, obstetric services, neonatal health, maternal and child health services, men’s and women’s health services, oral health, mental health, allied health, post-acute rehabilitation, aged care, palliative and respite services, visiting specialist services, general home and community care services and family support services incorporated where necessary such as child protection and respite care. In addition, the Health Service delivers services through partnerships with a range of government and non-government healthcare providers including outreach teams and visiting specialist services.
The Torres and Cape HHS’s vision is ‘Strengthening the region through the development of sustainable, safe and supported local workforce. Growing our ability and capability to respond to local needs by delivering innovative self-sufficient services closer to home’.
The Torres and Cape HHS contributes to the implementation of Queensland’s Economic Recovery Plan and is working to protect Queenslanders and save lives, to Unite & Recover for Queensland jobs.
The Torres and Cape HHS in 2020-21 will continue to deliver public hospital and health services for the Torres and Cape community.
Service performance
Torres and Cape Hospital and Health Service2019-20
Target/Est2019-20Actual
2020-21Target/Est
Service standardsEffectiveness measuresPercentage of emergency department patients seen within recommended timeframes1
100% 100% 100%
80% 94% 80%
75% 93% 75%
Category 4 (within 60 minutes) 70% 93% 70%
70% 98% 70%
Percentage of emergency department attendances who depart within 4 hours of their arrival in the department2
>80% 95% >80%
Percentage of elective surgery patients treated within clinically recommended times3
>98% 98% >98%4 >95% 97% ..
4 >95% 100% ..
Median wait time for treatment in emergency departments (minutes)5 .. 5 ..
Median wait time for elective surgery treatment (days)6 .. 23 ..

Torres and Cape Hospital and Health Service2019-20
Target/Est2019-20Actual
2020-21Target/Est
Efficiency measure7
Other measuresNumber of elective surgery patients treated within clinically recommended times8
64 52 649 47 57 ..
9 210 150 ..
Number of Telehealth outpatient occasions of service events10 1,797 3,265 3,265
Total weighted activity units (WAUs)11,12
5,616 5,143 5,698
2,306 2,143 2,273
-acute 434 396 370
2,552 2,389 2,462
Mental Health 145 123 111
- 544 849
Ambulatory mental health service contact duration (hours)13 >8,116 10,995 >8,116
Notes:1. This is a measure of the access and timeliness of ED services. It reports the percentage of patients seen within the timeframes (in minutes)
recommended by the Australasian College of Emergency Medicine. Data sourced for this measure is from the Queensland Health Emergency Department Data Collection and manual submissions from HHSs. Actuals for 2019-20 are for the period 1 July 2019 to 30 June 2020.
2. This is a measure of access and timeliness of Emergency Department (ED) services. Data sourced for this measure is from the Queensland Health Emergency Department Data Collection and manual submissions from HHSs. The target for this performance measure remains at 80 per cent in line with Collaboration for Emergency Access Research and Reform (CLEAR) recommendations. Actuals for 2019-20 are for the period 1 July 2019 to 30 June 2020.
3. This is a measure of effectiveness that shows how hospitals perform in providing elective surgery services within the clinically recommended timeframe for each urgency category. Note consistent with the National Cabinet decision, Queensland Health temporarily suspended non urgent elective surgery in preparation for COVID-19, which has impacted the seen in time performance. Data for this measure is sourced from the Queensland Health Elective Surgery Data Collection. Actuals for 2019-20 are for the period 1 July 2019 to 30 June 2020.
4. Given the System’s focus on reducing the volume of patients waiting longer than clinically recommended for elective surgery, as a result of preparing for COVID-19, seen in time performance targets for category 2 and 3 patients are not applicable for 2020-21.
5. This is a National Performance Agreement indicator and a measure of effectiveness of infection control programs and services in hospitals. The Target/Estimate for this measure aligns with the national benchmark of two cases per 10,000 acute public hospital patient days. Data for this measure is sourced from the Communicable Diseases Branch (CDB). Actuals for 2019-20 are for the period 1 July 2019 to 31 March 2020. Full year data is unavailable.
6. There are no Target/Estimates as there is no national benchmark target for this measure, and the median wait time varies depending on the proportion of patients in each urgency category. Performance was impacted by the temporary suspension of non urgent elective surgery in preparation for COVID-19. Data for this measure is sourced from the Queensland Health Elective Surgery Data Collection. Actuals for 2019-20 are for the period 1 July 2019 to 30 June 2020.
7. An efficiency measure is being investigated for this service area and will be included in a future Service Delivery Statement.8. This is a measure of activity that reports the number of elective surgery patients who were treated within the clinically recommended time in
each category. It shows the volume and timeliness of elective surgery services. Consistent with the National Cabinet decision, Queensland Health temporarily suspended non urgent elective surgery in preparation for COVID-19, which has impacted the volume of elective surgery performed. Data for this measure is sourced from the Queensland Elective Surgery Data Collection. Actuals for 2019-20 are for the period 1 July 2019 to 30 June 2020.
9. Given the System’s focus on reducing the volume of patients waiting longer than clinically recommended for elective surgery, as a result of preparing for COVID-19, the volume of patients treated within clinically recommended time performance targets for category 2 and 3 patients are not applicable for 2020-21.
10. This measure tracks the growth in non-admitted patient (outpatient) telehealth service events. Rapid uptake in telemedicine occurred as a result of preparing for COVID-19. Data for this measure is sourced from the Monthly Activity Collection. Actuals for 2019-20 are for the period 1 July 2019 to 30 June 2020.

11. A WAU is a measure of complexity and volume (i.e. activity) and provides a common unit of comparison so that fairer comparisons can be made across differing clinical services. Service Agreements between the Department of Health and HHSs and other organisations specify the activity to be provided in WAUs by service type. Actual data for 2019-20 is preliminary. The service agreement category ‘Total WAUs—Interventions and procedures’ has been reallocated between ‘Total WAUs—Acute Inpatient Care’ and ‘Total WAUs—Outpatient Care’ based on individual HHS Inpatient vs Outpatient proportions. Delivery of activity and weighted activity units was impacted by two significant factors in 2019-20; the introduction of a revised Australian Coding Standard “0002 Additional diagnoses” from 1 July 2019 (which resulted in lower weighted activity units being calculated for admitted patients relative to the same casemix period of 2018-19 year) and COVID-19 preparation, (for example the temporary suspension of non urgent planned care services) reduced the volume of patient activity. Data for this measure is sourced from GENWAU. Actuals for 2019-20 are for the period 1 July 2019 to 30 June 2020.
12. The activity targets in 2020-21 are in QWAU Phase 22.13. This measure counts the number of in-scope ambulatory mental health service contact hours, based on the national definition and calculation
of service contacts and duration. The 2019-20 Target/Estimate is calculated based on available clinician hours multiplied by an agreed output factor and weighted for locality. Data for this measure is sourced from the Mental Health Alcohol and Other Drugs Branch. Actuals for 2019-20 are for the period 1 July 2019 to 30 June 2020.

Income statement
Torres and Cape Hospital and Health Service 2019-20
Actual$'000
2020-21 Budget
$'000
INCOMEUser charges and fees 218,557 221,796
Grants and other contributions 20,882 17,069
Interest and distributions from managed funds 2 ..
Other revenue 3,203 1,289
Gains on sale/revaluation of assets .. ..
Total income 242,644 240,154 EXPENSES
Employee expenses 18,061 19,698
Supplies and Services:
Other supplies and services 82,209 74,882
Department of Health contract staff 118,840 123,627
Grants and subsidies .. ..
Depreciation and amortisation 18,066 18,649
Finance/borrowing costs 126 ..
Other expenses 14,778 3,288
Losses on sale/revaluation of assets 365 10
Total expenses 252,445 240,154 OPERATING SURPLUS/(DEFICIT) (9,801) ..
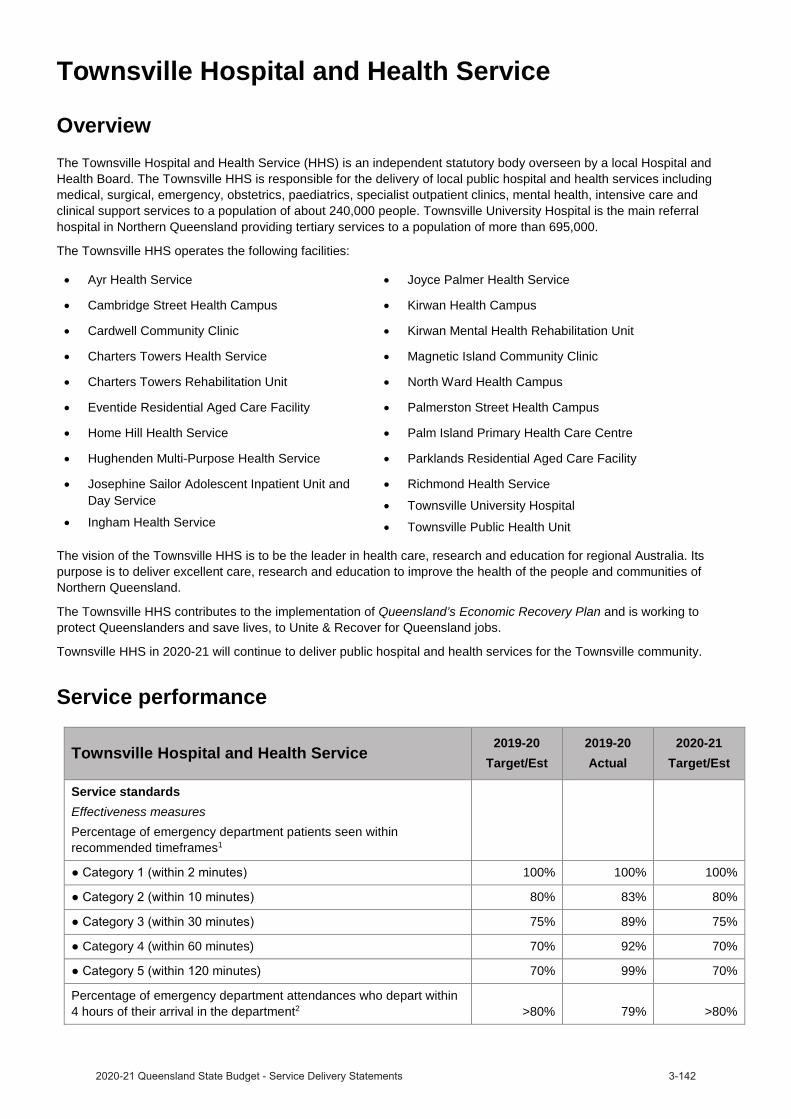
Townsville Hospital and Health Service
OverviewThe Townsville Hospital and Health Service (HHS) is an independent statutory body overseen by a local Hospital and Health Board. The Townsville HHS is responsible for the delivery of local public hospital and health services including medical, surgical, emergency, obstetrics, paediatrics, specialist outpatient clinics, mental health, intensive care and clinical support services to a population of about 240,000 people. Townsville University Hospital is the main referral hospital in Northern Queensland providing tertiary services to a population of more than 695,000.
The Townsville HHS operates the following facilities:
Ayr Health Service Joyce Palmer Health Service
Cambridge Street Health Campus Kirwan Health Campus
Cardwell Community Clinic Kirwan Mental Health Rehabilitation Unit
Charters Towers Health Service Magnetic Island Community Clinic
Charters Towers Rehabilitation Unit North Ward Health Campus
Eventide Residential Aged Care Facility Palmerston Street Health Campus
Home Hill Health Service Palm Island Primary Health Care Centre
Hughenden Multi-Purpose Health Service Parklands Residential Aged Care Facility
Josephine Sailor Adolescent Inpatient Unit and Day Service
Ingham Health Service
Richmond Health Service
Townsville University Hospital
Townsville Public Health Unit
The vision of the Townsville HHS is to be the leader in health care, research and education for regional Australia. Its purpose is to deliver excellent care, research and education to improve the health of the people and communities of Northern Queensland.
The Townsville HHS contributes to the implementation of Queensland’s Economic Recovery Plan and is working to protect Queenslanders and save lives, to Unite & Recover for Queensland jobs.
Townsville HHS in 2020-21 will continue to deliver public hospital and health services for the Townsville community.
Service performance
Townsville Hospital and Health Service2019-20
Target/Est2019-20Actual
2020-21Target/Est
Service standardsEffectiveness measuresPercentage of emergency department patients seen within recommended timeframes1
100% 100% 100%
80% 83% 80%
75% 89% 75%
Category 4 (within 60 minutes) 70% 92% 70%
minutes) 70% 99% 70%
Percentage of emergency department attendances who depart within 4 hours of their arrival in the department2 >80% 79% >80%
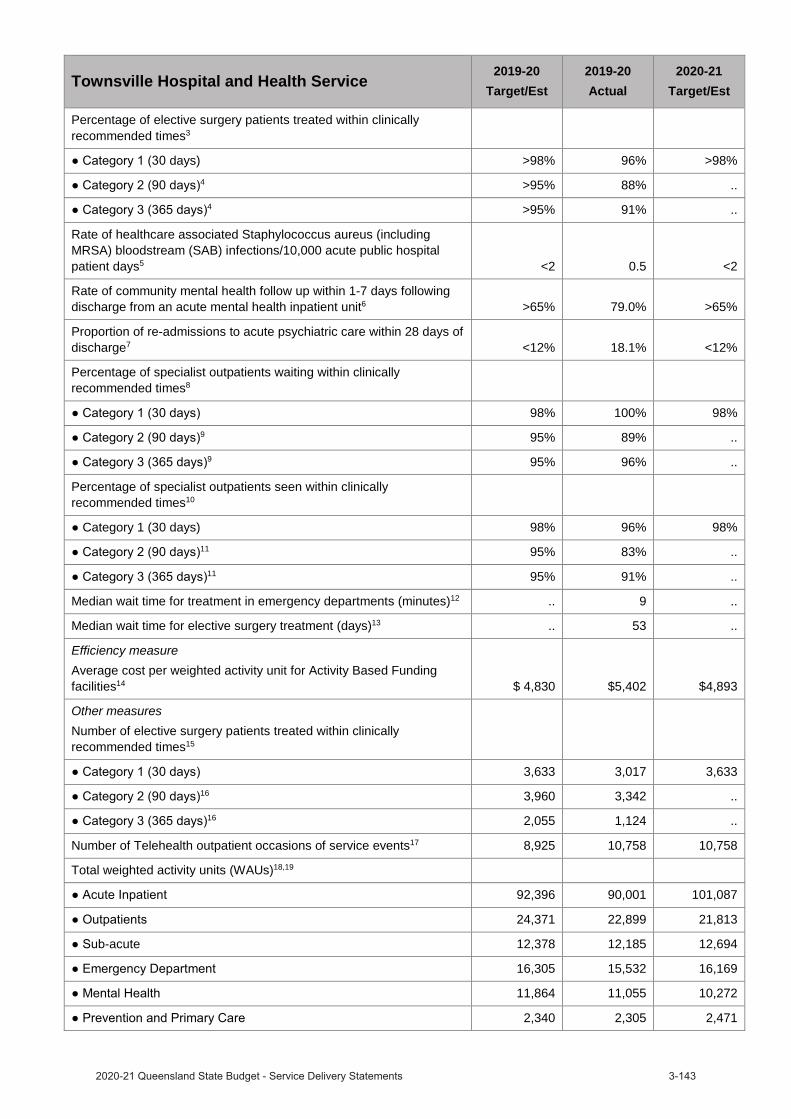
Townsville Hospital and Health Service2019-20
Target/Est2019-20Actual
2020-21Target/Est
Percentage of elective surgery patients treated within clinically recommended times3
days) >98% 96% >98%4 >95% 88% ..
4 >95% 91% ..
Rate of healthcare associated Staphylococcus aureus (including MRSA) bloodstream (SAB) infections/10,000 acute public hospital patient days5 <2 0.5 <2
Rate of community mental health follow up within 1-7 days following discharge from an acute mental health inpatient unit6 >65% 79.0% >65%
Proportion of re-admissions to acute psychiatric care within 28 days of discharge7 <12% 18.1% <12%
Percentage of specialist outpatients waiting within clinically recommended times8
98% 100% 98%9 95% 89% ..
9 95% 96% ..
Percentage of specialist outpatients seen within clinically recommended times10
Category 1 (30 days) 98% 96% 98%11 95% 83% ..
11 95% 91% ..
Median wait time for treatment in emergency departments (minutes)12 .. 9 ..
Median wait time for elective surgery treatment (days)13 .. 53 ..
Efficiency measureAverage cost per weighted activity unit for Activity Based Funding facilities14 $ 4,830 $5,402 $4,893
Other measuresNumber of elective surgery patients treated within clinically recommended times15
3,633 3,017 3,63316 3,960 3,342 ..
16 2,055 1,124 ..
Number of Telehealth outpatient occasions of service events17 8,925 10,758 10,758
Total weighted activity units (WAUs)18,19
92,396 90,001 101,087
24,371 22,899 21,813
-acute 12,378 12,185 12,694
16,305 15,532 16,169
11,864 11,055 10,272
2,340 2,305 2,471

Townsville Hospital and Health Service2019-20
Target/Est2019-20Actual
2020-21Target/Est
Ambulatory mental health service contact duration (hours)20 >68,647 62,637 >68,647
Notes:1. This is a measure of the access and timeliness of ED services. It reports the percentage of patients seen within the timeframes (in minutes)
recommended by the Australasian College of Emergency Medicine. Data sourced for this measure is from the Queensland Health Emergency Department Data Collection and manual submissions from HHSs. Actuals for 2019-20 are for the period 1 July 2019 to 30 June 2020.
2. This is a measure of access and timeliness of Emergency Department (ED) services. Data sourced for this measure is from the Queensland Health Emergency Department Data Collection and manual submissions from HHSs. The target for this performance measure remains at 80 per cent in line with Collaboration for Emergency Access Research and Reform (CLEAR) recommendations. Actuals for 2019-20 are for the period 1 July 2019 to 30 June 2020.
3. This is a measure of effectiveness that shows how hospitals perform in providing elective surgery services within the clinically recommended timeframe for each urgency category. Note consistent with the National Cabinet decision, Queensland Health temporarily suspended non urgent elective surgery in preparation for COVID-19, which has impacted the seen in time performance. Data for this measure is sourced from the Queensland Health Elective Surgery Data Collection. Actuals for 2019-20 are for the period 1 July 2019 to 30 June 2020.
4. Given the System’s focus on reducing the volume of patients waiting longer than clinically recommended for elective surgery, as a result of preparing for COVID-19, seen in time performance targets for category 2 and 3 patients are not applicable for 2020-21.
5. This is a National Performance Agreement indicator and a measure of effectiveness of infection control programs and services in hospitals. The Target/Estimate for this measure aligns with the national benchmark of two cases per 10,000 acute public hospital patient days. Data for this measure is sourced from the Communicable Diseases Branch (CDB). Actuals for 2019-20 are for the period 1 July 2019 to 31 March 2020. Full year data is unavailable.
6. This is a measure of the community support system that is in place for persons who have experienced an acute psychiatric episode requiring hospitalisation. Persons leaving hospital after a psychiatric admission with a formal discharge plan, involving linkages with community services and supports, are less likely to need early readmission. This service standard aligns with the Aboriginal and Torres Strait Islander Mental Health Strategy 2016–2021 and previous analysis has shown that there are statistically similar rates of follow up for Indigenous and non-Indigenous Queenslanders. Data for this measure is sourced from the Mental Health Alcohol and Other Drugs Branch. Actuals for 2019-20 are for the period 1 July 2019 to 30 June 2020.
7. Persons leaving hospital after a psychiatric admission with a formal discharge plan, involving linkages with community services and supports, are less likely to need early readmission. Previous analysis has shown similar rates of follow up for both Indigenous and non-Indigenous Queenslander’s are evident, but trends are impacted by a smaller number of separations for Indigenous Queenslanders. Data for this measure is sourced from the Mental Health Alcohol and Other Drugs Branch. Actuals for 2019-20 are for the period 1 July 2019 to 30 June 2020.
8. This is a measure of effectiveness that shows the percentage of patients waiting to have their first appointment (from the time of referral) with the health professional in an outpatient clinic, who were within the clinically recommended time. Specialist Outpatient volumes of waiting and seen are based on care provided/waiting at a Queensland Public Hospital and do not include activity undertaken by non-Queensland Health facilities. In preparation for COVID-19, Queensland Health temporarily suspended non urgent specialist outpatient services, which has impacted the percentage of patients waiting within the clinically recommended time. Data for this measure was sourced from the Queensland Health Specialist Outpatient Data Collection. Actuals for 2019-20 are as at 1 July 2020.
9. Given the System’s focus on reducing the volume of patients waiting longer than clinically recommended for specialist outpatients, as a result of preparing for COVID-19, wait in time performance targets for category 2 and 3 patients are not applicable for 2020-21.
10. This is a measure of effectiveness that shows the percentage of patients who were seen within clinically recommended times. As a result of preparing for COVID-19, the seen in time performance has been impacted. Actuals for 2019-20 are for the period 1 July 2019 to 30 June 2020.
11. Given the System’s focus on reducing the volume of patients waiting longer than clinically recommended for specialist outpatients, as a result of preparing for COVID-19, seen in time performance targets for category 2 and 3 patients are not applicable for 2020-21.
12. This measure indicates the length of time within which half of all people were seen in the ED (for all categories), from the time of presentation to being seen by a nurse or doctor (whichever was first). The target for this measure was removed from 2018–19. There is no nationally agreed target for this measure, and the median wait time varies depending on the proportion of patients in each urgency category. Data for this measure was sourced from the Queensland Health Emergency Department Data Collection. Actuals for 2019-20 are for the period 1 July 2019 to 30 June 2020.
13. There are no Target/Estimates as there is no national benchmark target for this measure, and the median wait time varies depending on the proportion of patients in each urgency category. Performance was impacted by the temporary suspension of non urgent elective surgery in preparation for COVID-19. Data for this measure is sourced from the Queensland Health Elective Surgery Data Collection. Actuals for 2019-20 are for the period 1 July 2019 to 30 June 2020.
14. Cost per WAU excludes Prevention and Primary Care, Specified Grants, and Clinical Education and Training. The introduction of a revised Australian Coding Standard “0002 Additional diagnoses” from 1 July 2019, resulted in lower weighted activity units being calculated for admitted patients relative to the same casemix of 2018-19 year. Furthermore, the additional costs of the COVID-19 pandemic costs and the temporary suspension of non urgent planned care services which reduced the volume of patient activity, contributed to the difference in Cost per WAU. The 2019-20 Actual is based on 1 July 2019 to 30 June 2020 ABF cost per WAU. The 2020-21 Target/Estimate is based on 2020-21 ABF funding per WAU.
15. This is a measure of activity that reports the number of elective surgery patients who were treated within the clinically recommended time in each category. It shows the volume and timeliness of elective surgery services. Consistent with the National Cabinet decision, Queensland Health temporarily suspended non urgent elective surgery in preparation for COVID-19, which has impacted the volume of elective surgery performed. Data for this measure is sourced from the Queensland Elective Surgery Data Collection. Actuals for 2019-20 are for the period 1 July 2019 to 30 June 2020.
16. Given the System’s focus on reducing the volume of patients waiting longer than clinically recommended for elective surgery, as a result of preparing for COVID-19, the volume of patients treated within clinically recommended time performance targets for category 2 and 3 patients are not applicable for 2020-21.
17. This measure tracks the growth in non-admitted patient (outpatient) telehealth service events. Rapid uptake in telemedicine occurred as a result of preparing for COVID-19. Data for this measure is sourced from the Monthly Activity Collection. Actuals for 2019-20 are for the period 1 July 2019 to 30 June 2020.
18. A WAU is a measure of complexity and volume (i.e. activity) and provides a common unit of comparison so that fairer comparisons can be made across differing clinical services. Service Agreements between the Department of Health and HHSs and other organisations specify the activity to be provided in WAUs by service type. Actual data for 2019-20 is preliminary. The service agreement category ‘Total WAUs—Interventions and procedures’ has been reallocated between ‘Total WAUs—Acute Inpatient Care’ and ‘Total WAUs—Outpatient Care’ based on individual HHS Inpatient vs Outpatient proportions. Delivery of activity and weighted activity units was impacted by two significant factors in 2019-20; the introduction of a revised Australian Coding Standard “0002 Additional diagnoses” from 1 July 2019 (which resulted in lower weighted activity units being calculated for admitted patients relative to the same casemix period of 2018-19 year) and COVID-19 preparation, (for example the temporary suspension of non urgent planned care services) reduced the volume of patient activity. Data for this measure is sourced from GENWAU. Actuals for 2019-20 are for the period 1 July 2019 to 30 June 2020.
19. The activity targets in 2020-21 are in QWAU Phase 22 and include activity that will be generated from the $250 million Planned Care Recovery Investment Strategy.
20. This measure counts the number of in-scope ambulatory mental health service contact hours, based on the national definition and calculation of service contacts and duration. The 2019-20 Target/Estimate is calculated based on available clinician hours multiplied by an agreed output factor and weighted for locality. Data for this measure is sourced from the Mental Health Alcohol and Other Drugs Branch. Actuals for 2019-20 are for the period 1 July 2019 to 30 June 2020.

Income statement
Townsville Hospital and Health Service 2019-20
Actual$'000
2020-21 Budget
$'000
INCOMEUser charges and fees 1,042,685 1,060,056
Grants and other contributions 34,544 32,116
Interest and distributions from managed funds 387 480
Other revenue 5,247 4,375
Gains on sale/revaluation of assets 35 ..
Total income 1,082,898 1,097,027 EXPENSES
Employee expenses 732,094 3,682
Supplies and Services:
Other supplies and services 244,167 267,840
Department of Health contract staff 25,438 747,566
Grants and subsidies 2,733 2,682
Depreciation and amortisation 62,459 62,464
Finance/borrowing costs 62 ..
Other expenses 12,278 11,076
Losses on sale/revaluation of assets 1,642 1,717
Total expenses 1,080,873 1,097,027 OPERATING SURPLUS/(DEFICIT) 2,025 .. Notes:1. Due to the Hospital and Health Service (HHS) no longer being a prescribed employer, Employee Expenses in 2020-21 relate only to the Health Service Executive and Senior Health Service employees, including Senior Medical Officers and Visiting Medical Officers.
2. All other HHS employee related expenditure is recognised as a contract labour expense under Supplies and Services effective 2020-21.
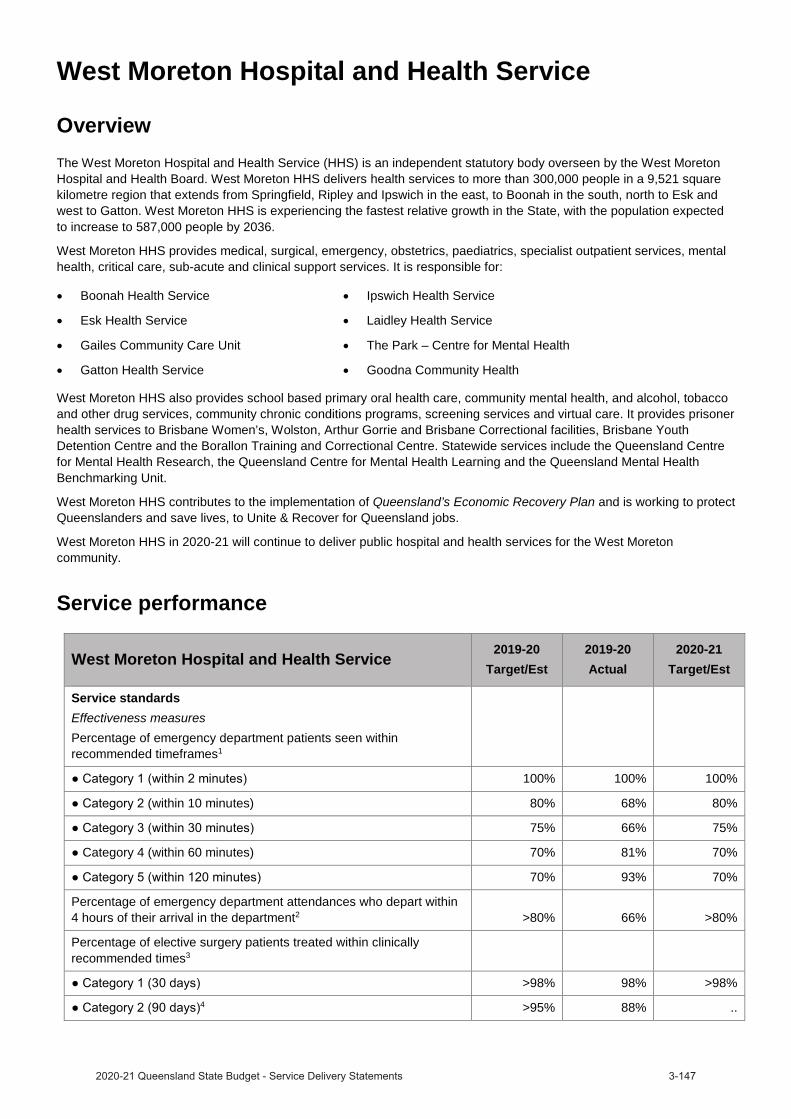
West Moreton Hospital and Health Service
OverviewThe West Moreton Hospital and Health Service (HHS) is an independent statutory body overseen by the West Moreton Hospital and Health Board. West Moreton HHS delivers health services to more than 300,000 people in a 9,521 square kilometre region that extends from Springfield, Ripley and Ipswich in the east, to Boonah in the south, north to Esk and west to Gatton. West Moreton HHS is experiencing the fastest relative growth in the State, with the population expected to increase to 587,000 people by 2036.
West Moreton HHS provides medical, surgical, emergency, obstetrics, paediatrics, specialist outpatient services, mental health, critical care, sub-acute and clinical support services. It is responsible for:
Boonah Health Service Ipswich Health Service
Esk Health Service Laidley Health Service
Gailes Community Care Unit The Park – Centre for Mental Health
Gatton Health Service Goodna Community Health
West Moreton HHS also provides school based primary oral health care, community mental health, and alcohol, tobacco and other drug services, community chronic conditions programs, screening services and virtual care. It provides prisoner health services to Brisbane Women’s, Wolston, Arthur Gorrie and Brisbane Correctional facilities, Brisbane Youth Detention Centre and the Borallon Training and Correctional Centre. Statewide services include the Queensland Centre for Mental Health Research, the Queensland Centre for Mental Health Learning and the Queensland Mental Health Benchmarking Unit.
West Moreton HHS contributes to the implementation of Queensland’s Economic Recovery Plan and is working to protect Queenslanders and save lives, to Unite & Recover for Queensland jobs.
West Moreton HHS in 2020-21 will continue to deliver public hospital and health services for the West Moreton community.
Service performance
West Moreton Hospital and Health Service 2019-20Target/Est
2019-20Actual
2020-21Target/Est
Service standardsEffectiveness measuresPercentage of emergency department patients seen within recommended timeframes1
100% 100% 100%
(within 10 minutes) 80% 68% 80%
75% 66% 75%
Category 4 (within 60 minutes) 70% 81% 70%
70% 93% 70%
Percentage of emergency department attendances who depart within 4 hours of their arrival in the department2 >80% 66% >80%
Percentage of elective surgery patients treated within clinically recommended times3
>98% 98% >98%4 >95% 88% ..

West Moreton Hospital and Health Service2019-20
Target/Est2019-20Actual
2020-21Target/Est
4 >95% 91% ..
Rate of healthcare associated Staphylococcus aureus (including MRSA) bloodstream (SAB) infections/10,000 acute public hospital patient days5 <2 0.8 <2
Rate of community mental health follow up within 1-7 days following discharge from an acute mental health inpatient unit6 >65% 64.9% >65%
Proportion of re-admissions to acute psychiatric care within 28 days of discharge7 <12% 14.4% <12%
Percentage of specialist outpatients waiting within clinically recommended times8
98% 88% 98%
Category 2 (90 days)9 95% 51% ..9 95% 86% ..
Percentage of specialist outpatients seen within clinically recommended times10
98% 91% 98%11 95% 57% ..
11 95% 92% ..
Median wait time for treatment in emergency departments (minutes)12 .. 12 ..
Median wait time for elective surgery treatment (days)13 .. 30 ..
Efficiency measureAverage cost per weighted activity unit for Activity Based Funding facilities14 $4,706 $5,252 $4,878
Other measuresNumber of elective surgery patients treated within clinically recommended times15
1,666 1,791 1,66616 2,322 1,111 ..
16 2,441 1,114 ..
Number of Telehealth outpatient occasions of service events17 2,632 5,030 5,030
Total weighted activity units (WAUs)18,19
55,581 50,183 56,033
11,200 11,633 11,792
-acute 4,115 5,056 4,564
Department 12,552 12,460 12,872
13,074 18,290 13,879
1,842 2,698 2,538
Ambulatory mental health service contact duration (hours)20 >52,691 60,963 >52,691

Notes:1. This is a measure of the access and timeliness of ED services. It reports the percentage of patients seen within the timeframes (in minutes)
recommended by the Australasian College of Emergency Medicine. Data sourced for this measure is from the Queensland Health Emergency Department Data Collection and manual submissions from HHSs. Actuals for 2019-20 are for the period 1 July 2019 to 30 June 2020.
2. This is a measure of access and timeliness of Emergency Department (ED) services. Data sourced for this measure is from the Queensland Health Emergency Department Data Collection and manual submissions from HHSs. The target for this performance measure remains at 80 per cent in line with Collaboration for Emergency Access Research and Reform (CLEAR) recommendations. Actuals for 2019-20 are for the period 1 July 2019 to 30 June 2020.
3. This is a measure of effectiveness that shows how hospitals perform in providing elective surgery services within the clinically recommended timeframe for each urgency category. Note consistent with the National Cabinet decision, Queensland Health temporarily suspended non urgent elective surgery in preparation for COVID-19, which has impacted the seen in time performance. Data for this measure is sourced from the Queensland Health Elective Surgery Data Collection. Actuals for 2019-20 are for the period 1 July 2019 to 30 June 2020.
4. Given the System’s focus on reducing the volume of patients waiting longer than clinically recommended for elective surgery, as a result of preparing for COVID-19, seen in time performance targets for category 2 and 3 patients are not applicable for 2020-21.
5. This is a National Performance Agreement indicator and a measure of effectiveness of infection control programs and services in hospitals. The Target/Estimate for this measure aligns with the national benchmark of two cases per 10,000 acute public hospital patient days. Data for this measure is sourced from the Communicable Diseases Branch (CDB). Actuals for 2019-20 are for the period 1 July 2019 to 31 March 2020. Full year data is unavailable.
6. This is a measure of the community support system that is in place for persons who have experienced an acute psychiatric episode requiring hospitalisation. Persons leaving hospital after a psychiatric admission with a formal discharge plan, involving linkages with community services and supports, are less likely to need early readmission. This service standard aligns with the Aboriginal and Torres Strait Islander Mental Health Strategy 2016–2021 and previous analysis has shown that there are statistically similar rates of follow up for Indigenous and non-Indigenous Queenslanders. Data for this measure is sourced from the Mental Health Alcohol and Other Drugs Branch. Actuals for 2019-20 are for the period 1 July 2019 to 30 June 2020.
7. Persons leaving hospital after a psychiatric admission with a formal discharge plan, involving linkages with community services and supports, are less likely to need early readmission. Previous analysis has shown similar rates of follow up for both Indigenous and non-Indigenous Queenslander’s are evident, but trends are impacted by a smaller number of separations for Indigenous Queenslanders. Data for this measure is sourced from the Mental Health Alcohol and Other Drugs Branch. Actuals for 2019-20 are for the period 1 July 2019 to 30 June 2020.
8. This is a measure of effectiveness that shows the percentage of patients waiting to have their first appointment (from the time of referral) with the health professional in an outpatient clinic, who were within the clinically recommended time. Specialist Outpatient volumes of waiting and seen are based on care provided/waiting at a Queensland Public Hospital and do not include activity undertaken by non-Queensland Health facilities. In preparation for COVID-19, Queensland Health temporarily suspended non urgent specialist outpatient services, which has impacted the percentage of patients waiting within the clinically recommended time. Data for this measure was sourced from the Queensland Health Specialist Outpatient Data Collection. Actuals for 2019-20 are as at 1 July 2020.
9. Given the System’s focus on reducing the volume of patients waiting longer than clinically recommended for specialist outpatients, as a result of preparing for COVID-19, wait in time performance targets for category 2 and 3 patients are not applicable for 2020-21.
10. This is a measure of effectiveness that shows the percentage of patients who were seen within clinically recommended times. As a result of preparing for COVID-19, the seen in time performance has been impacted. Actuals for 2019-20 are for the period 1 July 2019 to 30 June 2020.
11. Given the System’s focus on reducing the volume of patients waiting longer than clinically recommended for specialist outpatients, as a result of preparing for COVID-19, seen in time performance targets for category 2 and 3 patients are not applicable for 2020-21.
12. This measure indicates the length of time within which half of all people were seen in the ED (for all categories), from the time of presentation to being seen by a nurse or doctor (whichever was first). The target for this measure was removed from 2018–19. There is no nationally agreed target for this measure, and the median wait time varies depending on the proportion of patients in each urgency category. Data for this measure was sourced from the Queensland Health Emergency Department Data Collection. Actuals for 2019-20 are for the period 1 July 2019 to 30 June 2020.
13. There are no Target/Estimates as there is no national benchmark target for this measure, and the median wait time varies depending on the proportion of patients in each urgency category. Performance was impacted by the temporary suspension of non urgent elective surgery in preparation for COVID-19. Data for this measure is sourced from the Queensland Health Elective Surgery Data Collection. Actuals for 2019-20 are for the period 1 July 2019 to 30 June 2020.
14. Cost per WAU excludes Prevention and Primary Care, Specified Grants, and Clinical Education and Training. The introduction of a revised Australian Coding Standard “0002 Additional diagnoses” from 1 July 2019, resulted in lower weighted activity units being calculated for admitted patients relative to the same casemix of 2018-19 year. Furthermore, the additional costs of the COVID-19 pandemic costs and the temporary suspension of non urgent planned care services which reduced the volume of patient activity, contributed to the difference in Cost per WAU. The 2019-20 Actual is based on 1 July 2019 to 30 June 2020 ABF cost per WAU. The 2020-21 Target/Estimate is based on 2020-21 ABF funding per WAU.
15. This is a measure of activity that reports the number of elective surgery patients who were treated within the clinically recommended time in each category. It shows the volume and timeliness of elective surgery services. Consistent with the National Cabinet decision, Queensland Health temporarily suspended non urgent elective surgery in preparation for COVID-19, which has impacted the volume of elective surgery performed. Data for this measure is sourced from the Queensland Elective Surgery Data Collection. Actuals for 2019-20 are for the period 1 July 2019 to 30 June 2020.
16. Given the System’s focus on reducing the volume of patients waiting longer than clinically recommended for elective surgery, as a result of preparing for COVID-19, the volume of patients treated within clinically recommended time performance targets for category 2 and 3 patients are not applicable for 2020-21.
17. This measure tracks the growth in non-admitted patient (outpatient) telehealth service events. Rapid uptake in telemedicine occurred as a result of preparing for COVID-19. Data for this measure is sourced from the Monthly Activity Collection. Actuals for 2019-20 are for the period 1 July 2019 to 30 June 2020.

18. A WAU is a measure of complexity and volume (i.e. activity) and provides a common unit of comparison so that fairer comparisons can be made across differing clinical services. Service Agreements between the Department of Health and HHSs and other organisations specify the activity to be provided in WAUs by service type. Actual data for 2019-20 is preliminary. The service agreement category ‘Total WAUs—Interventions and procedures’ has been reallocated between ‘Total WAUs—Acute Inpatient Care’ and ‘Total WAUs—Outpatient Care’ based on individual HHS Inpatient vs Outpatient proportions. Delivery of activity and weighted activity units was impacted by two significant factors in 2019-20; the introduction of a revised Australian Coding Standard “0002 Additional diagnoses” from 1 July 2019 (which resulted in lower weighted activity units being calculated for admitted patients relative to the same casemix period of 2018-19 year) and COVID-19 preparation, (for example the temporary suspension of non urgent planned care services) reduced the volume of patient activity. Data for this measure is sourced from GENWAU. Actuals for 2019-20 are for the period 1 July 2019 to 30 June 2020.
19. The activity targets in 2020-21 are in QWAU Phase 22 and include activity that will be generated from the $250 million Planned Care Recovery Investment Strategy.
20. This measure counts the number of in-scope ambulatory mental health service contact hours, based on the national definition and calculation of service contacts and duration. The 2019-20 Target/Estimate is calculated based on available clinician hours multiplied by an agreed output factor and weighted for locality. Data for this measure is sourced from the Mental Health Alcohol and Other Drugs Branch. Actuals for 2019-20 are for the period 1 July 2019 to 30 June 2020.
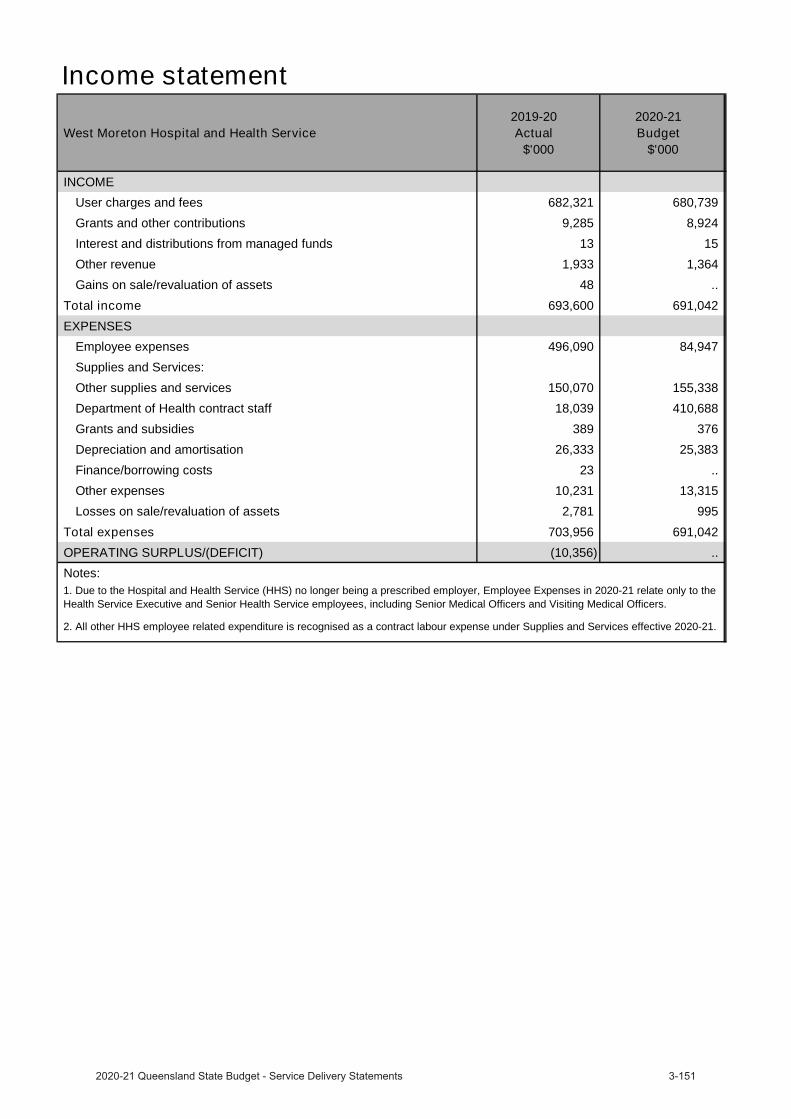
Income statement
West Moreton Hospital and Health Service 2019-20
Actual$'000
2020-21 Budget
$'000
INCOMEUser charges and fees 682,321 680,739
Grants and other contributions 9,285 8,924
Interest and distributions from managed funds 13 15
Other revenue 1,933 1,364
Gains on sale/revaluation of assets 48 ..
Total income 693,600 691,042 EXPENSES
Employee expenses 496,090 84,947
Supplies and Services:
Other supplies and services 150,070 155,338
Department of Health contract staff 18,039 410,688
Grants and subsidies 389 376
Depreciation and amortisation 26,333 25,383
Finance/borrowing costs 23 ..
Other expenses 10,231 13,315
Losses on sale/revaluation of assets 2,781 995
Total expenses 703,956 691,042 OPERATING SURPLUS/(DEFICIT) (10,356) .. Notes:1. Due to the Hospital and Health Service (HHS) no longer being a prescribed employer, Employee Expenses in 2020-21 relate only to the Health Service Executive and Senior Health Service employees, including Senior Medical Officers and Visiting Medical Officers.
2. All other HHS employee related expenditure is recognised as a contract labour expense under Supplies and Services effective 2020-21.
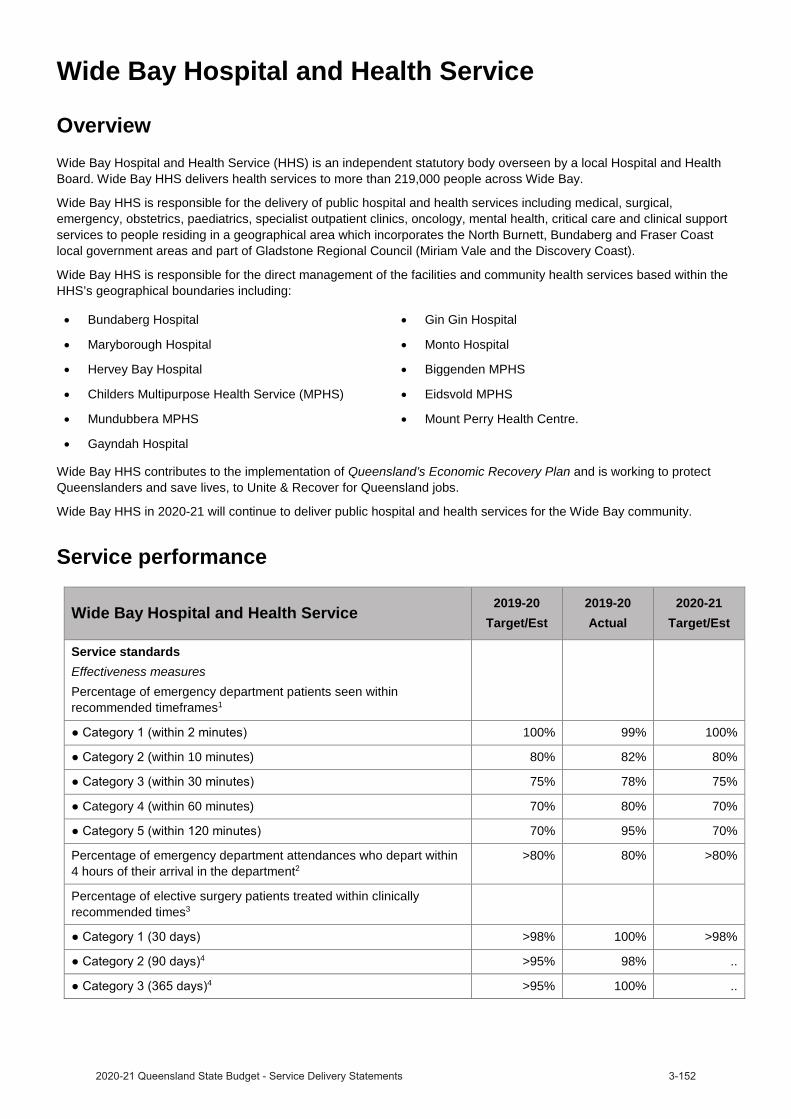
Wide Bay Hospital and Health Service
OverviewWide Bay Hospital and Health Service (HHS) is an independent statutory body overseen by a local Hospital and Health Board. Wide Bay HHS delivers health services to more than 219,000 people across Wide Bay.
Wide Bay HHS is responsible for the delivery of public hospital and health services including medical, surgical, emergency, obstetrics, paediatrics, specialist outpatient clinics, oncology, mental health, critical care and clinical support services to people residing in a geographical area which incorporates the North Burnett, Bundaberg and Fraser Coast local government areas and part of Gladstone Regional Council (Miriam Vale and the Discovery Coast).
Wide Bay HHS is responsible for the direct management of the facilities and community health services based within the HHS’s geographical boundaries including:
Bundaberg Hospital Gin Gin Hospital
Maryborough Hospital Monto Hospital
Hervey Bay Hospital Biggenden MPHS
Childers Multipurpose Health Service (MPHS) Eidsvold MPHS
Mundubbera MPHS Mount Perry Health Centre.
Gayndah Hospital
Wide Bay HHS contributes to the implementation of Queensland’s Economic Recovery Plan and is working to protect Queenslanders and save lives, to Unite & Recover for Queensland jobs.
Wide Bay HHS in 2020-21 will continue to deliver public hospital and health services for the Wide Bay community.
Service performance
Wide Bay Hospital and Health Service 2019-20Target/Est
2019-20Actual
2020-21Target/Est
Service standardsEffectiveness measuresPercentage of emergency department patients seen within recommended timeframes1
100% 99% 100%
(within 10 minutes) 80% 82% 80%
75% 78% 75%
Category 4 (within 60 minutes) 70% 80% 70%
70% 95% 70%
Percentage of emergency department attendances who depart within 4 hours of their arrival in the department2
>80% 80% >80%
Percentage of elective surgery patients treated within clinically recommended times3
>98% 100% >98%4 >95% 98% ..
4 >95% 100% ..

Wide Bay Hospital and Health Service2019-20
Target/Est2019-20Actual
2020-21Target/Est
Rate of healthcare associated Staphylococcus aureus (including MRSA) bloodstream (SAB) infections/10,000 acute public hospital patient days5
<2 0.8 <2
Rate of community mental health follow up within 1-7 days following discharge from an acute mental health inpatient unit6
>65% 66.9% >65%
Proportion of re-admissions to acute psychiatric care within 28 days of discharge7
<12% 9.1% <12%
Percentage of specialist outpatients waiting within clinically recommended times8
98% 99% 98%
Category 2 (90 days)9 95% 98% ..9 95% 89% ..
Percentage of specialist outpatients seen within clinically recommended times10
98% 99% 98%11 95% 98% ..
11 95% 98% ..
Median wait time for treatment in emergency departments (minutes)12 .. 14 ..
Median wait time for elective surgery treatment (days)13 .. 29 ..
Efficiency measureAverage cost per weighted activity unit for Activity Based Funding facilities14
$4,734 $5,206 $4,866
Other measuresNumber of elective surgery patients treated within clinically recommended times15
2,145 1,973 2,14516 1,680 1,421 ..
16 1,576 1,352 ..
Number of Telehealth outpatient occasions of service events17 7,220 6,911 6,911
Total weighted activity units (WAUs)18,19
54,794 53,850 56,721
16,062 15,602 16,911
-acute 8,431 7,813 7,106
Department 16,932 16,262 17,873
4,431 4,350 4,938
2,562 3,488 3,240
Ambulatory mental health service contact duration (hours)20 >34,523 39,880 >34,523
Notes:1. This is a measure of the access and timeliness of ED services. It reports the percentage of patients seen within the timeframes (in minutes)
recommended by the Australasian College of Emergency Medicine. Data sourced for this measure is from the Queensland Health Emergency Department Data Collection and manual submissions from HHSs. Actuals for 2019-20 are for the period 1 July 2019 to 30 June 2020.

2. This is a measure of access and timeliness of Emergency Department (ED) services. Data sourced for this measure is from the Queensland Health Emergency Department Data Collection and manual submissions from HHSs. The target for this performance measure remains at 80 per cent in line with Collaboration for Emergency Access Research and Reform (CLEAR) recommendations. Actuals for 2019-20 are for the period 1 July 2019 to 30 June 2020.
3. This is a measure of effectiveness that shows how hospitals perform in providing elective surgery services within the clinically recommended timeframe for each urgency category. Note consistent with the National Cabinet decision, Queensland Health temporarily suspended non urgent elective surgery in preparation for COVID-19, which has impacted the seen in time performance. Data for this measure is sourced from the Queensland Health Elective Surgery Data Collection. Actuals for 2019-20 are for the period 1 July 2019 to 30 June 2020.
4. Given the System’s focus on reducing the volume of patients waiting longer than clinically recommended for elective surgery, as a result of preparing for COVID-19, seen in time performance targets for category 2 and 3 patients are not applicable for 2020-21.
5. This is a National Performance Agreement indicator and a measure of effectiveness of infection control programs and services in hospitals. The Target/Estimate for this measure aligns with the national benchmark of two cases per 10,000 acute public hospital patient days. Data for this measure is sourced from the Communicable Diseases Branch (CDB). Actuals for 2019-20 are for the period 1 July 2019 to 31 March 2020. Full year data is unavailable.
6. This is a measure of the community support system that is in place for persons who have experienced an acute psychiatric episode requiring hospitalisation. Persons leaving hospital after a psychiatric admission with a formal discharge plan, involving linkages with community services and supports, are less likely to need early readmission. This service standard aligns with the Aboriginal and Torres Strait Islander Mental Health Strategy 2016–2021 and previous analysis has shown that there are statistically similar rates of follow up for Indigenous and non-Indigenous Queenslanders. Data for this measure is sourced from the Mental Health Alcohol and Other Drugs Branch. Actuals for 2019-20 are for the period 1 July 2019 to 30 June 2020.
7. Persons leaving hospital after a psychiatric admission with a formal discharge plan, involving linkages with community services and supports, are less likely to need early readmission. Previous analysis has shown similar rates of follow up for both Indigenous and non-Indigenous Queenslander’s are evident, but trends are impacted by a smaller number of separations for Indigenous Queenslanders. Data for this measure is sourced from the Mental Health Alcohol and Other Drugs Branch. Actuals for 2019-20 are for the period 1 July 2019 to 30 June 2020.
8. This is a measure of effectiveness that shows the percentage of patients waiting to have their first appointment (from the time of referral) with the health professional in an outpatient clinic, who were within the clinically recommended time. Specialist Outpatient volumes of waiting and seen are based on care provided/waiting at a Queensland Public Hospital and do not include activity undertaken by non-Queensland Health facilities. In preparation for COVID-19, Queensland Health temporarily suspended non urgent specialist outpatient services, which has impacted the percentage of patients waiting within the clinically recommended time. Data for this measure was sourced from the Queensland Health Specialist Outpatient Data Collection. Actuals for 2019-20 are as at 1 July 2020.
9. Given the System’s focus on reducing the volume of patients waiting longer than clinically recommended for specialist outpatients, as a result of preparing for COVID-19, wait in time performance targets for category 2 and 3 patients are not applicable for 2020-21.
10. This is a measure of effectiveness that shows the percentage of patients who were seen within clinically recommended times. As a result of preparing for COVID-19, the seen in time performance has been impacted. Actuals for 2019-20 are for the period 1 July 2019 to 30 June 2020.
11. Given the System’s focus on reducing the volume of patients waiting longer than clinically recommended for specialist outpatients, as a result of preparing for COVID-19, seen in time performance targets for category 2 and 3 patients are not applicable for 2020-21.
12. This measure indicates the length of time within which half of all people were seen in the ED (for all categories), from the time of presentation to being seen by a nurse or doctor (whichever was first). The target for this measure was removed from 2018–19. There is no nationally agreed target for this measure, and the median wait time varies depending on the proportion of patients in each urgency category. Data for this measure was sourced from the Queensland Health Emergency Department Data Collection. Actuals for 2019-20 are for the period 1 July 2019 to 30 June 2020.
13. There are no Target/Estimates as there is no national benchmark target for this measure, and the median wait time varies depending on the proportion of patients in each urgency category. Performance was impacted by the temporary suspension of non urgent elective surgery in preparation for COVID-19. Data for this measure is sourced from the Queensland Health Elective Surgery Data Collection. Actuals for 2019-20 are for the period 1 July 2019 to 30 June 2020.
14. Cost per WAU excludes Prevention and Primary Care, Specified Grants, and Clinical Education and Training. The introduction of a revised Australian Coding Standard “0002 Additional diagnoses” from 1 July 2019, resulted in lower weighted activity units being calculated for admitted patients relative to the same casemix of 2018-19 year. Furthermore, the additional costs of the COVID-19 pandemic costs and the temporary suspension of non urgent planned care services which reduced the volume of patient activity, contributed to the difference in Cost per WAU. The 2019-20 Actual is based on 1 July 2019 to 30 June 2020 ABF cost per WAU. The 2020-21 Target/Estimate is based on 2020-21 ABF funding per WAU.
15. This is a measure of activity that reports the number of elective surgery patients who were treated within the clinically recommended time in each category. It shows the volume and timeliness of elective surgery services. Consistent with the National Cabinet decision, Queensland Health temporarily suspended non urgent elective surgery in preparation for COVID-19, which has impacted the volume of elective surgery performed. Data for this measure is sourced from the Queensland Elective Surgery Data Collection. Actuals for 2019-20 are for the period 1 July 2019 to 30 June 2020.
16. Given the System’s focus on reducing the volume of patients waiting longer than clinically recommended for elective surgery, as a result of preparing for COVID-19, the volume of patients treated within clinically recommended time performance targets for category 2 and 3 patients are not applicable for 2020-21.
17. This measure tracks the growth in non-admitted patient (outpatient) telehealth service events. Rapid uptake in telemedicine occurred as a result of preparing for COVID-19. Data for this measure is sourced from the Monthly Activity Collection. Actuals for 2019-20 are for the period 1 July 2019 to 30 June 2020.

18. A WAU is a measure of complexity and volume (i.e. activity) and provides a common unit of comparison so that fairer comparisons can be made across differing clinical services. Service Agreements between the Department of Health and HHSs and other organisations specify the activity to be provided in WAUs by service type. Actual data for 2019-20 is preliminary. The service agreement category ‘Total WAUs—Interventions and procedures’ has been reallocated between ‘Total WAUs—Acute Inpatient Care’ and ‘Total WAUs—Outpatient Care’ based on individual HHS Inpatient vs Outpatient proportions. Delivery of activity and weighted activity units was impacted by two significant factors in 2019-20; the introduction of a revised Australian Coding Standard “0002 Additional diagnoses” from 1 July 2019 (which resulted in lower weighted activity units being calculated for admitted patients relative to the same casemix period of 2018-19 year) and COVID-19 preparation, (for example the temporary suspension of non urgent planned care services) reduced the volume of patient activity. Data for this measure is sourced from GENWAU. Actuals for 2019-20 are for the period 1 July 2019 to 30 June 2020.
19. The activity targets in 2020-21 are in QWAU Phase 22 and include activity that will be generated from the $250 million Planned Care Recovery Investment Strategy.
20. This measure counts the number of in-scope ambulatory mental health service contact hours, based on the national definition and calculation of service contacts and duration. The 2019-20 Target/Estimate is calculated based on available clinician hours multiplied by an agreed output factor and weighted for locality. Data for this measure is sourced from the Mental Health Alcohol and Other Drugs Branch. Actuals for 2019-20 are for the period 1 July 2019 to 30 June 2020.

Income statement
Wide Bay Hospital and Health Service 2019-20
Actual$'000
2020-21 Budget
$'000
INCOMEUser charges and fees 666,039 674,869
Grants and other contributions 10,254 10,067
Interest and distributions from managed funds 30 43
Other revenue 7,215 7,368
Gains on sale/revaluation of assets 98 ..
Total income 683,636 692,347 EXPENSES
Employee expenses 69,663 72,214
Supplies and Services:
Other supplies and services 204,885 200,364
Department of Health contract staff 386,084 389,271
Grants and subsidies 30 ..
Depreciation and amortisation 22,400 23,472
Finance/borrowing costs 259 270
Other expenses 6,924 6,342
Losses on sale/revaluation of assets 954 414
Total expenses 691,199 692,347 OPERATING SURPLUS/(DEFICIT) (7,563) ..
The Council of the Queensland Institute of Medical Research
OverviewThe Council of the Queensland Institute of Medical Research, known as QIMR Berghofer Medical Research Institute (QIMR Berghofer), is a world-leading medical research institute, established as a statutory body under the Queensland Institute of Medical Research Act 1945. QIMR Berghofer’s research focuses on four major areas: cancer, infectious diseases, mental health and chronic disorders. QIMR Berghofer aims to improve health by developing prevention strategies, new diagnostics and better health treatments.
QIMR Berghofer contributes to the implementation of Queensland’s Economic Recovery Plan and is working to protect Queenslanders and save lives, to Unite & Recover for Queensland jobs.
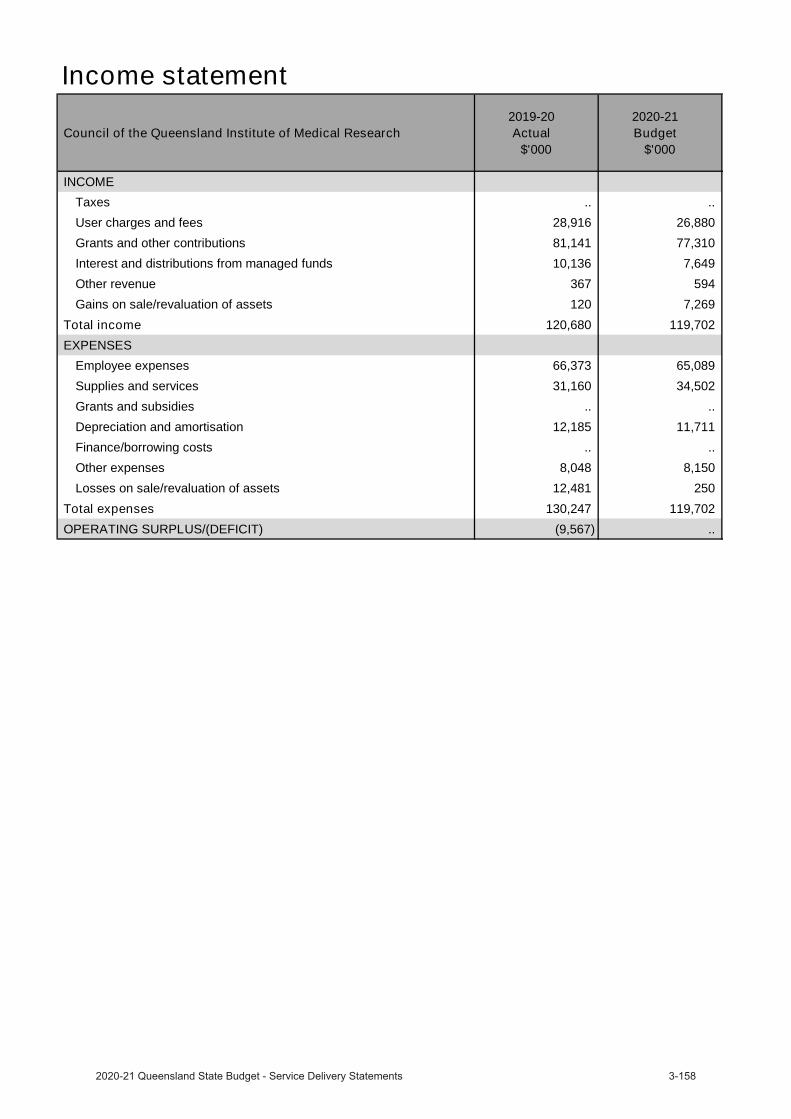
Income statement
Council of the Queensland Institute of Medical Research 2019-20
Actual$'000
2020-21 Budget
$'000
INCOMETaxes .. ..
User charges and fees 28,916 26,880
Grants and other contributions 81,141 77,310
Interest and distributions from managed funds 10,136 7,649
Other revenue 367 594
Gains on sale/revaluation of assets 120 7,269
Total income 120,680 119,702 EXPENSES
Employee expenses 66,373 65,089
Supplies and services 31,160 34,502
Grants and subsidies .. ..
Depreciation and amortisation 12,185 11,711
Finance/borrowing costs .. ..
Other expenses 8,048 8,150
Losses on sale/revaluation of assets 12,481 250
Total expenses 130,247 119,702 OPERATING SURPLUS/(DEFICIT) (9,567) ..
Queensland Mental Health Commission
OverviewEstablished under the Queensland Mental Health Commission Act 2013 the Queensland Mental Health Commission (the Commission) is an independent statutory body working to improve Queenslanders’ mental health and wellbeing. The Commission drives ongoing reform to create a more integrated, evidence-based, recovery-oriented mental health, alcohol and other drugs service system in Queensland.
The Commission contributes to the implementation of Queensland’s Economic Recovery Plan and is working to protect Queenslanders and save lives, to Unite & Recover for Queensland jobs.
The focus of the Commission’s work is driven by the implementation and oversight of the Shifting minds: Queensland Mental Health, Alcohol and Other Drugs Strategic Plan 2018–2023 (Shifting minds). Shifting minds identifies three whole of government focus areas to promote a fair and inclusive Queensland where all people can achieve positive mental health and wellbeing and live lives with meaning and purpose:
Better lives through person-centred and integrated services.
Investing to save through improved population mental health and early intervention.
Whole-of-system improvement through a balanced approach and collective action.
The Commission on behalf of the Queensland Government has also developed and supports implementation of Every life: The Queensland Suicide Prevention Plan 2019-29. The Commission facilitates collaboration across government, non-government, community, and private sectors to encourage and embed activities that improve the mental health and wellbeing of all Queenslanders.
During 2020–2021, the Commission’s work will focus on:
finalising a renewed whole-of-sector alcohol and other drugs plan for Queensland government plan.
improved lived experience, family, and carer opportunities in influencing reform.
An integrated cross-sectoral approach for the best start and early intervention.
A collaborative sectoral approach for improving mental health, AOD and suicide prevention.
A systematic approach to Mental Health Wellbeing Impact Assessment.
Reducing stigma and improving social inclusion and advocacy for human rights protection.
A sector wide needs analysis to support the growth, development, and sustainability of the mental health non-government community services sector.
Service performance The Commission is considering its approach to measuring its ability to drive reform through system stewardship and its performance across a range of operational domains.
Due to the andemic no annual survey was conducted in 2019-20 and therefore no source service standard data isavailable to assess current service measures
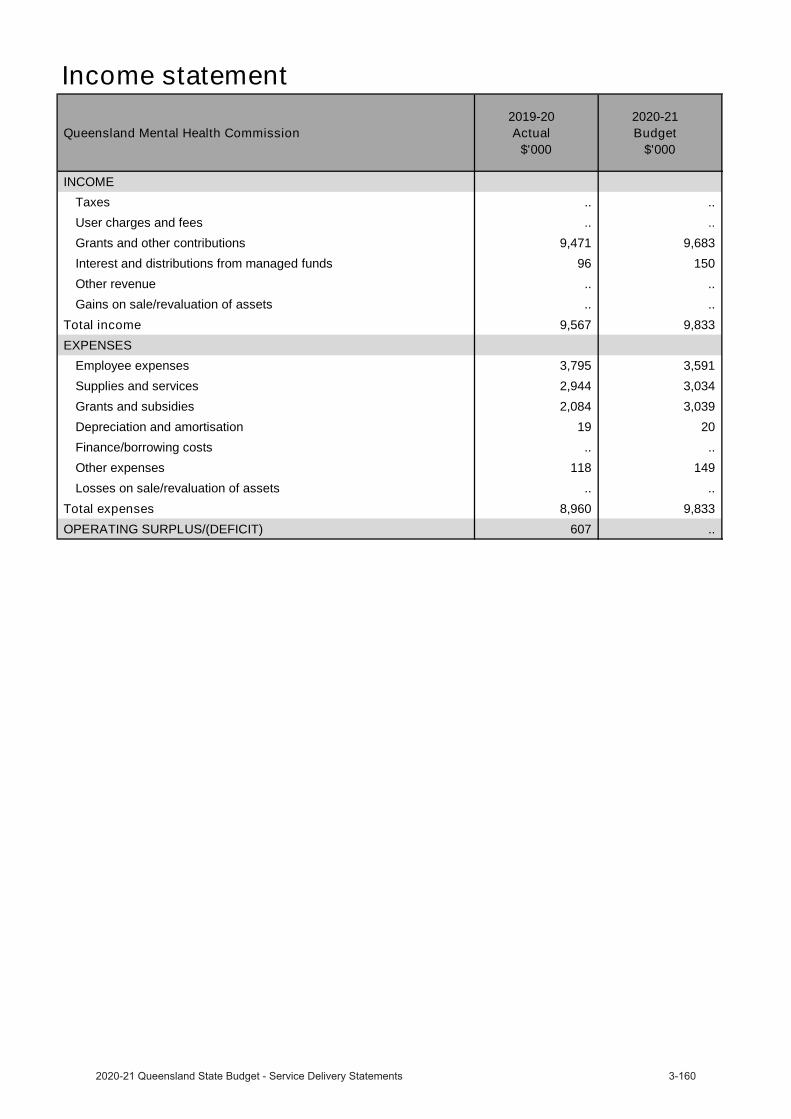
Income statement
Queensland Mental Health Commission 2019-20
Actual$'000
2020-21 Budget
$'000
INCOMETaxes .. ..
User charges and fees .. ..
Grants and other contributions 9,471 9,683
Interest and distributions from managed funds 96 150
Other revenue .. ..
Gains on sale/revaluation of assets .. ..
Total income 9,567 9,833 EXPENSES
Employee expenses 3,795 3,591
Supplies and services 2,944 3,034
Grants and subsidies 2,084 3,039
Depreciation and amortisation 19 20
Finance/borrowing costs .. ..
Other expenses 118 149
Losses on sale/revaluation of assets .. ..
Total expenses 8,960 9,833 OPERATING SURPLUS/(DEFICIT) 607 ..
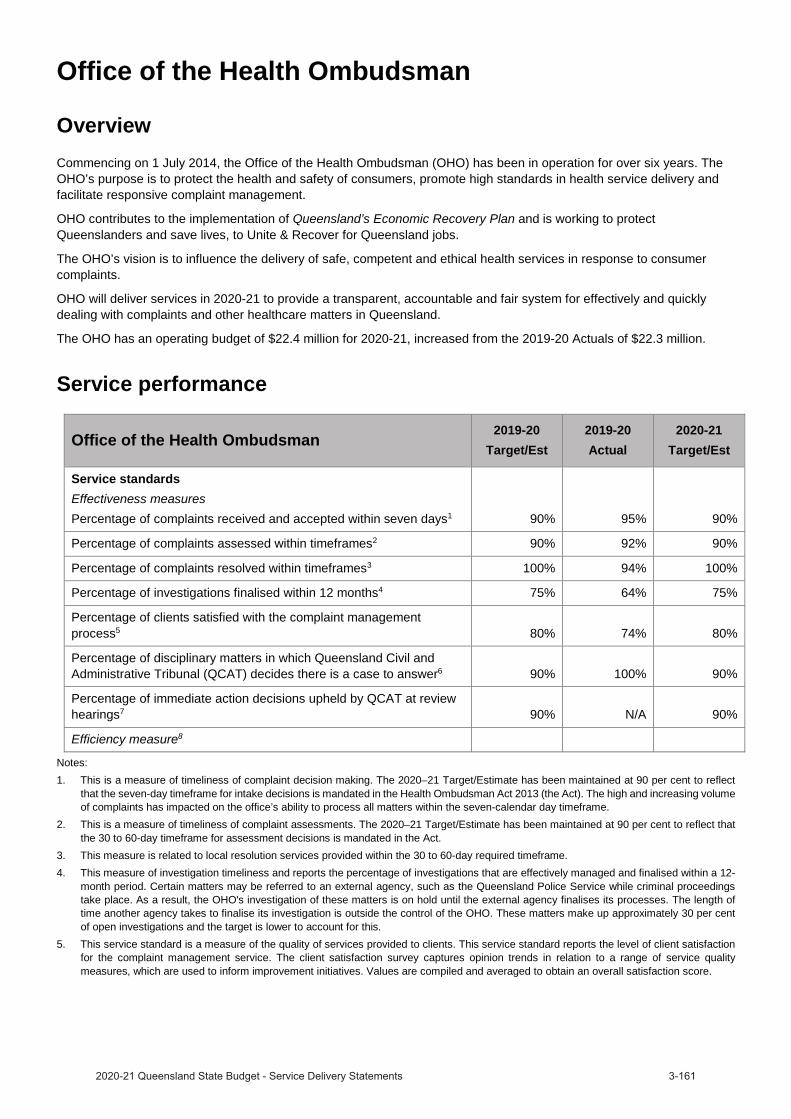
Office of the Health Ombudsman
OverviewCommencing on 1 July 2014, the Office of the Health Ombudsman (OHO) has been in operation for over six years. The OHO’s purpose is to protect the health and safety of consumers, promote high standards in health service delivery and facilitate responsive complaint management.
OHO contributes to the implementation of Queensland’s Economic Recovery Plan and is working to protect Queenslanders and save lives, to Unite & Recover for Queensland jobs.
The OHO’s vision is to influence the delivery of safe, competent and ethical health services in response to consumer complaints.
OHO will deliver services in 2020-21 to provide a transparent, accountable and fair system for effectively and quickly dealing with complaints and other healthcare matters in Queensland.
The OHO has an operating budget of $22.4 million for 2020-21, increased from the 2019-20 Actuals of $22.3 million.
Service performance
Office of the Health Ombudsman 2019-20Target/Est
2019-20Actual
2020-21Target/Est
Service standardsEffectiveness measuresPercentage of complaints received and accepted within seven days1 90% 95% 90%
Percentage of complaints assessed within timeframes2 90% 92% 90%
Percentage of complaints resolved within timeframes3 100% 94% 100%
Percentage of investigations finalised within 12 months4 75% 64% 75%
Percentage of clients satisfied with the complaint management process5 80% 74% 80%
Percentage of disciplinary matters in which Queensland Civil and Administrative Tribunal (QCAT) decides there is a case to answer6 90% 100% 90%
Percentage of immediate action decisions upheld by QCAT at review hearings7 90% N/A 90%
Efficiency measure8
Notes:1. This is a measure of timeliness of complaint decision making. The 2020–21 Target/Estimate has been maintained at 90 per cent to reflect
that the seven-day timeframe for intake decisions is mandated in the Health Ombudsman Act 2013 (the Act). The high and increasing volume of complaints has impacted on the office’s ability to process all matters within the seven-calendar day timeframe.
2. This is a measure of timeliness of complaint assessments. The 2020–21 Target/Estimate has been maintained at 90 per cent to reflect thatthe 30 to 60-day timeframe for assessment decisions is mandated in the Act.
3. This measure is related to local resolution services provided within the 30 to 60-day required timeframe.4. This measure of investigation timeliness and reports the percentage of investigations that are effectively managed and finalised within a 12-
month period. Certain matters may be referred to an external agency, such as the Queensland Police Service while criminal proceedingstake place. As a result, the OHO's investigation of these matters is on hold until the external agency finalises its processes. The length oftime another agency takes to finalise its investigation is outside the control of the OHO. These matters make up approximately 30 per centof open investigations and the target is lower to account for this.
5. This service standard is a measure of the quality of services provided to clients. This service standard reports the level of client satisfactionfor the complaint management service. The client satisfaction survey captures opinion trends in relation to a range of service qualitymeasures, which are used to inform improvement initiatives. Values are compiled and averaged to obtain an overall satisfaction score.
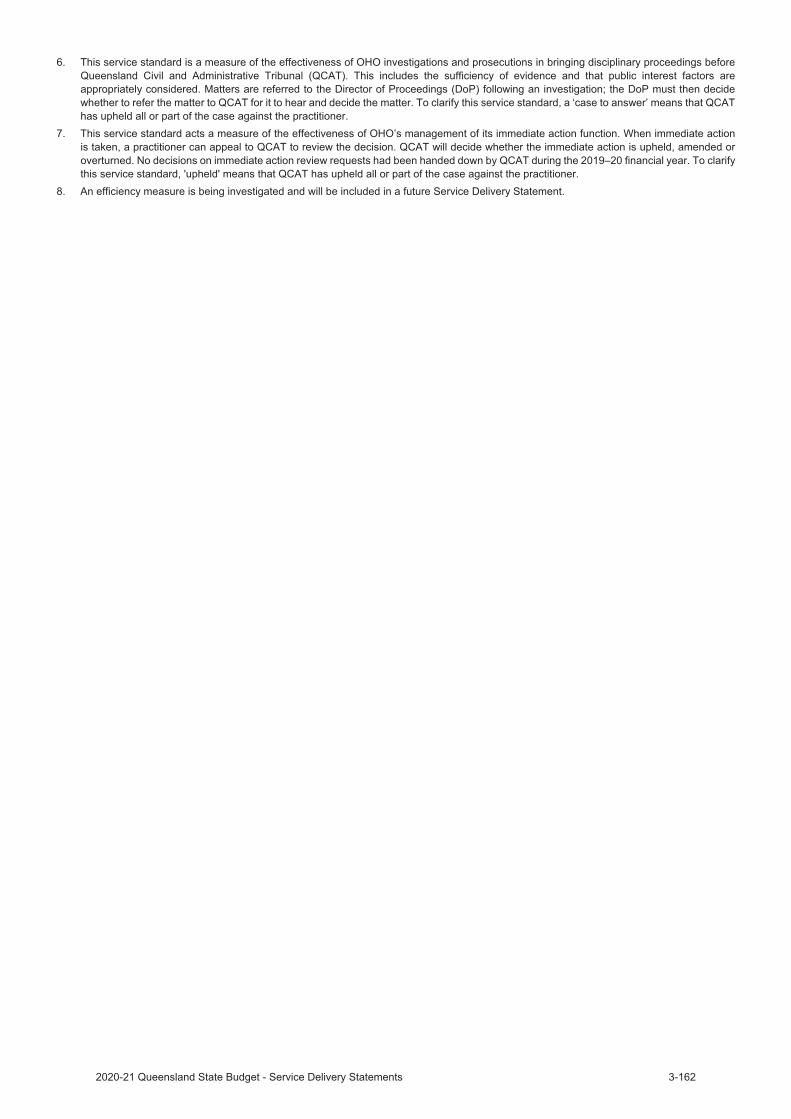
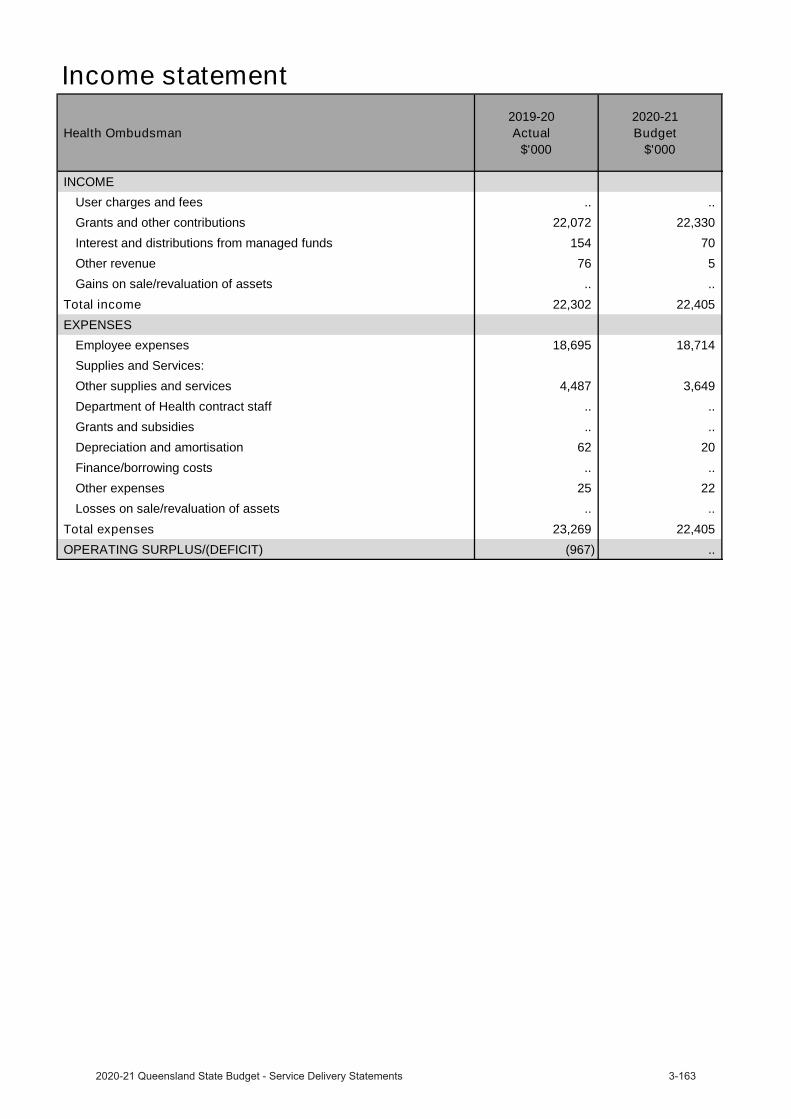
Income statement
Health Ombudsman 2019-20
Actual$'000
2020-21 Budget
$'000
INCOMEUser charges and fees .. ..
Grants and other contributions 22,072 22,330
Interest and distributions from managed funds 154 70
Other revenue 76 5
Gains on sale/revaluation of assets .. ..
Total income 22,302 22,405 EXPENSES
Employee expenses 18,695 18,714
Supplies and Services:
Other supplies and services 4,487 3,649
Department of Health contract staff .. ..
Grants and subsidies .. ..
Depreciation and amortisation 62 20
Finance/borrowing costs .. ..
Other expenses 25 22
Losses on sale/revaluation of assets .. ..
Total expenses 23,269 22,405 OPERATING SURPLUS/(DEFICIT) (967) ..
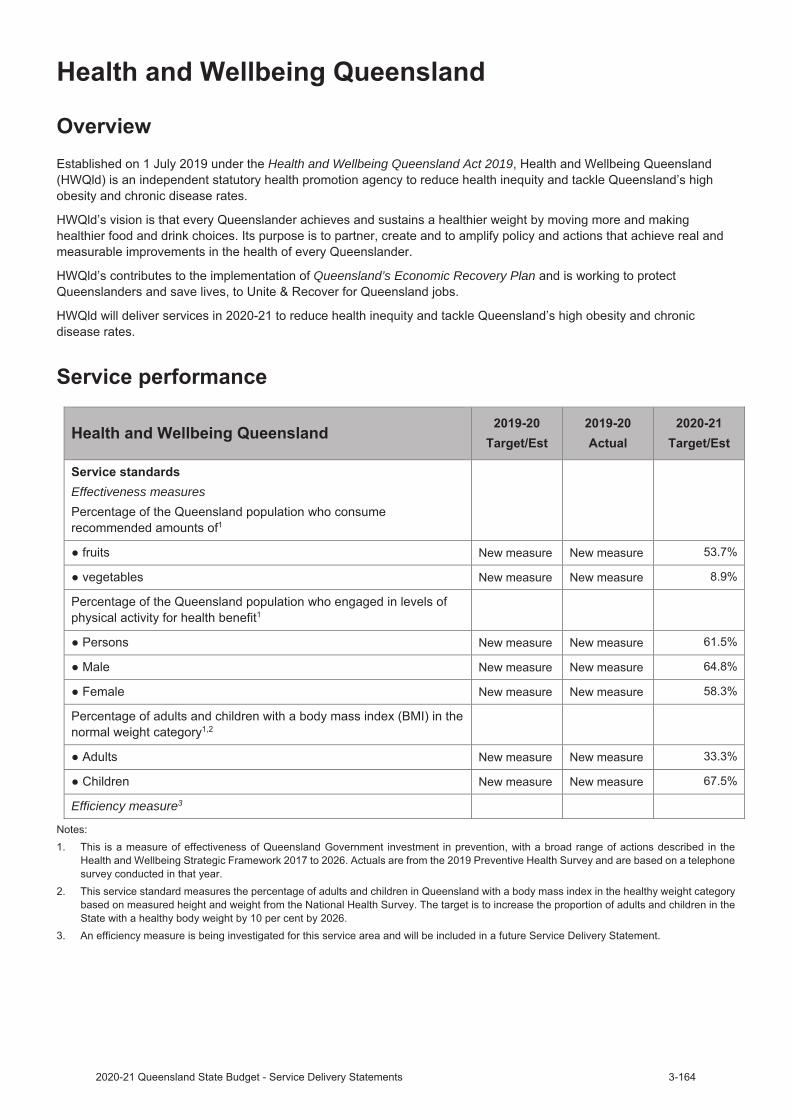
Health and Wellbeing Queensland Act 2019
Queensland’s Economic Recovery Plan
Effectiveness measures
Efficiency measure3

Income statement
Health and Wellbeing Queensland 2019-20
Actual$'000
2020-21 Budget
$'000
INCOMETaxes .. ..
User charges and fees .. ..
Grants and other contributions 3,537 37,988
Interest and distributions from managed funds 14 ..
Other revenue .. ..
Gains on sale/revaluation of assets .. ..
Total income 3,551 37,988 EXPENSES
Employee expenses 1,828 4,604
Supplies and services 1,246 33,384
Grants and subsidies .. ..
Depreciation and amortisation 8 ..
Finance/borrowing costs .. ..
Other expenses 34 ..
Losses on sale/revaluation of assets .. ..
Total expenses 3,116 37,988 OPERATING SURPLUS/(DEFICIT) 435 ..

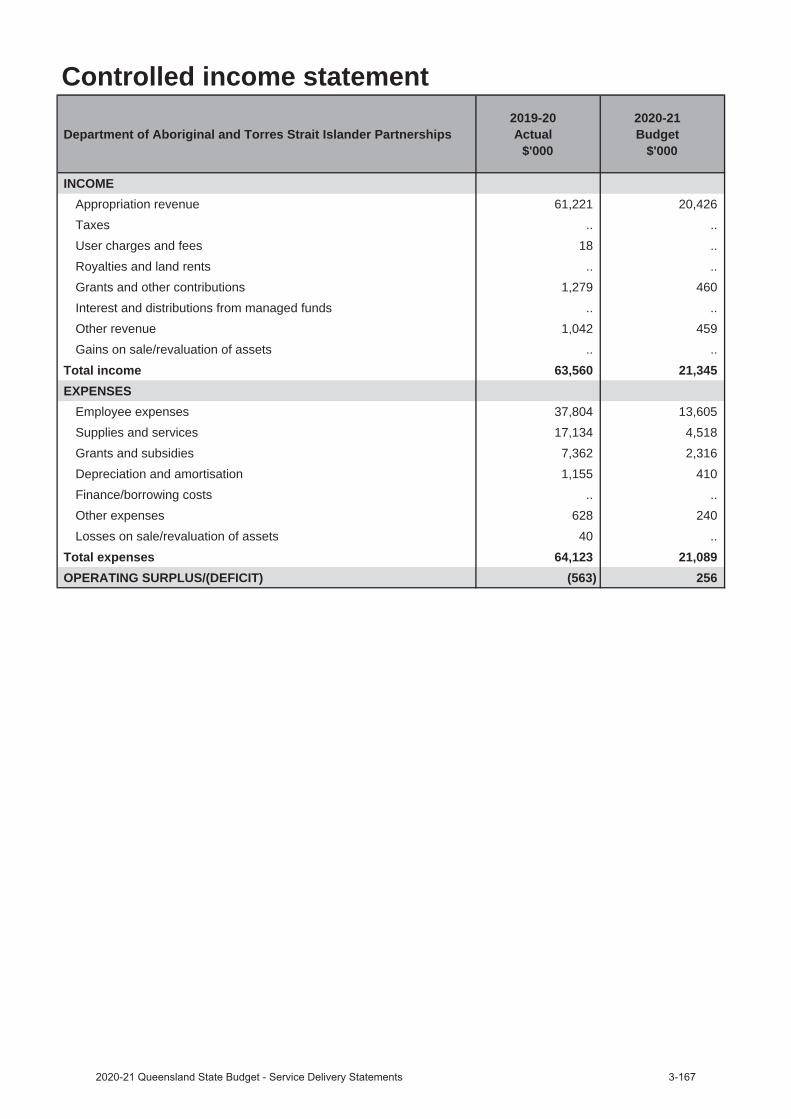
Controlled income statement
Department of Aboriginal and Torres Strait Islander Partnerships 2019-20
Actual$'000
2020-21 Budget
$'000
INCOMEAppropriation revenue 61,221 20,426Taxes .. .. User charges and fees 18 ..Royalties and land rents .. ..Grants and other contributions 1,279 460Interest and distributions from managed funds .. ..Other revenue 1,042 459 Gains on sale/revaluation of assets .. ..
Total income 63,560 21,345 EXPENSES
Employee expenses 37,804 13,605Supplies and services 17,134 4,518Grants and subsidies 7,362 2,316Depreciation and amortisation 1,155 410Finance/borrowing costs .. ..Other expenses 628 240 Losses on sale/revaluation of assets 40 ..
Total expenses 64,123 21,089OPERATING SURPLUS/(DEFICIT) (563) 256
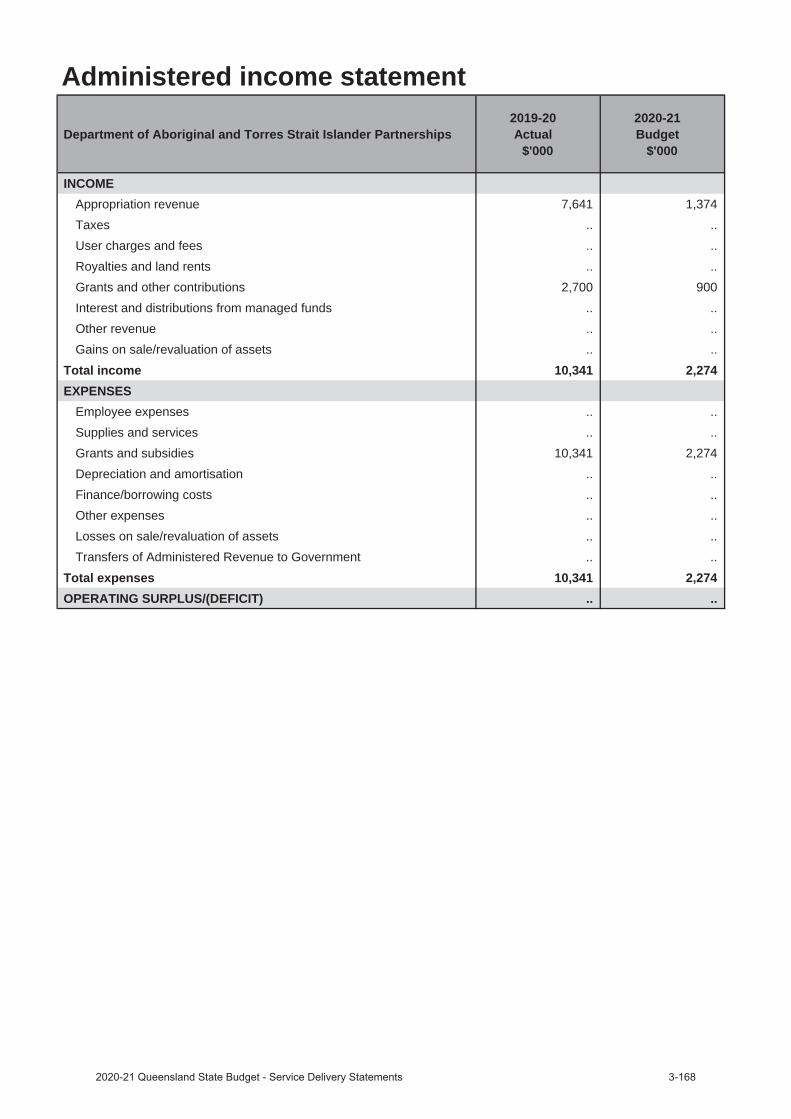
Administered income statement
Department of Aboriginal and Torres Strait Islander Partnerships 2019-20
Actual$'000
2020-21 Budget
$'000
INCOMEAppropriation revenue 7,641 1,374Taxes .. .. User charges and fees .. ..Royalties and land rents .. ..Grants and other contributions 2,700 900Interest and distributions from managed funds .. ..Other revenue .. .. Gains on sale/revaluation of assets .. ..
Total income 10,341 2,274 EXPENSES
Employee expenses .. ..Supplies and services .. ..Grants and subsidies 10,341 2,274Depreciation and amortisation .. ..Finance/borrowing costs .. ..Other expenses .. .. Losses on sale/revaluation of assets .. ..Transfers of Administered Revenue to Government .. ..
Total expenses 10,341 2,274OPERATING SURPLUS/(DEFICIT) .. ..
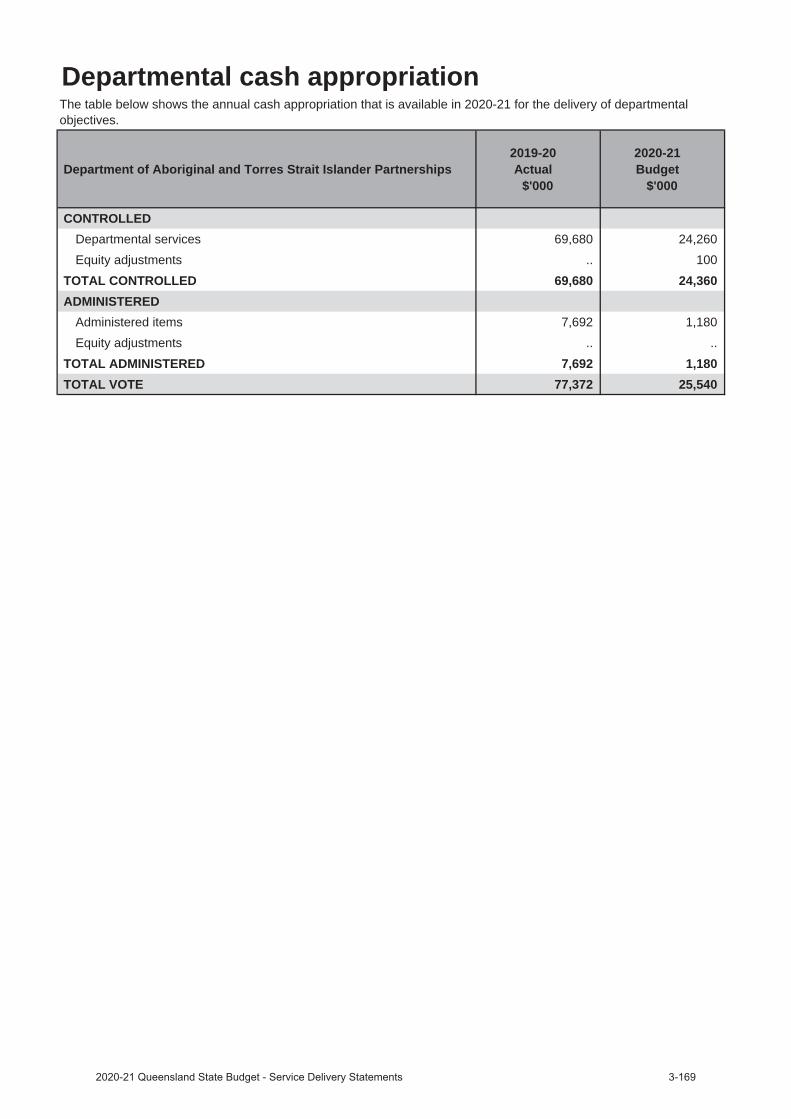
Departmental cash appropriation
Department of Aboriginal and Torres Strait Islander Partnerships 2019-20
Actual$'000
2020-21 Budget
$'000
CONTROLLEDDepartmental services 69,680 24,260Equity adjustments .. 100
TOTAL CONTROLLED 69,680 24,360ADMINISTERED
Administered items 7,692 1,180Equity adjustments .. ..
TOTAL ADMINISTERED 7,692 1,180TOTAL VOTE 77,372 25,540
The table below shows the annual cash appropriation that is available in 2020-21 for the delivery of departmental objectives.
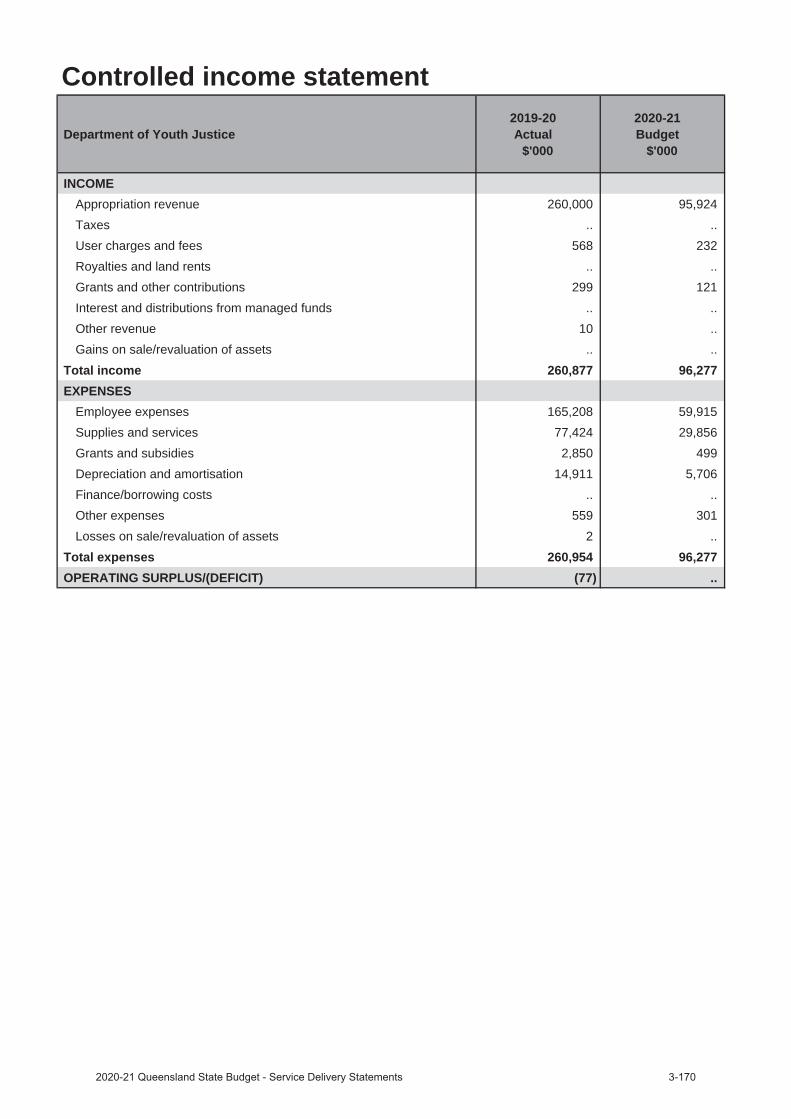
Controlled income statement
Department of Youth Justice 2019-20
Actual$'000
2020-21 Budget
$'000
INCOMEAppropriation revenue 260,000 95,924Taxes .. .. User charges and fees 568 232Royalties and land rents .. ..Grants and other contributions 299 121Interest and distributions from managed funds .. ..Other revenue 10 .. Gains on sale/revaluation of assets .. ..
Total income 260,877 96,277 EXPENSES
Employee expenses 165,208 59,915Supplies and services 77,424 29,856Grants and subsidies 2,850 499Depreciation and amortisation 14,911 5,706Finance/borrowing costs .. ..Other expenses 559 301 Losses on sale/revaluation of assets 2 ..
Total expenses 260,954 96,277OPERATING SURPLUS/(DEFICIT) (77) ..
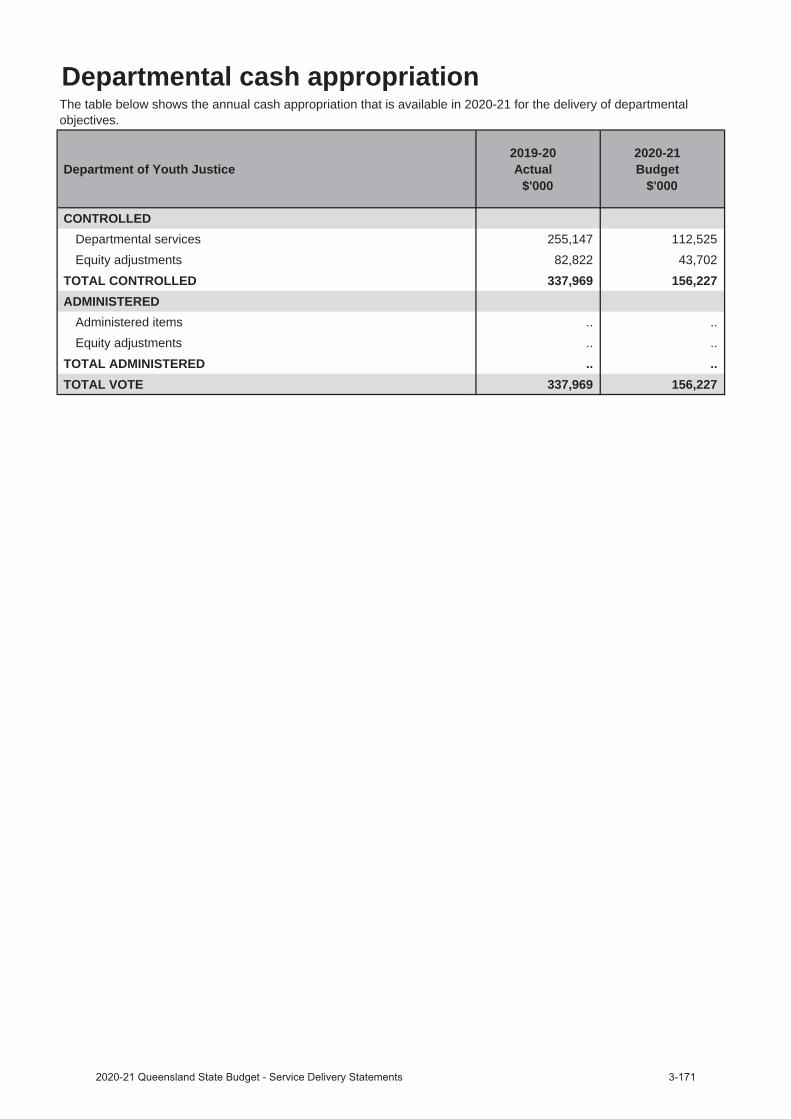
Departmental cash appropriation
Department of Youth Justice 2019-20
Actual$'000
2020-21 Budget
$'000
CONTROLLEDDepartmental services 255,147 112,525Equity adjustments 82,822 43,702
TOTAL CONTROLLED 337,969 156,227ADMINISTERED
Administered items .. ..Equity adjustments .. ..
TOTAL ADMINISTERED .. ..TOTAL VOTE 337,969 156,227
The table below shows the annual cash appropriation that is available in 2020-21 for the delivery of departmental objectives.
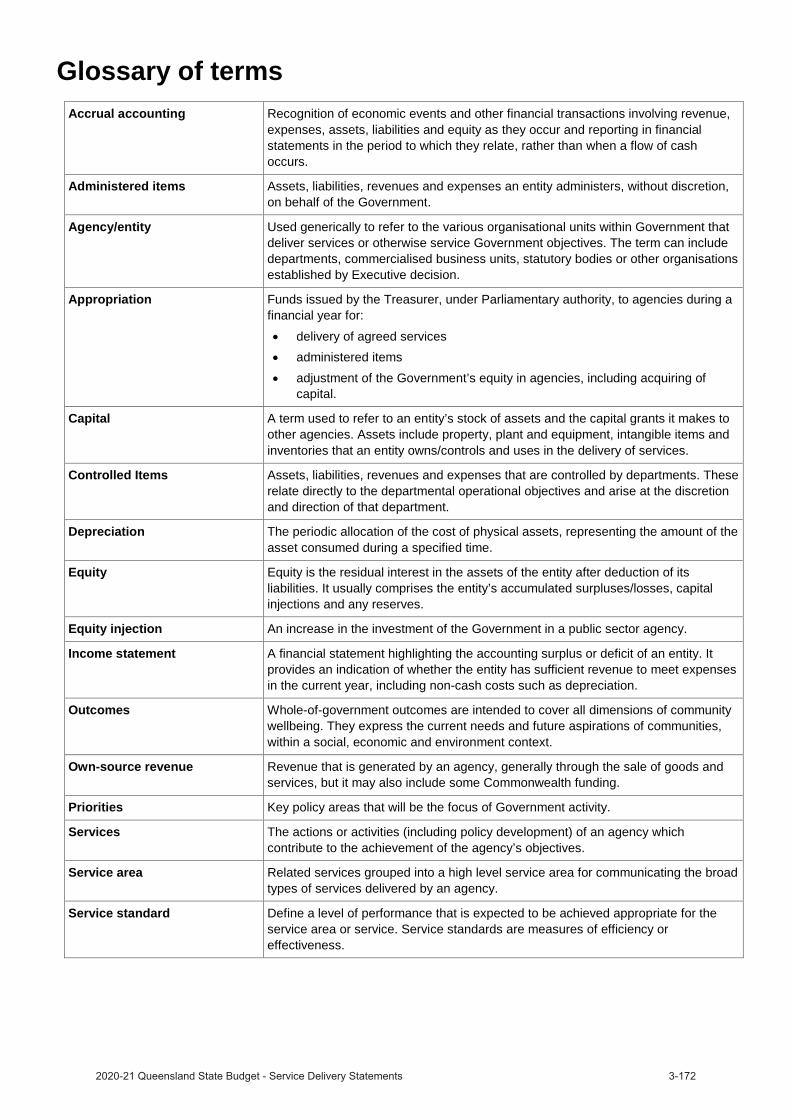
Glossary of termsAccrual accounting Recognition of economic events and other financial transactions involving revenue,
expenses, assets, liabilities and equity as they occur and reporting in financial statements in the period to which they relate, rather than when a flow of cash occurs.
Administered items Assets, liabilities, revenues and expenses an entity administers, without discretion, on behalf of the Government.
Agency/entity Used generically to refer to the various organisational units within Government that deliver services or otherwise service Government objectives. The term can include departments, commercialised business units, statutory bodies or other organisations established by Executive decision.
Appropriation Funds issued by the Treasurer, under Parliamentary authority, to agencies during a financial year for:
delivery of agreed servicesadministered itemsadjustment of the Government’s equity in agencies, including acquiring of capital.
Capital A term used to refer to an entity’s stock of assets and the capital grants it makes to other agencies. Assets include property, plant and equipment, intangible items and inventories that an entity owns/controls and uses in the delivery of services.
Controlled Items Assets, liabilities, revenues and expenses that are controlled by departments. These relate directly to the departmental operational objectives and arise at the discretion and direction of that department.
Depreciation The periodic allocation of the cost of physical assets, representing the amount of the asset consumed during a specified time.
Equity Equity is the residual interest in the assets of the entity after deduction of its liabilities. It usually comprises the entity’s accumulated surpluses/losses, capital injections and any reserves.
Equity injection An increase in the investment of the Government in a public sector agency.
Income statement A financial statement highlighting the accounting surplus or deficit of an entity. It provides an indication of whether the entity has sufficient revenue to meet expenses in the current year, including non-cash costs such as depreciation.
Outcomes Whole-of-government outcomes are intended to cover all dimensions of community wellbeing. They express the current needs and future aspirations of communities, within a social, economic and environment context.
Own-source revenue Revenue that is generated by an agency, generally through the sale of goods and services, but it may also include some Commonwealth funding.
Priorities Key policy areas that will be the focus of Government activity.
Services The actions or activities (including policy development) of an agency which contribute to the achievement of the agency’s objectives.
Service area Related services grouped into a high level service area for communicating the broad types of services delivered by an agency.
Service standard Define a level of performance that is expected to be achieved appropriate for the service area or service. Service standards are measures of efficiency or effectiveness.

Queensland Budget 2020–21 Service Delivery Statements

Queensland Budget 2020–21
Service Delivery Statements
budget.qld.gov.au