Service Delivery Statements Queensland Police ... - Amazon S3 · 2016-17 Queensland State Budget...
86
Queensland Police Service Queensland Fire and Emergency Services Public Safety Business Agency Office of the Inspector-General Emergency Management Service Delivery Statements Queensland Budget 2016-17
Transcript of Service Delivery Statements Queensland Police ... - Amazon S3 · 2016-17 Queensland State Budget...

Queensland Police Service Queensland Fire and Emergency ServicesPublic Safety Business AgencyOffice of the Inspector-General Emergency Management
Service Delivery Statements
Queensland Budget 2016-17

2016-17 Queensland Budget Papers1. Budget Speech
2. Budget Strategy and Outlook
3. Capital Statement
4. Budget Measures
5. Service Delivery Statements
Appropriation Bills
Budget Highlights
The Budget Papers are available online at
www.budget.qld.gov.au
© Crown copyright All rights reservedQueensland Government 2016
Excerpts from this publication may be reproduced, with appropriate acknowledgement, as permitted under the Copyright Act.
Service Delivery Statements
ISSN 1445-4890 (Print)ISSN 1445-4904 (Online)

Summary of portfolio
Page Agency
4 Queensland Police Service - controlled
Queensland Police Service - administered
28 Queensland Fire and Emergency Services
48 Public Safety Business Agency
66 Office of the Inspector-General Emergency Management

Portfolio overview
Ministerial and portfolio responsibilities The table below represents the agencies and services which are the responsibility of the Minister for Police, Fire and Emergency Services and the Minister for Corrective Services:
Minister for Police, Fire and Emergency Services and Minister for Corrective Services
The Honourable Bill Byrne MP
Queensland Police Service Commissioner: Ian Stewart
Service area 1: Crime and Public Order
Service area 2: Road Safety
Queensland Fire and Emergency Services Commissioner: Katarina Carroll
Service area 1: Fire and Emergency Services
Public Safety Business Agency Acting Chief Executive Officer: Anthony Reilly
Service area 1: Corporate Services
Office of the Inspector-General Emergency Management Inspector-General: Iain MacKenzie
Service area 1: Independent Assurance and Advice to Improve Emergency Management
2016-17 Queensland State Budget – Service Delivery Statements – Minister for Police, Fire and Emergency Services 1
Additional information about these agencies can be sourced from:
www.police.qld.gov.au
www.qfes.qld.gov.au
www.psba.qld.gov.au
www.igem.qld.gov.au
2016-17 Queensland State Budget – Service Delivery Statements – Minister for Police, Fire and Emergency Services 2

2016-17 Queensland State Budget – Service Delivery Statements – Minister for Police, Fire and Emergency Services 3

Queensland Police Service
2016-17 Queensland State Budget – Service Delivery Statements – Queensland Police Service 4
Departmental overview
The role of the Queensland Police Service is to preserve peace and good order; protect and support the community; prevent and detect crime; uphold the law; administer the law fairly and efficiently; bring offenders to justice; and help those in need of assistance. The department is committed to its vision of working with the community to stop crime and make Queensland safer.
The department supports the Queensland Government's objectives for the community, particularly delivering quality frontline services and building safe, caring and connected communities. In support of these, the department’s objectives are:
delivering services with fairness and integrity reducing and preventing the incidence of crime, public disorder and road trauma by problem solving, consulting and
collaborating with government agencies and community groups using technology and innovative strategies to be more mobile, flexible and capable of working across boundaries to
deliver services the community needs focusing resources to identify and deliver effective and efficient services that maximise public safety taking a lead role to prepare the community for managing major events, emergencies and disasters implementing an environment of continuous improvement based on learning, development and empowered
leadership building healthy and safe workplaces that support inclusion and diversity strengthening relationships with vulnerable persons and delivering appropriate victim support.
To achieve this, the department is focusing on five key strategies.
Frontline services- implement an integrated service delivery model, underpinned by improved intelligence capabilities and expanded
options for community consultation and engagement with police. Culture
- manage a program of cultural renewal to improve transparency and trust; devolve authority to the frontline; andembed a values based culture of inclusion, respect, innovation and training to improve capability, accountability and quality customer service.
People- ensure safe delivery of services; improve community engagement; increase diversity; apply contemporary
performance measures; and continue professional development and training to improve capability. Processes
- improve job allocation; reduce process complexity; facilitate innovation; provide improved technology and safetyequipment to the frontline; better use of assets; improve performance through organisational reporting; and improve cross agency collaboration.
Systems- improve data management and maximise analytics capability to improve productivity.
Key risks and challenges that may impact on the department during 2016-17 include:
a reduction in community confidence and engagement in policing an increase in the frequency and severity of extreme weather conditions and natural disasters predicted for
Queensland and the impact on policing services disruptions to major events, which may be caused by threats of terrorism or the actions of issue-motivated groups the growth, diversity and complexity of organised crime demands new adaptable approaches, capabilities and
relationships between law enforcement agencies, government and the private sector maintaining and improving our level of response to vulnerable persons, domestic and family violence, mental illness
and substance abuse disorders from the production of illicit drugs, such as ice and fentanyl reducing alcohol fuelled violence through strategic partnerships.
To address these risks and challenges, the key priorities for the department during 2016-17 include:
continuing to provide a safe and secure community by responding to threats including terrorism, disasters, and risksassociated with major events
2016-17 Queensland State Budget – Service Delivery Statements – Queensland Police Service 5
creating better workplaces and improving workforce capability targeting crime hotspots throughout the State, and issues such as organised crime, alcohol fuelled violence and the
drug, ice undertaking intelligence-led policing in late night entertainment precincts providing improved safety equipment for police, including body-worn cameras supporting the development and implementation of the Domestic and Family Violence Prevention Strategy and
implementing the Government's response to the Domestic and Family Violence Taskforce Not Now, Not Ever Report
continuing to plan the police response for the Gold Coast 2018 Commonwealth Games continuing to contribute to the child safety reform agenda initiated by the Queensland Child Protection Commission of
Inquiry final report working with the Attorney-General and Minister for Justice to consider and respond to the recommendations arising
from the Queensland Organised Crime Commission of Inquiry and the Queensland Taskforce into Organised Crime continuing to review the police complaints system and implement a new disciplinary system continuing to make improvements to ensure the promotions system is truly merit-based continuing to implement an integrated service delivery model developing an improved performance management framework to improve customer service.
In consultation with the department, the Public Safety Business Agency has responsibility for delivering most new and ongoing capital initiatives to support the department’s operational capability.
2016-17 Queensland State Budget – Service Delivery Statements – Queensland Police Service 6

Service performance
Performance statement
Crime and Public Order
Service area objective
To uphold the law by working with the community to stop crime and make Queensland safer.
Service area description
Services delivered by the department are designed to promote ethical behaviour, discipline and professional practice. These services include:
protect personal safety and prevent and detect related offences including homicide, assault, sexual assault androbbery
protect property and prevent and detect related offences including unlawful entry, other property damage, motorvehicle theft and other theft
maintain public order and safety including during major events and natural disasters and address public spaceenjoyment, street and nuisance offences; liquor licensing issues; and environmental design to reduce crime includingalcohol fuelled violence.
Services
Protect personal safety Protect property Maintain public order
2016-17 service area highlights
The department will continue its focus on delivering the Government's commitments to the Queensland community in 2016-17, with a particular focus on building safe, caring and connected communities through the delivery of quality frontline services.
Highlights include continuing to:
roll out key initiatives of the Government's Keeping our Community Safe and Tackling Alcohol Fuelled Violencepolicies by targeting crime hotspots; illegal drug use, especially Ice; and alcohol fuelled violence in conjunction withother agencies
support the implementation of the Government's child safety reform agenda, the Government's response to the Domestic and Family Violence Taskforce Not Now, Not Ever Report and the Domestic and Family Violence Prevention Strategy in collaboration with the community and other sectors of government
work with the community to stop crime and make Queensland safer by engaging with local communities throughinitiatives such as community policing boards which give local people a say on crime issues and Project Booyah, anearly intervention program which targets youth at risk of criminal offending.
Queensland Police Service Notes 2015-16
Target/Est.
2015-16
Est. Actual
2016-17
Target/Est.
Service area: Crime and Public Order
Service: Protect personal safety
Service standards
Effectiveness measures
2016-17 Queensland State Budget – Service Delivery Statements – Queensland Police Service 7

Queensland Police Service Notes 2015-16
Target/Est.
2015-16
Est. Actual
2016-17
Target/Est.
Rate (per 100,000 people) of personal safety offences reported: 1,2,3
Homicide 2-4 3 2-4
Assault 350-438 416 350-438
Sexual assault 100-125 125 100-125
Robbery 25-31 28 25-31
Total personal safety 550-688 636 550-688
Percentage of personal safety offences cleared within 30 days: 2,3
Homicide 70-88% 80% 70-88%
Assault 55-69% 66% 55-69%
Sexual assault 55-69% 56% 55-69%
Robbery 55-69% 61% 55-69%
Total personal safety 55-69% 63% 55-69%
Efficiency measures4
Service: Protect property
Service standards
Effectiveness measures
Rate (per 100,000 people) of property security offences reported: 1,2,5
Unlawful entry 650-813 668 650-813
Other property damage 650-813 697 650-813
Motor vehicle theft 180-225 202 180-225
Other theft (excluding unlawful entry)
1,900-2,375 2,082
1,900-2,375
Total property security 4,000-5,000 4,221 4,000-5,000
Percentage of property security offences cleared within 30 days: 2,5
Unlawful entry 16-20% 20% 16-20%
Other property damage 24-30% 28% 24-30%
Motor vehicle theft 30-38% 38% 30-38%
Other theft (excluding unlawful entry) 25-31% 29% 25-31%
Total property security 25-31% 31% 25-31%
Efficiency measures4
Service: Maintain public order
Service standards
Effectiveness measures
Rate (per 100,000 people) of good order offences detected: 1,2,6 1,100-1,375 1,269 1,100-1,375
2016-17 Queensland State Budget – Service Delivery Statements – Queensland Police Service 8

Queensland Police Service Notes 2015-16
Target/Est.
2015-16
Est. Actual
2016-17
Target/Est.
Percentage of good order offences cleared within 30 days 2,5,6 85-100% 86% 85-100%
Public satisfaction with police dealing with public order problems 7 ≥70% 73.4% ≥70%
Public satisfaction with police dealing with emergencies and disasters 8 ≥85% 85.4% ≥85%
Percentage of code one and code two incidents attended within 12 minutes 9 ≥80% 79.6% ≥80%
Efficiency measures4
Notes: 1. Population data is sourced from the Australian Bureau of Statistics (ABS) Catalogue No. 3101.0 Australian Demographic Statistics.2. Performance is reported against a ‘range’ rather than a single figure. The target range for 2016-17 Target/Estimate takes into account
recent results and any known factors that are likely to have an impact in the forthcoming 12 months. The range is standardised so that theupper end of the range is consistently 25% higher than the lower end.
3. The offence categories reported separately are those classified as ‘violent’ crimes and are the most significant personal safety offencecategories in terms of their impact on the community. The ‘total personal safety’ offences figure also includes the offence categories ofextortion, kidnapping, abduction and deprivation of liberty and other offences against the person. Homicide includes the offence categoriesof murder, attempted murder and conspiracy to murder.
4. Efficiency measures are being developed and will be included in a future Service Delivery Statement.
5. The offence categories reported separately are considered high volume property security offences. The total property security offencesalso includes arson, fraud and handling stolen goods.
6. Good order offences include offences relating to public nuisance, obstructing police and other offences against good order. An increase ingood order offences generally indicates an increase in policing activity around public spaces and major events, and a range of relatedproactive policing strategies, often focusing on liquor-related enforcement.
7. Public satisfaction is measured against the results of the National Survey of Community Satisfaction with Policing. Respondents to thisquestion may or may not have had contact with police in the last 12 months.
8. Public satisfaction is measured against the results of the National Survey of Community Satisfaction with Policing. Respondents to thisquestion may or may not have had contact with police in the last 12 months. This measure has been amended in 2016-17 to ensurealignment with a wording change in the national survey—respondents were previously asked about their satisfaction with police dealingwith 'disasters and major events'. No changes were made to the methodology of this measure. Respondents to this question may or maynot have had contact with police in the last 12 months.
9. Data measures the time taken to attend code one and code two incidents. Data includes geographic areas covered by the QueenslandComputer Aided Dispatch system. Code one and two incidents include very urgent matters when danger to human life is imminent and urgent matters involving injury or present threat of injury to person or property. The benchmark of 12 minutes was chosen for comparabilitywith New South Wales police, who use a similar methodology, business rules and systems.
2016-17 Queensland State Budget – Service Delivery Statements – Queensland Police Service 9
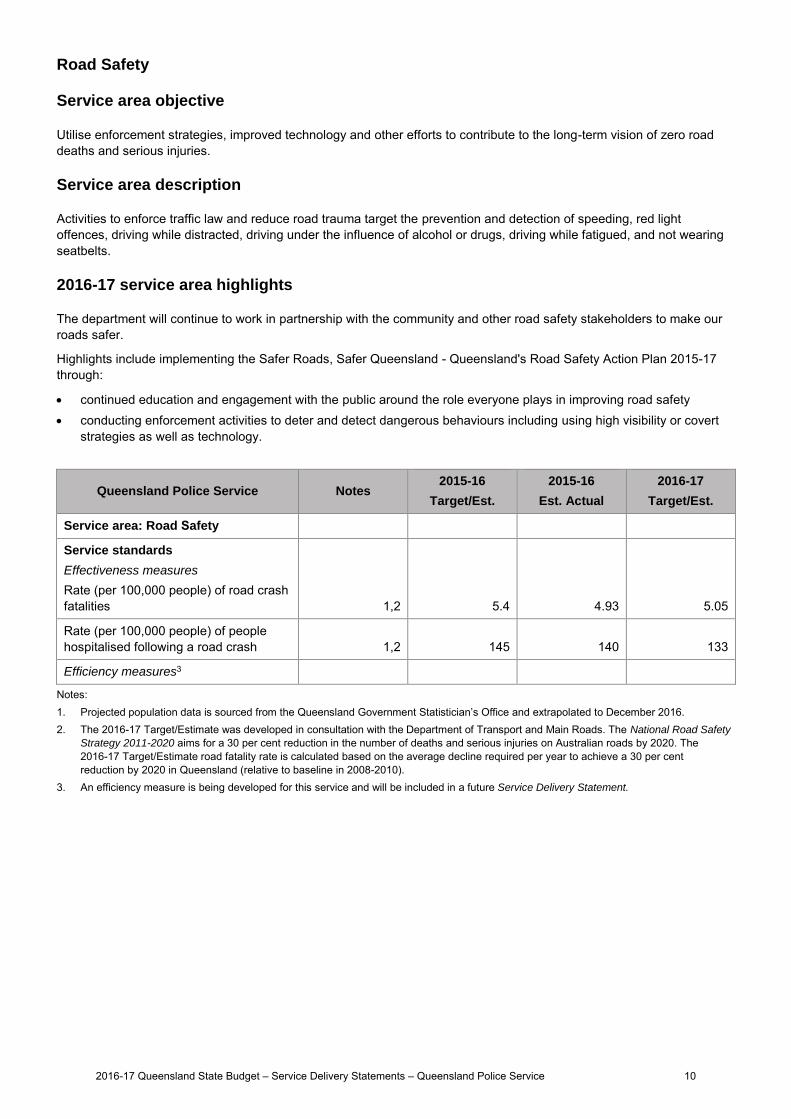
Road Safety
Service area objective
Utilise enforcement strategies, improved technology and other efforts to contribute to the long-term vision of zero road deaths and serious injuries.
Service area description
Activities to enforce traffic law and reduce road trauma target the prevention and detection of speeding, red light offences, driving while distracted, driving under the influence of alcohol or drugs, driving while fatigued, and not wearing seatbelts.
2016-17 service area highlights
The department will continue to work in partnership with the community and other road safety stakeholders to make our roads safer.
Highlights include implementing the Safer Roads, Safer Queensland - Queensland's Road Safety Action Plan 2015-17 through:
continued education and engagement with the public around the role everyone plays in improving road safety conducting enforcement activities to deter and detect dangerous behaviours including using high visibility or covert
strategies as well as technology.
Queensland Police Service Notes 2015-16
Target/Est.
2015-16
Est. Actual
2016-17
Target/Est.
Service area: Road Safety
Service standards
Effectiveness measures
Rate (per 100,000 people) of road crash fatalities 1,2 5.4 4.93 5.05
Rate (per 100,000 people) of people hospitalised following a road crash 1,2 145 140 133
Efficiency measures3
Notes: 1. Projected population data is sourced from the Queensland Government Statistician’s Office and extrapolated to December 2016.2. The 2016-17 Target/Estimate was developed in consultation with the Department of Transport and Main Roads. The National Road Safety
Strategy 2011-2020 aims for a 30 per cent reduction in the number of deaths and serious injuries on Australian roads by 2020. The2016-17 Target/Estimate road fatality rate is calculated based on the average decline required per year to achieve a 30 per cent reduction by 2020 in Queensland (relative to baseline in 2008-2010).
3. An efficiency measure is being developed for this service and will be included in a future Service Delivery Statement.
2016-17 Queensland State Budget – Service Delivery Statements – Queensland Police Service 10

The delivery of Crime and Public Order and Road Safety policing services to the community of Queensland is supported by a range of activities designed to promote ethical behaviour, discipline and professional practice. These are outlined below.
Queensland Police Service Notes 2015-16
Target/Est.
2015-16
Est. Actual
2016-17
Target/Est.
Service: Police Services1
Service standards
Effectiveness measures
Rate of complaints against police per 100 sworn (operational) staff 2 ≤9.8 10.5 ≤9.8
Public perception of police professionalism and image: 3
Police perform their job professionally ≥85% 86.7% ≥85%
Police treat people fairly and equally ≥75% 75.6% ≥75%
Police are honest ≥75% 74.7% ≥75%
I do have confidence in the police ≥85% 86.3% ≥85%
Satisfaction of members of the public who had contact with police in the last 12 months 4 ≥85% 83.3% ≥85%
Efficiency measures
Cost of policing services per person 5 $442 $439 $454
Percentage of prosecutions where costs were awarded against the police 6 ≤0.05% 0.01% ≤0.05%
Notes: 1. Projected population data is sourced from the Queensland Government Statistician’s Office and extrapolated to December 2016. Police
services covers general service standards across the department including ethical behaviour and professionalism. This service is notcosted.
2. This measure is calculated using the total number of complaints made against police by members of the public during the reporting period.Sworn operational staff refers to a police officer employed by the department who has sworn the Oath of Office under the Police Service
Administration Act 1990, and whose primary duty is the delivery of police or police related services to an external customer.3. Public perception is measured against the results of the National Survey of Community Satisfaction with Policing. Respondents to this
question may or may not have had contact with police in the last 12 months.4. Public satisfaction is measured against the results of the National Survey of Community Satisfaction with Policing. Respondents to this
question had contact with police in the last 12 months.5. Cost of policing services per person is calculated by dividing recurrent expenditure, including cost of services provided by the Public Safety
Business Agency, by Queensland population. Population data for the 2015-16 Estimated Actual is sourced from the ABS Catalogue No.3101.0. The 2016-17 Target/Estimate is based on Queensland Treasury population estimates. The 2016-17 Target/Estimate reflectsenterprise bargaining arrangements, improving counter-terrorism capability and capacity, and targeting organised crime.
6. Represents the sum of all prosecutions where costs were awarded against the Queensland Police Service from 1 July 2015 to 31 March2016, divided by the sum of all prosecutions in the same period. In the Report on Government Services, this is considered a measure ofpolice efficiency in preparing evidence that is relevant to, and supports, a prosecution. Court costs are generally awarded against policewhen a criminal action against an offender has failed; in this respect, it represents at least some of the resources expended when aprosecution fails. A low or decreasing proportion of prosecutions where costs are awarded against police in criminal actions is thereforedesirable.
2016-17 Queensland State Budget – Service Delivery Statements – Queensland Police Service 11

Administered items
Administered activities are those undertaken by departments on behalf of the Government.
The Queensland Police Service administers funds on behalf of the State which includes the collection of revenues including weapons licensing fees, fines and forfeitures, and proceeds from the sale of unclaimed property.
Weapons licensing fees comprise the majority of the administered revenue. Weapons licensing is an important part of the Government’s framework to ensure public safety and to prevent the misuse of weapons.
Financial statements and variance explanations in relation to administered items appear in the departmental financial statements.
2016-17 Queensland State Budget – Service Delivery Statements – Queensland Police Service 12

Departmental budget summary
The table below shows the total resources available in 2016-17 from all sources and summarises how resources will be applied by service area and by controlled and administered classifications.
Queensland Police Service
2015-16
Budget
$’000
2015-16
Est. Actual
$’000
2016-17
Budget
$’000
CONTROLLED
Income
Appropriation revenue1
Deferred from previous year/s 14,385 12,785 7,480
Balance of service appropriation 1,696,344 1,703,873 1,776,147
Other revenue 374,166 363,667 365,539
Total income 2,084,895 2,080,325 2,149,166
Expenses
Crime and public order 1,666,362 1,691,970 1,747,399
Road safety 418,533 388,355 401,767
Total expenses 2,084,895 2,080,325 2,149,166
Operating surplus/deficit .. .. ..
Net assets 133,016 100,020 119,923
ADMINISTERED
Revenue
Commonwealth revenue .. .. ..
Appropriation revenue .. .. ..
Other administered revenue 9,588 12,861 13,205
Total revenue 9,588 12,861 13,205
Expenses
Transfers to government 9,588 12,861 13,205
Administered expenses .. .. ..
Total expenses 9,588 12,861 13,205
Net assets 8,943 .. ..
Note: 1. Appropriation revenue includes State and Commonwealth funding.
2016-17 Queensland State Budget – Service Delivery Statements – Queensland Police Service 13

Service area sources of revenue1
Sources of revenue
2016-17 Budget
Queensland Police Service Total cost
$’000
State
contribution
$’000
User
charges
and fees
$’000
C’wealth
revenue
$’000
Other
revenue
$’000
Crime and Public Order 1,747,399 1,450,027 32,528 1,082 263,762
Road safety 401,767 333,600 7,484 .. 60,683
Total 2,149,166 1,783,627 40,012 1,082 324,445
Note: 1. Explanations of variances are provided in the financial statements.
2016-17 Queensland State Budget – Service Delivery Statements – Queensland Police Service 14

Budget measures summary
This table shows a summary of budget measures relating to the department since the 2015-16 State Budget. Further details are contained in Budget Paper 4.
Queensland Police Service 2015-16
$’000
2016-17
$’000
2017-18
$’000
2018-19
$’000
2019-20
$’000
Revenue measures
Administered .. .. .. .. ..
Departmental .. .. .. .. ..
Expense measures
Administered .. .. .. .. ..
Departmental1 912 18,163 8,488 7,800 6,378
Capital measures
Administered .. .. .. .. ..
Departmental 1,733 2,028 1,300 1,300 ..
Note: 1. Figures reconcile with Budget Paper 4, including the whole-of-government expense measures ‘Brisbane CBD government office agency
rental impacts’ and ‘Reprioritisation allocations’.
2016-17 Queensland State Budget – Service Delivery Statements – Queensland Police Service 15
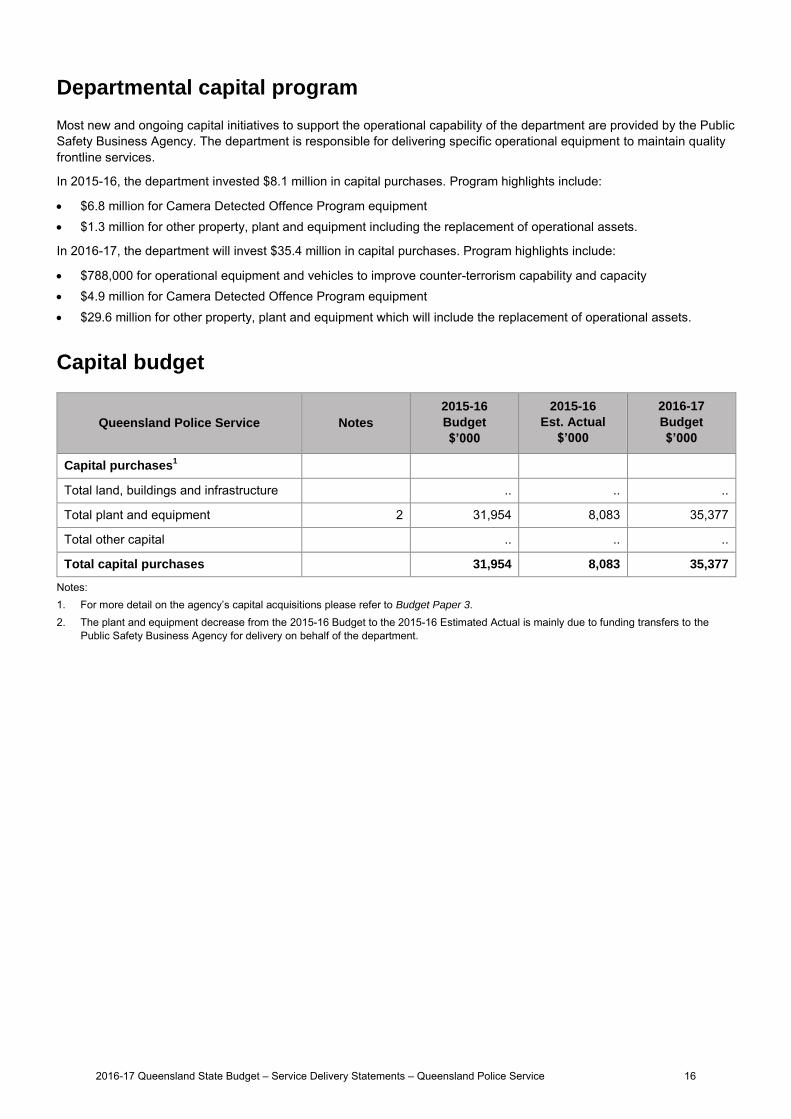
Departmental capital program
Most new and ongoing capital initiatives to support the operational capability of the department are provided by the Public Safety Business Agency. The department is responsible for delivering specific operational equipment to maintain quality frontline services.
In 2015-16, the department invested $8.1 million in capital purchases. Program highlights include:
$6.8 million for Camera Detected Offence Program equipment $1.3 million for other property, plant and equipment including the replacement of operational assets.
In 2016-17, the department will invest $35.4 million in capital purchases. Program highlights include:
$788,000 for operational equipment and vehicles to improve counter-terrorism capability and capacity $4.9 million for Camera Detected Offence Program equipment $29.6 million for other property, plant and equipment which will include the replacement of operational assets.
Capital budget
Queensland Police Service Notes
2015-16
Budget
$’000
2015-16
Est. Actual
$’000
2016-17
Budget
$’000
Capital purchases1
Total land, buildings and infrastructure .. .. ..
Total plant and equipment 2 31,954 8,083 35,377
Total other capital .. .. ..
Total capital purchases 31,954 8,083 35,377
Notes: 1. For more detail on the agency’s capital acquisitions please refer to Budget Paper 3.2. The plant and equipment decrease from the 2015-16 Budget to the 2015-16 Estimated Actual is mainly due to funding transfers to the
Public Safety Business Agency for delivery on behalf of the department.
2016-17 Queensland State Budget – Service Delivery Statements – Queensland Police Service 16
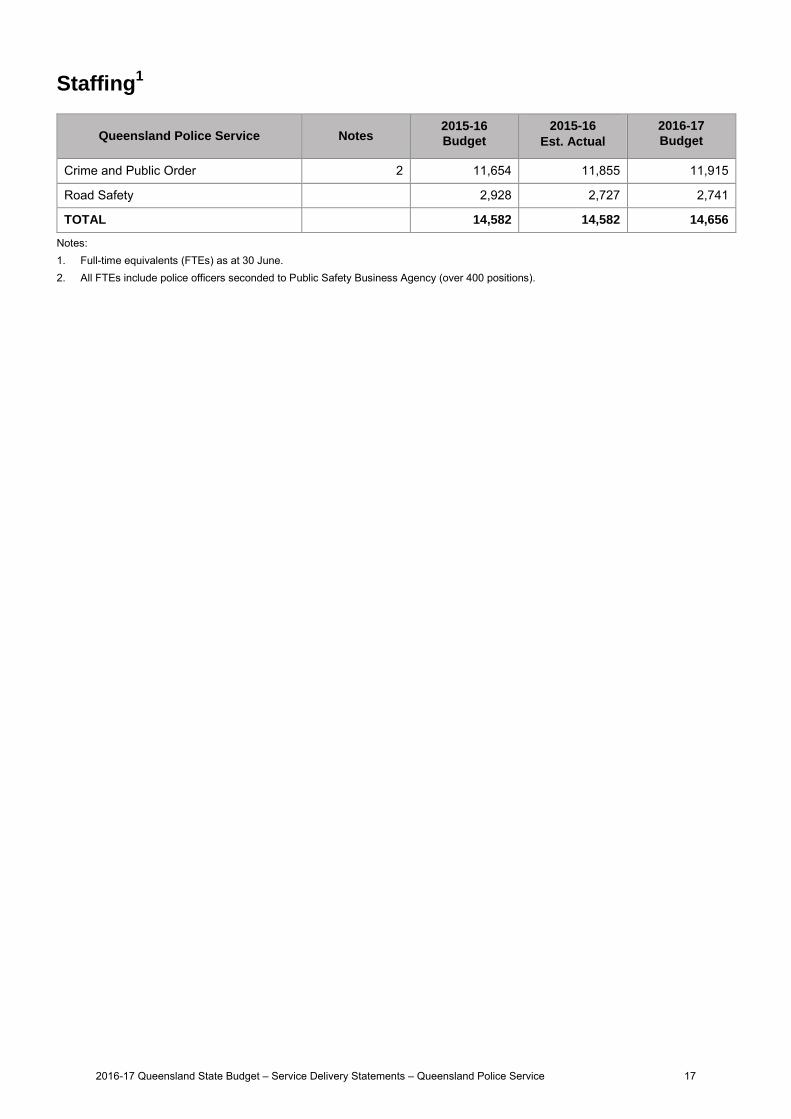
Staffing1
Queensland Police Service Notes 2015-16
Budget
2015-16
Est. Actual
2016-17
Budget
Crime and Public Order 2 11,654 11,855 11,915
Road Safety 2,928 2,727 2,741
TOTAL 14,582 14,582 14,656
Notes: 1. Full-time equivalents (FTEs) as at 30 June.2. All FTEs include police officers seconded to Public Safety Business Agency (over 400 positions).
2016-17 Queensland State Budget – Service Delivery Statements – Queensland Police Service 17

Chart: Total departmental expenses across the Forward Estimates period
Departmental balance sheetThe department's major assets are in plant and equipment and intangibles ($75.4 million) and cash ($78.7 million). The department's main liabilities relate to accrued employee benefits ($68.1 million) and payables ($30.1 million).
Budgeted financial statementsAnalysis of budgeted financial statementsAn analysis of the department's financial position, as reflected in the department's financial statements, is provided below.
Departmental income statementTotal expenses are estimated to be $2.149 billion in 2016-17, an increase of $68.8 million from the 2015-16 financial year. The increase is mainly due to the impact of enterprise bargaining arrangements, and funding for improving Counter-Terrorism Capability and Capacity and Targeting Serious and Organised Crime.
The increase over the remainder of the forward estimates is a result of enterprise bargaining arrangements and funding for the Gold Coast 2018 Commonwealth Games, Improving Counter-Terrorism Capability and Capacity, and Targeting Serious and Organised Crime. The 2017-18 financial year includes Gold Coast 2018 Commonwealth Games funding of approximately $68.1 million.
1,950,000
2,000,000
2,050,000
2,100,000
2,150,000
2,200,000
2,250,000
2,300,000
2015‐16 2016‐17 2017‐18 2018‐19 2019‐20
$'000
Financial year
Total expenses
Total expenses
2016-17 Queensland State Budget – Service Delivery Statements – Queensland Police Service 18

Controlled income statement
Queensland Police Service Notes 2015-16 Budget
$'000
2015-16 Est. Act.
$'000
2016-17 Budget
$'000
INCOMEAppropriation revenue 5,10 1,710,729 1,716,658 1,783,627 Taxes .. .. ..User charges and fees 1,6 52,148 38,520 40,012 Royalties and land rents .. .. .. Grants and other contributions 2,7 319,254 322,383 322,770 Interest 550 550 550Other revenue 2,214 2,214 2,207Gains on sale/revaluation of assets .. .. ..
Total income 2,084,895 2,080,325 2,149,166 EXPENSES
Employee expenses 3,8,11 1,492,447 1,528,899 1,577,185 Supplies and services 4,9,12 254,816 214,775 237,988 Grants and subsidies 2,951 3,338 3,207 Depreciation and amortisation 14,665 14,665 15,474 Finance/borrowing costs .. .. ..Other expenses 320,016 318,648 315,312 Losses on sale/revaluation of assets .. .. ..
Total expenses 2,084,895 2,080,325 2,149,166 OPERATING SURPLUS/(DEFICIT) .. .. ..
2016-17 Queensland State Budget – Service Delivery Statements – Queensland Police Service 19

Controlled balance sheet
Queensland Police Service Notes 2015-16 Budget
$'000
2015-16 Est. Act.
$'000
2016-17 Budget
$'000
CURRENT ASSETSCash assets 13,20 69,563 78,682 78,682 Receivables 14,21 71,502 56,494 56,494 Other financial assets .. .. .. Inventories 4,475 4,537 4,537Other 15,22 14,496 8,091 8,091Non-financial assets held for sale .. .. ..
Total current assets 160,036 147,804 147,804 NON-CURRENT ASSETS
Receivables .. .. ..Other financial assets .. .. .. Property, plant and equipment 16,23,27 70,699 35,641 59,644 Intangibles 17,24,28 28,007 19,826 15,726 Other .. .. ..
Total non-current assets 98,706 55,467 75,370 TOTAL ASSETS 258,742 203,271 223,174 CURRENT LIABILITIES
Payables 18,25 61,269 30,051 30,051 Accrued employee benefits 64,360 68,084 68,084 Interest bearing liabilities and derivatives .. .. .. Provisions .. .. ..Other 19,26 97 5,116 5,116
Total current liabilities 125,726 103,251 103,251 NON-CURRENT LIABILITIES
Payables .. .. ..Accrued employee benefits .. .. .. Interest bearing liabilities and derivatives .. .. .. Provisions .. .. ..Other .. .. ..
Total non-current liabilities .. .. .. TOTAL LIABILITIES 125,726 103,251 103,251 NET ASSETS/(LIABILITIES) 133,016 100,020 119,923 EQUITYTOTAL EQUITY 133,016 100,020 119,923
2016-17 Queensland State Budget – Service Delivery Statements – Queensland Police Service 20

Controlled cash flow statement
Queensland Police Service Notes 2015-16 Budget
$'000
2015-16 Est. Act.
$'000
2016-17 Budget
$'000
CASH FLOWS FROM OPERATING ACTIVITIESInflows:
Appropriation receipts 36,42 1,710,729 1,720,976 1,783,627 User charges and fees 29,37 52,148 38,520 40,012 Royalties and land rent receipts .. .. .. Grants and other contributions 30,38,43 5,160 8,289 13,470Interest received 550 550 550Taxes .. .. ..Other 2,214 2,214 2,207
Outflows:Employee costs 31,39,44 (1,492,447) (1,528,899) (1,577,185)Supplies and services 32,40,45 (254,816) (214,775) (237,988)Grants and subsidies (2,951) (3,338) (3,207)Borrowing costs .. .. ..Other 33 (5,922) (4,554) (6,012)
Net cash provided by or used in operating activities 14,665 18,983 15,474 CASH FLOWS FROM INVESTING ACTIVITIESInflows:
Sales of non-financial assets .. .. .. Investments redeemed .. .. ..Loans and advances redeemed .. .. ..
Outflows:Payments for non-financial assets 34,41,46 (31,954) (8,083) (35,377)Payments for investments .. .. .. Loans and advances made .. .. ..
Net cash provided by or used in investing activities (31,954) (8,083) (35,377)CASH FLOWS FROM FINANCING ACTIVITIESInflows:
Borrowings .. .. ..Equity injections 35,47 19,148 (9,041) 21,833
Outflows:Borrowing redemptions .. .. ..Finance lease payments .. .. .. Equity withdrawals (1,859) (1,859) (1,930)
Net cash provided by or used in financing activities 17,289 (10,900) 19,903 Net increase/(decrease) in cash held .. .. .. Cash at the beginning of financial year 69,563 78,682 78,682
Cash transfers from restructure .. .. .. Cash at the end of financial year 69,563 78,682 78,682
2016-17 Queensland State Budget – Service Delivery Statements – Queensland Police Service 21

Administered income statement
Queensland Police Service Notes 2015-16 Budget
$'000
2015-16 Est. Act.
$'000
2016-17 Budget
$'000
INCOMEAppropriation revenue .. .. ..Taxes .. .. ..User charges and fees 48,50 8,711 10,420 10,784 Royalties and land rents .. .. .. Grants and other contributions .. .. .. Interest .. .. ..Other revenue 49,51 877 2,441 2,421Gains on sale/revaluation of assets .. .. ..
Total income 9,588 12,861 13,205 EXPENSES
Employee expenses .. .. ..Supplies and services .. .. .. Grants and subsidies .. .. .. Depreciation and amortisation .. .. .. Finance/borrowing costs .. .. ..Other expenses .. .. ..Losses on sale/revaluation of assets .. .. .. Transfers of Administered Revenue to Government 9,588 12,861 13,205
Total expenses 9,588 12,861 13,205 OPERATING SURPLUS/(DEFICIT) .. .. ..
2016-17 Queensland State Budget – Service Delivery Statements – Queensland Police Service 22

Administered balance sheet
Queensland Police Service Notes 2015-16 Budget
$'000
2015-16 Est. Act.
$'000
2016-17 Budget
$'000
CURRENT ASSETSCash assets 1,752 1,963 1,963Receivables (13) (5) (5)Other financial assets .. .. .. Inventories .. .. ..Other .. .. ..Non-financial assets held for sale .. .. ..
Total current assets 1,739 1,958 1,958 NON-CURRENT ASSETS
Receivables .. .. ..Other financial assets .. .. .. Property, plant and equipment 52,53 8,943 .. ..Intangibles .. .. ..Other .. .. ..
Total non-current assets 8,943 .. .. TOTAL ASSETS 10,682 1,958 1,958 CURRENT LIABILITIES
Payables 962 896 896Transfers to Government payable 776 1,031 1,031 Accrued employee benefits .. .. .. Interest bearing liabilities and derivatives .. .. .. Provisions .. .. ..Other 1 31 31
Total current liabilities 1,739 1,958 1,958 NON-CURRENT LIABILITIES
Payables .. .. ..Accrued employee benefits .. .. .. Interest bearing liabilities and derivatives .. .. .. Provisions .. .. ..Other .. .. ..
Total non-current liabilities .. .. .. TOTAL LIABILITIES 1,739 1,958 1,958NET ASSETS/(LIABILITIES) 8,943 .. .. EQUITYTOTAL EQUITY 8,943 .. ..
2016-17 Queensland State Budget – Service Delivery Statements – Queensland Police Service 23

Administered cash flow statement
Queensland Police Service Notes 2015-16 Budget
$'000
2015-16 Est. Act.
$'000
2016-17 Budget
$'000
CASH FLOWS FROM OPERATING ACTIVITIESInflows:
Appropriation receipts .. .. ..User charges and fees 54,56 8,711 10,420 10,784 Royalties and land rent receipts .. .. .. Grants and other contributions .. .. .. Interest received .. .. ..Taxes .. .. ..Other 55,57 877 2,441 2,421
Outflows:Employee costs .. .. ..Supplies and services .. .. .. Grants and subsidies .. .. .. Borrowing costs .. .. ..Other .. .. ..Transfers to Government (9,588) (12,861) (13,205)
Net cash provided by or used in operating activities .. .. .. CASH FLOWS FROM INVESTING ACTIVITIESInflows:
Sales of non-financial assets .. .. .. Investments redeemed .. .. ..Loans and advances redeemed .. .. ..
Outflows:Payments for non-financial assets .. .. .. Payments for investments .. .. .. Loans and advances made .. .. ..
Net cash provided by or used in investing activities .. .. .. CASH FLOWS FROM FINANCING ACTIVITIESInflows:
Borrowings .. .. ..Equity injections .. .. ..
Outflows:Borrowing redemptions .. .. ..Finance lease payments .. .. .. Equity withdrawals .. .. ..
Net cash provided by or used in financing activities .. .. .. Net increase/(decrease) in cash held .. .. .. Cash at the beginning of financial year 1,752 1,963 1,963
Cash transfers from restructure .. .. .. Cash at the end of financial year 1,752 1,963 1,963
2016-17 Queensland State Budget – Service Delivery Statements – Queensland Police Service 24

Income statementMajor variations between 2015-16 Budget and 2015-16 Estimated Actual include:
1. User charges and fees decrease is due to lower than anticipated Special Services revenue.
2. Grants and other contributions increase is due to funding received for the Gold Coast 2018 CommonwealthGames.
3. Employee expenses increase is mainly due to a realignment of annual leave costs following the finalisation of the 2014-15 machinery-of-government (MOG) transfer to the Public Safety Business Agency (PSBA), an increased WorkCover premium, and preparations for the Gold Coast 2018 Commonwealth Games.
4. Supplies and services decrease is mainly due to a realignment of costs following the finalisation of the 2014-15MOG transfer to PSBA, decreases in costs associated with Special Services, and transfers to PSBA for activitiesdelivered on behalf of the Queensland Police Service (QPS).
Major variations between 2015-16 Budget and 2016-17 Budget include:
5. Appropriation revenue increase is mainly due to enterprise bargaining arrangements and funding for ImprovingCounter-Terrorism Capability and Capacity, and Targeting Serious and Organised Crime.
6. User charges and fees decrease is due to a reduction in expected Special Services revenue.
7. Grants and other contributions increase is largely due to funding for the Gold Coast 2018 Commonwealth Games.
8. Employee expenses increase is mainly due to enterprise bargaining arrangements, an increased WorkCoverpremium, preparations for the Gold Coast 2018 Commonwealth Games, Improving Counter-Terrorism Capabilityand Capacity, and Targeting Serious and Organised Crime.
9. Supplies and services decrease is mainly due to a realignment of costs following the finalisation of the 2014-15MOG transfer to PSBA, decreases in costs associated with Special Services, and transfers to PSBA for activitiesdelivered on behalf of QPS.
Major variations between 2015-16 Estimated Actual and the 2016-17 Budget include:
10. Appropriation revenue increase is mainly due to enterprise bargaining arrangements and funding for ImprovingCounter-Terrorism Capability and Capacity, and Targeting Serious and Organised Crime.
11. Employee expenses increase is mainly due to enterprise bargaining arrangements, an increased WorkCoverpremium for the department, preparations for the Gold Coast 2018 Commonwealth Games, Improving Counter-Terrorism Capability and Capacity, and Targeting Serious and Organised Crime.
12. Supplies and services increase is mainly due to preparations for the Gold Coast 2018 Commonwealth Games,and additional funding for Targeting Serious and Organised Crime and the Southport Specialist Domestic andFamily Violence Court Trial.
Balance sheetMajor variations between 2015-16 Budget and 2015-16 Estimated Actual include:
13. Cash assets have increased due to movements in receivables, prepayments, employee benefits, and payables.
14. Receivables decrease is due to timing of receipts.
15. Other current assets decrease is due to a reduction in pre-payments of supplies and services.
16. Property, plant and equipment decrease is mainly due to funding transfers to PSBA for delivery on behalf of QPS.
17. Intangibles decrease is due to the difference between the estimated and final balance transferred to PSBA as partof the 2014-15 MOG change.
18. Payables decrease reflects anticipated timing of payments to trade creditors.
19. Other current liabilities increase reflects the timing of expenditure reimbursements to other agencies within thePublic Safety portfolio.
Explanation of variances in the financial statements
2016-17 Queensland State Budget – Service Delivery Statements – Queensland Police Service 25
Major variations between 2015-16 Budget and 2016-17 Budget include:
20. Cash assets have increased due to movements in receivables, prepayments, employee benefits, and payables.
21. Receivables decrease is due to timing of receipts.
22. Other current assets decrease is due to a reduction in pre-payments of supplies and services.
23. Property, plant and equipment decrease is mainly due to funding transfers to PSBA for delivery on behalf of QPS.
24. Intangibles decrease is due to the difference between the estimated and final balance transferred to PSBA as partof the 2014-15 MOG change and amortisation of the assets.
25. Payables decrease reflects anticipated timing of payments to trade creditors.
26. Other current liabilities increase reflects the timing of expenditure reimbursements to other agencies within thePublic Safety portfolio.
Major variations between 2015-16 Estimated Actual and the 2016-17 Budget include:
27. Property, plant and equipment increase is a result of forecast purchases for 2016-17.
28. Intangibles decrease is due to amortisation of the assets.
Cash flow statementMajor variations between 2015-16 Budget and 2015-16 Estimated Actual include:
29. User charges and fees decrease is due to lower than anticipated Special Services revenue.
30. Grants and other contributions increase is due to funding received for the Gold Coast 2018 CommonwealthGames.
31. Employee costs increase is mainly due to a realignment of annual leave costs following the finalisation of the2014- 15 MOG transfer to PSBA, an increased WorkCover premium, and preparations for the Gold Coast 2018Commonwealth Games.
32. Supplies and services decrease is mainly due to a realignment of costs following the finalisation of the 2014-15MOG transfer to PSBA, decreases in costs associated with Special Services, and transfers to PSBA for activitiesdelivered on behalf of QPS.
33. Decrease in other operating outflows is due to reduced insurance premiums.
34. Payments for non financial assets decrease is mainly due to funding transfers to PSBA for delivery on behalf ofQPS.
35. Equity injections decrease is mainly due to funding transfers to PSBA for delivery on behalf of QPS.
Major variations between 2015-16 Budget and 2016-17 Budget include:
36. Appropriation revenue increase is mainly due to enterprise bargaining arrangements and funding for ImprovingCounter-Terrorism Capability and Capacity, and Targeting Serious and Organised Crime.
37. User charges and fees decrease is due to a reduction in expected Special Services revenue.
38. Grants and other contributions increase is due to funding expected to be received for the Gold Coast 2018Commonwealth Games.
39. Employee costs increase is mainly due to enterprise bargaining arrangements, an increased WorkCover premiumfor the department, preparations for the Gold Coast 2018 Commonwealth Games, Improving Counter-TerrorismCapability and Capacity, and Targeting Serious and Organised Crime.
40. Supplies and services decrease is mainly due to a realignment of costs following the finalisation of the 2014-15MOG transfer to PSBA, decreases in costs associated with Special Services, and transfers to PSBA for activitiesdelivered on behalf of QPS.
41. Payments for non financial assets increase is a result of forecast purchases for 2016-17.
Major variations between 2015-16 Estimated Actual and the 2016-17 Budget include:
42. Appropriation revenue increase is mainly due to enterprise bargaining arrangements and funding for ImprovingCounter-Terrorism Capability and Capacity, and Targeting Serious and Organised Crime.
43. Grants and other contributions receipts increase is due to funding expected to be received for the Gold Coast2018 Commonwealth Games.
2016-17 Queensland State Budget – Service Delivery Statements – Queensland Police Service 26

44. Employee costs increase is mainly due to enterprise bargaining arrangements, an increased WorkCover premium,preparations for the Gold Coast 2018 Commonwealth Games, Counter-Terrorism Capability and Capacity, andTargeting Serious and Organised Crime.
45. Supplies and services increase is mainly due to preparations for the Gold Coast 2018 Commonwealth Games,and additional funding for targeting organised crime and the Southport Specialist domestic and family violencecourt trial.
46. Payments for non financial assets increase is mainly due to 2015-16 funding transfers to PSBA for delivery onbehalf of QPS.
47. Equity injections increase is mainly due to 2015-16 funding transfers to PSBA for delivery on behalf of QPS.
Administered income statementMajor variations between 2015-16 Budget and 2015-16 Estimated Actual include:
48. The increase in user charges and fees relates to higher than anticipated fees raised under theWeapons Act 1990.
49. Increased other revenue relates to fines and forfeitures.
Major variations between 2015-16 Budget and 2016-17 Budget include:
50. The increase in user charges and fees relates to higher fees expected to be raised under the Weapons Act 1990.
51. Increased other revenue relates to fines and forfeitures.
Administered balance sheetMajor variations between 2015-16 Budget and 2015-16 Estimated Actual include:
52. Decrease in property, plant and equipment is due to a one-off transfer in 2014-15 of roads through Administeredto the Brisbane City Council as public roads under the Land Act 1994.
Major variations between 2015-16 Budget and 2016-17 Budget include:
53. Decrease in property, plant and equipment is due to a one-off transfer in 2014-15 of roads through Administeredto the Brisbane City Council as public roads under the Land Act 1994.
Administered cash flow statementMajor variations between 2015-16 Budget and 2015-16 Estimated Actual include:
54. The increase in user charges and fees relates to higher than anticipated fees raised under theWeapons Act 1990.
55. Increased other operating inflow relates to fines and forfeitures.
Major variations between 2015-16 Budget and 2016-17 Budget include:
56. The increase in user charges and fees relates to higher fees expected to be raised under the Weapons Act 1990.
57. Increased other operating inflow relates to fines and forfeitures.
2016-17 Queensland State Budget – Service Delivery Statements – Queensland Police Service 27

Queensland Fire and Emergency Services
2016-17 Queensland State Budget – Service Delivery Statements – Queensland Fire and Emergency Services 28

Departmental overview
Queensland Fire and Emergency Services provides fire and emergency services in partnership with the community. The department is committed to enabling Queenslanders to prevent, prepare for, respond to and recover from emergencies. This commitment underpins the department's vision of safe and resilient communities.
The department's focus on community safety supports the Queensland Government's objectives for the community of building safe, caring and connected communities and delivering quality frontline services. The agency achieves this by minimising the impact and consequences of emergencies on the people, property, environment and economy of Queensland.
The State Emergency Service (SES) and Rural Fire Service Queensland (RFSQ) are the primary volunteer streams of the organisation. The RFSQ operates in those areas where there is no urban fire service and covers rural, semi-rural and some urban fringe areas. The SES is a collaboration between the Queensland Government, local governments, SES members and the community who provide an around the clock volunteer response to emergencies and disasters across the State.
Key objectives of the department include:
delivering operational excellence by continuing to provide contemporary fire and emergency services ensuring the department is a great place to work and is ethical, inclusive, values diversity and is respectful empowering volunteerism by recognising, respecting and valuing volunteers working with external and internal partners to further integrate and co-deliver services being a capable organisation that encourages innovation and new ideas, learns from past experiences and adapts to
changing conditions continuing to provide Queensland communities with service delivery excellence that they can trust.
The department will deliver on these objectives through a range of strategies designed to support the Queensland Government's objectives for the community, including:
creating integrated and seamless fire and emergency services reducing the likelihood of emergencies occurring by implementing preventative strategies leading with integrity, transparency and accountability aligning volunteerism with community needs and risk profiles strengthening volunteer capability by investing in sustainable policies and programs providing integrated emergency management training for the private, public and not-for-profit sectors undertaking emergency management exercises with our delivery partners to enhance real life service delivery delivering community benefits by ensuring resourcing is agile and able to be allocated to areas of greatest need creating an organisation that is capable of anticipating and responding to future need working with communities and other stakeholders to enable the development and provision of timely and appropriate
information.
During 2016-17, key strategic challenges for the department include:
service capacity versus community expectations change in demand for services as the population grows, ages and becomes more diverse effective communication and information technology systems for frontline services workforce sustainability achieving seamless interoperability.
Key priorities for the department during 2016-17 include:
continuing work to transform the department into an inclusive, respectful and diverse organisation for staff andvolunteers
implementing the recommendations of the Review of the Public Safety Business Agency and developing a futureoperating model to support service delivery and the needs of the Queensland community
increasing the focus on prevention, mitigation, preparation and recovery activities implementing the recommendations of the independent QFES Financial Sustainability Review.
2016-17 Queensland State Budget – Service Delivery Statements – Queensland Fire and Emergency Services 29

Service performance
Performance statement
Fire and Emergency Services
Service area objective
To enhance community safety by minimising the impact of fire, emergency incidents and disasters on the people, property, environment and economy of Queensland.
Service area description
The department enhances community resilience, mitigates risk and contributes to safer and sustainable communities through disaster management, community assistance, responses to structure and landscape fires and rescue across all hazards.
2016-17 service area highlights
In 2016-17, key highlights include work to:
continue to embed the organisational Workplace Behaviour and Code of Conduct training across the organisation continue to enhance volunteer operational capability by ensuring alignment with community needs and development
of sustainable policies and programs augment approaches for recruitment, development and retention of volunteers focus on reducing bushfire risk, improving community safety awareness and knowledge in relation to bushfire safety
and prevention, and increasing the skills and experience of RFSQ volunteers focus on severe weather risk, improving community safety awareness and knowledge of severe weather risk
including safety precautions, and preparation activities monitor and review the strategic management framework and Disaster Management Guidelines for disaster
operations continue to deliver the Road Attitudes and Action Planning program in high schools, which is a practical lifesaving
road safety awareness program for young drivers that is facilitated by operational firefighters continue to provide the Fight Fire Fascination program, which supports parents to educate their children about the
dangers of playing with fire and teaches them the necessary skills to prevent harm to property or lives develop a State level risk register for natural hazard risk in partnership with the Queensland Police Service continue to promote the Get out. Fire about. winter fire safety campaign to educate Queenslanders about the
importance of home fire escape plans, promote the If It's Flooded Forget It safety campaign and support the GetReady preparation campaign
implement solutions to support interoperability and co-delivery of services across Queensland work in collaboration with local governments across Queensland to maintain and develop the SES continue to develop the department’s operational capability and support for the Gold Coast 2018 Commonwealth
Games to ensure public safety commence engagement to support the changing requirements for new smoke alarms host the 2016 Women and Firefighting Australasia Conference and the Australasian Fire and Emergency Service
Authorities Council Conference establish a reserve roster of additional full-time firefighters to enhance the department’s frontline service delivery
capacity.
2016-17 Queensland State Budget – Service Delivery Statements – Queensland Fire and Emergency Services 30

Queensland Fire and Emergency
Services Notes
2015-16
Target/Est.
2015-16
Est. Actual
2016-17
Target/Est.
Service area: Fire and Emergency
Services
Service standards
Effectiveness measures
Rate of accidental residential structure fires reported (per 100 000 households) 1 <60 59 <60
Response times to structure fires including call taking time:
50th percentile 90th percentile 2
<7.8 minutes <14 minutes
7.9 12.2
<7.8 minutes <14 minutes
Percentage of building and other structure fires confined to room/object of origin 2,3 ≥80% 84% ≥80%
Estimated percentage of households with smoke alarm/detector installed 4 95% 96.5% 95%
Percentage of building premises inspected and deemed compliant at first inspection 5 50% 52% 50%
Rate of Unwanted Alarm Activations per Alarm Signalling Equipment 6 <4 2.4 <4
Percentage of identified disaster management training met 7 75% 68.6% 75%
Percentage of volunteers satisfied with the experience of volunteering for the Rural Fire Service 8 New measure New measure 65%
Percentage of volunteers satisfied with the experience of volunteering for the State Emergency Service 8 New measure New measure 65%
Percentage of statewide State Emergency Service groups that meet minimum operational training requirements 9 New measure New measure 65%
Efficiency measure
Fire and emergency services expenditure per person 10 $135 $136 $140
Notes: 1. Accidental residential structure fires are those fires in a residential structure that are not deliberately lit and with effective educational
programs can be reduced or prevented from occurring. Household data is sourced from the Australian Bureau of Statistics (ABS) Catalogue No. 3236.0.
2. Structure fires are fires in housing and other buildings. Only structure fires occurring within the Levy District Boundaries (Class A-D) areincluded. Excluded are non-emergency calls and those where the department experienced delays due to extreme weather conditions or where the initial response was by another agency or brigade. Only primary exposure incidents are included.
3. Only structure fires where the confinement has been determined are included in the calculations.4. This measure provides an indication of the percentage of households with smoke alarms installed. Results are derived from the Annual
Queensland Fire and Emergency Services Queensland Householders Survey, February 2016.
5. This measure reports the percentage of building premises inspected and deemed compliant with building fire safety regulations (Fire and
Emergency Services Act 1990, Building Act 1975 and Building Fire Safety Regulation 2008) and fire safety procedures on first inspection.6. This measure compares the number of system initiated false alarms responded to by departmental fire personnel with the number of
connected Alarm Signalling Equipment (ASE) devices per annum. ‘Unwanted Alarm Activations’ are defined as any activation of the firealarm and detection system that could have been avoided. Unwanted alarms have a negative impact on firefighters and the widercommunity by increasing safety concerns for fire crews and the public, disrupting the community and industry, creating complacency, and
2016-17 Queensland State Budget – Service Delivery Statements – Queensland Fire and Emergency Services 31

imposing unnecessary costs to attend these incidents. Reducing unwanted alarm activations ensures that the department can more effectively manage priority emergency responses and resources. It is also a measure of the effectiveness of the strategies that the department has in place to help reduce the number of unwanted activations. The Fire and Emergency Services Act 1990 (section 104DA) provides a legislated target of no more than four unwanted alarm activations per ASE.
7. This measure focuses on Queensland Disaster Management Training Framework courses and the offering of current mandatory disastermanagement modules to disaster management stakeholders. Identified disaster management stakeholders include: Local DisasterCoordinators; Local Disaster Management Group Chairs; District Disaster Coordinators; and District Disaster Management GroupExecutive Officers. The wording of this measure has been amended to more accurately represent the department’s role in offering disastermanagement training. The 2016 local government elections resulted in changes to key disaster management personnel within LocalDisaster Management Groups impacting on the availability of new staff to undertake disaster management training.
8. This new measure is sourced from the biennial QFES Satisfaction Survey which commenced in 2014. It measures the number ofvolunteers who indicated they were either ‘very satisfied’ or ‘satisfied’ with the experience of volunteering, for either the SES or RFSQ,represented as a percentage of the total number of responses received. The survey measures volunteer satisfaction across a range ofareas including training and development, leadership, internal communication and culture.
9. This new measure focuses on the specific capability of SES groups to effectively respond to emergencies and disasters withincommunities. This measure benchmarks the skills, training and capabilities required of volunteers against a set of identified local hazardsand risks that is unique for each individual SES group. Volunteer training data is sourced from the department’s Volunteer InformationManagement System, with capability requirements assessed by Regional Managers, supported by the Assistant Commissioner andendorsed by the Deputy Commissioner.
10. This measure reports the fire and emergency services expenditure divided by the estimated population of Queensland. Population data forthe 2015-16 Estimated Actual is sourced from the ABS Catalogue No. 3101.0. The 2016-17 Target/Estimate is based on QueenslandTreasury population estimates.
2016-17 Queensland State Budget – Service Delivery Statements – Queensland Fire and Emergency Services 32

Discontinued measures
Performance measures included in the 2015-16 Service Delivery Statements that have been discontinued or replaced are reported in the following table with estimated actual results.
Queensland Fire and Emergency
Services Notes
2015-16
Target/Est.
2015-16
Est. Actual
2016-17
Target/Est.
Service area: Fire and Emergency
Services
State Emergency Service volunteers per 100,000 population 1 121 130.4
Discontinued measure
Rural Fire Service volunteers per 100,000 population 1 741 757.8
Discontinued measure
Note: 1. This measure is being discontinued as the number of volunteers per capita does not provide a measure of volunteer effectiveness or
emergency response readiness (i.e. appropriate training levels, volunteer response capabilities, and/or access to equipment). This discontinued measure will be reported in the 2015-16 Annual Report.
2016-17 Queensland State Budget – Service Delivery Statements – Queensland Fire and Emergency Services 33

Departmental budget summary
The table below shows the total resources available in 2016-17 from all sources and summarises how resources will be applied by service area and by controlled and administered classifications.
Queensland Fire and Emergency
Services
2015-16
Budget
$’000
2015-16
Est. Actual
$’000
2016-17
Budget
$’000
CONTROLLED
Income
Appropriation revenue1
Deferred from previous year/s 648 875 ..
Balance of service appropriation 78,061 77,730 80,272
Other revenue 569,614 571,470 594,984
Total income 648,323 650,075 675,256
Expenses
Fire and emergency services 647,682 647,371 675,256
Total expenses 647,682 647,371 675,256
Operating surplus/deficit 641 2,704 ..
Net assets 82,409 67,105 67,105
Note: 1. Appropriation revenue includes State and Commonwealth funding.
2016-17 Queensland State Budget – Service Delivery Statements – Queensland Fire and Emergency Services 34

Service area sources of revenue1
Sources of revenue
2016-17 Budget
Queensland Fire and Emergency
Services
Total cost
$’000
State
contribution
$’000
User
charges
and fees
$’000
C’wealth
revenue
$’000
Other
revenue
$’000
Fire and Emergency Services 675,256 77,141 51,157 4,131 542,827
Total 675,256 77,141 51,157 4,131 542,827
Note: 1. Explanations of variances are provided in the financial statements.
2016-17 Queensland State Budget – Service Delivery Statements – Queensland Fire and Emergency Services 35

Budget measures summary
This table shows a summary of budget measures relating to the department since the 2015-16 State Budget. Further details are contained in Budget Paper 4.
Queensland Fire and Emergency
Services
2015-16
$’000
2016-17
$’000
2017-18
$’000
2018-19
$’000
2019-20
$’000
Revenue measures
Administered .. .. .. .. ..
Departmental .. .. .. .. ..
Expense measures
Administered .. .. .. .. ..
Departmental1 199 2,071 219 211 203
Capital measures
Administered .. .. .. .. ..
Departmental .. .. .. .. ..
Note: 1. Figures reconcile with Budget Paper 4, including the whole-of-government expense measures ‘Brisbane CBD government office agency
rental impacts’ and ‘Reprioritisation allocations’.
2016-17 Queensland State Budget – Service Delivery Statements – Queensland Fire and Emergency Services 36

Departmental capital program
Most new and ongoing capital initiatives to support the department’s operational capability are delivered by the Public Safety Business Agency. The department continues to be responsible for delivering operational equipment and operational information systems.
In 2015-16 the department purchased $4 million in operational equipment including special purpose operational trailers, scientific analysis and detection equipment, thermal imaging cameras, fully encapsulated gas and chemical suits, technical and road crash rescue equipment, portable generators, breathing apparatus compressors, portable decontamination facilities and self-contained temporary shelter facilities, and upgraded the bushfire behaviour prediction system.
In 2016-17, the department will invest $8.1 million in capital purchases and provide $900,000 in capital grants.
Program highlights include:
$4.5 million for operational equipment, which may include protective clothing such as fully encapsulated gas andchemical suits, specialist and field portable scientific analysis and detection equipment, portable decontaminationfacilities, compressors for self-contained breathing apparatus, special purpose operational trailers and first responseall-terrain vehicles
$1.4 million for specialised operational equipment to support public safety at the Gold Coast 2018 CommonwealthGames
$2.2 million for additions and upgrades to operational information systems $712,000 for the State Emergency Service and $185,000 for rural fire brigade capital grants.
Capital budget
Queensland Fire and Emergency
Services Notes
2015-16
Budget
$’000
2015-16
Est. Actual
$’000
2016-17
Budget
$’000
Capital purchases1
Total land, buildings and infrastructure .. .. ..
Total plant and equipment 8,367 3,962 8,075
Total other capital 1,263 1,433 897
Total capital purchases 9,630 5,395 8,972
Note: 1. For more detail on the agency’s capital acquisitions please refer to Budget Paper 3.
2016-17 Queensland State Budget – Service Delivery Statements – Queensland Fire and Emergency Services 37

Staffing1
Queensland Fire and Emergency
Services Notes
2015-16
Budget
2015-16
Est. Actual
2016-17
Budget
Fire and Emergency Services 3,077 3,084 3,110
TOTAL 2,3 3,077 3,084 3,110
Notes: 1. Full-time equivalents (FTEs) as at 30 June.2. The 2015-16 Estimated Actual includes an increase of three funded FTEs transferred from the Public Safety Business Agency following the
return of positions/incumbents/functions of the Operations Management System support team to the department, and four FTE firefightersfor the reserve roster.
3. The 2016-17 Budget includes an increase of 20 FTE firefighters for the reserve roster.
2016-17 Queensland State Budget – Service Delivery Statements – Queensland Fire and Emergency Services 38

Total operating expenses are estimated to be $675.3 million in 2016-17. This is a $27.9 million, or 4.3 per cent, increase on the Estimated Actual operating expenses for the 2015-16 year and a $27.6 million, or 4.3 per cent, increase on the originally budgeted operating expenses for the 2015-16 year.
The major factors contributing to the increase are: — a 2.5 per cent increase in employee expenses in line with current wage agreements — $5.7 million to fund progressive wage increases for Auxiliary firefighters as provided for in the Auxiliary Award — $5 million in additional overtime provisions to meet operational and training delivery requirements— $1.3 million to fund additional firefighter recruits and recruit training to establish a reserve roster of 49 FTEs as an alternative solution to backfilling positions through overtime and temporary firefighters— a three per cent increase in supplies and services expenses reflecting increased prices for goods and services— up to $3.8 million increase in vehicle expenses to provide fuel and maintenance for rural fire appliances and tankers— a $2 million increase in aircraft charter expenses to meet increased requirements for bushfire and major natural disaster response, rapid damage assessment and aerial observation requirements— a $2.4 million increase in travelling and accommodation expenses to meet increased demands for travel associated with the department's expanded emergency management and volunteer coordination and training roles— $750,000 in 2016-17 of $3 million over 10 years to fund a comprehensive consumer protection campaign about legislative changes to domestic dwelling smoke alarms and the need for practised fire escape plans— a $5.3 million, or 4.2 per cent, increase in the grant to the Public Safety Business Agency (PSBA) to provide for increases in the costs of goods and services it provides for the department.
2016-17 includes the recognition of costs of services provided below fair value to the department by PSBA for the human resource and payroll systems replacement project. There costs are not reflected in 2017-18 due to the estimated completion of the project in 2016-17.
Increases in operating expenses for 2018-19 and 2019-20 are mostly due to enterprise bargaining arrangements and expected increases in prices for supplies and services.
Budgeted financial statementsAnalysis of budgeted financial statementsAn analysis of the department's financial position, as reflected in the department's financial statements, is provided below.
Departmental income statementTotal operating income is estimated to be $675.3 million in 2016-17. This is a $25.2 million, or 3.9 per cent, increase on the Estimated Actual operating income for the 2015-16 year and a $26.9 million, or 4.2 per cent, increase on the originally budgeted operating income for the 2015-16 year.
It is estimated the emergency management levy will contribute $486.3 million, or 72 per cent, of total operating income in 2016- 17.
2016-17 Queensland State Budget – Service Delivery Statements – Queensland Fire and Emergency Services 39

Chart: Total departmental expenses across the Forward Estimates period
Departmental balance sheetThe department will continue to maintain a favourable financial position at 30 June 2017 as a result of: — continued good management of cash and receivables assets— providing grant and equity contributions to enable the PSBA to efficiently manage the department's capital program— investments in new and replacement plant and equipment over the 2016-17 fiscal year— continued management of payables and employee benefit liabilities.
Forecast net assets at 30 June 2017 are $67.1 million, a reduction of $15.3 million against the budgeted net assets at 30 June 2016 and unchanged from the Estimated Actual net assets at 30 June 2016. The department's cash position at 30 June is forecast to remain positive throughout the forward estimates period. Continued low trade debtors estimated at 30 June 2016 is expected to remain low throughout the forward estimates period as a result of ongoing active pursuit of aged debtors.
600,000
620,000
640,000
660,000
680,000
700,000
720,000
740,000
760,000
2015‐16 2016‐17 2017‐18 2018‐19 2019‐20
$'000
Financial year
Total expenses
Total expenses
2016-17 Queensland State Budget – Service Delivery Statements – Queensland Fire and Emergency Services 40

Controlled income statement
Queensland Fire and Emergency Services Notes 2015-16 Budget
$'000
2015-16 Est. Act.
$'000
2016-17 Budget
$'000
INCOMEAppropriation revenue 8,13 78,709 78,605 80,272 Taxes 9,14 460,923 460,192 486,285 User charges and fees 1 51,409 50,627 51,157 Royalties and land rents .. .. .. Grants and other contributions 2,15 54,911 58,406 55,324 Interest 3 1,608 1,281 1,354Other revenue 4 763 964 864Gains on sale/revaluation of assets .. .. ..
Total income 648,323 650,075 675,256 EXPENSES
Employee expenses 5,10,16 329,001 344,573 355,898 Supplies and services 6,11,17 123,668 106,159 118,255 Grants and subsidies 7,12,18 142,455 144,341 148,237 Depreciation and amortisation 4,704 4,706 4,775 Finance/borrowing costs .. .. ..Other expenses 47,336 47,422 47,571 Losses on sale/revaluation of assets 518 170 520
Total expenses 647,682 647,371 675,256 OPERATING SURPLUS/(DEFICIT) 641 2,704 ..
2016-17 Queensland State Budget – Service Delivery Statements – Queensland Fire and Emergency Services 41

Controlled balance sheet
Queensland Fire and Emergency Services Notes 2015-16 Budget
$'000
2015-16 Est. Act.
$'000
2016-17 Budget
$'000
CURRENT ASSETSCash assets 19,26,34 28,311 29,099 25,799 Receivables 38,892 39,017 39,017 Other financial assets .. .. .. Inventories 20,27 2,013 2,630 2,630Other 21,28 1,752 2,368 2,368Non-financial assets held for sale .. .. ..
Total current assets 70,968 73,114 69,814 NON-CURRENT ASSETS
Receivables .. .. ..Other financial assets .. .. .. Property, plant and equipment 29,35 21,810 21,124 23,835 Intangibles 22,30 15,502 12,390 12,979 Other .. .. ..
Total non-current assets 37,312 33,514 36,814 TOTAL ASSETS 108,280 106,628 106,628 CURRENT LIABILITIES
Payables 23,31 8,320 17,571 17,571 Accrued employee benefits 17,551 18,658 18,658 Interest bearing liabilities and derivatives .. .. .. Provisions .. .. ..Other 24,32 .. 3,294 3,294
Total current liabilities 25,871 39,523 39,523 NON-CURRENT LIABILITIES
Payables .. .. ..Accrued employee benefits .. .. .. Interest bearing liabilities and derivatives .. .. .. Provisions .. .. ..Other .. .. ..
Total non-current liabilities .. .. .. TOTAL LIABILITIES 25,871 39,523 39,523 NET ASSETS/(LIABILITIES) 82,409 67,105 67,105 EQUITYTOTAL EQUITY 25,33 82,409 67,105 67,105
2016-17 Queensland State Budget – Service Delivery Statements – Queensland Fire and Emergency Services 42
Controlled cash flow statement
Queensland Fire and Emergency Services Notes 2015-16 Budget
$'000
2015-16 Est. Act.
$'000
2016-17 Budget
$'000
CASH FLOWS FROM OPERATING ACTIVITIESInflows:
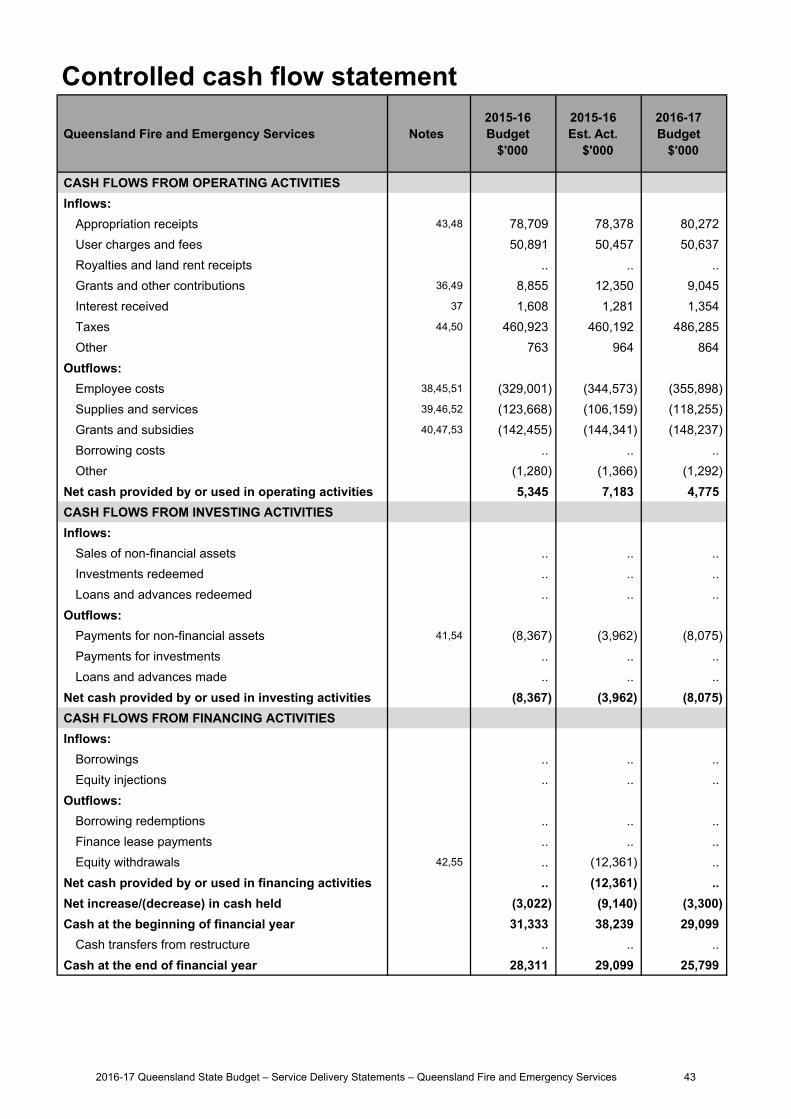
Appropriation receipts 43,48 78,709 78,378 80,272 User charges and fees 50,891 50,457 50,637 Royalties and land rent receipts .. .. .. Grants and other contributions 36,49 8,855 12,350 9,045 Interest received 37 1,608 1,281 1,354Taxes 44,50 460,923 460,192 486,285 Other 763 964 864
Outflows:Employee costs 38,45,51 (329,001) (344,573) (355,898)Supplies and services 39,46,52 (123,668) (106,159) (118,255)Grants and subsidies 40,47,53 (142,455) (144,341) (148,237)Borrowing costs .. .. ..Other (1,280) (1,366) (1,292)
Net cash provided by or used in operating activities 5,345 7,183 4,775 CASH FLOWS FROM INVESTING ACTIVITIESInflows:
Sales of non-financial assets .. .. .. Investments redeemed .. .. ..Loans and advances redeemed .. .. ..
Outflows:Payments for non-financial assets 41,54 (8,367) (3,962) (8,075)Payments for investments .. .. .. Loans and advances made .. .. ..
Net cash provided by or used in investing activities (8,367) (3,962) (8,075)CASH FLOWS FROM FINANCING ACTIVITIESInflows:
Borrowings .. .. ..Equity injections .. .. ..
Outflows:Borrowing redemptions .. .. ..Finance lease payments .. .. .. Equity withdrawals 42,55 .. (12,361) ..
Net cash provided by or used in financing activities .. (12,361) .. Net increase/(decrease) in cash held (3,022) (9,140) (3,300)Cash at the beginning of financial year 31,333 38,239 29,099
Cash transfers from restructure .. .. .. Cash at the end of financial year 28,311 29,099 25,799
2016-17 Queensland State Budget – Service Delivery Statements – Queensland Fire and Emergency Services 43
Income statementMajor variations between 2015-16 Budget and 2015-16 Estimated Actual include:
1. The reduction in user charges and fees is mainly due to a reduction in income from commercial servicesconsequent on the downturn in the mining industry.
2. The increase in grants and contributions is mainly the result of higher than forecast recoveries of counter disasteroperations expenses incurred in providing services at Natural Disaster Relief and Recovery Arrangements(NDRRA) activated events in 2014-15 and an increase in sponsorship incomes.
3. The reduction in interest income is due to a reduction in the estimated interest on emergency management levyarrears, following lower than forecast levy growth in 2014-15.
4. The increase in other revenue is due mainly to higher than budgeted insurance recoveries.
5. The increase in employee expenses is mainly due to provisions for auxiliary wage award increases, overtime andhigher duties expenses.
6. The reduction in supplies and services is partly due to the containment of professional services, equipment,computer, equipment maintenance and property repairs expenses, and partly due to the transfer of funding fromsupplies and services to employee expenses necessary for increases in the provisions for overtime expenses,auxiliary wages following approval of an Auxiliary Award, and to fund additional permanent and project ortemporary roles necessary to progress the establishment of the department, and to continue progressive input toand implementation of the recommendations and findings of reviews impacting the operation and performance ofthe department.
7. The increase in grants and subsidies is mainly due to an increase in the grant to the Public Safety BusinessAgency (PSBA) to provide additional goods and services for the department.
Major variations between 2015-16 Budget and 2016-17 Budget include:
8. The increase in appropriation revenue is mainly the result of $1.3 million to fund additional firefighter recruits andrecruit training to establish a reserve roster of 49 full-time equivalents (FTEs) as an alternative solution tobackfilling positions through overtime and temporary firefighters, and $750,000 in 2016-17 as part of $3 millionover 10 years to fund a comprehensive consumer protection campaign about legislative changes to domesticdwelling smoke alarms and the need for practised fire escape plans.
9. The increase in taxes is due to a 3.5 per cent increase in emergency management levies from 1 July 2016 andforecast growth in levied properties of 2.17 per cent.
10. The increase in employee expenses is mainly due to provisions for wage increases and overtime expenses, andfunding for additional firefighter recruits and recruit training to establish a reserve roster of 49 FTEs as analternative solution to backfilling positions through overtime and temporary firefighters.
11. The reduction in supplies and services is mainly due to the retiming of requirements for communicationsinfrastructure investments necessary outside the area covered by the Government Wireless Network, offset by$750,000 in 2016-17 as part of $3 million over 10 years to fund a comprehensive consumer protection campaignabout legislative changes to domestic dwelling smoke alarms and the need for practised fire escape plans.
12. The increase in grants and subsidies is mainly due to an increase in the grant to the PSBA to provide foradditional goods and services for the department.
Major variations between 2015-16 Estimated Actual and the 2016-17 Budget include:
13. The increase in appropriation revenue is mainly the result of $1.3 million to fund additional firefighter recruits andrecruit training to establish a reserve roster of 49 FTEs as an alternative solution to backfilling positions throughovertime and temporary firefighters, and $750,000 in 2016-17 as part of $3 million over 10 years to fund acomprehensive consumer protection campaign about legislative changes to domestic dwelling smoke alarms andthe need for practised fire escape plans.
14. The increase in taxes is due to a 3.5 per cent increase in emergency management levies from 1 July 2016 andforecast growth in levied properties of 2.17 per cent.
15. The decrease in grants and contributions is mainly due to a reduction in the estimated recoveries of counterdisaster operations expenses from NDRRA activated events in 2015-16.
Explanation of variances in the financial statements
2016-17 Queensland State Budget – Service Delivery Statements – Queensland Fire and Emergency Services 44

16. The increase in employee expenses is mainly due to provisions for wage increases and funding for additionalfirefighter recruits and recruit training to establish a reserve roster of 49 FTEs as an alternative solution tobackfilling positions through overtime and temporary firefighters.
17. The increase in supplies and services is due mainly to a forecasted three per cent increase for supplies andservices price increases and the rescheduling of a provision for critical investments in digital communicationsinfrastructure required outside the area covered by the Government Wireless Network, offset by $750,000 in2016-17 as part of $3 million over 10 years to fund a comprehensive consumer protection campaign aboutlegislative changes to domestic dwelling smoke alarms and the need for practised fire escape plans.
18. The increase in grants and subsidies is mainly due to an increase in the grant to the PSBA to provide foradditional goods and services for the department.
Balance sheetMajor variations between 2015-16 Budget and 2015-16 Estimated Actual include:
19. The increase in cash assets is mainly due to operating income higher than budgeted and operating expenseslower than budgeted for 2015-16.
20. The increase in inventories is mainly due to higher holdings of the State Emergency Service (SES) and ruralfire brigade operational and protective equipment following mild storm and bushfire seasons in 2015-16.
21. The increase in other current assets is due mainly to increases in supplies and vehicle prepayments.
22. The decrease in intangibles reflects lower than expected capital acquisitions.
23. The increase in payables reflects the timing of payments in 2015-16.
24. The increase in other current liabilities reflects the timing of expenditure reimbursements to other agencies withinthe Public Safety portfolio.
25. The reduction in total equity is mainly due to the transfer of cash back to the PSBA in 2015-16 to fund continuedimplementation of the rescheduled 2014-15 capital program.
Major variations between 2015-16 Budget and 2016-17 Budget include:
26. The reduction in cash assets is principally due to the need to fund increases in the PSBA urban and rural vehiclecapital budgets, offset by a reduction in the department's capital plant and equipment requirements.
27. The increase in inventories is mainly due to higher holdings of SES and rural fire brigade operational andprotective equipment to meet bushfire and storm responses.
28. The increase in other current assets is due mainly to increases in supplies and vehicle prepayments.
29. The increase in property, plant and equipment reflects acquisitions of operational and specialised equipment tomeet the department's service delivery obligations.
30. The decrease in intangibles reflects lower than expected capital acquisitions.
31. The increase in payables reflects the timing of payments in 2015-16.
32. The increase in other current liabilities reflects the timing of expenditure reimbursements to other agencies withinthe Public Safety portfolio.
33. The reduction in total equity is mainly due to the transfer of cash back to the PSBA in 2015-16 to fund continuedimplementation of the rescheduled 2014-15 capital program.
Major variations between 2015-16 Estimated Actual and the 2016-17 Budget include:
34. The reduction in cash assets is principally due to the need to fund increases in the PSBA urban and rural vehiclecapital budgets, offset by a reduction in the department's capital plant and equipment requirements.
35. The increase in property, plant and equipment reflects acquisitions of operational and specialised equipment tomeet the department's service delivery obligations.
Cash flow statementMajor variations between 2015-16 Budget and 2015-16 Estimated Actual include:
36. The increase in grants and other contributions is mainly due to higher than forecast recoveries of counter disasteroperations expenses incurred in providing services at NDRRA activated events in 2014-15 and an increase insponsorship receipts.
2016-17 Queensland State Budget – Service Delivery Statements – Queensland Fire and Emergency Services 45

37. The reduction in interest received is due to a reduction in the estimated interest on emergency management levyarrears, following lower than forecast levy growth in 2014-15.
38. The increase in employee costs is mainly due to provisions for auxiliary wage award increases, overtime andhigher duties expenses.
39. The reduction in supplies and services is mainly due to the containment of professional services, equipment,computer, equipment maintenance and property repairs expenses.
40. The increase in grants and subsidies is mainly due to an increase in the grant to PSBA to provide additionalgoods and services for the department.
41. The reduction in payments for non financial assets is due mainly to a reduction in the department's capital plantand equipment requirements, offset by the need to fund increases in PSBA urban and rural vehicle capitalexpenditure to maintain appliance fleet useful lives within agreed parameters.
42. The increase in equity withdrawals is due mainly to the transfer of cash back to PSBA in 2015-16 to fundcontinued implementation of the rescheduled 2014-15 capital program.
Major variations between 2015-16 Budget and 2016-17 Budget include:
43. The increase in appropriation receipts is mainly the result of $1.3 million to fund additional firefighter recruits andrecruit training to establish a reserve roster of 49 FTEs as an alternative solution to backfilling positions throughovertime and temporary firefighters, and $750,000 in 2016-17 as part of $3 million over 10 years to fund acomprehensive consumer protection campaign about legislative changes to domestic dwelling smoke alarms andthe need for practised fire escape plans.
44. The increase in taxes is due to a 3.5 per cent increase in emergency management levies from 1 July 2016 andforecast growth in levied properties of 2.17 per cent.
45. The increase in employee costs is mainly due to provisions for wage increases and overtime expenses andfunding for additional firefighter recruits and recruit training to establish a reserve roster of 49 FTEs as analternative solution to backfilling positions through overtime and temporary firefighters.
46. The reduction in supplies and services is mainly due to the retiming of requirements for communicationsinfrastructure investments necessary outside the area covered by the government wireless network, offset by$750,000 in 2016-17 as part of $3 million over 10 years to fund a comprehensive consumer protection campaignabout legislative changes to domestic dwelling smoke alarms and the need for practised fire escape plans.
47. The increase in grants and subsidies is mainly due to an increase in the grant to PSBA to provide foradditional goods and services for the department.
Major variations between 2015-16 Estimated Actual and the 2016-17 Budget include:
48. The increase in appropriation receipts is mainly the result of $1.3 million to fund additional firefighter recruits andrecruit training to establish a reserve roster of 49 FTEs as an alternative solution to backfilling positions throughovertime and temporary firefighters, and $750,000 in 2016-17 as part of $3 million over 10 years to fund acomprehensive consumer protection campaign about legislative changes to domestic dwelling smoke alarms andthe need for practised fire escape plans.
49. The reduction in grants and other contributions is mainly due to a reduction in the estimated recoveries of counterdisaster operations expenses from NDRRA activated events in 2015-16.
50. The increase in taxes is due to a 3.5 per cent increase in emergency management levies from 1 July 2016 andforecast growth in levied properties of 2.17 per cent.
51. The increase in employee costs is mainly due to provisions for wage increases and funding for additionalfirefighter recruits and recruit training to establish a reserve roster of 49 FTEs as an alternative solution tobackfilling positions through overtime and temporary firefighters.
52. The increase in supplies and services is due mainly to a forecasted 3 per cent increase for supplies and servicesprice increases and the retiming of a provision for critical investments in digital communications infrastructurerequired outside the area covered by the government wireless network, offset by $750,000 in 2016-17 as part of$3 million over 10 years to fund a comprehensive consumer protection campaign about legislative changes todomestic dwelling smoke alarms and the need for practised fire escape plans.
53. The increase in grants and subsidies is mainly due to an increase in the grant to PSBA to provide foradditional goods and services for the department.
54. The increase in payments for non financial assets reflects acquisitions of operational and specialised equipmentto meet the department's service delivery obligations.
55. The reduction in equity withdrawals is due mainly to the transfer of cash back to PSBA in 2015-16 to fundcontinued implementation of the rescheduled 2014-15 capital program.
2016-17 Queensland State Budget – Service Delivery Statements – Queensland Fire and Emergency Services 46

2016-17 Queensland State Budget – Service Delivery Statements – Queensland Fire and Emergency Services 47

Public Safety Business Agency
2016-17 Queensland State Budget – Service Delivery Statements – Public Safety Business Agency 48

Departmental overview
The Review of the Public Safety Business Agency was tabled in Parliament in February 2016. The review considered the scope, function and structure of the department to ensure it effectively supported public safety service delivery to the community. The review recommended the department narrow its focus to corporate support and made eight recommendations. The Government accepted the review's recommendations, with the exception of Recommendation 6 (to transfer Queensland Government Air (QGAir) fixed wing services to the Queensland Police Service). It is intended to implement the majority of findings and recommendations of the review by 1 July 2016.
The department is committed to its vision of being a trusted provider delivering value through high quality corporate and support services. The key objectives of the department are:
business - strong service focus, delivering value for money clients - agile, respectful, responsive relationships people - productive, engaged, inclusive workforce.
The department helps fulfil the Government's objectives of delivering quality frontline services and building safe, caring and connected communities by providing professional ICT, financial, procurement, asset management and human resources services to the Queensland Police Service, Queensland Fire and Emergency Services, and Office of the Inspector-General Emergency Management, managing QGAir Wing services, and providing ICT services to the Queensland Ambulance Service and Queensland Corrective Services. In support of the Government's objectives, the department will implement a range of strategies, including:
delivering quality services understanding and supporting the needs of its clients improving business processes in consultation with clients investing in innovation and technology to improve outcomes fostering collaboration and information sharing ensuring clarity of service provision and standards establishing and maintaining respectful client relationships embedding clients in decision making enhancing its service culture investing in its people to support a skilled, knowledgeable and capable workforce focusing on staff health and wellbeing acknowledging, celebrating and rewarding people and teams.
The key challenges for the department in 2016-17 include:
successfully adapting to the new business model and delivering improved services that meet the needs of our clients growing demand for services that are customised, delivered on demand, and available across multiple platforms maintaining ICT security to minimise disruptive activity and misuse of information, and support business continuity keeping pace with advancements in new technologies, which will have implications for information management,
community engagement, and service delivery.
In 2016-17, the department will deliver on its priorities through a number of initiatives including:
implementing the recommendations of the Review of the Public Safety Business Agency QGAir's work to obtain the Air Operator's Certificate developing a unified whole of public safety portfolio strategic ICT investment plan implementing the ongoing capital improvement program for frontline services.
The department has responsibility for delivering most new and ongoing capital initiatives to support the operational capability of the Queensland Police Service and the Queensland Fire and Emergency Services. This includes new or upgraded police and fire and rescue stations across the State, new and replacement police, fire and emergency service vehicles, and a range of ICT initiatives across the portfolio helping officers work smarter and safer. In 2016-17 this includes a program of accelerated capital works to provide new and refreshed facilities in parts of regional Queensland.
2016-17 Queensland State Budget – Service Delivery Statements – Public Safety Business Agency 49

Service performance
Performance statement
Corporate Services
Service area objective
To deliver high quality and sustainable corporate services to our clients and customers.
Service area description
Corporate services to the public safety portfolio agencies include:
business services including finance, asset management and procurement tactical human resource services advisory services on corporate service strategy frontline and digital services, including communication centres, IT maintenance and service delivery QGAir.
2016-17 service area highlights
In 2016-17 key highlights include:
developing a blueprint outlining the new role and purpose of the department supporting the replacement of the current paper based police rostering system with an electronic process to improve
police productivity supporting delivery of mobile service capability and completing the delivery of 5,400 mobile devices to provide real
time access to information for police officers in the field implementing the ongoing capital improvement program for frontline services, including replacing and upgrading
police and auxiliary fire and rescue stations replacing aircraft and the QGAir Cairns rotary wing facility to ensure QGAir meets future service requirements.
Public Safety Business Agency Notes 2015-16
Target/Est.
2015-16
Est. Actual
2016-17
Target/Est.
Service area: Corporate Services1
Service standards
Effectiveness measure
Customer satisfaction 2 ≥50% 36% ≥50%
Efficiency measure
Cost of Public Safety Business Agency services per person 3,4 ≤$130 $143 $142
Notes: 1. The scope of services has been substantially refined as a result of the Review of the Public Safety Business Agency, with the majority of
changes intended to be implemented by 1 July 2016. As a result of this review, strategic and operational services will be transferred to theQueensland Police Service and Queensland Fire and Emergency Services including operational functions, strategy, recruitment, educationand training, workplace health and safety, ethical standards, media services, right to information, ministerial services and cabinetlegislation liaison. In addition, responsibility for Blue Card Services will be transferred to the Department of Justice and Attorney-Generaland State Government Security will transfer to the Queensland Police Service.
2. This service standard is measured through an annual customer satisfaction survey and assesses overall client satisfaction with thedepartment. The customer satisfaction result comprises survey respondents who indicated that they were either satisfied or very satisfiedwith the services provided by the department over the last 12 months. Customers include Queensland Fire and Emergency Services, theQueensland Police Service, the Office of the Inspector-General Emergency Management and Ministerial staff, as well as key stakeholders
2016-17 Queensland State Budget – Service Delivery Statements – Public Safety Business Agency 50

from other government and non-government organisations who have accessed the services of the department. Internal departmental responses are excluded from this result.
3. This service standard measures the cost of delivering departmental services on a per capita Queensland basis. Population data for the2015-16 Estimated Actual is sourced from the Australian Bureau of Statistics Catalogue No. 3101.0. The 2016-17 Target/Estimate is based on Queensland Treasury population estimates.
4. The 2016-17 Target/Estimate is based on the forecast budget for the department for 2016-17, which does not reflect the intendedimplementation of the Review of the Public Safety Business Agency. The 2015-16 Estimated Actual increase is primarily due to machinery-of-government transfers, additional expenditure for programs, and programs delivered on behalf of the department’s clients and customers.
2016-17 Queensland State Budget – Service Delivery Statements – Public Safety Business Agency 51

Discontinued measures
Performance measures included in the 2015-16 Service Delivery Statements that have been discontinued or replaced are reported in the following table with estimated actual results.
Public Safety Business Agency Notes 2015-16
Target/Est.
2015-16
Est. Actual
2016-17
Target/Est.
Service area: Corporate Services
Average processing time (days) of blue card applications where there is no criminal history 14 11
Discontinued measure
Note: 1. This measure is being discontinued as it would be classified as a timeliness measure and not a measure of service effectiveness with
reference to the performance criteria within the Queensland Audit Office's Report on Monitoring and Reporting Performance.
2016-17 Queensland State Budget – Service Delivery Statements – Public Safety Business Agency 52

Departmental budget summary
The table below shows the total resources available in 2016-17 from all sources and summarises how resources will be applied by service area and by controlled and administered classifications.
Public Safety Business Agency
2015-16
Budget
$’000
2015-16
Est. Actual
$’000
2016-17
Budget
$’000
CONTROLLED
Income
Appropriation revenue1
Deferred from previous year/s 13,070 7,116 34,780
Balance of service appropriation 403,881 408,010 374,234
Other revenue 272,307 275,510 287,975
Total income 689,258 690,636 696,989
Expenses
Corporate services 680,760 684,101 683,111
Total expenses 680,760 684,101 683,111
Operating surplus/deficit 8,498 6,535 13,878
Net assets 2,521,221 2,599,379 2,695,089
Note: 1. Appropriation revenue includes State and Commonwealth funding.
2016-17 Queensland State Budget – Service Delivery Statements – Public Safety Business Agency 53

Service area sources of revenue1
Sources of revenue
2016-17 Budget
Public Safety Business Agency Total cost
$’000
State
contribution
$’000
User
charges
and fees
$’000
C’wealth
revenue
$’000
Other
revenue
$’000
Corporate services 683,111 408,715 74,299 299 213,676
Total 683,111 408,715 74,299 299 213,676
Note: 1. Explanations of variances are provided in the financial statements.
2016-17 Queensland State Budget – Service Delivery Statements – Public Safety Business Agency 54

Budget measures summary
This table shows a summary of budget measures relating to the department since the 2015-16 State Budget. Further details are contained in Budget Paper 4.
Public Safety Business Agency 2015-16
$’000
2016-17
$’000
2017-18
$’000
2018-19
$’000
2019-20
$’000
Revenue measures
Administered .. .. .. .. ..
Departmental .. .. .. .. ..
Expense measures
Administered .. .. .. .. ..
Departmental1 5,000 4,903 1,587 1,087 788
Capital measures
Administered .. .. .. .. ..
Departmental 5,161 .. .. .. ..
Note: 1. Figures reconcile with Budget Paper 4, including the whole-of-government expense measures ‘Brisbane CBD government office agency
rental impacts’ and ‘Reprioritisation allocations’.
2016-17 Queensland State Budget – Service Delivery Statements – Public Safety Business Agency 55
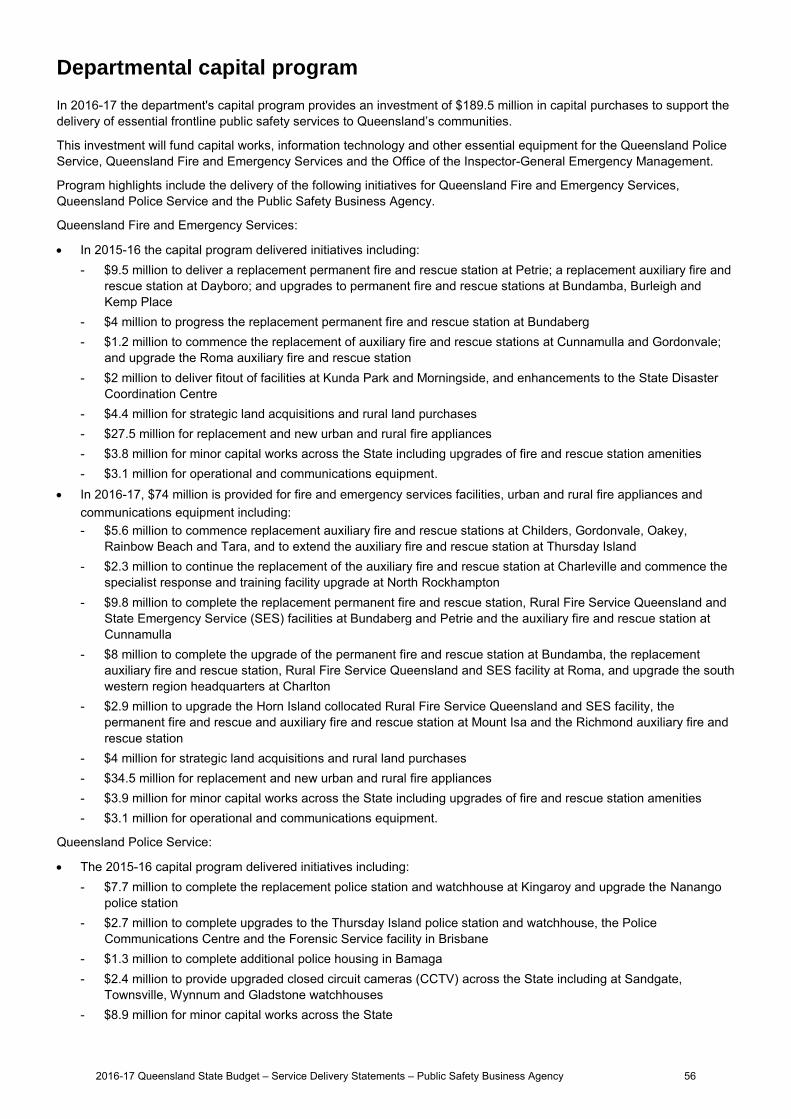
Departmental capital program
In 2016-17 the department's capital program provides an investment of $189.5 million in capital purchases to support the delivery of essential frontline public safety services to Queensland’s communities.
This investment will fund capital works, information technology and other essential equipment for the Queensland Police Service, Queensland Fire and Emergency Services and the Office of the Inspector-General Emergency Management.
Program highlights include the delivery of the following initiatives for Queensland Fire and Emergency Services, Queensland Police Service and the Public Safety Business Agency.
Queensland Fire and Emergency Services:
In 2015-16 the capital program delivered initiatives including:- $9.5 million to deliver a replacement permanent fire and rescue station at Petrie; a replacement auxiliary fire and
rescue station at Dayboro; and upgrades to permanent fire and rescue stations at Bundamba, Burleigh and Kemp Place
- $4 million to progress the replacement permanent fire and rescue station at Bundaberg - $1.2 million to commence the replacement of auxiliary fire and rescue stations at Cunnamulla and Gordonvale;
and upgrade the Roma auxiliary fire and rescue station - $2 million to deliver fitout of facilities at Kunda Park and Morningside, and enhancements to the State Disaster
Coordination Centre - $4.4 million for strategic land acquisitions and rural land purchases - $27.5 million for replacement and new urban and rural fire appliances - $3.8 million for minor capital works across the State including upgrades of fire and rescue station amenities - $3.1 million for operational and communications equipment.
In 2016-17, $74 million is provided for fire and emergency services facilities, urban and rural fire appliances andcommunications equipment including:- $5.6 million to commence replacement auxiliary fire and rescue stations at Childers, Gordonvale, Oakey,
Rainbow Beach and Tara, and to extend the auxiliary fire and rescue station at Thursday Island - $2.3 million to continue the replacement of the auxiliary fire and rescue station at Charleville and commence the
specialist response and training facility upgrade at North Rockhampton - $9.8 million to complete the replacement permanent fire and rescue station, Rural Fire Service Queensland and
State Emergency Service (SES) facilities at Bundaberg and Petrie and the auxiliary fire and rescue station at Cunnamulla
- $8 million to complete the upgrade of the permanent fire and rescue station at Bundamba, the replacement auxiliary fire and rescue station, Rural Fire Service Queensland and SES facility at Roma, and upgrade the south western region headquarters at Charlton
- $2.9 million to upgrade the Horn Island collocated Rural Fire Service Queensland and SES facility, the permanent fire and rescue and auxiliary fire and rescue station at Mount Isa and the Richmond auxiliary fire and rescue station
- $4 million for strategic land acquisitions and rural land purchases - $34.5 million for replacement and new urban and rural fire appliances - $3.9 million for minor capital works across the State including upgrades of fire and rescue station amenities - $3.1 million for operational and communications equipment.
Queensland Police Service:
The 2015-16 capital program delivered initiatives including:- $7.7 million to complete the replacement police station and watchhouse at Kingaroy and upgrade the Nanango
police station - $2.7 million to complete upgrades to the Thursday Island police station and watchhouse, the Police
Communications Centre and the Forensic Service facility in Brisbane - $1.3 million to complete additional police housing in Bamaga- $2.4 million to provide upgraded closed circuit cameras (CCTV) across the State including at Sandgate,
Townsville, Wynnum and Gladstone watchhouses - $8.9 million for minor capital works across the State
2016-17 Queensland State Budget – Service Delivery Statements – Public Safety Business Agency 56

- $34.9 million for 15 new and 962 replacement police service vehicles - $43 million for a range of ICT initiatives including mobile services and the Public Safety Network - $5.2 million for major plant and equipment including aircraft maintenance and upgrades.
In 2016-17 $98.9 million is provided for Queensland Police Service facilities, information and communicationtechnology and other essential equipment including:- $6.1 million to commence the replacement police station at Gordonvale, replacement police station and
watchhouse project at Caboolture and upgrade the police station at Bowen - $3 million to commence the construction of the new collocated Road Policing Unit and Special Emergency
Response Team facility at Cairns - $8.6 million to complete the replacement police station and watchhouse at Kingaroy, the replacement police
station at Maleny, replacement police station and residence upgrade at Nanango and the Forensic Service facility upgrade at Police Headquarters
- $9.7 million to continue the Police Headquarters renewal project, and deliver the upgrade of holding cells at Yarrabah, Bamaga residential accommodation, replacement residence at Halifax and upgraded CCTV across the State
- $32 million for new and replacement police service vehicles - $21.6 million for major plant and equipment including for Mobile Services and the Public Safety Network - $12 million for a range of information and communication technology initiatives - $5.9 million for minor capital works across the State.
Public Safety Business Agency – Other Departmental Capital:
in 2015-16 $14.9 million was provided for information systems development and other plant and equipment. in 2016-17 $16.6 million is provided to fund information systems development and other plant and equipment
including information technology asset replacements across the Public Safety portfolio and to support theQueensland Ambulance Service information and communication technology.
Capital budget
Public Safety Business Agency Notes
2015-16
Budget
$’000
2015-16
Est. Actual
$’000
2016-17
Budget
$’000
Capital purchases1
Total land, buildings and infrastructure 47,904 46,406 69,789
Total plant and equipment 130,222 136,088 119,684
Total other capital .. .. ..
Total capital purchases 178,126 182,494 189,473
Note: 1. For more detail on the agency’s capital acquisitions please refer to Budget Paper 3.
2016-17 Queensland State Budget – Service Delivery Statements – Public Safety Business Agency 57

Staffing1
Public Safety Business Agency Notes 2015-16
Budget 2015-16
Est. Actual 2016-17
Budget
Corporate Services 2 1,994 2,025 2,057
TOTAL 3,4,5 1,994 2,025 2,057
Notes: 1. Full-time equivalents (FTEs) as at 30 June.2. The Corporate Services service area description reflects the intended implementation of the Review of the Public Safety Business Agency.
The FTEs in this table continue to be representative of the 2015-16 service area description - Strategic, Corporate and OperationalServices.
3. The FTEs in the 2015-16 Estimated Actual include: a decrease of FTEs transferred to Queensland Fire and Emergency Services;additional positions created through the conversion of contractors to employees; additional temporary positions for implementation of anElectronic Rostering System for the Queensland Police Service and the Human Resource Information System payroll and Human CapitalManagement system for Queensland Fire and Emergency Services, Queensland Ambulance Service, Queensland Corrective Services andthe Office of the Inspector-General Emergency Management.
4. The FTEs in the 2016-17 Budget include: further temporary positions for implementation of an Electronic Rostering System for theQueensland Police Service; temporary positions to facilitate Corporate Services preparations for the Queensland Police Serviceinvolvement in the Gold Coast 2018 Commonwealth Games; and a project manager for the QGAir Cairns facility redevelopment.
5. All FTEs exclude police officers seconded to the department (over 400 positions).
2016-17 Queensland State Budget – Service Delivery Statements – Public Safety Business Agency 58

Budgeted financial statements
Departmental income statementTotal expenses are estimated to be $683.1 million in 2016-17, a decrease of $990,000 from the 2015-16 financial year. The decrease is marginal and reflects:— lower funding in 2016-17 for the flood-focused road safety campaign — deferrals of planned expenditure to 2015-16 for delayed projects— re-profiling of planned expenditure for mobile services capability. These decreases are partially offset by increased planned expenditure for the human resource and payroll systems.
Expenses in 2015-16, 2016-17 and 2017-18 include costs for the human resource and payroll systems project that is expected to be completed in 2018.
Departmental balance sheetThe department's major assets are in property, plant and equipment and intangibles ($2.608 billion) and cash ($107.6 million). Non-current assets are expected to increase by 9.4 per cent over the next three years, principally due to anticipated acquisition levels and revaluations over the period. The department's main liabilities relate to payables ($57.4 million).
645,000
650,000
655,000
660,000
665,000
670,000
675,000
680,000
685,000
690,000
2015‐16 2016‐17 2017‐18 2018‐19 2019‐20
$'000
Financial year
Total expenses
Total expenses
Analysis of budgeted financial statementsAn analysis of the department's financial position, as reflected in the department's financial statements, is provided below.
Chart: Total departmental expenses across the Forward Estimates period
2016-17 Queensland State Budget – Service Delivery Statements – Public Safety Business Agency 59

Controlled income statement
Public Safety Business Agency Notes 2015-16 Budget
$'000
2015-16 Est. Act.
$'000
2016-17 Budget
$'000
INCOMEAppropriation revenue 3,8 416,951 415,126 409,014 Taxes .. .. ..User charges and fees 1,4,9 68,928 72,674 74,299 Royalties and land rents .. .. .. Grants and other contributions 5,10 199,611 199,068 209,901 Interest .. .. ..Other revenue 1,768 1,768 1,775Gains on sale/revaluation of assets 2,000 2,000 2,000
Total income 689,258 690,636 696,989 EXPENSES
Employee expenses 2,6,11 212,607 216,560 220,132 Supplies and services 7,12 233,662 231,588 226,903 Grants and subsidies 30,974 30,974 30,975 Depreciation and amortisation 134,864 134,864 135,017 Finance/borrowing costs 471 471 471Other expenses 66,182 67,644 67,613 Losses on sale/revaluation of assets 2,000 2,000 2,000
Total expenses 680,760 684,101 683,111 OPERATING SURPLUS/(DEFICIT) 8,498 6,535 13,878
2016-17 Queensland State Budget – Service Delivery Statements – Public Safety Business Agency 60

Controlled balance sheet
Public Safety Business Agency Notes 2015-16 Budget
$'000
2015-16 Est. Act.
$'000
2016-17 Budget
$'000
CURRENT ASSETSCash assets 13,23,33 78,569 125,829 107,564 Receivables 14,24 35,445 29,108 29,108 Other financial assets .. .. .. Inventories .. 843 843 Other 15,25 3,296 22,583 22,583 Non-financial assets held for sale 4,351 5,084 5,084
Total current assets 121,661 183,447 165,182 NON-CURRENT ASSETS
Receivables .. .. .. Other financial assets .. .. .. Property, plant and equipment 16,26,34 2,421,528 2,458,139 2,570,594 Intangibles 17,27 42,766 36,211 37,650 Other .. .. ..
Total non-current assets 2,464,294 2,494,350 2,608,244 TOTAL ASSETS 2,585,955 2,677,797 2,773,426 CURRENT LIABILITIES
Payables 18,28 48,007 57,419 57,419 Accrued employee benefits 19,29 6,690 9,533 9,533 Interest bearing liabilities and derivatives 20,30 1,378 9,700 9,619 Provisions .. .. .. Other 148 1,766 1,766
Total current liabilities 56,223 78,418 78,337 NON-CURRENT LIABILITIES
Payables .. .. .. Accrued employee benefits .. .. .. Interest bearing liabilities and derivatives 21,31 8,511 .. .. Provisions .. .. .. Other .. .. ..
Total non-current liabilities 8,511 .. .. TOTAL LIABILITIES 64,734 78,418 78,337 NET ASSETS/(LIABILITIES) 2,521,221 2,599,379 2,695,089 EQUITYTOTAL EQUITY 22,32,35 2,521,221 2,599,379 2,695,089
2016-17 Queensland State Budget – Service Delivery Statements – Public Safety Business Agency 61

Controlled cash flow statement
Public Safety Business Agency Notes 2015-16 Budget
$'000
2015-16 Est. Act.
$'000
2016-17 Budget
$'000
CASH FLOWS FROM OPERATING ACTIVITIESInflows:
Appropriation receipts 36,41,48 416,951 425,364 409,014 User charges and fees 37,42,49 68,928 72,674 74,299 Royalties and land rent receipts .. .. .. Grants and other contributions 43,50 135,008 134,465 143,872 Interest received .. .. ..Taxes .. .. ..Other 1,768 1,768 1,775
Outflows:Employee costs 38,44,51 (212,607) (216,560) (220,132)Supplies and services 45,52 (233,662) (231,588) (226,903)Grants and subsidies (30,974) (30,974) (30,975)Borrowing costs (471) (471) (471)Other (1,579) (3,041) (1,584)
Net cash provided by or used in operating activities 143,362 151,637 148,895 CASH FLOWS FROM INVESTING ACTIVITIESInflows:
Sales of non-financial assets 20,000 17,098 18,400 Investments redeemed .. .. ..Loans and advances redeemed .. .. ..
Outflows:Payments for non-financial assets 39,46,53 (178,126) (182,494) (189,473)Payments for investments .. .. .. Loans and advances made .. .. ..
Net cash provided by or used in investing activities (158,126) (165,396) (171,073)CASH FLOWS FROM FINANCING ACTIVITIESInflows:
Borrowings .. .. ..Equity injections 40,47,54 70,226 87,119 64,504
Outflows:Borrowing redemptions (150) (150) (81)Finance lease payments .. .. .. Equity withdrawals (60,510) (64,560) (60,510)
Net cash provided by or used in financing activities 9,566 22,409 3,913 Net increase/(decrease) in cash held (5,198) 8,650 (18,265)Cash at the beginning of financial year 83,767 117,179 125,829
Cash transfers from restructure .. .. .. Cash at the end of financial year 78,569 125,829 107,564
2016-17 Queensland State Budget – Service Delivery Statements – Public Safety Business Agency 62

Income statementMajor variations between 2015-16 Budget and 2015-16 Estimated Actual include:
1. The increase in user charges revenue is due to the delivery of heightened security including the provision andtraining of extra State Government Security officers.
2. The increase in employee expenses is mainly due enterprise bargaining arrangements.
Major variations between 2015-16 Budget and 2016-17 Budget include:
3. The decrease in appropriation revenue is mainly due to budget transfers from QPS in 2015-16. In addition,funding for the mobile services program, the flood-focused road safety campaign and the body worn videocameras for police officers reduces in 2016-17.
4. The increase in user charges revenue funds the delivery of heightened security including the provision andtraining of extra State Government Security officers, and an anticipated increase in revenue from Blue Cardapplications.
5. The increase in grants and other contributions mainly relates to the contribution from Queensland Fire andEmergency Services (QFES) for services provided and the contribution from the Queensland Ambulance Service(QAS) for information and communication technology (ICT) services provided.
6. The increase in employee expenses is mainly due to enterprise bargaining arrangements.
7. The decrease in supplies and services is mainly due to one-off budget transfers from QPS in 2015-16 andexpenses for the flood-focused road safety campaign and the body worn video cameras for police officers thatreduce in 2016-17. The decrease is partly offset by additional costs for the provision and training of extra StateGovernment Security officers to provide heightened security.
Major variations between 2015-16 Estimated Actual and the 2016-17 Budget include:
8. The decrease in appropriation revenue is mainly due to budget transfers from QPS in 2015-16. In addition,funding for the mobile services program and the flood-focused road safety campaign reduces in 2016-17.
9. The increase in user charges is mainly due to an anticipated increase in revenue from Blue Card applications.
10. The increase in grants and other contributions mainly relates to the contribution from QFES for services providedand the contribution from the QAS for information and ICT services provided.
11. The increase in employee expenses is mainly due to enterprise bargaining arrangements.
12. The decrease in supplies and services is mainly due to one-off budget transfers from QPS in 2015-16 andexpenses for the flood-focused road safety campaign that reduce in 2016-17.
Balance sheetMajor variations between 2015-16 Budget and 2015-16 Estimated Actual include:
13. The increase in cash assets is mainly due to the lower than estimated payments for property, plant and equipmentand the timing of payments.
14. The decrease in receivables is due to the estimated timing of receipts in 2015-16.
15. The increase in other current assets is mainly due to higher than estimated prepaid expenses for information andcommunication services and expenditure reimbursements from QAS, QFES and QPS.
16. Property, plant and equipment increased principally due to higher than antipated revaluation increments.
17. The decrease in intangibles reflects the reduction in value through higher than anticipated amortisation.
18. The increase in payables reflects the timing of payments in 2015-16.
19. The increase in accrued employee benefits reflects the timing of payments for salaries and wages.
20. The increase in current Interest-bearing liabilities and derivatives reflects the reclassification of loan debt fromnon-current liabilities.
21. The decrease in non-current interest-bearing liabilities and derivatives reflects the reclassification of loan debt tocurrent liabilities.
Explanation of variances in the financial statements
2016-17 Queensland State Budget – Service Delivery Statements – Public Safety Business Agency 63
22. The increase in total equity is mainly due to the higher than estimated revaluation increments and operatingsurplus in 2014-15 and equity funding for the capital acquisitions program.
Major variations between 2015-16 Budget and 2016-17 Budget include:
23. The increase in cash assets is mainly due to the lower than estimated payments for property, plant and equipmentand the timing of payments.
24. The decrease in receivables is due to the estimated timing of receipts in 2015-16.
25. The increase in other current assets is mainly due to higher than estimated prepaid expenses for information andcommunication services and expenditure reimbursements from QAS, QFES and QPS.
26. The increase in property, plant and equipment is principally due to the effect of estimated revaluation incrementsand capital acquisitions.
27. The decrease in intangibles reflects the reduction in value through higher than anticipated amortisation.
28. The increase in payables reflects the timing of payments in 2015-16.
29. The increase in accrued employee benefits reflects the timing of payments for salaries and wages.
30. The increase in current interest-bearing liabilities and derivatives reflects the reclassification of loan debt fromnon-current liabilities.
31. The decrease in non-current interest-bearing liabilities and derivatives reflects the reclassification of loan debt tocurrent liabilities.
32. The increase in total equity is mainly due to the higher than estimated revaluation increments and operatingsurplus in 2014-15 and equity funding for the capital acquisitions program.
Major variations between 2015-16 Estimated Actual and the 2016-17 Budget include:
33. The decrease in cash assets is principally due to capital expenditure planned for 2016-17.
34. The increase in property, plant and equipment is principally due to the effect of revaluation increments and capitalacquisitions in 2016-17.
35. The increase in total equity is mainly due to the effect of revaluation increments, the operating surplus in 2016-17and equity funding for the 2016-17 capital program.
Cash flow statementMajor variations between 2015-16 Budget and 2015-16 Estimated Actual include:
36. The increase in appropriation receipts reflects the service revenue received in 2015-16 to fund 2014-15depreciation and other operational expenses.
37. The increase in user charges and fees is due to the delivery of heightened security including the provision and training of extra State Government Security officers.
38. The increase in employee costs is mainly due enterprise bargaining arrangements.
39. Payments for non-financial assets increased due to the additional capital acquisitions in 2015-16.
40. The increase in equity injections is due to increased funding for maintenance of the Queensland Government AirRotary Wing Aircraft and the transfer of funding from QPS for capital works.
Major variations between 2015-16 Budget and 2016-17 Budget include:
41. The decrease in appropriation receipts is mainly due to budget transfers from QPS in 2015-16. In addition,funding for the mobile services program, the flood-focused road safety campaign and the body worn videocameras for police officers reduces in 2016-17.
42. The increase in user charges and fees is due to the delivery of heightened security including the provision andtraining of extra State Government Security officers.
43. The increase in grants and other contributions mainly relates to the contribution from QFES for services providedand the contribution from the QAS for ICT services provided.
44. The increase in employee costs is mainly due enterprise bargaining arrangements.
45. The decrease in supplies and services is mainly due to one-off budget transfers from QPS in 2015-16 andexpenditure for the flood focused road safety campaign and the body worn video cameras for police officers thatreduces in 2016-17.
2016-17 Queensland State Budget – Service Delivery Statements – Public Safety Business Agency 64

46. The increase in payments for non-financial assets relates to the capital acquisitions program for 2016-17.
47. The reduction in equity injections is due to increased funding for maintenance of the Queensland Government AirRotary Wing Aircraft in 2015-16 only and the transfer of increased funding from QPS for capital works in 2015-16.
Major variations between 2015-16 Estimated Actual and the 2016-17 Budget include:
48. The decrease in appropriation receipts is mainly due to budget transfers from QPS in 2015-16. In addition,funding for the mobile services program and the flood-focused road safety campaign reduces in 2016-17.
49. The increase in user charges and fees is mainly due to an anticipated increase in revenue from Blue Cardapplications.
50. The increase in grants and other contributions mainly relates to the contribution from QFES for services providedand the contribution from the QAS for ICT services provided.
51. The increase in employee costs is mainly due enterprise bargaining arrangements.
52. The decrease in supplies and services is mainly due to budget transfers from QPS in 2015-16 and expenditure forthe flood-focused road safety campaign that reduces in 2016-17.
53. The increase in payments for non-financial assets relates to the capital acquisitions program for 2016-17.
54. The reduction in equity injections is due to increased funding for maintenance of the Queensland Government AirRotary Wing Aircraft in 2015-16 only and reduced funding transfers from QPS for capital works.
2016-17 Queensland State Budget – Service Delivery Statements – Public Safety Business Agency 65

Office of the Inspector-General Emergency
Management
2016-17 Queensland State Budget – Service Delivery StatementsOffice of the Inspector-General Emergency Management
66

Departmental overview
The Office of the Inspector-General Emergency Management (IGEM) was established on 1 July 2014 to enable confidence in Queensland's emergency management arrangements.
The Office of the IGEM's vision is to be a catalyst for excellence in emergency management. To support this, the strategic objectives of the Office of the IGEM are to:
ensure Government, stakeholders and the community receive independent assurance and advice aboutQueensland's emergency management arrangements
ensure authoritative reporting enhances accountability and improved community confidence and outcomes inemergency management
drive a culture of excellence and innovation across the emergency management sector by connecting stakeholders,creating partnerships and marshalling expertise
ensure a high performing, agile, engaged and connected workforce that consistently delivers quality services.
The Office of the IGEM is committed to delivering on the Queensland Government's objectives for the community of building safe, caring and connected communities and delivering quality frontline services. The Office of the IGEM does this by reviewing and assessing Queensland's disaster management arrangements for opportunities to improve community outcomes.
The Office of the IGEM has identified the following strategic risks and challenges for 2016-17 and into the future:
reducing barriers to responsive and integrated disaster management for local governments, state agencies and otherpartners
ensuring performance is measured against outcomes ensuring continued support for shared responsibilities balanced with clear accountabilities ensuring clear expectations of leadership across the emergency management sector providing valued services to key stakeholders ensuring all stakeholders understand their risks and are taking appropriate action to mitigate these risks ensuring the broader disaster management framework remains contemporary ensuring the value of advice and the related outcomes is greater than the investment required for implementation.
To address these risks and challenges in 2016-17, the Office of the IGEM will progress a range of strategies including:
embedding and validating the Emergency Management Assurance Framework, in collaboration with stakeholders providing diligent oversight to ensure that accountabilities and responsibilities are known, understood and met across
emergency management designing and applying assurance activities, tools and processes that are valued by our stakeholders and enable
performance improvements, evaluation and reporting undertaking targeted reviews and system analysis that identify risks, gaps and prioritise improvements on the basis
of community outcomes encouraging and harnessing trusted partnerships, enabled by transparent systems and processes, that promote
innovation, interoperability, consultation and knowledge transfer across the emergency management sector connecting and engaging with stakeholders through key platforms that enable timely and open communication and
help us to understand their needs integrating lessons identified, research, analysis and good practice into the provision of evidence-based policy and
advice providing timely, clear and helpful information and advice that enhances links between emergency management and
interdependent policy and programs promoting a coordinated strategic direction for emergency management in Queensland.
2016-17 Queensland State Budget – Service Delivery StatementsOffice of the Inspector-General Emergency Management
67

Service performance
Performance statement
Independent Assurance and Advice to Improve Emergency Management
Service area objective
To provide independent assurance and advice that enables confidence in Queensland’s emergency management arrangements.
Service area description
The Office of the IGEM provides independent assurance and advice about Queensland's emergency management arrangements and authoritative reporting to enhance accountability and improve outcomes for the community.
The Office of the IGEM has established the Standard for Disaster Management in Queensland (the Standard), which forms part of the Emergency Management Assurance Framework. The Office of the IGEM undertakes targeted reviews and system analysis to identify risks to emergency management planning, preparedness, response and recovery arrangements and recommends evidence-based improvements.
2016-17 service area highlights
In 2016-17, the Office of the IGEM will continue to review and assess disaster management arrangements in Queensland through a risk based approach, including undertaking reviews that may arise from future disaster events. Further highlights include:
enabling stakeholders to conduct a health check of their disaster management capability against the Standardthrough systems and processes that are easy to use, accessible and that provide clear, useful and timely information
progressing research and collaborative opportunities with universities and other institutions so that lessons identified,research and good practice are integrated into evidence-based policy and advice
facilitating continuous improvement, consultation and collaboration across the sector through the statewide networkof disaster management officers and local disaster coordinators.
Office of the Inspector-General
Emergency Management Notes
2015-16
Target/Est.
2015-16
Est. Actual
2016-17
Target/Est.
Service area: Independent Assurance
and Advice to Improve Emergency
Management
Service standards
Effectiveness measures
Customer satisfaction 1,2,3 80% 83% 80%
Proportion of recommendations agreed to by entities to which the recommendations apply 4,5 80% 85% 80%
Efficiency measures6
Notes: 1. This service standard is measured as part of an annual customer survey. Customers include the Minister, state and local government
stakeholders with a role in disaster and emergency management. 2. This service standard measures overall satisfaction with the Office of the IGEM. Overall satisfaction is measured in terms of satisfaction
with aspects of staff performance, timeliness, accessibility, quality, advice given and services provided. 3. This service standard measures the number of respondents who indicated they were either ‘very satisfied’ or ‘satisfied’ with the services
and advice provided by the Office of the IGEM represented as a percentage of the total number of responses received.
2016-17 Queensland State Budget – Service Delivery StatementsOffice of the Inspector-General Emergency Management
68
4. This service standard measures the number of recommendations agreed to by the entities to which the recommendations apply, expressedas a percentage of the total number of recommendations made by the IGEM. This calculation is based on reports formally provided to theMinister during the 2015-16 financial year.
5. ‘Agreed to’ refers to those recommendations which have been accepted by an accountable officer of the entity to which therecommendation applies.
6. An efficiency measure is being developed and will be included in a future Service Delivery Statement.
2016-17 Queensland State Budget – Service Delivery StatementsOffice of the Inspector-General Emergency Management
69

Departmental budget summary
The table below shows the total resources available in 2016-17 from all sources and summarises how resources will be applied by service area and by controlled and administered classifications.
Office of the Inspector-General
Emergency Management
2015-16
Budget
$’000
2015-16
Est. Actual
$’000
2016-17
Budget
$’000
CONTROLLED
Income
Appropriation revenue1
Deferred from previous year/s 50 73 ..
Balance of service appropriation 3,836 3,874 3,911
Other revenue 721 721 742
Total income 4,607 4,668 4,653
Expenses
Independent Assurance and Advice to Improve Emergency Management 4,607 4,668 4,653
Total expenses 4,607 4,668 4,653
Operating surplus/deficit .. .. ..
Net assets 666 839 839
Note: 1. Appropriation revenue includes State and Commonwealth funding.
2016-17 Queensland State Budget – Service Delivery StatementsOffice of the Inspector-General Emergency Management
70

Service area sources of revenue1
Sources of revenue
2016-17 Budget
Office of the Inspector-General
Emergency Management
Total cost
$’000
State
contribution
$’000
User
charges
and fees
$’000
C’wealth
revenue
$’000
Other
revenue
$’000
Independent Assurance and Advice to Improve Emergency Management 4,653 3,911 .. .. 742
Total 4,653 3,911 .. .. 742
Note: 1. Explanations of variances are provided in the financial statements.
2016-17 Queensland State Budget – Service Delivery StatementsOffice of the Inspector-General Emergency Management
71

Staffing1
Office of the Inspector-General
Emergency Management Notes
2015-16
Budget
2015-16
Est. Actual
2016-17
Budget
Independent Assurance and Advice to Improve Emergency Management 21 21 21
TOTAL 21 21 21
Note: 1. Full-time equivalents (FTEs) as at 30 June.
2016-17 Queensland State Budget – Service Delivery StatementsOffice of the Inspector-General Emergency Management
72

Chart: Total departmental expenses across the Forward Estimates period
Departmental balance sheetThe department's major assets are in cash. The department's main liabilities relate to payables.
Budgeted financial statements
Analysis of budgeted financial statementsAn analysis of the department's financial position, as reflected in the department's financial statements, is provided below.
Departmental income statementTotal expenses are estimated to be $4.7 million in 2016-17, a decrease of $15,000 from the 2015-16 financial year. This marginal decrease is mainly due to prior year expenditure rescheduled into 2015-16 not required in 2016-17, which has been partly offset by the impact of enterprise bargaining arrangements. The reduction in 2017-18 reflects movement in fair value recognition of cost of services provided by the Public Safety Business Agency (PSBA) to the department which is principally due to the completion of the human resource and payroll systems replacement project. The increase in 2018-19 and 2019-20 is mainly due to the impact of enterprise bargaining arrangements.
4,350
4,400
4,450
4,500
4,550
4,600
4,650
4,700
2015‐16 2016‐17 2017‐18 2018‐19 2019‐20
$'000
Financial year
Total expenses
Total expenses
2016-17 Queensland State Budget – Service Delivery StatementsOffice of the Inspector-General Emergency Management
73

Controlled income statementOffice of the Inspector-General Emergency Management Notes
2015-16 Budget
$'000
2015-16 Est. Act.
$'000
2016-17 Budget
$'000
INCOMEAppropriation revenue 5 3,886 3,947 3,911Taxes .. .. ..User charges and fees .. .. .. Royalties and land rents .. .. .. Grants and other contributions 2,6 721 721 742Interest .. .. ..Other revenue .. .. ..Gains on sale/revaluation of assets .. .. ..
Total income 4,607 4,668 4,653EXPENSES
Employee expenses 3 2,733 2,771 2,807Supplies and services 1,4,7 1,128 1,151 1,079Grants and subsidies .. .. .. Depreciation and amortisation 3 3 3 Finance/borrowing costs .. .. ..Other expenses 2,6 743 743 764Losses on sale/revaluation of assets .. .. ..
Total expenses 4,607 4,668 4,653OPERATING SURPLUS/(DEFICIT) .. .. ..
2016-17 Queensland State Budget – Service Delivery StatementsOffice of the Inspector-General Emergency Management
74

Controlled balance sheetOffice of the Inspector-General Emergency Management Notes
2015-16 Budget
$'000
2015-16 Est. Act.
$'000
2016-17 Budget
$'000
CURRENT ASSETSCash assets 8,16 784 1,418 1,421Receivables 9,17 47 73 73Other financial assets .. .. .. Inventories .. .. ..Other 10,18 30 .. ..Non-financial assets held for sale .. .. ..
Total current assets 861 1,491 1,494 NON-CURRENT ASSETS
Receivables .. .. ..Other financial assets .. .. .. Property, plant and equipment 11,19,24 21 18 15Intangibles .. .. ..Other .. .. ..
Total non-current assets 21 18 15 TOTAL ASSETS 882 1,509 1,509 CURRENT LIABILITIES
Payables 12,20 206 467 467Accrued employee benefits 13,21 10 72 72Interest bearing liabilities and derivatives .. .. .. Provisions .. .. ..Other 14,22 .. 131 131
Total current liabilities 216 670 670 NON-CURRENT LIABILITIES
Payables .. .. ..Accrued employee benefits .. .. .. Interest bearing liabilities and derivatives .. .. .. Provisions .. .. ..Other .. .. ..
Total non-current liabilities .. .. .. TOTAL LIABILITIES 216 670 670NET ASSETS/(LIABILITIES) 666 839 839EQUITYTOTAL EQUITY 15,23 666 839 839
2016-17 Queensland State Budget – Service Delivery StatementsOffice of the Inspector-General Emergency Management
75

Controlled cash flow statementOffice of the Inspector-General Emergency Management Notes
2015-16 Budget
$'000
2015-16 Est. Act.
$'000
2016-17 Budget
$'000
CASH FLOWS FROM OPERATING ACTIVITIESInflows:
Appropriation receipts 3,886 3,924 3,911User charges and fees .. .. .. Royalties and land rent receipts .. .. .. Grants and other contributions .. .. .. Interest received .. .. ..Taxes .. .. ..Other .. .. ..
Outflows:Employee costs 26 (2,733) (2,771) (2,807)Supplies and services 25,27,28 (1,128) (1,151) (1,079)Grants and subsidies .. .. .. Borrowing costs .. .. ..Other (22) (22) (22)
Net cash provided by or used in operating activities 3 (20) 3 CASH FLOWS FROM INVESTING ACTIVITIESInflows:
Sales of non-financial assets .. .. .. Investments redeemed .. .. ..Loans and advances redeemed .. .. ..
Outflows:Payments for non-financial assets .. .. .. Payments for investments .. .. .. Loans and advances made .. .. ..
Net cash provided by or used in investing activities .. .. .. CASH FLOWS FROM FINANCING ACTIVITIESInflows:
Borrowings .. .. ..Equity injections .. .. ..
Outflows:Borrowing redemptions .. .. ..Finance lease payments .. .. .. Equity withdrawals .. .. ..
Net cash provided by or used in financing activities .. .. .. Net increase/(decrease) in cash held 3 (20) 3 Cash at the beginning of financial year 781 1,438 1,418
Cash transfers from restructure .. .. .. Cash at the end of financial year 784 1,418 1,421
2016-17 Queensland State Budget – Service Delivery StatementsOffice of the Inspector-General Emergency Management
76

Income statementMajor variations between 2015-16 Budget and 2015-16 Estimated Actual include:
1. The increase in supplies and services is mainly due to the rescheduling of expenditure from 2014-15 into 2015-16.
Major variations between 2015-16 Budget and 2016-17 Budget include:
2. The increase in grants and other contributions revenue and corresponding increase in other expenses is primarilydue to movement in the fair value recognition of cost of services provided below fair value to the Office of theInspector-General Emergency Management (IGEM) by the PSBA.
3. The increase in employee expenses is due to the impact of enterprise bargaining arrangements.
4. The decrease in supplies and services is mainly the result of prior year expenditure rescheduled into 2015-16 notrequired in 2016-17.
Major variations between 2015-16 Estimated Actual and the 2016-17 Budget include:
5. The decrease in appropriation revenue is mainly the result of prior year expenditure rescheduled into 2015-16 notrequired in 2016-17.
6. The increase in grants and other contributions revenue and corresponding increase in other expenses is primarilydue to movement in the fair value recognition of cost of services provided below fair value to IGEM by the PSBA.
7. The decrease in supplies and services is mainly the result of prior year expenditure rescheduled into 2015-16 notrequired in 2016-17.
Balance sheetMajor variations between 2015-16 Budget and 2015-16 Estimated Actual include:
8. The increase in cash assets is mainly due to a higher than originally estimated opening cash balance for 2015-16,as a result of higher than estimated payables and accrued employee benefits.
9. The increase in receivables is primarily a result of the higher than estimated opening balance for 2015-16 due tothe timing of receipts for Goods & Services Tax (GST) credits.
10. The decrease in other currents assets is due to prepayments originally budgeted for in 2015-16 which did noteventuate.
11. The decrease in property, plant and equipment reflects reductions in the net book value of these assets heldduring 2015-16.
12. The increase in payables reflects the timing of payments in 2015-16.
13. The increase in accrued employee benefits reflects the timing of payments for salaries and wages and to theAnnual Leave and Long Service Leave central schemes for the holding of employee entitlements, and provides forincreases in other employee benefits payable.
14. The increase in other current liabilities reflects the timing of expenditure reimbursements to other agencies withinthe Public Safety portfolio.
15. The increase in total equity is primarily due to the higher than estimated operating surplus for 2014-15.
Major variations between 2015-16 Budget and 2016-17 Budget include:
16. The increase in cash assets is mainly due to a higher than originally estimated opening cash balance for 2015-16,as a result of higher than estimated payables and accrued employee benefits.
17. The increase in receivables is primarily a result of the higher than estimated opening balance for 2015-16 due tothe timing of receipts for GST credits.
18. The decrease in other currents assets is due to prepayments originally budgeted for in 2015-16 which did noteventuate.
19. The decrease in property, plant and equipment reflects reductions in the net book value of these assets heldduring 2015-16.
20. The increase in payables reflects the timing of payments in 2015-16.
Explanation of variances in the financial statements
2016-17 Queensland State Budget – Service Delivery StatementsOffice of the Inspector-General Emergency Management
77
21. The increase in accrued employee benefits reflects the timing of payments for salaries and wages and to theAnnual Leave and Long Service Leave central schemes for the holding of employee entitlements, and provides forincreases in other employee benefits payable.
22. The increase in other current liabilities reflects the timing of expenditure reimbursements to other agencies withinthe Public Safety portfolio.
23. The increase in total equity is primarily due to the higher than estimated operating surplus for 2014-15.
Major variations between 2015-16 Estimated Actual and the 2016-17 Budget include:
24. The decrease in property, plant and equipment reflects reductions in the net book value of these assets heldduring 2015-16.
Cash flow statementMajor variations between 2015-16 Budget and 2015-16 Estimated Actual include:
25. The increase in supplies and services is mainly due to the rescheduling of expenditure from 2014-15 into 2015-16.
Major variations between 2015-16 Budget and 2016-17 Budget include:
26. The increase in employee costs is due to the impact of enterprise bargaining arrangements.
27. The decrease in supplies and services is mainly the result of prior year expenditure rescheduled into 2015-16 notrequired in 2016-17.
Major variations between 2015-16 Estimated Actual and the 2016-17 Budget include:
28. The decrease in supplies and services is mainly the result of prior year expenditure rescheduled into 2015-16 notrequired in 2016-17.
2016-17 Queensland State Budget – Service Delivery Statements Office of the Inspector-General Emergency Management
78

Glossary of terms
Accrual accounting Recognition of economic events and other financial transactions involving revenue, expenses, assets, liabilities and equity as they occur and reporting in financial statements in the period to which they relate, rather than when a flow of cash occurs.
Administered items Assets, liabilities, revenues and expenses an entity administers, without discretion, on behalf of the Government.
Agency/entity Used generically to refer to the various organisational units within Government that deliver services or otherwise service Government objectives. The term can include departments, commercialised business units, statutory bodies or other organisations established by Executive decision.
Appropriation Funds issued by the Treasurer, under Parliamentary authority, to agencies during a financial year for: delivery of agreed services administered items adjustment of the Government’s equity in agencies, including acquiring of
capital.
Balance sheet A financial statement that reports the assets, liabilities and equity of an entity as at a particular date.
Capital A term used to refer to an entity’s stock of assets and the capital grants it makes to other agencies. Assets include property, plant and equipment, intangible items and inventories that an entity owns/controls and uses in the delivery of services.
Cash Flow Statement A financial statement reporting the cash inflows and outflows for an entity’s operating, investing and financing activities in a particular period.
Controlled Items Assets, liabilities, revenues and expenses that are controlled by departments. These relate directly to the departmental operational objectives and arise at the discretion and direction of that department.
Depreciation The periodic allocation of the cost of physical assets, representing the amount of the asset consumed during a specified time.
Equity Equity is the residual interest in the assets of the entity after deduction of its liabilities. It usually comprises the entity’s accumulated surpluses/losses, capital injections and any reserves.
Equity injection An increase in the investment of the Government in a public sector agency.
Financial statements Collective description of the Income Statement, the Balance Sheet and the Cash Flow Statement for an entity’s controlled and administered activities.
2016-17 Queensland State Budget – Service Delivery Statements – Minister for Police, Fire and Emergency Services 79
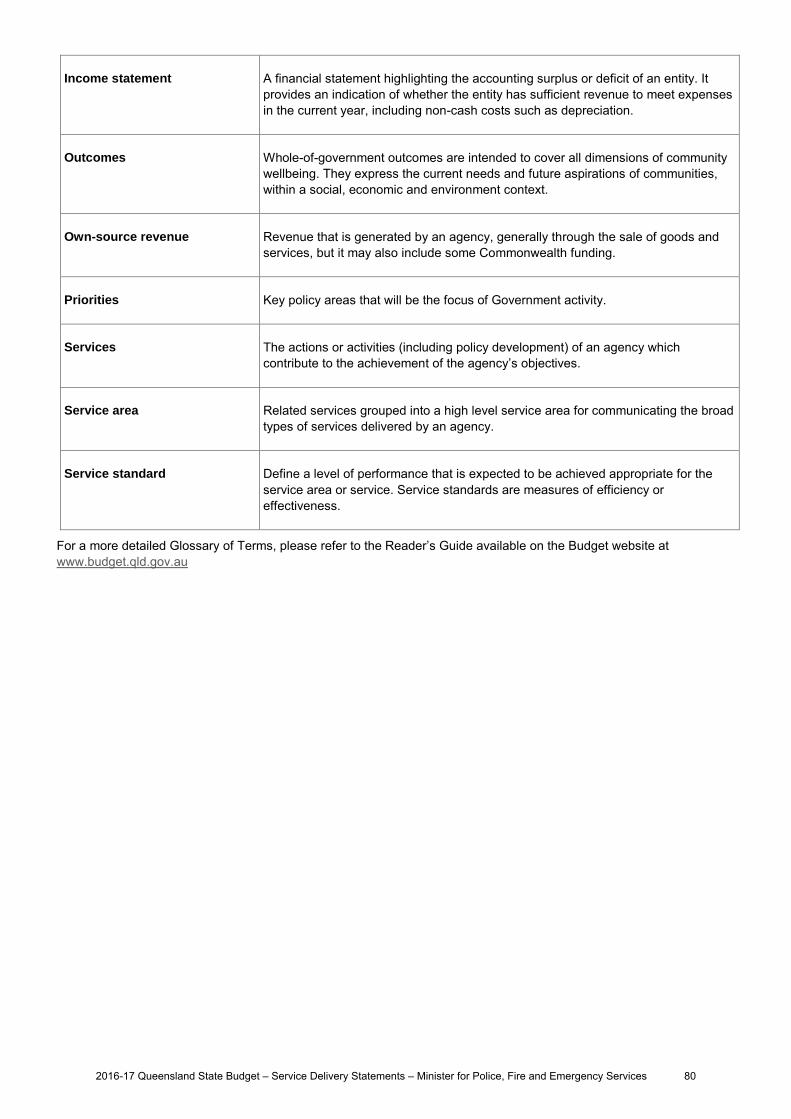
Income statement A financial statement highlighting the accounting surplus or deficit of an entity. It provides an indication of whether the entity has sufficient revenue to meet expenses in the current year, including non-cash costs such as depreciation.
Outcomes Whole-of-government outcomes are intended to cover all dimensions of community wellbeing. They express the current needs and future aspirations of communities, within a social, economic and environment context.
Own-source revenue Revenue that is generated by an agency, generally through the sale of goods and services, but it may also include some Commonwealth funding.
Priorities Key policy areas that will be the focus of Government activity.
Services The actions or activities (including policy development) of an agency which contribute to the achievement of the agency’s objectives.
Service area Related services grouped into a high level service area for communicating the broad types of services delivered by an agency.
Service standard Define a level of performance that is expected to be achieved appropriate for the service area or service. Service standards are measures of efficiency or effectiveness.
For a more detailed Glossary of Terms, please refer to the Reader’s Guide available on the Budget website at www.budget.qld.gov.au
2016-17 Queensland State Budget – Service Delivery Statements – Minister for Police, Fire and Emergency Services 80


Queensland Budget 2016-17 Service Delivery Statements www.budget.qld.gov.au

Queensland Budget 2016-17 Service Delivery Statements www.budget.qld.gov.au