SERVICE BRAND IDENTITY: DEFINITION, …etheses.bham.ac.uk/562/1/Coleman10PhD.pdf · service brand...
463
SERVICE BRAND IDENTITY: DEFINITION, MEASUREMENT, DIMENSIONALITY AND INFLUENCE ON BRAND PERFORMANCE DARREN ANDREW COLEMAN
Transcript of SERVICE BRAND IDENTITY: DEFINITION, …etheses.bham.ac.uk/562/1/Coleman10PhD.pdf · service brand...

SERVICE BRAND IDENTITY:
DEFINITION, MEASUREMENT, DIMENSIONALITY AND INFLUENCE ON
BRAND PERFORMANCE
DARREN ANDREW COLEMAN

University of Birmingham Research Archive
e-theses repository This unpublished thesis/dissertation is copyright of the author and/or third parties. The intellectual property rights of the author or third parties in respect of this work are as defined by The Copyright Designs and Patents Act 1988 or as modified by any successor legislation. Any use made of information contained in this thesis/dissertation must be in accordance with that legislation and must be properly acknowledged. Further distribution or reproduction in any format is prohibited without the permission of the copyright holder.

Abstract
Creating and maintaining brand identity is regarded as a formative brand building step
with the benefits contributing to the creation of valuable brands. Consequently, research that
provides brand identity management insights has the potential to be of considerable academic and
managerial interest.
Several brand identity frameworks have been published in the brand marketing literature.
However, a reliable, valid and parsimonious brand identity scale has yet to be developed. This
has restricted the academic community and practitioners from obtaining an empirically informed
understanding of the construct’s dimensionality and influence on brand performance.
Furthermore, the generic nature of these frameworks does not account for a specific goods or
services context. Informed by these issues, a valid, reliable and parsimonious service brand
identity scale was developed to reveal the construct’s dimensionality and assess its influence on
brand performance in the UK’s IT service sector.
A quantitative research design was employed to gather primary data with 421 senior
executive working in the UK’s IT service sector. Following a series of pretests and a pilot study,
Cronbach’s α and exploratory factor analysis were used to purify the measure. Confirmatory
factor analysis then helped verify the exploratory factor structure and establish the psychometric
properties of the scale. These analyses find support for a service brand identity scale comprising
of five dimensions: employee and client focus, corporate visual identity, brand personality,
consistent communications and human resource initiatives. The service brand identity scale is
then incorporated into the full structural model to assess the construct’s influence on brand
performance. Across the calibration, validation and full samples service brand identity has a

positive and significant (p<0.001) influence on brand performance.
The discussion outlines how these findings provide partial support for the dimensionality
implied by existing conceptual brand identity frameworks. Furthermore, the data provides
encouraging results for those that wish to invest in brand identity given the construct’s positive
and significant influence on brand performance. Concluding remarks highlight theoretical and
managerial implications with limitations and directions for future also being noted.

Dedication
Nicolas Chamfort (1741 – April 13, 1794) the French philosopher and writer once wrote “The
most completely wasted of all days is that in which we have not laughed.” This is good advice I
took to heart during the depths of a PhD. Thank you Nicolas!

Acknowledgements Several people have played a particularly important role in the development of this thesis
that I would like to acknowledge. First and foremost I would like to thank my two supervisors,
Professor Leslie de Chernatony and Dr. George Christodoulides. Together, your knowledge, time,
help, availability, responsiveness, encouragement and approachability are sincerely appreciated.
Specifically, I would to thank Professor de Chernatony for his patience and perseverance with my
inquisitive mind. What could have been perceived as borderline petulance was never perceived in
that way which is appreciated. George’s friendship, ‘open door policy’ and mastery of structural
equation modelling were valued throughout my academic journey. George, your knowledge belies
your years! I thank you both.
Naturally, my family and friends supported me through what has undoubtedly been the most
challenging task I have undertaken in my life so far. It’s not so much about asking, as not asking. I
appreciate that implicit understanding. I love you all.
Numerous people have helped in a range of ways over the past years that I would like to
acknowledge. From Birmingham Business School, in no particular order, these are Karen Duffy,
Marleen Vanstockem, Jacqueline Ward and Dr. Joanne Duberley. I would also like to acknowledge
the help and support provided by Oliver Furrer (Nijmegen School of Management), Kevin Lane
Keller (Tuck School of Business at Dartmouth), Erich Joachimsthaler (Vivaldi Partners), Christoph
Burmann (University of Bremen), Patrick Wilson (Interbrand), Bernard Barnett (Young and

Rubicam) and Sherry Robins (Publicis). I would not be writing this section without the help of these
people.
Finally, I would also like to express my gratitude to Birmingham Business School for
funding my PhD, providing a bursary in addition to the extensive training I have received.

Table of Contents 1. INTRODUCTION........................................................................................................................ 1
1.1. Background to the Research................................................................................................. 1 1.2. Research Problem, Statement and Questions....................................................................... 4 1.3. Justification for the Research – Why Do We Need a Service Brand Identity Scale? .......... 5 1.4. Methodology ........................................................................................................................ 8 1.5. Summary of Findings ......................................................................................................... 10 1.6. Main Contributions ............................................................................................................ 11 1.7. Thesis Outline .................................................................................................................... 11 1.8. Delimitations of Scope ....................................................................................................... 13 1.9. Conclusion.......................................................................................................................... 16
2. LITERATURE REVIEW........................................................................................................... 17 2.1. Introduction ........................................................................................................................ 17 2.2. Brand .................................................................................................................................. 18
2.2.1. Defining Brand........................................................................................................... 18 2.2.2. Corporate Branding .................................................................................................... 28 2.2.3. Brand – Summary....................................................................................................... 32
2.3. Goods and Services ............................................................................................................ 32 2.3.1. Towards a Service Dominant logic for Marketing Exchange .................................... 33 2.3.2. Goods and Services – Summary................................................................................. 39
2.4. Identity ............................................................................................................................... 40 2.4.1. Organisational Identity............................................................................................... 42 2.4.2. Corporate Identity ...................................................................................................... 44 2.4.3. Brand Identity............................................................................................................. 53 2.4.4. Brand identity, Corporate Identity and Corporate Branding – Distinct but Related Constructs................................................................................................................................... 58 2.4.5. Brand Identity – An Identity Orphan?........................................................................ 60 2.4.6. Finding a Theoretical Home for the Brand Identity Orphan...................................... 61
2.5. Models of Brand Identity ................................................................................................... 66 2.5.1. Kapferer’s (2004) Hexagonal Identity Prism............................................................. 67 2.5.2. Aaker’s (1996) Brand Identity Planning System ....................................................... 69 2.5.3. Aaker and Joachimsthaler’s (2000) Brand Leadership Model................................... 71 2.5.4. de Chernatony’s (2006) Components of Brand Identity. ........................................... 73 2.5.5. Frameworks of Brand Identity – Critical Evaluation ................................................. 74 2.5.6. Brand Identity in the B2B Literature.......................................................................... 76 2.5.7. Identity – Summary.................................................................................................... 78
2.6. Brand Performance............................................................................................................. 79 2.6.1. Approaches to Measuring Brand Performance .......................................................... 81
2.6.1.1. Financial ‘Focusers’ ........................................................................................... 86 2.6.1.2. Customer ‘Carers’ .............................................................................................. 87 2.6.1.3. Brand ‘Brokers’.................................................................................................. 90 2.6.1.4. ‘Balanced’ Branders........................................................................................... 92
2.6.2. Developing a Grounded Brand Performance Measure .............................................. 95
2.6.3. Brand Performance – Summary ............................................................................... 105 2.7. Conclusions ...................................................................................................................... 107
3. THEORETICAL FRAMEWORK ........................................................................................... 110 3.1. Introduction ...................................................................................................................... 110 3.2. Developing a Preliminary Service Brand Identity Framework........................................ 112 3.3. Preliminary Service Brand Identity Dimensionality ........................................................ 113 3.4. A Preliminary Service Brand Identity Framework .......................................................... 120 3.5. Postulating the Domain of Service Brand Identity........................................................... 122
3.5.1. Marketing Culture .................................................................................................... 123 3.5.2. Corporate Visual Identity Systems........................................................................... 131 3.5.3. Client Relationship Management ............................................................................. 138 3.5.4. Integrated Marketing Communications.................................................................... 142 3.5.5. Brand Personality ..................................................................................................... 146
3.6. Service Brand Identity and Brand Performance............................................................... 152 3.6.1. Marketing Culture .................................................................................................... 155 3.6.2. Corporate Visual Identity Systems........................................................................... 164 3.6.3. Client Relationship Management ............................................................................. 169 3.6.4. Integrated Marketing Communications.................................................................... 173 3.6.5. Brand Personality ..................................................................................................... 176
3.7. Evaluating the Preliminary Service Brand Identity Framework ...................................... 180 3.7.1. Guidelines for Developing a Theoretical Framework.............................................. 181 3.7.2. Evaluation of Preliminary Service Brand Identity Framework................................ 185 3.7.3. Service Brand Identity Framework – Dimension Interactions................................. 190
3.8. Conclusions ...................................................................................................................... 193 4. METHODOLOGY............................................................................................................... 195 4.1. Introduction ...................................................................................................................... 195 4.2. Research Design............................................................................................................... 196 4.3. Target Population, Sampling Frame, Sample and Completed Sample ............................ 197 4.4. Scale Development Process ............................................................................................. 200
4.4.1. Specify Domain of the Construct ............................................................................. 202 4.4.2. Generate a Pool of Items .......................................................................................... 203 4.4.3. Item Wording ........................................................................................................... 208 4.4.4. The Experience Survey ............................................................................................ 209 4.4.5. The Expert Panel ...................................................................................................... 211 4.4.6. Item Retention .......................................................................................................... 212
4.5. Finalising the Survey Design ........................................................................................... 213 4.5.1. Rationale for Postal Survey...................................................................................... 214 4.5.2. Survey Structure....................................................................................................... 215 4.5.3. Format of Survey Questions..................................................................................... 216 4.5.4. Considering Bias as Part of Survey Design ............................................................. 218
4.5.4.1. Socially Desirable ............................................................................................ 218 4.5.4.2. Acquiescence.................................................................................................... 219 4.5.4.3. Non Response................................................................................................... 220
4.5.5. Measuring Brand Performance................................................................................. 221 4.5.5.1. Justifying the Use of Subjective Brand Performance Measures ...................... 222
4.5.5.2. Using a Summed Brand Performance Measure ............................................... 225 4.5.6. Pretesting and Piloting the Survey ........................................................................... 227 4.5.7. Response Rate Enhancing Techniques..................................................................... 230
4.6. Quantitative Data Analysis............................................................................................... 233 4.6.1. Reliability Analysis .................................................................................................. 234 4.6.2. Exploratory Factor Analysis..................................................................................... 235 4.6.3. Confirmatory Factor Analysis.................................................................................. 236
4.6.3.1. Why Use SEM and Not OLS Regression?....................................................... 236 4.6.3.2. Formative and Reflective Indicators ................................................................ 238 4.6.3.3. Model Fit .......................................................................................................... 239
4.6.4. Validating the Measurement Model ......................................................................... 241 4.6.4.1. Cross Validation of the Measurement Model .................................................. 241 4.6.4.2. Construct Validity ............................................................................................ 242
4.7. Conclusions ...................................................................................................................... 243 5. ANALYSIS .......................................................................................................................... 245 5.1. Introduction ...................................................................................................................... 245 5.2. Exploring the Data ........................................................................................................... 246
5.2.1. Descriptive Statistics ................................................................................................ 246 5.2.2. Missing Value Analysis ........................................................................................... 250 5.2.3. Non Response Bias................................................................................................... 251 5.2.4. Testing Assumptions of Parametric Data................................................................. 252
5.2.4.1. Normally Distributed Data ............................................................................... 252 5.2.4.2. Interval Data..................................................................................................... 255 5.2.4.3. Independence.................................................................................................... 255
5.3. Developing the Service Brand Identity Scale .................................................................. 255 5.3.1. Reliability Analysis .................................................................................................. 256 2.2.3. Exploratory Factor Analysis..................................................................................... 259 2.2.4. Confirmatory Factor Analysis.................................................................................. 268
2.2.4.1. Selecting a Method of Model Estimation......................................................... 268 2.2.4.2. Model Estimation ............................................................................................. 270 2.2.4.3. Model Respecification...................................................................................... 272
2.3. Scale Cross Validation and Psychometric Properties ...................................................... 278 2.3.1. Model Fit .................................................................................................................. 279 2.3.2. Composite Reliability............................................................................................... 281 2.3.3. Construct Validity .................................................................................................... 283
2.3.3.1. Content Validity ............................................................................................... 283 2.3.3.2. Face Validity .................................................................................................... 284 2.3.3.3. Convergent Validity ......................................................................................... 284 2.3.3.4. Discriminant Validity....................................................................................... 286 2.3.3.5. Nomological Validity....................................................................................... 291 2.3.3.6. Criterion Validity ............................................................................................. 292 2.3.3.7. Predictive Validity............................................................................................ 292
2.3.4. The Final Service Brand Identity Scale.................................................................... 293 2.4. Service Brand Identity and Brand Performance............................................................... 294
2.4.1. Service Brand Identity as a Second Order Construct ............................................... 294

2.4.2. The Influence of Service Brand Identity on Brand Performance............................. 297 2.4.3. The Contribution of Each dimension to Service Brand Identity .............................. 300
2.5. Conclusions ...................................................................................................................... 302 3. DISCUSSION .......................................................................................................................... 303
3.1. Introduction ...................................................................................................................... 303 3.2. What is Service Brand identity?....................................................................................... 305 3.3. What are the Dimensions of Service Brand Identity? ...................................................... 306
3.3.1. Corporate Visual Identity ......................................................................................... 306 3.3.2. Consistent Communications..................................................................................... 309 3.3.3. Brand Personality ..................................................................................................... 312 3.3.4. Human Resource Initiatives ..................................................................................... 314 3.3.5. Employee and Client Focus...................................................................................... 317
3.4. Discarded Dimensions of Service Brand Identity ............................................................ 319 3.4.1. Marketing Culture .................................................................................................... 320 3.4.2. Client Relationship Management ............................................................................. 322
3.5. Does Service Brand Identity Have a Positive and Significant Impact On Brand Performance?................................................................................................................................ 324 3.6. Does the Service Brand Identity have Specific B2B Applicability?................................ 325 3.7. Conclusion........................................................................................................................ 328
4. CONCLUSIONS AND IMPLICATIONS............................................................................... 331 4.1. Introduction ...................................................................................................................... 331 4.2. Thesis Review – Content and Rationale .......................................................................... 332 4.3. Theoretical Contributions................................................................................................. 334
4.3.1. The ‘What’ of a Theoretical Contribution................................................................ 335 4.3.2. The ‘How’ of a Theoretical Contribution................................................................. 338 4.3.3. The ‘Why’, ‘Who’, ‘Where’ and ‘When’ of a Theoretical Contribution .................. 341
4.4. Managerial Implications................................................................................................... 342 4.4.1. Dimensions of Service Brand Identity ..................................................................... 342 4.4.2. The Nature of Service Brand Identity ...................................................................... 343 4.4.3. Service Brand Identity Audit.................................................................................... 343 4.4.4. Brand Identity Implementation ................................................................................ 345 4.4.5. Service Brand Identity and Brand Performance....................................................... 351 4.4.6. Nature of Measuring Brand Performance ................................................................ 352 4.4.7. Strategic Marketing .................................................................................................. 353
4.5. Limitations ....................................................................................................................... 354 4.5.1. Brand Identity, Brand Performance and Brand Identity-Performance..................... 354 4.5.2. Research Paradigm and Methodology...................................................................... 358
4.6. Future Research................................................................................................................ 361 4.7. Concluding Note .............................................................................................................. 369

List of Figures
Figure 1 Conceptualising Delimitation of Research Scope ............................................................... 13 Figure 2 Conceptualising Brand as an Iceberg (Davidson, 1998: 376) ............................................. 25 Figure 3 Conceptualising a Definition of Brand – An Integrated Perspective................................... 27 Figure 4 Corporate Identity Schools (Van Riel and Balmer, 1997)................................................... 47 Figure 5 Corporate Identity Schools (Balmer, 1995)......................................................................... 49 Figure 6 Overlap and Integration of Corporate Identity Schools of Thought. ................................... 51 Figure 7 Conceptualising Brand Identity, Corporate Identity and Corporate Branding .................... 58 Figure 8 Reconceptualising the Corporate, Organisational and Brand Identity Literature................ 65 Figure 9 Hexagonal Identity Prism Model (Kapferer, 2004) ............................................................. 67 Figure 10 Brand Identity Planning Model (Aaker, 1996a) ................................................................ 69 Figure 11 Components of Brand Identity (de Chernatony, 2006)...................................................... 73 Figure 12 Clustering the Brand Performance Literature Along Financial, Customer and Employee Dimensions......................................................................................................................................... 83 Figure 13 Conceptualising Brand Performance along Financial, Consumer and Employee Based Dimensions......................................................................................................................................... 85 Figure 14 Dimensions of Brand Performance (Fitzgerald et al. 1991) .............................................. 91 Figure 15 A Preliminary Service Brand Identity Framework .......................................................... 120 Figure 16 Conceptualising the Positive Influence Service Brand Identity ...................................... 153 Figure 17 How a Strong Culture Contributes Towards Brand Performance ................................... 156 Figure 18 Visual Identity Mediating Brand and Customer Values.................................................. 165 Figure 19 Methodology Chapter Structure....................................................................................... 195 Figure 20 Frequency Distribution of Scale Items by Dimension..................................................... 213 Figure 21 Frequency Distribution of Scale Items by Dimension Before Expert Panel, after Expert Panel and after Pretest / Pilot ........................................................................................................... 228 Figure 22 Scree Plot for Exploratory Factor Analysis ..................................................................... 264 Figure 23 Frequency Distribution of Scale Items by Dimension up to the Exploratory Factor Analysis stage (Calibration Sample, n=211).................................................................................... 267 Figure 24 Service Brand Identity Measurement Model 1 ............................................................... 271 Figure 25 Service Brand Identity Measurement Model 2 ................................................................ 275 Figure 26 Frequency Distribution of Scale Items at Each Stage of the Scaling Process ................. 278 Figure 27 Conceptualising Service Brand Identity as Second Order Construct .............................. 296 Figure 28 Service Brand Identity and Brand Performance - The Full Structural Model ................. 298 Figure 29 The Service Brand Identity Network ............................................................................... 339 Figure 30 Profiling Brand Identity – An Illustrative Example......................................................... 344 Figure 31 Potential Organisational Structure for Implementing Service Brand Identity................. 346 Figure 32 Conceptualising the Research Context ............................................................................ 355 Figure 33 Brand Performance – Illustrative Example of a Value Driver Map ................................ 365

List of Tables
Table 1 A Taxonomy for Brand Perspectives (de Chernatony and Dall'Olmo Riley, 1997)............ 19 Table 2 Authors’ that Constitute Each Cluster within the Brand Performance Literature ................ 84 Table 3 Perspectives on Measuring Consumer Based Brand Equity ................................................ 88 Table 4 Financial Measures of Brand Performance (Ambler, 2003) ................................................ 92 Table 5 Brand Performance Measurement Used in this Research ..................................................... 98 Table 6 Evaluating Current Brand Identity Dimensions in a ........................................................... 115 Table 7 Acknowledging Dimensions Interactions ........................................................................... 191 Table 8 Scale Development Process ................................................................................................ 201 Table 9 Source of Scale Items.......................................................................................................... 204 Table 10 Application of Helgeson et al’s (2002) Mail Response Model......................................... 231 Table 11 Main Activity within IT Services Sector ......................................................................... 247 Table 12 Organisational Age............................................................................................................ 247 Table 13 Number of Employees at Respondent’s Organisation ..................................................... 248 Table 14 Respondents’ Marketing Experience (Number of Years) ................................................. 248 Table 15 Respondents’ Position in the Organisation ....................................................................... 249 Table 16 Gender of Respondents ..................................................................................................... 249 Table 17 Respondents’ Age (Years) ................................................................................................ 249 Table 18 Respondents’ Highest Educational Level. ....................................................................... 250 Table 19 Assessment of Data Normality using Kolmogorov-Smirnov (K-S) ................................ 253 Table 20 Marketing Culture – Item Analysis.................................................................................. 257 Table 21 Corporate Visual Identity Systems- Item Analysis .......................................................... 257 Table 22 Brand Personality– Item Analysis..................................................................................... 258 Table 23 Client Relationship Management – Item Analysis............................................................ 258 Table 24 Integrated Marketing Communications – Item Analysis ................................................. 259 Table 25 Exploratory Factor Analysis Factor Loadings, Eigen Values, Variance Extracted and Cronbach’s Alpha (Calibration Sample, n=211).............................................................................. 265 Table 26 Factor Correlations (Obtained from SPSS Output)........................................................... 267 Table 27 The Influence of Removing Items 15 or 93 on Model Fit ................................................ 274 Table 28 Standardised Item Loadings (Calibration Sample, n=211) ............................................... 276 Table 29 Unstandardised Item Loadings – Coefficients, Standard Errors and t-Values................. 277 Table 30 Standardised Item Loadings (Validation Sample, n=210) ............................................... 279 Table 31 Unstandardised Item Loadings – Coefficients, Standard................................................. 280 Table 32 Composite Reliabilities for Service Brand Identity Dimensions ..................................... 282 Table 33 Average Variance Extracted for Service Brand Identity Subscales................................. 285 Table 34 Discriminant Validity Test 1 - Dimension Correlations (Squared) & AVE for Pairs of Correlation (Validation Sample, n=210).......................................................................................... 287 Table 35 Discriminant Validity Test 2 - Comparison of Competing Models ................................. 288 Table 36 Discriminant Validity Test 3 - 95% Confidence Intervals for Dimensions ...................... 290 Table 37 Final Service Brand Identity Scale................................................................................... 293 Table 38 Service Brand Identity Dimension Correlations Obtained................................................ 295 Table 39 Fit Indices for Brand Identity as a Second Order Construct ............................................. 296 Table 40 Fit Indices for Full Structural Model Incorporating Brand Performance ......................... 298 Table 41 The Influence of Service Brand Identity on Brand Performance..................................... 299

Table 42 Unstandardised Factor Loadings for Dimensions of Brand Identity ................................ 300 Table 43 Unstandardised Factor Loadings for Dimensions of Brand Identity ............................... 301 Table 44 Unstandardised Factor Loadings for Dimensions of Brand Identity ................................ 301 Table 45 Rephrasing Service Brand Identity Items as Brand Image Items ..................................... 366
Appendices
Appendix 1 - Complete Item Pool with Respective Removal Phase in Scaling Process
Appendix 2 - Experience Survey for Expert Panel
Appendix 3 - Covering Letter and Final Survey
Appendix 4 – Correlation of Brand Performance Measures
Appendix 5 – Missing Values (Frequency Distribution by item / question)
Appendix 6 - Expectation Maximisation Data Results
Appendix 7 - R-Matrix
Appendix 8 – References

1
1. INTRODUCTION
This thesis outlines how a valid, reliable and parsimonious service brand identity scale
was developed and applied to assess the construct’s influence on brand performance. The aim of
this chapter is to lay the foundations and provide the context for subsequent chapters. It is
structured as follows. The chapter opens by providing the research background. This leads to the
development of four research questions that underpin this research. The following section
provides a justification for this research which is followed by an overview of the quantitative
research methodology employed. Next, the structure of, and rationale, for each section of the
thesis is provided. The penultimate section delimits the research scope. The concluding section
reiterates key points addressed during the chapter and highlight how this chapter paves the way
for the literature review and subsequent chapters of this thesis.
1.1. Background to the Research
Since the early 1990’s brand identity has been subject to increased academic interest
(Aaker, 1991; 1996a; Aaker and Joachimsthaler, 2000; Alsem and Kostelijik, 2008; de
Chernatony, 1999, 2001, 2006; Kapferer, 1997, 2004; Keller, 1998, 2003; Madhavaram et al.,
2005). The reason being organisations that present a cohesive, distinctive and relevant brand
identity can create preference in the market place, add value to their offer and command premium
prices (Schmitt and Simonson, 1997). Building brand identity also fosters trust and facilitates
differentiation (Ghodeswar, 2008). Consequently, research providing brand identity management
insight has the potential to be of considerable academic and managerial interest.

2
Several brand identity frameworks have been published in the academic literature (Aaker,
1996a; Aaker and Joachimsthaler, 2000; de Chernatony, 2006; Kapferer, 2004). These
frameworks have helped the research community develop a formative understanding of what
brand identity is whilst providing a valuable platform for subsequent research. However, these
scholars’ work tends to operate within conceptual rather than empirical research domains. This
has prevented brand marketers developing an empirical understanding of what dimensions
constitute brand identity. The applicability of these conceptual frameworks in B2B, B2C,
product or service markets also remains unclear. Similarly, in the absence of a psychometrically
developed scale assessing the construct’s influence on brand performance has yet to be
established. Consequently, even a cursory view of the current brand identity literature highlights
a paucity of empirical research (e.g. Aaker, 1996a; Aaker and Joachimsthaler, 2000; de
Chernatony, 2006; Kapferer, 2004).
Brand performance is of considerable interest to management (Ambler, 2003; de
Chernatony et al., 2004; Farris et al., 2008; Kim et al., 2003b; Rubinson and Pfeiffer, 2005;
Schultz, 2005). Several factors have brought about this interest. These include the desire for
greater marketing boardroom ‘clout’ (Ambler, 2003; Munoz and Kumar, 2004), investor
pressures to demonstrate marketing returns (Clark, 1999), a greater appreciation, that business
performance is, amongst other factors, influenced by brand performance (Aaker, 1996a; Ambler,
2003; de Chernatony, 2006; Doyle, 2000; Hoeffler and Keller, 2003b; Kim et al., 2003a;
Rubinson and Pfeiffer, 2005; Srivastava and Shocker, 1991) and the need for greater marketing
accountability (Farris et al., 2008). Indeed, the need for greater marketing accountability is one
of six topics the Marketing Science Institute prioritised between 2008-2010. As a result, brand

3
metrics has become a hot topic for academic research. However, whilst several scholars have
highlighted the positive influence brand related constructs such as brand equity have on
performance-related outcomes (Aaker, 1996b; Kim et al., 2003b; Park and Srinivasan, 1994) as
of yet no research has highlighted the positive influence brand identity has on this dependent
variable.
The ‘service’ sector accounts for 75.2% of the UK’s GDP (ONS, 2008). With a GDP of
£1.275 trillion in 2008 this accounts to for £959 billion of the UK’s GDP. The UK’s Office for
National Statistics categorisation for ‘services industries’ and their associated GDP contributions
is as follows; distribution, hotels, catering and repairs (14.8%); transport, storage and
communications (7.5%); business services and finance (29.9%), government and other services
(22.9%). Consequently, it can be seen how within this sector 29.9%, or approximately £370
billion of the UK’s GDP in 2008 was accounted for by the Business Services and Finance
category. Consequently, research that focuses on this notable element of the UK’s economy
should interest both academics and practitioners alike.
Consequently, brand identity and performance in the service sector provides a particularly
topical and relevant area for academic research. However, there is an absence of empirical
research that explores brand identity’s dimensionality and the construct’s influence on brand
performance in any sector, let alone the burgeoning service sector.

4
1.2. Research Problem, Statement and Questions
There is a dearth of empirical brand identity-related research. Of particular note was how
a validated brand identity scale has not been developed. This has prevented both the academic
community and practitioners from building an empirically informed understanding of brand
identity dimensionality and the construct’s influence on brand performance. The growing
importance of marketing accountability and the service sector in the UK’s economy was also
noted (Section 1.1). Collectively, these developments constitute the research problem and
resulted in the following research statement:
This research aims to develop a valid, reliable and parsimonious service brand identity
scale and to assess the construct’s influence on brand performance in the UK’s IT service sector.
As the above research statement indicates, this thesis develops a service-specific brand
identity construct that extends the existing brand identity literature. This construct is referred to
as service brand identity and is intended to be cognizant of the view that services and goods
branding is different (Berry, 1980; Kim et al., 2003a; Low and Lamb, 2000). For instance, several
scholars (Berry and Seltman, 2007; Brodie et al., 2009; de Chernatony and Cottam, 2008) have
noted the particularly important role employees play for service brands which constitutes a
unique characteristic.
To focus and operationalise the above research statement it was filtered into four research
questions that underpin this thesis:
- What is service brand identity?

5
- What are the dimensions of service brand identity?
- How do we measure service brand identity?
- Does service brand identity have a positive and significant influence on brand
performance?
Consequently it can be seen how the research background (Section 1.1) provides the
context and rationale for the research problem articulated above. A research statement was then
developed which was broken down into four research questions. Gathering data in line with the
research questions was intended to facilitate solving the research problem (Emory and Cooper,
1991).
1.3. Justification for the Research – Why Do We Need a Service Brand Identity Scale?
The justification for this research is informed by four points. These span both academic
and practitioner fields. First, despite its longevity there is a dearth of empirical brand identity-
related research (cf: Section 1.1). Unfortunately, by operating within a conceptual domain the
research community has been unable to, empirically, establish the construct’s dimensionality. In
simpler terms, scholars have been unable to empirically articulate what brand, let alone service
brand identity is. This is a direct result of the research community failing to develop a valid,
reliable and parsimonious brand identity scale which would empirically reveal the construct’s
dimensionality. The absence of a psychometrically sound scale has also prevented scholars from
assessing the construct’s influence on performance-related measures. Consequently, developing

6
and applying the service brand identity scale helps both academics and practitioners? address
such pressing issues.
Second, although current brand identity frameworks have been widely referenced in the
academic literature these have been generically developed without an explicit concern for brand
context. This could encompass goods, services, B2B or B2C markets. For instance, the
applicability of these conceptual frameworks in a goods or services context remains unclear.
This is particularly important given several scholars have noted how service and goods marketing
is different (Berry, 1980; Kim et al., 2003a; Low and Lamb, 2000). As the literature review
highlights, some frameworks may have elements of service brand applicability. However, in
their entirety they do not account for the distinctive challenges service branding brings.
Additionally, as noted earlier (Section 1.1) the service sector constitutes a significant and
growing component of the UK’s GDP. For this reason it was considered important to develop a
service brand identity measure cognisant of this sector’s unique characteristics, notably, the
pivotal role human resource plays in service brand delivery (Ashford and Mael, 1996; Balmer,
1995, 1998; Balmer and Greyser, 2003; Balmer and Greyser, 2006; Berry and Seltman, 2007;
Brodie et al., 2009; Burmann and Zeplin, 2005; de Chernatony and Cottam, 2008; de Chernatony
and Segal-Horn, 2004; Harris and de Chernatony, 2001; Hulberg, 2006; Kennedy, 1977;
Vallaster and de Chernatony, 2006).
The relevance of current brand identity frameworks in B2B markets is also unclear. This
is important for two reasons. Primarily, extant frameworks do not account for the unique brand
marketing challenges a B2B context presents with the importance of personal relationships being

7
of particular note (Kotler and Pfoertsch, 2006b). Secondly, the value of B2B vis-à-vis B2C
markets in developed markets is notable (Slater, 1999). For instance, the value of B2B markets in
the UK is £11.34 billion (Keynote, 2008). For these reasons developing a framework cognisant
of B2B environment is important. Whilst it is encouraging to observe formative brand identity
development in the B2B literature (Beverland et al., 2007a; Beverland et al., 2007b) numerous
issues materialise with these scholars’ work. These encompass oversimplification of construct
domain in addition to confusing brand identity with related but distinct constructs such as brand
positioning. These issues are explored later in this thesis (Section 2.5.6). Consequently, current
brand identity frameworks do not appear to be sensitive to context and those that are have notable
shortcomings. This provides the underpinning logic for developing a service brand identity
construct in a B2B context.
Third, the operationalisation of current brand frameworks presents numerous practical
challenges. As will be highlighted in the literature review, it is unclear how some dimensions
could be scaled given they are so broadly conceived. Also, it is debatable if some dimensions are
activities or constructs with the former being unsuitable for scaling. Consequently, the suitability
of current and more conceptually orientated brand identity frameworks for scale development is
questionable.
The previous points justifying the need for a service brand identity scale tend to be more
academically orientated. From a practitioners’ perspective the development of a service brand
identity scale will enable brand managers to understand what service brand identity is (its
dimensions) and what activities (dimensions’ items) need to take place in order to operationalise

8
the construct. Developing a scale will also allow managers to audit and monitor their brand
identity which can provide the basis for remedial action. Similarly, application of the scale will
enable managers to demonstrate the extent to which service brand identity drives performance
with the latter being previously highlighted as an area of notable managerial interest (Section
1.1). Application of the service brand identity scale should not be restricted to brand related
research. Human resource scholars may wish to assess the influence service brand identity has
on employee turnover or job satisfaction (cf; employer brands) whilst those conducting finance-
related research will be able to assess the construct’s effect on a range of variables such as return
on investment (ROI) or earnings before interest tax depreciation and amortisation (EBITDA).
Once a scale has been developed, its application will enable practitioners in these areas to assess
the influence service brand identity has on outcomes of particular interest in their field. As will be
highlighted in the conclusions chapter, such points constitute this thesis’ main managerial
contributions.
Informed by the above rationale, the development of a psychometrically sound service
brand identity scale and establishing the construct’s influence on brand performance is justified
on both academic and practical grounds.
1.4. Methodology
To develop a service brand identity measure and assess the construct’s influence on brand
performance a quantitative research design was used. The scale development procedures were

9
primarily guided by the extant scaling literature (Churchill, 1979; DeVellis, 1991; Netemeyer et
al., 2003). Initially, this entailed developing a ‘preliminary’ service brand identity definition
which was grounded in the existing brand identity literature. These helped specify the domain of
the construct. Guided by the literature based definition, items were generated from the literature
that sampled the domain of service brand identity. These items were then subject to an expert
panel review (Churchill, 1979). A series of pretests and a pilot then followed before the final
survey was administered via postal mail to senior ‘marketing’ executives working in the UK’s
B2B IT services sector.
The completed sample (n=421) was randomly split into calibration (n=211) and validation
(n=210) samples (Anderson and Gerbing, 1988; Cudeck and Browne, 1983). Initial data analyses
involved, item to total and scale reliability estimates to assess the internal consistency of the scale
and remove ‘garbage’ items (Churchill, 1979). The calibration sample was then subjected to
exploratory factor analysis. Using AMOS V16.0, confirmatory factor analysis helped verify the
exploratory factor structure. With satisfactory levels of fit (Hu and Bentler, 1999) the
measurement model was re-estimated using the validation sample and once more demonstrated
satisfactory levels of fit. Next, the psychometric properties of the scale in the form of composite
reliability (Fornell and Larcker, 1981) and construct validity (Cronbach and Meehl, 1955) were
established. The dimensions identified were used to augment the preliminary service brand
identity definition so the construct could be defined. Finally, service brand identity was
reconceptualised as a second order construct and estimated as part of the full structural model to
assess the influence service brand identity has on brand performance in the UK’s IT service
sector.

10
1.5. Summary of Findings
The research questions outlined above (Section 1.2) will be used to structure summary
findings. The first question concerned defining service brand identity. This involved augmenting
the preliminary literature based definition with dimensions that emerged from the quantitative
analysis. Based on this research, service brand identity is defined as:
“The strategists’ vision of how a service brand should be perceived by its stakeholders
which is made manifest via the organisation’s brand personality, corporate visual
identity, consistent communications, human resource initiatives and by developing an
employee and client focus.”
The second research question concerned establishing service brand identity
dimensionality. As outlined above, the dimensions of service brand identity that emerged from
the data were: brand personality, corporate visual identity, consistent communications, human
resource initiatives in addition to an employee and client focus.
The third question related to the measurement of service brand identity. This question is
addressed via the development of a valid, reliable and parsimonious 15 item scale which
demonstrated psychometrically sound properties across the calibration, validation and full
samples (Chapter 5).
The final research question assessed the influence service brand identity has on brand
performance. When the service brand identity scale was incorporated into the full structural

11
model, service brand identity had both a positive and significant (p<0.001) influence on brand
performance across the calibration, validation and full samples.
1.6. Main Contributions
Guided by the above research questions, this thesis makes four main contributions to the
branding literature. These relate to developing or defining the service brand identity construct,
identifying the construct’s dimensionality, validating a psychometrically sound scale which is
then applied in the context of brand performance. The scale development is considered this
thesis’ primary contribution. Application of the scale is considered a secondary contribution.
Adopting this approach is consistent with Churchill’s (1979) seminal work where scale
development precedes application in order to establish norms.
Beyond these four main contributions other theoretical and managerial contributions have
been made and have been expanded upon in the Conclusions chapter (Sections 7.3 and 7.4)
1.7. Thesis Outline
This thesis consists of seven chapters and is structured as follows. Chapter 2 reviews a
broad range of relevant literature. This chapter helps clarify this thesis’ interpretation of key
conceptual terms such as brand and identity (brand, corporate and organisational), elucidate a gap
in the current brand identity literature and provide theoretical guidance with brand performance
measurement. Reviewing the existing brand identity literature also helps develop a preliminarily
12
service brand identity definition. This provides parameters for exploring the domain of service
brand identity in the theoretical framework chapter.
Chapter 3 develops a preliminary service brand identity framework which is
predominantly grounded in the brand identity literature. The rationale for developing this
framework is four fold. First, to help bridge the literature review and the empirical research that
follows. Second, to distil the relevant literature. Third, to inform and structure subsequent scale
development procedures by postulating a preliminary construct domain. Finally, to provide a
conceptual apparatus that guides the overall research effort in pursuit of answering the research
questions.
Chapter 4 outlines the methodology employed to gather data which facilitated testing of
the preliminary service brand identity framework. This process was primarily guided by the scale
development (e.g. Churchill, 1979, Anderson and Gerbing, 1988a) and survey design (e.g.
Dillman, 2000) literature.
Chapter 5 analyses the data. During this chapter a range of statistical techniques are
employed to reveal service brand identity dimensionality and assess the psychometric properties
of the scale. The measurement model is applied in the context of brand performance to assess the
influence of the former on the latter.
Chapter 6 discusses the data analysis in the context of the literature. The chapter is
structured around the four research questions. Consequently, at this stage in the thesis issues of

13
service brand identity definition, dimensionality, measurement and influence on brand
performance are addressed.
The final chapter draws conclusions from the preceding chapters. This encompasses
theoretical and managerial implications with limitations and directions for future research also
being noted.
1.8. Delimitations of Scope
The scope of this thesis was delimited in four ways as conceptualised in Figure 1. This
related to location (y axis), B2B markets (x axis), sector (z axis) and service brands (z axis).
Figure 1 Conceptualising Delimitation of Research Scope
Rest of World
IT services
Other sectors B2B B2C
UK

14
First, the study was conducted in the UK. This is represented by the y axis in Figure 1.
Consequently, scholars drawing on the results or applying the scale within different cultural
milieu should be cognisant of this fact. This country was chosen, primarily for data access and
language reasons.
The second and third delimitations relate to the z axis in Figure 1 which simultaneously
considers organisational sector and type of brand. In terms of organisational sector, the unit of
analysis the sample wanted to generalise was IT Service organisations (based in the UK). IT
services includes a broad range of activities such as IT consulting, software development and
support, hardware maintenance support, integration and development services. Key organisations
in this market include brands like IBM Global Services, Hewlett Packard and Computer Sciences
who between them only account for 24% of the global market (Datamonitor, 2007). With 76% of
the market being accounted for by other organisations this implies a highly competitive market
structure. Although data could not be obtained for the UK IT services market, it is assumed a
similar market structure would exist in the UK. Such a structure places an emphasis on
organisations to develop informed brand marketing strategies to differentiate their offer in a
market which offers largely undifferentiated (i.e. standards based technical protocols) services.
Third, this thesis focuses on service brands. A service brand can be defined as “a holistic
process beginning with the relationship between the firm and its staff and coming alive during the
interaction between staff and customers” (Dall'Olmo Riley and de Chernatony, 2000: 138).
Arguably, the term stakeholders as opposed to customers may be more preferable given the
increasing concern organisations’ have with wider audiences. However, notwithstanding this
point, Dall'Olmo Riley and de Chernatony’s (2000) research, consistent with numerous other

15
scholars highlights the central role employees play at service brands. However, this should not
imply employees do not play an important role for goods-based brands. Merely, the saliency of
their role in making service brand values manifest is greater due to the pivotal role humans play
for service brands. Hence, the goods and service distinction may be more appropriately
conceptualised as a matter of degree and not absolutes (Rathmell, 1966; Shostack, 1977). Earlier
in this chapter the significant GDP-generating role of the service sector in the UK was noted.
This provides a rationale for focusing on this sector in conjunction with the previously stated
logic for focusing on the IT service brands.
Finally, this thesis focuses on IT service organisations operating in B2B markets. For
clarity, B2B markets involve the acquisition of goods and / or services to use in the production of
other goods and / or services which are sold, rented or supplied to other businesses (Kotler and
Pfoertsch, 2006b). A B2B focus was motivated by a paucity of B2B brand literature (Han and
Sung, 2008). More specifically, Robert and Merrilees (2007) note the particularly sparse nature
of B2B service based research despite the sectors’ recent growth due to extensive IT outsourcing.
Additionally, conducting research of this manner which assess the impact of brand on
performance-related outcomes also answers Sheth and Sharma’s (2006) call for more “brand
effects” (p. 425) related research in a B2B context.
With regards to points three and four it should be noted there is a primary (service brand)
and secondary (B2B) research context. Hence, the research does not major on B2B but is an
example of service brand identity research in a B2B context. The relative importance of service
and B2B markets is reflected in this thesis’ title by focusing on service brand identity.

16
Consequently, given the above, within the context of the UK’s IT B2B service sector the
data and conclusions of this research should apply. However, outside those boundaries the
generalisability of the results should be treated judiciously (cf: Leone and Shultz, 1980).
1.9. Conclusion
This chapter has laid the foundations for this research. Initially, a background to the
research was provided. This highlighted a notable empirical gap in the existing brand identity
literature, the importance of brand performance and the burgeoning importance of the UK’s
service sector. Together these issues helped provide the research context in addition to
articulating the research problem, statement and associated research questions. The rationale for
the research was then justified, findings summarised, thesis structure outlined with delimitations
being stated. With these foundations laid, the literature can now be reviewed in order to
theoretically ground this thesis.

17
2. LITERATURE REVIEW
2.1. Introduction
The previous chapter laid the foundations for this research. This was achieved by outlining
the research context, identifying a notable gap in the brand identity literature and articulating four
research questions that underpin this research. The thesis structure and delimitations were also
noted.
This chapter reviews several key literature streams. By doing this the chapter aims to clarify
this thesis’ interpretation of key conceptual terms, explicate the gap in the brand identity literature
and obtain theoretical guidance with regards to brand performance measurement. Furthermore,
“common sense dictates that we should start any problem-solving activity by establishing what we
know already” (Baker, 2005: 1). Consequently, the literature review also looks to acknowledge
previous scholars’ efforts whilst charting the depth and breadth of existing knowledge.
To review the literature, this chapter is structured as follows. Guided primarily by de
Chernatony and Dall'Olmo Riley’s (1997) taxonomy, the opening section reviews brand from input,
output and evolutionary perspectives. This provides a theoretical foundation for the development of
an integrated and holistic brand definition which augments previous literature. The corporate
branding literature is also reviewed given its pervasiveness at service brands. The second section
considers how the goods and services literature has evolved from a dichotomous mindset to a
comprehensive marketing paradigm where the co-production of value and service marketing

18
principles provide dominant logics (Vargo and Lusch, 2004a). The following section reviews the
‘identity’ literature in the form of organisational, corporate and brand identity in order to distinguish
brand from corporate and organisational identity. The penultimate section of the chapter reviews the
brand performance literature to develop a theoretically grounded position with regards to this
research’s endogenous variable. The concluding section comprises a review of key points made
during this chapter and highlights how the literature reviewed provides a theoretical grounding for
the theoretical framework that is developed in the next chapter.
2.2. Brand
‘Brand’ is this thesis’ central construct and so will be discussed before service, identity and
brand performance. This section of the review considers brand from input, output and evolutionary
perspectives (de Chernatony and Dall'Olmo Riley, 1997). An ‘integrated’ definition of brand is then
forwarded which augments key elements from definitions that have been reviewed. An overview of
corporate branding then follows given its pervasiveness in the service sector.
2.2.1. Defining Brand
There are diverse interpretations of brand in both the literature (Davies and Miles, 1998;
Strizhakova et al., 2008) and amongst managers (de Chernatony and Dall'Olmo Riley, 1998, 1999).
Indeed, Kapferer (2004) outlines how one of the largest areas of disagreement between experts,
paradoxically, relates to defining brand. However, given the central importance of brand to this
thesis, it is important develop a clear understanding of what a brand is.

19
Guided by their literature review, de Chernatony and Dall'Olmo Riley (1997) identify nine
brand themes under three perspectives (input, output and evolutionary) to categorise viewpoints with
regards to brand. This taxonomy will be used as a framework to introduce views on brand and is
summarised in Table 1:
Table 1 A Taxonomy for Brand Perspectives (de Chernatony and Dall'Olmo Riley, 1997)
Input Perspective Output Perspective Evolutionary Perspective Legal instrument Image Evolving entity
Logo Personality Company Relationship Identity Adding value
From an ‘input’ perspective a brand is conceptualised as something the marketer creates
where the brand is: a legal instrument (e.g. ‘™’ or ‘®’); a logo; a company (e.g. British Airways) or
an more holistic identity system in terms of how the organisation wants to be perceived by
consumers - an area this chapter covers in detail later. The American Marketing Association first
published a brand definition in the 1960s which considered a brand as “a name, term, sign, symbol,
or design, or a combination of them, intended to identify the goods or services of one seller or group
of sellers and to differentiate them from those of competitors”. The most recent AMA definition
draws heavily on this definition where a brand is:
“a name, term, design, symbol, or any other feature that identifies one seller's good or service
as distinct from those of other sellers. The legal term for brand is trademark. A brand may

20
identify one item, a family of items, or all items of that seller. If used for the firm as a whole,
the preferred term is trade name” (AMA, 2009).
Although this definition has been criticised for being goods centric (Crainer, 1995; Jevons
and Gabbott, 2009), this claim is debatable given it explicitly considers both goods and services,
whilst other elements of the definition such as name, design, symbol or trademark have equal
applicability to service brands. However, it could be contended the AMA’s definition
overemphasises visible manifestations of brand at the expense of customer(s) or stakeholders. It
could also be argued the AMA perspective fails to account for the powerful role emotion plays in
brand development (Keller et al., 2008). Other scholars’ work follows the AMA’s position. For
instance, Farquhar (1989) defines a brand as “a name, term, design or mark that enhances the value
of a product beyond its functional purpose” (p.25). Similarly, Kotler (1991) considers a brand as:
“a name, term, sign, symbol, or design, or combination of them which is intended to identify
the goods and services of one seller or groups of sellers and to differentiate them from those
of competitors.” (p.442)
Once more a concern for organisational nomenclature could be interpreted as
oversimplifying the complexities that surround brand. The reason being, whilst a name, term,
symbol and so forth play an important role in brand development they could be regarded as physical
manifestations of the emotional bond brands look to develop with the latter being notably more
important than the former. In a similar manner, Doyle (2002) considers brand as a specific name,
symbol or design which is used to distinguish a particular product in terms of functional needs but

21
also psychological needs e.g. status. Whilst Doyle’s (2002) view highlights the psychological
dimension of brand, considering the construct merely as a name, logo or other outward symbols (as
does Kotler, 1991) can be regarded as something of an oversimplification (Aaker and
Joachimsthaler, 2000; de Chernatony, 2006; Keller et al., 2008).
From an ‘output’ perspective a brand is considered as existing in the consumers’ minds
where brands can be considered as: the image in the consumers’ minds (cf: Martineau, 1958); as a
way of adding value to the purchase; a personality where the brand is perceived as having quasi-
human qualities; and; a relationship between the consumer and the brand.
It has been argued relationships form an increasingly important part of marketing’s dominant
‘logic’ (Vargo and Lusch, 2004a), where if brands are personified, consumers form relationships
with them as if they were human beings (Aaker, 1996a; Aaker, 1997; Blackston, 1992; de
Chernatony, 2006; Fournier, 1995; Kapferer, 1997). Several authors consider brand in the context
of a relationship (Aaker, 1995; Aaker et al., 2004b; Agarwal, 2004; Fournier, 1998, 2005; Kapferer,
1997) whilst in the context of building brand identity, Aaker (1996a) considers relationships as the
“bottom line” (p.103). Adopting a rather functional perspective, Kapferer (2004) regards brands not
as legal but economic “quasi contracts” (p.40) where the brand’s ‘side’ of the contract include
factors such as retaining its identity but continuously enhancing its relevance, being loyal to its
mission and clients whilst the consumer’s ‘side’ of the ‘contract’ relates to being brand loyal. In this
sense brands take on the form of a psychological and implicit covenant between the brand owner
and consumer through which shared expectations are set and (to varying extents) met. Fournier
(1998) argues for the relevance of extending interpersonal relationships into the brand domain where

22
brand–consumer relationships consist of facets such as love, commitment and interdependence
whilst Aggarwal (2004) notes how norms of assessment used in personal relationships extend to
judgements about brands. However, metaphoric transfer from the human to brand domain has been
subject to debate. The reason brands are inanimate and so cannot think or feel as humans do
(Bengtsson, 2003; O'Malley and Tynan, 2000) with Bengtsson (2003) arguing elements of a human
relationship such as the reciprocation of emotions such as love are “qualitatively different” (p.155)
for brands and humans. For instance, I love my VW Beetle is different to I love my partner. Hence,
the issue arguably lies not so much with the fact that conceptually ‘relationships’ between brands
and consumers cannot be developed but more the discourse used insofar as the vocabulary, that is,
the word relationship, connotes humanity for both sides of the brand-stakeholder connection. This
potentially creates inaccurate associations when considering relationships in the context of brands
(Bengtsson, 2003). However, it could be argued the initial metaphorical use of relationship has been
taken too literally. Consequently, Aggarwal (2004) outlines how humans can have relationships with
brands but that they may not have the same “richness and texture” (p. 88) human relationships have.
This is an important caveat insofar Aggarwal (2004) appreciates the different context of a brand-
consumer dyad but that it is not unreasonable for some consumer-brand ‘connection’ to exist in the
way it does between humans (albeit under the term ‘relationship’). Drawing on the work of Shultz
and Shultz (2004), who note how brands bring a buyer and seller together, Veloutsou and Moutinho
(2008) refer to brand relationships in the context of a bond, be it financial, physical or emotional,
which may represent more appropriate language. Finally, it could be argued considering
‘relationships’ from a brand-consumer dyad may be too narrow in focus. This perspective excludes
broader organisational stakeholders that encounter the brand such as shareholders, employees, local
communities and so forth. The importance of this perspective has also been amplified by the

23
growing role corporate social responsibility where broader stakeholder management is key. Hence,
the output perspective makes it clear a brand is more than a logo, name or symbol whilst the notion
of a ‘covenant’ or quasi contract gives rise to mutual expectations being formed between the brand /
organisation and its stakeholders in the context of a relationship that may be more appropriately
conceptualised as a ‘connection’ or ‘bond’.
Finally, more evolutionary perspectives on brand “perceive brands as evolving from an input
to an output perspective” (de Chernatony and Dall'Olmo Riley, 1997:90). Here, brands are a more
fluid and dynamic entity which ‘evolve’ or ‘develop’ from a brand owner to consumer focus.
Goodyear (1996) conceptualised brands as evolving, or metamorphosizing, through sequential
stages where, in the final stage, ‘customer driven marketing’, the brand becomes “meaningful
symbols for whole sectors of society”(Goodyear, 1996:112). Following Goodyear (1996), Kunde
(2000) noted how brands are not static but evolve over time. In this sense branding moves from
being something the brand owner does to the consumer to something the consumer does with the
brand (Lannon, 1992; Senior, 2008). This could include forming a relationship or enabling the
communication of his / her self concept (Rosenberg, 1979; Sirgy, 1982) or to provide a forum where
a given stakeholder can interact with the brand. Organisations such as Nike have become
particularly competent in this respect with their street football skills tournaments and so forth.
Hence, as the brand evolves, the brand-consumer ‘interface’ develops into more of a dialogue as
opposed to the consumer merely responding to stimuli generated by the brand owner. In this sense
the consumer is no longer a ‘gullible dupe’ (Marchand, 1985) who could be swayed if product
claims were inflated. This position is consistent with Holt (2002) who argues consumers treat
brands as a cultural resource, within a “dynamic dialectical relationship” (p. 80), which emancipates

24
them from the control or domination of brand communications. Such a perspective also has
similarities with the wider ‘science of relationships’ literature which outlines how “relationships are
not to be considered static entities, but as dynamically linked in a continuous process of creation”
(Hinde, 1995: 5).
de Chernatony and Dall’Olmo Riley (1998) enlarged their literature review of 1997 by
considering a brand also as a shorthand device that facilitates the recall of brand benefits from
memory, a risk reducer with increasing brand familiarity and as value systems, that is a system or
“cluster of” (p. 442) values which represents the brand. Such additions can be considered as ‘input’
interpretations of brand (i.e. something the marketer creates). Expanding on de Chernatony and
Dall’Olmo Riley’s (1998) work, de Chernatony (2006) also considered brands in terms of
positioning so the brand is instantaneously associated with a certain benefit in relation to its
competitors and a vision which provides brand direction, focus and purpose. Finally, viewing a
brand as an identity system was now referred to a brand as a cluster of values. The latter can be
regarded a more of a self explanatory title than de Chernatony and Dall’Olmo Riley’s (1997) work.
The view that brands are concerned with values has been central to de Chernatony’s (and co-
authors’) work. For instance, a brand is considered “a complex multidimensional construct whereby
managers augment products and services with values” (de Chernatony and Dall'Olmo Riley, 1998
:436) or more simply as “..a cluster of functional and emotional values” (de Chernatony and Segal
Horn, 2003:1100). Once more, de Chernatony (2006) considers values as being central to defining
brand where “a successful brand is an identifiable product, service, person or place, augmented in
such as way that the buyer or user perceives relevant, unique, sustainable added values which match

25
their needs most closely.” (de Chernatony, 2006:13). This is consistent with de Chernatony’s (2009)
more recent work where a brand is defined as “a cluster of values that enables a promise to be made
about a unique and welcomed experience” (p. 104). Consequently, it can be seen how values form a
pivotal role of de Chernatony’s conceptualisation of brand. The logic being values are important
given they inform behaviour (Hardaker and Fill, 2005, Meglino and Ravlin, 1998, Rokeach, 1973)
with the latter being concerned with a variety of organisational stakeholders.
Several points should be noted from the above. For instance, the work of de Chernatony’s
(with other stated authors) provides a useful framework for considering perspectives on, and
interpretations of, brand. Furthermore, by considering these perspectives it becomes apparent a
brand is more than an image or logo. Here, Davidson’s (1998) metaphorical representation of brand
as an iceberg (Figure 2) is useful which highlights how considering a brand as a name or logo is
Figure 2 Conceptualising Brand as an Iceberg (Davidson, 1998: 376)

26
merely the ‘tip’ of the iceberg. Whilst it is true names play an important brand role (e.g. Virgin’s
name signifies a new or ‘virgin’ and atypical corporate market approach), to truly understand and
capitalise on a brand it is necessary to go beneath the ‘surface’ and consider factors such as values,
culture, norms etc. However, the input-output-evolutionary taxonomy does not account for the view
that brand can be conceptualised in terms of promises. Whilst de Chernatony’s (2009) work does
refer to a promise, values are pivotal to this scholar’s position. However, Ambler and Styles (1996)
consider a brand as “the promise of a bundle of attributes that someone buys….the attributes that
make up a brand may be real or illusory, rational or emotional, tangible or invisible” (p.10) whilst
Brodie et al (2006b) conceptualise a ‘service brand’ in terms of ‘making’, ‘enabling’ and ‘keeping’
promises. Similarly, Berry (2000) focuses on services by outlining “a strong service brand is
essentially a promise of future satisfaction” (p.129). Hence, such views of brand have similarities
with Bitner’s (1995) work where marketing is conceptualised in terms of selling, enabling and
delivering ‘promises’ as opposed to being concerned with ‘exchange’ (Bagozzi, 1975; Houston and
Gassenheimer, 1987).
From the preceding section, it becomes clear various perspectives on brand exist. However,
it could be argued that, to date, an integrated and holistic view of brand has yet to be developed that
captures the breath of construct as outlined above. Whilst it is appreciated all aspects of brand
cannot possibly be considered in one statement, current definitions tend to gravitate around one
central theme such as values, relationships, nomenclature or promises. Whilst such factors can be
viewed as important perspectives on brand the inclusion of one should not necessarily result in the
exclusion of another.

27
Seller / Corporation
Stakeholders
‘Evolving Bond'
Functional and Emotional values
Based on this review of the brand literature it is now appropriate to develop an integrated
view or definition of brand. Such an approach aims to augment the various positions outlined
above. Consequently, brands can be considered as: a construct that helps with the delivery of brand-
related promises made by the seller / corporation to its stakeholders; facilitating the formation of a
mutually beneficial and evolving bond between the seller / corporation its stakeholders; being
guided by functional and an emotional element. Combining these points leads to an ‘integrated’
definition of brand where a brand is a construct that delivers marketing promises to facilitate the
formation of a mutually beneficial and evolving bond between the seller (or corporation) and its
stakeholders based on functional and emotional values.
Consequently, this definition can be seen as an attempt to augment several views outlined
above. The definition has been conceptualised in Figure 3 where brand is developed as part of a
dialectical brand-stakeholder process (Holt, 2002) and so is couched within the evolutionary school.
Figure 3 Conceptualising a Definition of Brand – An Integrated Perspective

28
2.2.2. Corporate Branding
Given this thesis’ service brand focus, it is appropriate to consider corporate branding given
its pervasiveness in the service sector (Aaker and Joachimsthaler, 2000; Berry, 2000; Berry et al.,
1988; de Chernatony, 2001; Diefenbach, 1987; Pina et al., 2006). Indeed, scholars such as King
(1991) note the close links between corporate and service branding with scholars such as de
Chernatony and Segal-Horn (2004) using the terms interchangeably. However, it is important to
note that whilst corporate branding tends to predominate at service brands, this should not imply
goods based brands do not also adopt a corporate branding approach with Nestle, Unilever or Ferrari
providing illustrative examples.
Einwiller and Will (2002) define corporate branding as:
“a systematically planned and implemented process of creating and maintaining favourable
images and consequently a favourable reputation of the company as a whole by sending
signals to all stakeholders by managing behaviour, communication and symbolism.” (p.101)
Several points should be noted from Einwiller and Will’s (2002) definition. First corporate
branding, in a similar manner to product branding, is a planned and strategic process. It is not a
tactical activity the organisation can conduct on an ad hoc basis. Furthermore, corporate branding is
concerned with placing the organisation’s brand name in the consumer’s mind and so is concerned
with forming an image and reputation (please note the distinction between image and reputation will
be made in Section 2.6.2). Consequently, in the case of corporate or service branding, the

29
organisation’s name dominates branding activity (Argenti and Druckenmiller, 2004; Berry, 2000;
Berry and Seltman, 2007; de Chernatony, 2006; Hardaker and Fill, 2005; Harris and de Chernatony,
2001; Keller, 2003; Kim et al., 2003a; Low and Lamb, 2000). Conversely, for goods-centric
marketing the product is the primary brand (Berry, 2000; Berry and Seltman, 2007).
Einwiller and Will (2002) also makes reference to behaviour, communications and
symbolism. At service brands it is particularly important employees’ behaviour is consistent with
how the organisation wants the brand to be perceived (de Chernatony, 1999; de Chernatony and
Segal-Horn, 2004; Hulberg, 2006; Keller et al., 2008). Consequently, employees play a central role
in enacting the brand as part of the corporate branding process (Ashford and Mael, 1996; Balmer,
1995, 1998; Balmer and Greyser, 2003; Berry and Seltman, 2007; Brodie et al., 2009; Harris and de
Chernatony, 2001; Hulberg, 2006; Kennedy, 1977). This places increased importance on marketing
and human resources functional alignment for service brands (Balmer, 1995; Davies and Chun,
2006; Davies et al., 2003; de Chernatony, 1999, 2006; King, 1991; McDonald et al., 2001; Wilson,
2001; Zeithaml et al., 2006). To promote brand consistent behaviour across multiple interfaces
various human resource ‘mechanisms’ exist which service brand marketers’ can look to utilise.
These include recruitment, induction, training (de Chernatony, 2006; de Chernatony and Segal-
Horn, 2004; Farnfield, 1999; Heskett et al., 1997; Lovelock et al., 1999; McDonald et al., 2001),
internal marketing (Burmann and Zeplin, 2005; Dibb and Simkin, 2000; Free, 1999; Greene et al.,
1994; Hardaker and Fill, 2005; King, 1991; Melewar and Karaosmanoglu, 2006a; Piercy and
Morgan, 1990, 1991; Van Riel, 1995) and culture (on the assumption culture can be managed), or
more accurately cultures (Balmer and Greyser, 2003). Consequently, corporate branding can be
regarded as more ‘multi’ or ‘inter’ disciplinary in scope than traditional product based branding

30
(Balmer, 2001a) given the need for marketers’ at corporate brands to engage with human resource
activities that foster employee behaviour to propagate the brand.
Next, Einwiller and Will (2002) outline how corporate branding is concerned with
marketing communications. Of particular note is how for corporate brands, who need to manage
several interfaces, marketing communication is simultaneously aimed at multiple stakeholders
(Balmer and Greyser, 2003, Hulberg, 2006, Ind, 1997, Muzellec, 2006, Hallawell, 1999, Balmer,
2001a, King, 1991). The objective of external marketing communications is to reflect or make
manifest the organisation’s values to those outside the organisation (Hulberg, 2006). Conversely,
internal communications aim to engage employees in the branding process given the pivotal role this
stakeholder group plays at such organisations (de Chernatony and Segal-Horn, 2004; McDonald et
al., 2001).
Finally, Einwiller and Will (2002) note the role symbolism plays in corporate branding. This
could be in the form of the brand logo, typeface or premises an organisation occupies. The logic
being such visual cues provide a way for a service brand to convey its otherwise largely intangible
offering in a more concrete and tangible way (Keller, 2003; Levitt, 1981; Zeithaml et al., 2006).
However, regarding a corporate brand as synonymous with organisational nomenclature is an
oversimplification (Balmer, 2001a; Balmer and Greyser, 2003; de Chernatony, 2006). The reason
being the corporate brand is a way for the organisation to project its inner identity (Muzellec, 2006)
or defining values (de Chernatony, 2006, Ind, 1997, Kay, 2006, Hatch and Schultz, 2003) to all its
stakeholders (Ind, 1997). As a result, symbolism needs to be considered in synchrony with
communications and employee behaviour which help reflect and enact the organisation’s values
respectively (Hulberg, 2006).

31
Consequently, it can be seen how a ‘monolithic’ (Aaker, 1996a, Ind, 1990, Olins, 1989,
Olins, 1995, Van Riel, 1995) or corporate approach to branding contrasts with classical line
branding (Harris and de Chernatony, 2001; McDonald et al., 2001). With the latter, a product line or
product is the primary brand (Berry, 2000; Berry and Seltman, 2007; Brodie et al., 2006a), branding
tends to focus on consumers (Balmer, 2001a), employee interaction with customers is less notable
(de Chernatony, 1999; Lovelock, 1998) whilst values tend to be enacted via advertising, distribution,
user imagery (McDonald et al., 2001) or the physical product and its packaging (de Chernatony and
Segal-Horn, 2004; 2001; McDonald et al., 2001). However, in the context of corporate branding
values are largely enacted via employee behaviour (Bostrom and Isberg, 2009; de Chernatony and
Segal-Horn, 2004) to a broader range of stakeholders (Balmer and Gray, 2003; King, 1991). This
should not imply such ‘goods-based’ factors do not also play a role at service brands. For instance,
the packaging or presentation of your insurance policy when received by post helps convey brand
attributes or values (cf: symbolism). However, the role such tools play for service brands tends to
be less notable due to the prominence of the customer encounter. Furthermore, it could be argued
with the advent of corporate social responsibility, product based brands are paying increased
attention to stakeholder and not just consumer communications which may blur such a dichotomous
view of goods and services branding.

32
2.2.3. Brand – Summary
This section of the thesis has reviewed various definitions of brand. Based on the literature,
an ‘integrated’ definition of brand was presented where a brand is: a construct that delivers
marketing promises to facilitate the formation of a mutually beneficial and evolving bond between
the seller (or corporation) and its stakeholders based on functional and emotional values. The
characteristics of corporate branding were then discussed due to the pervasiveness of this branding
approach for service brands with particular note being played to the role symbolism,
communications and behaviour place for corporate brands (cf: Einwiller and Will, 2002). Now that
brand has been reviewed, the service literature will be considered given this provides the primary
context for this research.
2.3. Goods and Services
The previous section of this chapter clarified this thesis’ interpretation of what a brand is.
This was achieved by developing an integrated definition which augmented current definitions from
the literature. This section of the chapter reviews the development of the ‘service’ literature to
contextualise this research. This is structured around the literature evolving from a goods / service
dichotomy to a continuum and ultimately to a new service dominant marketing ‘logic’ (Vargo and
Lusch, 2004a). Concluding remarks highlight how, given the widespread academic support for the
new service dominant logic, the rationale for this thesis’ service focus becomes stronger.

33
2.3.1. Towards a Service Dominant logic for Marketing Exchange
Early services literature tended to focus on the difference between goods and services with
the implications they had for marketers being explored (Vargo and Lusch, 2004b, Zeithaml et al.,
1985). Judd (1964), for example, offers a service definition via the logic of ‘exclusion’ where a
service is “a market transaction by an enterprise or entrepreneur where the object of the market
transaction is other than the transfer of ownership (and title if any) of a tangible commodity” (Judd,
1964: 59). Whilst this approach helps articulate what a service is not it has the limitation of not
actually stating what a service is. Developing Judd’s (1964) work, Rathmell (1966) makes a clear
distinction between a good and service where “to consider a good to be a noun and a service a verb
– a good is a thing and a service is an act….the former is an object….whereas the latter is a deed,
performance or effort” (Rathmell, 1966; 33). In subsequent work, Rathmell (1974) eloquently
outlines how “goods are produced, services are performed” (p.58) whilst Berry (1980), drawing
heavily on Rathmell’s (1966), work defines a good as "an object, a device, a thing" (p. 25) and a
service as "a deed, a performance, and effort." (p. 25). However, to date, there is still no widely
accepted definition of service (Gummesson, 2000). Vargo and Lusch (2004b) argue this is a
function of goods and services not being mutually exclusive.
Considering goods and services in terms of degree aligns with the influential work of
Shostack (1977) who looked to help services marketers “break free” from product marketing. In a
similar manner to Rathmell (1966), Shostack (1977) highlighted how a goods-services continuum
may be a more appropriate conceptualisation in terms of tangible or intangible dominant ‘entities’
and argued “it seems that there are really very few, if any ‘pure’ products or services in the

34
marketplace” (Shostack, 1977: 74). This thinking echoes Levitt (1972) who believed any distinction
between goods and services was spurious; “there are only industries whose service components are
greater or less then those of other industries” (p. 41). Consequently, Shostack (1977) and Levitt
(1972) moved marketing beyond an ‘either / or’, that is, goods or services approach, to marketing
where conceptualising in terms of degree and not absolutes may be more appropriate. This
perspective finds more recent support from the Nordic school. For example, Gummesson (2000)
considers “the distinction between goods and services has become a burden” (p. 121). In a similar
manner, Gronroos (2000a) contended a goods and services divide should no longer exist and points
towards their convergence with service principles dominating.
Such a line of thinking leads to the influential work of Vargo and Lusch (2004a) who argue a
new dominant marketing ‘logic’ centred around service is emerging. Here, service is defined as “the
application of specialised competencies (knowledge and skill) through deeds, processes and
performances for the benefit of another entity or the entity itself” (Vargo and Lusch, 2004a: 2).
More recently, this definition has been refined to consider service as the application of resources
(Vargo and Lusch, 2006) or competences (Maglio et al., 2009) for the benefit of another.
The more traditional goods-centred logic can be distinguished from the burgeoning service
dominant logic (Vargo and Lusch, 2004a) in several ways. Primarily the former is centred on a
good, or more generally a ‘product’ which includes both tangibles (goods) and intangibles (services)
as units of output. In this context intangibles are considered specific types of goods, that is
intangible units of output or as an augmentation of goods to enhance value (Maglio et al., 2009).
Consequently, the goods dominant logic regards services as inferior to goods (ibid) and treats
services as a special kind of intangible product, or in other words, what goods are not (Vargo and

35
Lusch, 2008). Furthermore, in comparison to the goods-centred logic, within the service dominant
logic “exchange is fundamentally, primarily about the intangible rather than the tangible” (Lusch
and Vargo, 2008: 91).
The service dominant logic also represents something of a paradigm shift given it is
applicable to applicable to all marketing offerings (Vargo and Lusch, 2004a). The reason being
within the domain of this logic, all organisations, markets, and society are primarily concerned with
exchange of service (Vargo et al., 2008). This implies service is exchanged for service, all
organisations are service organisations, all markets focus on the exchange of service and all
economies are service based. The result being all marketing theory and practice should be informed
by service logic principles and theories. In other words “service is the dominant logic for marketing”
(Ballantyne and Varey, 2008: 11) or service is the common denominator of the exchange process
(Vargo and Lusch, 2008).
Consequently, within the service dominant logic, the principal units of exchange are now
operant (e.g. competencies) not operand (e.g. goods) resources (Maglio et al., 2009; Vargo et al.,
2008). Goods are no longer the source of value creation (Maglio et al., 2009), merely a tool or
“appliance” (Vargo and Lusch, 2004a: 7) or “distribution mechanism” (Vargo and Lusch, 2004a:
14) in the value creation process. In this sense products are a means to an end with the end being
benefit the customer receives from consuming the service (Lusch et al., 2007). More specifically
goods are service-delivery vehicles (Vargo et al., 2008). This position is consistent with
Gummesson (1995) who highlighted the pervasive nature of service across the good / service divide
by noting how both activities and things (i.e. goods) render service. Such logic echoes Kotler’s

36
(1977b) view where the value of physical goods does not lie in the good itself but in the services
they render. Within the service dominant logic, the customer is not viewed deterministically or an
operand resource. Marketers no longer do things to customers (cf: Lannon 1992). Customers are
now voluntaristic and an operant resource given their active role in co creating value with the
organisation (Lusch and Vargo, 2008; Vargo and Lusch, 2006). Hence, value is no longer imbued in
the good during production. It is perceived and determined by the consumer (or other beneficiary)
via application of their operant resource in the context of their lives to value propositions the
organisation makes (Ballantyne and Varey, 2008; Lusch et al., 2007; Vargo and Lusch, 2004a,b). In
this sense, the organisation cannot deliver value but only offer value propositions (Vargo et al.,
2008). Such value propositions focus on value creating process which are perceived by consumers
(Gronroos, 2000a; Vargo and Lusch, 2008; Vargo et al., 2008) so they can, via co-production, create
value for themselves by using their physical and mental effort (competencies) in collaboration or
dialogue with the organisation (Lusch and Vargo, 2008; Maglio et al., 2009). For instance, an IT
company may offer its database services to a retailer so they can develop deeper behavioural
customer insights. The IT company’s value proposition is database competence and the retailer
applies their knowledge of the retail market to configure data requirements and how the database
will be interrogated in order to obtain the desired customer insights. Consequently, mutual benefit
arises from exchange (Vargo et al., 2008) or value (Vargo and Lusch, 2008) in use as opposed to
value in exchange (i.e. buying the database). Hence, this element of the service dominant logic
paradigm moves marketing from a transactional to a relational or interactive perspective. In many
respects this echoes Holt’s (2002) position where brands aim to engage in dialogue with their
stakeholders.

37
Vargo and Lusch’s (2004a) work raises several important points. For instance, within this
new marketing logic, service forms a central role as does the consumer and relationship marketing.
The focus has moved from tangible (operand) to intangible (operant) resources with the service
rather than a good being the primary focus of marketing exchange (Maglio et al., 2009).
Consequently, “S-D logic inverts the role of goods and services by making service superordinant to
goods” (Lusch et al., 2007: 8) with service becoming the backbone of the organisation’s competitive
advantage (Lusch and Vargo, 2008; Lusch et al., 2007; Vargo and Lusch, 2004a,b; Vargo and
Lusch, 2006). Consequently, the growing support for this burgeoning logic provides a strong
rationale for service based research.
Furthermore, it should also be acknowledged how several literature “tributaries” (Day,
2004:18) (see Bolton et al., 2004) flow into the service dominant paradigm. For example, marketing
orientation (Kohli and Jaworski, 1990, Narver and Slater, 1990, Slater and Narver, 1994),
relationship marketing (Gronroos, 2000b, Gronroos, 2000a, Gummesson, 1998, Gummesson, 2002)
/ networks (Coviello et al., 2002, Achrol, 1991, Webster, 1992, Achrol and Kotler, 1999), services
marketing (Zeithaml and Bitner, 1996; Zeithaml et al., 1985), strategic management (Prahalad and
Hamel, 1990) and supply chain management are unified by the holistic service dominant logic
Vargo and Lusch (2004a) forward. This development facilitates the advancement of an integrative
marketing theory which Gummesson (2004) (see Bolton et al., 2004) argues is particularly helpful
given the fragmented nature of current “textbook theory” (p. 20). As Aitkin et al (2006:276) note,
Vargo and Lusch’s (2004a) work does not merely restate current literature but brings such thinking
together in a new way which Ballantyne and Varey (2008) consider as a challenge to current
marketing orthodoxy.

38
Whilst the service dominant logic draws on an eclectic range of literature, some of its
literature ‘tributaries’ are not without controversy. For example, the marketing concept (Drucker,
1954; Levitt, 1960), which is enacted by a marketing orientation, has been subject to criticism due to
its strong normative elements which marketers have tended to dogmatically follow (Brownlie and
Saren, 1992). Furthermore, marketing may be more concerned with the avoidance of competition
(Houston and Gassenheimer, 1987), dominance of markets (Dickenson et al., 1988), product push
(Kotler, 1972), influencing demand (Galbraith, 1967) in addition to meeting both internal
(organisational) and external (customer) needs (Brownlie and Saren, 1992). Also, Day (1999) notes
how being too market orientated can be disastrous as the goods or services customers demand may
not fit with the organisation’s competence. Such views are almost diametrically opposed to concept
of customer sovereignty which is central to a marketing orientation. Indeed, guided by the service
dominant principle of co-creation, Gummesson (2008) has called on marketers’ to move away from
a customer centric (Lusch and Vargo, 2008) position to balanced centricity with the latter also
focusing on suppliers. The reason being suppliers create the value propositions that customers
actualise and so play an active role in the value creating process. Furthermore, as previously noted
it is questionable if consumers can or want to have relationships with brands or organisations
(Bengtsson, 2003; O'Malley and Tynan, 2000) whilst Coviello et al (2002) highlighted how both
transactional and relational marketing can co-exist within the same firm. This questions whether
organisations need to move, entirely, to a relational approach. Consequently, such debates need to
be revisited so an academic consensus can be reached on some of the service dominant logic’s
literature tributaries.

39
The scope of the service dominant logic is also quite ‘inclusive’. Consequently, it is difficult
to appreciate what marketing is not and how marketing managers can prioritise scarce resources if
they are to incorporate this paradigm into their marketing activities. As Levy (2006: 61) states “the
most successful dominant logics are those which are embraced by both managers and scholars.”
Currently, the service dominant logic resides mainly in the academic domain with limited empirical
research in order to validate it being conducted (Palmer et al., 2006). As a result it could be argued
parameters need to be placed around this burgeoning paradigm. For instance, more recently, Lusch
and Vargo (2008) have incorporated the notion of symmetry into their logic. This involves not
misleading customers and treating partners equitably (Lusch and Vargo, 2008). It is questionable
whether it is marketing’s place to provide such moral guidance and so is the paradigm going too far?
Finally, the development and management of brand constitutes a strategic marketing activity
(Keller, 2003). However, is surprising to note the scant attention paid to brands within these authors’
work (Brodie et al., 2006b). Collectively, these points simultaneously highlight the authors
appreciation of, and concerns with, Vargo and Lusch’s (2004a) seminal work.
2.3.2. Goods and Services – Summary
This section of the chapter has outlined how it may no longer be appropriate to consider
goods / services dichotomously. A more informed approach may be to regard service as
superordinate to goods in the context of an emerging service dominant logic (Vargo and Lusch,
2004a). Of particular note is how the service dominant logic presents a revised paradigm for
marketing exchange. A central tent of this burgeoning paradigm concerns the co creation of value

40
(Lusch and Vargo, 2008; Vargo and Lusch, 2006). However, other key characteristics of this logic’s
‘mindset’ (Lusch and Vargo, 2008) include a primary concern for the exchange of intangibles, the
predominant use of operant resources (competences or knowledge) and a relational focus.
Consequently, this amplifies the importance of academic research in the service domain and so
provides a stronger rationale for this thesis’ focus.
2.4. Identity
Now the brand and service literature have been reviewed it is appropriate to consider the
‘identity’ literature. From a terminological perspective, Balmer and Greyser, (2003) outline how the
identity literature is disorganised and taxing. Indeed, Balmer (2001a) goes as far to say that “the
identity concept, in its various facets, is ubiquitous, but it can be used with reckless permissiveness
among practitioners circles, and, to a lesser degree amongst scholars.” (p. 251)
Despite the view that the identity literature is reaching maturity (Balmer and Greyser, 2003)
one only need look at the literature to find persistent examples of liberal terminological use. For
example, Van Rekom (1997: 413) in developing an operational measure on corporate identity
actually draws on Albert and Whetten’s (1985) seminal work on organisational identity. In a similar
manner, Illia and Lurati (2006: 301) refer to Balmer and Greyser’s (2002) AC2ID model in the
context of organisational identity whilst the model has been developed in the context of corporate
identity. Furthermore, when referring to Gioia and Thomas’ (1996) reservations regarding Albert
and Whetten’s (1985) view that organisational identity is enduring, Balmer (2001a: 280) actually
refers to business identity, which itself consists not only of organisational, but also corporate and

41
visual identity, and so is a new perspective on identity. This has resulted in the identity literature
being shrouded in ‘fog’ (Balmer, 2001a) or being represented by the mythical ‘Tower of Babel’
(Hatch and Schultz, 2000). Balmer and Greyser (2003) cite several reasons for the confusion that
surrounds identity. These include the practitioner / scholar divide, disciplinary research silos and
divisions accentuated by geography, language and culture.
However, despite recent work that aims to crystallise the ‘identity’ literature (e.g. Balmer,
2008) an array of identity types and related terms have continued to emerge. Of particular interest
to this research is how the identity literature has evolved to encompass corporate brand identity.
This is particularly intriguing given Balmer (2008) defines “corporate brand identity” in terms of a
“covenanted identity” which is then defined as “the covenant that underpins a corporate brand” (p.
898). Arguably, it is still rather challenging to understand what corporate brand identity is given a
clear explanation should potentially follow a term in order to define it. Consequently, it is debatable
if the fog has cleared or, unfortunately, descended once more on the identity literature.
Given this context, this section of the chapter aims to clarify this terminological confusion
and is structured as follows. The first three sections review the organisational, corporate and brand
identity literatures. This helps distinguish brand identity from the other major forms of identity that
can be found in the marketing literature. Brand identity is then considered in the context of corporate
identity and corporate branding to highlight how these constructs are related yet distinct. Next, the
case for brand identity being considered as an identity orphan is made. This paves the way for
justifying why the corporate identity’s interdisciplinary school potentially provides the brand
identity orphan with a suitable theoretical home. Finally, current conceptual frameworks of brand

42
identity are reviewed to explore construct dimensionality which will be drawn on to ground this
thesis’ service brand identity theoretical framework (Chapter 3).
2.4.1. Organisational Identity
In their seminal paper Albert and Whetten (1985) define organisational identity as “the
shared understanding of the central, distinctive and enduring character of an organisation” (p. 265)
whilst Hatch and Shultz (1997) consider the construct as “a collective shared understanding of the
organisation’s distinctive values and characteristics” (p. 357). In what Cornelissen et al. (2007)
consider a primary or common definition, organisational identity refers to the “the shared meaning
that an organisational entity is understood to have that arises from its members’ (and others’)
awareness that they belong to it” (p. S3). Consequently, organisational identity can be seen as a
“system of shared meanings” (Cornelissen et al., 2007: S3).
At a philosophical level, organisational identity researchers and organisational behaviourists
(Ashford and Mael, 1996; Dutton and Dukerich, 1991; Dutton et al., 1994; Gioia et al., 1998), are
concerned with addressing the question of “who are we?” as an organisation (Hatch and Schultz,
2000: 15) or “what kind of organisation is this?”(Albert and Whetten, 1985: 292). Hence,
answering these questions helps reveal the identity of the organisation by considering the ways
organisational members perceive, think and feel of themselves as an organisation (Hatch and
Schultz, 1997; 2000). Consequently, organisational identity is concerned with understanding
organisational members’ affinities to, or identification with, their employing organisation (Ashforth

43
and Mael, 1989; Dutton et al., 1994; Hatch and Schultz, 1997). This process of identification with
the organisation, organisational identification, has been defined as “a cognitive linking between the
definition of the organisation and the definition of self” (Dutton et al., 1994: 242) and is based on a
cognitive connection or alignment between the employee’s self concept and his / her employing
organisation (Dutton et al., 1994). Stuart (2003) refers to this as “person-organization fit” (p. 33)
where this fit is perceived through a given individual’s cognitive frame (Dutton and Dukerich, 1991;
Dutton et al., 1994) or perceptual lens (Gioia et al., 2000; Gioia and Thomas, 1996). In this context,
identity is conceptualised from an (internal) employee perspective via the relationship between
employees and their employing organisation (Balmer, 2008; Balmer and Greyser, 2003; Hatch and
Schultz, 1997) which results in organisational identity being “held in organisation members’ minds”
(Dutton and Dukerich, 1991 :547). As a result the organisational identity literature draws heavily on
Social Identity Theory (Ashforth and Mael, 1989; Tajfel and Turner, 1986) with scholars such as
Haslam (2001) contending social identity is a form of organisational identity. Distinctions aside,
Social Identity Theory outlines how individual actors associate with certain group, which King and
Whetten (2008) refer to as a categorical reference group, and so hold a favourable bias or attitude
towards it. An outcome is ‘positive distinctiveness’ where people’s self concept is defined in terms
of ‘we’ rather than ‘I’(Cornelissen et al., 2007). It is also worth noting the organisational identity
perspective has been particularly important to North American scholars (Balmer, 2001a; Balmer,
2008; Balmer and Greyser, 2003).

44
2.4.2. Corporate Identity
The corporate perspective on identity has been particularly important to scholars on
mainland Europe, the UK and the British Commonwealth (Balmer, 2008; Balmer and Greyser,
2003). In comparison to organisational identity, corporate identity has more of an external /
customer focus in addition to being influenced by a managerial and practical background (Balmer,
2008). Conversely, organisational identity tends to have more of an internal / employee focus and
richer theoretical foundations (Balmer, 2008). From a philosophical perspective, corporate identity
scholars, in comparison organisational identity scholars are more interested in answering the
question of “what are we?” as opposed to who are we? (Balmer and Greyser, 2003).
However, reaching a consensus of opinion with regards to defining corporate identity has
proven challenging (Melewar and Karaosmanoglu, 2006b). Potential reasons for the continuation of
this issue relate to the multidisciplinary nature of the literature (Balmer, 1998; Melewar and Jenkins,
2002; Melewar et al., 2005b) and the construct having different meanings for different stakeholders
(Melewar et al., 2005c). Earlier scholars’ definitions tended to focus on the visual aspects of
corporate identity. For instance Carter (1982) defined corporate identity as “the logo or brand image
of a company and all other visual manifestations of the identity of a company” (p. 5) whilst Dowling
(1994) considered the concept as “the symbols an organisation uses to identify itself to people”
(p.40). Abratt’s (1989) seminal work, which regarded brand personality as an antecedent of
corporate identity, defined the latter as “as assembly of visual cues physical and behavioural by
which an audience could recognise the company and distinguish from others” (p. 414). Hence, this

45
can be seen as an evolution of the literature beyond a visual domain. Taking more of a behavioural
perspective, Van Riel (1997) regards corporate identity as “the self presentation of an organisation,
rooted in the behaviour of individual organisational members, expressing the organisation’s
“sameness over time” or continuity, “distinctiveness” and “centrality”” (p. 290). Consequently, it
can be seen how Dowling (1994) and Van Riel’s (1997) work has similarities with elements of
Abratt’s (1989) work by considering visual and behavioural elements respectively. Olins’ (1991)
perspective focused on communications where corporate identity was defined as “everything that
the corporation does, in every way it communicates” (p. 34). By considering visual, behaviour and
communication elements the emergence of the corporate identity mix (Van Riel and Balmer, 1997),
as will be discussed later, started to take root.
In what appears to be a development of Thomas and Kleyn’s (1989) work, who regard
corporate identity as ‘what the organisation really is’, Baker and Balmer (1997) refer to corporate
identity as “what an organization is” (p.368). However, such a view tends to veil the complexity
and debate that has surrounded the construct. Other scholars (Bernstein, 1984; Melewar and
Jenkins, 2002; Melewar et al., 2005b) have developed this interrogative-based line of thinking to
consider corporate identity in terms of ‘what the organisation is’, ‘what it stands for’, ‘what it does’,
‘how it does it’ and ‘where it is going’. In a similar vein, albeit adopting a semiological perspective,
Olutayo and Melewar (2007) pose several probing questions to reveal corporate identity by
considering “where the firm is going”, “how the firm is different”, “what the firm does” and “how
the firm carries out its business” (p. 428). Whilst this approach provides questions it, unfortunately,
does not appear to answer the question of what corporate identity is.

46
In a “more generic but all-encompassing definition of corporate identity” (Balmer et al.,
2007: 8) Gray and Balmer (1998) define the construct as “the reality and uniqueness of the
organisation” (p. 696). Drawing on the work of several authors (Fombrun, 1996; Margulies, 1977;
Olins, 1989, 1995), Hatch and Schultz (2000) regard corporate identity as the “central or distinctive
ideas of the organisation and how this idea is represented and communicated to a variety of
audiences” (p. 13). Hatch and Shultz’s (2000) work bears some resemblance to Marwick and Fill
(1997) where corporate identity is defined as “the organisation’s presentation of itself to its various
stakeholders and the means by which it distinguishes itself from all other organisations” (p. 397).
Hence, corporate identity appears to be concerned with understanding how the organisation’s central
or distinctive attributes (i.e. its differentiating factors), can be communicated to a broad range of
stakeholders (Alvesson, 1990; Balmer, 2001a; He and Balmer, 2007b; Olins, 1995; Van Riel and
Balmer, 1997). Based on in-depth interviews, Melewar and Karaosmanoglu (2006b) offer an
operational definition where “corporate identity is the presentation of an organisation to every
stakeholder. It is what makes an organisation unique and it incorporates the organisation’s
communication, design, culture, behaviour, structure, industry identity and strategy. It is thus
intrinsically related to both the corporate personality and image” (p. 864). This definition has the
benefit of being empirically informed whilst the operational orientation nature of the definition also
provides clear guidance in terms of what corporate identity is. Finally, Zinkhan et al. (2001)
consider corporate identity as representing “the ways a company chooses to identify itself to all the
publics.” (p. 154).
As can be seen from the above, a range of corporate identity definitions have been advanced
in the literature. Whilst general themes appear to concern making internal organisational attributes

47
manifest, outlining what the organisation stands for in addition to stressing the construct’s strategic
nature, it is still challenging to define, per se, what corporate identity is. The problematic nature of
defining corporate identity led to the formation of the International Corporate Identity Group (ICIG)
which moved away from developing a corporate identity definition in favour of a broader view
referred to as the ‘Strathclyde Statement’ (Van Riel and Balmer, 1997). This statement looks to
capture and articulate the multidisciplinary nature of the construct which definitions are arguably
unable to do (Van Riel and Balmer, 1997) via the corporate identity mix’s tenets of
communications, symbolism and behaviour as part of an interdisciplinary school (Van Riel and
Balmer, 1997) . The Interdisciplinary School will now be reviewed in the context of two approaches
that have used to structure the corporate identity literature.
Van Riel and Balmer (1997) identified three paradigms which have helped to structure the
corporate identity literature (Figure 4).
Corporate Identity
School / Paradigms
Graphic D
esign Paradigm
Integrated C
omm
unications Paradigm
Interdisciplinary Paradigm
Logos, nomenclature, typeface etc Consistency of communications
Behaviour, communication and
symbolism
Figure 4 Corporate Identity Schools (Van Riel and Balmer, 1997)
The ‘graphic design’ paradigm, which focuses on organisational nomenclature, company
name, logos, trademarks and so forth (Margulies, 1977, Carter, 1982, Olins, 1989, Bernstein, 1986,

48
Ind, 1990, Pilditch, 1970) focuses on identity structures (Hatch and Schultz, 2000) that help
organisations’ present elements of their identity as a separate line or business. For example, several
authors (Melewar et al., 2005b; Melewar et al., 2005c; Olins, 1989, 1995; Van Riel, 1995) refer to
monolithic identity where the organisation consistently uses its name and style across the
organisation (e.g. Virgin); endorsed identity where the brand is associated with subsidiaries (e.g.
Holiday Inn Crowne Plaza, Holiday Inn Express); and branded identity where product are
differentially branded (e.g. Pantene and Wella at the Procter and Gamble Corporation). However,
Olins (1979) noted this categorisation is more widely reflected in the literature than organisational
reality whilst Balmer (2001a) regarded such a system as being too simple to capture the complexity
of subsidiary relationships.
The second and third paradigms within Van Riel and Balmer’s (1997) conceptualisation
relate to the integrated communications and interdisciplinary paradigms respectively. The
‘integrated communication’ paradigm is concerned with consistency in formal brand
communication and execution (Bernstein, 1986; Schultz et al., 1994). The ‘interdisciplinary’
paradigm (Abratt, 1989; Balmer, 1995, 1998; Birkigt and Stadler, 1986; Olins, 1978a; Van Riel,
1995) focuses on “marshalling” the corporate identity mix (Birkigt and Stadler, 1986). The
corporate identity mix reveals corporate identity via its three tenets of behaviour, communication
and symbolism to both internal and external audiences. Behaviour relates to the organisation’s or,
more accurately, its employees’ actions, communication concerns verbal or visual messages whilst
symbolism relates to visual cues that indicate what the brand wishes to stand for (Van Riel, 1995).
Within the interdisciplinary school there is an increasing awareness that an organisation’s unique
characteristics are grounded in its employees behaviour (Van Riel and Balmer, 1997). Indeed, Van

49
Riel and Balmer (1997) emphasise the multidisciplinary nature of this schools work via the
“Strathclyde Statement” which advocates marshalling the corporate identity mix as discussed above.
Consequently, at this early stage, the interdisciplinary school may be particularly relevant to this
service brand research given its explicit consideration of behaviour, symbolism and communication.
The reason being these three tenets were also salient to the corporate branding literature (cf:
Einwiller and Will, 2002) which itself is pervasive at service brands (Aaker and Joachimsthaler,
2000; Berry, 2000; Berry et al., 1988; de Chernatony, 2001; Diefenbach, 1987; Pina et al., 2006).
The interdisciplinary school also places importance on stakeholder communication which, as
previously outlined, is particularly important at service brands.
In an alternative framing of the literature, Balmer (1995) identified seven corporate identity
schools of thought Figure 5.
Balm
er (1995)
Strategic Visual
School
Visual
Behavioural School
Strategic C
omm
unications School
Design as Fashion
School
Corporate
Com
munications
School
Strategic School
Behavioural School
Strategic change via visual means
Communicate organisation's culture visually
Communicate organisations mission and philosophy visually
Keep visual cues modern
Enact mission / philosophy via formal corporate communications
Focus on corporate mission and philosophy
Nurture distinctive culture
Figure 5 Corporate Identity Schools (Balmer, 1995)
The four ‘design’ or ‘visual’ schools comprise of the ‘strategic visual’ school where strategic
change is driven visually; the ‘visual behaviour’ school where visual communications concentrate

50
on the organisation’s distinct culture; the ‘strategic communications’ school which visualises the
organisation’s mission and vision (and so seems very similar to the communications school) and the
‘design as fashion’ school where visual elements of identity are kept contemporary and fashionable.
The ‘corporate communications’ school concentrates on enacting mission and vision via formal
corporate communications, the ‘strategic’ school considers identity as being linked with articulating
the organisation’s central idea, mission and philosophy (Fombrun, 1996; Olins, 1989, 1995; Van
Riel, 1995). Finally, the ‘behavioural’ school places an emphasis on developing a distinctive
organisational culture as part of identity.
Whilst the above scholars’ taxonomies (Balmer, 1995; Van Riel and Balmer, 1997) help to
structure the corporate identity literature, in many respects they could be regarded as overlapping
and indeed providing support for the interdisciplinary paradigm (Figure 6).

51
Balm
er (1995)
Strategic Visual
School
Visual
Behavioural School
Strategic C
omm
unications School
Design as Fashion
School
Corporate
Com
munications
School
Strategic School
Behavioural School
Strategic change via visual means
Communicate organisation's culture visually
Communicate organisations mission and philosophy visually
Keep visual cues modern
Enact mission / philosophy via formal corporate communications
Focus on corporate mission and philosophy
Nurture distinctive culture
Van R
iel & B
lamer
(1997)
Graphic D
esign Paradigm
Integrated C
omm
unications Paradigm
Interdisciplinary Paradigm
Logos, nomenclature, typeface etc Consistency of communications
Behaviour, Communication Symbolism
Figure 6 Overlap and Integration of Corporate Identity Schools of Thought.
Figure 6 outlines how Balmer’s (1995) Visual Schools are similar to the Graphic Paradigm (Van
Riel and Balmer, 1997), which itself can be considered as being represented by the symbolism tenet
within the Interdisciplinary School. The Communications School (Balmer, 1995) is similar to the
Integrated Communications Paradigm (Van Riel and Balmer, 1997) which is also represented by the
Interdisciplinary Schools communications tenet (Van Riel and Balmer, 1997). Finally, the Strategic
and Behavioural Schools (Balmer, 1995), which could be considered as inextricably linked given
mission and philosophy guide culture, are reflected in the Behaviour tenet of the Interdisciplinary
School. Consequently, this argument strengthens the case for considering these scholars’ respective
schools as a function of the Interdisciplinary School. This line of thinking follows Olutayo and

52
Melewar (2007) who note how these two taxonomies in addition to the work of other scholars
(Cornelissen and Harris, 2001; He and Balmer, 2007a; Moingeon and Ramanantsoa, 1997) can be
distilled to the three tenets of the corporate identity mix that constitute the interdisciplinary school
(Van Riel and Balmer, 1997). This, Olutayo and Melewar (2007) argue is a function of the
interrelated and converging nature of these scholars’ schools of thought, paradigms and perspectives
(p. 420).
It should be noted numerous corporate identity frameworks have been developed in the
literature concerning the construct’s formation and management (Alessandri, 2001; Baker and
Balmer, 1997; Balmer, 1995, 1998; Balmer and Greyser, 2003; Balmer and Greyser, 2002;
Markwick and Fill, 1997; Melewar, 2003; Melewar and Jenkins, 2002; Melewar and
Karaosmanoglu, 2006b; Melewar et al., 2005b; Stuart, 1998, 1999; Suvatjis and de Chernatony,
2005; Van Riel, 1995; Van Riel and Balmer, 1997). However, these frameworks will not be drawn
on for two reasons. First, Melewar and Jenkins (2002) note the lack of consensus regarding defining
the corporate identity construct has only fuelled conceptual confusion. Consequently, it is contended
here greater definitional clarity is needed before subsequent corporate identity conceptual
development can proceed. Second, this thesis wishes to explore, develop and contribute to the brand,
as opposed to the corporate identity literature, in a service context. For these reasons, corporate
identity framework will not be reviewed here.

53
2.4.3. Brand Identity
Several brand marketing academics have contributed to the brand identity literature (Aaker,
1996a; Aaker and Joachimsthaler, 2000; de Chernatony, 2001, 2006; Kapferer, 1997, 2004) whose
conceptual frameworks will be reviewed later in this chapter (Section 2.5). However, it is important
to consider how these authors’ define brand identity for several reasons. Primarily, these authors’
definitions will be drawn on to provide a theoretical grounding for developing a preliminary,
literature-based service brand identity definition. Furthermore, developing such a literature-based
definition provides a starting point for specifying the domain of the construct (Churchill, 1979) and
subsequent scale development procedures (Netemeyer et al., 2003). Finally, the literature-based
definition will then be augmented later in this thesis once service brand identity dimensionality has
been empirically established to provide a specific service brand identity definition (Chapter 6). For
these reasons current brand identity definitions will be reviewed.
Drawing on the of work of Hatch and Shultz (2000), de Chernatony (2006), considers brand
identity as “the distinctive or central idea of a brand and how the brand communicates this idea to its
stakeholders” (p. 45). By considering stakeholders, de Chernatony’s (2006) work has the benefit of
taking a strategic perspective and being particularly relevant to service brands. However, this
definition bears some resemblance to Hatch and Shultz’s (2000) corporate identity definition
(Section 2.4.2) which itself is problematic given has been predominantly informed by visual identity
scholars such as Margulies (1977) and Olins (1989, 1995). As subsequent sections will highlight
brand identity encompasses more than visual identity.

54
When considering brand identity Kapferer (2004) defines the construct as “specifying the
facets of the brands’ uniqueness and value” (p. 95). Whilst this definition encourages brand
marketers to think about developing a distinctive brand identity, what constitutes ‘uniqueness’ or
‘value’ could be considered somewhat abstract. Arguably, this results in a definition that is
challenging to understand.
Aaker (1996a) regards brand identity as “…what the organisation wants the brand to stand
for in the customer’s mind” (p. 25) or “how strategists want the brand to be perceived” (p. 71).
Aaker’s (1996a) work raises several points. First, brand identity emanates from the ‘organisation’.
It is not a consumer or client side construct (cf: brand image). Second, within the organisation, the
“strategist” plays a pivotal brand identity role. Whilst it is not entirely clear who this person is, one
would assume the strategist holds a senior position within the organisation such as the Marketing
Director or Marketing Vice President. However, it is not inconceivable the strategist is the Chief
Executive Officer or Managing Director. The reason being this individual is ultimately responsible
for executing organisational strategy of which brand identity plays a crucial part. Third, brand
identity is visionary or more colloquially as the “dream it [i.e. the brand] wants to sell” (Roy and
Banerjee, 2007: 142). Considering the construct as visionary is consistent with scholars such as
Alsem and Kostelijik (2008) and de Chernatony (2006). Similarly, Joachimsthaler and Aaker
(2000) regard brand identity as the “vision of how that brand should be perceived by its target
audience” (p. 27) or more succinctly as “….what the organisation wants the brand to stand for” (p.
40). This implies the company should make its own choice for what it wants to stand for (Alsem and
Kostelijik, 2008). However, several issues materialise from Aaker and Joachimsthaler’s (2000)
definition. For example, these authors refer to a “vision” but do not elaborate on whose vision this

55
actually is. This is a benefit of Aaker’s (1996a) work insofar the vision lies with the “strategist”.
Furthermore, it may be more appropriate to define brand identity in the context of stakeholders and
not a target audience. The latter implies a myopic concern for a specific target market as opposed to
a broader range of groups the organisation should actively engage with. Expanding the scope of the
construct’s definition in this way overcomes a limitation of Aaker’s (1996a) work which also
appears to be customer centric. Adopting this logic is consistent with the literature review (Section
2.2.2) which outlined how for corporate brands, which are especially pervasive in the service sector
(Aaker and Joachimsthaler, 2000; Agarwal, 2004; Berry, 2000; Berry et al., 1988; de Chernatony,
2006; Diefenbach, 1987; Pina et al., 2006), considering multiple stakeholders is particularly
important (Balmer and Greyser, 2003, Hulberg, 2006, Ind, 1997, Muzellec, 2006, Hallawell, 1999,
Balmer, 2001a, King, 1991).
In line with other scholars (de Chernatony, 2006; Kapferer, 2004), Keller and Kotler (2008)
make the distinction between brand identity and brand image:
“Identity is the way a company aims to identify or position itself or its product. Image is the
way the public actually perceives them. For the right image to be established in the minds of
consumers, the marketer must convey brand identity through every available communication
vehicle and brand contact. Identity should be diffused in ads, annual reports, brochures,
catalogs, packaging, company stationery, and business cards. If "IBM means service," this
message must be expressed in symbols, colors and slogans, atmosphere, events, and
employee behavior.” (p. 288)

56
This view echoes Keller (2003) who notes “an image is how you are perceived, and an
identity is how you aspire to be perceived” (p. 763). Hence, it can be seen how Keller (2003) and
Keller and Kotler’s (2006a) work not only helps demarcate the construct but clearly aligns with
other scholars where brand identity is considered as emanating from the organisation (Aaker, 1996a;
Aaker and Joachimsthaler, 2000; de Chernatony, 2006; Kapferer, 2004). This is consistent with the
position that identity is an organisational “input” (de Chernatony, 2006).
When brand identity is considered as an input, scholars such Taveira de Barros and Martins
(2007) have criticised these authors’ work on the grounds that it is introspectively conceived.
However, as will be outlined later (Section 2.5), authors such as Kapferer (2004) and de Chernatony
(2006) regard relationships as a dimension of brand identity whilst those that do not, such as Aaker
(1996a) and Aaker and Joachimsthaler (2000), note how relationships play an important role in the
brand identity building process. Subsequently, it is debatable if a relationship can be developed
without a concern for the external party the brand wishes to engage in a relationship with. In order
for a ‘relationship’ to exist both parties need to be cognisant of and respond to the others’ needs’ or
it will inevitably disintegrate. Consequently, whilst brand identity emanates from the organisation it
is questionable if any brand identity scholars thought of brand identity in such an inward looking
way. Second, if organisations did not have a vision for their brand’s identity that was guided by a
strong internal conviction it is conceivable that all brand identities in a given market would be
variations on the same theme. The reason being such organisations would be following the same
strategy of strictly following customers’ needs. This, potentially, results in a circular logic where a
key objective of brand identity building to facilitate differentiation may not actually be achieved.

57
Based on the above, Aaker (1996a) and Aaker and Joachimsthaler’s (2000) work was
considered a particularly useful starting point for developing a preliminary service brand identity
definition. This logic was primarily guided by the clear, concise and unambiguous language these
scholars use which helps specify the ‘domain’ of the construct (Churchill, 1979). Furthermore,
Aaker’s (1996a) work provides some sampling frame guidance in the form of the brand “strategist”,
who one could reasonably assume to be a senior marketer. Consequently, guided by this rationale
and these authors’ work, service brand identity is preliminarily defined as:
The strategist’s vision of how a service brand should be perceived by its stakeholders.
This definition represents an initial step towards developing a service brand identity
definition. However, this literature-based definition should be considered as a theoretical starting
point for defining service brand identity which will be augmented to incorporate the construct’s
dimensions once they have been revealed after data analysis (Chapter 5).

58
2.4.4. Brand identity, Corporate Identity and Corporate Branding – Distinct but
Related Constructs.
The previous sections reviewed the organisational, corporate and brand identity literature to
make the distinction between these constructs. This section will now provide the logic for
considering brand identity, corporate identity and corporate branding as distinct but related
constructs. Figure 7 conceptualises this section’s discussion.
Figure 7 Conceptualising Brand Identity, Corporate Identity and Corporate Branding *With tenets of behaviour, symbolism & communications
First, the relationship between brand identity and corporate identity will be considered. The
brand identity literature highlighted how this construct is concerned with the strategist’s vision for
how they want the brand to be perceived by its stakeholders (cf: Aaker, 1996a; Aaker and
Joachimsthaler, 2000). Hence, brand identity relates to the conceptualisation of brand identity and
is psychologically focused. Furthermore, the unit of analysis is a person (i.e. the strategist) as
opposed to an organisation which is the case for corporate identity and corporate branding. It is
Construct Relation to Brand identity
Corporate Identity*
Operationalisation of…
Corporate Branding Manifestation of…
Brand Identity Conceptualisation of…

59
suggested here that corporate identity provides some, but not all of the ‘apparatus’ or ‘tools’ for
operationalising the strategist’s vision for how they want the brand to be perceived by its
stakeholders. In the context of corporate and brand identity this is achieved via the tenets of the
interdisciplinary school which are behaviour, symbolism and communications. This position is
consistent with He and Mukherjee (2009b) who note how corporate identity is the staring point for
developing the corporate brand (in addition to an organisation’s reputation). However, as will be
highlighted in the next chapter, whilst these tenets help operationalise brand identity, they are not
the only ways in which brand identity is made more tangible with brand personality and the
management of client relationships providing relevant examples. This shares the author’s view on
why brand identity and corporate identity can be considered distinct but related constructs.
In terms of corporate identity and corporate branding, Balmer and Greyser (2003) make
several useful distinctions. Firstly, corporate branding has more of an external focus and aims to
achieve profile vis-à-vis identity. Second, corporate brands can be financially valued / amortised in a
way corporate identity cannot. For example in 2002, Coca Cola’s brand accounted for 61% of the
organisation’s market capitalisation (Hatch and Rubin, 2006). Finally, corporate identity helps
underpin corporate branding (Balmer, 1995) insofar that corporate branding is a way of manifesting
corporate identity (Balmer and Greyser, 2003). For these reasons corporate identity is considered an
antecedent of corporate branding.
To summarise, brand identity is made manifest via corporate branding with the latter being
facilitated by, amongst other constructs (as will be highlighted in the next chapter), the tenets of
corporate identity. If brand identity was not made manifest in this way it would remain merely a

60
psychological or cognitive construct within the strategist’s mind given its focus on the strategists’
vision.
2.4.5. Brand Identity – An Identity Orphan?
Earlier sections in this chapter made the distinction between organisational, corporate and
brand identity. This section develops the literature from the theoretical perspective to highlight how
brand identity is something of an identity orphan without a theoretical home.
Balmer and Greyser (2003) outline how the disciplinary roots of identity originate from three
main areas: marketing / corporate communications (Abratt, 1989; Balmer, 1998; Cheney and
Christensen, 1999; Van Riel, 1995; Van Riel and Balmer, 1997), organisational behaviour (Albert
and Whetten, 1985; Ashford and Mael, 1996; Dutton and Dukerich, 1991; Hatch and Schultz, 1997)
and graphic design (Napoles, 1988; Olins, 1995; Pilditch, 1970). Hatch and Schultz (2000)
develop this point further by noting how organisational identity has primarily been influenced by
organisational studies (Dutton and Dukerich, 1991, Dutton et al., 1994, Gioia and Thomas, 1996,
Gioia et al., 1998, Albert and Whetten, 1985) , corporate identity by marketing literature and
consultants / practitioners (Abratt, 1989; Balmer, 1998; Bernstein, 1986; Olins, 1989; Van Riel and
Balmer, 1997) whilst the fields of strategy (Gray and Smeltzer, 1985) and communication (Cheney
and Christensen, 1999, Markwick and Fill, 1997) have contributed to both. More recently Balmer
(2008) notes how the marketing and organisational behaviour literatures have played a particularly
important role in developing the corporate identity literature.

61
Intriguingly, given marketing’s input into the corporate identity literature, the brand identity
literature (Aaker, 1996a; Aaker and Joachimsthaler, 2000; de Chernatony, 2006; Kapferer, 1997,
2004) receives at best little, if no reference, within the corporate identity literature. Furthermore, the
development of brand identity schools of thought has not occurred. Consequently, brand identity can
be regarded as being something of an identity orphan in terms of the broader identity literature given
it tends to be somewhat isolated and does not have a theoretical home. This is problematic given it is
important academic research adopts a theoretical perspective that informs subsequent theorising and
academic research. In response to this issue, two academic opportunities arise. First, brand identity
schools of thought could be developed. Second, the marketing roots of corporate identity could be
drawn on to identify a school which has relevance to this service brand identity research. In this
sense, a corporate identity school could act as a proxy for a service brand identity school given the
former’s relevance to this service brand identity research. As of yet, the brand identity literature
appears to be insufficiently developed to form schools of thought given the limited research that has
taken place in this area. Consequently, this thesis will adopt the second approach with the rationale
being discussed next.
2.4.6. Finding a Theoretical Home for the Brand Identity Orphan
In the absence of brand identity schools of thought, this section provides the logic for this
thesis aligning with the corporate identity literature’s interdisciplinary school and proceeds as
follows. Initially, the shortcomings of aligning with certain schools as outlined in Balmer’s (1995)
and Van Riel and Balmer’s (1997) taxonomies will be outlined which simultaneously provides the
logic for aligning with the interdisciplinary school. The section closes by noting how

62
interdisciplinary school alignment does not necessarily negate the importance of organisational
identity in the context of service brand identity research. The reason being this literature stream
feeds into the development of this thesis’ service brand identity conceptualisation via the
interdisciplinary schools behavioural tenet.
Balmer (1995) presented seven schools of thought (Figure 5) whose suitability as a
theoretical home for brand identity will now be considered. Firstly, the management of visual
imagery or graphics can be regarded as part of, but not the complete representation of identity
(Balmer and Greyser, 2003; Olins, 1978a). Whilst symbolism helps make intangible brand promises
more concrete (Berry, 2000; Keller, 2003), the communication of symbols or visual imagery alone
does not make an organisation more effective (Grunig, 1993). This point is of amplified importance
given this thesis’ service focus and central role employees’ play in such industries (Ashford and
Mael, 1996; Balmer, 1995, 1998; Balmer and Greyser, 2003; Balmer and Greyser, 2006; Berry and
Seltman, 2007; Brodie et al., 2009; Burmann and Zeplin, 2005; de Chernatony and Cottam, 2008; de
Chernatony and Segal-Horn, 2004; Harris and de Chernatony, 2001; Hulberg, 2006; Kennedy, 1977;
Vallaster and de Chernatony, 2006). The reason being service brand employees mediate the brands
values at the service encounter (Bostrom and Isberg, 2009). Consequently, this limits the utility of
focusing purely on the visual / design school in the context of service based research.
Whilst communicating with both internal and external stakeholders plays a critical role in
executing brand identity, it is contended here that utilising communication in isolation is inadequate
for building service brand identity. In a similar manner to the visual school, the importance of this

63
point is amplified in the service sector give this school fails to account crucial role human play at
service brands. Consequently, this limits the utility of aligning with a communications school.
Finally, the behavioural school (culture) can be regarded as a function of the strategic school
(vision, mission and philosophy). Whilst factors such as advertising, leadership, office location,
social responsibility programs and so forth mobilise, support or help reinforce the vision, mission
and philosophy of an organisation, these three constructs will both inform, and to a large extent (but
not entirely), be enacted by organisational culture (behaviour). Consequently, a more informed
approach may be to consider these two schools as one given they appear to be inextricably linked
(cf: Section 2.4.2). Whilst it is clear from the literature behaviour plays a central role in service
brand delivery, it is contended here that brand consistent behaviour alone will not facilitate informed
service brand identity building. The reason being symbolism, communication and other activities
that will be outlined in the next chapter need to be considered as part of a holistic service brand
identity building process.
In terms of Van Riel and Balmer’s (1997) taxonomy, the utility of the graphic and integrated
communications paradigms can be questioned on the above grounds. However, by drawing on
behaviour, symbolism and communication the interdisciplinary school appears to be particularly
appropriate for this service based research. Behaviour is critical for service brands given the role
employees play in enacting the brand. Communication needs to occur with a variety of brand
stakeholders in order to allow brand identity to be more than a psychological construct whilst
symbolism helps tangibalise the otherwise largely intangible brand promise service organisations
make. Adopting this interdisciplinary position is consistent with numerous other marketing scholars

64
(Abratt, 1989; Balmer, 2001a; Balmer and Greyser, 2003; Hatch and Schultz, 2000; Markwick and
Fill, 1997; Melewar et al., 2006; Van Riel and Balmer, 1997) who see corporate identity research
being multidisciplinary in nature as not just as being concerned with visual imagery alone.
Interestingly, other branding scholars such as Keller and Richey (2006) when developing a view on
corporate brand personality have also noticed parallels between their work and dimensions of the
Corporate Identity Mix.
Whilst the above provides this thesis’ logic for aligning with the corporate identity
literature’s interdisciplinary school, the role organisational identity plays in making service brand
identity manifest should not be understated. The reason being employee identification is a
behavioural precursor. In other words, the extent to which organisational members’ identify with
their employing organisation will influence the (brand) behaviour customer’s experience (Stuart,
2003). Consequently, it is critical service-based brand identity research is cognisant of this internal
context and so the organisational studies literature given organisational members influence external
stakeholders’ perceptions (Ambler, 2003; Chandon et al., 1997; Dowling, 1986; Grunig, 1993;
Heskett et al., 1997; Kennedy, 1977; Zeithaml and Bitner, 1996). This position appears to be
finding more recent support in the corporate identity literature. For instance, scholars such as He and
Mukherjee (2009b) argue organisational identification, which plays a central role in organisational
identity, acts as an antecedent to behaviours such as loyalty and commitment. Similarly, Balmer
(2008) notes “it would appear that a consensus is gradually emerging that both traditions (including
reference to the concepts of corporate identity and organisational identity) are complementary and ,
therefore mutually enriching” (p. 881). Consequently, these scholars’ views reiterate the position
that organisational and corporate identity are connected (Stuart, 2003). The logic for adopting this

65
combined position can be grounded in the view that the more employees identify with an
organisation the more likely they are to show a supportive attitude towards it (Mael and Ashford,
1992) and so make decisions consistent with the organisation’s objectives (Littlejohn, 1993). As a
result of adopting this perspective an organisational and corporate identity dichotomy may be
somewhat diluted where organisational identity becomes an integral element, or antecedent, of
corporate identity via the behavioural tenet of the interdisciplinary school. Figure 8 conceptualises
this.
Figure 8 Reconceptualising the Corporate, Organisational and Brand Identity Literature
Once more, the point should be reiterated that whilst the tenets of the interdisciplinary school
help operationalise service brand identity (cf: Section 2.4.4) they are not the only dimensions that
make the construct manifest as will be highlighted later in this research. Developing such an
amalgamated line of thought is consistent with other scholars (Cornelissen et al., 2007; Hatch and
Schultz, 1997; 2000) who regard the organisational and corporate identity (and in the case of
Cornelissen et al, 2007a organisational and social identity) boundaries as becoming increasingly
blurred, overlapping or interconnected. It is also interesting to note that similar cross disciplinary

66
developments appear to be taking root within the brand identity literature. For example, Burmann
and Zeplin (2005) regard employee identification with the brand as an essential prerequisite for
consistent and supportive brand identity behaviour. Consequently, such developments echo Baker’s
(1999) view where marketing draws on a range of other disciplines such as economics, sociology,
psychology and strategy to name a few to develop a body of marketing knowledge. Hence, it this
section has outlined, how in the absence of theoretical schools of thought being developed within
the brand identity literature, for now, the Interdisciplinary School provides a suitable proxy in order
to guide subsequent, more theoretically orientated service brand identity research which is
interdisciplinary in nature.
2.5. Models of Brand Identity
The previous sections of this chapter have reviewed three main ‘types’ of identity in detail in
order to see through the proverbial fog and develop a preliminary service brand identity definition.
The relevance of the Interdisciplinary School as a proxy theoretical home for the brand identity
orphan was also noted. This thesis will now focus on brand identity by introducing and evaluating
related frameworks that have been published in the literature. The objective of this section is to
explore theoretical dimensions of brand identity which can be incorporated into the theoretical
framework developed in the next chapter and highlight why current frameworks could not be
holistically operationalised in this research. Practitioner based models such as Upshaw’s (1995)
work will not be reviewed in detail as they tend not to be subject to rigour of theoretical models.

67
2.5.1. Kapferer’s (2004) Hexagonal Identity Prism
Kapferer’s (2004) Hexagonal Identity Prism model conceptualises brand identity along six facets.
These are physique, personality, relationships, culture, self image and reflection, Figure 9.
Figure 9 Hexagonal Identity Prism Model (Kapferer, 2004)
Physique relates to the concrete, tangible or objective features of the brand encompassing
product features, symbols and attributes. These are considered the basic purpose of the brand in
terms of what the brand is, what it does and how it looks. Whilst not explicit in Kapferer’s (2004)
work it is not unreasonable to interpret physique as having service branding applicability. For
example, the minimal offices, table football, computer consoles and so forth contribute to the
creative and artistic brand identity many advertising agencies wish to build. This position is
consistent with scholars such as Dowling (1994) who regard physical cues such as premises,
architecture, location, interior décor and so forth as contributing to the organisation’s visual identity.

68
Personality considers how brands can be ‘humanised’ through ‘traits’ and so reveals the
brand’s character and attitude in a more emotionally orientated manner. Developing brand
personality entails addressing questions such as if this brand was a person what type of person
would it be. A brand may be considered rugged and masculine (Marlboro). Hence, this facet of
Kapferer’s (2004) model draws heavily on Aaker’s (1997) seminal brand personality work. Culture
relates to the fundamental values the brand and / or organisation stand for in addition to the norms
that guide employees’ behaviour to facilitate brand identity building. Considering identity in terms
of a relationship takes a brand beyond a purely functional domain given that emotions are an
intricate part of any relationship. A relationship could be characterised as caring e.g. Fairy or as
providing status e.g. American Express. Reflection, relates to the brand being an instrument for the
individual to make a statement about their actual or desired self (cf: Sirgy, 1982). Consequently,
marketing communications reflecting the brand being used by a certain type of individual in a
certain way plays a particularly important role. The reason being such communications allow
customers to imagine themselves using the good or service in a particular way or at a particular
time. Self image relates to how the brand is viewed introspectively by the customer in terms of a
personal brand evaluation.
As Figure 9 highlights, Kapferer’s (2004) model considers the six brand identity facets from
four perspectives. First, the sender and receiver of brand identity. Second, an internal and external
perspective. Physical appearance and personality are controlled by the sender whilst consumer
reflection and self-image are concerned with the receiver. Culture and relationships link the sender
and the recipient and so in this sense act as a common denominator between the brand (the sender)
and the consumer (the receiver). In terms of internalisation and externalisation, elements to the left

69
of the model such as physical appearance, relationship and consumer reflection are social, provide
brand with a form of external expression and are visible. Conversely, the facets to the right, that is,
personality, culture and consumer self-image are connected with the inside of a brand and its ‘soul’.
2.5.2. Aaker’s (1996) Brand Identity Planning System
To provide structure to an organisation’s brand identity building efforts Aaker (1996a)
advances a Brand Identity Planning Model (Figure 10)
Figure 10 Brand Identity Planning Model (Aaker, 1996a)
Aaker’s (1996a) model advocates brand strategists consider brand from four perspectives.
These are brand as a product, an organisation, a person and a symbol. By considering each of these
four perspectives, Aaker (1996a) argues this approach helps brand strategists consider different
brand elements which clarify, distinguish and add depth to a brand identity.

70
The brand as a product perspective concerns developing brand associations within a specific
product class (Oracle and database software). Aaker (1996a) outlines how the important point is not
for a brand to be recalled when a brand in a class is mentioned but for customers to recall a brand
when there is a need in relation to a given product class. The brand as an organisation perspective
focuses on organisational attributes or associations (e.g. 3M and innovation, Body Shop and ethics)
instead of a specific good or service. Aaker (1996a) considered the organisational perspective
particularly important given it is more durable and resilient to competitive threats. Through the
brand as a person perspective, Aaker (1996a) suggests brands can embody a more human form by
displaying traits such as being ‘entrepreneurial’ (Skype) with the outcome being a richer and more
interesting brand than if just a product perspective was employed. Aaker (1996a) develops this
point noting how brand personality facilitates building stronger brands in three ways. He argues
personality helps consumers express their own personalities, provides a foundation for customer-
brand relationships whilst enabling a brand convey product attributes which contributes a functional
brand benefit. The final perspective of Aaker’s (1996a) model concerns the brand as a symbol
which helps, at a glance, stimulate brand associations that other brand marketing activities have
looked to induce (the Michelin Man suggests a tire with strength, durability and energy). Aaker
(1996a) contends symbols that capitalise on visual imagery, metaphors and brand heritage play a
particularly important role in driving brand awareness as part of an overall equity building effort. It
should be noted that when utilising the model, Aaker (1996a) advocates organisations consider all
four perspectives but only use those which are helpful in terms of articulating the brand in the
consumer’s mind. In the case of service brands, the product dimension is a potential candidate for
consideration but not for explicit inclusion.

71
Aaker’s (1996a) model also encompasses a core and an extended brand identity. The core
identity encapsulates the timeless brand essence which is built and sustained over time. It is pivotal
to both the central meaning and success of the brand whilst developing associations that are likely to
remain constant if the brand moves into new products and / or markets. The extended identity
includes elements that provide texture and completeness to the core identity by adding details that
help reveal what the brand stands for.
2.5.3. Aaker and Joachimsthaler’s (2000) Brand Leadership Model
Aaker and Joachimsthaler’s (2000) Band Leadership Model augments Aaker’s (1996) work
via the inclusion of brand essence and elaboration of brand identity. Firstly, at the heart of the core
and extended identity, the brand essence should be considered as “a compact summary of what the
brand stands for” (Aaker and Joachimsthaler, 2000; 40) or “a single thought that captures the soul of
the organisation.” (p. 45). The brand essence looks to communicate the brand’s identity in a
compact and inspiring way (Kotler and Keller, 2008).
The objective of brand identity elaboration is to provide the identity with greater clarity and
distinctiveness whilst reducing the ambiguity, brevity or “terseness” (Aaker and Joachimsthaler,
2000: 65). Elaborating the brand identity consists of several activities which are informed by an
identity audit. As part of brand identity elaboration, the brand strategist needs to identify internal
and external brand identity role models to communicate the identity to their respective audiences.
From an internal perspective, this individual must have visibility of, and authority to influence brand
related-decisions within the organisation. In essence, this individual becomes a brand identity

72
champion who promotes and drives brand identity-related initiatives forward. Externally, role
models whose personalities align with the desired brand identity need to be identified so
associations, consistent with the desired brand identity, can be created in consumers’ minds. Brands
frequently employ actors or sports celebrities to transmit the brand identity in this way. The use of
metaphors to make the identity a more distinctive and striking also facilitates elaboration of the
brand identity. This practice is particularly notable in the financial services sector where
organisations such as Citi Group use an umbrella as a metaphor for protection and security. Aaker
and Joachimsthaler (2000) also outline how it is important to prioritise the brand identity elements
which will be central to brand positioning. This activity provides focus and direction to the brand
building effort.

73
Positioning (functional
values)
Presentation Personality
(emotional values)
Vision / Culture
Relationships • Staff to staff • Staff to customers • Staff to other stakeholders
2.5.4. de Chernatony’s (2006) Components of Brand Identity.
Building on earlier work (de Chernatony, 1999) de Chernatony (2006) proposes a model for
considering components of brand identity (Figure 11).
Figure 11 Components of Brand Identity (de Chernatony, 2006)
Working from the centre of the model out, at the heart of any brand is a vision which
provides the brand with strategic direction and guidance. For this vision to be realised, a culture that
supports brand consistent behaviour needs to be developed. Such a culture requires staff who
believe in the brand’s values in addition to managers that hold congruent views concerning market
characteristics and so how their brand should be developed within it. The next stage is for the brand

74
to become more tangible via its positioning and personality. In this model, positioning is concerned
with manifesting functional values whilst personality relates to making emotional values more
animate. To support the positioning, personality and vision / culture, staff need to have a clear
understanding of, and manage their relationships with, colleagues, customers and other stakeholders
in order to enact the brand’s values in a manner congruent with the desired brand identity. The
result of considering these dimensions which manifest in a unified form of internal behaviour is the
effective and consistent presentation of the brand which “differentiates the brand in a manner which
stakeholders welcome.” (de Chernatony, 2006: 46).
2.5.5. Frameworks of Brand Identity – Critical Evaluation
The previous section of this chapter reviewed grounded brand identity frameworks. These
frameworks have helped the research community develop a formative understanding of what brand
identity is whilst providing a valuable platform for subsequent research. However, they were not the
subject of this research for several reasons.
Primarily, although only a small number of frameworks have been developed, an eclectic
range of dimensions have been advanced in the literature. Whilst this makes explicit the
multidimensional nature of the construct it also makes developing a common understanding of what
constitutes brand identity challenging. For example, Aaker (1996a) does not consider ‘relationships’
or ‘culture’ whilst for de Chernatony (2006) and Kapferer (2004) they are both key. This issue is

75
compounded by the conceptual nature of these frameworks which makes it difficult to determine
which scholars’ work is the most plausible and so warrants subsequent empirical research.
From a scale development perspective, the current frameworks are problematic. For instance,
it could be argued some frameworks, such as Kapferer’s (2004) identity prism, are too abstract to be
operationalised. More specially, it is unclear how some dimensions such as ‘product’ or
‘organisation’ (Aaker, 1996a) could be scaled given they are so broadly conceived. Also, it is
debatable if some dimensions such as ‘elaboration of brand identity’ (Aaker and Joachimsthaler,
2000) or ‘presentation’ (de Chernatony, 2006) are activities or constructs with the former being
unsuitable for scaling. This presents the academic community with the challenge of how to scale
such frameworks and so prevents researchers from applying scales in order to address questions
such as: does brand identity drive performance? If so, which dimensions of brand identity are
particularly important in driving performance or do they play a relatively equal role?
The logic underpinning some frameworks is also open to discussion. For example, Kapferer
(2004) considers self image and reflection facets of brand identity. However, these consumer based
constructs seem to be at odds with the consensus of opinion that brand identity is an input (cf: de
Chernatony, 2006).
Finally, these frameworks appear to have been generically conceived. For example, several
scholars have noted how service and goods marketing are different (Berry, 1980; Kim et al., 2003a;
Low and Lamb, 2000). Whilst de Chernatony (2006) and Aaker’s (1996) work may have some
service brand applicability as they account for internal stakeholders and the organisation / symbol

76
respectively these frameworks, in their entirety, do not account for the distinctive challenges service
branding brings where human resource plays a pivotal role (Ashford and Mael, 1996; Balmer, 1995,
1998; Balmer and Greyser, 2003; Balmer and Greyser, 2006; Berry and Seltman, 2007; Brodie et
al., 2009; Burmann and Zeplin, 2005; de Chernatony and Cottam, 2008; de Chernatony and Segal-
Horn, 2004; Harris and de Chernatony, 2001; Hulberg, 2006; Kennedy, 1977; Vallaster and de
Chernatony, 2006).
Current frameworks are not cognisant of a B2B context. As a direct result their applicability
in B2B markets, which present unique marketing challenges (Kotler and Pfoertsch, 2006b), remains
unclear.
For these reasons it was considered more appropriate to build on these scholars’ conceptual
thinking to develop the domain of service brand identity as opposed to operationalising one of their
frameworks in isolation.
2.5.6. Brand Identity in the B2B Literature
In the B2B literature embryonic brand identity research is starting to emerge (Beverland et
al., 2007a; Beverland et al., 2007b). For instance, Beverland et al. (2007a) draw on Aaker and
Joachimsthaler’s (2000) Global Brand Leadership Framework to postulate an Industrial Global
Brand Leadership Framework which is intermittently referred to as brand identity. These scholars

77
contend brand identity is built around five capabilities. These are relational support, coordinating
network players, leveraging brand architecture, adding value and quantifying the intangible.
Underpinning these capabilities were the five organisational level capabilities termed
entrepreneurial, reflexive, innovative, brand supportive dominant logic and executional abilities.
Whilst making an interesting contribution to the field these scholars’ work was not
incorporated into this research for two reasons. Primarily, brand identity was regarded as “the key
words or phrases that sum up the core values of the brand” (p. 1086). As the previous section
outlined, considering brand identity merely in terms of words or phrases simplifies the construct’s
complexity whilst detracting from its rich and multidimensional nature. Articulating brand identity
in this way also makes the logic underpinning the authors subsequent construct dimensionality
questionable. The reason being the proposed dimensionality extends beyond the parameters of the
definition provided (cf; Churchill, 1979). Second, Beverland et al. (2007), on numerous occasions
(p. 1083; 1085; 1088) amalgamate brand identity and positioning or refer to the constructs
interchangeably. As noted earlier these two constructs although related are theoretically distinct (cf;
Kapferer, 2004).
In subsequent work, Beverland et al’s (2007b) refer to “identifying key attributes that
business marketers can use to build a strong brand identity” (p. 394) as the purpose of their paper.
These attributes include product, services, logistics, adaptation and advice which are referred to as
the “basis” (p. 395), “forms” (P. 397) or “pillars” (p. 397) of brand identity. However, it is
contended such an approach confuses brand identity building and brand positioning. The reason
being these scholars do not consider building brand identity (the means) per se but the positioning

78
(the ends) of brands around product benefits, levels of service or by being adaptive and providing
advice. Indeed, unlike the frameworks outlined above (Section 2.5), advice on how to realise these
“forms” (or more accurately execute such brand positioning strategies) of brand identity is,
unfortunately, not provided. Informed by this logic it is contended these authors are not referring to
attributes marketers’ can use to build brand identity but brand positioning options with the latter
being made manifest via the former (cf: Kapferer, 2004). For these reasons it was not considered
plausible to incorporate Beverland et al’s (2007a; 2007b) work into this research as it is regarded
terminologically inconsistent and incongruent with the view of brand identity adopted herein as
highlighted in Section 2.4.3.
2.5.7. Identity – Summary
This section of the chapter has introduced and explored organisational, corporate and brand
identity. The objective has been to see through the proverbial fog shrouding the metaphorical Tower
of Babel and so clearly articulate the type of identity which is of interest to this thesis. In order to
develop a preliminary service brand identity definition this thesis drew on the work of Aaker
(1996a) and Aaker and Joachimsthaler (2000). This helped specify the domain of the construct
(Churchill, 1979) and pave the way for subsequent scaling procedures (DeVellis, 1991; Netemeyer
et al., 2003). The relationship between brand identity, corporate identity and corporate branding
was also explored.

79
Of particular note is how the brand identity literature has yet to develop schools of thought in
the way the corporate identity literature has. The logic for aligning with the corporate identity
interdisciplinary school was then provided. Notably, this literature has been informed by marketing
scholars and consultants whilst its tenets are particularly relevant to service branding research. This
results in the interdisciplinary school potentially providing a suitable theoretical home, by proxy, for
the brand identity orphan whilst providing an interdisciplinary logic for subsequent theoretical
development in this area.
A review of the brand identity frameworks then followed. This highlighted how brand
identity is a multidimensional construct but agreement on dimensionality does not exist.
Furthermore, numerous limitations with current frameworks were noted. This provided the rationale
for this thesis extending the current literature to develop a service brand identity framework as
opposed to operationalising a given author’s work in the next chapter.
2.6. Brand Performance
The previous sections of this chapter reviewed the brand, service and identity literature. This
section considers how this thesis’ endogenous variable, brand performance, has been operationalised
in the literature. Reviewing this literature also provided theoretical guidance with regards to the
brand performance measure employed later in this research.
Brand metrics have become an area of increasing brand management interest in recent

80
years (Kim et al., 2003a; Rubinson and Pfeiffer, 2005; Schultz, 2005). Amongst others, several
factors have been cited in the literature as driving this interest. These include the need for greater
marketing accountability (Ambler, 2000a,b; Doyle, 2000; Farris et al., 2008; Rust et al., 2004a), the
desire for greater marketing boardroom ‘clout’(Ambler, 2003; Munoz and Kumar, 2004) and
credibility (Rust et al., 2004a), investor pressures (Clark, 1999), today’s cost cutting environment
will no longer accept a no measurement culture (Ambler, 2003) and a greater appreciation, that
business performance is, amongst other factors, influenced by brand performance (Aaker, 1996a; de
Chernatony, 2006; Doyle, 2000; Hoeffler and Keller, 2003b; Ittner and Larcker, 2003; Kim et al.,
2003a; Rubinson and Pfeiffer, 2005; Srivastava and Shocker, 1991).
This section of the chapter opens by reviewing approaches to brand performance
measurement along financial, customer and employee dimensions. Adopting this approach results in
the emergence of four ‘clusters’ of literature (financial focusers, customer carers, brand brokers and
balanced branders) which are then evaluated. The following section develops a theoretically
grounded brand performance measure with the rationale for excluding, and including, certain
measures being provided. This section closes by reiterating the importance of taking a balanced
approach to service brand measurement and that no single measure fully captures the depth of brand
performance (Farris et al., 2008; Lehmann et al., 2008).

81
2.6.1. Approaches to Measuring Brand Performance
Within the marketing literature, it has been noted that a universal brand performance
measure does not exist (Ambler, 2003; de Chernatony et al., 2004; Lehmann et al., 2008; Schultz,
2005). This can be regarded as a function of the environment / organisation’s strategy (Ambler,
2003; Day and Nedungadi, 1994), department (Deshpande and Webster, 1989b), market / sector
(Ambler, 2003; Oktemgil, 2003), different managerial mental models (de Chernatony et al., 1993) or
more simply because no single metric is likely to be perfect (Farris et al., 2008).
As this section outlines, a broad range of measures have been used to operationalise brand
performance. Consequently, to organise, introduce and evaluate the brand performance literature
this thesis needed to develop a framework. This framework is structured around customer, financial
and employee dimensions. The importance of a customer has been central to marketing since the
advent of the marketing concept (Kotler, 1967). Furthermore, marketing theory and practice have
become increasingly customer driven over the last 40 years (Vavra, 1997) with constructs such as
marketing) orientation becoming central to the discipline (Ambler, 2000b, 2003; Kohli and
Jaworski, 1990; Narver and Slater, 1990; Slater and Narver, 1994). Of particular interest is how
developing a market orientation has been shown to have a notable effect on the performance of
service brands (Cano et al., 2004) whilst the centrality of customers within the widely embraced
service dominant logic has amplified their importance in recent years (Vargo and Lusch, 2004a).
Several scholars have highlighted the importance of financially based brand metrics (Aaker, 1996a;
Doyle, 2000; Munoz and Kumar, 2004; Schultz, 2005, 2006) and the growing role they play in
justifying marketing expenditures (Ambler, 2003). Given the prominent role financial play at

82
organisations (Schultz, 2006) and the relevance they have to senior executives (Rubinson and
Pfeiffer, 2005) it is challenging to envisage a brand performance measure that does not incorporate
financial metrics. Finally, the corporate branding literature review revealed the pivotal role
employees play for service brands (Ashford and Mael, 1996; Balmer, 1995, 1998; Balmer and
Greyser, 2003; Balmer and Greyser, 2006; Berry and Seltman, 2007; Brodie et al., 2009; Burmann
and Zeplin, 2005; de Chernatony and Cottam, 2008; de Chernatony and Segal-Horn, 2004; Harris
and de Chernatony, 2001; Hulberg, 2006; Kennedy, 1977; Vallaster and de Chernatony, 2006)
whilst de Chernatony et al. (2004) note “most business performance measures have tended to evolve
from goods, rather than service-centred organisations, overlooking services’ distinctive
characteristics” (p.17). Consequently, the inclusion of employee based measures is intended to
address these issues.
Consequently, ‘customer’, ‘finance’ and ‘employees’ emerge as key service brand
dimensions as so will be used to organise, introduce and evaluate the brand performance literature.
Figure 12 summarises authors’ ‘clusters’ of thought along these dimensions, Table 2 outlines
authors that constitute each cluster and provides details on the measures respective authors have
used. Consultancy models such as those provided by Young and Rubican (BrandAsset® Valuator),
WPP (Brandz™), Interbrand (Brand Valuation Method) or Millward Brown (Optimor) have not be
reviewed given they are proprietary and so full access would have been unlikely.

83
Figure 12 Clustering the Brand Performance Literature Along Financial, Customer and Employee
Dimensions
Strong financial dimension
Strong employee dimension (employee equity)
Strong customer dimension (customer based brand equity*)
Customer Carers (2, 4, 14, 15, 16, 17, 18, 19, 20, 21
& 22)
Broker Brands (3, 5 & 8) Balanced
Branders (1 & 13)
Financial Focusers
(6, 7, 9, 10, 11 & 12)

84
Table 2 Authors’ that Constitute Each Cluster within the Brand Performance Literature
Number Author(s) 1 Ambler (2003) 2 de Chernatony et al.(2004) 3 Fitzgerald et al.(1991) 4 Egan and Guilding (1994) 5 Munoz and Kumar (2004) 6 Chaudhuri and Holbrook (2001) 7 Chaudhuri (1999) 8 Ehrenberg et al.(2004) 9 Roth (1995b, , 1995a) 10 Ghosh et al.(1995) 11 Weerawardena et al. (2006) 12 O’Cass and Ngo (2007a) 13 Oktemgil (2003) 14 Aaker (1991) 15 Keller (1993; 1998; 2003) 16 Sharp (1995) 17 Berry (2000) 18 Yoo & Donthu (2001) 19 Kim et al (2003a) 20 Shocker and Weitz (1988) 21 Pappu et al (2005) 22 Yasin et al.(2007)
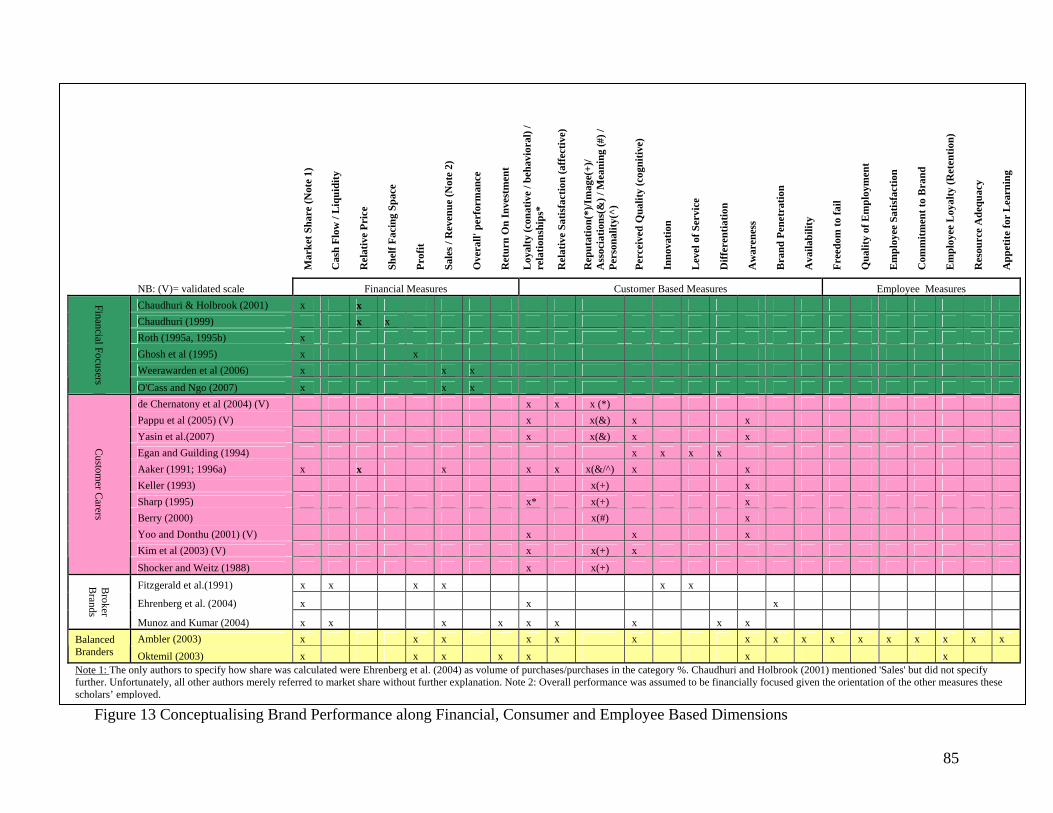
85
Figure 13 Conceptualising Brand Performance along Financial, Consumer and Employee Based Dimensions
Mar
ket S
hare
(Not
e 1)
Cas
h Fl
ow /
Liq
uidi
ty
Rel
ativ
e Pr
ice
Shel
f Fac
ing
Spac
e
Prof
it
Sale
s / R
even
ue (N
ote
2)
Ove
rall'
per
form
ance
Ret
urn
On
Inve
stm
ent
Loy
alty
(con
ativ
e / b
ehav
iora
l) /
rela
tions
hips
*
Rel
ativ
e Sa
tisfa
ctio
n (a
ffec
tive)
Rep
utat
ion(
*)/I
mag
e(+)
/ A
ssoc
iatio
ns(&
) / M
eani
ng (#
) /
Pers
onal
ity(^
)
Perc
eive
d Q
ualit
y (c
ogni
tive)
Inno
vatio
n
Lev
el o
f Ser
vice
Diff
eren
tiatio
n
Aw
aren
ess
Bra
nd P
enet
ratio
n
Ava
ilabi
lity
Free
dom
to fa
il
Qua
lity
of E
mpl
oym
ent
Em
ploy
ee S
atis
fact
ion
Com
mitm
ent t
o B
rand
Em
ploy
ee L
oyal
ty (R
eten
tion)
Res
ourc
e A
dequ
acy
App
etite
for
Lea
rnin
g
NB: (V)= validated scale Financial Measures Customer Based Measures Employee Measures Chaudhuri & Holbrook (2001) x x Chaudhuri (1999) x x Roth (1995a, 1995b) x Ghosh et al (1995) x x Weerawarden et al (2006) x x x
Financial Focusers O'Cass and Ngo (2007) x x x de Chernatony et al (2004) (V) x x x (*) Pappu et al (2005) (V) x x(&) x x Yasin et al.(2007) x x(&) x x Egan and Guilding (1994) x x x x Aaker (1991; 1996a) x x x x x x(&/^) x x Keller (1993) x(+) x Sharp (1995) x* x(+) x Berry (2000) x(#) x Yoo and Donthu (2001) (V) x x x Kim et al (2003) (V) x x(+) x
Custom
er Carers
Shocker and Weitz (1988) x x(+) Fitzgerald et al.(1991) x x x x x x
Ehrenberg et al. (2004) x x x
Broker
Brands
Munoz and Kumar (2004) x x x x x x x x x Ambler (2003) x x x x x x x x x x x x x x x x Balanced
Branders Oktemil (2003) x x x x x x x Note 1: The only authors to specify how share was calculated were Ehrenberg et al. (2004) as volume of purchases/purchases in the category %. Chaudhuri and Holbrook (2001) mentioned 'Sales' but did not specify further. Unfortunately, all other authors merely referred to market share without further explanation. Note 2: Overall performance was assumed to be financially focused given the orientation of the other measures these scholars’ employed.

86
As can be seen from Figure 13, there is a tendency for the literature to cluster in
four. In the spirit of segmentation these shall be referred to as Financial ‘Focusers’,
Customer ‘Carers’, ‘Broker’ Branders and ‘Balanced’ Branders.
2.6.1.1.Financial ‘Focusers’
As the title suggests, financial focusers measure brand performance via financial
metrics alone. When researching the influence of loyalty and trust on brand performance,
Chaudhuri and Holbrook (2001) regarded the latter in terms of market share and relative
price. When assessing the direct / indirect influence of brand attitudes and brand loyalty
had on brand performance, Chaudhuri (1999) measured performance in terms of shelf
space and relative price. Whilst relative price could be considered a brand related measure
(and so falls within the Customer Carer’s cluster) it is regarded as a financial measure here.
The reason being price multiplied by units sold equals overall revenue and so is considered
a more financially orientated measure. When assessing the influence industry structure,
organisational learning and innovation had on performance, Ghosh et al. (1995) considered
brand performance via market share and profitability. Weerawardena et al. (2006) defined
performance in terms of relative market share, sales growth and the ‘overall’ performance
whilst O'Cass and Ngo (2007a) used consumer measures of overall perception of the
performance, market share and sales growth rate in the context of balancing external
adaptation and internal effectiveness. Finally, Roth (1995a,b) considered market share as a
proxy for performance when researching the influence of global marketing conditions on in
this endogenous variable.

87
A financial focuser’s perspective could be regarded as an oversimplified and short-
termistic approach to brand performance (Barwise et al., 1990; Brignall and Ballantine,
1996; Egan and Guilding, 1994). Consequently, adopting this perspective is inconsistent
with the view that brand building is a strategic activity (Kapferer, 2004; Keller et al.,
2008). Whilst financial measures help with the analysis of previous marketing initiatives,
decisions based on such data in isolation are retrospective and not strategic or forward
looking (Rust et al., 2004a). Whilst brand managers need to be guided by past
performance, strategic brand decisions cannot be informed by historical data in isolation.
Previous sections of this chapter have highlighted the pivotal role employees’ play for
service brands. However, financial focusers’ fail to incorporate employee-based equity
measures into their measure. Finally, several scholars incorporate market share as a
measure of brand performance (Chaudhuri and Holbrook, 2001; O'Cass and Ngo, 2007a;
Roth, 1995a,b; Weerawardena et al., 2005). However, these authors fail to outline if share
is based on units of sale, revenues of sale or number of customers which makes it
challenging to determine which approach should be used. Consequently, financial focusers
contribute to, but do not offer, a complete brand performance picture. Indeed purely
financial methods are regarded as being inadequate for justifying marketing investments
(Rust et al., 2004a) and measuring its performance (Clark, 1999).
2.6.1.2.Customer ‘Carers’
Customer carers’ tend to focus on consumer-based brand performance measures.
For instance, when developing a consumer based measure for financial service brands, de
Chernatony et al (2004) outline how “brand loyalty, consumer satisfaction and reputation

88
constitute the brand performance measure” (p. 15) which results in a brand performance
measure “akin to consumer based brand equity” ( p. 16). Whilst not brand performance
measures per se, several approaches to measuring consumer based brand equity have been
developed in the literature (Table 3). This is consistent with the view that a range of brand
equity conceptualisations exist (de Chernatony et al., 2004, Mackay, 2001, Vasquez et al.,
2002, Ambler, 2003, Schultz, 2005, Yoo and Donthu, 2001 ). Given these authors
customer focus this thesis regards it as appropriate to consider these authors in the context
of customer carers.
Table 3 Perspectives on Measuring Consumer Based Brand Equity
Aaker (1991, 1996b), Pappu et al. (2005), Yasin et al.(2007)
Keller (1993; 1998; 2003)
Sharp (1995) Berry (2000) Yoo & Donthu (2001)
Shocker & Weitz (1988)
Kim et al. (2003a)
Brand Awareness Brand Awareness
Company / Brand Awareness
Brand Awareness
Brand Awareness / associations
Brand Associations
Brand Image Brand Image (or company / brand reputation)
Brand Meaning
Brand Image
Brand Image
Brand Loyalty Relationships with customers / customer franchises
Brand Loyalty
Brand Loyalty
Brand Loyalty
Perceived Quality Perceived Quality
Perceived Quality
Note 1: Aaker’s (1991, 1996b) work could potentially be considered within the broker brands category. The
reason being it includes financial measures such as sales and share based on sales (on the assumption sales
were based on revenue – this was not specified in this scholar’s work). However, Aaker’s (1991; 1996b)
work is more frequently referred to in the brand literature in the context of consumer based brand equity and
so is considered here. A fifth dimension of Aaker’s brand equity conceptualisation relates to patents and
trademarks. As these relate to firm and not consumer based equity they are not included here.
Note 2: Yoo & Donthu’s (2001) work draws heavily on Aaker (1991) and Keller (1993).

89
Finally, building on Doyle’s (1989) work, Egan and Guilding (1994), develop an
interdisciplinary (marketing / management accounting) perspective on brand performance
by theorising that perceived quality, innovation, superior levels of service and degree of
differentiation are central to brand metrics.
Several points should be noted from the ‘Customer Carers’ work. For instance,
earlier conceptualisations of brand equity such as those developed by Aaker (1996b) or
Keller (1993) provided the platform for subsequent empirical research (de Chernatony et
al., 2004; Kim et al., 2003a; Yoo and Donthu, 2001). However, it is questionable if brand
marketers’ would employ a range of metrics that did not incorporate financial measures.
Furthermore, failing to consider employee based measures can be regarded as a potential
shortcoming of ‘Customer Carer’s’ research in the context of service brands. It would,
retrospectively, be rather unfair to lodge such criticism against brand equity measures as
they were not conceived as ‘broader’ brand performance metrics. More specifically, de
Chernatony et al. (2004) informed by their adoption of the MSI definition of brand equity,
discount awareness on the grounds it does not drive market share, a view which is contrary
to previous empirical research (Agarwal and Roa, 1996; Mackay, 2001). This is an
interesting position given Ambler (2000b, 2003) found awareness was the most widely
used metric in the UK (78% of firms used it). The inferential logic being that if it is widely
used it must have practical use. Finally, Egan and Guilding (1994) intended to develop a
marketing / accounting perspective (i.e. ‘Broker Brands’). However, their work does not
outline which financial measures should be used. Furthermore, these authors appear to be
more customer / marketing focused than marketing / accounting. Hence, in theory or
‘spirit’ their work is balanced but in practice it is more customer-focused. Consequently,

90
in a similar manner to financial focusers, customer carers contribute to the brand
performance literature. However, such a viewpoint fails to take a holistic perspective
which is required when measuring the performance of service brands.
2.6.1.3.Brand ‘Brokers’
The third cluster of researchers, ‘Brand Brokers’ combine consumer and financial
brand measures. For example, Munoz and Kumar (2004) consider the importance of
perception metrics which relate to factors such as awareness, perceived quality and
differentiation in addition to performance metrics which are concerned with customer
satisfaction, retention/loyalty, revenue per customer and return on investment (ROI).
Together these measures span customer and financial measures. Munoz and Kumar’s
(2004) third dimension, financial metrics, is concerned with market share, cash flow,
overall revenue (nature of measurement unspecified) and so appears to be akin to their
performance measures. Ehrenberg et al.(2004) outline how their Dirichlet model, which
has been developed in both goods and services markets, helps audit brand performance.
These scholars’ conceptualisation of brand performance consists of size related measures
such as market share and penetration, loyalty related measures which are concerned with
annual number of purchases whilst the final measure focuses on annual switching (and so
appears to be akin to loyalty). With a specific service focus, Fitzgerald et al. (1991)
forward six dimensions of service business performance. Two measure results of
competitive success (compositeness measures and financial measures) and four measure
determinants of competitive success (equality, flexibility, resource utilisation and
innovation). Figure 14 illustrates these dimensions.

91
Figure 14 Dimensions of Brand Performance (Fitzgerald et al. 1991)
As noted previously Aaker’s (1991, 1996b) work could be considered under brand
brokers. The reason being it encompasses measures of a financial nature such as share /
sales (on the assumption these are measured in monetary not unitary value) and price
premium. However, given Aaker’s (1991, 1996b) work is more frequently referred to in
the context of consumer based brand equity it is included within the Customer Carer
cluster.
The strength of the Brand Brokers’ work lies their consideration of both long
(customer) and short term (financial) measures. This compensates for the inadequacies of
only adopting a consumer or financial perspective (Kim et al., 2003a) and is consistent

92
with the perspective that employing only short term financial measures mitigates brand
development (de Chernatony and Cottam, 2008). However, in a similar manner to
Customer Carers, Brand Brokers overlook employees. This potentially limits the utility of
their approach in a service brand context.
2.6.1.4.‘Balanced’ Branders
The final segment of researchers consists of ‘Balanced’ Branders who to
amalgamate financial, employee and consumer based measures. Ambler (2003) reports
“best practice in marketing performance measurement” (p.2) from the Marketing
Leadership Council’s research and suggests measuring brand performance from three
financial and six non financial (brand equity) measures. Table 4 illustrates how such
financial measures can be considered internally (year on year) or externally (in relation to
competitors).
Table 4 Financial Measures of Brand Performance (Ambler, 2003)
Actual Metric % Compared with plan and
/ or prior year % Compared with competition i.e. relative
1) Sales Volume / value Market Share 2) Marketing Investment (that builds brand equity)
Period Costs Share of Voice
3) Bottom line Economic Profit Share of Profit
The non financial measures Ambler (2003) proposes relate to brand equity as a
marketing asset which, in this context consists of brand awareness, brand penetration,
what customers think of the brand (perceived quality, i.e. a cognitive measure), what
customers feel about the brand (relative customer satisfaction, i.e. an affective measure),
brand loyalty (probability of buying the brand next time, i.e. a behavioural or conative

93
measure) and availability (distribution of the good or service). Of particular interest is
Ambler’s (2003) employee based brand equity which consists of awareness of brand goals,
perceived calibre (quality) of the employer vis-à-vis competitors, relative employee
satisfaction with employer, commitment to brand goals, employee retention (loyalty),
perceived resource adequacy, appetite for learning and freedom to fail.
Oktemgil (2003) considers brand performance in terms of four financial (return on
investment, brand sales volume, brand market share and profit) and four intangible (brand
awareness, customer loyalty, number of new customers attracted and employee retention)
metrics. Consequently, the intangible elements of this work can be considered as
comprising of elements of consumer brand equity and employee brand equity.
Both Ambler (2003) and Oktemgil’s (2003) views on brand performance satisfy the
criteria outlined earlier in this section. This relates to considering financial, employee and
consumer based dimensions. However, given the small sample size (n=121) and working
paper status of Oktemgil’s (2003) work, Ambler’s (2003) approach merits closer attention.
Ambler’s (2003) work makes several contributions that are of particular interest to
this research. Primarily, Ambler’s (2003) work is underpinned by empirical research with
the Marketing Leadership Council. This provides a clear indication of which measures are
being employed by practitioners. Consequently, this facilitates the identification of metrics
participants are more likely to be familiar with and so provide plausible responses to.
Furthermore, the balanced approach Ambler (2003) advocated encompasses financial, non
financial (brand equity) and employees measures. This allows brand metrics to progress

94
from the mindset of using financial measures alone. Such a perspective could be regarded
as both short-termistic and outdated (Brignall and Ballantine, 1996; Egan and Guilding,
1994; Ittner and Larcker, 2003; Rust et al., 2004a) whilst being counter productive to
building strong brands (de Chernatony and Cottam, 2008). This perspective has been
reiterated by Lehmann et al. (2008) who encourages those who measure brand
performance to measure both the means and the ends. The reason being Ambler’s (2003)
approach encourages employee and customer measurement (i.e. the means) which help
maximise shareholder value (i.e. the ends). More specifically, the inclusion of employee
based measures is also particularly relevant to this research given the central role human
resource plays in service brand delivery (Ashford and Mael, 1996; Balmer, 1995, 1998;
Balmer and Greyser, 2003; Balmer and Greyser, 2006; Berry and Seltman, 2007; Brodie et
al., 2009; Burmann and Zeplin, 2005; de Chernatony and Cottam, 2008; de Chernatony
and Segal-Horn, 2004; Harris and de Chernatony, 2001; Hulberg, 2006; Kennedy, 1977;
Vallaster and de Chernatony, 2006). Indeed studies at organisations such as Compaq,
Nortel Networks, BP highlight how employee based brand equity, that is what employees
carry in their minds, is an important driver of brand performance (Ambler, 2003). Finally,
by considering customer satisfaction, Ambler’s (2003) work finds support from the brand
identity literature which outlines how satisfaction is a particularly powerful measure at
service brands where satisfaction is a function of experiences (Aaker, 1996a).
However, issues should be noted with Ambler’s (2003) work. For instance,
validated scales have not been developed for several of the proposed employee based
measures. This dearth of employee-related measures potentially highlights the infancy of
this area in the brand performance literature. This point is corroborated by personal
correspondence with Amber (17th April 2007) where data for the percentage of

95
organisations that use employee based measures was not available. Consequently, this
infers such metrics may not be widely used, participants did not have them available or did
not wish to share them as part of the research. Finally, it is questionable if brand managers
would, even within the context of confidential research, be happy to share such
commercially sensitive information with the research community as Ambler’s (2003) work
requires.
2.6.2. Developing a Grounded Brand Performance Measure
The approach this thesis adopted to brand performance measurement was
developed in two stages. Initially, the logic for ruling out certain performance metrics will
be provided. The rationale for the measures this thesis used is then provided.
From a financial perspective, cash flow (Fitzgerald et al., 1991; Munoz and Kumar,
2004) is a too short term measure to be considered in the context of brand performance.
Relative or premium price (Aaker, 1996b; Chaudhuri, 1999; Chaudhuri and Holbrook,
2001), shelf space (Ghosh et al., 1995) and overall performance (O'Cass and Ngo, 2007a;
Weerawardena et al., 2005) will not be used due to their limited salience in the literature,
retail focus or being broadly conceived respectively. Whilst return on investment (ROI)
has been used in the marketing literature (Rust et al., 2004b) and advocated by certain
scholars to measure brand performance (Munoz and Kumar, 2004; Oktemgil, 2003),
authors such as Ambler (2003) have expressed concerns over the use of this metric. The
reason being, marketers’ have a tendency to divide return by investment as opposed to
subtract investment from return as authors such as Farris et al. (2008) suggest.

96
Intriguingly, Rust et al (2004a :79), where Ambler is a co-author, calculate ROI as
“discounted return (net of discounted expenditure), expressed as a percentage of the
discounted expenditure” and so divides not subtracts as Ambler (2003) suggests. Hence,
there appears to be an implicit danger in using ROI due to the inconsistencies with regards
to how this metric is calculated. Also, from a practical perspective it would also be
challenging for survey respondents’ to generalise across multiple marketing activities to
provide a credible ROI figure. Finally, sales / revenue (Aaker, 1991, 1996b; Ambler, 2003;
Fitzgerald et al., 1991; Munoz and Kumar, 2004; O'Cass and Ngo, 2007a; Weerawardena
et al., 2006) constitutes part of market share (by revenue) metric that will be obtained as
will be discussed later.
From a customer perspective (i.e. ‘brand equity’), perceived quality (Egan and
Guilding, 1994; Munoz and Kumar, 2004) will not be used. This metric may be difficult to
measure for service brands due to their characteristics [i.e. being high on experience and
credence values in comparison to ‘tangible’ products (Zeithaml and Bitner, 1996)].
Indeed, Rundle-Thiele and Bennett (2001) noted how such cognitive measures are
particularly unstable and sensitive in service-based research. This raises questions about
the robustness of the perceived quality measure whilst Ambler’s (2000b) research
highlighted it was one of the less frequently used measures. Innovation (Egan and
Guilding, 1994; Fitzgerald et al., 1991), level of service (Egan and Guilding, 1994;
Ehrenberg et al., 2004), availability (Ambler, 2003) and differentiation (Egan and
Guilding, 1994; Munoz and Kumar, 2004) will not be used as they were not prominent in
the brand performance literature. Finally, brand penetration (Ambler, 2003; Ehrenberg et
al., 2004) can be regarded as providing similar insights to the data that will be obtained in
the form of market share.

97
From an employee perspective, perceived quality of employment will not be
considered for the reasons discussed above. Furthermore, some of the employee equity
variables appear too subjective or abstract to research. Appetite for learning, freedom to
fail, resources to carry out work and commitment to brand all provide relevant examples.
This position concurs with Ambler (personal correspondence, 16th April, 2007) who
appreciated these are the more “unusual” measures of employee-based brand equity.
The above shares the author’s logic for excluding certain brand performance
measures. Informed by the rationale used to introduce and structure the brand performance
literature (financial, brand and employee dimensions) the key measures of brand
performance this thesis will use are presented in Table 5. Following numerous scholar’s
advice (Farris et al., 2008; Munoz and Kumar, 2004) a range of brand performance
measures was used. Furthermore, consistent with The Marketing Leadership Research
Council work, eight measures were used given between eight and ten metrics was regarded
as the ideal number of metrics (Ambler, 2003). Hence, these findings have been considered
when developing an approach to brand performance measurement.

98
Table 5 Brand Performance Measurement Used in this Research % of
companies using measure (Ambler 2000)
Rank (Ambler 2000)
Relevant Literature
Financial Measures
Market Share (based on revenue and so i) accounts for revenue based figures ii) is financially focused
78%
#5
(Aaker, 1996b; Ambler, 2003; Chaudhuri and Holbrook, 2001; Ehrenberg et al., 2004; Fitzgerald et al., 1991; Ghosh et al., 1995; Munoz and Kumar, 2004; O'Cass and Ngo, 2007a; Roth, 1995a,b; Weerawardena et al., 2005)
Profit (net) 91.5% #1 (Ambler, 2003; Fitzgerald et al., 1991; Ghosh et al., 1995)
Customer Measures (Brand equity)
Loyalty (‘churn’)
64%
#13
(Aaker, 1991; Aaker, 1996a; Ambler, 2003; de Chernatony et al., 2004; Ehrenberg et al., 2004; Kim et al., 2003a; Munoz and Kumar, 2004; Pappu et al., 2005; Shocker and Weitz, 1988; Yasin et al., 2007; Yoo and Donthu, 2001)
Satisfaction (relative) 68% #9 (Ambler, 2003; de Chernatony et al., 2004; Munoz and Kumar, 2004)
Awareness
78%
#4
(Aaker, 1991, 1996b; Ambler, 2003; Berry, 2000; Keller, 1993, 1998, 2003; Munoz and Kumar, 2004; Pappu et al., 2005; Sharp, 1995; Yasin et al., 2007; Yoo and Donthu, 2001)
Reputation / Image / Associations / Meaning 54%* NA
(Aaker, 1991, 1996b; Berry, 2000; de Chernatony et al., 2004; Keller, 1993; Kim et al., 2003a; Pappu et al., 2005; Sharp, 1995; Shocker and Weitz, 1988; Yasin et al., 2007)
Employee Measures Employee Satisfaction NA NA (Ambler, 2003) Loyalty (Retention / labour turnover)
NA NA (Ambler 2003)

99
The logic for not including certain measures was outlined above. Now the rationale
for including the measures in Table 5 will be discussed.
From a financial perspective, market share data was obtained due to its salience in
the brand performance literature (Aaker, 1996b; Ambler, 2003; Chaudhuri and Holbrook,
2001; Ehrenberg et al., 2004; Fitzgerald et al., 1991; Ghosh et al., 1995; Munoz and
Kumar, 2004; O'Cass and Ngo, 2007a; Roth, 1995a,b; Weerawardena et al., 2005) in
addition to be regarded a key competitive indicator (Farris et al., 2008). Furthermore,
several empirical studies have outlined how share drives profit (Buzzell et al., 1975;
Buzzell and Gale, 1987; Chu et al., 2008; Gale and Branch, 1982; Goddard et al., 2005;
Martin, 1988; Szymanski et al., 1993). This view is grounded in: efficiency theory
(Demsetz, 1973) where high share enables firms to spread fixed costs and so enjoy larger
profits; market power theory (Schroeter, 1988; Staten et al., 1988) where brands with
larger share enjoy greater market power in the form of raw material negotiation, channel
influence and so forth; product quality assessment theory (Smallwood and Conlisk, 1979)
where buyers use market share as a proxy for superior quality.
Whilst the brand performance literature is replete with examples of market share
use, it is not always clear how this metric has been calculated. For example, Ehrenberg et
al.(2004) clearly calculates share based on units sold, Chaudhuri and Holbrook (2001) refer
to sales but do not specify monetary or unit-based calculations whilst numerous scholars
(Ghosh et al., 1995; Munoz and Kumar, 2004; O'Cass and Ngo, 2007a; Roth, 1995a,b;
Weerawardena et al., 2005) refer to market share without providing details on how the
figure is calculated. Given limited literature guidance market share data based on revenue
was obtained for the following reasons. Primarily, the suitability of calculating market

100
share by unit sale or revenue has been noted in the literature (Farris et al., 2008).
Furthermore, share based on revenue is a headline metric that is more challenging to be
‘creative’ with, in comparison to profit-based share. Also, revenue-based share is a metric
frequently incorporated into managerial dashboards. Therefore, it was considered a metric
participants’ should be relatively familiar with and so be able to provide responses to.
Indeed, due to the widely available nature of such revenue figures via Companies House
etc., it was anticipated this would facilitate managers’ willingness to divulge such
information. It should also be noted how share based on figures such as subscribers are
subject to the vagaries and idiosyncrasies of organisational measurement. For example,
Vodafone UK’s subscriber based shrank overnight from 14m to 11m in 2006 when they
had to reconsider subscribers as being active in the last three months and not six. Finally,
given this research’s service brand focus, unit based share in the form of mainframe
computers or servers sold is not appropriate. For these reasons share, based on revenue,
was used.
In terms of net profit, Milton Friedman (1982) famously stated the sole purpose of
an organisation is to make profits for its shareholders, albeit, within the bounds of the law.
Whilst profit maximisation alone can be regarded as a relatively narrow conceptualisation
of an organisation’s marketing purpose (Webster, 1992) it is hard to contend profit is not a
critical business metric given the frequency with which it is used (Ambler, 2003) and the
importance it holds with financial markets. Furthermore, net profit provides an indication
of how efficiently an organisation is managing their resources. Finally, gross profit could
have been obtained. However, this figure was not collected due to the importance of

101
understanding bottom line figures (Ambler, 2003). For these reasons revenue-based share
and net profit data were obtained to capture more financially orientated metrics.
From a customer or brand equity perspective the dimensions selected emerged from
a parallel process. This involved considering the logic for eliminating dimensions as
outlined above and assessing the value certain dimensions bring when developing a brand
performance measure. This process resulted in relative customer satisfaction, loyalty,
reputation and awareness data being collected. The justification for including these
measures now follows.
In terms of relative customer satisfaction, Aaker (1996a) noted how satisfaction
was “an especially powerful measure in service businesses” (p. 323). Similarly, Rust and
Chung (2006) highlight that “customer satisfaction should receive considerable attention in
service research” (p. 570). The reason being levels of customer interaction and so the
opportunity to satisfy the customer is more frequent with service brands. Furthermore,
higher levels of consumer satisfaction bring several organisational benefits. These include
a willingness to pay premium prices (de Chernatony et al., 2004), loyalty (Farris et al.,
2008), positive word of mouth (Farris et al., 2008; Srivastava et al., 1998) and enhanced
financial performance (Yeung and Ennew, 2000). The logic being such outcomes should
encourage senior executives to gather and be familiar with satisfaction data. However, it is
important to look beyond satisfaction figures. The reason being consumers may claim to be
satisfied but switch whilst others claim to be unsatisfied but stay (Ambler, 2000a). For
example Gale (1994) noted that although Cadillac’s customers were satisfied, their
competitors were satisfying their customers better and so moving to them. Similarly,
Sajeev and Rust (1997) noted:

102
“Earlier studies of customer satisfaction focused on measuring the satisfaction
levels of the sponsoring firm's customers alone. The emphasis has gradually shifted
to measuring the satisfaction levels of the firm's customers relative to those of its
competitors.” (p.14)
Consequently, satisfaction research appears to have evolved to incorporate a
measure relative to a key competitor (Sajeev and Rust, 1997). Consequently, for these
reasons relative satisfaction data was collected.
The next consumer based measure related to brand loyalty and was included as a
dimension of brand performance for several reasons. For instance, loyalty was a salient
measure in the brand performance literature (Aaker, 1991; Aaker, 1996a; Ambler, 2003; de
Chernatony et al., 2004; Ehrenberg et al., 2004; Kim et al., 2003a; Munoz and Kumar,
2004; Pappu et al., 2005; Shocker and Weitz, 1988; Yasin et al., 2007; Yoo and Donthu,
2001). This point is reflected in Aaker’s (Aaker, 1996a) comment where it was noted how
loyalty is a “core dimension of brand equity” (p. 105). Similarly, de Chernatony et al.
(1998) cited loyalty as the most frequently used consumer based measure when appraising
brand success. Furthermore, the benefits of building customer loyalty have been noted in
the literature. These include greater channel leverage (Aaker, 1991), increasing customer
resistance to competitive offerings (Dick and Basu, 1994), erecting as a barrier to entry
(Aaker, 1996b), delivering higher profit margins (Reichheld, 1996; Reichheld and Sasser,
1990), providing defence against competitor’s initiating price wars (Aaker, 1996b), in
addition to driving rowing market share (Chaudhuri and Holbrook, 2001). In a similar
manner to the relative satisfaction data, the logic being such outcomes should encourage

103
senior executives to gather and so be able to share (within the context of confidential
research) loyalty data. Thus, brand loyalty is a justified inclusion.
The rationale for collecting reputation-related data requires a more involved
discussion. Although image (Keller, 1993; Kim et al., 2003a; Shocker and Weitz, 1988)
and ‘reputation’ (de Chernatony et al., 2004; Sharp, 1995) have been included in the brand
performance literature it is important to make a distinction between the constructs. In the
literature, reputation, in comparison to image, is regarded as being formed over longer
periods of time (Balmer, 1998; Bick et al., 2003; de Chernatony, 2006; Fombrun, 1996;
Fombrun and Van Riel, 1997; Walsh and Beatty, 2007) in addition to being more stable
(Dowling, 1986; Kennedy, 1977; Melewar and Jenkins, 2002) and durable (Melewar et al.,
2005b). Consequently, considering reputation as being built over time is consistent with
the strategic brand perspective this research adopts. Furthermore, image tends to be more
consumer centric (de Chernatony et al., 2004) whilst reputation adopts a more balanced
stakeholder perspective (Mitchell, 2001; Veloustou and Moutinho, 2008). Again, this view
is aligned with the definition of brand developed earlier in this chapter in addition to being
more akin with a corporate branding perspective which predominates for service brands.
Indeed, given this research’s service focus, reputation plays an important role in terms of
reducing the intangibility of the brand (Davies et al., 2003; Fombrun, 1996). The positive
influence reputation has on other organisational outcomes has also been noted. These
include greater loyalty (Hall, 1992; Walsh and Beatty, 2007), instilling trust (Walsh and
Beatty, 2007), attracting customers (de Chernatony et al., 2004), attracting higher calibre
employees (Fombrun and Shanley, 1990; Van Riel, 1995), reducing perceived risk (Bauer,
1960) and price sensitivity whilst a strong reputation has also been found to positively
correlate with market share (Bharadwaj and Menon, 1993) and customer satisfaction

104
(Walsh and Beatty, 2007). Similarly, reputation has competitive benefits. For example,
company reputation is an intangible asset that contributes to the organisation’s success
(Hall, 1992) and driving competitive advantage (Melewar et al., 2005b; Melewar et al.,
2005c) whilst a strong and favourable reputation is hard to duplicate (Sharp, 1995).
Finally, since the 1990s increasing academic attention has been placed on reputation as
opposed to image (Balmer and Greyser, 2003).
At a more detailed level, reputation could be regarded as an ‘umbrella’ construct
for other brand equity related constructs such as associations (Aaker, 1991, 1996b; Pappu
et al., 2005; Yasin et al., 2007), brand meaning (Berry, 2000) and perceived quality
(Aaker, 1991, 1996b; Ambler, 2003; Egan and Guilding, 1994; Kim et al., 2003a; Pappu et
al., 2005; Yasin et al., 2007; Yoo and Donthu, 2001). Associations relate to a node linked
to a brand in memory (Keller, 1993) where such an association could relate to the brand’s
reputation (Fombrun et al., 2000). Similarly, ‘brand meaning’, which relates to “the
customer’s dominant perception of the brand” (Berry, 2000: 129) could be regarded as
manifesting in the perceived reputation a stakeholder has about a given brand. In terms of
perceived quality, Nguyen and Leblanc’s (2001) research highlighted how consumers infer
quality via reputation. In a similar manner, (Veloustou and Moutinho, 2008) state how
“[R]eputation is one of the primary contributors to perceived quality of the products carry
the brand name” (p. 315). Hence, closer inspection of several distinct brand equity
measures can, arguably, be considered as being closely related, if not synonymous with
reputation. Collectively, these points provide the rationale for considering reputation.
The final customer related dimension of brand performance relates to brand
awareness. Primarily, brand awareness has been extensively used to measure brand

105
performance in the literature (Aaker, 1991; Ambler, 2003; Berry, 2000; Keller, 1993, 1998,
2003; Munoz and Kumar, 2004; Sharp, 1995; Yoo and Donthu, 2001). Furthermore, if a
stakeholder is not aware of a brand, it will not enter a given stakeholder’s consideration
set when evaluating alternative brands (Baker et al., 1986; Nedundadi, 1990) .
Furthermore, awareness reduces perceived risk in addition to creating barriers to entry
(Sharp, 1995) that can deliver incumbency benefit (Kay, 1992). It is debatable if awareness
could be considered as part of reputation. However, this research has kept the two
constructs distinct. The reason being awareness is concerned with the brand being in the
consumers’ memory whilst reputation is a subsequent step where an opinion / view is
formed about the brand based on what is held in memory over a period of time.
The final dimension of brand performance considered employee based measures.
The Methodology chapter (Section 4.5.6) outlines how, based on the survey pretesting,
employee satisfaction and employee loyalty measures were included.
Collectively, the above shares the authors’ logic for the dimensions of brand
performance this research used.
2.6.3. Brand Performance – Summary
This section of the chapter has introduced and evaluated the brand performance
literature along financial, customer and employee dimensions. The logic for using these
dimensions to structure the brand performance literature was outlined in this chapter
(Section 2.6.1). This multi-measure and multidimensional approach was also informed by

106
the view that a universal brand performance measure does not exist (Ambler, 2003; de
Chernatony et al., 2004; Lehmann et al., 2008; Mackay, 2001; Schultz, 2005; Vasquez et
al., 2002; Yoo and Donthu, 2001).
Obtaining financially related data is important as today’s organisations run on
financial measures (Schultz, 2006). Furthermore, incorporating a financial dimension
enhances the metrics’ relevance to senior managers (Rubinson and Pfeiffer, 2005) whilst,
from a practical perspective, it is hard to imagine a brand performance dashboard without
financial measures.
The objective of incorporating customer based, or brand equity, measures into a
brand performance metric was to eliminate short term tendencies (Aaker, 1996a; Aaker,
1996b). The reason being such measures account for the ‘lag’ that occurs between
investment in, and returns generated by, brands (Ambler, 2000a; Egan and Guilding, 1994;
Schultz, 2006). Consequently, from a metaphorical perspective brand equity represents a
reservoir (Ambler, 2000b, 2003; Rust et al., 2004a) behind a dam where brand equity
represents latent value which has yet to be translated into financial returns. Such a position
is consistent with scholars such as Farris et al. (2008) who note how brand marketing
measures serve as leading indicators for future financial performance.
Finally, incorporating employee based measures into brand performance makes
explicit the pivotal role employees’ play in service brand delivery. This answers the
literature’s call for a more balanced service branding approach (de Chernatony et al., 2003;
de Chernatony and Segal Horn, 2003; Zeithaml et al., 2006). This approach also helps
avoid an ‘external perspective trap’ which fails to account for employees as part of the

107
brand identity building process (Aaker, 1996a). Furthermore, paying particular attention to
employees overcomes the issue that most metrics have tended to emanate from goods
based brands (Brignall and Ballantine, 1996; de Chernatony et al., 2004) with the result
being that service specific factors tend to be overlooked.
2.7. Conclusions
This chapter has reviewed the brand, 'identity', service and brand performance
literature. Reviewing this literature clarified this thesis’ interpretation of key conceptual
terms, contextualised this research and provided theoretical grounding for subsequent
chapters.
The review of brand was guided by de Chernatony and Dall'Olmo Riley’s (de
Chernatony and Dall'Olmo Riley, 1997, 1998) and de Chernatony’s (2006) taxonomy of
brand perspectives. This resulted in an ‘integrated’ view of brand being forwarded that
embodied a more integrated and holistic brand perspective by augmenting previous
scholars’ work. The corporate branding literature was then reviewed given the salience of
this branding approach in the service sector (Aaker and Joachimsthaler, 2000; Agarwal,
2004; Berry, 2000; Berry et al., 1988; de Chernatony, 2006; Diefenbach, 1987; Pina et al.,
2006).
The evolution of the goods and services literature was then considered. This
outlined how this literature stream has evolved from conceptualising goods and services
dichotomously to a burgeoning the service dominant logic (Vargo and Lusch, 2004a). At
108
this point it was noted how the service dominant logic represents something of a paradigm
shift within marketing thought. The reason being within the domain of this logic,
organisations and consumers are co-producers of value whilst all organisations, markets,
and societies are primarily concerned with exchange of service as opposed to goods.
Consequently, service becomes the dominant logic. The latter point is of particular
relevance given it contextualises this research and provides a stronger rationale for this
service based research.
The ‘identity’ literature review then paid particular attention to the terms
organisational, corporate and brand identity. At this stage, guided by the literature, service
brand identity was preliminarily defined as the strategist’s vision of how a service brand
should be perceived by its stakeholders. The distinction and relationship between brand
identity, corporate identity and corporate branding was then conceptualised to clarify how
these constructs are distinct but related. This was followed by a discussion of how, in the
absence of brand identity schools of thought, the corporate identity’s interdisciplinary
school may provide a suitable theoretical home for the brand identity orphan that can guide
subsequent theoretical development of brand identity related research which is
interdisciplinary in nature. Current brand identity conceptual frameworks were then
reviewed which revealed sparse conceptual development and a paucity of empirical
research.
The final section of the chapter reviewed the brand performance literature along
financial, consumer and employee dimensions. Informed by these dimensions four
‘clusters’ of brand performance literature were identified. These were referred to as
Financial Focusers, Brand Brokers, Consumer Carers and Balanced Branders. The

109
justification for why certain measures were and were not used then followed. This resulted
in a balanced brand performance approach being adopted which spanned financial,
consumer and employee-based measures.
Now the relevant literature has been reviewed it is possible to build on this chapter
to develop this thesis’ theoretical framework in the next chapter.

110
3. THEORETICAL FRAMEWORK
3.1. Introduction
The previous chapter reviewed the brand, service, ‘identity’ (corporate, brand,
organisational) and brand performance literature. This helped clarify this thesis’
interpretation of key conceptual terms, provide a broader research context insight,
highlight issues with current brand identity frameworks and supply theoretical guidance
with regards to brand performance measurement. In particular, reviewing the brand
identity literature facilitated the development of a preliminarily service brand identity
definition. Developing such a literature-based definition allows this research to move
towards addressing its first research question whilst providing parameters for exploring the
domain of service brand identity in this chapter.
Informed by the preliminary service brand identity definition developed in the
previous chapter, this chapter draws on the literature to postulate dimensions of service
brand identity and develop a hypothesis outlining the construct’s positive influence on
brand performance. Consequently, this chapter allows this research to move towards
addressing the second research question of ‘What are the dimensions of service brand
identity?’ Exploring the construct’s dimensionality also provides the foundation and
conceptual apparatus for subsequent chapters where a service brand identity measure is
developed and applied in the context of brand performance. Therefore, this chapter also
helps address the third and fourth research question of ‘How do we measure service brand
111
identity?’ and ‘Does service brand identity have a positive and significant influence on
brand performance?’ respectively.
This chapter opens by justifying why the scale development literature, in particular
Churchill’s (1979) paradigm, was utilised to develop the service brand identity measure.
Informed by this paradigm, the following section considers the domain of service brand
identity to explore preliminary construct dimensionality. This involves drawing on both
the brand and broader identity literature in the context of the previously developed
definition (Churchill, 1979). Guided by the literature review and previous sections of this
chapter, a preliminary service brand identity framework is then presented. The following
sections engage with the literature to postulate dimensions of service brand identity and so
substantiate the preliminary dimensions that were postulated. A hypothesis outlining the
positive influence service brand identity has on brand performance is then developed. The
penultimate section of the chapter evaluates the preliminary service brand identity
framework in the context of Suvatjis and de Chernatony’s (2005) criteria or guidelines for
‘model’ development. At this stage the potential for dimension interactions is highlighted.
This is acknowledged as being a function of moving from construct conceptualisation to
operationalisation. Concluding remarks highlight the logic for developing a preliminary
service brand identity framework, reiterate key points made during the chapter and outline
how this chapter lays the foundation for the Research Methodology chapter.

112
3.2. Developing a Preliminary Service Brand Identity Framework
To develop a preliminary service brand identity framework, this thesis was guided
by the extant scale development literature (DeVellis, 1991; Netemeyer et al., 2003) which,
for the most part, has been informed by Churchill’s (1979) seminal work. Employing
Churchill’s (1979) paradigm served to help this thesis identify initial dimensions of service
brand identity. These dimensions then fed into the development of a preliminary service
brand identity framework which provided structure to subsequent measurement model
development and application in the context of brand performance.
The logic for following Churchill’s (1979) paradigm was as follows. Primarily,
Chruchill’s (1979) work provides an academic paradigm that facilitates, structures and
guides the scale development process. Furthermore, this practice has been extensively
followed by other scholars when developing measures for latent marketing constructs.
These include market orientation (Deng and Dart, 1994), brand associations (Low and
Lamb, 2000), reputation (Fombrun et al., 2000), brand performance measure for financial
services (de Chernatony et al., 2004) and consumer-based brand equity (Vasquez et al.
2002; Yoo and Donthu 2001). Moreover, Churchill’s (1979) work requires scholars to
draw on the literature to develop theoretically grounded items that will later constitute
construct dimensions. Consequently, greater academic rigour underpins the scale
development process than if the items used to scale each dimension were not grounded in
the literature. Next, drawing on the domain sampling model (Nunally and Bernstein,
1994), the scale development literature requires the domain of each dimension has been
exhaustively sampled. Adhering to this advice improves a scale’s content validity
(Netemeyer et al. 2003). Similarly, expert panel review of the initial item pool enhances

113
the scale’s face validity (Ibid). Furthermore, expert panel members are encouraged to
comment on current items or suggest new items. Once more this enhances the face and
content validity respectively. For these reasons the scale development procedures as
outlined in the extant literature was followed.
It should be noted if Chruchill’s (1979) paradigm was to be strictly followed a
qualitative stage utilising focus groups or exploratory interviews would have
complemented the literature based item generation. Indeed, several scholars have
conducted focus groups to generate items at the item generation stage (Lytle et al., 1998;
Simoes et al., 2005; Walsh and Beatty, 2007). The rationale for not pursing a qualitative
stage is outlined in the methodology chapter (Section 4.4.2).
This section of the chapter has shared the logic for how this research intended to
explore the domain of service brand identity and so relates to the second research question.
This process was predominantly guided by Chruchill’s (1979) paradigm. The first step in
this process involves exploring the domain of service brand identity in the context of the
previously developed construct definition. This step is important because it informs what
does and does not constitute the construct and so sets parameters for subsequent scaling
procedures. This step is considered in the next section.
3.3. Preliminary Service Brand Identity Dimensionality
This section of the chapter outlines how the ‘identity’ literature was drawn on to
explore and subsequently postulate the domain of service brand identity. This process

114
encompassed two activities. First, considering current brand identity dimensionality in the
context of the service brand identity definition developed in the literature review (cf:
Churchill, 1979). Second, dimensions the author considers important, based on broader
identity reading that are not included in the brand identity literature are considered.
Communications provides an example. The latter draws on the Literature Review (Section
2.4.6), which outlined how it is appropriate for service brand identity to draw on other
identity literatures. Again, the second step was influenced by the construct’s definition and
so is consistent with Churchill’s (1979) paradigm. These two activities then fed into the
development of a theoretical framework (preliminary service brand identity framework)
which would guide quantitative analyses. Each will now be discussed.
When following the first step of Churchill’s (1979) paradigm it is necessary to
define the domain of the construct “in order to be exacting in delineating what is included
in the definition and what is excluded” (p. 67). It is important to follow this step so the
parameters for operationalising constructs are set. Table 6 summarises the brand identity
dimensions from the extant literature and highlights their relevance in the context of the
service brand identity construct developed in this thesis. Each will now be discussed.

115
Table 6 Evaluating Current Brand Identity Dimensions in a Service Brand Identity Context
Brand
Identity Dimension
Kapferer (2004)
Aaker (1996a).
Aaker and Joachimsthaler
(2000)
de Chernatony
(2006)
Relevance to Postulating Dimensions of Service
Brand Identity?
Vision √ √ Synonymous with service brand identity (cf;
Section 2.4.3) Reflection (external)
√ Consumer based construct so not included
Self Image (internal)
√ Consumer based construct so not included
Positioning √ (functional aspects)
Consumer based construct so not included
Presentation
√ Implicit / part of Consistent
Communications and Corporate Visual Identity
Systems dimensions . Organisation
√ Included by default due
to service brand/ corporate branding
overlap (Cf; Section 2.2.2)
Relationships
√ √ Considered via Client Relationship
Management dimension Personality √ √ √ (emotional
aspects) Considered via Brand Personality dimension
Culture
√ √ (& vision) Considered via Marketing Culture
dimension Symbol
√ Considered via Corporate
Visual Identity Systems dimension
In terms of vision, the literature review outlined how this thesis’ service brand
identity conceptualisation aligns with an ‘input’ perspective where the brand identity
emanates from the organisation (de Chernatony, 2006). Consequently, this thesis’ position
with regards to service brand identity is consistent with the work of several brand identity
authors (Aaker, 1996a; Aaker and Joachimsthaler, 2000; de Chernatony, 2006; Keller,

116
2003; Kotler and Keller, 2008) whose views embody a managerial perspective which
relates to the strategist’s vision for his or her brand. Hence, this thesis does not consider
vision as being a dimension of brand identity, more that vision is synonymous with service
brand identity, that is, service brand identity is concerned with making manifest the brand
strategist’s vision (cf: Section 2.4.3).
Given the input or managerial perspective this thesis adopts, several consumer
based dimensions from the brand identity literature fall outside the domain of service
brand identity. These relate to self image, reflection and positioning. Self image and
reflection (Kapferer, 2004) are ruled out given they are consumer and not managerially
based constructs. They are grounded in the consumer behaviour literature’s self concept
(Belk, 1988; Rosenberg, 1979; Sirgy, 1982). Drawing on Reis and Trout’s (1972) seminal
work, positioning can be regarded as creating a position in the “prospects mind” (p. 181).
Whilst, organisations try to position their goods or services, strictly speaking, the brands
position vis-à-vis its competitors, resides with the consumer and not the organisation. In
this sense, positioning can be regarded as more akin to image (Abratt, 1989, Boulding,
1956, Dowling, 1986, Grunig, 1993, Kennedy, 1977, Martineau, 1958, Poiesz, 1989,
Worcester, 1986) or reputation (Argenti and Druckenmiller 2004; Chun 2005; Davies et al.
2003; Dowling 1994; Fombrun 1998; 1996; Fombrun and Shanley 1990; Fombrun and van
Riel 1997; Fombrun et al. 2000; Haywood 2005) than brand identity given it resides in the
stakeholders, not the brand strategist’s mind (cf: output perspective). It is also important to
make the distinction between positioning and brand identity. For instance, Kapferer (2004)
notes how positioning is regarded as the manifestation of a ‘facet’ of brand identity in
relation to competitive offerings as opposed to being a part of brand identity per se (p.

117
222). Additionally, in comparison to positioning “[i]dentity is more stable and long
lasting, for it is tied to the brand roots and fixed parameters.”(Kapferer, 2004: 102).
Hence, it is contended here positioning lies with the consumer. Furthermore, whilst
positioning and brand identity are related, the former is not a dimension but a consequence
of the latter.
de Chernatony (2006) noted the importance of “presenting the brand to
stakeholders with a design and promotional support that differentiates the brand in a
manner which stakeholders welcome” (p. 46). As will be discussed later in the chapter, this
thesis considers presenting the brand as being an integral part of, indeed as synonymous
with communication and symbolism. Both of these areas are included in the preliminary
service brand identity framework.
With regards to ‘product’ / ‘physique’, given this thesis service focus, these
dimensions were not regarded as central. However, as will be discussed later, physique can
play a role in symbolism, or more accurately corporate visual identity systems (Melewar,
2001; Melewar et al., 2005a; Melewar and Saunders, 1998; 2000; Melewar et al., 2001;
Van den Bosch et al., 2005, 2006a; Van den Bosch et al., 2006b), in the form of logo,
premises, clothing, vehicles and so forth which is considered via the inclusion of
symbolism, or more accurately corporate visual identity, as will be highlighted later.
Finally, given the similarities between corporate and service branding (Section 2.2.2), it is
argued that by default the brand is the ‘organisation’ which results in this dimension being
accounted for.

118
Consequently, guided by the first stage of Churchill’s (1979) paradigm, this thesis
was able to ‘trim’ redundant dimensions from the current brand identity literature. These
were vision, self reflection, self image, positioning, presentation and product / physique
whilst the symbolism, relationships, personality and culture dimensions remained.
Consequently, it can be seen how adopting this approach is consistent with Netemeyer et al
(2003) who noted “the construct’s definition and content domain determine theoretical
dimensionality” (p. 9).
Exploring the domain of service brand identity also draws on the author’s
understanding of the broader ‘identity’ literature. As the literature review (Section 2.4.6)
outlined this encompasses incorporating corporate identity dimensions (and so indirectly
organisational identity literature) as part of this thesis’ service brand identity
conceptualisation. Specifically, this relates to the view that in a service brand context, the
Interdisciplinary School with its tenets of behaviour, symbolism and communications
provided both a pertinent theoretical home for the brand identity orphan and particularly
relevant dimensions. The relevance of the Interdisciplinary Schools ‘behaviour’ and
‘symbolism’ tenets has already been explicitly considered above via the brand identity
literature. As will be discussed in later this chapter, ‘communication’ can be regarded as
critical to mobilising service brand’s identity. If the service brand identity is not
communicated both internally and externally it merely remains a psychological construct
within the brand strategist’s mind. It is appreciated de Chernatony’s (2006) ‘presentation’
dimension alludes to communications. However, the communications dimension of the
corporate identity mix was regarded as being relevant given this thesis’ desire to draw on
the wider identity literature and the need to make explicit this construct’s importance to

119
service brand identity. In terms of the organisational identity literature, employee
identification with the organisation was discussed in the literature review as influencing
behaviour (cf: He and Mukherjee, 2009) which itself is a manifestation of culture
(Balthazard et al., 2006) and so has already been included as a dimension.
Consequently, although this thesis’ conceptualisation of service brand identity has
been primarily informed by brand identity authors, the way in which service brand identity
is made manifest via its dimensions draws on brand, corporate and organisational identity
literature (cf: Section 2.4.6).
This section of the chapter has outlined why certain dimensions were included and
excluded when developing a preliminary view on service brand identity dimensionality.
Consistent with the scaling literature, this process was guided by the earlier stages of
Churchill’s (1979) paradigm which involved defining and then specifying the domain of
the construct. Taking this step involved distilling the brand, corporate and organisational
identity literatures. Now the preliminary dimensions of service brand identity have been
considered this chapter’s attention will turn to presenting a preliminary service brand
identity framework which will then be justified.

120
Brand Personality
Marketing Culture
Corporate Visual Identity Systems
Client Relationship Management
Integrated Marketing Comms
3.4. A Preliminary Service Brand Identity Framework
Figure 15 presents a preliminary service brand identity framework. The
development of this framework was informed by the literature review and the extant
scaling literature where construct definition informs construct domain. Representing the
construct visually also aims to clarify the author’s thinking and facilitate reader
comprehension (Whetten, 1989). The previous section of the chapter postulated
dimensions of service brand identity to be marketing culture, corporate visual identity
systems, client relationships management, brand personality and integrated marketing
communications.
Figure 15 A Preliminary Service Brand Identity Framework
Dimensions of Service Brand Identity
Service Brand
Identity

121
At this stage it should be noted how the ‘identity’ literature tends to refer to
categories of constructs such as ‘culture’, ‘symbolism’ and ‘communications’. However,
only constructs and not categories of constructs are unsuitable for scaling procedures
(DeVellis, 1991). The reason being each category represents a pool of latent variables
which themselves are suitable for scaling procedures (DeVellis, 1991). For instance,
culture encompasses constructs such as corporate culture, learning culture, marketing
culture to name a few. Given this issue, a specific construct, within a category was chosen.
For example, marketing culture within the culture category. Similarly, corporate visual
identity systems relates to symbolism. The detail of these specific constructs will be
explored later in this chapter.
It should also be noted the preliminary service brand identity framework only
considers the focal construct, that is service brand identity. Service brand identity’s
antecedents are not considered. The reason being service brand identity is a new construct
and so is not embedded within a nomological network (Cronbach and Meehl, 1955).
Consequently, it was not possible to consider antecedents at this stage given they do not
exist. However, as Section 7.6 outlines once the dimensionality of the construct has been
established, considering service brand identity’s wider nomological net provides a fruitful
avenue for subsequent research.

122
3.5. Postulating the Domain of Service Brand Identity
The previous sections of this chapter, guided by the extant scaling literature, drew
on the identity literature to propose five dimensions that constitute the domain of service
brand identity. These were marketing culture, corporate visual identity systems, integrated
marketing communications, client relationship management and brand personality.
Before this chapter’s justifies the proposed dimensionality of the preliminary
framework (Figure 15) it is important to outline why dimensions were postulated and not
hypothesised. The decision to postulate dimensions was the function of three factors.
Primarily, this approach is consistent with previous scale development literature which
postulates as opposed to hypothesising dimensions (Bennet et al., 2005; Cretu and Brodie,
2007; Lings and Greenley, 2005b; Simoes et al., 2005; Sin et al., 2005a; Venable et al.,
2005; Walsh and Beatty, 2007). Furthermore, guided by the extant scale development
literature (Anderson and Gerbing, 1988; DeVellis, 1991; Netemeyer et al., 2003), which
augmented Churhill’s (1979) seminal work, previously established scaling procedures were
followed. This entailed employing exploratory factor analysis prior to confirmatory factor
analysis. The exploratory nature of the former means initial dimensions infrequently
remain at the confirmatory factor analysis where a hypothesis could be formally tested.
Consequently, the more exploratory language and approach of postulating as opposed to
hypothesising dimensions was employed. Finally, service brand identity is a holistic
second order construct. The logic for considering the construct holistically is grounded in
dimension interactions outlined later in this chapter (section 3.7.3). As a result of this
perspective it was not appropriate to hypothesise individual dimensions. The reason being

123
this approach would not consider the construct, that is the whole, but only the parts. For
these reasons, it was considered more appropriate to postulate than hypothesise
dimensions. Now that the rationale for the terminology employed has been shared the
inclusion of each service brand identity dimension will be justified.
3.5.1. Marketing Culture
The literature review highlighted the salient role ‘culture’ plays in both the brand
(Aaker, 1996a; Aaker and Joachimsthaler, 2000; de Chernatony, 2006; Kapferer, 2004)
and corporate (Balmer, 1995, 1998; Olins, 1978a; Van Riel, 1995) identity literatures.
The literature review also noted how organisational identity (Dutton and Dukerich, 1991,
Dutton et al., 1994, Gioia et al., 1998, Ashford and Mael, 1996, Albert and Whetten, 1985)
is a behavioural antecedent (He and Mukherjee, 2009a) which itself is a manifestation of
culture (Lepak et al., 2006). Consequently, this provided an early indication that culture
should fall under the domain of service brand identity.
However, the culture literature is rich and diverse (Ogbonna and Harris, 2000).
Consequently, in order to structure this section the organisational or corporate literature is
initially introduced. The marketing culture literature Webster (1990, 1993, 1995), which is
a specific form of organisational culture, is then reviewed. It is important to review the
broader organisational culture literature given the influence it had on Webster’s marketing
culture work.

124
Deshpande and Webster (1989a) define organisational culture as “the unwritten, the
formally decreed, and what actually takes place, it is the pattern of shared values and
beliefs that helps individuals understand the functioning of the firm and thus provides them
norms for behaviour in the firm” (p. 4). Two points should be noted from this definition.
Firstly, culture focuses on the informal or ‘latent’ forces within the organisation. These can
potentially influence behaviour to a greater extent than formal mechanisms (Appiah et al.,
1999; Deshpande and Webster, 1989a; Schneider and Rentsch, 1988; Webster, 1995;
Wilson, 2001). Secondly, values play a central role in the development of culture. Values
are important because they inform or guide behaviour (de Chernatony and Cottam, 2008;
Deal and Kennedy, 1982; Kotter and Heskett, 1992; Rokeach, 1973). Behaviour is of
particular relevance to this service based branding thesis given ‘stronger’ cultures, with
commonly held pervasive values, facilitate behavioural consistency across the organisation
(Gordon and DiTomaso, 1992; O'Reilly and Chatman, 1996; Sorensen, 2002), in other
words, norms of organisational behaviour. The relevance of this point is reiterated by Olins
(1995) who outlined how consistent employee behaviour is particularly important for
service brands. Similarly, Chan et al.(2004) suggest organisational culture is a particularly
valuable resource for service companies. Focusing on service brands, Webster (1995)
outlines “[d]ue to the unique characteristics of services (i.e. intangibility, insuperability of
production and consumption, perishability and variability) the nature of the culture of a
service firm is particularly important and worthy of attention” (p. 7). However, as noted in
the literature review, consistency is a particularly acute challenge for service brands due to
the human element (Zeithaml and Bitner, 1996; Zeithaml et al., 2006). Consequently,
culture can be regarded as providing employees with a cognitive ‘schema’ or ‘logic’ which
enables them to not only behave in a manner consistent with the desired brand identity but

125
also respond to unfamiliar situations in a way which is consistent with the desired brand
identity.
Following from Schein’s (1991) work, Sorensen (2002) notes how organisational
culture provides employees with a “framework” (p. 70) for responding to the environment
and so culture can be regarded as providing behavioural direction (Van de Post et al.,
1998). Indeed, O'Reilly and Chatman (1996) note how culture helps with “defining
appropriate behaviours for organisational members” (p. 160) whilst Harrison (1972)
outlines, in rather simplistic terms, how organisational culture signifies the ‘do’s and
don’ts’ of behaviour in the organisation. Rashid et al. (2003) follow a similar logic to
these scholars by considering, rather autocratically, culture as “the structural and control
system to generate behavioural standards” (p. 711). This position is consistent with other
authors such as Wilkins and Ouchi (1983) who also regard culture as a control apparatus.
Consequently, building on Deshpande and Webster’s (1989a) work, culture can look to
provide implicit rules or norms that act as control mechanisms with regards to expected
and acceptable behaviour. The logical extension to this argument being such behaviour
plays an important role in service brand identity execution.
Consequently, the above literature outlines how culture provides a way the brand
owner can try to promote or encourage behaviour which is aligned with its brand values
and desired identity. The word ‘try’ has been used intentionally. The reason being
employees may not passively react to their values being massaged so they align with the
brand. However, in the context of this research, this thesis aligns with the integration
paradigm (Deshpande and Webster, 1989a; Schein, 1984) where culture is something the
organisation has which can be managed as an independent variable. This contrasts with

126
the differentiation paradigm where culture is something the organisation is (Meyerson and
Martin, 1987). The reason being, consistent with the service brand identity definition
developed earlier this thesis adopts a managerial perspective, that is, service brand identity
is a construct that can be managed.
de Chernatony (2006) focuses the debate on culture and brand identity by noting:
“When an organisation has its different departments aligned with a desired culture,
there is a more unified identity presented to different stakeholders and greater
likelihood that staff will act in a more consistent manner.” (p. 158)
The notion of an ‘aligned’ culture implies that norms have been established which
promote consistent behaviour across the organisation. This perspective echoes Kotter and
Heskett’s (1992) Theory I of a ‘strong’ corporate culture where “almost all managers share
a set of relatively consistent values and methods of doing business” (p. 15). However,
Kotter and Heskett (1992) outline how considering cultures merely from a ‘strong’
perspective may be an oversimplification. Strong cultures are not always beneficial and
can sometimes become dysfunctional. The reason being they can stifle creativity and
innovation (Nemeth, 1997) and encourage ‘groupthink’ (Kim et al., 2004; Lee and Yu,
2004). Such a situation can be a function of successful financial performance where the
development and reinforcement of strong cultures which were initially, but are no longer,
suitable for the organisation’s environment were developed. Consequently, Kotter and
Heskett (1992) forward Theories II and III of corporate culture. The former focuses on the
notion of a strategically appropriate culture which ‘fits’ with the organisation’s context or
environment at that time. For, example, a brand striving for cost leadership would be well

127
served to develop an organisational culture built around strict financial control,
accountability and operational efficiency. A criticism of Theory II is that the culture-
context fit may no longer be appropriate for the environment / market due to change.
Consequently, it could be regarded as engendering a short to medium term perspective.
Theory III relates to leaders / managers ability to adapt adjust the organisation’s strategy in
light of all ‘constituencies’ (customers, shareholders and employees) changing needs via
an adaptable corporate culture. Hence, with Theory III, the change occurs in order to
retain an ongoing fit between the organisation and its constituencies, whereas Theory II
relates to a culture / environment fit which is more static in nature. Consequently, Kotter
and Heskett’s (1992) work, especially Theory III can be regarded as a evolution of the
culture literature given it encompasses more of a dynamic and fluid perspective where
culture has to change in response to the organisation’s environment.
This section so far has concentrated on the ‘broad’ or high level construct of
organisational culture. However, several scholars have noted there can be a ‘type’ of
culture within an organisation. For example, Desphande and Farley (1999) refer to
competitive, entrepreneurial, bureaucratic and consensual cultures whilst Denison (1990)
refers to participative and involvement cultures. One type of culture that is of particular
interest to this service based research is Webster’s (1990, 1993, 1995) marketing culture.
Webster (1990, 1993, 1995), building on the work of Deshpande and Webster
(1989a), advances a marketing culture which is regarded as a “component of the firm’s
overall culture”(Webster, 1995 :7). Marketing culture was defined as “the unwritten, the
formally decreed, and what actually takes place in a marketing context, it is the pattern of
shared values and beliefs that helps individuals understand the marketing function and thus

128
provides them with norms of behaviour in the firm.” (Webster, 1993: 113). In a similar
manner to Deshpande and Webster (1989a) the latent power of culture and the important
influence values have on developing norms of behaviour are emphasised in this definition,
albeit with a marketing focus. Hence, it can be seen that a marketing culture refers to the
importance placed on the marketing function (Webster, 1995) which, in its turn, provides a
unifying and customer-centric organisational focus.
Webster (1993, 1995) operationalised a marketing culture via six dimensions.
‘Service quality’ is concerned with the organisation’s commitment to meeting the
customers needs’ whilst ‘interpersonal relationships’ consider the way managers interact
with their employees and how the latter are treated by the organisation (Webster, 1993,
1995). The role employees play is particularly important in that a marketing culture
considers frontline employees as strategic partners (Karatepe et al., 2005) as opposed to an
organisational resource whose feelings are not accounted for. ‘Selling task’ refers to the
organisation’s human resource practices such as recruitment and training. ‘Organisation’ is
concerned with the creation of a suitable work environment, effective time management,
professional appearance and so forth (Appiah et al., 1999) whilst ‘internal communication’
allows employees to better understand the vision and mission of the organisation (Karatepe
et al., 2005). Finally, ‘innovation’ relates to the organisation and employees receptiveness /
responsiveness to change.
The marketing culture literature is of particular relevance to this research for
several reasons. First, as the name implies, the marketing culture literature was developed
specifically with a marketing focus in mind. The logic being that a stronger marketing,
that is a culture which scores highly on the Marketing Culture Scale (Webster, 1993;

129
1995), fosters an internal environment conducive to implementing marketing initiatives
(Appiah et al., 1999). In the case of this research service brand identity is the marketing
initiative of interest.
Second, whilst more product orientated brands can also look to proactively manage
their organisation’s culture, the marketing culture literature was developed specifically
with service brands in mind. Consequently, this perspective accounts for the pivotal role
humans play in service brand delivery (Lovelock et al., 1999). As a result, developing a
supportive marketing culture literature, in comparison to previous (standardisation or
process driven) service branding approaches which resulted in mechanical responses to
atypical customer needs, was regarded as a more effective way of managing the variability
humans bring to service brand delivery (Karatepe et al., 2005). This position is consistent
with other scholars (Appiah et al., 2000; Pascale, 1984; Velliquette and Rapert, 2001) who
noted how effective use of culture is critical for service brands due to the employee-
customer interaction. Third, Webster’s work was driven by a customer focus. Given the
centrality of the customer to the marketing literature (cf: Marketing Concept / Orientation)
this increases the construct’s relevance to this research. Fourth, in line with the
organisational culture literature, Webster (1995) notes how a marketing culture “refers to
unwritten policies and guidelines which provide employees with behavioural norms” (p.6).
The logic being that such behavioural norms support the desired service brand identity via
greater behavioural consistency (Olins, 1995; Zeithaml and Bitner, 1996; Zeithaml et al.,
2006) at the ‘service encounter’ (Bowen et al., 1990). It could be argued Webster’s work
incorporates the more complex issues of an adaptable or Theory III ‘type’ culture (Kotter
and Heskett, 1992). A marketing culture is particularly adaptable insofar it aims to develop

130
and inculcate values which make the organisation receptive and responsive to change via
the ‘innovation’ dimension. Finally, a marketing culture also considers two of the three
constituencies (i.e. customers and employees) whilst human resource practices aim to
recruit / develop employees whose values are aligned with, and so help perpetuate a
marketing culture. Consequently, a marketing culture was regarded as a particularly
relevant culture ‘type’ in the context of this service based research.
This section opened by outlining the salient role culture plays in the identity (brand,
corporate and organisational) literature. The influence of ‘organisational’ culture in
guiding and shaping employee behaviour was then noted (Deal and Kennedy, 1982) with
two points being of particular note. First, culture plays a pivotal role in directing
employees and management towards the same goal (Deshpande and Webster, 1989b;
Webster, 1990). Second, culture helps promote consistent behaviour across the
organisation (de Chernatony, 2006; Gordon and DiTomaso, 1992; O'Reilly and Chatman,
1996; Olins, 1995; Sorensen, 2002). The latter has been noted as providing particular
challenges for service brands due to the variability humans bring (Zeithaml et al., 2006;
Zeithaml et al., 1985) with culture has been proposed as one way of addressing or
managing this issue (Gordon and DiTomaso, 1992; Karatepe et al., 2005). The marketing
culture literature was then reviewed (Webster, 1990, 1993, 1995) given it was regarded as
being particularly relevant to this research’s primary context. Of particular note was how a
marketing culture looks to create an environment conducive to developing, nurturing and
supporting marketing activities whilst being developed with service brands in mind and
promoting the development of a culture which is ‘adaptable’ to change (Kotter and

131
Heskett, 1992). Consequently, for these reasons a marketing culture is considered a
dimension of service brand identity.
3.5.2. Corporate Visual Identity Systems
The literature review highlighted how, due to their characteristics, service brands
frequently try to ‘tangibalise’ their offering through the use of ‘symbolism’ (Berry, 2000;
Bitner, 1990; Levitt, 1981; Miller et al., 2007; Shostack, 1977; Zeithaml and Bitner, 1996;
Zeithaml et al., 1985). Of particular note was Shostack’s (1977) seminal paper which
outlined how intangible dominant entities needed to use tangible ‘evidence’ to make their
offering more concrete.
However, the term ‘symbolism’ encompasses a variety of related disciplines and
topics including semiology (Chandler, 2007; Noth, 1995), symbolic consumption
(McCracken, 1988) and symbolic interactionism (Schenk and Holman, 1980) to name a
few. Due to the broad nature of this term, the corporate visual identity systems literature
(Melewar et al., 2005a; Melewar and Saunders, 1998; 2000; Van den Bosch et al., 2006a;
Van den Bosch et al., 2006b) will be drawn on. The reason being this literature will help
focus this thesis’ theoretical contribution whilst providing relevant literature with regards
to the more tangible or concrete elements associated with developing service brand
identity. This approach is consistent with authors such as Baker and Balmer (1997) who
regard corporate visual identity as being synonymous with the ‘symbolism’ tenet of the
corporate identity mix.
132
Van den Bosch et al. (2004) outlined how the corporate visual identity literature
can be conceptualised as operating at the three levels. The strategic level focuses on
corporate choices with regards to brand structure, that is a monolithic, endorsed or a
branded approach. The operational level is concerned with corporate visual identity
processes and systems whilst the design level concentrates on logos, names, slogans and
typography. This research focuses on the design level of corporate visual identity given its
pervasiveness in the identity (brand and corporate) literature and the important role such
physical cues play for service brands. Guided by this view, corporate visual identity
consists of name, symbol and / or logo, typography, colour and slogan (Dowling, 1994;
Melewar and Saunders, 1998; 2000; Olins, 1986; Simoes et al., 2005; Topalian, 1984; Van
den Bosch et al., 2005, 2006a) and is transmitted through buildings, vehicles, clothing,
marketing collateral and so forth (Melewar and Saunders, 2000). In combination such
visual cues provide means through which the organisation can project consistent visual
identity to its ‘publics’ (Henrion and Parkin, 1967). Consequently, whilst a logo is an
important part of corporate visual identity, the construct relates to more than the logo alone
(Van den Bosch et al., 2005).
Within the brand identity literature, authors tend to use the term ‘symbol’ or
‘symbolism’ and ‘logo’ interchangeably. For instance, Aaker (1996a) outlines how “a
strong symbol can provide cohesion and structure to an identity and make it much easier to
gain recognition and recall……it just takes a glance to be reminded of the brand” (p. 84).
Developing this point further, Aaker (1996a) outline how brands that use symbols (i.e.
logos) to harness their metaphorical power are particularly effective in conveying key
aspects of their brand identity. For example, Citigroup’s umbrella signifies shelter and

133
protection. In a similar manner, the strategic value of symbolism / logos is echoed by
Aaker and Joachimsthaler (2000) who argue logos are most important when they create a
visual metaphor that simplifies the process of communicating complex brand benefits. The
metaphorical value of brands has also been noted outside the brand identity literature. For
instance, focusing on services, Levitt (1981) highlights the metaphorical value of logos by
noting how they “become surrogates for the tangibility that cannot be provided or
experienced in advance” (p. 97). Similarly, Biel (1993b) argues the “visual metaphor can
provide a powerful set of symbols that are particularly important in service categories,
where there is no tangible product per se” (p. 73). The logic underpinning this perspective
in grounded in the view that humans tend to incorporate new stimuli and information into
existing knowledge structures via association with other metaphorical objects (Jonassen,
1995).
The importance of a brand’s objective and tangible elements is also raised in
Kapferer’s (2004) work via the ‘physique’ facet of the Identity Prism. Whilst not explicit
in his work, it is not unreasonable to extend the physique logic to service brands via
organisational name, nomenclature, vehicles, employee clothing and so forth all of which
contribute to a brand’s visual identity. For example, a boutique strategy consultancy will
reinforce this desired brand identity via a prestigious address and opulent offices. In a
similar manner, flight attendants uniforms are intended to visually reinforce the desired
brand identity with Singapore airlines being both a pioneer and exemplar in this respect.
In a similar manner to the brand identity literature, corporate identity scholars tend
to use the terms symbolism and corporate visual identity interchangeably. The latter
constitutes a tenet of the corporate identity’s interdisciplinary school (Van Riel and

134
Balmer, 1997) and draws heavily on earlier and more visually orientated scholars’ work
such as Carter (1982) and Dowling (1994). In the context of corporate identity, when
considering symbolism, Van Riel and Van den Ban (2001) outline how logos are an
‘efficient management tool’ which can be used to express the desired features the
organisation wishes to express to its stakeholders. Linking personality and symbolism,
Marwick and Fill (1997) regard symbolism as the element of the corporate identity mix
which helps communicate the organisation’s personality to its various stakeholders. This
view is consistent with Van Riel and Van den Bosch (2001) who outline how
organisational symbolism such as its logo has the potential to help organisations express
their characteristics. More recently Balmer (2008) noted how symbolism can help
communicate the quintessence of a corporation including its values, standards and
distinctiveness. Melewar et al. (2006) make a similar point when referring to the Co-
operative bank’s visual identity which aims to reflect the ethically orientated values and
goals of the organisation. Hence, in a similar manner to the brand identity literature,
corporate identity scholars consider visual identity as playing an important role in making
the underlying aspects of their brand or organisation manifest. This position is consistent
with other services marketing scholars (Berry et al., 1988; Miller et al., 2007) who note
how logos can be used to express desired service features, benefits or attributes. Similarly,
Legg and Baker (1987), albeit more philosophically, note how symbols help service brands
in particular to convey their central brand meaning in terms of what the brand wants to
stand for. For example, Virgin’s slanted typography signifies it is an atypical corporate
organisation. Such an approach is in sharp contrast to large professional services
companies such as Accenture and KPMG for example. Consequently, it can be seen how
the logo or other visual identity cues become an apparatus for conveying or expressing the

135
brand or organisation (Schultz et al., 2000). As outlined above this could include values,
standards, service features or personality to name a few.
The important role visual identity plays in brand differentiation has been
acknowledged by several scholars. For instance, Boyle (1996) highlights how the brand’s
visual identity helps overcome the issue intangibility creates in terms of consumers being
able to differentiate between brands. In a similar manner, de Chernatony (2006) outlines
how, for service brands, physical cues such as the logo, clothes employees wear, premises
and so forth can help distinguish a brand. This point has been reiterated by other authors
(Aaker, 1996a; Onkvisit and Shaw, 1989; Park et al., 1986) who stress how intangible
cues, such as the brand name and logo, provide a powerful means of service brand
differentiation. This position is consistent with Melewar et al.’s (2001) empirical research
which highlighted how for industrial, service and consumer brands, corporate visual
identity can be used to differentiate an organisation from its competitors.
From a consumer decision making perspective, services are high on experience and
credence values (Sharp, 1995; Zeithaml and Bitner, 1996). Consequently, it can be
challenging for customers to assess competing (intangible) offers before they make a
purchase due to service brands lacking physical differences (Legg and Baker, 1987; Sharp,
1995; Zeithaml, 1981). Therefore, consumers frequently base service brand evaluations on
factors that are not directly related to the service itself (Keller, 2003). Visual cues such as
logo, employee dress and premises frequently being used as surrogate ‘evaluation
variables’ (Hansen, 1972). Hence, visual identity plays a particularly important role by
making the abstract nature of service more concrete (cf: Shostack, 1977).

136
Within the B2B literature only a limited number of scholars have embraced
corporate visual identity from a broader perspective as initially developed in the B2C
literature (Dowling, 1994; Melewar and Saunders, 1998; 2000; Simoes et al., 2005; Van
den Bosch et al., 2005, 2006a). For instance, Blomback and Axelsson (2007) acknowledge
the role of premises and employees whilst Kotler and Pfoertsch (2006a) consider the
efficacy of metaphor as a vehicle for conveying brand values, attributes or personality. The
importance of symbolism and other forms of visual identity to communicate and reinforce
brand values has also been noted (Jackson and Tax, 1995) whilst Keller and Lehman
(2006) consider the importance of names, logos, symbols, packaging and slogans. These
authors tend to be the exception with the majority of B2B scholars focusing on brand
name.
A range of perspectives have emerged from the B2B literature in the context of
brand name. Kotler and Pfoertsch (2006a) consider brand names as a shorthand for
everything that is being offered, be it reliability of delivery or value for money whilst
Shrimp (1993) notes how brand names can evoke feelings of trust, confidence, security,
strength, durability, speed, status and exclusivity (cf: connection with emotion in B2B
branding). Consistent with the view that brand names have emotional loadings, Hutton
(1997) notes individuals make more emotionally informed decisions based on name
instead of price when failure of the purchased brand could have adverse affects for the
buyer and / or their organisation. This is consistent with van Riel et al. (2005) who found
the influence of brand names is amplified under conditions of increased perceived risk. The
role brand name plays in building brand equity (Low and Blois, 2002) and realising
corporate success (Mitchell et al., 2001) have also been noted in the B2B literature.

137
In comparison to the B2C literature, limited scholarly work has been published
concerning logos. Kotler and Pfoertsch (2006a) outline how logos help reflect corporate
values and characteristics of a brand in addition to facilitating stakeholder-brand
connection given humans tend to be more receptive to images and symbols than text . In
the context of B2B markets, Aaker and Joachimsthaler (2000) note the particularly
important role logos play in B2B markets where complex functional benefits need to be
portrayed in more vivid and memorable ways.
As the above outlines, in comparison to the B2C literature, the B2B corporate
visual identity literature is at an embryonic stage in terms of considering the breath and
depth of factors that comprise the construct with the majority of scholars focusing on brand
name and to a lesser extent logo.
This section has highlighted the critical role corporate visual identity plays for
service brands and drew on the brand, service marketing, brand identity and the corporate
identity (visual element) literatures. Of particular note was how service brands need to
tangibalise the intangible (Levitt, 1981) due to their inherently invisible nature (Van den
Bosch et al., 2006a) and that visual identity plays a particularly powerful role when used in
a metaphorical manner (Aaker, 1996a; Aaker and Joachimsthaler, 2000; Biel, 1993b;
Levitt, 1981). The use of corporate visual identity to facilitate service brand identity
differentiation was also noted. Notwithstanding this point, it is also appreciated corporate
visual identity plays an important role in branding tangible dominant entities (Shostack,
1977) or tangibles (Levitt, 1981). However, in line with the above literature, it is
contended the role of visual cues such as logo, name, premises and so forth is particularly
important for service brands (Berry et al. 1988; Bitner 1990; Levitt 1981; Van Riel 1995;

138
Zeithaml and Bitner 1996; Zeithaml et al. 2006). The reason being such cues become a
way, vehicle or apparatus for the brand to convey or visually express itself. This is
consistent with Keller (2003) who noted that, due to service intangibility, ‘symbols’ can be
used by the brand owner to convey the brand identity in a more concrete and real manner.
The particularly important role aspects of corporate visual identity such as name and logo
play in B2B markets was also noted. Consequently, for these reasons corporate visual
identity systems is considered a dimension of service brand identity.
3.5.3. Client Relationship Management
The importance of brands developing relationship with customers has been noted in
a broad range of literature. This includes the service dominant logic (Lusch and Vargo,
2006; Lusch et al., 2007; Vargo and Lusch, 2004a), marketing (Sheth and Parvatiyar, 1995;
Webster, 1992), relationship marketing (Gronroos, 2000b; 1994, 1995, 1998), service
marketing (Berry, 1983, 1995; Bitner, 1995), brand (Aaker et al., 2004b; Agarwal, 2004;
Bengtsson, 2003; 1992, 1993; 1995, 1998, 2005) and brand identity (Aaker, 1996a; Aaker
and Joachimsthaler, 2000; de Chernatony, 2006; 1997, 2004) literature. These will now be
discussed.
A key tenet of the burgeoning service dominant logic (Vargo and Lusch, 2004a)
concerns the co-creation of value with customers in the context of a ‘relationship’. Value is
created by consumers in collaboration or dialogue with the brand via application of their
operant resources to the organisation’s value proposition (Lusch et al. 2007; Vargo and
Lusch 2004b). The fervour with which this new order has been adopted in academic circles

139
highlights the importance of conceptually moving marketing research from a transactional
to relational or dialectical (Holt, 2002) perspective. Hence, it is important marketing
research considers relationships.
Several scholars highlight how a relational approach is particularly important for
service brands. The reason being service are particularly interpersonal and variable in
nature (Berry, 1995; Dall'Olmo Riley and de Chernatony, 2000) . Such a perspective is
consistent with scholars such as Rust et al. (2000) who note how services are more
relationships based. In a similar manner, Ang and Buttle (2006) highlight how service
companies tend to have a higher propensity for relationship-building than non-service
companies. The reason being due to their intangibility and variability, perceived risk
associated with service brands may be higher which can be reduced by building
relationships based on trust.
The importance of developing a relational approach has been noted in several
marketing literature streams. For instance, Webster (1992) notes the importance of a
marketing paradigm which “binds actors together in ongoing relationships” (p. 10) whilst
Day (1992) reiterates this point by highlighting the strategic importance of customer and
organisation relationships. In a similar manner, relationship marketing (Gronroos, 1990,
1991, 2000b; Gummesson, 1994, 1995, 1998) service marketing scholars (Berry, 1983,
1995; Bitner, 1995) have also noted the importance of developing relationships is
amplified in the case of service brands due to the high level of employee and customer
contact.

140
Focusing on the brand identity literature, Aaker (1996a), considers the brand-
customer relationship as the “bottom line” (p. 103) which helps drive and enhance brand
identity programs. The reason being relationships help build a stronger emotional bond
than if just functional aspects of the brand are developed. The result of this stronger
emotional attachment is greater brand loyalty (Aaker, 1996a). Building on Aaker’s
(1996a) work, Aaker and Joachimsthaler (2000) note how relationships form an integral
part of brand identity where “one goal of the brand should be to create a relationship with
its customers” (p. 50). When considering Kapferer’s (2004) Brand Identity Prism, one
facet highlights how brands are “often at the crux of transactions and exchanges between
people” and that “service is by definition a relationship” (p. 10). de Chernatony’s (2006)
Components of Brand Identity framework outlines the importance of relationships staff
have with each other, customers and other stakeholders as a dimension which “underpins”
(p. 46) brand identity. Consequently, this view appears to be grounded in Stakeholder
Theory (Donaldson and Preston, 1995) which outlines how “organisations have
responsibilities to a broad range of audiences and must, as best possible, draw stakeholders
into relationships with the organisation” (p. 79). de Chernatony’s (2006) stakeholder
perspective on brand relationships is of particular relevance to this service based research.
The reason being the literature review (Section 2.2.2) highlighted how for corporate
brands, which is a pervasive brand structure in the service sector (Aaker and
Joachimsthaler, 2000; Berry, 2000; Berry et al., 1988; de Chernatony, 2001; Diefenbach,
1987; Pina et al., 2006) a broader stakeholder concern is particularly important.
The important role building and managing client relationships plays, that is
relationships with upstream channel partners, has been noted by several scholars in the

141
B2B literature. Consistent with Kotler and Keller (2006b), Malaval (2002) highlight how
relationships perform a crucial role for B2B brands due to the interpersonal nature of the
market and selling process whilst Bentsson and Servais (2005) argue brand may be a
relationship prerequisite. van Riel et al. (2005) outline how in markets where products are
complex or high in value, as is frequently the case in B2B markets, buyers expect value-
adding relationships. Similarly, Ford et al. (2003) note how B2B markets are characterised
by stability and enduring relationships. This is consistent with de Chernatony and
McDonald (1998) who contend buyer and seller relationships form an important
characteristic of B2B markets. Lynch and de Chernatony (2004) augment these scholars’
views suggesting meaningful relationships in B2B markets are built on both functional and
emotional values which themselves help drive competitive advantage.
Drawing on a broad range of literature this section has discussed how developing
relationships or ‘bond’ between the seller / corporation and buyer (cf: Section 2.2.1) plays
a critical role not only within the brand identity, but several ‘marketing’ literature streams.
However, from a terminological perspective two points should be noted. First, ‘customers’
tends to be the language employed within B2C markets. Given this research’s secondary
context is B2B markets, the term ‘client’ was considered more appropriate given its
widespread use in B2B markets. Second, given the managerial perspective this research
embodies, referring specifically to the management of client relationships as opposed to
customer relationships was regarded a more accurate reflection of the position this research
adopts. For these reasons the language of client relationship management has been
employed. Consequently, client relationship management is considered a dimension of
service brand identity.

142
3.5.4. Integrated Marketing Communications
The literature review highlighted how ‘communications’ was a tenet of corporate
identity’s interdisciplinary school (Van Riel and Balmer, 1997). Although this facet of the
corporate identity ‘mix’ is referred to as ‘communications’, it is clear authors from this
literature stream are aware communications need to be ‘integrated’ (Balmer, 2001a;
Melewar et al., 2001). Hence, this thesis adopts the position communications is concerned
with integrated marketing communications which can be defined as “an audience-driven
business process of strategically managing stakeholders, content, channels, and results of
brand communication programs.” (Kliatchko, 2008: 140)
Kliatchko’s (2008) definition draws attention to several points such as integrated
marketing communications being an audience-driven process, results focused and
delivering marketing messages or content via communications programs and channels.
However, two points are of particular note. First, consistent with Kliatchko (2008) and
other scholars (Holm, 2006; Madhavaram et al., 2005; Schultz and Schultz, 1998), it is
contended here integrated marketing communications requires the strategic and not tactical
mindset. The reason being IMC necessitates symbiotic orchestration of the
communications mix over a sustained period of time. This cannot be achieved if a tactical
mindset is adopted. Hence, in a similar manner to brand identity, integrated marketing
communications is considered a strategic and not tactical construct. Secondly, the span of
integrated marketing communications encompasses organisational stakeholders and not
just customers. This logic is consistent with the view that service brands need to engage
with a broader range of stakeholders as outlined in the literature review (Section 2.2.2).

143
In terms of the corporate identity literature, Marwick and Fill (1997) note how
marketing communications should be used to express the organisation’s distinctive
qualities. This is a point echoed by Gray (1995) who argues marketing communication is
the means by which a brand conveys its brand meaning to stakeholders. Van Rekom
(1997) highlights how the purpose of marketing communications is to develop a desired
corporate image with target groups whilst Balmer (1995) stresses ineffective
communications “may result in key groups holding erroneous and negative perceptions of
the corporate brand” (p. 35). Hence, integrated marketing communications play a key role
in organisational expression and image formation with the latter being conceptualised in
the literature as the ‘receivers’ interpretation of the ‘senders’ brand identity (Kapferer,
2004).
Whilst several brand identity scholars outline the important role marketing
communications play in mobilising brand identity, integrated marketing communications
was not explicitly identified as a dimension of brand identity. However, in order for
service brand identity to be successfully ‘mobilised’ integrated marketing communications
is essential and so should constitute a dimension of service brand identity. The reason
being if the service brand identity is not communicated, it merely remains as a
psychological construct residing with the brand strategist in the form of his or her vision
for their brand. Furthermore, communications play a pivotal role with regards to other
dimensions such as corporate visual identity and brand personality which were
acknowledged in the brand identity literature. Hence, it is contended here that by default
integrated marketing communications can be regarded an essential dimension of service
brand identity. Adopting this logic appears to be consistent with the brand identity

144
literature. For example, Aaker (1996) considers communications as critical to brand
identity in terms of its “execution” (p.186) whilst Aaker and Joachimsthaler (2000), when
providing guidance on how to elaborate brand identity, note “a key step in implementing a
brand identity is communicating it to organisational members and partners” (p. 89).
Consequently, Aaker and Joachimsthaler’s (2000) work makes explicit the need for
organisations to communicate with both internal and external stakeholders. In a similar
manner the final dimension of de Chernatony’s (2006) model considers “presenting the
brand to stakeholders with a design and promotional support that differentiates the brand”.
Hence, in this context it is reasonable to consider ‘presentation’ as being synonymous with
or constituting ‘marketing communications’. Finally, in developing a theoretical
framework and research propositions, Madhavaram et al.(2005) highlight how integrated
marketing communications play a critical role in the brand identity building process.
Adopting a more balanced perspective, , Fill (2002) stresses how service brands
need to utilise internal communications due to the pivotal role employee play at such
brands. This is a point reiterated by several other authors who outline how achieving
internal and external consistency is vital to conveying coherent service brand messages
(Bhattacharya and Sen, 2003; Kennedy, 1977; Simoes et al., 2005). In line with these
scholars, several brand identity authors note the importance of internal communications at
service brands (Aaker and Joachimsthaler, 2000; Burmann and Zeplin, 2005; de
Chernatony, 2006). For instance, Aaker and Joachimsthaler (2000) outline how “internal
communication programs to employees and firm partners, can be vital to creating the
clarity and culture needed to deliver on the identity” (p. 317). Hence it can be seen how
from Aaker and Joachimsthaler’s (2000) perspective, communication relates to both
external and internal audiences. Adopting this perspective implies the integration of

145
marketing communications needs to occur along two dimensions. One relates to the
integration of external activities. The second concerns the integration or alignment of
internal and external communications. This is of particular importance for service brands
given the need for such organisations to “take their employee with them”.
The important role marketing communications plays in B2B markets has been
noted in the relevant literature for some time (Gilliland and Johnston, 1997) with Mudambi
(2002) highlighting how to leverage the potential of B2B brands, business marketers must
understand and effectively communicate the value of their brands in the market place.
More specifically, the literature outlines how B2B marketing communications tends
to focus on stakeholders and the organisational. For instance, Kotler and Pfoertsch (2006a)
note B2B encounters are complex interactions affected by multiple stakeholders who
organisations need to communicate. Similarly, Bendixen et al. (2004) recommend
marketers consider all stakeholders that might influence a customers perception when
devising their communications strategy. Bendixen et al’s (2004) position is consonant
with Lynch and de Chernatony (2004) who encourage synchronised internal and external
communication of brand values.
In terms of communication focus, B2B brands tend to concentrate on the
organisation and not specific product lines. Bendixen et al. (2004) contend this is a
function of extensive brand lines most B2B organisations have. Consistent with Bendixen
et al. (2004), Han and Sung (2008) suggest to create brand value, B2B organisations need
to develop marketing communications that augment their corporate brand as opposed to
focusing on a range of line brands. Blomback and Axelsson (2007) elaborate on this point

146
by emphasising how B2B communications should look to convey organisational abilities
and opposed to focusing on a given brand line’s benefits.
This section opened by acknowledging how communication, as a construct, is more
explicit in the corporate than brand identity literature. However, this should not imply
brand identity scholars have neglected its importance as this section has outlined.
Consequently, building on both corporate and brand identity literature the role
communications play in mobilising, expressing and executing service brand identity was
highlighted. The role communications plays in B2B markets was also outlined.
Consequently, for these reasons integrated marketing communications is considered a
dimension of service brand identity.
3.5.5. Brand Personality
The literature review highlighted how brand ‘personality’ was the salient dimension
of several brand identity frameworks (Aaker, 1996a; Aaker and Joachimsthaler, 2000; de
Chernatony, 2006; Kapferer, 2004) whilst several corporate identity scholars (Abratt,
1989; Marwick and Fill, 1997; Olins, 1978b, 1995) have drawn on the personality
metaphor to reveal corporate identity.
Brand personality can be defined as “the set of human characteristics associated
with the brand” (Aaker, 1997: 347). Two points should be noted from this definition. First,
the branding literature considers brands having a personality in a metaphorical and not
literal sense (Aaker, 1995). The logic for adopting such an approach is three fold.

147
Primarily, utilising a metaphor capitalises on human’s natural tendency to
anthropomorphise non human things and events (Freling and Forbes, 2005b; Zentes et al.,
2008). Furthermore, such an approach provides a way of accessing and exploring a
complex construct such as brand in a more comprehensible and familiar manner (Davies et
al., 2001). Finally, personification makes brands appear more familiar, comfortable and
less risky (Haigood, 1999). As a result, brands are frequently imbued with ‘typical’ user
personality traits (Helgeson and Supphellen, 2004; Plummer, 1985). For example, a brand
may be sporty or youthful (Aaker, 1997) or modern or exotic (Keller, 1993). Second,
Aaker’s (1997) definition highlights how brand personality is concerned with symbolic
brand associations (Zentes et al., 2008). As indicated above, a brand could be associated
with sporty or youthful connotations.
Initially, it is important to make a distinction between the use of the personality
metaphor in the brand and corporate identity literatures. The brand identity literature
regards personality as a dimension of brand identity whereas several corporate identity
frameworks tend to consider personality as being synonymous with corporate identity. For
example, Van Riel (1995), adapting the work of Birkigt and Stadler (1986), regards
corporate identity as being concerned with corporate personality which is made manifest
via the tenets of behaviour, symbolism and communication (cf: The Interdisciplinary
School). In a similar manner, Marwick and Fill’s (1997) Corporate Identity Management
Process Model regards personality as “a means by which the substantive essence of an
organisation is revealed” (p. 401) whilst Stuart (1999) considers corporate identity as the
expression of personality via Corporate Strategy and the Corporate Identity Mix. Olins’
(1978b, 1995) viewed corporate identity as the manifestation of an organisation’s
personality whilst Balmer (1995) considers corporate identity as an outcome of personality

148
with the latter being influenced by corporate philosophy and mission. Consequently, it can
be seen how corporate and brand identity scholars utilise the personality metaphor in
different ways. However, it does appear more recent corporate identity literature has
moved away from a personality-centric to a more multidisciplinary approach.
In terms of the brand identity literature, Aaker’s (1996a) ‘brand-as-person’
perspective “suggests a brand identity that is richer and more interesting than one based on
product attributes” (p. 83). Aaker’s (1996a) continues to outline how developing a brand
personality allows consumers to express themselves (cf: Belk 1988) via the brand, provides
the basis for a meaningful ‘relationship’ and enables the brand owner to communicate key
product attributes. de Chernatony (2006) highlights the role personality plays in brand
identity by outlining how brand personality “brings the brand’s emotional values to life”
(p.46). The logic being that anthropomorphisation enables customers to better appreciate
and connect, or bond, with the brands’ emotional values due to it taking on, in theory, a
more human nature. As part of the Identity Prism, Kapferer (2004) also considers
personality as a key identity facet given it “shows what kind of person it would be if it
were human” (p. 108). Kapferer’s (2004) line of thinking appears to have been developed
more recently by Roy and Banerjee (2007) where brand personality “creates a human face
of a brand to nurture the brand identity” (p. 143). As part of their Brand Leadership
Model, Aaker and Joachimsthaler (2000) note the strategic importance of developing a
brand personality by arguing if a brand identity has been developed without personality it
has been too narrowly conceived. Consequently, it can be seen how brand personality
plays a salient role in brand identity scholars’ thinking.

149
In terms of the broader brand literature, the personality metaphor has been
extensively researched. For instance, numerous authors outline the important role brand
personality plays in providing the basis for brand-customer relationships (Aaker, 1996a;
Aaker and Joachimsthaler, 2000; Aaker, 1995; Aaker et al., 2004b; Blackston, 1993; de
Chernatony, 2006; de Chernatony and McEnally, 1999; Fournier, 1998; Ghodeswar, 2008;
Phau and Cheen Lau, 2000; Smit et al., 2007; Swaminathan et al., 2008a; Sweeney and
Brandon, 2006). The logic being making a brand less inanimate, via brand personality
development, increases the likelihood of a human being able to develop an emotional bond
with a brand. Furthermore, Keller (2003) outlines how it is important brands have
personality traits, especially in markets that are reaching parity or service markets. The
latter point is consistent with Berry (2000) who contends service companies with strongest
brands make a “conscious effort to carve out a distinct brand personality” (p. 131).
Moreover, Hoefller and Keller (2003a) note how brand personality enables the brand to
convey much richer and contextually based information than if a brand personality was not
developed. Consequently, it can be seen how brand personality provides a basis for
developing a brand-stakeholder bond which, due to their nature, is particularly relevant for
service brands.
The relationship between brand personality and ‘self’ has also been explored in the
literature where brand personality helps augment the symbolic and self expressive meaning
a brand holds for the consumer (Allen and Olsen, 1995; Belk, 1988; de Chernatony and
McEnally, 1999; Levy, 1959; Swaminathan et al., 2008a). Consequently, brand personality
takes brand beyond merely utilitarian or functional benefits (de Chernatony and McEnally,
1999) by providing a basis for enabling consumers to utilise the brand in a way that helps

150
them express their definition of self (Mulyanegara et al., 2009b; Swaminathan et al.,
2008a), be it actual, social, ideal or social ideal (Sirgy, 1986).
Other scholars such as Smothers (1993) and Landon (1974) stress how brand
personality can help to enhance the emotional aspects of the brand (cf: de Chernatony,
2006). Acknowledging the important role personality plays in engendering emotion is
consistent with other authors who outline how personality can strengthen emotional
attachment to the brand (Belk, 1988; Biel, 1993a) whilst facilitating the diffusion of
emotional benefits (Olgivy, 1983). Indeed, Aaker (1996a) argues developing ‘emotion’ is
the backbone of a successful brand identity and is of increased importance in today’s
business environment where it is difficult for brands to retain competitive advantage based
on functional or utilitarian benefits alone (de Chernatony and Dall'Olmo Riley, 1997;
Freling and Forbes, 2005a; Van Rekom and Jacobs, 2006). Consequently, by developing
brand personality organisations look to compete not only on the grounds of what it the
brand is or does but who it is (Keller and Aaker, 1998; Lannon, 1992).
In terms of the B2B literature, authors such as Keller (2003) contend brand
personality development tends to be less important for organisations operating in B2B
markets than for those operating in B2C markets. The reason being their clients have,
unlike consumer markets, comparatively fewer psychological and social needs. In a
similar manner, de Chernatony and McDonald (1998) outline how emotionally influenced
decisions are rare in industrial markets. This perspective is grounded in the logic that
organisational buying behaviour is informed by a rationale decision making process
(Bendixen et al., 2004; Lynch and de Chernatony, 2004; Voss, 1990; Wilson, 2000).

151
This rational perspective is contrary to an increasing body of knowledge outlining
the salient role emotional in addition to functional aspects of branding play in B2B markets
(Bennet et al., 2005; Davis et al., 2007; Kotler and Pfoertsch, 2006b; Lamons, 2005; Lynch
and de Chernatony, 2004, 2007; Malhotra, 2005). Emotions relating to trust, confidence
and comfort (Kotler and Pfoertsch, 2006a) in addition to pride, peace of mind, security,
reassurance, reputation and responsiveness (Lynch and de Chernatony, 2004) provide
relevant examples. This more balanced perspective acknowledges decisions are made by
humans, not machines, who have individual preferences, orientations and dispositions with
regards to their decision making processes (Kotler and Keller, 2006b). For instance,
Kotler and Pfoertsch (2006a) outline how “A brand is emotional, has a personality and
captures the hearts and minds of its customers” (p. 4).
The role emotion plays in decision making has evolved more recently in the B2B
literature. Blomback and Axelsson (2007) outline how earlier parts of the decision making
process are influenced by first impressions from sales representatives, trade fairs and so
forth. This is followed by functional or practical (price and functionality) factors and with
a mixture of emotional and functional factors characterising the final stage of the process.
Lynch and de Chernatony (2004), who adopt more of a contextual approach, note the
influence of emotion depends on a range of organisational and individual factors. These
include product type and purchasing situation in addition to personal characteristics and the
individual’s level of involvement in the decision. Consequently, the importance of
developing an emotional connection via brand personality appears to be extending from
consumer to business markets and obtaining increasing scholarly support.

152
This section opened by distinguishing between the use of ‘personality’ in the brand
and corporate identity literatures. Noticeably, the former regards brand personality as a
dimension of, as opposed to being the sole manifestation of the construct. The important
role personality plays in relationship building, facilitating expression of self and driving
competitive advantage in addition to mobilising or generating emotion was then noted.
The growing academic interest in the role of emotion in B2B markets was also outlined.
Based on this literature and consistent with the brand identity literature, this thesis regards
brand personality as being a dimension of service brand identity. It is contended here that
regarding service brand identity as being synonymous with brand personality
oversimplifies the construct and fails to account for its multidimensional nature.
Consequently, for these reasons brand personality is considered a dimension of service
brand identity.
3.6. Service Brand Identity and Brand Performance
The previous section of this chapter reviewed a broad range of literature to justify the
domain of service brand identity as portray in the preliminary framework. The preliminary
framework consisted of five dimensions. These were marketing culture, corporate visual
identity, client relationship management and brand personality. This section will now look
to justify a research hypothesis stating the positive influence service brand identity has on
brand performance. Consequently, this section looks to unify the ‘identity’ and brand
performance literature reviewed in the previous chapter. Figure 16 conceptualises this
process:

153
Figure 16 Conceptualising the Positive Influence Service Brand Identity
has on Brand Performance
At present empirical research that assesses the influence brand identity has on
brand performance has not been conducted. Consequently, a theoretically informed body
of knowledge does not exist which this thesis can use to ground a brand identity-
performance hypothesis. However, it was still regarded possible to hypothesise:
H1: Service brand identity has a positive and significant influence on brand
performance
The logic for this approach was underpinned by three rationale. First, the
relationship between other brand related constructs such as brand equity and performance
has already been established (Aaker, 1996b; Kim et al., 2003b; Park and Srinivasan, 1994).
Dimensions of Service Brand Identity Dimension
Employee Measures Satisfaction Loyalty
Consumer Measures Relative satisfaction Loyalty Reputation Awareness
Financial Measures Market Share (revenue) Profit (net)
Brand Performance
Marketing Culture
Customer Relationships
Corporate Visual Identity
Integrated Marketing Communications
Brand Personality
Service Brand
Identity

154
Second, the previous sections of this chapter explored the domain of service brand identity.
In order to develop this hypothesis, this section will outline how, in isolation, the literature
indicates that each dimension has a positive impact on performance. Third, later in this
chapter (Section 3.7.3) the potential for positive dimension interactions will be
highlighted. Consequently, given previous brand equity research, positive dimension
interactions and literature highlighting the positive influence each dimension, in isolation,
has on brand performance it was not considered unreasonable to hypothesise service brand
identity, which is made manifest via these dimensions, should have a positive influence on
brand performance.
Adopting this approach is consistent with former Journal of Marketing Editor
Varadarajan (1996) who, when reflecting on JM submissions during his time as an editor
noted:
“[T]hat little prior theorizing exists to lay the foundation for a sound
conceptualizations does not exempt the researcher from the responsibility for
developing at least a preliminary framework or model that would provide insights
into the phenomenon of interest. For instance, an author could present a logically
reasoned explanation of why a certain relationship may be true.”
(p. 4)
Now the logic underpinning the development of the service brand identity-
performance hypothesis has been shared, it is necessary to address the second point above.
This relates to reviewing literature that outlines the positive influence each dimension, in
isolation, has on performance.

155
3.6.1. Marketing Culture
In a similar manner to the marketing culture dimension (Section 3.5.1) the broader
organisational culture and performance literature will be reviewed before the marketing
culture and performance literature. The reason being the marketing culture literature is
grounded in the organisational culture literature. Consequently, the latter is regarded as
relevant to the former.
Several authors have noted the positive influence culture has on organisational
performance (de Chernatony 2006; Deal and Kennedy 1982; Denison 1990; Denison and
Mishra 1995; Hofestede 1980; Kanter 1989; Peters and Waterman 1982; Wilkins and
Ouchi 1983). From this early literature, Hofestede (1998) outlined how “ there is little
doubt that organizational culture affects performance” (p. 16). Similarly, Kotter and
Heskett (1992) note “despite differences in initial research focus, terminology, and
methodology, the fundamental conclusions were very similar and very dramatic: all firms
have corporate cultures, although some have much stronger cultures than others, these
cultures can exert a powerful effect on individuals and on performance” (p. 9). Kotter and
Heskett (1992) continue to outline how such benefits are a function of enhanced informal
social control within the organisation as opposed to using bureaucracy which stifles
motivation, improved goal alignment and increased employee motivation due to feelings of
commitment or loyalty.
In a similar manner to Kotter and Heskett’s (1992) Theory I cultural type, de
Chernatony (2006) postulates how stronger cultures, with consistent values (and so
behaviour) promote employee motivation, commitment and loyalty which in their turn

156
Strong Organisational Culture
Motivates Staff
Ensures Coherent Staff Behaviour
Enhances Brand Consistency
Builds Stakeholder Trust
Enhanced Brand Performance
enhance brand performance. This thinking is borne out in Figure 17 where de Chernatony
(2006) postulates how a strong culture motivates staff, ensures coherent staff behaviour
which in its turn enhances consistency and so brand trust with the outcome being enhanced
brand performance.
Figure 17 How a Strong Culture Contributes Towards Brand Performance
(de Chernatony 2006:142)
Interestingly, de Chernatony (2006) outlines how the culture-performance literature
is mainly anecdotal. However, several empirical studies exist. For instance, adopting a
trait-based approach, Peters and Waterman (1982) identified a positive relationship
between a particular type of “strong culture” and superior performance. In a similar
manner, other pioneering authors (Deal and Kennedy, 1982; Denison, 1984; Kilmann et
al., 1985) outlined how a strong culture has a major influence on organisational
performance. The logic that underpinned these scholars’ work was grounded in the view
that adopting certain traits would drive performance (Lee and Yu, 2004). In subsequent

157
work, Kotter and Heskett’s (1992) research indicated a positive, albeit statistically weak,
relationship between a ‘strong’ culture (i.e. where there are a shared set of relatively
consistent values) and organisational performance. The empirical work of McGivern and
Tvorik (1997) identified that organisational culture was a significant ‘determinant’ of
organisational performance (return on assets, return on sales and return on invested capital)
whilst Denison (1990) found that stronger organisational cultures, which had a consensus
on organisational values, demonstrated superior organisational effectiveness. Building on
earlier work, Denison (1990) and colleagues (Denison et al., 2004; Denison and Mishra,
1995) highlighted how a range of strong cultural types (high involvement, consistent,
adaptable and mission / vision focused) positively related to organisational effectiveness.
In a similar manner to Denison and Mishra (1995), Rashid et al.’s (2003) empirical
research highlighted how, based on Deshpande and Farley (1999) typology of corporate
cultures, all four culture ‘types’ (competitive, entrepreneurial, bureaucratic and consensual)
had a positive influence on return on asset and return on investment (profitability ratios),
but not liquidity. Consequently, the early hypothesis seemed to be a strong culture drives
organisational performance.
However, it may not be possible to generalise the relationship between a ‘strong’
culture (i.e. an organisation with widely shared, homogenous and pervasive values) and
performance. For example, Sorensen (2002) highlights how in more volatile markets a
‘strong’ culture may adversely affect organisational performance whilst organisations
operating in more stable environments who have a ‘strong’ culture demonstrated superior
performance. The logic being that strong cultures are less able to adapt to change (cf:
Kotter and Heskett’s Theory I). Furthermore Wilkins and Ouci (1983) highlight how a

158
strong, pervasive, pan-organisational culture may not be as effective as ‘clans’ which can
better respond to local environmental change.
In a similar manner, scholars such as Kim et al. (2004) note that, overall, the early
literature which assessed the influence of a ‘strong’ culture (i.e. a culture with common /
consistent values and strong behavioural norms) on performance literature generally
provided a weak evidence for the influence of the latter on the former. The reason being
there were organisations with ‘strong’ cultures that both performed well and poorly (Kotter
and Heskett, 1992). With a few exceptions (Denison and Mishra, 1995; Gordon and
DiTomaso, 1992) such views do not appear to have considered the influence of
strategically ‘appropriate’ or ‘adaptable’ cultures (Kotter and Heskett, 1992). Kotter and
Heskett’s (1992) empirical research found firms with cultures that were guided by
adaptable values could respond to changes in the external environment and so
outperformed firms that did not have those cultural traits (cf: Theory III). Subsequent
authors’ research (Collins and Porras, 1994; De Geus, 1997) provides support for this
position insofar that cultural flexibility and adaptability was regarded a key determinant of
organisational success in the form of longevity and financial success. In a similar manner,
Gordon and DiTomaso’s (1992) noted that cultural adaptability was also predictive of short
term financial performance. This finding was important as it introduces the concept of ‘fit’.
Furthermore, Van der Post et al. (1998) found organisations who regularly reviewed their
values in the context of the external environment and adapted them accordingly,
financially outperformed those that did not whilst Ogbonna and Harris (2000) found that
an innovative culture, characterised by flexibility, dynamism and an external orientation,
exerted a direct and positive effect on organisational performance. Similarly, Kim et al.’s

159
(2004) research highlighted that “strong cultures are only valuable if they exhibit adaptive
and learning qualities” (p. 356). Consequently, a large body of empirical research points to
the positive influence an adaptable culture has on performance-related outcomes.
However, a more mixed picture has started to emerge from the literature in recent
years regarding the adaptable culture-performance effect. For instance, Xenikou and
Simosi (2006) found that an adaptive cultural orientation had a negative and significant
influence on performance. However, it should be noted performance was measured in
financial terms. The authors note how an adaptive orientation may be a better predictor of
long term performance and so these findings should be treated with caution. Furthermore,
Ngo and Loi (2008) note how an adaptable culture drives both human resource (e.g.
morale, retention etc) and market (e.g. turnover, net profit) related performance. However,
the influence of cultural adaptability on market-related outcomes became non significant
when mediated by human resource-related outcomes. Conversely, O'Cass and Ngo
(2007b) found an innovative culture, characterised by employee flexibility, adaptability
and spontaneity, had a positive and significant influence on brand performance. Having
considered the above discussion it appears that, for the most part, the literature indicates
how an adaptable culture, informed by values that encourage flexibility, appear to have
positive influence on performance-related outcomes.
Given the literature supporting the influence an adaptable culture has on
performance, much of the earlier organisational culture and performance literature may be
regarded as something of an oversimplification in that “the statement, strong cultures
create excellent performance appears to be just plain wrong” (Kotter and Heskett, 1992
:21). The notion of adaptability once more leads to the marketing culture literature which

160
emphasised how, via its innovation dimension, an organisation and its employees need to
be accepting of, and responsive to change. Furthermore, scholars such as Daft (2007) note
how an adaptable culture is “characterised by strategic focus on the external environment
through flexibility and change to meet customer needs” (p. 368) which, it could be argued,
relate to the marketing culture’s service quality dimension. For these reasons, it is argued
here, the marketing culture – performance literature findings are of particular value to this
service focused thesis.
Several empirical studies have highlighted the positive influence a ‘strong’
marketing culture can have on marketing-related performance variables. For example,
Webster (1993) concluded “that a significant relationships exists between the importance
placed on marketing culture and the profitability of a firm” (p.120). Drawing on Kotler’s
(1977a) work to define marketing effectiveness in terms of operational efficiency,
customer philosophy, marketing information, strategic orientation, Webster (1995)
highlighted how “[e]ven when the possible effects of firm size and geographical scope are
removed, the relationship between [marketing] culture and effectiveness remains
significant” (p. 16). Applying Webster’s (1993) marketing culture scale, Appiah et
al.(1999) found “that service firms which give greater attention to the development of
organisational variables such as service quality, innovation, interpersonal relationships,
internal communication, organisation and selling generally exhibit relatively higher levels
of performance in of customer satisfaction, customer retention and profitability” (p. 166).
In subsequent work, Appiah et al. (2000) found a “moderately strong relationship between
marketing culture and customer retention” (p. 95) with the logic being it is more profitable
to retain than have to gain customers (Fornell and Wernerfelt, 1987, 1988; Heskett et al.,

161
1994; Karatepe et al., 2005; Reichheld and Sasser, 1990; Sheth and Parvatiyar, 1995;
Vavra, 1995). Consequently, several empirical studies highlight how marketing culture
helps drive a range of performance measures.
At a more detailed level, several dimensions, within a marketing culture merit
closer attention. As outlined above, the innovation dimension encourages organisations to
be more accepting of, and responsive to change. This position is consistent with Kotler
and Heskett’s (1992) Theory III or more adaptable organisation which outperformed those
organisations that did not display such cultural traits. However, service quality, internal
communications and selling task all play a role in driving performance and will now be
considered. The service quality dimension encourages a customer-centric approach and so
is consistent with the philosophy of enacting the marketing concept. Whilst
operationalisation of the marketing concept via a market orientation has been subject to
some criticism (Brownlie and Saren, 1992) numerous empirical studies have highlighted
how a market orientation can enhance organisational performance (Day and Nedungadi,
1994; Jaworski and Kohli, 1993; Kohli and Jaworski, 1990; Narver and Slater, 1990;
Pelham and Wilson, 1996; Slater and Narver, 1994; Vorhies et al., 1999). Internal
communications looks to engage employees and align this stakeholder group with the
organisation’s vision. Several scholars have highlighted the positive influence developing
an internal market orientation, that is a mindset cognizant of the value internal marketing,
can have on performance-related outcomes. For instance, Lings and Greenley (2009)
identified how an internal market orientation drives an external market orientation with the
benefits of the latter being outlined above. Furthermore, Lings and Greenley (2009) found
a strong internal market orientation positively influenced employee motivation, which
enhanced customer satisfaction and ultimately financial performance. Hence, an internal

162
orientation appears to be indirect antecedent of financial performance (which constitutes an
element of this research’s brand performance measure). Similarly, an internal market
orientation has also been suggested to improve employee motivation (Berry and
Parasuraman, 1991), increase employee satisfaction (Piercy, 1995) and foster employee
commitment (Berry and Parasuraman, 1991), all of which could be logically hypothesised
as having a positive impact on performance.
The selling task dimension focuses on human resource practices such as
recruitment and training. This is of particular relevance to this research due to the pivotal
role employees’ play in service brand delivery. There is a vast human resource literature
outlining the influence informed HR practices have on organisational performance (Arthur,
1994; Becker and Gerhart, 1996; Delaney and Huselid, 1996; Guest et al., 2004; Hitt et al.,
2001; Huselid, 1995; Huselid and Becker, 2000; Paauwe, 2009; Paauwe and Richardson,
1997; Pfeffer, 1994). For example, Pfeffer (1994) noted the top five performing firms
(based on return from shares) from 1972-1992 differentiated themselves via the way in
which they proactively managed their workforce whilst Becker and Gephart (1996)
outlined how human resource activities have “an important and unique influence on
organisational performance” (p.779). Huselid’s (1995) cross sectional study “found
considerable support for the hypotheses that investments in such practices [recruitment,
training, appraisals etc] are associated with lower employee turnover, greater productivity
and corporate financial performance” (p.667). In a similar manner, Delaney and Huselid
(1996) found “positive associations between human resource management (HRM)
practices, such as training, staffing selectivity, and perceptual firm performance measures”
(p. 949). Terpstra and Rozell (1993) found a statistically positive link between
extensiveness of recruitment / formal selection procedures and profit whilst Russell et al.

163
(1985) demonstrated a positive relationship between the use of training programs and
financial performance. The logic being training provides employees with good technical
brand knowledge and so better places them to provide accurate information and consistent
experience to all stakeholders (de Chernatony, 2006). More recently, Combs et al. (2006)
found an increase of one standard deviation increased return on sales by 4.6%. Hence, it
can be seen from the above, the view that internal factors ultimately have a positive impact
on financial performance concurs with the broader view in the services branding literature
(Heskett et al., 1994).
This section of the chapter has drawn on a broad range of literature to consider the
influence ‘culture’ has on performance. It was noted how support for the early view that a
‘strong’ culture has a positive influence on organisational performance appears to be
somewhat weakening. The reason being a strong culture-performance link may be an
oversimplification as this perspective fails to take into account the importance of an
aligned or adaptable culture (Kotter and Heskett, 1992). Given this position, the marketing
culture and performance literature was reviewed given the emphasis this construct places
on an organisation being receptive and responsive to change via the innovation dimension.
This is encouraged via the ‘innovation dimension’. The influence of specific marketing
culture dimensions, notably, service quality, internal communications and selling task on
performance related measures was also noted. This only serves to reinforce the position
that marketing culture drives performance.

164
3.6.2. Corporate Visual Identity Systems
The value of the brand’s name and logo, as visual cues, has been noted as an
important driver of brand awareness by a number of scholars (Aaker, 1991; Aaker and
Joachimsthaler, 2000; Berry, 2000; Berry et al., 1988; Keller, 2003; Melewar and
Saunders, 1998; Miller et al., 2007; Van den Bosch et al., 2005). The reason being visual
stimuli such as logos are more effective in terms of brand recall because they are learned
faster and remembered for significantly longer periods of time than verbal cues (Henderson
et al., 2003; Miller et al., 2007). MacInnis and Price (1987) refer to this phenomena as the
‘picture superiority effect’. James’ (1990) empirical research highlighted how the
organisation’s new visual identity helped convey a strong sense of organisational purpose
and increased brand awareness by 30%. In a similar manner, the visual identity programme
of TRW doubled brand awareness amongst the brand’s target business (Hartigan, 1987).
Henderson and Cote’s (1998) empirical research outlines how logos can facilitate brand
awareness whilst favourably influencing brand selection and company evaluations. These
findings are corroborated by Henderson et al. (2003) who found a positive relationship
between logo design characteristics and recognition in addition to perceptions of quality
the logo connoted. In a similar manner, Lancastre and Corte-Real’s (2007) empirical work
found how figurative brand names and logos such as Apple enjoyed better recall and
recognition. Such findings substantiate the views of earlier scholars (Carter, 1982; Peter,
1989; Pilditch, 1970) who note how the organisation’s visual identity help facilitate brand
recognition. As the literature review highlighted, brand awareness is a salient brand equity
dimension (Aaker 1996b; Aaker 1996a; Berry 2000; Keller 1993; Sharp 1995; Yoo and
Donthu 2001) which itself has been noted in the literature as, amongst other things, as

165
Direct effect Indirect effect
Brand’s Values
Customer’s Values
Visual identity e.g. logo, name,
premises
having a positive influence on business performance (Aaker, 1996b; Kim et al., 2003b;
Park and Srinivasan, 1994).
It is worth noting how research indicating the positive influence visual identity
elements, such as brand name and logo have on brand awareness ignores the intervening
influence of brand associations. A consumer may be aware of a brand but the association
may not be what was intended. In other words, awareness may be contrary to the intended
association (Van Riel and van den Ban, 2001). Consequently, the above awareness-related
findings must be treated with some caution. The importance of brand association is raised
by de Chernatony (2006) who outlines how brand nomenclature should evoke the correct
consumer associations with a cluster of brand values. As noted in the literature review,
values are important as they influence behaviour (de Chernatony and Cottam, 2008;
Hardaker and Fill, 2005; Meglino and Ravlin, 1998; Rokeach, 1973) with the desired
behaviour in this case being selecting service the brand owner is offering. In this sense
visual identity ‘mediates’ or unifies both brand and customer values. This is conceptualised
in Figure 18.
Figure 18 Visual Identity Mediating Brand and Customer Values
166
For example, a consultancy may build its brand identity based on ethical values. These
may be made manifest via green typography, ecologically developed premises, use of a
logo which has natural or organic metaphorical connotations in the form of a tree. Such
cues provide the customer with an indication of what the organisation stands for and the
extent to which its core values (e.g. ethical concerns) are aligned with theirs. A similar
point is made by Van Riel (1995) who regards ‘symbols’ in the form of brand logo, brand
name and so forth as having ‘emotional loadings’ that can influence consumer behaviour.
As the literature noted, employees play a crucial role in service brand delivery.
Consequently, it is appropriate to consider employee based related benefits with regards to
visual identity which have been noted in the literature. These relate to employee
recruitment and identification with the organisation. Several authors (Carter, 1982; Gray
and Smeltzer, 1987; Melewar et al., 2005a; Olins, 1990; Sorrell, 1997; Van Riel and
Balmer, 1997) have outlined how visual identity helps attract qualified employees. This
point has been empirically proven by other scholars (Balmer and Stotvig, 1997; Belt and
Paolillo, 1982; Melewar and Saunders, 1998; Melewar et al., 2001). The logic being that
more able employees will be able to contribute better to brand performance. Visual identity
has also been noted as way of engendering a sense of company pride (Carter, 1982; Olins,
1989) and employee identification with the organisation (Van den Bosch et al., 2006b).
Hence, this point draws heavily on the organisational identity literature (Ashford and Mael,
1996, Dutton and Dukerich, 1991, Dutton et al., 1994, Albert and Whetten, 1985, Gioia et
al., 2000, Gioia and Thomas, 1996). In this sense, symbols become a concrete
manifestation of the brand’s identity which employees use as a salient cue or shorthand
prompt to identify with the organisation. Drawing on the work of Hinkle et al.(1989), Van
Riel and Van den Ban (2001) make a similar point by noting “ logos implicitly contribute
167
to an increased degree of [employee] identification with the organisation” (p. 438). The
logic being that stronger employee identification with the brand or organisation results in
greater alignment with, commitment towards and support of the brand’s values which in its
turn drives brand performance (cf: de Chernatony, 2006).
Several other organisational benefits that emanate from effective corporate visual
identity management have been noted in the literature. For instance several authors (Baker
and Balmer 1997; Berry et al. 1988; Olins 1989; Simoes et al. 2005) found visual identity
helps drive competitive advantage which itself is associated with superior organisational
performance (Barney, 1991; Chan et al., 2004; Porter, 1980). Furthermore, Van Riel and
Van den Ban’s (2001) found that logos have “added value in the creation and maintenance
of a favourable corporate reputation” (p. 439). The view that visual cues have a positive
influence on a brand’s reputation is consistent with other scholars (Baker and Balmer,
1997; Green and Lovelock, 1983; Olins, 1989; Schultz et al., 2000; Van den Bosch et al.,
2005). Please refer to brand performance section in literature review for organisational
benefits of reputation (Section 2.6.2). Melewar and Saunders’ (1998) research which
spanned consumer, industrial goods and services outlined how a more standardised visual
identity had a positive impact on sales, consumer goodwill, awareness, market share and
executive recruitment. Although focusing solely on products, Klink’s (2001) research
highlighted how brand names / symbols which convey the product-related information
were better ‘liked’ and positioned more strongly in consumers’ minds. More recently, Jun
et al.’s (2008) demonstrated how a favourable logo attitude positively and directly
influenced both attitude towards the company and purchase intentions, which were
themselves causally related. Finally, Bitner’s (1990) research outlined how components of
visual identity such as design, décor and employee presentation transmit tangible hints or

168
clues that influence customer satisfaction which itself increases the likelihood of word of
mouth, reduces service switching and enhances service loyalty (Magin et al., 2003).
Consideration of corporate visual identity systems in the B2B literature tends to
focus on the influence brand name has on a range of brand-related outcomes. Of particular
note is how brand names can influence brand choice (Bendixen et al., 2004; Walley et al.,
2007), facilitate premium pricing (Bendixen et al., 2004; Firth, 1997; Mudambi et al.,
1997), enhance loyalty (van Riel et al., 2005; Walley et al., 2007), drive brand awareness
(Davis et al., 2007; Mitchell et al., 2001), facilitate differentiation (Kotler and Pfoertsch,
2006a; Shrimp, 1993) and build brand equity which has been noted as a valuable
organisational asset in B2B markets (Bendixen et al., 2004; Davis et al., 2007; Kotler and
Pfoertsch, 2006a). Whilst not capturing the breadth of corporate visual identity systems
this indicates that within the B2B literature, elements of the construct have been noted as
driving performance related outcomes.
This section of the chapter has reviewed a range of literature to highlight how
corporate visual identity drives a variety of performance-related variables. Of particular
note was how corporate visual identity helps improve brand awareness, employee
identification, recruitment and reputation in addition to driving competitive advantage
which have been noted in the literature as having a positive effect on a range of
organisationally-related performance outcomes. The specific role brand name, in the
context of the corporate visual identity systems construct, in B2B markets was also
highlighted. For these reasons corporate visual identity, as a dimension of service brand
identity is regarded as having a positive influence on brand performance.

169
3.6.3. Client Relationship Management
The performance related benefits that can be derived from developing and
managing relationships have been widely documented in the academic literature. For
instance, the seminal work of Reichheld and Sasser (1990) highlighted some of the
organisational benefits brand-customer relationships can bring to organisations. These
include the cost of acquiring customers can be five times greater than retaining and
satisfying current customers [NB Peppers and Rogers (1993) argue this ratio can be in the
order of six to nine whilst Kotler (1997) also thought a ratio of five was more accurate], a
5% reduction in customer defection which can increase profit by 25%-85% (depending on
the industry) and that customer profitability tends to increase with time due to reduced
‘servicing costs’. However, some of Reichheld and Sasser’s (1990) findings have been
disputed (Carroll, 1991, 1992). These arguments are based on the fact that customer costs
are mostly fixed. Notwithstanding these scholars’ arguments, the frequency with which
Reichheld and Sasser’s (1990) findings are quoted in the literature tends to add to their
credibility. They also align with the view that it is more profitable to retain rather than
have to gain customers (Berry, 1995; Fornell and Wernerfelt, 1987, 1988; Sheth and
Parvatiyar, 1995; Vavra, 1995).
The view that a relational approach is more profitable obtains empirical support
from Izquierdo et al.’s (2005) research where loyalty had a positive affect on revenue and
profitability. It has also been argued a relational approach enhances marketing productivity
(Buttle, 1996; Rust and Chung, 2006) by making marketing more ‘effective’ (e.g.
individual customer needs are better addressed) and ‘efficient’ (e.g. reducing untargeted

170
marketing expenditures, customer retention etc.) (Sheth and Parvatiyar, 1995). Several
scholars (Heskett et al., 1994; Izquierdo et al., 2005) have noted how the cost of servicing
clients also tends to reduce with time as the organisation knows how to better meet their
customers’ needs with overall effect being improved profitability (Sharma et al., 1999). In
a similar manner, Sin et al’s (2002) empirical research outlined how a relational orientation
has positive outcomes such as sales growth, customer retention, return on investment and
overall performance (the average of the other four measures).
Other organisational benefits emanating from a relational approach have been
highlighted in the literature. These include enhanced share price (Fornell et al., 2006),
greater channel leverage (Aaker, 1991), creating a barrier to entry (Aaker, 1996b), positive
word of mouth (Buttle, 1996; Heskett et al., 1994; Ranaweera, 2007), loyalty (Roberts et
al., 2003) in addition to helping to build market share (Chaudhuri and Holbrook, 2001) /
sales volumes (Buttle, 1996), all of which can be logically hypothesised as contributing
positively to brand performance. Furthermore, other authors have noted how a relational
approach facilitates competitive advantage (Berry, 1983; Gronroos, 1991; McKenna,
1991; Ray et al., 2005; Roberts et al., 2003; Vavra, 1995) or competitiveness (Richards,
1998; Sheth and Parvatiyar, 1995) given the intangibility of a relationship is not easily
duplicated and take time to build. From a Stakeholder Theory perspective, Jones (1995)
reiterates this point outlining how “the firm will gain competitive advantage if it is able to
develop relationships with its stakeholders based on mutual trust and cooperation” (p 424).
The logic being such organisations will enjoy reduced transaction, production, warranty
etc., costs that drive their competitive advantage. Consequently, it can be seen how a
range of literature highlights the positive influence a relational approach can have on a
performance-related outcomes.

171
At this stage, customer relationship management (CRM) literature merit closer
inspection for three reasons. First, this thesis adopts a managerial position with regards to
service brand identity and so the management of relationships is important. Second, CRM
and relationship marketing are frequently used interchangeably (Parvatiyar and Sheth,
2001). Finally, authors such as Hendricks et al. (2007) regard CRM as an amalgamation of
current relationship marketing principles and so the relationship marketing literature can be
regarded as providing a theoretical foundation for CRM-related research. For the most part,
the CRM literature acknowledges how nurturing customer relationships provides the
organisation with a valuable asset that enhances retention, lowers costs and so boosts
profitability (Blattberg, 2001; Ryals and Knox, 2001; Ryals and Payne, 2001; Sheth and
Sisodia, 2001). In a similar manner, other scholars have noted how CRM can drive
profitability by providing deeper customer insights with regards to understanding and
predicting behaviour, habits needs and trends (Chen and Popovich, 2003; Kalakota and
Robinson, 2000). More specifically, Sin et al. (2005b) highlight how a greater emphasis
on CRM correlated with both marketing (trust and customer satisfaction) and financial
measures (return on investment and sales) whilst Coltman (2007) highlights how superior
CRM capability can drive performance (measured in terms of ROI, reduced transaction
costs, new product revenue and sales growth). In a similar manner, Jayachandran et al.’s
(2005) research revealed that organisations which leveraged more relationally orientated
information services tended to have more satisfied and loyal customers. Furthermore,
Reinartz et al. (2004) found that within their CRM conceptualisation, relationship
‘initiation’ and ‘maintenance’ significantly influenced performance whilst ‘termination’
did not. The authors postulated the insignificant influence of termination may be a
function of a Type II error where companies are reluctant to terminate unprofitable

172
company relationships (p. 302). More recently Elmuti et al. (2009) highlighted how CRM
increased a range of performance related outcomes including customer satisfaction and
responsiveness, organisational productivity in addition to enhancing market share.
Consequently, a considerable body of knowledge is developing which indicates the
positive influence informed CRM practices can have on a range of performance-related
outcomes.
However, developing such a relationship and performance mantra could be an
oversimplification. For instance, scholars such as Hendricks et al. (2007) found that CRM
did not have a significant affect on share price or profitability. Similarly, the view that a
relational approach drives performance-related outcomes has also been challenged by some
scholars. For instance, Ranaweera (2007) noted “the premise that having long-term
satisfied customers is the best predictor of having profitable customers was shown to be
too much of a generalisation” and “that such a view could be tenuous” (p. 119). This
concurs with Reinartz and Kumar (2000), who based on data from a non-contractual
setting, found longer term customers are not necessarily the most profitable. Furthermore,
in subsequent research Reinartz and Kumar (2003) noted the presence of both high and low
profitability amongst short and long term customers. Consequently, it can be see how
some empirical studies question the positive influence a relational approach has on
performance-related outcomes.
As with the B2C literature, the B2B literature suggests several brand-related
benefits can emanate from building and managing client relationships. These include
developing favourable brand associations (Beverland et al., 2004), creating barriers to
entry (Wilson, 1995), enhancing customer satisfaction (Han and Sung, 2008), increased

173
customer willingness to pay a premium price (Bendixen et al., 2004), greater brand loyalty
(Bennet et al., 2005; Beverland et al., 2004; Lynch and de Chernatony, 2004), reduced
technical uncertainty (Mudambi et al., 1997) and enhanced overall brand equity (Kotler
and Pfoertsch, 2006a) which has been shown to as an organisational asset in B2B markets
(Davis et al., 2007).
In a similar manner to the ‘culture’ literature unanimous agreement with regards to
a relationship-performance effect does not exist. However, based on the above literature,
the general consensus of opinion appears to be that building and managing customer-brand
relationships has a positive influence on a broad range of performance-related outcomes.
This position spans both B2C and B2B literature. Whilst ‘performance’ has generally
related to financial measures, this is a dimension of brand performance this thesis has
considered. Consequently, the management of relationships, which constitutes a
dimension of service brand identity is considered as playing a noteworthy role in driving
brand performance.
3.6.4. Integrated Marketing Communications
Several authors have outlined how integrated marketing communications plays an
important role in building and maintaining both customer relationships and brand equity
(Ambler et al., 2002; Duncan and Moriarty, 1998; Jones and Blair, 1996; Keller, 2003;
Madhavaram et al., 2005; Naik and Raman, 2003; Rust et al., 2004a; Schultz et al., 1994).
Please refer to the literature review (Section 2.6.2) and earlier in this chapter (Section
3.6.3) for details concerning the positive influence consumer-based brand equity and

174
customer relationships have on performance-related outcomes. The view that integrated
marketing communications provides organisational benefits finds support from authors
such as Schultz and Schultz (1998) and Kitchen et al. (2004) who regard IMC as a way of
improving brand performance. Similarly, scholars such as Srivastava et al. (2000; 1998)
and Hom (2006) note how integrating marketing communications can help provide the
basis for competitive advantage, which itself drives superior financial performance
(Barney, 1991; Chan et al., 2004; Porter, 1980). More specifically, Lee and Park (2007)
note that integrated marketing communications campaigns create brand awareness and
foster favourable brand attitudes whilst Peppers and Rogers (1994) outline how greater
communication integration drive behavioural responses and results such as retention and
sales respectively. These views are consistent with other others such as Schultz et al.
(1994) and Kliatchko (2008) who highlight how the impact of communication increases if
all elements are orchestrated synergistically.
Several empirical studies outline the positive affect greater integration of marketing
communications can have on brand performance. For instance, Low’s (2000) research in
the USA highlighted how a greater level of integrated marketing communications
enhanced market performance (growth in share, sales and profit) with Reid et al.’s (2001)
work in the Australian wine market corroborated these findings. In subsequent research,
Reid (2003) highlighted “a positive relationship between brand-related (sales, brand
strength, customer loyalty) performance and IMC” (p. 245). This point is supported by
later research (Reid, 2005) which illustrated how “there was a strong main effect indicating
a positive relationship between the IMC process and brand outcomes” (p. 47) with brand
outcomes being defined as (relative) sales performance, customer satisfaction and brand
advantage (awareness, premium price and channel support offered). Adopting a case study

175
guided by grounded theory principles, Dewhirst and Davis (2005) note how integrated
marketing communications helped Players cigarettes build brand equity and increase
shareholder value in the Canadian market. Consequently, it can be seen how a number,
albeit small, of empirical studies highlight the positive influence a greater degree of
marketing communication integration can have on performance.
In a similar manner to the B2C literature, benefits that emanate from marketing
communications have been noted in the B2B literature. Effective stakeholder
communication increases trust and commitment in business relationships (Lynch and de
Chernatony, 2004; Wren and Simpson, 1996), reduces perceived risk and uncertainty faced
by buyers (Bendixen et al., 2004) whilst facilitating the building of stronger buyer / seller
relationships (Cretu and Brodie, 2007). Lynch and de Chernatony (2004) outline how the
utilisation of different communication channels plays an important and continuous attitude
formation role. This is consistent with the view communication facilitates and influences
choice during the selection process (Blomback and Axelsson, 2007). Blomback and
Axelsson, (2007) highlight how communication helps build brand image which facilitates
brand preference. Finally, de Chernatony and McDonald (2003) contend brand
communication that considers the psychological concerns of B2B buyers is an important
means of differentiation in markets dominated by a functionality focus.
To date there have been a limited number of empirical studies which support the
view that a greater level of integration with respect to marketing communications
positively effects organisational / brand performance (Cornelissen, 2000; Low, 2000). This
is a point reiterated by Reid (2003) who noted the “intuitively appealing but empirically
176
thin relationship between integrated marketing communications and higher levels of brand
performance” (p. 245). Whilst the evidence presented is an anecdotal and empirical
mixture, the general consensus points towards the positive effect integrated marketing
communications has on brand performance.
3.6.5. Brand Personality
The branding literature outlines how several performance-related benefits may
emanate from developing a brand personality. These include: facilitating relationship
building (Blackston, 1993; Fournier, 1998; Meenaghan, 1995; Swaminathan et al., 2008a),
providing a source of sustainable competitive advantage (Haigood, 1999; Keller and
Richey, 2006; Sherrington, 2003), engendering a greater willingness to pay premium prices
(Freling and Forbes, 2005b; Smothers, 1993), facilitating brand extension (Batra et al.,
1993; Freling and Forbes, 2005b), fostering greater brand loyalty (Biel, 1992; Fournier,
1994; Freling and Forbes, 2005b; Magin et al., 2003; Smothers, 1993; Zentes et al., 2008)
and increasing purchase likelihood (Swaminathan et al., 2008a) whilst Ramaseshan and
Tsao’s (2007) empirical work outlines how if the brand personality is consistent with brand
positioning, perceived quality can be enhanced. The positive influence of brand
personality on brand preference and usage has also been noted by several scholars (Aaker,
1995; Aaker, 1999; Biel, 1993a; Biel, 1993b; Siguaw et al., 1999; Sirgy, 1982; Sirgy et al.,
1997; Sweeney and Brandon, 2006).
The differentiating role brand personality plays has been highlighted by numerous
scholars (Aaker, 1996a; Aaker, 1997; Biel, 1993a; Biel, 1993b; Crask and Laskey, 1990;

177
de Chernatony, 2006; Farquhar, 1990; Freling and Forbes, 2005b; Ghodeswar, 2008;
Gwinner and Eaton, 1999; Haigood, 1999; Keller and Richey, 2006; Meenaghan, 1995;
Murphy et al., 2007; Plummer, 1985; Roy and Banerjee, 2007; Sweeney and Brandon,
2006; Van Rekom and Jacobs, 2006). The rationale being a differentiated offering
provides a compelling reason to buy a given brand vis-a -vis a competitor (Aaker, 1982;
Ries and Trout, 1972) and that personality based features are more difficult to copy than
functional features (Ghodeswar, 2008). This view is consistent with de Chernatony and
McEnally (1999) who note that “[T]o differentiate their brands, marketers focus on
incorporating emotional values into their brands, portraying this through the metaphor of
brand personality” (p. 9). Indeed, Aaker and Joachimsthaler (2000) regard differentiation
as being increasingly important to brands that wish to ‘burst out of the clutter’, with brand
personality development being considered a particularly effective way of doing this.
Other scholars such as Siguaw et al. (1999) and Haigood (1999) highlight how
brand personality plays a particularly influential differentiating role when little or no
functional distinction can be made between competing brands. Harris and Fleming (2005)
develop this point by noting the important role brand personality plays in the service sector
given the predominantly intangible nature of service brands can make distinguishing
between such brands challenging. This perspective is consistent with Freling and Forbes
(2005b) who outline how:
“A strong, favourable brand personality may have less of an impact on consumer
preferences for products predominantly characterised by search attributes (which
consumers can fully evaluate prior to purchase) and be relatively more important to
consumers for products that are predominantly characterised by experience or

178
credence qualities (which can only be evaluated after the purchase, if at all), when
information about a brands’ personality may reduce consumers’ perceived risk.”
(p. 159)
Consequently, the differentiating role of brand personality appears to take on
greater importance for service brands. The reason being it can act as a surrogate for the
brand’s intrinsic attributes which may otherwise be difficult to evaluate prior to purchase
(Freling and Forbes, 2005a).
The positive influence brand personality has on brand attitude has also been
highlighted by several authors (Aaker, 1999; Freling and Forbes, 2005b; Haigood, 1999;
Helgeson and Supphellen, 2004; Sirgy et al., 2000; Sirgy et al., 1997). Indeed, Freling and
Forbes’ (2005a) empirical research concludes:
“subjects exposed to stimulus materials containing information about the brand’s
personality – regardless of the dimension [based on Aaker’s personality scale] - had
significantly more favourable brand attitudes than those exposed to stimulus
materials containing no information about the brand personality” (p. 408).
The rationale being attitudes are important because they lead to intentions which in their
turn result in actual behaviour (Fishbein and Ajzen, 1975), which, in this case is
purchasing the brand. Echoing Haigood’s (1999) work, Freling and Forbes’ (2005a)
research highlights the salient role of brand personality:

179
“[T]his effect (i.e. the BP effect) occurred regardless of which brand personality
dimension was experimentally manipulated, suggesting that (for the stimulus
product) any brand personality, so long as it is perceived as being strong and
favourable, is likely to be associated with positive consequences” (p. 409)
Hence, it appears developing a brand personality, irrespective of type, which has strong
and favourable associations has a positive influence on performance-related outcomes.
The literature review chapter highlighted the critical role dimensions of consumer
based brand equity play in enhancing brand performance (Section 2.6.2). Brand
personality has also been noted as playing an important equity building role (Aaker, 1991;
Biel, 1993a; 1992, 1993b; Keller, 2003). For example, albeit researching a more tangible
product in the form of bottled water, Freling and Forbe’s (2005a) research presents some
illuminating findings with regards to the ‘brand personality effect’, that is, the influence of
brand personality on brand equity by concluding:
“A strong, positive brand personality also leads to more brand associations that are
favourable, unique, strong and congruent – thus enhancing brand equity.” (p. 409)
Furthermore, Freling and Forbe’s (2005a) also noted that “a significantly greater
proportion” (p. 409) of brand personality-present subjects, that is subjects whose stimulus
material was imbued with a brand personality (spanning all five of Aaker’s, 1997,
personality types), were able to recall the correct brand name. In a similar manner, Aaker
and Joachimsthaler (2000) note how brand personality can help raise brand awareness,

180
which itself is a central brand equity dimension (Aaker, 1991, 1996b; Berry, 2000; Keller,
1993, 1998, 2003; Pappu et al., 2005; Sharp, 1995; Yasin et al., 2007; Yoo and Donthu,
2001) with the organisational benefits being highlighted in the literature review.
Whilst the literature outlining the positive influence brand personality can have on
brand performance is somewhat limited, this section has drawn on the available (anecdotal
and empirical) literature to highlight how, despite this paucity, several organisational
benefits emanate from augmenting a brand with a strong and favourable personality.
These include facilitating relationship building, engendering more positive attitudes, a
willingness to pay premium prices, greater purchase likelihood and enhanced brand
loyalty. The important role brand personality plays in service brand differentiation was
also noted. Consequently, as a dimension of service brand identity, brand personality can
be considered as contributing to the construct’s positive influence on brand performance.
3.7. Evaluating the Preliminary Service Brand Identity Framework
Grounded in a broad range of literature, the previous sections of this chapter
postulated how service brand identity is a multidimensional construct comprising of five
dimensions. The dimensions were marketing culture, corporate visual identity systems,
client relationship management, integrated marketing communications and brand
personality. The construct’s positive influence on brand performance was also
hypothesised.
Now the preliminary framework has been developed it is necessary to evaluate it in
two steps. First, the framework is evaluated in the context of Suvatjis and de Chernatony

181
(2005) criteria for ‘model’ development. Second, the potential for dimension interactions is
acknowledged.
3.7.1. Guidelines for Developing a Theoretical Framework
To guide evaluation of the preliminary service brand identity framework, Suvatjis
and de Chernatony’s (2005) criteria for building a “useful and valid” framework (p. 810)
was employed. Whilst these criteria were developed in the context of corporate identity,
the literature review highlighted how corporate and brand identity intersect (Simoes et al.,
2005). Furthermore, these criteria provide useful conceptual apparatus for directing the
evaluation process. For these two reasons before the suggested criteria are applied they will
be introduced here.
Visual clarity relates to the framework being “pictorially clear and stimulating”
(Suvatjis and de Chernatony, 2005 :811) with the objective being preventing the need for
further explanation. In particular the use of metaphors in order to convey the framework’s
meaning is of particular importance. This requires frameworks that are visually engaging
to promote their usefulness within non academic circles (Leeflang et al., 2000; Lilien et al.,
1992). For example, Kapferer’s (2004) Identity Prism can be regarded as being visually
distinctive and clear.
Ease of interpretation is concerned with making frameworks simple to understand.
This point reiterates Naert and Leeflang’s (1978) view that “a model must be simple,
complete, adaptive and robust” (p. 322). A robust model is one that is “hard to get absurd

182
answers from” (Little, 1970 :446) or makes it “difficult for a user [of the framework] to
obtain bad answers” (Leeflang and Wittink, 2000 :108).
Logical sequence relates to the rational flow between one construct and another. As
noted in the literature review, this is strength of de Chernatony’s (2006) and Aaker’s
(1996a) work. These author’s frameworks provide clear guidance on where to start and
how to proceed with the brand identity building process.
Adjustment and adaptability is associated with a framework’s ability to cope with
unexpected factors in the business environment (Naert and Leeflang, 1978). Little (1970)
makes a similar point insofar frameworks need to be adaptive so they “can be adjusted as
new information is acquired” (p. 466). Laurent (2000) argues more effective frameworks
have greater flexibility and adaptiveness in terms of describing the model’s relationship
with, or “representation of reality” (Leeflang and Wittink, 2000 :109) whilst Little (1970)
notes how it should be possible to update frameworks as and when new data becomes
available or new factors become important.
Production of synergies relates to the model’s dimensions interacting in unison or
symbiosis. In particular Suvatjis and de Chernatony (2005) note how internal and external
dimensions need to be taken into account. This is strength of both Kapferer (2004) and de
Chernatony’s (2006) work which advocate a balanced approach to branding.
Employee operationalisation enables the framework to be ‘put into practice’.
Whilst operationalisation by employees as important, it is argued that it should also be
possible for framework’s to be operationalised by other groups such as consultants,

183
research students and so forth. Explicit consideration of this factor would help overcome
Naert and Leeflang’s (1978) concern point regarding many framework’s being built whilst
in practice few are used.
Ease of memorising results in a framework acting as a “mnemonic device”
(Suvatjis and de Chernatony (2005 :814) which can help stimulate dialogue, focus
thinking, provide a structure for problem solving whilst highlighting relationships between
dimensions.
The effectiveness of the framework is concerned with the extent to which it aids
strategy formation, priority setting and dealing with a dynamic environment (Cameron and
Whetten, 1983; Drucker, 1964; McFarland, 1979). Lunn (1978) also outlined how the
effectiveness of a framework can be judged by the extent to which it depicts the
relationship between its dimensions.
Leeflang and Wittink (2000) note how modularity means “the end result is obtained
by putting together a set of submodels or modules” (p.108). Suvatjis and de Chernatony
(2005) outline how modularity implies a framework can be broken up into distinct
components in order to prevent “bottlenecks” whilst allowing “flexibility in the assembly
of the component units” (p. 815). Modularity also enables more complex issues to be
addressed by breaking a large problem into simpler tasks, which once addressed can be re-
amalgamated as a final solution. Little’s (1975) BRANDAID marketing mix model is an
example of a modular based approach where, promotion, for example can either be added
or removed from the model at the user’s discretion.

184
The final criterion, proactivity, helps focus the efforts of those using the framework
on articulating and achieving goals (Suvatjis and de Chernatony, 2005).
To summarise, Suvatjis and de Chernatony’s (2005) present ten criteria for building
a “visual, clear and workable model” (p. 811). This provided useful guidance for
developing this thesis’ theoretical framework. However, the ten criteria are not without
their limitations. For instance, it may be ambitious to incorporate all ten criteria into the
development of a theoretical framework. Compromises may be required. For example,
developing a framework which has both ‘logical sequence’ and ‘modularity’ is
challenging. If a dimension or ‘module’ is removed from a framework the sequence which
the model intends to convey will be affected. For example, Suvatjis and de Chernatony’s
(2005) corporate identity model appears to be modular due to its ‘stations’. However, it is
more of a sequenced model due to flow each stations follows. If one of the stations is
removed the logical sequence of the model is altered. Furthermore, whilst in theory useful,
in reality the value of a sequential model may be limited. In the constantly changing
external environment rarely does reality unfold in this way. Additionally, it should be
noted how several of the criteria are particularly subjective. For example, visual clarity is a
matter of personal opinion. Some may regard a framework as visually engaging whilst
others consider it to be overly complex. It is challenging to see how such ‘particular’
criteria help assess a framework. It could also be argued the criteria fail to provide
guidance in terms of priority. Is ease of interpretation more important than modularity?
Moreover, the criteria offered appear to omit advice on whether models should operate at
the construct or process level. For example, Berry’s (2000) brand equity model clearly
operates at the construct level whilst Suvatjis and de Chernatony’s (2005) model appears to

185
incorporate constructs (e.g. visual identity and mission) in addition to processes such as
communication and aligning sub-cultures. Finally, Suvatjis and de Chernatony’s (2005)
use of the word ‘model’ appears to be somewhat liberal. These authors tend to draw mainly
on statistical or econometric literature to develop their ‘model’ criteria. Notwithstanding
the value of these criteria in the context of this research, it is contended that theoretical
frameworks and models should be distinguished from each other. Theoretical frameworks
refer to visual flows that pictorially represent the construct and the relationships between
its constituent dimensions. Models tend to be concerned with statistical or measurement
models which quantitatively validate and underpin relationships outlined in a given
theoretical framework.
This section of the chapter has outlined how Suvatjis and de Chernatony’s (2005)
criteria for model development provide useful guidance for the development of theoretical
frameworks. With these criteria in mind, the next section of this chapter presents a
preliminary service brand identity framework.
3.7.2. Evaluation of Preliminary Service Brand Identity Framework
The previous section of this chapter introduced Suvatjis and de Chernatony’s
(2005) criteria for evaluating models, which it was argued have applicability to the
evaluation of theoretical frameworks. This section of the chapter will now assess the
preliminary service brand identity framework in the context of these criteria.
186
In terms of visual clarity the service brand identity framework aims to encapsulate
service brand identity in a simple, clear and logical manner. However, as outlined above,
visual clarity is a subjective criterion and so this criterion tends to rest in the ‘eye of the
beholder’. Notwithstanding this issue, it is hoped the framework needs limited explanation
to make clear the multidimensional nature of the construct. Additionally, whilst it is
important this thesis visualises the postulated relationships via a theoretical framework,
this merely provides structure and guidance for the development of the underlying
measurement model. The measurement model is the mechanism that will enable this thesis
to identify what dimensions constitute service brand identity and whether the construct has
a positive influence on brand performance. Consequently, whilst visual clarity was
important, at this stage of the research process it was considered as a means to an end with
regards to the stated research questions.
The model’s ease of interpretation has been facilitated by rigidly adhering to a
managerial perspective. This provides focus and so ensures the model does not try to
become ‘all things to all people’ by considering both managerial and consumer based
constructs. The model also makes clear what constitutes service brand identity via its
dimensions. This is intended to reduce the likelihood of obtaining ‘absurd’ answers
(Little, 1970).
The logical sequence of the framework emanates from the literature where the
starting point for brand identity is brand vision (Aaker and Joachimsthaler, 2000; de
Chernatony, 2006). Service brand identity is realised via its postulated dimensions.
Currently, a logical sequence for service brand identity dimensions has not been presented

187
insofar dimensions are represented as simultaneous ‘tools’ the brand strategist can
orchestrate when executing their intended service brand identity. Consequently, logical
sequence may be a weakness of the preliminary service brand identity framework.
However, as noted previously, it must be questioned if a logical sequence reflection the
reality of business markets which are represented by fluidity and uncertainty as opposed to
chronology.
The adaptability of the model relates to how each service brand identity dimension
used can be employed to different degrees in line with how the brand strategist’s aims to
realise his / her desired service brand identity. For example, a greater emphasis on
corporate visual identity may be required to reduce the perceived risk associated with a
new service whilst the personality of the brand may be emphasised to endanger a deeper
emotional bond. Kentucky Fried Chicken, with Harland Sanders has used this strategy
from a visual and emotional perspective. Furthermore, each dimension can be adapted if
necessary. Kentucky Fried Chicken again provides a relevant example where the name was
abbreviated to KFC to reduce the unhealthy connotation of fried food (cf: corporate visual
identity systems). Consequently, within the postulated framework, service brand identity
can be adjusted at a second (service brand identity) or first order (dimension) level.
The model encourages synergistic thinking as the dimensions of brand identity
should not be regarded as mutually exclusive but as integrated and reinforcing. For
example, corporate visual identity systems and integrated marketing communications
should support brand personality which itself may play an important role in developing the
client relationship. At this stage, it was hard to evaluate the extent to which the model can

188
be operationalised by employees. This can only be assessed once the framework has been
used over a period of time.
The progression of the framework from left to right is intended to facilitate the ease
with which the model is memorised (at least in the western world). Furthermore, humans’
cognitive processing abilities are limited to approximately seven pieces of data (Miller,
1956). The current preliminary framework contains five dimensions. This reduces the
cognitive ‘load’ of the framework and so should facilitate the ease with which the model
can be memorised. Again, it is challenging to objectively assess the framework against this
criterion until the framework has been used.
In terms of the effectiveness of the framework, ‘strategy formation’ is facilitated by
service brand identity being regarded as the brand strategist’s vision for his / her brand (cf:
Aaker, 1996; Aaker and Joachimsthaler, 2000). This is consistent with the strategy
literature where vision is regarded as one of formative stages in strategy development
(Benis and Naus 1985; Collins and Porras 1996; Collins and Porras 1991; Hamel and
Prahalad 1989; Johnson and Scholes 2002). Next, the framework helps with ‘priority
setting’ via brand vision. Based on the strategist’s brand vision certain dimensions of
service brand identity may or may not be prioritised. Finally, in terms of dealing with a
dynamic environment, it is important to reiterate service brand identity is a strategic
construct and not tactical tool. Consequently, the framework’s value in terms of ‘dealing
with’ environmental changes may be limited. The reason being service brand identity
should be considered in conjunction with broader strategic and not tactical issues that

189
respond to short term market changes. If an organisation’s service brand identity was to
continuously change it would be challenging to execute a given vision consistently.
Modularity presents a challenge. As noted above, it is hard for a framework to meet
both the modularity and logical sequence criteria. However, the framework presented here
aims to span both criteria by presenting a (limited) logic sequence (as outlined above) with
each dimension of service brand identity being modular. Managers, in line with their
vision, could prioritise and utilise specific dimensions they think are particularly important
to realising their intended service brand identity. For example, in the early years of a brand,
the brand strategist may use marketing communications to emphasise functional and then
at a later date emotion benefits. Taiwanese original equipment manufacturers (OEM) such
as Acer and HTC have aptly done this. Furthermore, the framework can also be
considered modular given it breaks service brand identity into more manageable
dimensions. Consequently, there is flexibility in the arrangement of the dimensions in
terms of how they could be utilised.
Finally, as a result of incorporating the brand vision, the framework provides the
brand owner with the opportunity to proactively consider how he / she would like to
articulate and deliver the desired service brand identity. This is achieved via strategically
planning how each dimension can contribute to supporting the brand identity.
Collectively, the above points provide an evaluation of the preliminary service
brand identity framework. Now the framework has been evaluated it is important to
consider how dimension interactions exist. Taking this step acknowledges how, in reality,
a more complex picture emerges than the preliminary framework paints.

190
3.7.3. Service Brand Identity Framework – Dimension Interactions
The final element of evaluating the preliminary service brand identity framework
relates to considering the interactions between the postulated dimensions. As the
preliminary theoretical framework evolved it became apparent interactions between the
service brand identity dimensions exist. Table 7 summarises how the broader marketing
literature has considered certain dimensions as being related.

191
Table 7 Acknowledging Dimensions Interactions
Dimensions Literature Corporate visual identity and Integrated Marketing Communications (Notes 1 & 2)
(Aaker, 1996a; Aaker and Joachimsthaler, 2000; Balmer, 1995; de Chernatony, 2006; Henderson and Cote, 1998; McCracken, 1988; Melewar and Saunders, 1998; Melewar and Saunders, 2000; Schechter, 1993; Simoes et al., 2005; Van den Bosch et al., 2005, 2006a; Van Rekom, 1997; Van Riel, 1995; Van Riel and van den Ban, 2001)
Brand Personality and Integrated Marketing Communications
(Aaker, 1996a; Aaker, 1997; Birkigt and Stadler, 1986; Harris and Fleming, 2005; Keller, 2003; Van den Bosch et al., 2006a; Van Riel, 1995)
Brand Personality and Customer Relationships
(Aaker, 1996a; Aaker and Joachimsthaler, 2000; Aaker, 1995; Aaker et al., 2004b; Blackston, 1993; de Chernatony, 2006; de Chernatony and McEnally, 1999; Fournier, 1998; Ghodeswar, 2008; Phau and Cheen Lau, 2000; Smit et al., 2007; Swaminathan et al., 2008a; Sweeney and Brandon, 2006)
Brand personality and corporate visual identity (Note 1)
(Aaker, 1996a; Aaker, 1995; Birkigt and Stadler, 1986; de Chernatony, 2006; Van den Bosch et al., 2005; Van Riel, 1995)
Integrated marketing communications and customer relationships
(Anderson and Narus, 1990; Duncan and Moriarty, 1998; 1997; Keller, 2001, 2003; Kliatchko, 2005, 2008; Lee and Park, 2007; Morgan and Hunt, 1994)
Culture and brand personality Note 2
(Aaker, 1996a; Birkigt and Stadler, 1986; de Chernatony, 2006; Keller and Richey, 2006; Van Riel, 1995)
Communications and (a) internal and (b) external relationships
a) (Anderson and Narus, 1990; Berry, 1983, 1995; Duncan and Moriarty, 1998; 1997; Hutton, 1996; Reid, 2005) b) (Anderson and Narus, 1990; Duncan and Moriarty, 1998; 1997; Keller, 2001, 2003; Morgan and Hunt, 1994)
Culture and corporate visual identity (Notes 1 & 2)
(Balmer, 1995; Schein, 1984; Van den Bosch et al., 2004)
Culture and integrated marketing communications
(Van Riel, 1995)
Customer relationships and integrated marketing communications
(Gummesson, 1994)
Note 1: Authors tended to use the term symbolism, symbol or logo to refer to what is now generally referred to corporate visual identity. Note 2: Authors tend to refer to the term ‘culture’ generically. It is assumed here that most authors are referring to organisational culture which Webster’s (1990, 1993, 1995) marketing culture work drew on, in particular Deshpande and Farley (1999). Consequently, the constructs are considered related.

192
By uncovering these interactions, it is clear how researchers have to impose and
accept potential research constraints when moving from construct conceptualisation to
operationalisation. This is consistent with the logic that it may be impossible for the
marketing constructs of interest to accurately represent reality in its entirety (Keon, 1991).
To help address this issue, Leeflang and Wittink (2000) note how the best
frameworks are developed with specific objectives in mind. Consequently, whilst these
interactions have, and should be acknowledged, they will not be the subject of this
research’s statistical analysis for two reasons. Primarily, they do not directly relate to the
research objectives, or more accurately research questions given the approach this thesis
adopts. Furthermore, incorporating so many interactions into statistical analyses at this
formative stage of service brand identity development would make the research overly
complex given service brand identity construct dimensionality had yet to be established.
Indeed, Ehrenberg et al. (2000) note making models too complex at formative stage of
development is a common problem within the marketing literature. Consequently, at this
stage in the process developing a clearer empirical understanding of what dimensions
constitute service brand identity is considered more important than exploring the
relationships between those dimensions. However, the final service brand identity
framework presented later in this thesis will incorporate dimensions interactions. This was
decision was directly influenced by an awareness of interactions as per Table 7 and that
fact that it is unrealistic to expect dimensions to not correlate (Conway and Huffcutt, 2003;
Costello and Osborne, 2005; Hair et al., 1998).
This section of the chapter has introduced and evaluated a preliminary service
brand identity framework. The logic for acknowledging but not incorporating dimensions

193
interactions into the research has also been considered. Now it is appropriate to justify
why the dimensions outlined above constitute the domain of service brand identity.
3.8. Conclusions
This chapter, informed by an empirical gap in the brand identity literature,
developed a theoretically grounded preliminary service brand identity framework. The
rationale for developing this framework was four fold. First, to bridge the literature review
and the empirical research that follows. Second, to distil the extensive but relevant
literature reviewed in the previous chapter. Third, to inform and structure subsequent scale
development procedures by postulating a preliminary construct domain. Finally, to provide
a conceptual apparatus that guides the overall research effort in pursuit of answering the
remaining research questions which relate to dimensionality, measurement and construct
influence on performance. In summary and to use Adams and White’s (1994) language,
developing the preliminary framework this prevented this research from becoming a
“mindless theoretical wasteland” (p. 566) that did not focus on specific research questions.
This chapter opened by justifying why the scale development literature, and in
particular Churchill’s (1979) paradigm, was followed to develop a service brand identity
measure. Informed by preliminary service brand identity definition developed in the
literature review (Section 2.4.3), certain brand identity dimensions were considered as
falling outside the domain of service brand identity. This resulted in preliminary construct
dimensionality emerging. At this stage the relevance of the broader ‘identity’ literature to
this thesis service brand identity conceptualisation was also highlighted. Building on the

194
previous section, a preliminary service brand identity framework was presented. The
preliminary service brand identity framework comprised of five dimensions. These were
marketing culture, corporate visual identity, client relationship management, integrated
marketing communications and brand personality which were then justified in the
subsequent section. With a preliminary service brand identity framework presented, the
next section of the chapter developed a hypothesis highlighting the construct’s positive
influence on brand performance. Due to the lack of directly relevant literature this
hypothesis was grounded in the view that other brand related constructs such as brand
equity have been shown to drive performance-related outcomes, individual dimensions
have a positive influence on performance and that dimensions interactions exist. Based on
this logic, it was considered plausible to hypothesise service brand identity had a positive
influence on brand performance. The penultimate section of the chapter evaluated in the
model in the context of Suvatjis and de Chernatony’s (2005) criteria and acknowledged
how dimensions interactions may exist.
This chapter has built upon a broad range of literature to postulate a preliminary
service brand identity framework and hypothesise a service brand identity–performance
effect. This lays the foundations for the next chapter where the methodology employed to
develop a valid, reliable and parsimonious service brand identity scale is outlined.

195
4. METHODOLOGY
4.1. Introduction
Guided by the literature review, the previous chapter introduced the preliminary
service brand identity framework. The construct was considered as comprising of
marketing culture, corporate visual identity systems, integrated marketing
communications, client relationship management and brand personality. A hypothesis
outlining service brand identity’s positive effect on brand performance was also developed.
This chapter outlines the methodology used to obtain data that will enable the
domain of service brand identity and the construct’s influence on brand performance to be
established. The chapter consists of four sections which are summarised in Figure 19.
Research Design
Sampling
Scale Development Process / Measures
Finalising the Survey Design
Quantitative Data Analysis
Figure 19 Methodology Chapter Structure
The first section provides an overview of the quantitative research design
employed. This is followed by a description of the sampling technique used. Next, the
scale development process, which is principally guided by Churchill’s (1979) paradigm, is
outlined. The fourth section describes how the survey was finalised. Issues surrounding
survey structure, question format, bias and the use of subjective performance measures and

196
pretesting / piloting are discussed at this stage. The penultimate section of the chapter
reviews the quantitative methods used to analyse the data. Concluding remarks reiterate
how this chapter has been informed by the scaling (Churchill, 1979; DeVellis, 1991;
Netemeyer et al., 2003) and structural equation modelling (Anderson and Gerbing, 1988)
literature whilst facilitating collection of the data required for the next chapter – Analysis.
4.2. Research Design
As chapter one outlined the focus of this research lies with establishing service
brand identity dimensionality and the construct’s influence on brand performance. In order
to address these research questions a quantitative research design employed. The reason
being qualitative methods such as case study or in-depth interviews would have not
enabled such research questions to be addressed. Overall the research was conducted in
three stages, which themselves contained respective phases.
The first stage was guided predominantly by Churchill’s (1979) paradigm and
subsequent scaling literature (DeVellis, 1991; Netemeyer et al., 2003). This involved
defining the construct of interest, that is, service brand identity, and developing a pool of
items to scale each dimension. These items were then subject to expert panel review which
resulted in the number of items being reduced to a more manageable level.
The second phase of the research involved writing a covering letter and finalising
the final survey in line with Dillman’s (2000) principles. Consequently, following the
expert panel review in stage 1 the items were subject to a series of pretests in addition to a

197
pilot being conducted. At this stage considerable thought was also given to a sample size
versus number of mailings dynamic. In other words, is one large mailing preferable to two
or more smaller mailings? Based on this literature, the final survey was administered by
postal mail to a random sample of senior executives working in the UK’s IT service sector.
The reasons for not conducting a follow up mailing are provided later in this chapter
(Section 4.5.7).
The third and final stage of the research design involved data analysis. Following
Churchill’s paradigm item-to-total correlations, Cronbach’s α and exploratory factor
analysis were initially used. However, consistent with subsequent authors (Anderson and
Gerbing, 1988; Gerbing and Anderson, 1988) who augmented Churchill’s (1979) paradigm
confirmatory factor techniques were used to verifying the factor structure, establish the
scale’s psychometric properties and assess the influence of service brand identity on brand
performance as part of the full structural model.
4.3. Target Population, Sampling Frame, Sample and Completed Sample
Now that the survey design has been outlined it is appropriate to clarify the
sampling procedure that was used.
The target population consisted of all UK based IT service organisations that could
be obtained. These comprised the units which this research’s data intends to generalise to.
Sampling from this sector was considered appropriate for two reasons. First, this thesis is
focused on service brands operating in a B2B market (Section 1.8). Based on these two

198
criteria, IT service organisations provide a highly relevant market. Second, the IT services
market is highly competitive with over 75% of market share (by value) being pursued by
non top four organisations (Datamonitor, 2007). This places an emphasis on organisations
to differentiate their proposition, via branding, in a market which offers largely
undifferentiated (i.e. standards based technical protocols) services.
The sampling frame consisted of named senior ‘marketing’ executives working in
the IT services sector. A total of 3241 contacts were returned when a “marketing
executive” database search was performed. The sampling frame was obtained from the
ONESOURCE database hosted at the British Library. This was preferred to the University
hosted FAME database for the following reasons. First, it is possible to search by
functional title (i.e. marketing) whilst ONESOURCE provided a larger sampling frame of
3241 (vs. 1820 organisations from FAME). Furthermore, the ONESOURCE database
provides a Business Description search facility which has been cross-validated with
Experian data. This provides the benefit of more accurate lists than if SIC-based lists (as
does FAME) had been used. The reason being SIC are taken in good faith by Companies
House when companies submit their accounts.
When a marketing contact was not provided the CEO / MD was selected. Whilst
this thesis’ definition of brand identity is concerned with the “strategist”, CEO / MD’s
were also accepted for five reasons. First, obtaining data from organisations’ most senior
personnel is consistent with how this thesis has defined service brand identity, that is, as a
senior management construct. Second, managing service brand identity is a strategic
activity. Executives are regarded as the most knowledgeable sources for this type of
information (Cycyota and Harrison, 2002; Norburn and Birley, 1988). Third, such

199
individuals should have a clear vision for how their brand should be perceived by its
stakeholders. Fourth, CEO / MD’s should have signed off a document outlining the service
brand identity strategy as articulated by the ‘brand strategist’ and so be engaged with the
brand identity building process. Fifth, it has been noted in the corporate identity literature
(Balmer, 1995), which feeds into this thesis’ conceptualisation of service brand identity,
that senior management play a critical role in the ‘identity’ building process and so are
well placed to give their opinion on such issues. Consequently, the most senior marketing
(or CEO / MD) contact was selected.
A random sample of 2150 (2200 including 50 pilot surveys) executives was drawn
from the sampling frame using MS Excel’s Random Generator. The final survey was sent
to these individuals. The logic for 2200 is as follows. With, 50 items (before psychometric
analyses began), calibration and validation samples of 250 were required. This is based on
a participant to item ratio of 5:1 (Floyd and Widaman, 1995; Nunally, 1967). Hence, a
completed sample of at least 500 was required. As a ratio of 5:1 is the minimum, a slightly
higher target sample of 600 was aimed for. Guided by Cycyota and Harrison’s (2006) meta
analysis of executive research which yielded an average response rate of 28% a sample of
2200 was required (allowing for a pilot of 50) i.e. N x 28% = 600 (NB this gives 2143 to
be precise).
Finally, the completed sample (N=421) was the list of executives that actually
responded to the survey on the 12th May 2008. This represented a 19% response rate.
Whilst this is lower than Cycyota and Harrisons (2006) expected 28%, based on

200
discussions with scholars who have conducted similar research a 20% response rate was ,
retrospectively, more realistic.
4.4. Scale Development Process
To develop and validate the scale, this thesis was guided by Churchill’s (1979)
paradigm, which has been subsequently enlarged to incorporate confirmatory factor
analysis (Anderson and Gerbing, 1988; Gerbing and Anderson, 1988). The logic for
following this process was two fold. First, such scale development procedures are widely
endorsed in the scaling literature (Clark and Watson, 1995; DeVellis, 1991; Netemeyer et
al., 2003; Nunally and Bernstein, 1994). Second, this paradigm has been extensively used
in the marketing literature (de Chernatony et al., 2004; Simoes et al., 2005; Sin et al.,
2005b; Walsh and Beatty, 2007; Yoo and Donthu, 2001). Table 8 summarises the scale
development process that was followed. The psychometric property of interest during each
stage in the process is also highlighted.

201
Table 8 Scale Development Process Specify dominant of construct / define construct of interest (Brand Identity) Content validity
Sample the construct’s domain / obtain a pool of items Content validity
Administer items for expert panel Content & face validity Trim items based on a priori decision rule Content & face validity Pretest and pilot survey Content & face validity Administer final survey (with subjective brand performance measures)
Split the completed sample into calibration and validation sample
Purify scale items using Cronbach’s α / item to total correlations (calibration sample) Reliability
Conduct exploratory factor analysis (calibration sample)
Conduct confirmatory factor analysis (using measurement model on calibration sample) Item unidimensionality
Conduct confirmatory factor analysis (using measurement model) on validation sample
Item unidimensionality, composite reliability,
discriminant and convergent validity
Conduct structural equation modelling (using structural model) on validation sample
Assess influence of service brand identity on brand
performance Sources: (Anderson and Gerbing, 1988; Churchill, 1979; DeVellis, 1991; Gerbing and Anderson, 1988; Netemeyer et al., 2003)
202
4.4.1. Specify Domain of the Construct
The first step of Churchill’s (1979) paradigm involves specifying the domain of the
construct where “the researcher must be exacting in delineating what is included in the
definition and what is excluded” (Churchill, 1979 :67). Influenced by the work of several
brand identity scholars (Aaker, 1996a; Aaker and Joachimsthaler, 2000; Keller, 2003), this
thesis regards service brand identity as a managerial, not consumer construct. The literature
review (Section 2.4.3) provided this thesis’ rationale for defining service brand identity as:
The strategist’s vision of how a service brand should be perceived by its stakeholders.
Consequently, the literature enabled this thesis to develop a preliminary service
brand identity definition which in its turn helped specify the construct’s domain and
provide early dimensionality guidance (DeVellis, 1991). As noted in the theoretical
framework chapter, the domain of service brand identity was postulated as consisting
dimensions of marketing culture, corporate visual identity systems, integrated marketing
communications, customer relationship management and brand personality. Hence,
beginning scale development with clear construct definition is consistent with Netemeyer
et al’s (2003) approach where “the process of scale development starts with a thorough
review of the literature in which a solid theoretical definition of the construct and its
domain is delineated and outlined” (p.9).

203
4.4.2. Generate a Pool of Items
With service brand identity defined and a priori dimensionality postulated, it was
necessary to generate a pool of items that measured each dimension. Within the scaling
literature such dimensions are referred to as latent variables (DeVellis, 1991; Netemeyer et
al., 2003) because they are elusive abstractions which cannot be observed or measured
directly (DeVellis, 1991). In order to operationalise latent variables, items are required
that ‘tap’ or ‘scale’ the domain of the construct (Netemeyer et al., 2003).
To scale each latent variable multiple items were generated with the logic being
four fold. First, multiple items “allow the most unambiguous assignment of measuring to
the estimated constructs” (Anderson and Gerbing, 1988: 415). Second, multi item scales
enhance scale reliability (Churchill, 1979; Peter, 1979) as measurement errors cancel each
other out (Peter, 1979). Third, no single item is likely to be adequate in measuring a
construct (Churchill 1979; Clark and Watson 1995; DeVellis 1991; Netemeyer et al. 2003).
Fourth, it is difficult to assess the psychometric properties of single item measures
(Diamantopoulos, 1999).
In order to generate items for each latent variable two approaches were used. The
first involved ‘culling’ or adapting items from existing scales (Table 9). A full list of
items, their source and the stage of elimination can be found in Appendix 1.

204
Table 9 Source of Scale Items
Dimension Measurement focus Items culled / adapted from: Marketing Culture Importance placed on
marketing culture.
Webster (1995; 1993; 1990) Kotter and Heskett (1992)
Corporate Visual Identity Systems
Importance placed on Corporate visual identity.
Simoes et al.(2005) Stuart (Stuart, 1999) Melewar (1998; 2000) Van den Bosch et al (2006a) Baker and Balmer (1997)
Integrated Marketing Communications
Degree to which marketing communications is integrated
Reid (2005) Duncan and Moriarty (1997) Ewing and de Bussy (2000) Low and Lamb (2000)
Customer Relationship Management
The quality of the customer-brand relationship management
Fournier (1994) Roberts et al (2003) Iacobucci et al.(1995) Sirdeshmukh et al.(2002) Aaker et al. (2004b) Boon and Holmes (1999) Sin et al.(2005b)
Brand Personality The strength, favourability and uniqueness of the brand personality association.
Keller (2003)
For the brand personality dimension it was not possible to adapt or cull items from
previously published scales. The reason being the brand personality literature has tended
to focus on measuring personality type (Aaker 1997; Davies et al. 2004; Davies et al. 2001;
Plummer 1985; Sweeney and Brandon 2006), assessing the value of current personality
type scales (Austin et al., 2003; Azoulay and Kapferer, 2003), the pervasiveness of certain
personality types in specific sectors (Siguaw et al., 1999), the importance of brand
personality congruity with self (Aaker, 1999; Mulyanegara et al., 2009a; Sirgy, 1986; Sirgy
et al., 2000; Sirgy and Su, 2000; Swaminathan et al., 2008b) or product personality
(Govers and Schoormans, 2005) and the practical relevance of anthropomorphisation

205
(Bengtsson, 2003; Bromley, 2001; Caprara et al., 2001; Cornelissen and Harris, 2001; Van
Riel and Balmer, 1997). Indeed, Freling and Forbes (2005) note how the brand personality
literature “generally diagnoses the nature of a brand’s personality – not its impact on brand
performance” (p. 405).
Consequently, Keller’s (1993) types of brand association, as dimensions of brand
image within his brand equity conceptualisation, were used to operationalise brand
personality. The logic being three fold. Primarily, brand personality is an association
(Aaker, 1995, 1997; 1999; Batra et al., 1993; Freling and Forbes, 2005a; Haigood, 1999;
Johar et al., 2005; Kotler and Pfoertsch, 2006b). For example, Singapore Airlines and
Shangri-La are associated with sophistication and charm (Ramaseshan and Tsao, 2007).
Indeed, Freling and Forbes (2005b) draw on spreading activation theory (Collins and
Loftus, 1975) to note:
“Brand personality fits into this conceptualisation (i.e. spreading activation theory)
of brand knowledge because it is one of potentially many brand associations that
contribute to the meaning of the brand for consumers” (p. 151).
Furthermore, Keller’s (1993) work is theoretically grounded and extensively
referenced in the branding literature. This provides academic credibility to these
association ‘types’. Finally, in the absence of a previously validated scale, the scaling
literature advocates utilising theory to develop theoretically grounded items (Clark and
Watson, 1995; DeVellis, 1991). Collectively these points provide the rationale for drawing
on Keller’s (1993) work in order to measure brand personality as an association.

206
At this stage, three additional personality items were included for two reasons.
First, with only three items the final personality measure may not have had multiple items.
Second, the scaling literature encourages item redundancy earlier in the scale development
process (Netemeyer et al., 2003). Given the generally weak polarisation of the survey
items, stronger item wording was used to increase response variability (Lam and Stevens,
1994; Wyatt and Meyers, 1987). For example, “The associations making up our brand
personality are extremely positive”.
Consistent with Churchill’s (1979) paradigm several scholars have included a
qualitative item generation stage when developing a scale (Lytle et al., 1998; Simoes et al.,
2005; Walsh and Beatty, 2007). Such a qualitative stage takes the form of focus groups or
exploratory interviews and aims to augment items grounded in the literature. It is
appreciated a qualitative stage adds to items’ richness, contextual relevance whilst
enhancing face and content validity. However, such a stage was not employed for several
reasons.
Primarily, it was noted from the literature how published scales, in journals such as
the Journal of Academy of Marketing Science (Baker and Sinkula, 2005a; Guiry et al.,
2006), Journal of Business Research (Sin et al., 2005a), Journal of Service Research (Lings
and Greenley, 2005b) or those focusing on B2B research such as Industrial Marketing
Management (Bennet et al., 2005; Cretu and Brodie, 2005) did not always employ a
qualitative item generation stage. Furthermore, whilst Churchill’s (1979) work is seminal
and has had an extensive impact on measuring latent constructs it should be acknowledged
how this paradigm is over 30 years old. Specifically, it could be regarded as

207
epistemologically inconsistent to adopt both an inductive and deductive approach
simultaneously. Similarly, although Churchill’s (1979) research suggests a qualitative
stage more recent scale development literature e.g. Netemeyer et al (2003) does not
incorporate a qualitative stage but stresses the importance of reviewing relevant literature
to generate theoretically grounded items.
A qualitative item generation stage was not included for other reasons. The
researcher had concerns surrounding the practicality of administering a large number of
items (n=119) to the expert panel. Such a large number of items had the potential to
adversely affect the quantity and quality of expert panel participation. Informed by these
reservations the experience survey was sent to five senior marketing executives at leading
IT service organisations who agreed to review the document in terms of logic, length and
format. During follow up telephone interviews all five executives voiced concerns over
the length of the experience survey and advised against adding more items via a qualitative
stage. This decision was later substantiated, as will be highlighted the next chapter
(section 4.4.4). Several panel members initially agreed to complete the experience survey
but on receipt refused to do so citing length of time required as the sole reason. Members
of the expert panel were also invited to modify current or suggest new items.
Unfortunately, this did not result in additional qualitatively generated items being
developed. Once again this suggested completing the experience survey, in its current
length, was a time consuming task. It could also imply the expert panel may have
considered the current pool of items a comprehensive representation of the construct’s
domain. Finally, as Table 9 indicates an abundance of items already existed in form of
extant scales and literature. For these reasons the value of a qualitative stage was
acknowledged and incorporated to an extent by giving expert panel members the

208
opportunity to add or modify items but not employed as a formal stage within the item
generation stage.
4.4.3. Item Wording
In parallel to developing a pool of items it was necessary to consider the issue of
item wording. Churchill and Peter (1984) found the level of item difficulty did not
adversely affect scale reliability. However, this tends to be at odds with the broader scaling
literature in terms of items that have ‘good’ characteristics (Clark and Watson, 1995;
DeVellis, 1991; Netemeyer et al., 2003). Consequently, care was taken to ensure the items
were clear (DeVellis, 1991; Nunally and Bernstein, 1994) and unambiguous (Alreck and
Settle, 1995; Johnson et al., 2004) whilst avoiding specialist jargon (Baker, 2003), double
barrelled (Alreck and Settle, 1995; DeVellis, 1991; Netemeyer et al., 2003) or double
negatives (Payne, 1980). This approach is consistent with the logic that simplifying items
will enhance reliability (Peter, 1979).
In order to address the above wording issues six second year Business School PhD
students (three marketing and three non marketing but aware of scaling procedures) and
one research member from Centre for Research in Brand Marketing at the Business School
were asked to complete the questionnaire and report any issues. The main change related to
the initial rewording of Webster’s (1993) marketing culture (semantic differential) scale
items. Initially, each item incorporated “(It is important)” before the item but several
participants said this was confusing and untidy. Making such modifications at this stage in
the scaling process is consistent with other brand related scale development (Vasquez et
al., 2002; Yoo and Donthu, 2001). Subsequently, only minor grammatical changes were

209
made and this version of the experience survey was regarded as final (please see Appendix
2).
4.4.4. The Experience Survey
An initial pool of 119 items resulted from the literature review and constituted the
experience survey (Churchill, 1979). This was intended to be over and not under inclusive
to ensure the construct had been adequately sampled (Clark and Watson 1995; DeVellis
1991; Loevinger 1954; Nunally and Bernstein 1994). The logic for this approach was two-
fold. First, it is easier to remove than add items at subsequent stages (Clark and Watson,
1995). Secondly, adopting this approach increases the probability that all dimensions are
adequately represented which enhances content validity (Netemeyer et al., 2003).
The experience survey looked to obtain three pieces of information. The first
concerned asking for expert panel members’ views on service brand identity items
generated from the literature. Expert panel members’ views were assessed via the extent to
which they thought each item ‘represented’ the domain of service brand identity (cf;
Zaichkowsky, 1985). Second, expert panel members were invited to modify the more
theoretically grounded items that had been developed based on the literature to enhance the
scale’s face validity. Finally, the experience survey also encouraged expert panel members
to suggest items they felt had been overlooked to improve content validity.
The survey consisted of two parts. First, each panel member was asked to outline
the extent to which each item ‘represented’ the domain of service brand identity on a three
point Likert scale. The points were anchored as “not representative”, representative”,

210
“clearly representative”. A ‘compact’ three-point scale was used and an equivocation
statement not provided for three reasons. First, Hardesty and Bearden’s (2004) review
outlines how three categories have been frequently applied at this stage in the scaling
process [e.g. Netemeyer et al (1996), Bearden et al (2001), Zaichkowsky (1985) and Sin et
al (2002)]. However, unlike these scholars ‘Somewhat representative’ was replaced by
‘Representative’ given ‘somewhat’ is regarded as ambiguous (DeVellis, 1991; Dillman,
2000). Second, given the number of items, the author did not want the item rating process
to be overly arduous by making the number of scale points too granular. Initial feedback
from the group of Business School PhD candidates that completed the experience survey
(see above) indicated the task took between 20-25 minutes to complete. Finally, the
objective of the exercise was to retain or remove items, that is, to make a decision. A
smaller number of categories can help with this process by avoiding excessive deliberation.
Following Netemeyer et al.’s (2003) suggestion, the panel was also asked to comment on
each scale item. This related to item clarity or conciseness, terminology etc. Given a
qualitative stage had not been employed to generate scale items each panel member was
also invited to comment on or modify individual items. As noted above, this was driven
with face validity considerations in mind.
The final part of the experience survey invited participants to suggest additional
items they thought had been omitted. The objective being to ensure the domain of the
service brand identity construct had been comprehensively ‘tapped’. This was intended to
compensate for any potential shortcomings in the generation of scale items given a formal
qualitative stage in the form of focus groups or exploratory interviews (cf: Churchill, 1979)

211
had not been conducted. At this stage no additional scale item suggestions were made
which might suggest that the domain had been adequately sampled.
4.4.5. The Expert Panel
The next stage in the scale development process entailed the initial pool of service
brand identity items being reviewed by the expert panel. Collecting this data was intended
to assess the extent to which the service brand identity items generated from the literature
represented the domain of construct. Once reviewed, these items would then form the
service brand identity-related questions in the survey administered to the sample. These
questions would then be subject to quantitative data analysis consistent with established
scale development to establish the scale’s psychometric properties procedures (DeVellis,
1991; Netemeyer et al., 2003).
Potential expert panel judges were contacted based on one of two criteria 1) they
had published widely in the brand identity field or 2) they were brand identity practitioners
at ‘leading’ brand consultancies. ‘Leading’ brand / advertising agencies were identified
from Campaign’s Marketing Advertising League (Campaign, 2007).
A panel of six experts completed the expert survey. This is consistent with
Netemeyer et al. (2003) who suggest five or more judges as a practical rule of thumb is
suitable for an expert panel. Three panel members were academics at leading Universities
(one in Germany and two in the US) who also consulted widely on branding issues. Due to

212
the length of the survey a well respected UK based branding academic commented on the
items but did not complete the survey. The remaining three panel members were senior
practitioners working at leading global brand consultancies.
4.4.6. Item Retention
Hardesty and Bearden (2004) note how inconsistent item retention criteria have
been used. These, generally guided by Zaichkowsky’s (1985) seminal work include: at
least five of the six judges agree the item “tapped the domain” of the construct (Shimp and
Sharma, 1987), all judges regarded the item as at least “somewhat representative”
(Netemeyer et al., 1996), items were, on average, at least regarded as “somewhat
representative” (Bearden et al. 2001) or that all items should be regarded as “somewhat
applicable” to the domain of the construct (Sin et al., 2005, Walsh and Beatty, 2007).
Given the consistency of language, Netemeyer et al. (1996) and Bearden et al.’s
(2001) approach was considered particularly relevant. However, the former’s decision rule
resulted in all items being deleted. This was considered too severe at such an early stage in
the scaling process. Conversely, Bearden et al.’s (2001) ‘average’ decision rule, that is,
three or more panel members regarding the item as being representative (or clearly
representative) reduced the number of items to 89. Based on experience gained from
administering the experience survey to the expert panel this was considered too long.
Hence, guided by the literature and practical judgement, Bearden et al.’s (2001) rule was
adapted so that the item was, on average, “clearly representative”. This reduced the number
of items from 119 to 68 (41% of items were removed) which was considered more feasible

213
given the executive level target population. This percentage is slightly lower than the
average reported in Hardesty and Bearden’s (2004) literature review where, on average,
51% of items were removed. Figure 20 shows the frequency distribution of scale items
before and after the expert panel review.
0
20
40
60
80
100
120
140
No.
of I
tem
s
Marketing Culture 38 13
Corporate Visual Identity 19 13
Brand Personality 6 6
Customer RelationshipManagement
41 26
Integrated MarketingCommunications
15 10
Initial Item Pool Items after Expert Panel
Figure 20 Frequency Distribution of Scale Items by Dimension
Before & After Expert Panel
4.5. Finalising the Survey Design
The previous section of this chapter outlined how, guided by the scaling literature,
68 brand identity items remained after expert panel review. The next stage of the
methodology involved finalising the survey (please see Appendix 3 for final survey and
accompanying covering letter). At this stage decisions regarding survey structure, response
format, bias, justifying the use of subjective brand performance measures, pretesting / pilot

214
and response rate enhancing techniques were made. However, before these issues are
discussed the rationale for using a postal survey is provided.
4.5.1. Rationale for Postal Survey
The self completed postal survey is a well recognised marketing research data
collection method (Dillman, 1978; Falconer and Hodgett, 1999) and was used for several
reasons. Primarily, for deductive research, survey is considered the most appropriate
method for obtaining data to test hypotheses (Baker, 2001). Hence, it was necessary to
match the method to the problem and not vice versa (Creswell, 2003). Furthermore,
survey facilitates the economical collection of large amounts of data whilst being
consistent with specifications of scientific research e.g. being logical, deterministic,
general and parsimonious (Hart, 1987). Moreover, the versatile, flexible, efficient and
comprehensive nature of survey provide major benefits vis-à-vis qualitative methods
(Alreck and Settle, 1995; Fox et al., 1988) whilst Klassen and Jacobs (2001) note how
surveys are particularly suitable when investigating concepts (cf: what is service brand
identity?), testing theory (cf: what are the dimensions of service brand identity?) and
analysing / measuring relationships (cf: does service brand identity have a positive
influence on brand performance?). Finally, surveys can provide participant assurance with
regards to confidentiality (Leong and Austin, 1996) which is often a major executive
concern (Falconer and Hodgett, 1999).
The market research literature highlights several benefits web based surveys have
in comparison to mail surveys. These include reduced costs (Ilieva et al., 2002),

215
eliminating the need for data input (Ilieva et al., 2002; Kaplowitz et al., 2004), quicker
response times (Jobber and O'Reilly, 1998; Schaefer and Dillman, 1998) and, apparently,
having superior completion rates (Klassen and Jacobs, 2001). However, web based survey
was not used for several reasons. Primarily, it was not possible to obtain a list of senior
brand / marketing executives’ emails without purchasing them (at some expense).
Furthermore, Sills and Song (2002) note how managers are frequently inundated with
emails that are in danger of being treated as ‘spam’. Sending a postal letter was regarded as
a way of differentiating the research. Also, several empirical studies have highlighted how
response rates from web based surveys tend to be lower than postal survey (Fricker and
Rand, 2002; Kaplowitz et al., 2004; Klassen and Jacobs, 2001; Saunders et al., 2007;
Schaefer and Dillman, 1998) whilst unsolicited email tends to be treated with disdain due
to its more personal nature with the outcome potentially being a reduced response rate.
Finally, given the ease that an email can be sent with, such an approach reduces the overall
value in the context of social exchange (Homans, 1958) which underpins the survey
response process (Dillman, 2000).
4.5.2. Survey Structure
The survey consisted of three sections. The first contained service brand identity
items. Earlier items were intended to be simple (Baker, 2003), non threatening (Gendall,
1998) and immediately associated with the subject matter (Dillman, 2000). Consequently,
a small number of corporate visual identity questions were initially asked. The rationale
being logos and organisation nomenclature are frequently (and incorrectly) regarded as
being the brand (cf: AMA definition). In order to reduce pattern response the items were

216
not grouped by dimension (Brace, 2006). The second section of the survey consisted of
eight subjective brand performance measures along financial, customer and employee
based dimensions. The source of items for each dimension was outlined in the literature
review (Section 2.6.2). Finally, descriptive data such as position, number of employees,
age and so forth was obtained at the end of the questionnaire for two reasons. First, the
researcher did not want participants to ‘break off’ due to what could be perceived as
personal (Baker, 2003) or irrelevant (Brace, 2006; Dillman, 2000) questioning early in the
survey. Second, if respondent fatigue became an issue, the most critical data had already
been obtained (Brace, 2006).
4.5.3. Format of Survey Questions
Given the need to measure the strength and direction of participant’s attitudes the
Likert scale format was used in the main survey. Strictly speaking, Likert scales are
ordinal, however there is a general consensus of opinion that interval based techniques
such as exploratory factor analysis and structural equation modelling can be applied to
Likert scales (Clark and Watson, 1995; DeVellis, 1991). The reason being the
psychological distances on a Likert scale are not equal but very close (Kennedy et al.,
1996). The treatment of (ordinal) Likert scales as interval also finds wider support in the
marketing research literature (Aaker et al., 2004a; Hair et al., 2006).
In terms of the number of scale points, Garland (1991) outlines how this is
essentially a matter of personal preference whilst other scholars (Cox, 1980; Moors, 2007)
note how the ideal number of response categories has yet to be established. Several

217
scholars (Cox, 1980; Green and Rao, 1970; Matell and Jacoby, 1972; Weng, 2004)
consider between six and seven as optimal number of points in order to provide a reliable
and consistent participant response. After consulting the extensive number of scale points
literature (Andrews, 1984; Brace, 2006; Churchill and Peter, 1984; Clark and Watson,
1995; Coulthard, 2004; Cox, 1980; Dawes, 2008; Fabrigar et al., 1999; Garland, 1991;
Green and Rao, 1970; Krosnick and Fabrigar, 1997; Matell and Jacoby, 1972; Moors,
2007; Netemeyer et al., 2003; Saunders et al., 2007; Smith, 1993; Weng, 2004) a seven
point Likert scale was used for several reasons.
First, Malhotra and Birks (2006) note statistical techniques such as exploratory
factor analysis require seven or more scale points. Furthermore, scales with more than
seven points do not tend improve validity or reliability (Dawes, 2008). Moreover, if an
even number of points is used participants may feel uncomfortable about being '’forced’
into providing a response (Cox, 1980). This could be considered unethical. Additionally,
an odd number of responses is preferable when participants have a legitimate reason for
adopting a neutral position (Brace, 2006; Cox, 1980), as they may well do with this
research. Finally, the absence of a mid point could be problematic as it may reflect the
participant’s true opinion (Brace, 2006; Krosnick and Fabrigar, 1997; Smith, 1993, 1995).
Consequently, for these reasons, a seven point Likert scale was used.
The final scale issue related to the use of scale labels and numbers. Scale labels
were used as this “enables participants to conceptualise and respond in spatial terms” (Cox,
1980: 420) whilst Weng (2004) concludes a scale with each anchor label clearly specified
should be preferred to achieve consistent and stable participant responses” (p. 970). The
mid point was labelled ‘not sure’ as opposed to ‘don’t know’ given the as the former is

218
regarded less threatening (Saunders et al., 2007). Numbers and labels were used as this
approach is advocated in the literature (Krosnick and Fabrigar, 1997; Netemeyer et al.,
2003) with Schwarz et al. (1991) noting the use of numbers and labels helps
“disambiguate” (p. 577) scale points more than if just one was used.
Consequently, a seven point Likert scale anchored from ‘Agree Very Strongly’ to
‘Disagree Very Strongly’ with a midpoint of ‘not sure’ was used. Following Dillman
(2000), an agree-to-disagree scale direction was used.
4.5.4. Considering Bias as Part of Survey Design
Due to the survey nature of this research it was necessary to contemplate bias as
part of the research design. Socially desirable, acquiescence and non response bias were
considered as part of the survey design.
4.5.4.1.Socially Desirable
Socially desirable responding is concerned with a participants tendency to answer
questions in a manner consistent with favourable cultural norms (Mick, 1996; Nederhof,
1985). Social desirability bias was considered important for two reasons. First, as
subjective brand performance measures have been used an individual may wish to provide
answers that enhance his / her status or self esteem. The results being distorted or
exaggerated responses (DeVellis, 1991). Furthermore, the importance of socially desirable

219
responding in self report survey research is frequently understated (Netemeyer et al.,
2003). Consequently, this thesis was mindful of this issue.
Authors such as Crowne and Marlowe (1960) in addition to Strahan and Gerbasi
(1972) have developed scales that assess the extent to which socially desirable responding
constitutes a research issue. However, they were not used for several reasons. Primarily,
the incorporation of such scales would result in additional items and so amplify parsimony
concerns. Furthermore, using self administered questionnaires reduces socially desirable
responding tendencies (Brace, 2006; Fricker and Rand, 2002; Nederhof, 1985). This is
consistent with Richman et al. (1999) who found participants tended to respond in more
socially desirable ways when they were with other people. Finally, empirical research has
highlighted how socially desirable responding tends not to be an issue with executives
(Cycyota and Harrison, 2002). Consequently, the issue of socially desirable responding
was acknowledged but not considered as an issue in the context of this executive focused
research.
4.5.4.2.Acquiescence
Acquiescence bias, or “yea-saying”, relates to a participant’s tendency to agree
with a statement regardless of whether it is positively or negatively phrased (Billet and
McClendon, 2000; Brace, 2006; Johnson et al., 2004). To avoid acquiescence, several
scholars (Baumgarter and Steenkamp, 2001; Churchill, 1979; Nunally, 1967) advocate the
use of both negatively and positively worded items. However, mixed items were not used
for six reasons. First, Cycyota and Harrison (2002) and Baker’s (2003) research
highlighted how acquiescence bias was not an issue with executives or those that had
higher education levels respectively. Secondly, negatively worded statements can be more

220
difficult to process or confusing (DeVellis, 1991; Johnson et al., 2004; Netemeyer et al.,
2003; Patten, 1998) given they increase the number of cognitive operations required
(Swain et al., 2008) . Consequently, participants have “to concentrate more on how to
respond correctly than on the substance of each question” (Dillman, 2000: 129). Third, a
mixture of negatively and positively worded statements tends to adversely affect factor
structure (Schmitt and Stults, 1985) insofar that items tended to load onto factors in line
with question ‘polarity’(Herche and Engellend, 1996). The reason being an item phrased
positively and negatively phrased is not necessarily symmetrical. Fourth, Herche and
Engellend (1996) found mixed items adversely affect item unidimensionality. Fifth,
negatively phrased items have been found to increase misresponse even when
acquiescence and inattention were not issues (Swain et al., 2008). Misresponse occurs
when respondents select responses on the same side of the neutral response irrespective of
whether the item is positive or negative and so constitutes a form of systematic
measurement error. Finally, the influence of mixed statements on reliability has provided
inconclusive findings. Whilst Churchill and Peters (1984) found no evidence that mixed
statements adversely affect reliability more recent research has tended to find the opposite
(Eisenbach and Schriesheim, 1995; Johnson et al., 2004; Netemeyer et al., 2003). Mindful
of these issues, all questions were phrased positively.
4.5.4.3.Non Response
Non response bias is concerned with determining if respondents and non
respondents provide significantly different answers (Dillman, 2000) and can be an issue
when response rates are less than 100% (Armstrong and Overton, 1977). Following the
“interest hypothesis”, which assumes that non-respondents are like late respondents

221
(Armstrong and Overton, 1977), early and late respondents’ scores are subject to a
independent t-test (on interval data) and a χ2 test (on nominal / categorical data) to assess if
there was a significant mean difference between early and late respondents. If late
respondents’ answers differ from those that have responded unprompted there is an
increased chance the model will be biased. This can be identified by a statistically
significant test statistic (i.e. t<0.05) (Saunders et al., 2007).
However, the survey was only administered on one occasion. Consequently, it was
not possible to objectively determine early or late respondents objectively from a first or
second wave. Whilst the completed sample could have been chronologically split at a
given point in time, it is contended this arbitrarily split would only increase and not help
assess bias.
4.5.5. Measuring Brand Performance
The previous section of this chapter focused on the process for the service brand
identity scale development. This helped address this thesis’ second research question that
concerned uncovering service brand identity dimensionality. This section now considers
the endogenous variable of brand performance in two steps. The first section provides a
justification for employing subjective measures whilst the second outlines why a single
brand performance measure was used.

222
4.5.5.1.Justifying the Use of Subjective Brand Performance Measures
The literature review (Section 2.6.2) shared this thesis’ rationale for
conceptualising brand performance along financial, consumer and employee based
dimensions. However, within the literature performance is viewed from two perspectives
(Sin et al., 2005b). The first relates to objective measures. These are based on absolute
figures such as gross margin, total sales (Cronin and Page, 1988) or data from the PIMS
database (Chakravarthy, 1986). The second approach relates to subjective measures. These
are concerned with the participants’ view on a given measure vis-à-vis their organisation’s
competitors.
The marketing literature is replete with examples of subjective measure use. For
example, Golden (1992) measured market share relative to other providers whilst Lings
and Greenley (2005b) consider dependent variables such as employee and customer
satisfaction in the context of competitors. In addition to using objective (dollar market
share) data, Kohli and Jaworski’s (1993) seminal paper used judgemental measures
“which asked informants for their overall assessment of the business and its overall
performance relative to major competitors, rated on a 5-point scale ranging from “poor” to
excellent” (p. 60). Indeed, 41 of the 58 marketing orientation studies completed between
1990-2004 used only subjective performance measures (Cano et al., 2004). Numerous
other examples of subjective measures can be found in the marketing (Baker and Sinkula,
2005b; Greenley, 1995; Lings and Greenley, 2009; Matear et al., 2004; Reid, 2005),
human resource (Delaney and Huselid, 1996; Denison and Mishra, 1995; Harris and

223
Ogbonna, 2001; Ngo and Loi, 2008) and strategy (Pearce et al., 1987; Robinson and
Pearce, 1988) literatures.
However, subjective measures are not without issues. These include a susceptibility
to random error due to participants’ inability to remember figures or confusing accounting
periods which can result in a Type II error (false negatives). Furthermore, Type I errors
(false positives) may occur as a result of systematic bias (Wall et al., 2004) such as social
desirability bias (see Section 4.5.4.1 for how this issue was considered as part of the
methodology) which can result in artificially inflated responses (Cano et al., 2004). From
a more practical perspective, the literature notes how marketing and human resource
functional overlap should be greater at service brands (Gronroos, 1984; Heskett, 1987).
However, the reality may be that less well informed senior brand managers may not be in a
position to comment on human resource based issues. This presents a challenge to the use
of subjective employee based measures employed in this research.
Guided by the above, this thesis’ logic for using subjective measures is as follows.
First, previous literature highlights a close association between objective and subjective
performance measures (Bommer et al., 1995; Dess and Robinson, 1984; Guthrie, 2001;
Han et al., 1998; Pearce et al., 1987; Venkatraman and Ramanujam, 1986) with Wall et al.
(2004) concluding “[T]he relationships of the use of the management practices with
subjective performance are no greater than those with objective performance” (p. 111).
Second, the target sample for this research is the most senior marketing / brand manager.
Subjective measures are generally directed at such respondents who should have a good
knowledge of broader strategic issues (Wall et al., 2004). Third, some organisations may
not have (objective) financial, brand or employee based data widely available. Even if it is

224
available they may be reluctant to share it for commercial reasons (Dess and Robinson,
1984; Venkatraman and Ramanujam, 1986). Consequently, an estimate in relation to the
organisation’s main competitor can be considered the next best alternative. Fourth,
objective performance figures may not always be truly objective. Fraudulent or creative
accounting can result in tax being offset or assets depreciated at various rates to boost cash
flow in years of poor financial performance. Consequently, such data cannot be assumed
to be error free (Dess and Robinson, 1984; Wall et al., 2004). Fifth, subjective measures
have been noted in the literature as being of particular use with non economic dimensions
(Dess and Robinson, 1984) which in the case of this research relate to customer and
employee based measures. Sixth, survey participants prefer questions that ask for opinion
as opposed to fact (Greer et al., 2000). Seventh, subjective performance measures have the
benefit of being relative to a nearest competitor. This is important because it could be
argued a performance measure used in isolation has limited meaning (Coltman, 2007).
Finally, the use of subjective measures also finds support in non-academic research. For
example, Deloitte’s Marketing in 3D Benchmark has used industry level subjective
performance measures. Consequently, this research adopted a subjective approach for the
reasons outlined above.
In terms of wording the subjective brand performance items, previously used
subjective measures (Delaney and Huselid, 1996; Dess and Robinson, 1984; Matear et al.,
2004; Wall et al., 2004) were referred to for guidance. For each of the performance
measures, participants were asked (to rate on a seven point scale):

225
“On average, over the past three years, our organisation's performance in the
following areas has been significantly better than our main competitor (if it is hard
to recall, your best estimate is fine)”
Several points should be noted from this statement. First, a seven point scale was
employed to retain consistency with the service brand identity items. Second, the term ‘on
average’ (Baker, 2003; Dillman, 2000) was used in order to overcome the annual variation
and recall issues e.g. year one being notably better than years two and three. Third, the
earlier subjective performance literature tended to use a five year time frame with Dess and
Robinson’s (1984) research providing a illustrative example. However, given the fluid
nature of the IT services market, a five year window was regarded as too long. For
example, five years ago Orange would not have envisaged Virgin or Skype (on certain
mobile phones) as competitors. Consequently, consistent with more recent literature e.g.
Matear et al. (2004) a three year timeframe was used. Finally, given the difficulty
participants’ may have with this question, the caveat of “Your best estimate is fine” was
added to limit non response issues (Dillman, 2000).
4.5.5.2.Using a Summed Brand Performance Measure
The eight brand performance item scores were summed to provide an overall brand
performance measure. Whilst the literature highlights how it is preferable not to collapse
multi item scales (Iacobucci et al., 2007), summed scores were used to measure
performance for six reasons. First, from a psychometric perspective, several of the selected
brand performance dimensions were essentially headline summaries of other multi

226
dimensional multi item measures (as per Section 2.6.2 of the literature review). For
example, brand awareness consists of recognition and recall (Keller, 2003) whilst
reputation has been has been empirically validated as a multi dimensional construct (Walsh
and Beatty, 2007). By using indicators for each (third order) dimension the number of scale
items would become increasingly unparsimonious. Second, the development and validation
of a brand performance scale was considered beyond the scope of one PhD thesis. Third,
when alternative approaches to using the eight performance measures were used, such as
summing each dimension, levels of fit in the structural model were very poor. This was to
be expected give the performance items’ psychometric properties had not been assessed.
Fourth, culling items verbatim became increasingly unpractical when a subjective
approach was adopted. For example, employee satisfaction from Berson and Linton (2005)
included “Our employees feel our organisation is a greater place to work” or “Our
employees really like the type of work they do”. It is questionable whether respondents
would be able to answer such granular questions when phrased subjectively. Fifth,
Iacobucci et al.(2007) note how when conducting SEM research (albeit with more complex
models that incorporate mediating constructs) that obtaining multi item measures for the
dependent variable is less critical than for the exogenous or mediating variable (p.146).
Finally, as part of the scale development process dependent variables have been summed in
previously published studies (Walsh and Beatty, 2007). For these reasons a summed
measure was used.

227
4.5.6. Pretesting and Piloting the Survey
The previous sections of this chapter have outlined how Churchill’s (1979)
paradigm guided the development of service brand identity items. The steps involved with
finalising the survey design were also discussed. However, before the survey could be
considered final several pretests and a pilot were conducted (Baker, 2003; Converse and
Presser, 1986; Deng and Dart, 1994; Vasquez et al., 2002). The objective was to reduce the
systematic element of overall measurement error in the form of participants
misunderstanding a question. Such an approach aimed to calibrate the research instrument.
The pretest / pilot proceeded in four stages.
First, the survey was distributed to eight PhD candidates at Birmingham Business
School. This approach follows that of scholars such as Walsh and Beatty (2007). At this
stage, small presentation and typographical changes were made. Several colleagues noted
the idealistic nature of several client relationship items. For example, participants
questioned if brands can be dependable (Boon and Holmes, 1999), respect the customer
(Fournier, 1994) or whether clients do feel emotionally attached to brand (Roberts et al.,
2003). Concerns over survey length were also voiced during the second stage. Second, six
MBA students from the Business School who held senior marketing positions at IT service
organisations completed the survey. This group was selected as they held similar positions
to the target population (Clark and Watson, 1995). Four of the MBA students completed
the survey. Recommendations on some item wording, sector activities and a preference for
using year of birth (as opposed to age) were incorporated into the survey. Again, comments
regarding several relational items were made. In particular, concepts such as honesty and

228
trust were considered as something of an ideal given they were perceived as commercially
unrealistic. Two of the six participants agreed to participate in cognitive interviews
(Dillman, 2000) where participants read the questions out loud and verbalised their
feelings / thoughts. No issues materialised at this stage in terms of understanding the
questions. During the third stage, three senior managers (two Marketing Managers and one
Managing Director) at IT service companies the researcher knew also commented on the
survey. Follow up phone calls explored the relational items in addition to completion
times. Again, the realities of the commercial world indicated that such terms may be
considered naïve whilst survey length was a recurring issue. Given these issues,
relationship marketing-related items were removed from the scale. This left eight items
from Sin et al.’s (2005b) CRM scale. Figure 21 outlines the number of items, by
dimension, after the pilot stage.
0
20
40
60
80
100
120
140
No.
of I
tem
s
Marketing Culture 38 13 13
Corporate Visual Identity 19 13 13
Brand Personality 6 6 6
Customer RelationshipManagement
41 26 8
Integrated MarketingCommunications
15 10 10
Initial Item Pool Items after Expert Panel Items after Pretest/Pilot
Figure 21 Frequency Distribution of Scale Items by Dimension Before Expert Panel, after
Expert Panel and after Pretest / Pilot

229
The resultant 50 item scale reduced the survey to three pages which helped address
the recurring issue of survey length. At this stage the survey was considered as ready for a
small population pilot study (Dillman, 2000) which constituted the fourth stage of the
survey development process. A group of 50 participants were randomly selected from the
sampling frame, sent the survey by postal mail and removed from the main survey mailing.
The objective of this exercise was not to conduct statistical analysis but to obtain response
rate estimates and essentially ‘test run’ the survey process e.g. mail merge etc.
Furthermore, participants were purposefully selected from the sampling frame as, ideally,
they would have a similar profile to those contacted in the final survey (Nunally, 1978). Of
the twelve responses, ten were useful. One company was a retailer (inaccurate mailing list)
and one company had gone out of business. Hence, a 19% response rate was obtained. At
this stage the survey was considered final.
It should also be noted how the second and third stages of the pretesting followed
also helped with the selection of employee based measures. As highlighted in the literature
review chapter (Section 2.6.2) the majority of Ambler’s (2003) employee based equity
measures were rather abstract. However, two measures relating to relative employee
satisfaction and employee loyalty were discussed with executive MBA students at the
University of Birmingham’s Business School and senior executives working in the IT
services sector the researcher knows to assess their suitability (i.e. phases two and three of
the pretest). These discussions revealed most participants would be able to provide
estimates for these questions. Guided by these discussions and the view that employees
play a pivotal role in service brand delivery employee satisfaction and loyalty measures
were included as part of the overall brand performance measure.

230
4.5.7. Response Rate Enhancing Techniques
Due to inconsistent findings, several scholars (Bednar and Westphal, 2006; Roth
and BeVier, 1998) have called for the response rate enhancing literature to develop a
stronger theoretical orientation to direct subsequent research. Guided by this view,
Helgeson et al.’s (2002) Hierarchy of Effects Model provides a useful framework. In a
similar manner to Dillman’s (2000) Tailored Design Method, Helgeson et al.’s (2002)
model is grounded in Social Exchange Theory (Homans, 1958) with its tenets of reward,
cost and trust. The Theory of Reasoned Action (Fishbein and Ajzen, 1975) also underpins
Helgeson et al.’s (2002) model insofar respondents pass through a casual attitudinal to
behavioural survey-response decision making process. Stages of this process are attention,
intention, completion and return with each stage being subject to cost / benefit analysis by
the respondent.
Table 10 highlights how this research has drawn on Helgeson et al.’s (2002) model
to structure the response rate enhancing techniques employed and move respondents
through the decision making process.

231
Table 10 Application of Helgeson et al’s (2002) Mail Response Model
Attention
Intention
Completion
Return
University Affiliation (Bartholomew and Smith, 2006; Dillman, 2000; Jobber and O'Reilly, 1998; Larson and Poist, 2004; Schneider and Johnson, 1995).
Personalised letter (Dillman, 2000; Greer et al., 2000; Hair et al., 2006; Tomaskovic-Devey et al., 1994; Yammarino et al., 1991)
Salience of Research Topic (Baker, 2003; Cycyota and Harrison, 2006; Greer et al., 2000; Larson and Poist, 2004;
Roth and BeVier, 1998; Tomaskovic-Devey et al., 1994) Non Monetary Incentive (summary findings)
(Bednar and Westphal, 2006; Dillman, 2000; Jobber, 1986; Larson and Poist, 2004; Tomaskovic-Devey et al., 1994),
Confidentiality (Dennis, 2003; Dillman, 2000; Hair et al., 2006; Larson and Poist,
2004) Identification Number
(Claycomb et al., 2000; McKee, 1992; Roth and BeVier, 1998) Concise Questionnaire
(Bednar and Westphal, 2006; Greer et al., 2000; Yammarino et al., 1991)
Stamp addressed Envelope (Dillman, 2000; Greer et al., 2000; Jobber, 1986; Jobber and O'Reilly, 1998; Larson and Poist, 2004; Yammarino et al., 1991)
Stamp addressed Envelope (Dillman, 2000; Greer et al., 2000; Jobber, 1986; Jobber and O'Reilly, 1998; Larson and Poist, 2004; Yammarino et al., 1991)

232
The response rate enhancing literature frequently cites prenotification, monetary
incentives and a follow up mailing as being useful response rate enhancing techniques. The
reasons for not using these methods are discussed below.
Pre notification by mail (Cycyota and Harrison, 2002; Dillman, 2000; Roth and
BeVier, 1998; Yammarino et al., 1991) was not used due to inconsistent (Cycyota and
Harrison, 2006; Jobber and O'Reilly, 1998) or unfavourable (Dennis, 2003; Greer et al.,
2000; Larson and Poist, 2004) findings, budget constraints and the view that multiple
contact could become irritating. Prenotification by phone (Dillman, 2000; Jobber and
O'Reilly, 1998) to over 2000 marketing / brand executives was considered beyond the
practical and financial feasibility of doctoral research.
Whilst financial incentives have been found to increase response rates in business
samples (Fox et al., 1988; Jobber, 1986; Jobber and O'Reilly, 1998; Larson and Chow,
2003; Saunders et al., 2006; Yammarino et al., 1991) they were not used for three reasons.
First, financial incentives are not widely used in executive level research (Cycyota and
Harrison, 2006). Indeed, when used amongst executive samples positive (Bednar and
Westphal, 2006) and negative (Greer et al., 2000; Larson and Poist, 2004) response rate
effects indicate mixed results. Secondly, when conducting executive level research under
the auspices of a University, incentives can have a detrimental response rates effect.
Schneider and Johnson (1995) note insulting the participants’ generosity and the
perception that universities should not ‘stoop’ to offering financial incentives as reasons.
Third, the widely quoted US $1 bill equates to a ‘heavy’ 60 pence whilst the lowest paper
denomination of £5 in the UK was beyond the resources of this project.

233
Finally, a follow up mailing was carefully considered but not pursued. With the
exception of Dennis’ (2003) (small business owners) and Larson and Chow (2003)
(purchasing “professionals”), support for follow up mailing has been found in general
population / consumer employee (Church, 1993), consumer and employee (Fox et al.,
1988; Yammarino et al., 1991; Yu and Cooper, 1983), “industrial” (Roth and BeVier,
1998) or middle manager (Jobber, 1986; Jobber and O'Reilly, 1998) samples. However,
consistent with Larson and Poist’s (2004) work (transportation executives) and Greer et
al’s (2000) research (industrial Vice Presidents and CEOs), Cycyota and Harrison (2002,
2006) outlined how sending a follow up mailing to executive populations had a statistically
insignificant effect on response rates. Consequently, the most relevant and recent literature
questioned the value of this method. Indeed, Dillman (2000), who consistently advocates
follow up use, notes how one contact can actually have higher (23%) response rates than
two or more contacts (20%).
4.6. Quantitative Data Analysis
The previous sections of this chapter discussed the research design, sampling
procedures, scale development process and how the survey was finalised. This section of
the chapter outlines the quantitative data analysis techniques used. Before quantitative data
analysis began the completed sample (n=421) was randomly split using MS Excel’s
Random Generator into a calibration (n1=211) and validation (n2=210) sample (Anderson
and Gerbing, 1988; Churchill, 1979; Cudeck and Browne, 1983; Hair et al., 1998;
Iacobucci et al., 2007; MacCallum, 1995). The calibration sample was used to develop the

234
scale whilst the validation sample was used to verify the scale dimensionality and establish
its psychometric properties.
4.6.1. Reliability Analysis
Following Churchill (1979) the first quantitatively orientated step in the scale
development process involved assessing the internal consistency or reliability of subscales.
A scale is considered reliable when it gives similar or repeatable results in different
applications or with different samples (Netemeyer et al., 2003). Hence, the notions of
internal consistency (Field, 2005; Hair et al., 1998; Peter, 1979) or repeatability
(Netemeyer et al., 2003) are at the heart of a reliable scale.
Coefficient Alpha (Cronbach, 1951) is a widely used internal reliability measure
(Deng and Dart, 1994; DeVellis, 1991; Hair et al., 1998; Malhotra and Birks, 2006) with
Peter (1979) considering alpha the “most useful formula for assessing the reliability of
measures in marketing research” (p. 9). The alpha statistic assesses the extent to which the
items intended to measure a given construct are interrelated and whose variance is derived
from a common source (Netemeyer et al., 2003). Consequently, highly correlated items
suggest these items are measuring the same latent variable.
Robinson et al. (1991) advocate an alpha score of 0.8 for a new scale whilst
DeVellis (1991) considers 0.7-0.8 as respectable, 0.8-0.9 as very good whilst greater than
0.9 should result in the scale length being reduced. Clark and Watson (1995) concur with
Nunally (1978) who considers 0.7 as a minimum figure of acceptability with 0.8 and above

235
adding little to the scale’s reliability. Indeed, Churchill and Peter (1984) note how very
high levels of reliability adversely affect construct validity. This is consistent with
Loevinger’s (1954) ‘attenuation paradox’ where:
“..increasing the internal consistency of a test beyond a certain point will not
enhance its construct validity. One reason for this is that strongly intercorrelated
items are highly redundant. Once one of them is included in the scale, the
other(s) contribute virtually no incremental information.” (p. 316).
This point is of particular importance given calls in the literature from authors such
as Churchill (1979) to select items that maximise reliability (Gerbing and Anderson, 1988).
Consequently, in line with several of the above authors (Clark and Watson, 1995; Nunally,
1978) an alpha in the region of 0.7 was required for a subscale to be considered reliable.
4.6.2. Exploratory Factor Analysis
The next stage in the scale development process involved using exploratory factor
analysis to reveal early construct dimensionality. Exploratory factor analysis helps achieve
this by assessing the extent to which the scales’ items could be represented by a smaller
underlying group of items which are referred to as ‘factors’.
It is important to note how reliability estimates were deliberately obtained prior to
exploratory factor analysis. The reason being conducting factor analysis on a pool of
unreliable items results in a “garbage-in-garbage out” scenario and tends to result in

236
conceptually irrelevant dimensions being identified (Churchill, 1979). Consequently,
exploratory factor analysis built on initial reliability analyses and helped ‘pool’ items into
underlying factors. However, exploratory factor analysis can only suggest, not confirm,
dimensions (Churchill, 1979) whilst scale unidimensionality can only be established via
confirmatory factor analysis (Gerbing and Anderson, 1988).
4.6.3. Confirmatory Factor Analysis
Gerbing and Anderson (1988) widened the initial scale development paradigm
based on Cronbach’s α and exploratory factor analysis (e.g. Churchill, 1979) to include
confirmatory factor analysis. Confirmatory factor analysis differs from exploratory factor
analysis insofar that prior to statistical analysis a factor structure is specified (Anderson
and Gerbing, 1988; Floyd and Widaman, 1995) which should be grounded in theory
(Anderson and Gerbing, 1988).
4.6.3.1.Why Use SEM and Not OLS Regression?
From a construct dimensionality perspective it was necessary to employ
confirmatory factor analysis for several reasons. First, to verify (or refute) the postulated
construct dimensionality as indicated by exploratory factor analysis (Floyd and Widaman,
1995). Second, to establish each sub scale’s unidimensionality (Anderson and Gerbing,
1988; Gerbing and Anderson, 1988) which is a prerequisite for construct validity (Clark
and Watson, 1995; Gerbing and Anderson, 1988). Third, to trim redundant items
(DeVellis 1991; Floyd and Widaman 1995; Hair et al. 1998; Netemeyer et al. 2003; Shimp

237
and Sharma 1987). Fourth, to assess the scale’s psychometric properties in the form of
convergent / discriminant validity (Fornell and Larcker, 1981; Hair et al., 1998) and
composite reliability (Fornell and Larcker, 1981) and so forth. It would not be possible to
conduct these activities with regression.
To assess the influence of service brand identity on brand performance ordinary
least squares regression could have been used. However, regression was not used for four
reasons. First, ordinary least squares regression makes no allowance for measurement
(random and systematic) error (Baron and Kenny, 1986; Cheng, 2001) given it is
subsumed into the overall measurement term for each factor / construct (Baron and Kenny,
1986). However, structural equation modelling attenuates for measurement error by
including such an error term for each item whether it be a residual (indicator) or
disturbance (construct) term. Furthermore, by using multi item measures, structural
equation modelling results in higher levels of reliability (Iacobucci et al., 2007). Third, by
not summing each dimension, more consistent structural estimates between latent
constructs, that is service brand identity, and its dimensions can be obtained because
measurement error has been not been ignored (Jarvis et al., 2003). Finally, measuring each
item, as opposed to taking a single figure such as the mean or sum (as with regression)
results in more accurate population estimates due to smaller standard errors (Iacobucci et
al., 2007).

238
4.6.3.2.Formative and Reflective Indicators
Following Mackenzie et al.’s (2005) advice, before estimating the measurement
and structural models careful consideration was given to construct causality for two
reasons. First, model misspecification adversely affects fit indices such as χ2/df
(Diamantopolous et al., 2008) and RMSEA (Mackenzie et al., 2005). Second, model
misspecification can result in an overestimation of structural parameters (Jarvis et al.,
2003), or in some cases, significant parameter estimate being presented when this is not the
case had the model been formatively specified (Mackenzie et al., 2005). Consequently,
such misspecification can adversely affect the interpretation of structural model
relationships (Diamantopolous et al., 2008).
Guided by Jarvis et al.’s (2003) criteria for model development, the service brand
identity measurement and full structural model that incorporated brand performance were
estimated with reflective indicators for three reasons. First, service brand identity was
made ‘manifest’ via its postulated dimensions with these dimensions being made
‘observable’ via their respective indicators (Edwards and Bagozzi, 2000; Jarvis et al.,
2003). Hence, changes in the construct caused changes in the indicator and not vice versa
(Bollen, 1989). Second, the indicators for each construct shared a common theme in terms
of content (Jarvis et al., 2003). Third, covariation was theoretically expected at both second
and first order levels in the model. At the second order level, there were theoretical reasons
for expecting the dimensions to be positively correlated (please see Section 3.7.3 in the
Theoretical Framework chapter). At the first order level, there were also theoretical
grounds for expecting items to be positively correlated given they were sampled with the

239
intention of measuring the same construct. The analysis chapter outlines how these
theoretical grounds were empirically substantiated via dimension correlations (Section
5.3.2of the Analysis chapter) and satisfactory Cronbach α results (Section 5.3.1 of Analysis
chapter). Modelling service brand identity with formative indicators would only be
suitable if the dimensions / indicators were not correlated (Diamantopolous et al., 2008;
Diamantopoulos, 1999; Edwards and Bagozzi, 2000; Jarvis et al., 2003). Collectively,
these points provide logic for conceptualising brand identity as a reflective, not formative,
construct.
In a similar manner to service brand identity, brand performance was modelled as a
reflective measure for three reasons. First, an increase (decrease) in the performance score
was made manifest or reflected by an increase (decrease) in the summed performance
(which itself consisted of eight items). Second, conceptualising performance reflectively is
consistent with previous structural equation modelling applications such as Sin et al.’s
(2005b) CRM conceptualisation and scale development. Finally, all performance measures
expected to be positively and significantly correlated (Please see Appendix 4 which
supports this view).
4.6.3.3.Model Fit
With the formulation of the measurement and structure model considered, the a
priori service brand identity model was estimated and assessed for fit (cf: Hu and Bentler,
1999). In order to assess fit between the observed covariance data and implied
(theoretical) covariance data fit (Netemeyer et al., 2003) a series of indices exist. A
commonly used goodness of fit measure is the χ2 (chi square) statistic where smaller /
240
statistically insignificant rather than larger / statistically significant values indicate good fit
(Stapleton, 1997). However, the χ2’s susceptibility changes in sample size (Anderson and
Gerbing, 1988; Floyd and Widaman, 1995; Hair et al., 1998; Kelloway, 1998; Lei and
Lomax, 2005) has resulted in the development of other goodness of fit indices during the
1980s such as the Goodness of Fit Index (GFI) and Adjusted Goodness of Fit Index
(AGFI). Whilst such indices have been found to behave consistently across estimation
methods (La Du and Tanaka, 1989; Sugawara and MacCallum, 1993) GFI and AGFI have
received criticism for being susceptible to sample size increase (Anderson and Gerbing,
1984; Bollen, 1990; Hu and Bentler, 1995, 1998; La Du and Tanaka, 1989; Marsh et al.,
1988a; Netemeyer et al., 2003). Consequently, GFI and AGFI should not be relied on in
isolation when assessing fit (Netemeyer et al., 2003).
Steiger’s (1990) RMSEA (root-mean-square-error-of-approximation) has received
greater empirical attention in recent years. The reason being it aims to overcome χ2 sample
size vulnerability (Netemeyer et al., 2003). However, Chen et al. (2008) highlight how
model rejection rates, based on RMSEA (albeit using normal data) decrease as sample size
increases. Furthermore, whilst some scholars note stability of RMSEA across estimation
techniques (Sugawara and MacCallum, 1993) others outline how, when estimated via
Generalised Least Squares, RMSEA tends to provide more (biased) optimistic fit (Olsson
et al., 1999).
Comparative or incremental fit indices include the Comparative Fit Index (CFI),
Normed Fit Index (NFI), Non-Normed Fit Index (NNFI) / Tucker-Lewis Index (TLI) and
Incremental Fit Index (IFI). The IFI is regarded as being especially useful with non normal

241
data (Hoyle, 1995). Several scholars note that NNFI / TLI is particularly resilient to sample
size (Anderson and Gerbing, 1984; Bollen, 1990; Hu and Bentler, 1995, 1998; Marsh et al.,
1988b) whilst this tends not to be the case for NFI (Bearden et al., 1982; Hu and Bentler,
1998; La Du and Tanaka, 1989; Muller, 1996). Interestingly, Sugawara and MacCallum’s
(1993) research highlighted the erratic behaviour of comparative indices, in comparison to
absolute indices, across estimation methods (ADF, MLE, GLS and OLS) and their
tendency to inflate results vis-a-vis other estimations methods (cf: GLS and ADF).
Consequently, a spectrum of fit indices exist which, to varying extents, have certain
limitations. Guided by the above fit issues and the confirmatory factor analysis literature
(Anderson and Gerbing, 1988; Byrne, 2001; Chen et al., 2008; Fan and Sivo, 2005; Hair et
al., 1998; Kelloway, 1998; Markland, 2007; Mulaik, 2007; Steiger, 1990; Stevens, 1996)
several indices (with the exception of NFI) were used. The objective being to make an
informed decision about model fit based on a range of indices.
4.6.4. Validating the Measurement Model
4.6.4.1.Cross Validation of the Measurement Model
All prior statistical analyses were conducted on the calibration sample (n=211) to
develop the scale. To assess the stability of the scale, the measurement model was re-
estimated on the validation (N=210) and full samples (N=421) with a range of fit indices
being used to assess model fit (Hu and Bentler, 1999).

242
4.6.4.2.Construct Validity
Churchill (1979) notes how Cronbach’s Alpha and exploratory factor analysis
produce an internally consistent or internally homogenous set of items (p. 70). However,
this approach does not take into account the external psychometric scale properties in the
form of construct validity. Reliability is necessary, but not alone sufficient in terms of
indicating construct validity (Churchill, 1979; Clark and Watson, 1995; DeVellis, 1991;
Netemeyer et al., 2003; Nunally, 1978; Peter, 1979, 1981). Following Peter (1981),
Netemeyer et al (2003: 8) note construct validity “is an assessment of the degree to which a
measure actually measures the latent construct it is intended to measure.” In this sense, the
measurement scale ‘behaves’ in the way it is expected to with respect to the construct it is
measuring (DeVellis, 1991).
Content, face, convergent, discriminant, criterion and nomological validity are the
most widely accepted forms of construct reliability (Hair et al., 1998; Peter, 1981).
Hardesty and Bearden (2004) note how face and content validity are frequently (and
incorrectly) used interchangeably with Hair et al. (1998: 117) and Ping (2004:130)
illustrating this point. Content validity is concerned with how adequately a latent
variable’s items ‘sample’ the construct’s domain (Haynes et al., 1995). Hardesty and
Bearden (2004) use the analogy of a dart board having darts only in one half as not having
content validity. Face validity relates to the items being relevant to the measured construct
(Hardesty and Bearden, 2004). Using Hardesty and Bearden’s (2004) dart board analogy,
face validity is represented by a dart hitting the board. If the dart does not hit the board, the
item does not represent the intended construct. Convergent validity refers to the degree of
agreement or ‘convergence’ between two or more measures of the same construct

243
(Churchill 1979; Netemeyer et al. 2003; Sin et al. 2005). Discriminant validity is
concerned with the extent conceptually distinct constructs do actually differ (Hair et al.,
1998) or as Peter (1981: 136) states “discriminant validity is determined by demonstrating
that a measure does not correlate very highly with another measure from which it should
differ”. Criterion validity relates to how well the new measure correlates with a pre-
existing measure (Haynes et al., 1995). Nomological validity is concerned with the scale’s
ability to behave as expected with regards to other constructs it is theoretically related to
(Campbell, 1960; Netemeyer et al., 2003). Cronbach and Meehl (1955) referred to this as
the model’s ‘nomological network’.
4.7. Conclusions
This chapter has outlined the methodology used to collect data so the domain of
service brand identity and the construct’s influence on brand performance could be
established. The first section of the chapter provided an overview of the predominantly
quantitative research design. The second outlined the sampling procedures that were
employed. This was followed by an overview of the process followed to develop the
service brand identity measure that was principally guided by Churchill’s (1979)
paradigm. The fourth section discussed how the survey was iteratively developed and
finalised. This involved considering issues such as survey structure, question format, bias,
the rationale for using subjective measures in addition to conducting several pretests and
one pilot. The quantitative analyses used to analyses the data were then considered in the
chapter’s penultimate section. This related to the use of Cronbach’s α and exploratory
factor analysis to purify the measure whilst confirmatory factor analysis was employed to

244
verify the factor structure, assess unidimensionality and evaluate the scale’s psychometric
properties. With the data collection complete it was possible to analyse the data.

245
5. ANALYSIS
5.1. Introduction
Building on the literature review, the theoretical framework chapter postulated a
preliminary service brand identity comprising of five dimensions. These were marketing
culture, brand personality, integrated marketing communications, corporate visual identity
systems and client relationship management. The positive influence of service brand
identity on brand performance was also hypothesised. The methodology chapter then
outlined how data was collected in order to test the preliminary framework and service
brand identity-brand performance hypothesis. This chapter analyses the data gathered
during the methodology enabling this thesis move towards answering its research
questions. Noticeably, to understand service brand identity dimensionality and the
influence this construct has on brand performance.
The chapter consists of four sections. The first explores the raw data via descriptive
statistics, missing value analysis and a normality test. Guided by the scaling literature
(Anderson and Gerbing, 1988; Churchill, 1979; DeVellis, 1991; Netemeyer et al., 2003)
the second section uses a calibration sample to develop the scale. Using a validation
sample, the third section uses confirmatory factor analysis to verify the scale’s
dimensionality and assess its psychometric properties. The final section of the chapter
applies the scale to assess service brand identity’s influence on brand performance.
Concluding remarks reiterate the multidimensional nature of service brand identity and the
positive influence the construct has on brand performance.

246
5.2. Exploring the Data
Initially the data was explored graphically (histograms and box plots), via
frequency distributions and descriptive statistics (mean, variance, kurtosis and skew). This
helped familiarise the researcher with the data, provide early normality indications, check
for data entry errors e.g. values outside scale limits, identify outliers and so forth.
5.2.1. Descriptive Statistics
As part of the data collection a range of descriptive statistics were obtained. Please
see Table 11 to Table 18 for details. From an organisational perspective, the sample were
predominantly involved in IT consultancy (23%), were less than ten years’ old (53%)
whilst approximately 85% of the organisations were SMEs i.e. 249 or less employees
(European Commission, 2005). In terms of the respondents, approximately 38% had at
least 11 years’ marketing experience, were predominantly male (76%) and held the
position of Marketing Director / VP level or above (80%). Hence, overall, the sample
tended to consist largely of male senior executives at small and relatively young
organisations. Please see Table 11 to Table 18 for descriptive data details.

247
Table 11 Main Activity within IT Services Sector
Activity N % IT Consultancy 97 23.0 Software Development 88 20.9 Other 71 16.9 Technical Support 48 11.4 IT Managed Services e.g. data centers
39 9.3
Networking 37 8.8 Infrastructure Management 32 7.6 Security 8 1.9 Total 420 99.8 Missing 1 .2 Total 421 100.0
Table 12 Organisational Age
Age Category (years) Frequency Percent
1-10 223 53.0 11-20 123 29.2 21-30 44 10.5 31+ 11 2.6
Total 401 95.2
Missing 20 4.8
Total 421 100.0
N=401, Min=1, Max=150, Mean=13.15, SD=12.11.

248
Table 13 Number of Employees at Respondent’s Organisation
Number of Employees Frequency Percent
1-5 143 34.0 6-49 155 36.8
50-249 58 13.8 250 or more 27 6.4
Total 383 91.0
Missing 38 9.0
Total 421 100.0
N=383, min=1, max=4200, mean=277+, SD=2297.8 + This figure should be treated with caution given the small number of very large
organisations that bias the mean and inflate the standard deviation (Field, 2005). These
data were not removed as they were considered valid and the researcher did not wish to
adversely affect sample generalisability to the population (Hair et al., 1998)
Table 14 Respondents’ Marketing Experience (Number of Years)
Number of Years Marketing
Experience Frequency Percent
0 30 7.1 1-10 140 33.3 11-20 118 28.0 21-30 33 7.8 31+ 8 1.9
Total 329 78.1
Missing 92 21.9
Total 421 100.0
N=329, Min=0, Max=40, Mean 12.32, SD=8.35

249
Table 15 Respondents’ Position in the Organisation
Position Frequency Percent
CEO/MD 263 62.5 Marketing Director / VP 73 17.3 Marketing Manager 40 9.5 Other 45 10.7 Total 421 100.0
Table 16 Gender of Respondents
Gender Frequency Percent
Male 319 75.8 Female 89 21.1 Total 408 96.9
Missing 13 3.1
Total 421 100.0
Table 17 Respondents’ Age (Years)
Age Category Frequency Percent
20-30 22 5.2 31-40 103 24.5 41-50 153 36.3 51-60 102 24.2 61+ 19 4.5
Total 399 94.8
Missing 22 5.2
Total 421 100.0
N=399, min=23, max=71, mean=45, SD=9.60

250
Table 18 Respondents’ Highest Educational Level.
Educational Qualification Frequency Percent
A-Level / Post GSCSE e.g. BTEC 111 26.4 Undergraduate Degree 126 29.9 Postgraduate Degree (MBE, PhD etc) 81 19.2 Professional Qualification 62 14.7 Other 21 5.0 None 5 1.2 Total 406 96.4
Missing 15 3.6
Total 421 100.0
5.2.2. Missing Value Analysis
Overall, missing data for scale-related items was not regarded a critical issue given
their low percentage. The reason being any given question or item had fewer than 10%
missing values (Roth and Switzer, 1995). Please see Appendix 5 for missing values by
item and question. However, the logic for calculating missing values using the expectation
maximisation algorithm (EM) (Dempster et al., 1977) was four fold. First, the
measurement model could not be estimated (using MLE, GLS, ADF, UWLS) or
bootstrapped samples obtained if data were missing. Second, missing values reduce
statistical inference power and adversely affect the accuracy of estimation due to an
increase in variance (Fichman and Cummings, 2003; Roth and Switzer, 1995). Third, other
missing value remedies such as listwise deletion, mean imputation or regression require the
data to be missing completely at random (MCAR) (Hair et al., 1998: 51). Data is MCAR
when any variable observation is equally likely to missing. Little’s MCAR test revealed the
data was not MCAR given p=0.00 which was less than the required 0.05 (Little, 1998).
However, expectation maximisation does not require MCAR data (Little and Rubin, 1987).

251
Even if the data was MCAR, such remedies create numerous issues. For example,
substituting missing values with the mean distorts the actual distribution of real values with
the imputed mean values (Hair et al., 1998) in addition to biasing standard errors (Howell,
2008). Regression estimates are unconstrained and so a 7 point scale may have a regressed
value of 8 (Anderson and Gerbing, 1988; Churchill, 1979; Hair et al., 1998). Descriptive
statistics on the EM-based data set revealed all values fell in the Likert scale range.
Furthermore, if all cases were deleted listwise, the sample size at N=176 became perilously
small for confirmatory factor analysis (structural equation modelling sample size issues are
discussed later in this chapter). Fourth, EM provides several distinct benefits such as being
particularly suitable for non normal data whilst providing mean variance and covariance
estimates with very low levels of bias (Brown, 1994). Finally, post EM data analysis
revealed the influence of the method had, at most, had marginal affect on the data
(Appendix 6) and so indicated that missing values did not constitute a major data issue.
Consequently, all subsequent analysis was conducted on a complete data set once the
expectation maximisation algorithm had been used.
5.2.3. Non Response Bias
As discussed in the previous chapter (Section 4.5.4.3) late response bias was not
calculated. The reason being only one wave of mailing was conducted and so any split in
the received questionnaires would have been purely arbitrary.

252
5.2.4. Testing Assumptions of Parametric Data
Field (2005) outlines how statistical techniques such as exploratory and
confirmatory factor analysis are based on parametric data. Three tests were conducted on
the brand identity related items to check parametric data assumptions.
5.2.4.1.Normally Distributed Data
The normality assumption for each brand identity item was tested via inspection of
histograms in addition to the Kolmogorov-Smirnov (K-S) and Shapiro-Wilk (S-W) tests.
Given that a histogram is quite subjective the latter two tests were regarded as necessary.
The Shapiro-Wilk test was also employed as a cross check for two reasons. First it is less
susceptible to providing significant results than the Kolmogorov-Smirnov test and so is
considered more accurate (Field, 2005). Second, the K-S test is regarded as a less powerful
normality test than the S-W test (Barnes, 2001). As Table 19 outlines all items, for both
tests, were significant i.e. p<0.000. This indicates the scale items were not normally
distributed. This data was consistent with the Normal Q-Q plots for all 50 items where the
actual (observed) values did not follow the straight line, that is expected (normal) values
(Hair et al., 1998).

253
Table 19 Assessment of Data Normality using Kolmogorov-Smirnov (K-S)
Kolmogorov-Smirnov Shapiro-Wilk Statistic df Sig. Statistic df Sig. Item 1 0.240 421 0.000 0.881 421 0.000 Item 2 0.331 421 0.000 0.629 421 0.000 Item 3 0.219 421 0.000 0.865 421 0.000 Item 4 0.273 421 0.000 0.797 421 0.000 Item 5 0.216 421 0.000 0.867 421 0.000 Item 7 0.200 421 0.000 0.893 421 0.000 Item 10 0.226 421 0.000 0.791 421 0.000 Item 13 0.258 421 0.000 0.746 421 0.000 Item 14 0.256 421 0.000 0.754 421 0.000 Item 15 0.197 421 0.000 0.878 421 0.000 Item 28 0.192 421 0.000 0.870 421 0.000 Item 34 0.225 421 0.000 0.845 421 0.000 Item 35 0.286 421 0.000 0.679 421 0.000 Item 39 0.313 421 0.000 0.769 421 0.000 Item 40 0.221 421 0.000 0.810 421 0.000 Item 41 0.132 421 0.000 0.946 421 0.000 Item 42 0.203 421 0.000 0.915 421 0.000 Item 44 0.147 421 0.000 0.945 421 0.000 Item 45 0.219 421 0.000 0.906 421 0.000 Item 46 0.185 421 0.000 0.936 421 0.000 Item 47 0.226 421 0.000 0.840 421 0.000 Item 49 0.220 421 0.000 0.807 421 0.000 Item 51 0.228 421 0.000 0.788 421 0.000 Item 53 0.184 421 0.000 0.910 421 0.000 Item 55 0.211 421 0.000 0.871 421 0.000 Item 57 0.202 421 0.000 0.902 421 0.000 Item 58 0.201 421 0.000 0.910 421 0.000 Item 59 0.180 421 0.000 0.888 421 0.000 Item 60 0.177 421 0.000 0.926 421 0.000 Item 61 0.173 421 0.000 0.915 421 0.000 Item 62 0.165 421 0.000 0.931 421 0.000

254
Kolmogorov-Smirnov Shapiro-Wilk Statistic df Sig. Statistic df Sig. Item 63 0.166 421 0.000 0.926 421 0.000 Item 91 0.260 421 0.000 0.700 421 0.000 Item 93 0.190 421 0.000 0.900 421 0.000 Item 94 0.209 421 0.000 0.860 421 0.000 Item 97 0.234 421 0.000 0.800 421 0.000 Item 98 0.235 421 0.000 0.832 421 0.000 Item 99 0.234 421 0.000 0.859 421 0.000 Item 101 0.237 421 0.000 0.833 421 0.000 Item 102 0.245 421 0.000 0.787 421 0.000 Item 106 0.206 421 0.000 0.884 421 0.000 Item 107 0.194 421 0.000 0.890 421 0.000 Item 108 0.179 421 0.000 0.939 421 0.000 Item 109 0.123 421 0.000 0.946 421 0.000 Item 110 0.206 421 0.000 0.933 421 0.000 Item 112 0.195 421 0.000 0.922 421 0.000 Item 114 0.182 421 0.000 0.914 421 0.000 Item 117 0.216 421 0.000 0.866 421 0.000 Item 118 0.171 421 0.000 0.900 421 0.000 Item 119 0.203 421 0.000 0.905 421 0.000
Although the scale items did not follow a normal distribution several points should
be noted. Primarily, numerous authors (Clason and Dormody, 1994; Malthouse, 2001;
Nunally, 1978) outline how it is unusual for Likert scales to follow a normal distribution.
Furthermore, scholars such as Browne (1984), Bentler and Yuan (1999) note “real data sets
in practice seldom follow normal distributions” (p. 184) whilst Cudeck (2001) states
“Virtually no variable follows a normal distribution” (p. 80). Additionally, it is not
uncommon to obtain significant results in large samples when only small normality
deviations exist (Cudeck, 2001; Field, 2005). The current sample is 421 with Hair et al
(1998:23) considering samples in excess of 200 as ‘large’. Finally, both exploratory factor

255
analysis and confirmatory factor analysis, in practice, are relatively robust against
violations of normality (Gorsuch, 1983).
5.2.4.2.Interval Data
The Methodology Chapter (Section 4.5.3) highlighted that whilst, strictly speaking,
a Likert scale is ordinal, interval based statistical techniques such as exploratory and
confirmatory factor analysis can be applied to Likert scale data (Clark and Watson, 1995;
DeVellis, 1991). Indeed, Kennedy et al.’s (1996) empirical research demonstrated the
psychological distances on a Likert scale are not equal but very close. Hence, consistent
with number marketing scholars (Aaker et al., 2004a; Hair et al., 2006) the scale was
assumed to be interval.
5.2.4.3.Independence
One respondent per organisation was contacted. Hence, all responses were
considered independent.
5.3. Developing the Service Brand Identity Scale
The previous section of this chapter outlined how the raw data was explored,
missing values were managed and parametric data assumptions considered. Before scale
development began the completed sample (n=421) was randomly split using MS Excel’s
Random Generator into a calibration (n1=211) and validation (n2=210) samples (Anderson
and Gerbing, 1988; Churchill, 1979; Cudeck and Browne, 1983; Hair et al., 1998;

256
Iacobucci et al., 2007; MacCallum, 1995). The calibration sample used Cronbach’s α,
exploratory and confirmatory factor analyses to develop the scale whilst the validation
sample was used to verify the scale and establish its psychometric properties.
5.3.1. Reliability Analysis
The first scale development step involved calculating item to total correlations and
coefficient alpha (Churchill, 1979). This analysis was conducted for each of the five
subscales with the objective being to purify the measure by removing ‘garbage’ items.
Items with a correlation of lower than 0.3 on the hypothesised factor were candidates for
deletion (Hair et al., 1998; Nunally, 1978). The more stringent criteria of 0.5 employed by
scholars such as Netemeyer et al (1996) was not used at such an early stage in the process.
The reason being it was preferable to retain items and remove them at subsequent stages if
they consistently had an adverse affect on the scale’s psychometric properties. Table 20,
Table 21, Table 22, Table 23 and Table 24 show the subscale item analysis for marketing
culture, corporate visual identity systems, brand personality, client relationship
management and integrated marketing communications respectively. Coefficient alpha
figures are also included to provide early reliability estimates.

257
Table 20 Marketing Culture – Item Analysis
Scale Mean if Item Deleted
Scale Variance if Item Deleted
Corrected Item-Total Correlation
Cronbach's Alpha if Item Deleted
Item 1 25.72 84.07 0.35 0.90 Item 2 27.22 84.06 0.66 0.88 Item 3 26.24 80.60 0.55 0.88 Item 4 26.78 83.85 0.64 0.88 Item 5 26.32 81.09 0.61 0.88 Item 7 26.24 83.07 0.59 0.88 Item 10 26.81 84.21 0.60 0.88 Item 13 26.89 80.67 0.69 0.88 Item 14 26.94 80.81 0.77 0.87 Item 15 26.09 80.18 0.56 0.88 Item 28 26.34 85.19 0.52 0.88 Item 34 26.63 83.13 0.60 0.88 Item 35 27.11 83.84 0.67 0.88 Cronbach’s α for marketing culture = 0.889
Table 21 Corporate Visual Identity Systems- Item Analysis
Scale Mean if Item Deleted
Scale Variance if Item Deleted
Corrected Item-Total Correlation
Cronbach's Alpha if Item Deleted
Item 39 33.51 111.22 0.36 0.88 Item 40 33.03 98.055 0.75 0.86 Item 41 31.13 105.98 0.31 0.89 Item 42 32.21 103.99 0.50 0.88 Item 44 31.65 96.117 0.61 0.87 Item 45 32.35 104.77 0.49 0.88 Item 46 31.94 99.88 0.62 0.87 Item 47 32.75 97.82 0.65 0.87 Item 49 32.92 103.55 0.54 0.87 Item 51 33.03 101.18 0.64 0.87 Item 53 32.22 96.97 0.60 0.87 Item 55 32.59 95.91 0.80 0.86 Item 57 32.45 101.22 0.61 0.87
Corporate visual identity systems Cronbach’s α= 0.882

258
Table 22 Brand Personality– Item Analysis Scale Mean if
Item Deleted Scale Variance if
Item Deleted Corrected Item-
Total Correlation Cronbach's Alpha if
Item Deleted Item 58 14.74 17.476 0.75 0.76 Item 59 14.99 18.982 0.71 0.78 Item 60 14.55 20.460 0.44 0.83 Item 61 14.80 19.248 0.60 0.80 Item 62 14.50 19.439 0.57 0.80 Item 63 14.48 18.851 0.52 0.82 Brand personality Cronbach’s α = 0.825
Table 23 Client Relationship Management – Item Analysis Scale Mean if
Item Deleted Scale Variance if
Item Deleted Corrected Item-
Total Correlation Cronbach’s Alpha if
Item Deleted Item 91 15.55 26.613 0.63 0.80 Item 93 14.55 26.170 0.43 0.83 Item 94 14.83 26.822 0.47 0.82 Item 97 15.40 26.685 0.60 0.80 Item 98 15.14 25.034 0.69 0.79 Item 99 15.06 27.053 0.44 0.82 Item 101 14.96 23.812 0.64 0.80 Item 102 15.23 25.068 0.59 0.80 Client relationship management Cronbach’s α = 0.828

259
Table 24 Integrated Marketing Communications – Item Analysis Scale Mean if
Item Deleted Scale Variance if
Item Deleted Corrected Item-
Total Correlation Cronbach's Alpha if
Item Deleted Item 106 27.72 72.90 0.41 0.87 Item 107 27.60 71.13 0.51 0.86 Item 108 26.97 68.08 0.65 0.85 Item 109 26.25 68.05 0.49 0.86 Item 110 27.05 67.39 0.62 0.85 Item 112 27.39 69.72 0.61 0.85 Item 114 27.23 68.48 0.49 0.86 Item 117 27.65 69.81 0.69 0.85 Item 118 27.53 68.10 0.69 0.85 Item 119 27.43 66.23 0.74 0.84 Integrated marketing communications Cronbach’s α = 0.866
Based on the above decision rule no items were removed. Early scale reliability
estimates were, on one hand, encouraging given they exceeded 0.7 (Clark and Watson,
1995; Nunally, 1978). However, the marketing culture subscale (α=0.889) was perilously
close to exceeding 0.9 (DeVellis, 1991; Netemeyer et al., 2003). This potentially indicated
a level of item redundancy within this subscale cf: attenuation paradox (Loevinger, 1954).
5.3.2. Exploratory Factor Analysis
Cronbach’s alpha was intended to remove ‘garbage’ items which displayed low
levels of internal reliability (Churchill, 1979). Next, exploratory factor analysis was used to
obtain early construct dimensionality estimates.

260
Before exploratory factor analysis could be conducted the suitability of the sample
size was considered. The literature provides varied exploratory factor analysis sample size
guidance. Some scholars advocate sample sizes of 300 (Kass and Tinsley, 1979;
Tabachnick and Fidell, 2001) or 200 (Gorsuch, 1983; Hoelter, 1983). Nunally (1978)
recommends having a participant to items ratio of 10:1, Hair et al (1998) consider a
minimum ratio of 5:1 whilst Kass and Tinsely (1979) consider between five to ten items
per respondent up to 300 as appropriate . Hence, with 50 items and a sample size of 211
the data set was considered on the whole suitable for exploratory factor analysis. This
decision that was corroborated by subsequent exploratory factor analysis tests.
First, an R-Matrix was produced (Appendix 7) to identify items with consistently
high (multicollinearity) or low (singularity) correlations. Spearman’s correlation
coefficient was used due to the non normal nature of the data. Inspection of the correlation
matrix revealed items 1 (marketing culture), 41 (corporate visual identity), 46 (corporate
visual identity) 109 (client relationship management) had consistently low, that is, less than
0.2 (Davies et al., 2004; Floyd and Widaman, 1995; Walsh and Beatty, 2007) and
insignificant correlations with a large number of other items (more than fifteen). Given the
high reliability estimates obtained these items were removed from subsequent analysis. No
items had a correlation in excess of 0.9 (Davies et al., 2004; Field, 2005) and so
multicollinearity was not considered an issue. The literature advocates using the R-Matrix
Determinant to assess multicollinearity or singularity (Field, 2005). However, this statistic
was not used given SPSS V16.0.1 exploratory factor analysis correlation output is based on
Pearson’s correlation coefficient which assumes parametric data.

261
Second, the suitability of the dataset for exploratory factor analysis was assessed by
running Bartlett’s Test of Sphericity and the calculating the Kaiser-Meyer-Olkin (KMO)
statistic on the 50 items. Bartlett’s Test of Sphericity provided a significant χ2 value of
6248.8 (p<0.000, df=1035). The KMO for the overall data set provided gave a result of
0.908 which can be regarded as ‘meritorious’ (Kaiser, 1960) or ‘superb’ (Hutcheson and
Sofroniou, 1999). This indicated item correlations were compact and so factor analysis
should produce distinct and reliable factors. As an additional check, the anti-image
correlation matrix was analysed to assess individual items’ sampling adequacy. All
diagonals exceeded the required 0.5 (Field, 2005). Inspection of the off diagonals revealed
the vast majority of item correlations were below 0.1 which again indicated the suitability
of the data for exploratory factor analysis. Consequently, both the KMO and Barlett test
indicated the suitability of the data for exploratory factor analysis.
Once the suitability of the data set for factor analysis had been determined (via
correlation matrix and the above two tests) the third step involved selecting the most
suitable factorial method. Two main types of factor analysis exist. These are Principal
Components Analysis (PCA) or Common Factor Analysis. PCA is mainly concerned with
data reduction (Floyd and Widaman, 1995; Netemeyer et al., 2003). Common factor
analysis methods, such as principal axis factoring, unweighted least squares or maximum
likihood, is more concerned with uncovering construct dimensionality (Conway and
Huffcutt, 2003; Costello and Osborne, 2005; Floyd and Widaman, 1995). The use of
common factor analysis is advocated in the scaling literature because it only analyses
shared (common) variance and not unique variance (Conway and Huffcutt, 2003; Floyd
and Widaman, 1995; Hair et al., 1998; Netemeyer et al., 2003). However, common factor-
based results were not used for two reasons. First, several factors contained fewer items

262
than subsequent factors (unweighted least squares, generalised least squares, maximum
likelihood and principal axis factoring). Second, several theoretically uninterpretable factor
structures were presented in the form of cross loading items. The PAF findings were of
particular note given the literature’s support for this method with non normal data
(Costello and Osborne, 2005; Fabrigar et al., 1999). Consequently, for these reasons, the
calibration sample was subject to principal components analysis.
The factors were then rotated to improve factor structure interpretability (Floyd and
Widaman, 1995; Netemeyer et al., 2003; Stevens, 1992). Initially, oblique (PROMAX and
Direct Oblimin) rotations were conduced with factor loadings of 0.4 (Hair et al., 1998;
Stevens, 1992), 0.5 (Bearden et al., 2001) and 0.67 (Shimp and Sharma, 1987) i.e. √0.4.
These were regarded appropriate factor loadings given the comparable sample sizes of
these authors work with this research. Furthermore, examining multiple factor solutions is
encouraged in the literature at the ‘exploratory’ factor analysis stage (Hair et al., 1998).
Informed by theses analyses, an oblique rotational method (PROMAX) with factor
loadings >0.67 gave the preferred solution, that is, the most interpretable factor structure.
This decision was guided by several theoretical and practical rationale. First, unlike
orthogonal methods such as VARIMAX, oblique methods such as PROMAX allow factors
to correlate (Floyd and Widaman, 1995; Gorsuch, 1983). Indeed, Gerbing and Anderson
(1988) advocate the use of oblique methods “ because it more accurately reflects the
underlying structure of the data than that provided by the more restrictive orthogonal
solution” (p. 189). As noted in the theoretical framework chapter, interactions may exist
between the postulated dimensions (Section 3.7.3). This provides theoretically grounded
logic for using oblique rotation (Field, 2005). Second, orthogonal methods may not suit

263
confirmatory factor analysis as forcing zero correlation may result in model
unidentification (Kelloway, 1998; Netemeyer et al., 2003). Third, several scholars
(Conway and Huffcutt, 2003; Costello and Osborne, 2005; Hair et al., 1998) contend
orthogonal rotation forces unrealistic solutions as it is unlikely factors will not correlate.
Finally, consistent with Conway and Huffcutt (2003) oblique rotation gave the most
interpretable solution.
From a practical perspective, Direct Oblimin was not used for two reasons. First,
factors with a smaller number of items were not always found towards the end of the
rotated matrix (all factor loading levels). Second, the final factors contained only two or
one item(s) at factor loadings of 0.5 and 0.67 respectively which may result in a single item
scale after confirmatory factor analysis. Conversely, PROMAX (at factor loading of 0.67)
contained three items. This approach is consistent with Ding et al. (1995) who advocate the
final factor should have no fewer than three items because this increases the chances of
obtaining infeasible solutions whilst Hair et al. (1998) note reliability estimates can only be
obtained if the latent variable has two or more indicators.
Multiple decision rules were used to identify underlying factors (Conway and
Huffcutt, 2003; Ford et al., 1986). First, factors needed eigenvalues greater than 1 (Kaiser,
1960). This rule was suitable given the number of items was not less than 50 (Hair et al.,
1998). However, this criterion was not used in isolation given it tends to produce too many
factors (Gorsuch, 1997). Second single items factors were eliminated given the need to
develop multi item measures (DeVellis, 1991; Netemeyer et al., 2003). Third, the number
of factors extracted should account for 50%-60% of the variance explained (Hair et al.,

264
1998; Streiner, 1994). A scree plot was not used because, as Figure 22 indicates the
number of large factors made interpretation too subjective (Netemeyer et al., 2003).
Figure 22 Scree Plot for Exploratory Factor Analysis
From the initial pool of 50 items the resulting exploratory factor analysis produced
a nine factor solution accounting for 66.9% of the variance. However, the final four factors
were represented by single items. Consequently, a five factor, 20 item solution was
selected which accounted for 56.2% of the variance (Table 25).

265
Table 25 Exploratory Factor Analysis Factor Loadings, Eigen Values, Variance Extracted and Cronbach’s Alpha (Calibration Sample, n=211)
Factor Loadings
E&CF CVI BP CC HRI Communalities
IT 97. Our employees will help clients in a responsive manner 0.85 0.68
IT 91. Our organisation makes an effort to discover our clients' needs 0.82 0.67
IT 35. Our organisation responds to our clients' needs 0.82 0.69
IT 2. Our top management is committed to providing quality service 0.81 0.74
IT 10. Our employees as essential part of organisation 0.79 0.67
IT 4. Our employees focus on clients' needs, desires and attitudes 0.75 0.73
IT 98. CRM -Our organisation fully understands the needs of our key clients by learning from them 0.69 0.75
IT 14. Our organisation places an emphasis on hiring the right people 0.68 0.71
IT 53. The font we use is an important part of our visual identity 0.96 0.69
IT 47. Our logo is an important part of who we are 0.80 0.73
IT 55. The corporate visual identity is helpful in making our organisation recognisable 0.79 0.77
IT 61. The associations making up our brand personality are extremely positive. 0.84 0.68
IT 62. Our clients have no difficulty describing our brand personality 0.79 0.56
IT 59. Our brand personality has favourable associations 0.79 0.68 IT 107. The people managing the communications program for our organisation have a good understanding of the strengths and weaknesses of all major marketing communications tools 0.81 0.70
IT 118. Our organisation's advertising, PR and sales promotion all present the same clear consistent message to our stakeholder 0.76 0.71
IT 94. Our organisation has established clear business goals related to client relationship management 0.72 0.62 IT 93. Our employee training programs are designed to develop skills required for acquiring and deepening client relationships 0.88 0.71
IT 15. Our organisation provides skill based training to front-line employees 0.84 0.76
IT 3. Our organisation regularly monitors employees' performance 0.80 0.68
Eigen Value 14.44 4.92 2.02 1.96 1.53 % of Variance 33.57% 10.69% 4.39% 4.2% 3.33% Cronbach’s α 0.91* 0.78* 0.78* 0.75* 0.81* Extraction Method: Principal Component Analysis. Rotation Method: Promax with Kaiser Normalization. *no item to total correlations <0.3.

266
As Table 25 indicates, items from both marketing culture and client relationship
management loaded onto Factor 1. This was labelled employee and client focus (E&CF) given
the salience of these stakeholders. This factor had a very high alpha (α=0.91) which indicated
potential item redundancy. However, at this stage such a high alpha may be a function of (sub)
scale length (Netemeyer et al., 2003) as opposed to item quality per se. Factor 2 only contained
items from the corporate visual identity systems literature. It was labelled corporate visual
identity (CVI) and not corporate visual identity systems given the latter is reflected by more than
three items (Dowling, 1994; Melewar and Saunders, 1998; 2000; Olins, 1986; Simoes et al.,
2005; Topalian, 1984; Van den Bosch et al., 2005, 2006a). Factor 3 contained items from only
the brand personality literature and so was labelled BP. Items from both integrated marketing
communications and client relationship management loaded onto Factor 4. This factor was
labelled consistent communication (CC) given the items gravitated around branding / business
communication. Finally, Factor 5 contained a customer relationship management and two
marketing culture items. This was labelled human resource initiatives (HRI) given the training
and employee monitoring focus.
All item communalities, that is the amount of variance each item can explain after
rotation, were above 0.5. Given the sample size (n=211) this confirms the calibration sample
was suitable for exploratory factor analysis (MacCallum et al., 1999). Finally, the decision to
use an oblique rotation was corroborated by the final component correlation matrix which
indicated the factors were positively and significantly correlated (Table 26).

267
Table 26 Factor Correlations (Obtained from SPSS Output)
Factor Correlation Matrix
Component E&CF CVI BP CC HRI E&CF 1.00 CVI 0.16* 1.00 BP 0.50** 0.50** 1.00 CC 0.37** 0.49** 0.53** 1.00 HRI 0.43** 0.38** 0.49** 0.54** 1.00
Extraction Method: Principal Component Analysis. Rotation Method: Promax with Kaiser Normalization. * p<0.05 ** p<0.01 (two tailed)
Figure 23 outlines the number of items, by dimensions and content domain that were
retained after each stage of the scaling process up to and including exploratory factor analysis.
0
20
40
60
80
100
120
140
No.
of I
tem
s
Marketing Culture 38 13 13 7
Corporate Visual Identity 19 13 13 3
Brand Personality 6 6 6 3
Customer RelationshipManagement
41 26 8 5
Integrated MarketingCommunications
15 10 10 2
Initial Item Pool Items after Expert Panel
Items after Pilot Items after E.F.A
Figure 23 Frequency Distribution of Scale Items by Dimension up to the Exploratory Factor
Analysis stage (Calibration Sample, n=211).

268
5.3.3. Confirmatory Factor Analysis
The previous exploratory factor analyses highlighted how five dimensional service brand
identity solution emerged from the data. Before it was possible to confirm whether this five
factor solution ‘fits’ the data it was necessary to consider confirmatory factor analysis sample
size.
Echoing the exploratory factor analysis literature an eclectic range of opinions exist for a
suitable confirmatory factor analysis sample size. Kelloway (1998) considers around 200 as
appropriate whilst Anderson and Gerbing (1988) suggest 150. More recently Lei and Lomax
(2005) suggest a “Sample sizes of 100 or more are recommended for accurate parameter
estimates”(p.1) whilst Mulaik (2007) considers 200 as the minimum for publishable research.
Consequently with calibration and validation samples of 211 and 210 respectively the data set
was considered adequate for confirmatory factor analysis.
5.3.3.1.Selecting a Method of Model Estimation
Model estimation was considered carefully given the impact it has on fit indices (Hu and
Bentler, 1998; La Du and Tanaka, 1989; Sugawara and MacCallum, 1993). Maximum
likelihood estimation (MLE) was used for six reasons. First, several scholars note how MLE is
the most widely used confirmatory factor analysis estimation technique (Bentler and Yuan,
1999; Hair et al., 1998; Kelloway, 1998; Netemeyer et al., 2003; Schermelleh-Engel et al., 2003;
Sugawara and MacCallum, 1993). This implies a general consensus of opinion that this is a

269
suitable estimation method. Second, MLE has been employed in the branding literature for
previous scale development with scholars such as Yoo and Donthu (2001) providing an
illustrative example. Third, whilst concerns have been voiced over the performance of MLE
with non normal data (Bentler and Yuan, 1999; Curran et al., 1996; Hu et al., 1992;
Schermelleh-Engel et al., 2003) numerous scholars have highlighted how, under conditions of
non normality, MLE provides robust parameter estimates (Boomsma and Hoogland, 2001; Chou
and Bentler, 1995; Curran et al., 1996; Hu and Bentler, 1998; McDonald and Ho, 2002; Muthen
and Muthen, 2002). Fourth, Hu and Bentler (1998) conclude ML based estimates are preferable
to those obtained via GLS and ADF given they perform more accurately under conditions of
model misspecification, varying sample size and distributions. Fifth, ML based estimates
provide better theoretical fit than empirical (atheoretical or data specific fit) fit in comparison to
GLS (Browne, 1974; Ding et al., 1995; Olsson et al., 1999) given the latter tends to distort
parameter estimates (Olsson et al., 1999). Finally, the bias in GLS based estimates is often
substantial for smaller sample sizes (<300) in comparison to ML estimates (Olsson et al., 1999).
For these reasons MLE was the preferred estimation method.
Alternative methods of estimation such as ADF (Asymptotic Distribution Free) which is
sometimes referred to as Weighted Least Squares (WLS), ULS (Unweighted Least Squares) and
GLS (Generalised Least Squares) were not used for several reasons. The use of ADF has been
advocated with non normal data (Browne, 1984; Curran et al., 1996). However, the calibration
sample was not large enough for AMOS to estimate via ADF (cf: Curran et al, 1996; McDonald
and Ho, 2002). Furthermore, the difference between estimated parameter values and the true
parameter values when ADF is used in comparison to MLE or GLS has been empirically
questioned (Olsson et al., 2000). In a similar manner, Schermelleh-Engel et al. (2003) conclude

270
ML estimation with or without correction for non normal data (by using bootstrapping) performs
better than ADF. Unweighted least squares (UWLS) output did not provide key indices such as
IFI, TLI / NNFI, CFI or RMSEA. In a similar manner, to MLE, GLS is based on normal theory
(Bentler and Dudgeon, 1996; Gerbing and Anderson, 1984; Hu and Bentler, 1998; McDonald
and Ho, 2002; Olsson et al., 1999). However, unlike MLE, empirical support for using GLS
with non normal data is scarce.
Given the non normal nature of the data, in conjunction with MLE, bootstrapping
(Bollen and Stine, 1992; 1993; Yung and Bentler, 1994) was used to obtain the Bollen-Stine p-
value for all estimated models (measurement and structural). This statistic aims to provide less
biased estimates (Byrne, 2001) and increase the power of the statistical tests (Iacobucci et al.,
2007).
5.3.3.2.Model Estimation
Based on the prior analyses (Cronbach’s α and exploratory factor analysis) a five factor
measurement model consisting of 20 items was estimated using MLE in AMOS 16.0. Following
Anderson and Gerbing (1988) all five dimensions within the measurement model were allowed
to covary (Figure 24).

271
E&CF
Item 97 (CRM) e11
1
Item 91(CRM) e21
Item 35 (MC) e31
Item 2 (MC) e41
Item 10 (MC) e51
Item 4 (MC) e61
Item 98 (CRM) e71
CVI
Item 53 (CVI) e911
Item 47 (CVI) e101
Item 55 (CVI) e111
BP
Item 61 (BP) e12
Item 62 (BP) e13
Item 59 (BP) e14
11
1
1
CCItem 107 (IMC) e15
Item 118 (IMC) e16
Item 94 (CRM) e17
11
1
1
HRI
Item 93 (CRM) e18
Item 15 (MC) e19
Item 3 (MC) e20
11
1
1
Item 14 (MC) e8
Figure 24 Service Brand Identity Measurement Model 1
In terms of fit, Service Brand Identity Measurement Model 1 provided the following
statistics. χ2=302.23, df=160 (χ2/df=1.89). The significant value (p=0.03) Bollen-Stine statistic
indicated poor model fit and so suggested the model could not be accepted i.e. p<0.05.
However, this statistic, in a similar manner to χ2 is adversely affected by sample size (Byrne,
2001) and so should not be used in isolation. GFI and AGFI were 0.88 and 0.84 respectively.
IFI, TLI / NNFI, CFI were 0.93, 0.92 and 0.93. Hence, the model produced marginally

272
acceptable fit indices (Hu and Bentler, 1999). The RMSEA was acceptable at 0.07 (90 percent
confidence interval of 0.05-0.08) (Browne and Cudeck, 1993).
5.3.3.3.Model Respecification
Whilst the fit indices were not entirely unsatisfactory (cf: χ2/df , and RMSEA) most
indices (cf: Bollen Stine p, AGFI, GFI, IFI, TLI, CFI) indicated there was room for model fit
improvement. Consequently, confirmatory factor analysis was used in an exploratory or post
hoc manner (Byrne, 2001). Scholars such as Cudeck and Browne (1983) have criticised this
process for reducing the impact and importance of confirmatory factor analysis. Conversely,
other scholars such as Tanaka and Huba (1984) argue such an approach still holds value as long
as the researcher is aware of the exploratory nature of their work. In a similar manner, Anderson
and Gerbing (1988) observe how, in practice, such an approach is frequently necessary whilst
MacCullum (1995) notes this approach is tenable as long as the model is validated on the new
data set.
Consequently, model respecification proceeded in an iterative manner. The reason being
removing items simultaneously may affect other parts of the model (Segars and Grover, 1993).
Decisions to remove parameters were based on both the data (modification indices /
standardised residuals) and theory. Modification indices were analysed to identify cross loading
items (Joreskog and Sorbom, 1988; Sin et al., 2005b; Yoo and Donthu, 2001) whilst if 5% (Hair
et al., 1998) or more of the standardised residuals had values of greater than 2.58 (Hair et al.,
1998; Joreskog and Sorbom, 1988) items would have been considered candidates for removal.
273
However, if the data indicated an item should be removed a decision was made in tandem with
theory (Hair et al., 1998; McDonald and Ho, 2002). Making decision in conjunction with theory
prevented sample specific modifications being made that could capitalise on chance (Byrne,
2001; MacCallum, 1995; MacCallum et al., 1992; Markland, 2007). The consequence being a
model that is not defensible from a theoretical perspective (Hair et al., 1998; Schermelleh-Engel
et al., 2003), generalisable to the wider population (Hair et al., 1998) or content valid (Ping,
2004).
Guided by the above rationale items 14 (E&CF), 98 (E&CF), 4 (E&CF), 94 (CC) and 15
(HRI) were removed. Following several authors’ advice (MacCallum, 1995; McDonald and Ho,
2002) the logic for removing each item is provided. Item 14 cross loaded onto HRI and EC
dimensions whilst modification indices indicated freeing this parameter would reduce χ2 by 70
(the largest amount). Item 98 was one of four items that measured clients’ needs (items 91, 35, 4
and 98) in addition to being the most frequent modification indice given it accounted for 6 of the
20 suggested modifications (Byrne, 2001). Hence based on the data and parsimony concerns
item 98 was removed. Item 4 occurred frequently as a modification indices i.e. 4 of 12 which is
indicative of a problematic item (Byrne, 2001). Item 4 was also one of three items measuring
clients’ needs (items 91, 35 and 4) was removed based on parsimony concerns. Item 94 cross
loaded onto consistent communication and human resource initiatives, was included in a high
number of modification indices (5 of 15) in addition to being a theoretically inconsistent item
given it was accompanied by two IMC items in Factor 4 (consistent communications). The final
item to be removed was 15. The reason being it was one of two training items (15 and 93)

274
within the HRI dimension and so item redundancy was regarded a potential issue. Removing
either training item (15 or 93) improved overall model fit, at best, marginally (Table 27).
Table 27 The Influence of Removing Items 15 or 93 on Model Fit
Retain items 15
and 93 Retain item 15 and
remove item 93 Retain item 93 and
remove item 15 C V F C V F C V F B-S p 0.378 0.020 0.020 0.483 0.065 0.030 0.328 0.070 0.025 GFI 0.93 0.90 0.94 0.94 0.92 0.95 0.94 0.92 0.95 AGFI 0.90 0.86 0.92 0.91 0.87 0.92 0.90 0.88 0.93 TLI 0.96 0.93 0.95 0.97 0.94 0.95 0.96 0.95 0.96 CFI 0.97 0.94 0.96 0.98 0.95 0.97 0.97 0.96 0.97 RMSEA 0.05 0.07 0.05 0.04 0.06 0.05 0.05 0.06 0.05 (C) = Calibration sample, n=211, (V) = Validation Sample, n=210 and (F) = Full Sample, n=421) and B S p = Bollen Stine p value.
Item 93 was retained in favour of 15 due to its strategic nature and B2B (relational)
focus whilst item 15 had more of a B2C connotation. Hence, this decision was guided by the
data, research context and practical concerns. With the above parameters freed, Service Brand
Identity Measurement Model 2 was estimated (Figure 25).

275
E&CF
Item 97 (CRM) e11
1
Item 91(CRM) e21
Item 35 (MC) e31
Item 2 (MC) e41
Item 10 (MC) e51
CVI
Item 53 (CVI) e911
Item 47 (CVI) e101
Item 55 (CVI) e111
BP
Item 61 (BP) e12
Item 62 (BP) e13
Item 59 (BP) e14
11
1
1
CCItem 107 (IMC) e15
Item 118 (IMC) e17
1 1
1
HRIItem 93 (CRM) e18
Item 3 (MC) e20
1
1 1
Figure 25 Service Brand Identity Measurement Model 2
Service Brand Identity Measurement Model 2 demonstrated a noticeable improvement in
fit over Measurement Model 1. χ2=127.27, df=80 (χ2/df=1.59). The Bollen-Stine statistic was
insignificant (p=0.159). This indicated good model fit and so suggested the model could not be
rejected. GFI and AGFI were 0.93 and 0.90 respectively. IFI, TLI / NNFI, CFI were 0.96, 0.95
and 0.96. Hence, the model indicated acceptable fit (Hu and Bentler, 1999). The RMSEA was
acceptable at 0.05 (90 percent confidence interval of 0.04-0.07) (Browne and Cudeck, 1993).

276
At this stage no substantive meaning could be derived from the modification indices or
standardised residuals whilst each dimension was clearly interpretable. Consequently, Service
Brand identity Measurement Model 2 was regarded as the best model (in terms of fit and
theoretical interpretability) based on calibration sample analyses. Standardised item loadings on
their postulated dimensions ranged from 0.62 to 0.95 (Table 28) whilst the smallest t-value was
7.74 (p=0.001) which indicated highly significant item loadings (Table 29).
Table 28 Standardised Item Loadings (Calibration Sample, n=211)
Item Dimension Estimate IT97 <--- Employee & client focus 0.80 IT91 <--- Employee & client focus 0.73 IT35 <--- Employee & client focus 0.77 IT2 <--- Employee & client focus 0.77 IT10 <--- Employee & client focus 0.71 IT53 <--- Corporate visual identity 0.63 IT47 <--- Corporate visual identity 0.62 IT55 <--- Corporate visual identity 0.95 IT61 <--- Brand personality 0.74 IT62 <--- Brand personality 0.63 IT59 <--- Brand personality 0.84 IT107 <--- Consistent communication 0.69 IT118 <--- Consistent communication 0.77 IT93 <--- Human resource initiatives 0.77 IT3 <--- Human resource initiatives 0.78

277
Table 29 Unstandardised Item Loadings – Coefficients, Standard Errors and t-Values (Calibration Sample, n=211)
Item Dimension Estimate S.E. t value p IT97 <--- Employee & client focus 1.000 IT91 <--- Employee & client focus 0.888 0.081 10.919 *** IT35 <--- Employee & client focus 1.001 0.086 11.673 *** IT2 <--- Employee & client focus 0.980 0.085 11.472 *** IT10 <--- Employee & client focus 0.973 0.093 10.479 *** IT53 <--- Corporate visual identity 1.000 IT47 <--- Corporate visual identity 0.889 0.114 7.812 *** IT55 <--- Corporate visual identity 1.248 0.143 8.733 *** IT61 <--- Brand personality 1.000 IT62 <--- Brand personality 0.858 0.102 8.401 *** IT59 <--- Brand personality 1.035 0.099 10.411 *** IT107 <--- Consistent Communication 1.000 IT118 <--- Consistent Communication 1.071 0.127 8.461 *** IT93 <--- Human resource initiatives 0.869 0.112 7.740 *** IT3 <--- Human resource initiatives 1.000 p<0.001
Figure 26 outlines the number of items, by dimensions and content domain, which were
retained after each stage in the scaling process up to and including confirmatory factor analysis.

278
0
20
40
60
80
100
120
140
No.
of I
tem
s
Marketing Culture 38 13 13 7 4
Corporate Visual Identity 19 13 13 3 3
Brand Personality 6 6 6 3 3
Customer RelationshipManagement
41 26 8 5 3
Integrated MarketingCommunications
15 10 10 2 2
Initial Item Pool Items after Expert Panel
Items after Pilot Items after E.F.A
Items after C.F.A
Figure 26 Frequency Distribution of Scale Items at Each Stage of the Scaling Process Please see Appendix 1 for a full list of the initial items and their associated elimination stage.
5.4. Scale Cross Validation and Psychometric Properties
The previous section highlighted how, guided by theory and the data, a service brand
identity measurement model was iteratively developed with the calibration sample and
demonstrated adequate levels of fit (cf: Hu and Bentler, 1999, Browne and Cudeck, 1993). In
order to verify the ‘post hoc’ confirmatory factor analysis, factor analysis was used in a purely
confirmatory mode on the validation sample (n=210) (Byrne, 2001).

279
5.4.1. Model Fit
When estimated using the validation sample the measurement model showed satisfactory
levels of fit (cf: Hu and Bentler, 1999). χ2=133.96, df=80 (χ2/df=1.68). The model’s Bollen-Stine
was non significant (p=0.08) and indicated the model fit could not be rejected. GFI and AGFI
were 0.92 and 0.88 respectively. IFI, TLI / NNFI, CFI were 0.96, 0.95 and 0.96 whilst the
RMSEA was 0.05 (90 percent confidence interval of 0.04-0.07). Standardised item loadings on
their postulated dimensions ranged from 0.50 to 0.98 (Table 30) whilst the smallest t-value was
6.7 (p=0.001) which indicated highly significant loadings on the postulated factors (Table 31).
Table 30 Standardised Item Loadings (Validation Sample, n=210)
Item Dimension Estimate IT97 <--- Employee & client focus 0.71 IT91 <--- Employee & client focus 0.82 IT35 <--- Employee & client focus 0.77 IT2 <--- Employee & client focus 0.83 IT10 <--- Employee & client focus 0.82 IT53 <--- Corporate visual identity 0.60 IT47 <--- Corporate visual identity 0.56 IT55 <--- Corporate visual identity 0.98 IT61 <--- Brand personality 0.78 IT62 <--- Brand personality 0.50 IT59 <--- Brand personality 0.82 IT107 <--- Consistent Communication 0.72 IT118 <--- Consistent Communication 0.80 IT93 <--- Human resource initiatives 0.93 IT3 <--- Human resource initiatives 0.60

280
Table 31 Unstandardised Item Loadings – Coefficients, Standard Errors and t-Values (Validation Sample, n=210)
Item Dimension Estimate S.E. C.R. P IT97 <--- Employee & client focus 1.000 IT91 <--- Employee & client focus 1.431 0.129 11.054 *** IT35 <--- Employee & client focus 1.428 0.136 10.515 *** IT2 <--- Employee & client focus 1.545 0.138 11.184 *** IT10 <--- Employee & client focus 1.638 0.148 11.082 *** IT53 <--- Corporate visual identity 1.000 IT47 <--- Corporate visual identity 0.899 0.126 7.142 *** IT55 <--- Corporate visual identity 1.438 0.166 8.642 *** IT61 <--- Brand personality 1.000 IT62 <--- Brand personality 0.630 0.094 6.703 *** IT59 <--- Brand personality 1.067 0.093 11.483 ***
IT107 <--- Consistent Communication 1.000 IT118 <--- Consistent Communication 1.035 0.104 9.918 *** IT93 <--- Human resource initiatives 1.462 0.206 7.087 *** IT3 <--- Human resource initiatives 1.000
*** p<0.001
As final check the measurement model was estimated with the full sample (n=421) and
demonstrated excellent levels of fit. χ2=162.36, df=80 (χ2/df=2.03). A significant Bollen-Stine
(p=0.015) indicated the model could not be accepted. However, this statistic can be adversely
affected by sample size and so is prone to Type 1 errors (Byrne, 2001). GFI and AGFI were 0.95
and 0.93 respectively. Whilst acceptable, GFI / AGFI were treated with caution given their
susceptibility to sample size (Anderson and Gerbing, 1984; Bollen, 1990; Hu and Bentler, 1995,
1998; La Du and Tanaka, 1989; Marsh et al., 1988a; Netemeyer et al., 2003). IFI, TLI / NNFI,
CFI were 0.97, 0.96 and 0.97. The RMSEA was 0.05 (90 percent confidence interval of 0.04-
0.06). Standardised item loadings on their postulated dimensions ranged from 0.55 to 0.97
whilst the smallest t-value was 10.42 (p=0.001) which indicated highly significant loadings
(p=0.001) on postulated factors.

281
5.4.2. Composite Reliability
Composite reliabilities were estimated to assess the internal consistency of the five
Service brand identity subscales with the validation sample. As, Anderson and Gerbing (1988)
note:
“after the unidimensionality of a set of scales has been acceptably established, one would
assess it’s reliability. Even a perfectly unidimensional scale will not be useful in practice
if the resultant scale score has unacceptably low reliability.” (p. 191).
For each dimension, the relevant AMOS output was substituted into Fornell and Larker’s
(1981) composite reliability formula:
Direct substitution from AMOS output resulted in the subscale’s composite reliabilities being
calculated (Table 32).
Composite Reliability =
(Sum of Standardised Loadings)2
(Sum of Standardised Loadings)2 + Sum of indicator Measurement Error

282
Table 32 Composite Reliabilities for Service Brand Identity Dimensions
Employee & client focus Standardised Factor Loading Indicator Measurement
Error
Item 97 0.71 Item 97 0.50 Item 91 0.82 Item 91 0.33 Item 35 0.77 Item 35 0.40 Item 2 0.83 Item 2 0.32 Item 10 0.82 Item 10 0.33 Σ Standardised Factor Loading 3.94 Σ Error 1.88 Σ (Standardised Factor Loading)2 15.56 Composite Reliability 0.89
Corporate visual identity Standardised Factor Loading Indicator Measurement
Error
Item 53 0.60 Item 53 0.64 Item 47 0.56 Item 47 0.69 Item 55 0.98 Item 55 0.03 Σ Standardised Factor Loading 2.14 Σ Error 1.36 Σ (Standardised Factor Loading)2 4.60 Composite Reliability 0.77
Brand personality Standardised Factor Loading Indicator Measurement
Error
Item 61 0.78 Item 61 0.39 Item 62 0.49 Item 62 0.76 Item 59 0.82 Item 59 0.32 Σ Standardised Factor Loading 2.09 Σ Error 1.48 Σ (Standardised Factor Loading)2 4.36 Composite Reliability 0.75
Consistent Communication Standardised Factor Loading Indicator Measurement
Error
Item 107 0.72 Item 107 0.48 Item 118 0.80 Item 94 0.36 Σ Standardised Factor Loading 1.52 Σ Error 0.84 Σ (Standardised Factor Loading)2 2.31 Composite Reliability 0.73
Human resource initiatives Standardised Factor Loading Indicator Measurement
Error
Item 93 0.93 Item 93 0.14 Item 3 0.60 Item 3 0.65 Σ Standardised Factor Loading 1.52 Σ Error 0.78 Σ (Standardised Factor Loading)2 2.32 Composite Reliability 0.75

283
As Table 32 shows, all reliabilities were above the recommended level of 0.6 (Bagozzi
and Yi, 1988) whilst not being in excess of 0.9 which would indicate scale item redundancy
(Netemeyer et al. 2003).
5.4.3. Construct Validity
Construct validity is concerned with ensuring the scale behaves as expected (Cronbach
and Meehl, 1955; Peter, 1981) and is regarded as a necessary condition for theory testing and
development (Peter, 1981). Netemeyer et al (2003) note how the scope of construct validity
encompasses is widely disputed with content, face, convergent, discriminant, nomological and
criterion related validity being considered its main components.
5.4.3.1.Content Validity
By clearly defining the domain of the construct, exhaustively reviewing relevant
literature, culling items from published scales, administering the experience survey to
practitioners and leading academics the domain of the construct has been adequately sampled.
Consequently, whilst being subjective in nature, the scale was regarded as content valid.

284
5.4.3.2.Face Validity
In order to assess the relevance of the items two steps were taken. First, pre-tests with
PhD colleagues, members of academic staff and personal contacts that work in the IT Services
sector were conducted. Secondly, as part of the experience survey branding experts (both
practitioners and academics) were contacted in order to assess the scale items’ relevance
(Section 4.4.5). Guided by these two steps the scale was considered face valid.
5.4.3.3.Convergent Validity
Evidence of convergent validity was obtained in three ways. First, via the variance
extracted for each factor. As Fornell and Larcker (1981) note “the researcher may conclude the
convergent validity of the construct is adequate, even though more than 50% of the variance is
due to error” (p. 46). It was necessary to substitute AMOS output into Fornell and Larcker’s
(1981) formula:
*Please see composite reliability estimates for calculation.
Via substitution of AMOS output Table 33 highlights how the AVE for each sub scale was
calculated.
AVE = Sum of Squared Standardised Loadings
Sum of Squared Standardised Loadings + Sum of indicator Measurement Error*

285
Table 33 Average Variance Extracted for Service Brand Identity Subscales (Validation Sample, n=210)
Employee & client focus Squared Standardised Factor Loading
Item 97 0.50 Item 91 0.67 Item 35 0.60 Item 2 0.68 Item 10 0.67 Σ Squared Standardised Loadings 3.12 Average Variance Extracted 0.62 Corporate visual identity Squared Standardised Factor Loading Item 53 0.36 Item 47 0.31 Item 55 0.97 Σ Squared Standardised Loadings 1.64 Average Variance Extracted 0.55 Brand personality Squared Standardised Factor Loading Item 61 0.61 Item 62 0.24 Item 59 0.68 Σ Squared Standardised Loadings 1.52 Average Variance Extracted 0.51 Consistent Communication Squared Standardised Factor Loading Item 107 0.52 Item 118 0.64 Σ Squared Standardised Loadings 1.16 Average Variance Extracted 0.58 Human resource initiatives Squared Standardised Factor Loading Item 93 0.86 Item 3 0.35 Σ Squared Standardised Loadings 1.22 Average Variance Extracted 0.61
As Table 33 illustrates, all AVE’s are greater than 0.5 which indicates the scale’s
convergent validity (Fornell and Larcker, 1981).

286
The second convergent validity test involved “determining if each indicator’s estimated
pattern coefficient on its posited underlying construct factor is significant (greater than twice its
standard error)” (Anderson and Gerbing, 1988: 416). In other words, convergent validity can
be provided by the t-value for each item being significant (i.e. >1.96). The smallest test statistic
for each (item) regression coefficient was t=6.7 (p=0.001). This, again, supports convergent
validity.
Finally, all standardised factor loadings were greater than 0.5 (Table 32) which again
indicates convergent validity (Steenkamp and Trijp, 1991) .
5.4.3.4.Discriminant Validity
Evidence of discriminant validity was assessed in three ways. First, Fornell and Larcker
(1981) highlight how pairwise correlations between factors obtained from the final model are
compared with the average variance extracted estimates for each possible pair of dimensions.
Discriminant validity is obtained when variance extracted estimates are greater than the square
of the correlations for each pair of dimensions (Sin et al., 2005b; Venable et al., 2005).

287
Table 34 Discriminant Validity Test 1 - Dimension Correlations (Squared) & AVE for Pairs of Correlation (Validation Sample, n=210)
Dimensions Correlation Estimate
Squared pairwise
correlations
Lowest AVE for Dimension Correlation
CVI <--> HRI 0.46 0.21 0.55 (CVI) CVI <--> CC 0.69 0.48 0.55 (CC)
E&CF <--> CC 0.62 0.39 0.58 (CC) BP <--> CC 0.83 0.69 0.51 (BP)* BP <--> HRI 0.65 0.42 0.51 (BP) CVI <--> BP 0.67 0.44 0.51 (BP)
E&CF <--> CVI 0.40 0.16 0.55 (CVI) E&CF <--> HRI 0.63 0.39 0.61 (HRI)
CC <--> HRI 0.65 0.42 0.58 (CC) E&CF <--> BP 0.64 0.41 0.51 (BP)
As Table 34 highlights the brand personality / Consistent Communication dimensions
indicated potential discriminant validity issues. These were explored further in subsequent
discriminant validity tests.
Anderson and Gerbing (1988) provide two further methods for assessing discriminant
validity. These constitute the second and third discriminant validity tests. First, by constraining
correlation parameters between constructs to 1.0 and then performing a χ2 difference test on the
values for both the constrained and unconstrained model. Evidence of discriminant validity
exists if the χ2 for an unconstrained model (with more factors) is significantly lower than the χ2
of each constrained model i.e. models with fewer factors. As Bagozzi and Phillips (1982)
comment “a significantly lower χ2 value for the model in which the trait correlations are not
constrained to unity would indicate that the traits are not perfectly correlated and that
discriminant validity is achieved” (p. 476).

288
Table 35 Discriminant Validity Test 2 - Comparison of Competing Models
BS p χ2 df χ2/df ∆df One Factor Model 0.005 502.09 90.00 5.58 NA Two Factor Correlated Model: φ BP/CC/CVI=1; φ E&CF/HRI=1
0.005 306.84 89.00 3.45 195.25w
Three Factor Correlated Model: φ BP/CC/CVI =1
0.005 233.97 87.00 2.69 268.12w
72.87x Four Factor Correlated Model: 0.04 149.21 84.00 1.78 352.88w φ BP/CC=1 157.63x 84.76y Five Factor Correlated Model: 0.08 133.96 80.00 1.67 368.13w 172.88x 100.01y 15.25z
Note: W Chi-square difference over one-factor model, X Chi-square difference over two-factor model (BP, CC and CVI combined; E&CF and HRI combined) Y Chi-square difference over three-factor model (BP, CC and CVI combined) Z Chi-square difference over four-factor model (BP and CC combined) E&CF=employee and client focus, CVI=corporate visual identity, BP=brand personality, CC=consistent communication, HRI=human resource initiatives.
As Table 35 highlights the five factor model provides the lowest χ2 and only non
significant Bollen Stine p value (p=0.08) at the 5% level. This provides support for the final
scale’s discriminant validity.
The sequencing of dimensions for the second discriminant validity test followed a two-
fold logic. Firstly, the four-factor model collapsed the brand personality and consistent
communication dimensions to assess whether previous discriminant validity issues reoccurred.
The four factor model’s χ2 was higher than the postulated five factor model in addition to having

289
a significant Bollen Stine (p=0.04) which indicated the discriminant validity of these two
dimensions may not be an issue. Second, the difference between the squared dimension
correlations and the AVEs for brand personality / corporate visual identity and Consistent
Communication / Corporate visual identity were the smallest (0.07 in both cases) as indicated in
Table 34. Hence, the three factor model subsumed corporate visual identity into the brand
personality / Consistent Communication amalgam to assess the impact on fit. This resulted in a
higher χ2 than the five factor model and a highly significant Bollen Stine value (p=0.005).
The final discriminant validity test involved analysing the confidence interval for all the
possible construct correlations. If the estimated confidence interval (+/- two standard errors)
does not contain the value 1 this provides addition evidence of discriminant validity (Anderson
and Gerbing, 1988; Hair et al., 1998). AMOS V 16.0.1 did not provide correlation confidence
intervals. Consequently, to obtain the standard error estimates required to calculate approximate
(95%) confidence intervals for the correlation coefficients, Fisher’s (1915) z' Transformation
was used:
SE z' = Where n = sample size i.e. 210 (validation sample). Via substitution: SE z' = Table 36 provides approximate 95 % confidence intervals for the correlation coefficient, r.
1√n-3
√207
1= 0.07. Therefore 2*SE = 0.14

290
Table 36 Discriminant Validity Test 3 - 95% Confidence Intervals for Dimensions Correlation Coefficients (Validation Sample, n=210)
Correlation Estimate Lower 90% CI Upper 90% CI
CVI <--> HRI 0.46 0.32 0.60 CVI <--> CC 0.69 0.55 0.83
E&CF <--> CC 0.62 0.48 0.76 BP <--> CC 0.83 0.69 0.97 BP <--> HRI 0.65 0.51 0.79 CVI <--> BP 0.67 0.53 0.81
E&CF <--> CVI 0.40 0.26 0.54 E&CF <--> HRI 0.63 0.49 0.77
CC <--> HRI 0.65 0.51 0.79 E&CF <--> BP 0.64 0.50 0.78
As Table 36 indicates, no confidence intervals crossed the number one. This, once more
provides evidence of scale’s discriminant validity.
Hence, two of the three tests support the discriminant validity of the scale. However,
four points should be noted at this stage. First, the five-factor model demonstrates a χ2
improvement over the four factor model. Second, the five-factor model provides an insignificant
Bollen Stine value (at the 5% level) whilst the four-factor model does not. Hence, points one
and two imply that forcing the items measuring brand personality and consistent
communications into one dimension resulted in a deterioration of model fit. Third, there are
theoretical reasons for accepting brand personality and communications are distinct but
correlated. The Conceptual Framework chapter highlighted the potential for dimension
interactions (Section 3.7.3). Finally, there are no theoretical reasons for assuming brand
personality and marketing communication-related items should be combined. For these reasons
the scale was considered as possessing discriminant validity.

291
5.4.3.5.Nomological Validity
Nomological validity assesses the extent to which the measure behaves in a way as
predicted by theory (Campbell, 1960; Churchill, 1995; Netemeyer et al., 2003). It was not
possible to assesses the scale’s nomological validity as service brand identity is new construct
and so has yet to be embedded in a nomological network (Cronbach and Meehl, 1955). Whilst, it
is appealing to assume brand identity should have a positive impact on brand performance, no
such theoretical body of knowledge exists. Hence, assessing nomological validity based on these
grounds has limited utility. The reason being disconfirmation of the theory could be a function
of theoretical shortcomings rather than those of the scale (Peter, 1981).
Some scholars have regressed (Lings and Greenley, 2005a) or correlated (Sin et al.,
2002; Walsh and Beatty, 2007) construct dimensions and performance-related dependent
variables with significant and positive coefficients indicating nomological validity. It is
suggested here such as approach does not constitute a test of nomological validity. By breaking
a construct into dimensions researchers are no longer considering the construct per se but its
dimensions in isolation which themselves are not the subject of the nomological test.
Furthermore, such a fragmented approach ignores the symbiotic effects dimensions may have
when treated as a collective entity. Such a position is consistent with Sin et al (2005b) who,
when assessing the nomological validity of their CRM scale, conceptualised CRM as a second
order construct and estimated the structural model against two performance variables. The
positive coefficients between CRM and the performance measures indicated nomological

292
validity given a previous body of knowledge indicated the positive relationship between CRM
and performance.
5.4.3.6.Criterion Validity
It was not possible to assess the scale’s criterion validity, that is, the new measure’s
correlation with a pre-existing measure of the same construct (Ping, 2004). The reason being a
validated brand identity measure in its entirety did not exist. Validated measures for some
dimensions exist such as marketing culture (Webster, 1993), integrated marketing
communications (Duncan and Moriarty, 1997; Reid, 2005) , corporate visual identity systems
(Simoes et al., 2005; Van den Bosch et al., 2006a) but not for service brand identity (or any
brand identity models).
5.4.3.7.Predictive Validity
Predictive validity is concerned with the scale’s ability to predict something it should
theoretically be able to predict. As will be demonstrated in the next section, as hypothesised,
brand identity had a positive and significant influence on brand performance. This is an
indication of the scale’s predictive validity.

293
5.4.4. The Final Service Brand Identity Scale
With reliability and validity of the scale established Table 37 presents the dimensions
and items for what is considered this thesis’ final service brand identity scale.
Table 37 Final Service Brand Identity Scale
Dimension Item Number Items
10 Our organisation treats each employee as an essential part of the organisation
97 Our employees will help clients in a responsive manner 91 Our organisation makes an effort to discover our clients' needs 35 Our organisation responds to our clients' needs
Employee & client focus
2 Our top management is committed to providing quality service
53 The font we use is an important part of our visual identity 47 Our logo is an important part of who we are Corporate visual
identity 55 The corporate visual identity is helpful in making our organisation recognisable
61 The associations making up our brand personality are extremely positive
62 Our clients have no difficulty describing our brand personality Brand personality
59 Our brand personality has favourable associations
107 The people managing the communications program for our organisation have a good understanding of the strengths and weaknesses of all major marketing communications tools Consistent
communications 118 Our organisation's advertising, PR and sales promotion all present the same clear consistent message to our stakeholders
93 Our employee training programs are designed to develop skills required for acquiring and deepening client relationships Human resource
initiatives 3 Our organisation regularly monitors employees' performance

294
5.5. Service Brand Identity and Brand Performance
The previous sections of this chapter developed the service brand identity scale
(calibration sample) and established its psychometric properties (validation sample). This
section will use the full structural model to reveal the influence of service brand identity on
brand performance. Such a two-step approach is consistent with the structural equation
modelling literature where the measurement model precedes the structural model (Anderson and
Gerbing, 1988; Bagozzi, 1981; Bollen, 1989). Hence, the measurement model is concerned with
auxiliary theory (measures to constructs) whilst structural model is concerned with substantive
theory (between constructs) with this approach being seen as the best way of minimising
erroneous conclusions (Edwards and Bagozzi, 2000). Before the structural model could be
estimated, it was necessary to consider how brand identity was conceptualised and the causality
of the model’s indicators. Each will now be discussed.
5.5.1. Service Brand Identity as a Second Order Construct
Prior to the full structural model being estimated, service brand identity was
conceptualised as a second order construct for three reasons. First, it was not possible to
estimate the final measurement model with brand performance given endogenous variables
should not be correlated in a structural model (Anderson and Gerbing, 1988; Byrne, 2001).
Secondly, exploring a higher order conceptualisation was warranted because of the positive and
highly significant factor correlations (Anderson and Gerbing, 1988) (Table 38).

295
Table 38 Service Brand Identity Dimension Correlations Obtained
from AMOS Output (Validation Sample, n=210)
Factor Correlation Matrix
Component CVI E&CF BP CC HRI CVI 1.00
E&CF 0.40** 1.00 BP 0.67** 0.64** 1.00 CC 0.69** 0.62** 0.83** 1.00 HRI 0.46** 0.63** 0.65** 0.65** 1.00
**p<0.01 (two tailed)
Third, following Law et al’s (1998) advice:
“In contrast to a set of inter-related unidimensional constructs, the dimensions of a
multidimensional construct can be conceptualised under an overall abstraction, and it is
theoretically meaningful and parsimonious to use this overall abstraction as a representation
of the dimensions.” (p. 741)
Hence, given service brand identity is a multidimensional it was considered appropriate
to conceptualise it as a second order construct. As Figure 27 outlines, the first order constructs
relate to the measurement model (factors / indicators) whilst the second order construct is
service brand identity.

296
E&CF
Item 97 (CRM) e11
Item 91(CRM) e21
Item 35 (MC) e31
Item 2 (MC) e41
Item 10 (MC) e51
CVI
Item 53 (CVI) e911
Item 47 (CVI) e101
Item 55 (CVI) e111
BP
Item 61 (BP) e12
Item 62 (BP) e13
Item 59 (BP) e14
11
1
1
EFItem 107 (IMC) e15
Item 118 (IMC) e17
1 1
1
HRIItem 93 (CRM) e18
Item 3 (MC) e20
1
1 1
BrandIdentity
e231
e241
e251
e261
e271
1
1
Figure 27 Conceptualising Service Brand Identity as Second Order Construct Prior to incorporating the second order model into the full structural model, fit indices
were obtained for the calibration, validation and full sample (Table 39).
Table 39 Fit Indices for Brand Identity as a Second Order Construct
χ2 df χ2/df Bollen
Stine p GFI AGFI IFI TLI CFI RMSEA (90% CI)
C 142.03 85 1.67 0.129 0.92 0.89 0.96 0.95 0.96 0.06 (0.04-0.07) V 149.59 85 1.76 0.065 0.91 0.88 0.96 0.95 0.96 0.06 (0.04-0.08) F 187.25 85 2.20 0.010 0.94 0.92 0.96 0.95 0.96 0.05 (0.04-0.06) C= Calibration Sample (n=211), V=Validation (n=210) and F= Full Sample (n=421).

297
Two points should be noted from Table 39. First, when conceptualised as a second order
construct service brand identity provides acceptable levels of fit. Second, the second order
model’s fit indices are largely consistent with the first order model across all three samples
(Please see Section 5.3.3.3 and 5.4.1).
5.5.2. The Influence of Service Brand Identity on Brand Performance
The full structural model in Figure 28 was estimated using Maximum Likelihood
Estimation with fit indices being obtained for the calibration, validation and full sample Table
40.

298
E&CF
Item 97 (CRM)e1
1
1Item 91(CRM)e2
1Item 35 (MC)e3
1Item 2 (MC)e4
1Item 10 (MC)e5
1
CVI
Item 53 (CVI)e91
1Item 47 (CVI)e10
1Item 55 (CVI)e11
1
BP
Item 61 (BP)e12
Item 62 (BP)e13
Item 59 (BP)e14
11
1
1
CCItem 107 (IMC)e15
Item 118 (IMCe1711
1
HRIItem 93 (CRM)e18
Item 3 (MC)e201
11
BrandIdentity
e23
1
e24
1
e25
1
e26
1
e27
1
1
Performance SumPerformance1
e281
0
e291
Figure 28 Service Brand Identity and Brand Performance - The Full Structural Model
Table 40 Fit Indices for Full Structural Model Incorporating Brand Performance
χ2 df χ2/df Bollen
Stine p GFI AGFI IFI TLI CFI RMSEA
(90% CI) C 193.55 99 1.95 0.03 0.90 0.86 0.93 0.92 0.93 0.07 (0.05-0.08) V 207.57 99 2.10 0.01 0.89 0.85 0.93 0.91 0.93 0.07 (0.06-0.08) F 280.77 99 2.83 0.01 0.92 0.90 0.94 0.92 0.94 0.07 (0.06-0.08) C= Calibration Sample (n=211), V=Validation (n=210) and F= Full Sample (n=421).

299
The fit between the measurement and structural model degraded slightly. In particular it
was notable how the Bollen Stine p value degraded when service brand identity was
reconceptualised as a second order construct.
However, overall the structural model provided broadly satisfactory levels of fit (Browne
and Cudeck, 1993; Hu and Bentler, 1999). Indeed, more recent literature notes that whilst
golden rules have been advocated for model fit by scholars such as Hu and Bentler (1999) in
addition to Browne and Cudeck (1993), decisions made in line with these indices are essentially
subjective given models have varying degrees of freedom, levels of complexity, sample sizes
and data distributions (Markland, 2007). Chen et al. (2008) make a similar point with regards to
specified acceptability for RMSEA. Hence, achieving such fit indices may be considered
somewhat elusive or implausible (Fan and Sivo, 2005; Marsh et al., 2004; Yuan, 2005). Several
modification indices highlighted areas where model fit could be improved. These were not
implemented because changes in the structural model can produce changes in the parameter
estimates for the measurement model, which in its turn would affect the empirical meaning of
the constructs as outlined in the measurement model (Ping, 2004). Consequently, from an
overall perspective, the structural model fit indices were considered acceptable and so the
coefficient and significance levels for the influence brand identity had on performance could be
reviewed (Table 41).
Table 41 The Influence of Service Brand Identity on Brand Performance
Unstandardised Estimate Standard Error t-value Significance C 6.96 1.34 5.19 p<0.001 V 4.54 1.32 3.44 p<0.001 F 5.59 0.94 5.93 p<0.001
C= Calibration Sample (n=211), V=Validation (n=210) and F= Full Sample (n=421). p<0.001

300
As Table 41 indicates service brand identity has a positive and significant influence on brand
performance across the calibration, validation and full samples.
5.5.3. The Contribution of Each dimension to Service Brand Identity
With the positive and highly significant influence service brand identity has on
performance established the next stage was to identity the relative contribution each dimension
made to driving brand performance. Table 42 , Table 43 and Table 44 illustrate the relative
contribution each dimension makes to brand identity in the calibration, validation and full
sample respectively.
Table 42 Unstandardised Factor Loadings for Dimensions of Brand Identity (Calibration Sample, n=211)
Estimate Standard Error
t-value Significance
Employee and Client Focus
<---
Brand Identity 1.00
Corporate visual identity <--- Brand Identity 1.30 0.26 4.95 ***
Consistent communications <--- Brand Identity 1.87 0.30 6.29 ***
Human resource initiatives <--- Brand Identity 1.69 0.30 5.69 ***
Brand personality <--- Brand Identity 1.68 0.26 6.41 ***
p<0.001
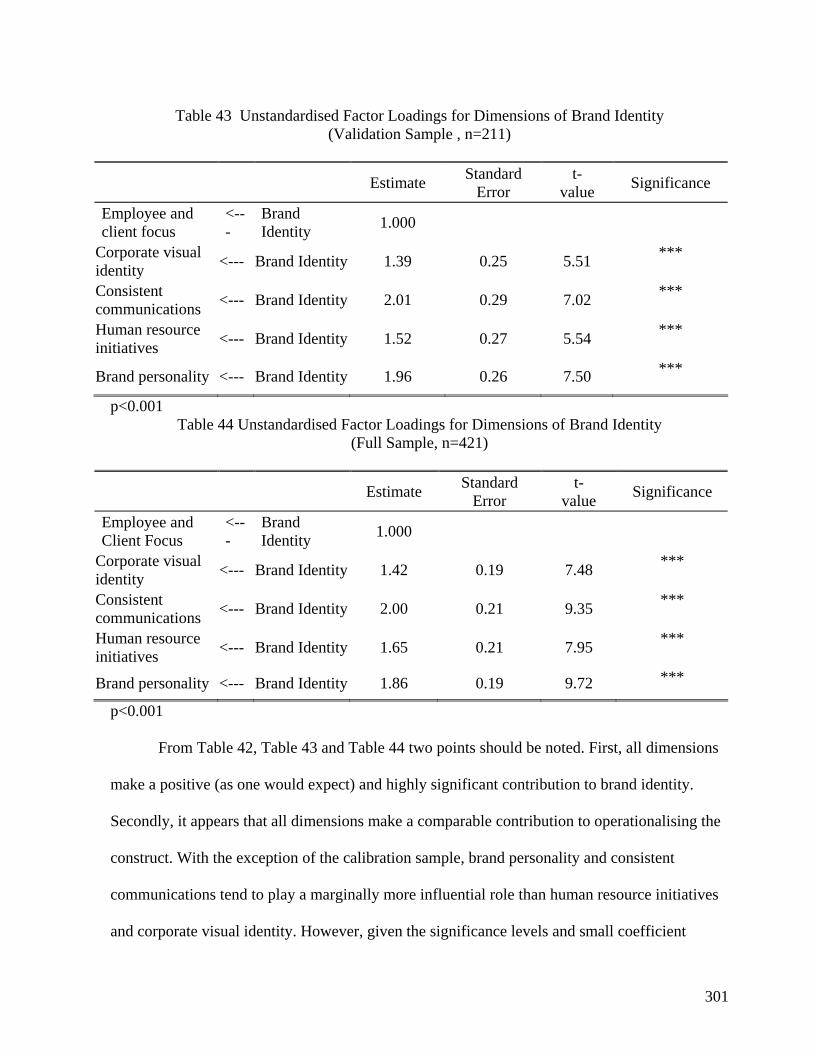
301
Table 43 Unstandardised Factor Loadings for Dimensions of Brand Identity (Validation Sample , n=211)
Estimate Standard Error
t-value Significance
Employee and client focus
<---
Brand Identity 1.000
Corporate visual identity <--- Brand Identity 1.39 0.25 5.51 ***
Consistent communications <--- Brand Identity 2.01 0.29 7.02 ***
Human resource initiatives <--- Brand Identity 1.52 0.27 5.54 ***
Brand personality <--- Brand Identity 1.96 0.26 7.50 ***
p<0.001 Table 44 Unstandardised Factor Loadings for Dimensions of Brand Identity
(Full Sample, n=421)
Estimate Standard Error
t-value Significance
Employee and Client Focus
<---
Brand Identity 1.000
Corporate visual identity <--- Brand Identity 1.42 0.19 7.48 ***
Consistent communications <--- Brand Identity 2.00 0.21 9.35 ***
Human resource initiatives <--- Brand Identity 1.65 0.21 7.95 ***
Brand personality <--- Brand Identity 1.86 0.19 9.72 ***
p<0.001
From Table 42, Table 43 and Table 44 two points should be noted. First, all dimensions
make a positive (as one would expect) and highly significant contribution to brand identity.
Secondly, it appears that all dimensions make a comparable contribution to operationalising the
construct. With the exception of the calibration sample, brand personality and consistent
communications tend to play a marginally more influential role than human resource initiatives
and corporate visual identity. However, given the significance levels and small coefficient

302
difference this would not be considered a substantive finding. Data could not be obtained for
employee and client focus as this parameter was constrained to one.
5.6. Conclusions
By analysing the data gathered during the methodology this chapter has helped this
thesis move towards meeting its research questions. These were concerned with defining,
dimensionalising and measuring service brand identity dimensionality in addition to assessing
construct’s influence on brand performance. These research questions will be addressed in the
next chapter.
The first section of the chapter explored the data via descriptive statistics, missing value
analysis and normality tests. Using the calibration sample, the second section developed the
scale via the use of Cronbach’s α, exploratory and confirmatory factor analyses. As a result of
these analyses a five dimensional, fifteen item scale emerged from the data which was then
verified using the validation sample (n=210). At this stage the psychometric properties of the
scale were established in terms of composite reliability and construct validity. The final section
of the chapter applied the service brand identity scale via the structural model to demonstrate the
positive and highly significant influence brand identity had on brand performance. The largely
uniform role each dimension played in operationalising brand identity was also noted at this
stage.
With the data analysed it is now appropriate to discuss these analyses in the context of
the literature and this thesis’ research questions.

303
6. DISCUSSION
6.1. Introduction
The previous chapter focused on data analysis. These analyses revealed how, in the UK’s
IT services sector, service brand identity is a multidimensional construct comprising of
corporate visual identity, consistent communications, brand personality, human resource
initiatives in addition to an employee and client focus. The positive and significant influence
brand identity has on brand performance was also demonstrated.
This chapter discusses the analyses (Chapter 5) conducted on the data collected (Chapter
4) in the context of the literature (Chapter’s 2 and 3) with the latter being informed by the
research questions (Chapter 1). Consequently, the objective of this chapter is to draw out and
discuss, as opposed to quantitatively recapitulate, key findings from the previous analyses in
relation to the relevant literature.
The Introduction (Chapter 1) established four research questions which have guided this
thesis. These were:
- What is service brand identity?
- What are the dimensions of service brand identity?
- How do we measure service brand identity?
- Does service brand identity have a positive and significant influence on brand
performance?

304
As these research questions provide the rationale for this thesis they will be used to
structure the majority of this chapter. Consequently, the first section presents a service brand
identity definition. This augments the literature-based definition developed in the literature
review (Section 2.4.3) via the incorporation of service brand identity dimensionality (Chapter 5).
The second section of the chapter elaborates on the first by discussing the domain, or
dimensionality, of service brand identity in the context of the literature. At this stage dimensions
that were postulated as falling under the domain of service brand identity but did not materialise
are also discussed. The third research question concerning service brand identity management is
implicitly addressed during the second section given the measure reveals dimensionality and so
is the means to the end. With the definition and domain of the service brand identity discussed,
the influence the service brand identity has on brand performance is discussed. The balanced
nature of the construct, in the context of performance, is also considered. The penultimate
section of the chapter goes beyond the initial research questions to discuss the service brand
identity framework’s applicability in B2B markets. The concluding section reiterates the key
points made in during this chapter. Notably, this is the first study to empirically establish that
service brand identity is a multidimensional construct which has a positive and significant
influence on brand performance.
305
6.2. What is Service Brand identity?
The literature review (Section 2.4.3) shared this thesis’ logic for, preliminarily, defining
service brand identity as:
The strategist’s vision of how a service brand should be perceived by its stakeholders
Guided predominantly by the work of Aaker (1996a) as well as Aaker and
Joachimsthaler (2000) this literature-based definition was regarded as a providing a theoretical
grounding and platform for developing a service brand identity definition. Now the construct’s
dimensionality has been revealed during data analysis, it is possible to augment this literature-
based definition by incorporating this research’s findings to define service brand identity as:
The strategists’ vision of how a service brand should be perceived by its stakeholders
which is made manifest via the organisation’s brand personality, corporate visual
identity, consistent communications, human resource initiatives and by developing an
employee and client focus.
As a result of developing the literature-based definition several points should be noted.
Primarily, this definition can now be considered as a service specific and not generic brand
identity definition for two reasons. First, this definition incorporates dimensions that have
emerged from this service sector-based research. Second, the initial dimensions were developed
bearing in mind the unique characteristics service brands have and the specific challenges brand
marketers at such organisations face (cf: Berry, 1980; Low and Lamb, 2000). Of particular note

306
here is the central role employees’ play in service brand delivery. Consequently, this definition
builds on the extant brand identity literature to develop a service brand identity definition which
is cognisant of the research’s service context.
6.3. What are the Dimensions of Service Brand Identity?
This thesis’ second research question is concerned with understanding what dimensions
constitute service brand identity. To address this research question, the Theoretical Framework
chapter, guided by the literature, initially considered the domain of service brand identity as
consisting of marketing culture, corporate visual identity systems, integrated marketing
communications, client relationship management and brand personality (Section 0). The
analysis chapter outlined how service brand identity was a multidimensional construct made
manifest via five dimensions. These were corporate visual identity, human resource initiatives,
consistent communications, brand personality and by developing an employee and client focus.
Each dimension will now be discussed in the context of the literature.
6.3.1. Corporate Visual Identity
A dimension that contained only corporate visual identity system items emerged from
the analysis (Section 5.3). This factor was labelled corporate visual identity and not corporate
visual identity systems. The reason being the domain of the latter is greater than reflected by the
former (Melewar and Saunders, 1998; 2000; Van den Bosch et al., 2005; Van den Bosch et al.,

307
2006b). Furthermore, from a parsimony perspective, it is questionable if a large enough number
of corporate visual identity systems items could have ever materialised from the analyses in
order to form such a dimension in the final scale.
Couched within the above logic, regarding corporate visual identity as a dimension of
brand identity corroborates the view that the use of symbolism in the form of logos, typeface
etc., play an important role in the brand identity building process. This position supports several
scholars’ work. For example, Aaker (1996a) outlines how the use of logos provides brand
identity with greater cohesion which facilitates recognition and recall (p. 84) whilst Aaker and
Joachimsthaler (2000) note how symbolism helps create a visual metaphor which acts as a
vehicle for communicating complex brand benefits. Similarly, Kapferer’s (2004) ‘physique’
facet, which is associated with the more concrete and tangible aspects of a brand, could also be
understood as relating to the development of brand nomenclature such as the logo and typeface.
Hence, this research also substantiates Kapferer’s (2004) work. Likewise, these findings are
consistent with Keller (2003) who outlines how the use of an organisation’s logo and other
brand symbolism can help convey the brand identity for a service brand in a more concrete and
real manner than if such visual cues were not used .
The emergence of a visually orientated service brand identity dimension also provides
support for the wider service branding literature. For example, it has been widely noted in the
literature how the effective use of logos helps tangibilise predominantly intangible service
offerings (Berry, 2000; Bitner, 1990; Keller, 2003; Levitt, 1981; Miller et al., 2007; Shostack,
1977; Zeithaml and Bitner, 1996; Zeithaml et al., 1985) whilst several scholars have outlined

308
how the use of visual cues plays a particularly important role in differentiating service brands
(Aaker, 1996a; Boyle, 1996; de Chernatony, 2006; Onkvisit and Shaw, 1989; Park et al., 1986).
The conceptual framework chapter highlighted how brands operating in B2B markets
tend to focus on brand name and to a lesser extent on brand logo (Section 3.5.2 ). The findings
presented in the previous chapter support the prevailing view that names and logos constitute an
integral part of a B2B brand. More specifically, this corroborates the position of numerous B2B
scholars who note the salient role brand name (Hutton, 1997; Kotler and Pfoertsch, 2006a; Low
and Blois, 2002; Shrimp, 1993; van Riel et al., 2005) and brand logo (Aaker and Joachimsthaler,
2000; Kotler and Pfoertsch, 2006a) play in B2B markets. However, in line with more B2C
orientated literature to unlock the full value of visual identity management, B2B brand
marketers should consider the full range of activities that span the domain of the construct such
as stationery, facilitates, vehicles, employee clothing and other organisational nomenclature as
outlined in section 3.5.2.
Based on this finding and consistent with Kotler and Pfoertsch (2006a) B2B brands
would be well served to consider metaphoric transfer via visual identity to convey their brand
values, attributes or personality. Such an approach would facilitate receipt of brand related
benefits such as premium pricing (Bendixen et al., 2004; Firth, 1997; Mudambi et al., 1997),
enhanced loyalty (van Riel et al., 2005; Walley et al., 2007), higher brand awareness (Davis et
al., 2007), brand differentiation (Kotler and Pfoertsch, 2006a; Shrimp, 1993) and enhanced
brand equity (Bendixen et al., 2004; Davis et al., 2007; Kotler and Pfoertsch, 2006a).

309
Consequently, these findings support the view that ‘visual identity’ plays an important
brand identity building role. Moreover, these findings are consistent with the broader service
branding literature which outlines how organisations that provide predominantly service
orientated offerings need to pay particular attention to visual cues such as logo design and font
in order to make their brand more recognisable.
6.3.2. Consistent Communications
A dimension emerged from the data which consisted purely of integrated marketing
communications items (Section 5.3). This was labelled consistent communications and not
integrated marketing communications. The reason being the domain of integrated marketing
communications, as outlined in the literature (Reid, 2005; Reid et al., 2001; Schultz et al., 1994),
is represented by more than the two communication items included in the final scale. Whilst
integrated marketing communications could not be considered a dimension of brand identity two
points should be noted. First, based on parsimony grounds alone, it was not reasonable,
retrospectively, to expect all (or at least a sizable number of) items that constituted the domain
of integrated marketing communications to be included in a multidimensional scale of which
IMC was a part. Second, the two consistent communication items make it clear that
organisations need to integrate across the communications mix when developing their brand
identity. Hence, the concept of integrating marketing communications is salient to this
dimension.

310
The theoretical origins of the integrated marketing communications dimension were
grounded in the corporate and not brand identity literature. Of particular note was how this
research drew on The Interdisciplinary Schools Corporate Identity Mix with its elements of
communications, behaviour and symbolism (Van Riel and Balmer, 1997). Consequently the
emergence of this communication related dimension provides support for the multidisciplinary
approach this thesis has adopted which attempts to bridge the schism between the brand,
corporate and organisational identity literatures (Section 2.4.6 of the Literature Review) and
provide interdisciplinary direction for subsequent brand identity research.
Although marketing communications has not been identified in the relevant literature as
a dimension of brand identity, several scholars have outlined the important role communication
plays when building brand identity. For example, Aaker (1996a) regards communications as
critical to brand identity “execution” (p. 186) whilst Aaker and Joachimsthaler (2000) outline
how communication facilitates brand identity implementation. Hence, these scholars believe
communication plays a crucial role in terms of making service brand identity, that is, the
strategists’ vision for his or her brand, manifest. In a similar manner, de Chernatony’s (2000)
model made reference to brand identity ‘presentation’ which the conceptual framework chapter
argued could be considered as being synonymous with communications. Consequently, the
emergence of this dimension provides support, albeit indirectly, for these scholars’ views.
In terms of the broader service branding literature, the literature review highlighted the
important role that employees play in service brand delivery (Balmer, 1995; Balmer and
Greyser, 2003; Berry, 2000; Biel, 1993b; Bitner, 1990; Burmann and Zeplin, 2005; Dall'Olmo
Riley and de Chernatony, 2000; Harris and de Chernatony, 2001; Kennedy, 1977). To engage

311
employees in the branding process the use of internal marketing at service brands has been
advocated in both the B2C (Aaker and Joachimsthaler, 2000; de Chernatony, 2006; de
Chernatony et al., 2003; Fill, 2002; McDonald et al., 2001) and B2B literature (Bendixen et al.,
2004; Lannon, 1992; Lynch and de Chernatony, 2004). However, the final scale did not
measure internal marketing / communications (cf: Reid, 2005, Duncan and Moriarty, 1997).
This finding was not anticipated given the need for service brands to take a balanced approach
to branding by considering both internal and external stakeholders (Balmer, 1995; Balmer,
2001b; Blackston, 1993; de Chernatony, 1999; de Chernatony et al., 2003; de Chernatony and
Segal Horn, 2003; Harris and de Chernatony, 2001; Lamons, 2005; Zeithaml et al., 2006).
The emergence of a communications dimension corroborates the position that
communication plays an important role in B2B markets (Gilliland and Johnston, 1997;
Mudambi, 2002). Of particular note is how the communication should have an organisational
and not line brand focus. This supports the position numerous scholars adopt (Bendixen et al.,
2004; Blomback and Axelsson, 2007; Han and Sung, 2008). The target for the communications
focuses in a broader range of stakeholders and not just on customers. This reinforces the view
that if marketing communications are customer-centric they have been too narrowly conceived
(Bendixen et al., 2004; Kotler and Pfoertsch, 2006a).
The emergence of a communications dimension supports the view that marketing
communications play an important service brand identity role. Consequently, when
organisations look to build brand identity it is essential those responsible for marketing
communications understand the relative strengths and weaknesses of various communications

312
tools at their disposal. By carefully orchestrating advertising, PR, sales promotion and so forth
the organisation will be better placed to deliver a consistent brand message to its stakeholders
and diffuse the desired brand identity more effectively. However, whilst it is possible internal
marketing communications may be an antecedent of service brand identity, based on the
previous analyses, internal communications are not reflected in the final scale.
6.3.3. Brand Personality
The previous chapter (Section 5.3) highlighted how, based on empirical and theoretical
grounds, brand personality is a dimension of service brand identity. Empirically, a dimension
that consisted purely of brand personality items emerged from the data. From a theoretical
perspective, the methodology chapter (Section 4.4.2) outlined the logic for employing Keller’s
(1993) dimensions of brand association within his brand equity conceptualisation to measure
brand personality. The main reason being brand personality is an association (Aaker, 1995,
1997; 1999; Batra et al., 1993; Freling and Forbes, 2005a; Haigood, 1999; Johar et al., 2005).
Whilst the final three items did not contain all three brand association adjectives of ‘strong’,
‘favourable’ and ‘unique’ (cf: Keller, 1993), it was clear different aspects of brand personality
have been measured via a brand personality being ‘positive’ (strong), ‘favourable’ or having ‘no
difficulty in being described’ (unique).
The emergence of a brand personality dimension supports several brand identity scholars
who noted the important role brand personality plays when developing brand identity (Aaker,
1996a; Aaker and Joachimsthaler, 2000; de Chernatony, 1999, 2006; Kapferer, 2004). For

313
example, Aaker (1996a) outlined how brand personality results in a “a brand identity that is
richer and more interesting than one based on product attributes” (p. 83) whilst de Chernatony’s
(2006) noted how brand personality “brings the brand’s emotional values to life” (p.46). In a
similar manner, Kapferer (2004) considered personality as a facet of his Brand Identity Prism
while Aaker and Joachimsthaler (2000) argued that if a brand identity has been developed
without personality it has been too narrowly conceived.
From a broader branding perspective, this finding appears to be at odds with authors
such as Keller (2003) who argue the development of a brand personality for organisations
operating in B2B markets tends to be less important than those in B2C markets. The reason
being B2B organisations’ clients have, unlike consumer markets, comparatively fewer
psychological and social needs (Keller, 2003). This finding also contests the view that
emotionally influenced decisions are rare in industrial markets (de Chernatony and McDonald,
1998).
Conversely, the findings that brand personality is a dimension of service brand identity
in the UK’s IT service sector supports an increasing body of knowledge which outlines the
important role emotional aspects of branding play in B2B markets (Bennet et al., 2005;
Blomback and Axelsson, 2007; Davis et al., 2007; Kotler and Keller, 2006b; Kotler and
Pfoertsch, 2006b; Lamons, 2005; Lynch and de Chernatony, 2004, 2007; Malhotra, 2005).
Consequently, when building brand identity, the brand strategist would be well served to build
an emotional element into their identity which is made manifest via brand personality. This
emotional element could take the form of trust, confidence, comfort (Kotler and Pfoertsch,

314
2006a), pride, peace of mind, security, reassurance, reputation or responsiveness (Lynch and de
Chernatony, 2004)
Consequently, this finding adds credence to the brand identity literature which
highlighted the salient role brand personality plays when building brand identity. The emergence
of this dimension also highlights that when developing their brand identity, organisations
operating in the UK IT Services sector should endeavour to create an emotional connection via
the development of positive, favourable and unique brand personality associations.
6.3.4. Human Resource Initiatives
A new dimension that emerged from the data was labelled human resource initiatives.
This factor consisted of one marketing culture and one client relationship management item. As
the title indicates this factor was concerned with human resource activities, notably to
administer training programs that provide employees with the skills to acquire and deepen client
relationships in addition to monitoring employee performance on a regular basis. Although
human resource initiatives had not been identified in the relevant literature as a dimension of
brand identity, the content of this dimension reiterates the central importance employees play in
service branding (Balmer, 1995; Balmer and Greyser, 2003; Berry, 2000; Biel, 1993b; Bitner,
1990; Burmann and Zeplin, 2005; Dall'Olmo Riley and de Chernatony, 2000; Harris and de
Chernatony, 2001; Kennedy, 1977).

315
The first item, “Our employee training programs are designed to develop skills required
for acquiring and deepening client relationships” was of particular note for several reasons.
Initially, this item made explicit the critical role that investing in human resource initiatives such
as training play in the brand identity building process at service organisations. Whilst not
directly related to the brand identity literature, this supports the work of numerous scholars who
noted the salient role human resource activities such as training play in promoting behaviour
consistent with the brand’s values (de Chernatony, 2006; Farnfield, 1999; Heskett et al., 1997;
Lovelock et al., 1999). With human resource initiatives playing an important part in building
service brand identity, it is increasingly important that marketing and human resource
departments develop stronger cross functional ties. This is consistent with the view that with
corporate brands, whose branding structure tends to predominate in service markets, there is a
greater need for functional alignment between marketing and human resource (Balmer, 1995;
Davies and Chun, 2006; Davies et al., 2003; 1999, 2006; King, 1991; Wilson, 2001; Zeithaml et
al., 2006). Additionally, this item elucidates the important role client / brand relationships play
as part of the brand identity building process and so provides indirect support for several
scholars’ work (Aaker, 1996a; Aaker and Joachimsthaler, 2000; de Chernatony, 2006; Kapferer,
2004). Finally, the language of the item alludes to the strategic nature of building service brand
identity. This reinforces the view that branding identity building is a strategic and not tactical
activity (Aaker, 1996a; de Chernatony, 2006).
In the context of the B2B literature, the importance of proactively managing human
resource initiatives has been highlighted by several scholars. Davis et al. (2007) note that in the
context of Keller’s (2003) brand equity conceptualisation, image played a more important brand

316
equity building role than awareness for B2B service brands. Based on this finding these
scholars advise organisations to allocate greater resource to image supportive activities such as
employee training as opposed to costly brand awareness exercises such as above the line
advertising. This is consistent with the view clients make assessments on the company based on
employees’ skills, attitudes, behaviours and communication (Gordon et al., 1993) and that mass
communication can be used to a much lesser extent in B2B than B2C markets (Ohnemus,
2009). Consequently, B2B brands would be wise to train their human resource so brand
consistent behaviours can be inculcated and subsequently demonstrated when they interact with
clients. The importance of employee training was specifically highlighted in the employee and
client focus dimension of the scale (item 93). This places an emphasis on employee training
which facilitates the acquisition and deepening of client relationships (cf; Section 6.3.5 for
Employee and Client Focus). Taking a broader perspective, Beverland et al. (2007a) suggest
B2B brands should develop internal brand ownership, or a brand supportive dominant logic, via
reward, training and hiring policies, which again fall under the domain of human resource
initiatives.
Consequently, the emergence of this dimension highlights how marketers who are
responsible for building brand identity in service brands need to develop a more considered
approach to human resource management. In particular, this relates to organising training that
focuses on the development of client relationships in addition to regularly monitoring of
employees’ performance.

317
6.3.5. Employee and Client Focus
In a similar manner to the human resource initiatives, developing an employee and client
focus was a new dimension to emerge from the data. As the title intimates, this factor consisted
of items which paid particular attention to employees and clients’ needs. It comprised of three
client relationship management and two marketing culture items. Each component of the
dimension will now be discussed in the context of the B2C and B2B literature.
The employee related element of the dimension was concerned with treating each
member of staff as an essential part of the organisation. Developing such an employee focus in
service organisations supports the work of numerous scholars who outlined the pivotal role
employees’ play in service brand delivery (Balmer, 1995; Balmer and Greyser, 2003; Berry,
2000; Biel, 1993b; Bitner, 1990; Burmann and Zeplin, 2005; Dall'Olmo Riley and de
Chernatony, 2000; Harris and de Chernatony, 2001; Kennedy, 1977).
In terms of the B2B literature Kotler and Pfoertsch (2006a) consider employees, in
addition to customers and the company as playing a central role in B2B brand success. The
reason being employees help differentiate the brand, enhance the brand experience and facilitate
reputation building due to the pivotal role they play in conveying the brand in B2B markets
(Kotler and Pfoertsch, 2006a). This point is consistent with Beverland et al. (2007a) who
advocate those responsible for B2B brands actively engage organisational employees in the
branding process. Adopting a broader perspective, Webster and Keller (2004) encourage a top
down and bottom up approach to B2B brand building. This entails clear senior management
direction and active employee involvement in the brand building process. Finally, the

318
emergence of an employee component in this dimension provides support for the view that
employees play a central role building corporate brand equity at B2B brands (van Riel et al.,
2005). This position aligns with the considerable body of knowledge highlighting the pivotal
role employees play for corporate brands (Ashford and Mael, 1996; Balmer, 1995, 1998; Balmer
and Greyser, 2003; Balmer and Greyser, 2006; Berry and Seltman, 2007; Brodie et al., 2009;
Burmann and Zeplin, 2005; de Chernatony and Cottam, 2008; de Chernatony and Segal-Horn,
2004; Harris and de Chernatony, 2001; Hulberg, 2006; Kennedy, 1977; Vallaster and de
Chernatony, 2006).
The client related element of the dimension was concerned with helping clients in a
responsive manner in addition to discovering and responding to their needs. Developing such a
client focus is consistent with the marketing orientation literature (Kohli and Jaworski, 1990,
Narver and Slater, 1990, Slater and Narver, 1994) which looks to foster a pan organisational
mindset that focuses on meeting current and potential customers’ needs. However, given this
thesis’ B2B focus, the language of ‘clients’ as opposed to ‘customers’ has been used although
the same principles apply, that is, a concern for identifying and meeting customers needs that
runs through the organisation. Indirectly, the importance of a client focus also provides support
for the service dominant logic (Vargo and Lusch, 2004a) which encapsulates the marketing
orientation literature as part of its burgeoning paradigm (Section 2.3.1).
The client component of the employee and client dimension corroborates the view that
clients form, as one would hope, an integral part of the B2B branding process. Kotler and
Keller (2006a) contend the nature and complexity of B2B markets requires closer customer
support vis-à-vis B2C goods or services where relatively little or no expertise is required. This

319
perspective is consistent with Beverland et al. (2007a) who advocate B2B brands adopt a
customer focus whilst Golder and Tellis (1993) contend placing customers’ wants and needs at
the heart of B2B brands drives differential advantage.
In terms of the dimension overall, by considering both employees and clients this thesis’
view on brand identity answers the call from the literature for a more balanced approach to
service branding where both employees and customers / clients are considered as part of brand
marketing initiatives (Balmer, 1995; Balmer, 2001b; Blackston, 1993; de Chernatony, 1999; de
Chernatony et al., 2003; de Chernatony and Segal Horn, 2003; Harris and de Chernatony, 2001;
Zeithaml et al., 2006).
Consequently, an employee and client focus that was not initially considered a distinct
service brand identity dimension emerged from the data. The contents of this dimension
highlight the need for organisations to be aware of and meet their clients’ needs but also to
appreciate the role employees’ play in making their brand identity manifest.
6.4. Discarded Dimensions of Service Brand Identity
The conceptual framework chapter drew on a broad range of literature to explore the
domain of service brand identity. As the previous sections outlined the construct consists of five
dimensions. However, two dimensions, notably a marketing culture and client relationship
management did not materialise from the data analyses.
320
6.4.1. Marketing Culture
Based on analyses conducted in the previous chapter (Section 5.3) a marketing culture
dimension did not emerge from the data. Whilst this indicates a marketing culture is not a
dimension of service brand identity several points should be noted. For example, the brand
identity literature (de Chernatony, 2006; Kapferer, 2004) outlined how ‘culture’ was a
dimension of brand identity. However, the Theoretical Framework chapter (Section 3.7.2) noted
how ‘culture’ is a category of constructs and not a construct per se with the former being
unsuitable for scale development (DeVellis, 1991). Consequently, a marketing culture was
justified as a dimension of brand identity with the rationale being provided in the Theoretical
Framework chapter (Section 3.7.2). On one hand, support for these authors views’ (cf: de
Chernatony, 2006; Kapferer, 2004) may never have been achievable given the range of
categories that fall under the term culture. However, even if these scholars meant
organisational culture, this construct was encapsulated, albeit indirectly, within the domain of a
marketing culture given the latter built on Deshpande and Webster’s (1989b) seminal
organisational culture work. This only serves to strengthen the argument that a marketing
culture is not a dimension of brand identity. Second, Webster’s (1993, 1995) marketing culture
scale consisted of 34 items which spanned six dimensions. From a practical perspective it was
unlikely, retrospectively, that a large enough number of items would emerge from the data in the
form of a meaningful marketing culture dimension. Third, from the final 15 item scale, four
items were sampled from the marketing culture domain. These items measured senior
management’s commitment to service quality, the frequency of employee performance
monitoring, the extent to which each employee was treated as an essential part of the
organisation in addition to assessing how well the organisation responds to clients’ needs. The

321
relatively high number of marketing culture items indicates that whilst this construct did not
form a dimension per se, this literature stream played a notable role in operationalising brand
identity. Finally, other items that were tangentially related to the marketing culture literature
were included in the final scale. For example, Webster’s (1993, 1995) scale contained training
related items. The final service brand identity scale also included a training item, albeit drawn
from the domain of client relationship management.
Consequently, although a marketing culture dimension did not emerge from the data, to
consider the development of a culture, which promotes more market-focused behaviours as
unimportant to brand identity represents a cursory interpretation of the data. A more informed
approach may be to consider marketing culture as an antecedent of brand identity as opposed to
a dimension in its own right.
The identity literature tends to conceptualise culture as a dimension of its respective
constructs (cf; de Chernatony, 2006; Kapferer, 2004; Van Riel and Balmer, 1997). This position
contrasts with other literature where culture is considered as an antecedent as opposed to a
dimension for the focal construct of interest. For example, Orlando et al.(2009) outlined how
organisational culture influences the types of psychological contracts employees wish to enter
with their employing organisation. Bate (1984) highlighted how culture influences employee
orientation to organisational change whilst Cabrera et al. (2001) noted how culture affects
organisational process and behaviour in the context of technology driven change. The role of
culture in driving innovation and creativity was outlined by Martins and Terblanche (2003)
whilst Lok and Crawford (2004 ) found innovative and supportive cultures (in addition to a

322
considerate leadership style) had a positive effect on both job satisfaction and commitment.
Informed by the logic underpinning this literature, it was considered appropriate to consider
marketing culture as an antecedent of service brand identity and so potentially constitute part of
the focal construct’s nomological net (Cronbach and Meehl, 1955). As the conclusions chapter
highlights (Section 7.6) exploring the nomological net for service brand identity could be
considered an avenue for future research.
6.4.2. Client Relationship Management
Based on the analyses conducted in the previous chapter (Section 5.3) a client
relationship management dimension did not emerge from the data. Consequently, this finding is
at odds with several brand identity scholars who outline the important role relationships, which
need to be managed, play in building brand identity. For example, Aaker (1996a) considers
brand relationships as the “bottom line” (p. 103) when developing brand identity whilst Aaker
and Joachimsthaler regard relationships as an integral part of the brand identity building process.
In a similar manner, relationships represent a facet of Kapferer’s (2004) identity prism whilst
relationships underpin de Chernatony’s (2006) brand identity conceptualisation.
The absence of a relational dimension is also at odds with several authors who note that
relationships play a particularly important role in B2B markets (de Chernatony and McDonald,
1998; Ford et al., 2003; Kotler and Keller, 2006b; Lynch and de Chernatony, 2004; van Riel et
al., 2005). These scholars views were grounded in the logic that the interpersonal (Kotler and
Keller, 2006b) and complex (van Riel et al., 2005) nature of the buying process necessitates a
323
more relational approach. However, the findings from this data suggest relationships do not
form a dimension of service brand identity.
However, to say the views of the above brand identity and service marketing scholars
have limited value represents a fleeting interpretation of the analyses. In a similar manner to the
marketing culture dimension, four of the 15 items in the final scale were drawn from the
relationship management literature. Hence, the importance of considering a relational approach
as part of brand identity building should not be underestimated. Furthermore, one of the human
resource initiative items focuses on the importance of training employees in order to acquire and
deepen client relationships. Whilst this item’s primary focus or means was concerned with
training, the objective or end was to “acquire and deepen” client relationship management.
Consequently, the importance, albeit indirectly, of relationships is apparent.
A client relationship management dimension did not materialise from the data.
Consequently, in a similar manner to a marketing culture, it may be more appropriate to
consider the management of client relationships as a potential antecedent of service brand
identity as opposed to a dimension in its own right given the salience of the construct’s items in
the final scale.

324
6.5. Does Service Brand Identity Have a Positive and Significant Impact On Brand
Performance?
In order to address the fourth research question the theoretical framework chapter
(Section 3.6) hypothesised:
H1: Service brand identity has a positive and significant influence on brand performance
As the Analysis chapter (Section 5.5.2) indicated, service brand identity had a positive
and significant influence on brand performance. Consequently, the brand identity-performance
hypothesis could not be rejected. There is no previous literature outlining the positive influence
brand identity has on performance. Thus, this finding represents an original contribution to
knowledge made by this thesis. However, unlike the earlier sections of this chapter concerned
with construct dimensionality it is not possible to discuss this finding in the context of a
previous body of knowledge. The only tangentially connected literature relates to brand equity
where the positive influence on performance has already been established (Aaker, 1996b; Kim
et al., 2003b; Park and Srinivasan, 1994). Consequently, it is hoped this finding provide both a
platform and point of reference for subsequent brand identity-performance research.
The data analysis also highlighted the relatively equal factor loadings each service
brand identity dimension had in the context of brand performance (Section 5.5.3). This indicated
that, when considered in unison with brand performance, brand identity not only has a positive
influence on performance but that the influence of each dimension is comparable. This gives rise
to service brand identity being conceptualised as a balanced construct. Furthermore, when the
balanced nature of the construct is considered in conjunction with the finding that all dimensions

325
are positively and significantly correlated this indicates service brand identity should be
considered holistically and not atomistically. Such a logic follows that of de Chernatony (2006)
who advocates a holistic approach to brand building.
6.6. Does the Service Brand Identity have Specific B2B Applicability?
Distinctions between B2B and B2C markets have been highlighted in the literature (de
Chernatony and McDonald, 1998; Kotler and Pfoertsch, 2006a). Conversely, some scholars
outline how the characteristics of B2B and B2C markets are not necessarily mutually exclusive
(Beverland et al., 2007a; Webster and Keller, 2004). Although the service brand identity
framework was developed in a B2B market and with B2B markets in mind it is contended the
latter group of scholar’s position is particularly valid for several reasons.
The brand personality dimension encourages B2B brand marketers to look beyond
functional values and incorporate more emotionally orientated values into service brand identity
building initiatives. This draws directly on several scholars’ work from the B2B literature who
advocate such an approach (Kotler and Pfoertsch, 2006a; Lannon, 1992; Lynch and de
Chernatony, 2004). However, the use of personality and more emotional branding has also been
advocated, and indeed originated, in the B2C literature (Aaker, 1995, 1997; Blackston, 1993;
Fournier, 1998; Keller and Richey, 2006; Venable et al., 2005).
The consistent communication dimension entails coherent brand identity execution
across the communications mix. Numerous scholars have outlined the important role
communication plays when building brands in B2B markets (Bendixen et al., 2004; Blomback

326
and Axelsson, 2007; Cretu and Brodie, 2007; Gilliland and Johnston, 1997; Han and Sung,
2008; Kotler and Pfoertsch, 2006a; Lynch and de Chernatony, 2004; Mudambi, 2002; Wren and
Simpson, 1996). In a similar manner to the B2B literature a notable number of scholars have
also outlined the important role brand related communications play in B2C markets (Kliatchko,
2005; Low, 2000; Reid, 2005; Reid et al., 2001; Schultz, 2006).
The visual identity dimension concerns making service brand identity more tangible and
manifest via font, logo and other visual cues. The importance of visual imagery has been noted
in both the B2C (Melewar and Saunders, 2000; Van den Bosch et al., 2006a; 2006b) and B2B
literatures (Bendixen et al., 2004; Davis et al., 2007; Firth, 1997; Hutton, 1997; Jackson and
Tax, 1995; Kotler and Pfoertsch, 2006a; Mudambi et al., 1997; Shipley and Howard, 1993;
Shrimp, 1993; van Riel et al., 2005; Walley et al., 2007). Consequently, the salience of the
construct to brand building initiatives spans both literature streams.
The employee and client focus dimension encapsulates and elucidates the important role
of these two stakeholder groups play when building service brand identity. The importance of
both stakeholders has been found in both the B2B and B2C literature. In terms of the B2C
literature, a concern for employees (Ashford and Mael, 1996; Balmer, 1995, 1998; Balmer and
Greyser, 2003; Balmer and Greyser, 2006; Berry and Seltman, 2007; Brodie et al., 2009;
Burmann and Zeplin, 2005; de Chernatony and Cottam, 2008; de Chernatony and Segal-Horn,
2004; Harris and de Chernatony, 2001; Hulberg, 2006; Kennedy, 1977; Vallaster and de
Chernatony, 2006) and customers (Baker and Sinkula, 1999; Baker and Sinkula, 2005b; Deng
and Dart, 1994; Jaworski and Kohli, 1993; 1996; Kohli and Jaworski, 1990; Slater and Narver,
1994) has been highlighted. Similarly, the importance of employees (Beverland et al., 2007a;

327
Kotler and Pfoertsch, 2006a; van Riel et al., 2005; Webster and Keller, 2004) and clients /
customers (Beverland et al., 2007a; Golder and Tellis, 1993; Kotler and Keller, 2006a) for B2B
brands has been noted in the relevant literature.
The previous discussion highlighted how B2B and B2C overlap may exist when
applying the service brand identity framework. Notwithstanding these points, elements of the
framework could be regarded particularly pertinent in B2B markets. For instance, personal
selling is considered especially important in B2B markets given the interpersonal and relational
nature of the buying process (Bendixen et al., 2004; Cretu and Brodie, 2007; Davis et al., 2007;
Lynch and de Chernatony, 2004; van Riel et al., 2005). Whilst not an item per se, the scale
encourages brand marketers to consider all elements of the marketing communications mix, of
which personal selling forms a part (item 107). When devising a communications strategy,
several scholars (Bendixen et al., 2004; Han and Sung, 2008) advocate B2B marketers’ consider
all stakeholders that might influence a customer’s perception. This point is considered as part of
the consistent communications dimension (item 118) in addition to the employee and client
focus dimension which encompasses three important stakeholder groups (employees, clients and
senior management). Following Bendixen et al. (2004), Han and Sung (2008) note how B2B
marketing communications focus on the organisation and not the various product lines given the
extensive range most B2B organisations have. This is consistent with the scale which measures
communication at the organisation and not individual service level (items 107 and 118).
In terms of human resource initiatives, the scale encourages those responsible for
building service brand identity to equip employees with skills that facilitate the acquisition and
deepening of organisation-client relationships via training (item 93). As the conceptual

328
framework chapter highlighted (Section 3.5.3) the relational nature of B2B purchases makes
such a bond particularly important with client-facing employees playing a pivotal role in such
relationships. The reason being client loyalty often lies with both the brand and the channel
members employed to deal with clients (Quiston, 2004) . The salience of this ‘human factor’ is
also made clear via employee element of employee and client focus dimension of the scale.
From a broader perspective, Kotler and Pfoertsch (2006a) note how B2B marketing
requires a holistic approach. Whilst the discussion above makes reference to individual
dimensions, it is clear that interactions exist which are represented by service brand identity
network (Figure 29 The Service Brand Identity Network). For this reason the rationale
underpinning the framework is considered consistent with that advocated in the B2B literature.
As the preceding discussion intimates, it may be an oversimplification to consider
applicability of the service brand identity framework within B2B markets alone. Guided by this
logic, adopting a position of degree and not absolutes may be more appropriate. The reason
being it is conceivable all five dimensions have, to varying extents, applicability in a B2C
service context. As the conclusions chapter highlights, exploring the magnitude or influence
each of dimension in a range of markets provides a useful avenue for future research.
6.7. Conclusion
This chapter has discussed the data analyses in the context of the literature. It has been
structured by the four research questions outlined during the introductory chapter of this thesis.

329
The first section of the chapter built on the construct dimensionality established in the
previous chapter to advance a service brand identity definition. This represented an
augmentation of the preliminary definition developed in the literature review (Section 2.4.3)
which was principally informed by the extant brand identity literature (Aaker, 1996a; Aaker and
Joachimsthaler, 2000; de Chernatony, 2006). By incorporating dimensions that emerged from
this service specific research into the literature based definition it was argued a specific service
brand identity definition had been developed.
With the construct defined, the second section of the chapter elaborated on the first to
discuss the domain of service brand identity which consisted of five dimensions. These were
corporate visual identity, brand personality, consistent communications, human resource
initiatives in addition to an employee and client focus. Of particular note was how the first three
of these five dimensions, albeit with slightly shortened or amended forms, were expected to fall
under the domain of service brand identity whilst human resource initiatives and employee and
client focus were not. At this stage considering a marketing culture and client relationship
management as potential antecedents of service brand identity as opposed to dimensions was
noted due to the salience of these constructs’ items in the final service brand identity scale. This
section, by default, has also addressed the third research question insofar service brand identity
measurement is the means to establishing the construct’s dimensionality.
The penultimate section of the chapter discussed the positive and significant influence
brand identity has on performance. At this stage the paucity of brand identity and performance
research was acknowledged. Consequently, the brand equity and performance literature was

330
considered a suitable surrogate given the pioneering nature of this research’s findings. At this
stage the relatively equal influence each service brand identity dimension had on brand
performance was also noted as were the correlated dimensions. This led to the position that
service brand identity should be viewed as a holistic and balanced construct.
The final section of the chapter considered service brand identity framework
applicability in the context of B2Cand B2B markets. At this stage it was recommended the
framework be considered in terms of degree and not absolutes. The reason being all dimensions
of the framework may have, to varying extents, more or less applicability in either market. This
was also highlighted as a potential avenue for future research.
Now that the analyses have been discussed in the context of the literature it is
appropriate to draw conclusions from this research in the next chapter.

331
7. CONCLUSIONS AND IMPLICATIONS
7.1. Introduction
The previous chapter discussed data analyses in the context of the literature and was
guided by the four research questions presented in the introduction. Consequently, the
discussion was concerned with service brand identity definition, measurement, dimensionality in
addition to assessing the construct’s influence on brand performance.
The objective of this chapter is to draw conclusions from this research and is structured
as follows. The opening section revisits the rationale and content of each chapter in order to
consolidate the research. The next section outlines the theoretical contributions this research
makes and is followed by managerial implications that materialise from this research. As with
all research, limitations exist. These are acknowledged before avenues for future research are
suggested. The final section of the chapter makes concluding remarks and reiterates this thesis’
major contributions. Notably, that service brand identity is a multidimensional construct which
has a positive and significant influence on performance in the UK’s B2B IT services sector.

332
7.2. Thesis Review – Content and Rationale
At this stage in the thesis it is helpful to revisit the previous chapters in terms of content
and rationale. The objective being to consolidate and unify this research before implications,
limitations and avenues for future research are considered.
The introduction chapter provided the foundations for this research. This was achieved
by outlining the research context and identifying a notable gap in the brand identity literature.
The former is associated with growing practitioner and academic interest in research that
explores the role brands play in driving business performance in addition to the paucity of B2B
service-based research. The latter relates to the existing brand identity literature operating
primarily in conceptual rather than empirical research domains whilst the generic nature of
current frameworks does not accounting for a specific goods or service context. Guided by
these issues four research questions were formulated which have underpinned this research:
- What is service brand identity?
- What are the dimensions of service brand identity?
- How do we measure service brand identity?
- Does service brand identity have a positive and significant impact on brand
performance?
With the context of the research considered and research questions developed the next
chapter reviewed the relevant literature. This helped clarify this thesis’ interpretation of key

333
conceptual terms such as brand and identity (brand, corporate and organisational), highlight
issues that exist with current brand identity frameworks and provide theoretical guidance with
brand performance measurement. By reviewing the existing brand identity literature it was also
possible to develop a preliminarily service brand identity definition which provided parameters
for exploring the domain of service brand identity in the theoretical framework chapter.
Grounded predominantly in the brand identity literature, the theoretical framework
chapter enabled this research to progress in four ways. First, the theoretical framework helped
bridge the literature review and the empirical research that followed. Second, it helped distil the
relevant literature. Third, the framework informed and structured subsequent scale development
by postulating a preliminary construct domain. Finally, the framework provided a conceptual
apparatus that guided the overall research effort in pursuit of answering the research questions.
In order to test the theoretical framework, the methodology chapter outlined how the
research instrument was developed and used to gather primary data. This process was primarily
guided by the scale development (e.g. Churchill, 1979, Anderson and Gerbing, 1988a) and
survey design (e.g. Dillman, 2000) literature. The result of this process was a postal survey
being administered to senior executives at organisations offering IT services in the UK.
With data collection complete, data analysis could proceed. The analysis chapter
outlined how a range of statistical techniques was employed to reveal service brand identity
dimensionality and assess the psychometric properties of the scale. These analyses highlighted
how service brand identity consisted of five dimensions. These were brand personality,

334
corporate visual identity, consistent communication, human resource initiatives in addition to
developing an employee and client focus. Application of the scale demonstrated the positive and
significant influence service brand identity had on brand performance in the UK’s IT service
sector. The balanced nature of the construct, in the context of brand performance, was also
noted at this stage.
The next chapter discussed the data analysis in the context of the literature. To structure
the discussion the four research questions presented in the introductory chapter were revisited.
Initially, a service brand identity definition, which augmented the literature based definition
with this research’s empirical findings was presented. Next, the domain of service brand
identity, and by default its measurement, in addition to the construct’s influence on brand
performance were discussed. Consequently, it was at this stage within the thesis that the original
research questions were addressed.
Having revisited the overall structure of the chapter, the managerial and theoretical
implications of this research, its limitations and outlining opportunities for future research can
be considered.
7.3. Theoretical Contributions
Whetten (1989) encourages scholars to address six interrogatives when trying “to
communicate the necessary ingredients of a theoretical contribution” (p. 490). The interrogatives
of primary concern are what, how and why. Who, where and when are considered to a lesser

335
extent. What relates to the variables or constructs of interest. How is concerned with the
relationships between constructs and brings sequence to the conceptualisation. Why relates to the
underlying logic or justification linking the what and the how. Who, where and when are
concerned with contextualising the research within a set of boundaries. Consequently, these six
interrogatives will be used to structure the theoretical contributions this thesis has made.
7.3.1. The ‘What’ of a Theoretical Contribution
This research makes several original ‘what’ contributions. These relate to paradigm
advancement, construct definition, measurement and dimensionality. Adopting a
multidisciplinary approach and advancing the brand performance literature via the adoption of a
balanced approach are also considered original theoretical contributions of this kind
Principally, this research has challenged and advanced the existing research paradigm
(Kuhn, 1996). This specifically relates to the extant brand identity paradigm where more
conceptually orientated models predominate (Aaker, 1996a; Aaker and Joachimsthaler, 2000; de
Chernatony, 2006; Kapferer, 2004). For the first time, this research moves the brand identity
research paradigm from a conceptual to an empirical domain in the form of a more specific
construct, that is, service brand identity.
Guided by the earlier stages of the scale development literature, this thesis presented a
preliminary service brand identity framework. This was subsequently augmented with
theoretically grounded and empirically derived dimensions to define service brand identity.

336
This is the first study to define a specific type of brand identity cognisant of its research context
informed by both theoretical and empirical considerations. This research context is also
intended to be cognisant of a B2B service market, although this may be more suitably
considered in terms of degree and not absolutes (cf: Section 6.6).
This study is the first of its kind to follow a rigorous and grounded approach to
developing a parsimonious, valid and reliable service brand identity scale. However, the scale is
a means to an end, with the end being the more significant contribution of revealing service
brand identity dimensionality in the UK’s B2B IT service sector. In simpler terms this relates to
articulating what service brand identity is with a specific concern for a B2B service context.
Guided by the domain sampling model and the existing scaling literature this research has, for
the first time, empirically shown that, in the UK’s B2B IT service sector brand identity is a
second order construct comprising of five dimensions.
The literature review highlighted how theoretical schools of thought for brand identity
have yet to be developed (Section 2.4.5). Consequently, to focus this thesis’ theoretical
contribution the rationale for supplementing the brand identity literature by drawing on the
tenets of the corporate identity literature’s interdisciplinary school (Abratt, 1989; Balmer, 1995,
1998; Birkigt and Stadler, 1986; Olins, 1978a; Van Riel, 1995) was provided (Literature Review
Section 2.4.6). At this stage the overlap between the organisational identity literature and the
behavioural tenet within the interdisciplinary school was also noted. Consequently, the domain
of service brand identity, as outlined in the Theoretical Framework Chapter was grounded in the
corporate, organisational and brand identity literatures. This approach has attempted to unify

337
the identity literature and reduce schisms that currently exist. Drawing on such an eclectic range
of disciplines to dimensionalise service brand identity highlights the multidisciplinary approach
this thesis’ has adopted which extends previous brand identity research. For instance, the final
scale draws on the semiology (Chandler, 2007; Noth, 1995); organisational studies (Dutton and
Dukerich, 1991, Dutton et al., 1994, Gioia and Thomas, 1996, Gioia et al., 1998, Albert and
Whetten, 1985), marketing culture (Webster, 1990, 1993, 1995), marketing communications
(Cheney and Christensen, 1999, Markwick and Fill, 1997), relational (Sin et al., 2005b) and
anthromophisation (Aaker, 1997; Freling and Forbes, 2005a,b) literatures. This approach also
attempted to bridge the schism between the organisational, corporate and brand identity
literature streams. This is considered an original contribution to knowledge because it is the
first time academic research has unified the three previously discrete identity literature streams
under the umbrella of service brand identity in the brand literature, let alone the B2B brand
marketing literature.
Finally, it is contended this thesis makes a nascent theoretical contribution to the brand
performance literature. By drawing on the financial, brand and human resource based literatures
the aggregated performance measure employed in this research facilitated a more balanced
approach to brand performance measurement (Ambler, 2003). Whilst it is appreciated the
dimensionality of the brand performance was not psychometrically assessed, measuring brand
performance in this tri-dimensional manner brings together previously discrete financial, brand
and human resource literature streams and so makes a theoretical contribution to the literature in
terms of articulating brand performance.

338
7.3.2. The ‘How’ of a Theoretical Contribution
‘How’ theoretical contributions are concerned with the relationships between constructs
or variables (Whetten, 1989). From this perspective several points should be noted. Primarily,
application of the service brand identity scale revealed the positive and significant influence the
construct has on brand performance in the UK’s IT service sector. This represents a original
contribution to knowledge and is considered a preliminary step towards a theory of service
brand identity and performance, that is, building service brand identity drives brand
performance.
The scale was applied in the context of a holistic and balanced brand performance
measure during this research. However, brand marketing researchers are now in a position to
assess the influence service brand identity has on specific variables such as brand loyalty, brand
awareness or premium pricing. Hence, the scale can be applied in more focused brand marketing
research contexts than applied here. However, application of the scale for theoretical
development should not be restricted to scholars conducting brand or marketing research. For
example, human resource researchers could assess whether service brand identity has a positive
influence on endogenous variables such as employee satisfaction or labour turnover. Similarly,
those working in finance will be able to assess the extent to which service brand identity drives
financially orientated metrics such as return on investment (ROI) or earnings before interest tax
depreciation and amortisation (EBITDA). Consequently, the scale’s application extends beyond
brand related research.

339
The previous chapter indicated that service brand identity is a balanced (cf: relatively
equal unstandardised factor loadings) and synergistic (cf: positive and significant correlations)
construct. Therefore, based on the data (Section 5.5.1) and guided by previous literature (Section
3.7.3) it was considered more appropriate to reconceptualise brand identity as a holistic and
integrated construct driven by symbiotic dimension relationships. This represents a paradigmatic
shift from the piecemeal or list-like manner conceptualisation initially by the preliminary service
brand identity framework (Section 3.4). By evolving from a list of boxes to a series of
relationships between boxes the framework progressed into the domain of theory (Whetten,
1989). Figure 29 represents this thesis’ reconceptualisation of service brand identity. This is
referred to as the Service Brand Identity Network.
Figure 29 The Service Brand Identity Network When considered in isolation the ideas expressed in this framework may be familiar to
most marketers. However, it is argued this framework makes an original theoretical
Consistent Communications
Human Resource Initiatives
Corporate Visual Identity
Employee and Client Focus
Brand Personality
Service Brand
Identity

340
contribution by postulating dimensions of service brand identity and bringing these dimensions
together in a way that has not been done before.
Several points should be noted when service brand identity is conceptualised in this way.
For instance, service brand identity is the central or higher order construct. The first service
brand identity building step requires the brand strategist to articulate the vision he or she has for
their brand. Not until this issue has been addressed can the brand strategist look to mobilise their
vision via all five dimensions. Furthermore, service brand identity should be considered as a
whole and not as parts. This logic is based on the positive / significant dimension correlations
and relatively equal factor loadings that emerged from the data. The framework represents these
dimension interactions along the perimeter and internal lines of the framework with the key
point being that all dimensions interact with each other. This is consistent with the view that a
holistic approach to brand marketing should be pursed in B2B markets (Kotler and Pfoertsch,
2006a). It is also important to appreciate the service brand identity framework integrates both
internal (employees, managers) and external (clients, upstream members of supply chain)
perspectives. This answers Alsem and Kostelijik’s (2008) call for the marketing paradigm to
follow strategy scholars such as Srivastava et al. (1998) and Sharma (1999) by reflecting
internal and external orientations in their work as opposed to focusing on the former. Finally, a
potential shortcoming of this framework may be the initial visual similarity it shares with
Kapferer’s (2004) identity prism. However, unlike Kapferer’s (2004) prism, it is contended the
inclusion of lines within the framework amplifies the importance of dimension interactions
which Kapferer’s (2004) prism does not appear to make. Similarly, Kapferer’s (2004)
framework has not been empirically validated.

341
Finally, the development of the service brand identity framework has been couched
within the broader service dominant logic paradigm (Vargo and Lusch, 2004a). Whilst a central
tent of this burgeoning paradigm concerns the co creation of value (Lusch and Vargo, 2008;
Vargo and Lusch, 2006) this research has dovetailed with several characteristics key to the
service dominant ‘mindset’ (Lusch and Vargo, 2008), notably a primary concern for the
exchange of intangibles, the predominant use of operant resources (competences or knowledge)
and a relational focus. To the best of the author’s knowledge, this is the first time the brand
identity literature has been considered in the context of this growing paradigm.
7.3.3. The ‘Why’, ‘Who’, ‘Where’ and ‘When’ of a Theoretical Contribution
The Theoretical Framework chapter (Section 3.6) provided the rationale for
hypothesising that service brand identity drives brand performance (i.e. why). The who, where
and when elements of Whetten’s (1989) work play a less pivotal role in terms of this thesis’
theoretical contributions. However, executive level research (i.e. who), tends to be sparse given
the issues surrounding access and adequate response rates (Cycyota and Harrison, 2002, 2006).
Similarly, the paucity of B2B service branding research has been noted in the literature (Roberts
and Merrilees, 2007). This research can be regarded as making a novel theoretical contribution
to this field in terms of the where.

342
7.4. Managerial Implications
The previous section of this chapter outlined the theoretical contributions this research
has made. A number of managerial implications materialise which will now be discussed.
7.4.1. Dimensions of Service Brand Identity
Before managers can build and manage service brand identity they need to know what
dimensions make the construct manifest. This research provides clear guidance on what
constitutes service brand identity (dimensions) and what activities (items) comprise those
dimensions. Consequently, as a result of understanding what brand identity is, when managers
embark on a service brand identity building programme they need to bear in mind a broad range
of activities. Considering brand identity as being synonymous with visual identity alone would
be an oversimplification. Therefore, in no particular order (due to the relatively equal factor
loadings) managers need to pose and find answers to questions such as: Are we focusing
adequately on our employees’ and clients’ needs? What type of brand personality do we wish to
develop? How consistent is our marketing communications? How can we use the font, logo and
other visual identity aids as part of our overall brand identity? What human resource initiatives
do we have in place to support our desired brand identity? Consequently, the framework’s
dimensionality provides managers with the conceptual apparatus to delineate service brand
identity whilst the underlying scale provides managers with specific activities to structure and
mobilise their early thoughts around each dimension.

343
7.4.2. The Nature of Service Brand Identity
When building service brand identity, managers need to consider the symbiotic and
balanced nature of the construct. The positive and significant dimension correlations indicate
how dimension symbiosis exists. Whilst such correlations highlight how dimensions
synergistically ‘feed’ off one other it is important managers consider the adverse effect of
correlated dimensions. The reason being a neglected brand identity dimension could act as a
millstone and burden other dimensions. It is also important managers acknowledge, in the
context of driving brand performance, that each dimension makes a positive, significant and
relatively equal contribution to making the brand identity manifest. This implies service brand
identity is a balanced construct where each dimension should receive equal attention and
resource. Consequently, more informed brand managers will adopt a holistic rather than
atomistic brand identity approach due to the construct’s synergistic and balanced properties.
Therefore, those responsible for managing service brand identity need to carefully orchestrate all
five dimensions to drive brand performance. This calls for managers to plan for the sum and not
just the parts when building service brand identity.
7.4.3. Service Brand Identity Audit
The scale can be used by managers as a brand identity audit or diagnostic tool. Such an
approach brings several benefits. For instance, using the scale in this way enables brand
managers to answer the rudimentary question of “where are we now?” by assessing their current
brand identity profile. Also, by identifying the current identity profile managers can assess how

344
far away they are from their desired service brand identity, or, in other words ‘where would we
like to be?’ Figure 30 conceptualises these two points by illustrating how a hypothetical
organisation needs to improve all areas of its service brand identity management if it is to reach
its desired profile and in particular develop more of an emotional connection by developing a
unique, positive and strong brand personality.
0123456
7Brand Personality
Consistent Communications
Employee and Client FocusHuman Resource Initiatives
Visual Identity
Current Brand Identity Profile (average of seven point scale)Desired Brand Identity Profile (average of seven point scale)
Figure 30 Profiling Brand Identity – An Illustrative Example
By using the scale in a diagnostic manner, managers will be able to track service brand
identity dimension movements over time. This allows those responsible for brand marketing to
develop an understanding of how employees perceive the organisation’s brand identity. Such
longitudinal research can then provide a starting point for objectively-based corrective action
such as internal marketing to raise levels of service brand identity and awareness.
Consequently, the scale can be used to explore the organisation’s current brand identity profile

345
in the context of strategic objectives whilst providing an impartial foundation for brand identity
change. The parsimony of the scale is intended to facilitate such practical applications.
The previous section outlined how the scale could be used to audit an organisation’s
service brand identity. However, such an approach could be regarded as introspectively focused.
Potentially, a third party that specialises in brand measurement could independently track brand
identity profiles for key brands. This would allow the organisation to benchmark their brand
identity management against its competitors. However, obtaining such benchmark data could be
problematic. For instance, measurement would need to take place on the assumption that all
organisations consider brand identity in a similar way so comparisons could be made. This could
be counter productive given brands (Hoeffler and Keller, 2003b) and more specifically brand
identity (Ghodeswar, 2008) aim to differentiate an organisation’s offer.
7.4.4. Brand Identity Implementation
In order to implement brand identity managers should, amongst other things, consider
organisational structure, human resource implications and management of change.
When building service brand identity, senior managers need to ensure they have a
suitable structure in place to allocate and marshal resources effectively. Figure 31 provides a
potential, albeit somewhat simplified, example.
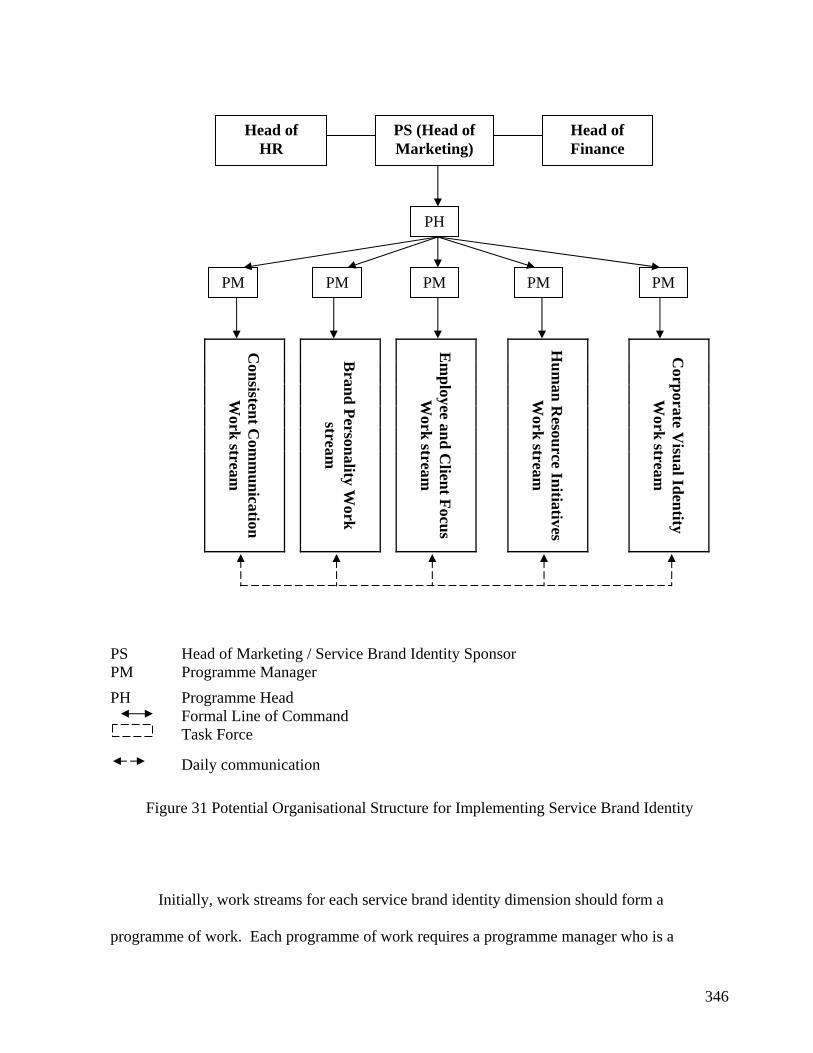
346
Consistent C
omm
unication W
ork stream
Brand Personality W
ork stream
Em
ployee and Client Focus
Work stream
Hum
an Resource Initiatives
Work stream
Corporate V
isual Identity W
ork stream
PS Head of Marketing / Service Brand Identity Sponsor PM Programme Manager PH Programme Head Formal Line of Command
Task Force
Daily communication
Figure 31 Potential Organisational Structure for Implementing Service Brand Identity
Initially, work streams for each service brand identity dimension should form a
programme of work. Each programme of work requires a programme manager who is a
PS (Head of Marketing)
Head of HR
Head of Finance
PH
PM PM PM PM PM

347
member of the (brand) marketing department. This programme manager is responsible for the
management of all work streams within that dimension ranging from strategic to operational
issues. Whilst Figure 31 may appear somewhat bureaucratic, it should be noted daily
communication between members of each programme of work should be encouraged to
facilitate activity alignment and consistent service brand identity execution. This is indicated by
the dotted line between each programme of work. For instance, those responsible for consistent
communications should ensure their work conveys the visual identity and brand personality in
accordance with colleagues’ views from the relevant departments. This is intended to bring the
holistic nature of service brand identity to life in an operational way as was indicated by the
previous analysis (Table 38).
Next, a task force should be formed comprising of all programme managers that report to
a programme head who has overall responsibility for managing the task force. The task force
needs to attend all service brand identity related meetings, irrespective of dimension focus, to
ensure a group of people have, at all times, an overview of service brand identity building
activities. Finally, this task force programme head should report to the head of (brand)
marketing, or another marketing project sponsor that has board level access, to ensure the
execution of each programme is consistent with the desired and envisioned service brand
identity. If information needs to be communicated to the service brand identity team it should
be disseminated via the programme head to the programme managers who in their turn share the
information within their allocated dimension with intra-dimension employee communication on
more operationally-orientated issues being encouraged as outlined above. By adopting this
approach the task force should have an overall view of each service brand identity dimension

348
work stream whilst being in regular contact, via the programme head, with the ultimate brand
identity sponsor. The project sponsor should also collaborate closely with other departmental
heads to ensure strategic and functional alignment. For illustrative purposes, Figure 31 refers to
HR and Finance due to the pivotal role they play in service brand identity development and
measurement respectively. This should not imply marketers should not communicate with other
departmental heads who may have accountability for other areas such as quality compliance or
procurement for example.
This structure should not be regarded as temporary, but as an ongoing strategic activity
where the work stream deliverables are fine tuned in accordance with the desired service brand
identity. It is appreciated that in smaller organisations this type of mildly bureaucratic structure
may not be appropriate. However, similar principles apply insofar senior management should
allocate work streams in line with dimensions in addition to establishing clear channels of
communication and accountability between those delivering the tasks and senior management.
Finally, this structure should not operate in a vacuum. As the brand performance section of the
conceptual framework chapter highlighted, a balanced approach to service brand identity
management is advocated by this research. This necessitates strong cross functional ties between
the project sponsor and his or her equivalent within finance and human resources department to
facilitate functional alignment. Consequently, Figure 31 could be extended to incorporate a
dotted line between the project sponsors his or her finance and human resource peers.
From a service brand identity implementation perspective, several human resource-
related managerial implications arise from this research. The reason being human resource
initiatives constitute a dimension of brand identity in addition to employees forming a salient

349
component of another dimension which were labelled employee and client focus. Whilst
marketing and human resource functional overlap is common for service brands (Gronroos,
1984; Heskett, 1987), human resource managers tend to be comparatively unaware of strategic
marketing activities (Harris and Ogbonna, 2001). Consequently, if organisations opt to build a
service brand identity as guided by the above framework, it is crucial service brand marketers
take the initiative to build stronger cross functional ties with their human resource colleagues.
Adopting this approach provides support for Webster’s (1992) view where marketing decisions
will be increasingly related to other functional areas. More specifically, brand marketers should
encourage human resources to recruit individuals who hold values consistent with the desired
service brand identity. The reason being values inform behaviour (Meglino and Ravlin, 1998;
Rokeach, 1973). Recruiting potential employees with brand-congruent values should help
propagate the desired brand identity. Identification of values can potentially be obtained via
group based exercises, in depth interviews and psychometric profiling. However, the
importance of marketing and HR alignment does not end with recruitment. Indeed, the vision for
the organisation’s brand (i.e. service brand identity), should be conveyed to all new employees
as part of their induction. Furthermore, the five brand identity dimensions should act as the
basis for new and current employee training so that employees’ skills sets continue to support
the desired service brand identity. For example, graphic designers may need training on how to
deliver a consistent brand experience across emerging media platforms (cf: visual identity).
Additionally, to encourage behaviour that is consistent with the desired service brand identity it
is important reward and employee behaviour are aligned. This position is consistent with
Ginsburg and Miller (1992) who argue for the value employees deliver to be assessed through
reward. Similarly, Bostrom and Isberg (2009) noted how for corporate brands there should be

350
consistency between employee performance evaluation and behaviour. Demonstrating brand
identity-consistent behaviour is particularly important for service brands and could be monitored
via questions such as “Please provide examples of when you have focused on meeting our
clients’ needs? How have your behaviours supported our [trait] brand personality?” at annual
performance reviews. Consequently, if organisations aim to implement and manage a brand
identity as guided by the above framework it is crucial brand marketers build strong working
relationships with their human resource colleagues. Such relationships will allow brand
marketers to proactively engage in human resource initiatives that support the desired service
brand identity ranging from recruitment to performance appraisal. The development of such
cross functional ties calls for senior managers to recruit and train marketers so they develop a
deeper understanding of human resource initiatives at their organisation with vice versa
applying. This point is consistent with the view that for corporate brands, which predominate in
service markets, functional alignment between marketing and human resources is particularly
important (Balmer, 1995; Davies and Chun, 2006; Davies et al., 2003; de Chernatony, 1999,
2006; King, 1991; Wilson, 2001; Zeithaml et al., 2006).
If managers move towards a more metric-based branding approach, resistance to such a
change may materialise from some employees. The reason being measurement equates to
accountability. For example, if human resource initiatives or visual identity consistently score
poorly on the scale they may be prioritised for corrective action. Hence, managers would be well
served to consider informed human resource strategies that facilitate change such as
involvement, participation, delegation and so forth. At a more fundamental level, such change
may require a senior management effort to inculcate values consistent with a measurement

351
culture so such behaviour can take root within the organisation. Once more, recruitment,
training and appraisal play a crucial role in mobilising and reinforcing this change.
7.4.5. Service Brand Identity and Brand Performance
The previous chapter highlighted the positive and significant influence service brand
identity has on performance. This empirical finding supports the anecdotal and intrinsically
appealing notion that service brand identity drives brand performance. Consequently, by
investing in brand marketing activities that span all five service brand identity dimensions,
organisations should experience enhanced brand performance.
Whilst some managers may wish to assess which dimensions of brand identity have the
most significant impact on performance and then allocate resources accordingly, such an
approach is not advocated here for the reasons outlined above. Notably, service brand identity is
a highly symbiotic, and in the context of performance, balanced construct. By focusing on
certain dimensions at the expense of others, managers may fail to capitalise on the construct’s
synergistic characteristics. Whilst in isolation a given dimension may not have a positive
influence on performance it may be positively correlated with all other dimensions which
creates an argument for considering this dimension (cf: Hair et al, 1998). Consequently, as
outlined earlier, to maximise brand performance a holistic management approach is advocated.

352
7.4.6. Nature of Measuring Brand Performance
Managers responsible for predominantly service-based brands would be well served to
take a balanced approach to brand performance measurement. This approach encompasses, but
is not limited to financial, brand and employee based measures. Whilst financial measures are
useful for analysing previous activities they are retrospective and brand managers cannot be
guided by history alone. Conversely, brand related measures are strategically orientated and
provide an indication of future cash flows (Ambler, 2003). Employee based measures are
particularly relevant to service brands due to the pivotal role employees play in service brand
delivery (Ashford and Mael, 1996; Balmer, 1995, 1998; Balmer and Greyser, 2003; Berry and
Seltman, 2007; Brodie et al., 2009; de Chernatony and Segal-Horn, 2004; Harris and de
Chernatony, 2001; Hulberg, 2006; Kennedy, 1977). Consequently, such an approach can be
considered ‘balanced’ from three perspectives. One relates to the use of hard (financial) and soft
(brand / employee) metrics, another concerns internal (employee) and external (brand and
financial) measures whilst the final element relates to short (financial) and long term (brand /
employee measures). This position is consistent is broadly consistent with de Chernatony and
Cottam’s (2008) advice, who when discussing measurement at financial service brands, note
“managers are advised to avoid this trap [i.e. focusing purely on financial measures] by ensuring
their organisational goals encompass a variety of both soft and hard, short- and long-term
targets, reflecting a more holistic approach to organisational success” (p. 20). As a result of
taking a broader, balanced and more strategic approach to brand performance measurement
service brand managers can develop deeper market insights than if shorter term financial
measures were used in isolation.

353
Whilst this research advocates a balanced approach, the metrics that have been employed
during this research should not be considered a panacea. Organisations will require, at differing
moments in time, contextually relevant measures that align with their organisation’s strategy and
objectives (Ambler, 2000b, 2003). This is consistent with Aaker (1996b) who outlines how
different measures work for different organisations. Consequently, the decision to use certain
metrics should be guided by a balance of practicality and organisational objectives.
7.4.7. Strategic Marketing
The final managerial implication relates to broader strategic issues surrounding service
brand identity. For example, application of the scale may reveal a given organisation scores
consistently well with regards to its brand personality. This could provide a platform for an
organisation to reach out to their clients with a strong emotional message as the basis for brand
differentiation. Such an emotionally orientated differentiation could be utilised and built upon
in subsequent brand marketing activities or even brand extensions. Consequently, once an
organisation understands its service brand identity profile via application of the scale, managers
could use these findings to dovetail the brand identity building effort with broader strategic
marketing initiatives. Finally, in terms of broader portfolio management, organisations could
use the scale to identify the extent to which certain SBUs are aligned with the wider
organisational perception of brand identity. Once established, this could provide the basis for
corrective action in the form of recruitment, training or performance appraisal.

354
7.5. Limitations
The opening section of this chapter revisited the content and rationale for the preceding
chapters. The theoretical contributions and managerial implications of this research were then
outlined. As with all research, limitations exist which should not be ignored (DeVellis, 1991).
Consequently, potential limitations of this research will now be discussed in two parts. The first
group of limitations relates to brand identity, brand performance and brand identity-performance
whilst the second is concerned with research philosophy and methodological issues.
7.5.1. Brand Identity, Brand Performance and Brand Identity-Performance
The analysis chapter highlighted how service brand identity is a multidimensional
construct which has a positive and significant influence on brand performance in the UK’s B2B
IT services market. Figure 32 highlights how this research has focused on the UK’s B2B IT
services market.

355
Figure 32 Conceptualising the Research Context
However, further research in other sectors is needed before these findings can be
generalised to other contexts (markets, sectors or countries). Questioning the plausibility of
generalising this research’s findings is consistent with Leone and Shultz (1980) who outline the
elusive nature of marketing generalisations by noting “There are no universal generalizations in
marketing” (p. 12). Consequently, caution should be exercised if these findings are generalised
beyond the UK’s B2B IT services sector.
In terms of the scale, the Analysis chapter (Section 5.4.3.4) highlighted how a potential
brand personality and consistent communications discriminant validity issue may exist.
However, as Section 5.4.3.4 outlined there is no theoretical reason for assuming these two
constructs are not distinct but that the issue may lie with the items used to scale them.
Furthermore, two other tests provided empirical evidence that the two constructs are discrete.
Rest of World
IT services
Other sectors B2B B2C
UK

356
Consequently, guided by theoretical and empirical rationale, this issue was acknowledged but
considered a minor discriminant validity problem.
The scope of the final service brand identity scale could also be considered quite
restricted. For example, functional aspects of brand (Barwise and Meehan, 2004; de Chernatony,
2006; Jones, 2000) have not been considered. These could relate to the more practical elements
of service brand delivery such as consistency, responsiveness, meeting service level agreements
and so forth. Whilst such elements may not form an explicit part of service brand identity, an
organisation’s inability to effectively manage such ‘hygiene’ factors could escalate and prevent
clients from experiencing the more emotional aspects the brand is built around if they are to
disengage from the branding process at a early stage. For example, a software development
house associated with quality and sophisticated functionality could soon harm such an
association if its software continuously froze and clients could not obtain prompt support.
From a brand performance measurement perspective, it should be acknowledged the
subjective and summed approach employed by this research has inherent limitations. Whilst
previous literature highlights the strong association between objective and subjective measures
(Dawes, 1999; Jaworski and Kohli, 1993; Pearce et al., 1987; Robinson and Pearce, 1988;
Venkatraman and Ramanujam, 1986) subjective scales are particularly susceptible to Type I
errors which can artificially inflate responses (Cano et al., 2004). In terms of a summed
performance measure, aggregation can result in less precise population estimates due to smaller
standard errors (Iacobucci et al., 2007). Furthermore, Jarvis et al (2003) noted summed
measures can result in “inconsistent structural estimates of the relationships between the
construct and other latent constructs because it ignores the effect of measurement error” (p.

357
202). Whilst the logic for employing a subjective and summed approach was provided (Sections
4.5.5.1 and 4.5.5.2 respectively) the brand identity-brand performance finding should be
couched within the context of these specific limitations.
B2B markets formed the secondary context of this research. However, the literature used
to ground this research was based on B2C research given the paucity of B2B (Han and Sung,
2008), let alone B2B services branding literature (Davis et al., 2007; Roberts and Merrilees,
2007). This may raise questions about the suitability of the literature used to ground the
conceptual framework (Chapter 4) given the unique characteristics of B2B markets (Cretu and
Brodie, 2005; Kotler and Pfoertsch, 2006b). However, this approach was grounded in the logic
of Elaboration Theory (Lee, 1999) which involves the application and extension of existing
theory in new settings or contexts. Adopting this approach is consistent with Webster and Wind
(1972) who suggested modifying consumer research models for the business to business sector.
Given this background, the paucity of B2B literature available to ground this thesis’ framework
was regarded as causing a limitation as opposed to the approach itself.
The literature review highlighted the positive influence each dimension, within the
domain of brand identity, had on brand performance. However, two of these five dimensions did
not emerge from the data. This could question the theoretical roots of this hypothesis given ‘like
and like’ are not being compared.
In terms of brand identity-performance, these research findings imply causality from the
latter to the former. However, this can only be inferred but not unequivocally stated as
longitudinal data was not used. As a result, this research, strictly speaking, poses the question of

358
“Does an increase in service brand identity enhance brand performance or vice versa?”
Consequently, the results provided here cannot be regarded as proof of causality but as lending
preliminary empirical support for potential brand identity → performance causality.
Furthermore, the statistical nature of the results still prevents managers from addressing key
board level issues that plague marketing professionals. For example, what level of return will be
delivered from a given level of service brand identity investment?
Finally, it could be argued several of the measures used in this research, with the
exception of customer satisfaction, are organisational and not client centric. Metrics that
measure how effective the organisation has been at helping clients save time, money or effort in
addition to simplifying the decision making process may be more insightful (Mitchell, 2007).
The majority of the measures employed in this research tend to be concerned with the
organisation’s needs and so can be considered somewhat narcissistic (Mitchell, 2008a,b) . Do
net profit, market share (by revenue), loyalty and brand awareness really matter to clients? This
approach, paradoxically, mitigates the cornerstone of the marketing discipline in the form of the
marketing concept which has an overriding need of meeting customers’ needs. Wouldn’t it be
better to measure the cause (e.g. time saved) and not the effect (e.g. net profit)?
7.5.2. Research Paradigm and Methodology
Several limitations materialise as a result of the research paradigm adopted and
methodology employed. For example, the current research approach has resulted in a
predominantly deterministic service brand identity framework. Such an ontological position fails

359
to account for the interactive nature of brand where consumers do things with brands (Lannon,
1992). This view echoes Holt (2002) who considered brand in an iterative and dialectical
context and those of Vargo and Lusch (2007; 2004a) where value is co-created. However, the
framework developed here fails to account for this plausible perspective. Furthermore, the
positivistic position adopted by this research has inherent philosophical limitations. For
instance, it is debatable if observations that are not ‘theory laden’ be made (Connelly, 2004; Gill
and Johnson, 2002) whilst it is doubtful whether reality is external to the mind, objective and
measurable (Hudson and Ozanne, 1998). Similarly, the plausibility of imposing the external
logic of natural science laws on social science phenomena who have their own internal logic and
decision making processes is contentious (Gill and Johnson, 2002). Finally, considering human
beings as passive or reactive to a given stimulus could be considered somewhat unrealistic
(Hudson and Ozanne, 1998). As Gill and Johnson (2002) note “People perceive, interpret and
attach meaning to various stimuli they might experience.” (p. 62). Consequently, the
philosophical assumptions that underpin this research could be challenged on a number of
epistemological, ontological and axiological grounds.
From a methodological perspective, this research may have benefited from employing
qualitative methodologies at certain stages. For example, a qualitative stage could have been
used to generate additional items when sampling the domain of service brand identity. Adopting
this approach could potentially have reduced measurement error. As Ping (2004) notes
“…focus groups can reveal the specific language the study population uses to communicate
regarding these constructs. This information is then used to improve the phrasing of the item
stems, and thus reduce measurement error.” (p.134). Consequently, adopting such an approach

360
would have facilitated more accurate instrument calibration. However, this step was not taken
for the reasons outlined earlier in this thesis (Section 4.4.2). Notably, epistemological concerns
surrounding this element of Churchill’s (1979) paradigm in addition to the large number of
items (n=119) that had already been culled from existing scales and literature which may have
affected the quality and quantity of expert panel response. Finally, whilst the process followed
in this research is largely consistent with the existing scaling literature (DeVellis, 1991;
Netemeyer et al., 2003), it is debatable if quantitative methods alone can really provide
insightful findings. As Blackston (1993) outlines:
“In the development of scales via Factor Analysis, for example, outlying statements are
systematically eliminated; what remains are statements which represent a sort of lowest
common denominator. Using this process, we must often discard the very things that
would allow us to see what makes a brand really different or unique.”
(p. 114)
Hence, by using only quantitative methods some research richness may have been lost.
Finally, from a sampling perspective, a list of all UK based IT service organisations
could not be obtained. These included sole traders, organisations missing from the sampling
frame. Such coverage ‘error’ (Dillman, 2000) or sample selection bias may compromise
population inferences (Tomaskovic-Devey et al., 1994). However, it is contended here this is a
practical limitation that all research operates within.

361
Consequently, it can be seen how several limitations surround this research. However,
these should not detract from the significance of the findings but provide a platform for future
research.
7.6. Future Research
The opening section of this chapter reviewed the content and rationale of previous
chapters to consolidate this research. The theoretical and managerial contributions made were
discussed with potential limitations being highlighted. The final section of this chapter will
explore opportunities for future research.
The service brand identity scale provides the platform for longitudinal studies within the
same research context (sector, market and country). In terms of service brand identity
dimensionality, such replicative studies would enable researchers to assess the stability of the
proposed scale and whether service brand identity is a balanced construct as this research has
indicated. Furthermore, subsequent research could explore whether cultural and relational items
form a notable part of the final scale as they have done in this study. This would reveal whether
such constructs can be considered antecedents of service brand identity as highlighted in the
Discussion chapter (Section 6.4). Such research would facilitate a deeper understanding of the
focal construct’s, that is, service brand identity’s nomological net (Cronbach and Meehl, 1955).
Longitudinal studies could also determine service brand identity and brand performance
causality and so establish if the former drives the latter. Consequently, longitudinal research
would overcome several limitations of this study (Section 7.5).

362
Scholars may also wish to broaden the scope of this research by looking to replicate the
findings beyond the current research context. The reason being replication of empirical research
plays an important role in developing robust and generalisable brand marketing explanations
(Kocak et al., 2007). Figure 32 (p. 355) conceptualised this research as being focused on IT
services organisations operating in the UK B2B markets (dark cube). This context could be
extended in a number of combinations along sector, market or country dimensions via
application of the service brand identity scale. This relates to different cubes within Figure 32.
By replicating the findings, small steps towards the holy grail of marketing ‘generalisations’
may be taken. This approach is consistent with Leone and Schultz (1980) who note:
“replication is the key to generalization for without it, in the broadest sense, we have no
corroboration of research results. We are left with one-shot studies that represent
historical facts. Only by extending findings to other data sets do we perceive the
generality of marketing relationships” (p. 15).
Hence, replication of the current study in different research context is regarded as a step
towards assessing the generalisability of the scale’s dimensionality and the service brand
identity–performance effect. Simultaneously, such research would assess the extent to the
current service brand identity definition generalises to other sectors as a result of the dimensions
that emerged from the data. However, it is crucial subsequent research validates the scale using
exactly the same procedures. The same exploratory factor and structural equation modelling
estimation methods should be used given the range of findings different estimation methods
produce.

363
Within the organisational identity literature calls have been made (Brown et al., 2006),
and to an extent, small steps been taken, to initiate debate surrounding organisational and
corporate identity literature cross fertilisation (Balmer, 2008; Cornelissen et al., 2007; He and
Mukherjee, 2009b). However, no such steps have been taken within the brand identity
literature. As a result, subsequent brand identity scholars could look to adopt, as this research
has done, a more multidisciplinary approach which draws on both the organisational and
corporate identity literatures. This may result in an end for the brand identity orphan and provide
a fruitful ground, and indeed encouragement, for subsequent theoretical brand identity
development that is interdisciplinary in nature.
In order to develop this research, future studies could control mediating variables as part
of the structural model. Following the strategy literature, potential variables could include
organisational structure (Burns and Stalker, 1961), resources (Barney, 1991), regulatory
restrictions (Denison and Mishra, 1995) and industry structure (Porter, 1980). Incorporating
such variables into the model would allow researchers to assess the stability of the scale and the
influence service brand identity has on brand performance under a range of conditions. It would
also create a more realistic context for the model to be estimated within.
This research has developed a model which provides adequate levels of data fit (cf: Hu
and Bentler, 1995; Browne and Cudeck, 1993). However, within the structural equation
modelling literature alternative models may provide equally acceptable fit (Bollen, 1989). An
alternative model may consider dimension causality. Consequently, considering the relationship
between service brand identity dimensions could provide a fruitful avenue for future research.
For example, do consistent communications help transmit brand personality? Do human

364
resource initiatives feed into or facilitate an employee and client focus? Currently it is unclear if
the dimensions are related in this causal way. If such relationships are explored it is essential
they are grounded in theory to prevent the findings from capitalising on data set chance (Byrne,
2001; MacCallum, 1995; MacCallum et al., 1992; Markland, 2007). Identifying such causality
would help managers sequence the development of their brand identity building programmes
and understand the formative drivers of service brand identity.
Whilst the research has focused on service brand identity scale development, subsequent
research could develop a valid, reliable and parsimonious brand performance scale. Consistent
with the logic that has guided this research, a more balanced approach to brand performance
measurement is advocated. Consequently, such research would build upon Ambler’s (2003)
view who encouraged the use of financial, brand and employee based measures and the logic
that no single measure fully captures the depth of brand performance (Lehmann et al., 2008). In
a similar manner to service brand identity the causality of brand performance could also be
causally explored. For example, do employee measures drive both brand and financial
performance with brand also driving financial measures? Figure 33 conceptualises this approach
which Ittner and Larcker (2003) refer to as Value Driver Maps. Please note, consistent with the
scaling literature, each dimension would have multiple indicators.
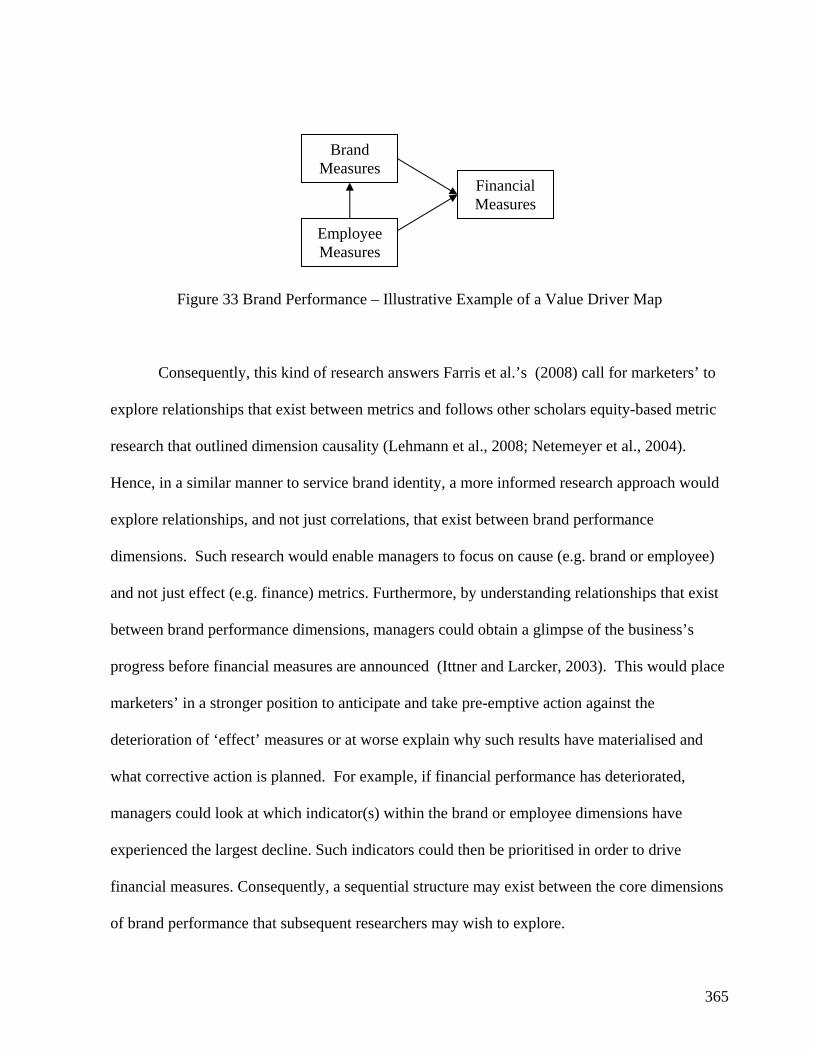
365
Figure 33 Brand Performance – Illustrative Example of a Value Driver Map
Consequently, this kind of research answers Farris et al.’s (2008) call for marketers’ to
explore relationships that exist between metrics and follows other scholars equity-based metric
research that outlined dimension causality (Lehmann et al., 2008; Netemeyer et al., 2004).
Hence, in a similar manner to service brand identity, a more informed research approach would
explore relationships, and not just correlations, that exist between brand performance
dimensions. Such research would enable managers to focus on cause (e.g. brand or employee)
and not just effect (e.g. finance) metrics. Furthermore, by understanding relationships that exist
between brand performance dimensions, managers could obtain a glimpse of the business’s
progress before financial measures are announced (Ittner and Larcker, 2003). This would place
marketers’ in a stronger position to anticipate and take pre-emptive action against the
deterioration of ‘effect’ measures or at worse explain why such results have materialised and
what corrective action is planned. For example, if financial performance has deteriorated,
managers could look at which indicator(s) within the brand or employee dimensions have
experienced the largest decline. Such indicators could then be prioritised in order to drive
financial measures. Consequently, a sequential structure may exist between the core dimensions
of brand performance that subsequent researchers may wish to explore.
Employee Measures
Brand Measures
Financial Measures

366
Scholars such as Burmann and Riley (2008) suggest the need for brand identity and
image to be aligned. The logic being a brand that is aligned or in synchrony with its target
audiences should perform better than one that is not. As a validated measure of brand identity
has been developed by this research, such work can potentially proceed. However, due to the
internal orientation of the service brand identity scale, existing items would need to be rephrased
in a client focused brand image way. Table 45 illustrates this point for the employee and client
focus dimension.
Table 45 Rephrasing Service Brand Identity Items as Brand Image Items
Current ‘brand’ side scale items (Brand Identity)
Proposed ‘client’ side scale items (Brand Image)
Our employees will help clients in a responsive manner
<brand X> helps clients in a responsive manner
Our organisation makes an effort to discover our clients' needs
<brand X> makes an effort to discover our needs
Our organisation responds to our clients' needs
<brand X> responds to our needs
Our top management is committed to providing quality service
<brand X’s> top management is committed to providing quality service
Our organisation treats each employee as an essential part of the organisation
<brand X> treats each employee as an essential part of the organisation.
If this research is pursued several issues must be considered. For instance, when current
service brand identity items are rephrased in this way, participants external to the organisation
may not be able to answer some questions. The final question from Table 45 illustrates this
point. Furthermore, the psychometric properties of the brand image items would need to be
assessed and there is no guarantee the same factor structure would emerge from the data. This
creates the following dilemma. Is it possible to mirror brand identity / image research in a
psychometrically sound way or should researchers proceed with a potentially flawed brand
image measure? Additionally, the rationale for conducting this research must be considered. Is

367
alignment really that important? For instance, it is debatable if Burberry’s brand marketing team
appreciate their caps and scarves being ‘de rigour’ for ‘chavs’. This position has been borne out
by the brand withdrawing these products from the market (Marketer, 2009). However, this
does not appear to have adversely affected their brand’s premium brand image, or more
accurately reputation, given it has been built over a period of time. Finally, whilst it is important
marketers’ incorporate clients’ needs into their brand identity building efforts, if a brand strictly
follows customers’ needs it is possible they may develop a brand identity similar to their
competitors. This results in a circular logic where the aim of building brand identity defeats
itself. Such a position is consistent with Alsem and Kostelijik’s,(2008) who argue for a new
‘balanced’ marketing paradigm that encompasses, in a similar manner to the strategy literature
(Sharma, 1999; Srivastava et al., 1998), both the organisation’s internal competence and vision
(i.e. brand identity) in conjunction with market needs as opposed to focusing primarily on the
latter. This view also finds wider support in the literature where scholars such as Baker and
Sinkula (1999) note “breakthroughs do note always come from reacting to the market as it is”
(p. 1999). O’Cass and Ngo (2007b) make a similar point where market-driving or innovative
cultures were identified as having a significantly stronger effect on brand performance than
market-following or market orientated behaviours. Consequently, the paradigm of following
and meeting clients’ needs at the expense of following an internally orientated market vision
may need to be revisited, or at least, the balanced re-addressed in the light of these scholars’
perspectives.
Recent developments within the literature point to the growing importance of full
sensory branding. For example, Lindstrom (2005) notes how brands tend to focus on sight and
sound whereas those that focus, synergistically, on all five senses have the greatest opportunity

368
to develop an emotional connection. Similarly, Goldkuhl and Styven (2007) note the particular
valuable role scent plays in tangiablising, enhancing and differentiating service based offerings
whilst scholars such as Bartholme and Melewar (2009) are considering auditory identity
management. Consequently, future brand identity research that looks to encompass such
innovative perspectives would be welcome.
The importance of culture, in its various forms within the B2B literature was highlighted
in the literature review. It was notable how such theoretical development or research has yet to
occur in the B2B literature. Subsequent scholars may wish to explore what types of culture
facilitate the development and execution of service brand identity in addition to forms of culture
that drive brand performance in B2B markets. The relative importance of types of culture
supporting B2B service or goods brands could also be explored.
From a methodological perspective, opportunities for subsequent scale development
research exist. For example, comparative fit indices were particularly sensitive to different
estimation methods (cf: Sugawara and MacCallum 2003; La Du and Tanaka, 1989; Hu and
Bentler, 1998). This raises the question of ‘were the lower GLS comparative fit indices a
function of under estimation vis-a-vis MLE or vice versa?’ In a similar manner the
susceptibility of indices such as the Bollen Stine p value (Byrne, 2001) and AGI / GFI
(Anderson and Gerbing, 1984; Bollen, 1990; Hu and Bentler, 1995, 1998; La Du and Tanaka,
1989; Marsh et al., 1988a; Netemeyer et al., 2003) to sample size have been noted.
Consequently, the development of indices that are more robust to estimation method or sample
size would be welcome. Furthermore, the scale development procedures used in this research

369
are grounded on the domain sampling model (Nunally and Bernstein, 1994) which entails the
researcher exhaustively sampling the domain of the construct to generate scale items. However,
research that provides guidance on the optimal item pool size has the potential to provide
valuable insights. The reason being there may be diminishing returns from increasing the
number of items beyond a certain point if other commitments force expert panel members to
hastily complete their answers. This would move the literature from a quantity to quality
paradigm.
Finally, subsequent research could explore this research’s findings qualitatively. For
example, Blaxter et al. (1996) note:
“You may follow up on a survey with some interviews, in order to get some more
detailed perspectives on the issues raised. The telling anecdote may be much more
revealing and influential than almost any amounts of figures.” (p. 77)
Consequently, qualitative research could help assess the face validity of the proposed
brand identity dimensionality. Supplementing this quantitative research more qualitatively
would add richness and depth to the findings which, arguably, the data has not been able to do.
7.7. Concluding Note
The opening section of this chapter consolidated and unified this research. This was
achieved by reviewing the content and logic of the preceding chapters. At this stage, it was

370
noted how the introductory chapter laid the foundation for this research and formulated the
research questions. The literature review and theoretical framework chapters provided the
theoretical grounding and conceptual apparatus for this thesis respectively. Next, the
methodology chapter outlined how the research instrument was developed and data gathered in
order to test the theoretical framework. The following chapter, guided predominantly by the
scaling literature, shared the results of the quantitative data analysis. These analyses revealed
how service brand identity is a multidimensional construct that has a positive and significant
influence on brand performance. The penultimate chapter, structured by this thesis’ research
questions, discussed the findings in the context of the literature.
With the content and rationale for each chapter considered, theoretical and managerial
implications were discussed. Guided by Whetten’s (1989) criteria, the theoretical contributions
mainly concerned scale development, establishing construct dimensionality and tentative
support for a brand identity-performance effect. At this stage the initial model outlined in the
theoretical framework chapter (Section 3.4) was reframed in a more dynamic manner as a
Service Brand Identity Network (Section 7.3.2). Managerial implications focused on the need
for practitioners to orchestrate all service brand identity dimensions whilst noting how service
brand identity appears to drive brand performance.
The penultimate section of the chapter highlighted potential research limitations. These
included reservations about the feasibility of generalising these findings beyond the current
research context, concerns about brand identity-performance causality and issues surrounding
the research paradigm that underpinned this thesis.

371
The final section of the chapter considered potential avenues for future research. These
included opportunities for replicating this research to assess the stability of the scale and brand
identity-performance causality, developing a psychometrically sound brand performance
measure in addition to exploring causality that may exist within the brand identity or brand
performance constructs. It hoped subsequent brand marketing scholars will take the opportunity
to validate and build on this research.

372
Appendices
Appendix 1 - Complete Item Pool with Respective Removal Phase in Scaling Process
Appendix 2 - Experience Survey for Expert Panel
Appendix 3 - Covering Letter and Final Survey
Appendix 4 – Correlation of Brand Performance Measures
Appendix 5 – Missing Values (Frequency Distribution by item / question)
Appendix 6 - Expectation Maximisation Data Results
Appendix 7 - R-Matrix
Appendix 8 – References

373
APPENDIX 1: COMPLETE ITEM POOL WITH RESPECTIVE REMOVAL PHASE IN SCALING PROCESS (IF APPLICABLE)
ITEM ITEM ELIMINATION PROCESS SOURCE
IT1 Our organisation specifically defines what exceptional service is Removed at correlations matrix stage Webster (1993)
IT2 Our top management is committed to providing quality service Retained Webster (1993)
IT3 Our organisation regularly monitors employees' performance Retained Webster (1993)
IT4 Our employees focus on clients' needs, desires and attitudes Removed at CFA Webster (1993)
IT5 Our employees believe their behaviour reflects the brand's image Removed at EFA Webster (1993)
IT6 Our employees meet our organisation's expectations of them Removed at expert panel stage Webster (1993)
IT7 Our organisation places an emphasis on employees' communication skills Removed at EFA Webster (1993)
IT8 Our employees pay attention to detail in their work Removed at expert panel stage Webster (1993)
IT9 Our organisation is considerate of employees' feelings Removed at expert panel stage Webster (1993)
IT10 Our organisation treats each employee as an essential part of the organisation Retained Webster (1993)
IT11 Our employees feel comfortable giving opinions to senior management Removed at expert panel stage Webster (1993)
IT12 Our managers have an 'open door' policy Removed at expert panel stage Webster (1993) IT13 Our managers interact with front line employees Removed at EFA Webster (1993)
IT14 Our organisation places an emphasis on hiring the right people Removed at CFA Webster (1993)
IT15 Our organisation provides skill based training to front-line employees Removed at CFA Webster (1993)
IT16 Our organisation encourages creative approaches to selling Removed at expert panel stage Webster (1993)
IT17 High achievers in selling are recognized at our organisation Removed at expert panel stage Webster (1993)
IT18 Our employees enjoy pursuing new clients / accounts Removed at expert panel stage Webster (1993)
Marketing C
ulture
IT19 Our organisation rewards employees better than our Removed at expert panel stage Webster (1993)

374
competitors with incentives to sell IT20 Our employees aggressively pursue new business Removed at expert panel stage Webster (1993) IT21 Our employees are well organised Removed at expert panel stage Webster (1993)
IT22 Careful planning is characteristic of each employee's daily routine Removed at expert panel stage Webster (1993)
IT23 Our employees prioritise their work Removed at expert panel stage Webster (1993) IT24 Each employee's work area is well organised Removed at expert panel stage Webster (1993) IT25 Each of our employees' manages his / her time well Removed at expert panel stage Webster (1993)
IT26
Our organisation has an approved set of policies / procedures which is made available to every employee Removed at expert panel stage
Webster (1993)
IT27 Our organisations' supervisors clearly state their expectations of others Removed at expert panel stage Webster (1993)
IT28 Each employee understands the mission and general objectives of the organisation Removed at EFA Webster (1993)
IT29 Our management share financial information with all employees Removed at expert panel stage Webster (1993)
IT30 Our organisation's management encourage front-line employees to become involved in standard setting Removed at expert panel stage
Webster (1993)
IT31 Our organisation motivates employees Removed at expert panel stage Webster (1993)
IT32 All of our employees are receptive to ideas for change Removed at expert panel stage Webster (1993)
IT33 Our organisation keeps up with technological advances Removed at expert panel stage Webster (1993)
IT34 Our organisation is receptive to change Removed at EFA Webster (1993) IT35 Our organisation responds to our clients' needs Retained derived from Kotter and Heskett (1992) IT36 Our organisation responds to our employees needs Removed at expert panel stage derived from Kotter and Heskett (1992)
IT37 Our organisation responds to our shareholders needs Removed at expert panel stage derived from Kotter and Heskett (1992)
IT38 Our organisation has strong leadership Removed at expert panel stage derived from Kotter and Heskett (1992)
IT39 The name of our organisation is part of our brand identity Removed at EFA adapted from Simoes et al 2005
IT40 Our corporate symbols (logo / slogan, colours, visual style, signage) are part of our brand identity Removed at EFA adapted from Simoes et al 2005
CO
RP
OR
ATE
V
ISU
AL ID
EN
TITY IT41
Our premises are part of our brand identity Removed at correlations matrix stage adapted from Simoes et al 2005; Melewar and Saunders 1998

375
IT42 Our employees understand the meaning of our visual branding Removed at EFA adapted from Simoes et al 2005
IT43 Our employees are dressed in a manner that helps project our brand identity Removed at expert panel stage adapted from Simoes et al 2005
IT44 We have formal (visual) brand guidelines Removed at EFA adapted from Simoes et al 2005
IT45
Our brand is consistently presented through our facilities, equipment, personnel and communications material Removed at EFA
adapted from Simoes et al 2005
IT46
Our visual identity creates the intended brand associations
Removed at correlations matrix stage
Based on Lesle's feedback cf: awareness i.e. you could be aware but that's of no use if you have the wrong brand associations!
IT47 Our logo is an important part of who we are Retained Stuart 1997 IT48 Our organisation can be summed up by our logo Removed at expert panel stage Stuart 1997 IT49 Our stationery forms part of our brand identity Removed at EFA Melewar and Saunders 1998 IT50 Our vehicles are part of our brand identity Removed at expert panel stage Melewar and Saunders 1998
IT51
Our marketing collateral (brochures, letterheads, tenders, forms, documentation etc) is part of our brand identity Removed at EFA
Melewar and Saunders 1998
IT52 Everyone in our organisation complies with our visual identity guidelines / rules Removed at expert panel stage van den Bosch et al. 2006
IT53 The font we use is an important part of our visual identity Retained
Melewar and Saunders 2000 / Balmer and Baker 1997
IT54 It is important to apply the corporate visual identity
Removed at expert panel stage van den Bosch et al. 2006
IT55 The corporate visual identity is helpful in making our organisation recognisable Retained
van den Bosch et al. 2006
IT56 The guidelines for our corporate visual identity are up to date Removed at expert panel stage
van den Bosch et al. 2006
IT57 Within our organisation it's easy to get information on the corporate visual identity Removed at EFA
van den Bosch et al. 2006
IT58 Our brand personality has strong associations Removed at EFA Keller (1993) IT59 Our brand personality has favourable associations Retained Keller (1993)
IT60 Our brand personality has unique associations within its category Removed at EFA Keller (1993)
PE
RS
ON
ALITY
IT61 The associations making up our brand personality are extremely positive. Retained Additional item for redundancy

376
IT62 Our clients have no difficulty describing our brand personality Retained Additional item for redundancy
IT63 Our brand personality is completely different from our competitors Removed at EFA Additional item for redundancy
IT64 Our clients feel very loyal to our organisation Removed at pretest / pilot stage Fournier (1994)
IT65 Our clients stay with our organisation through good times and bad Removed at pretest / pilot stage Fournier (1994)
IT66 Our clients know we appreciate them Removed at pretest / pilot stage Fournier (1994) IT67 Our clients know we respect them Removed at pretest / pilot stage Fournier (1994)
IT68 Our clients know we regard them as being valuable to our organisation Removed at pretest / pilot stage Fournier (1994)
IT69 Our organisation shows a continuing interest in our clients Removed at pretest / pilot stage Fournier (1994)
IT70 Our clients know a lot about our organisation Removed at expert panel stage Fournier (1994) IT71 Our clients understand our organisation Removed at expert panel stage Fournier (1994) IT72 We are honest about problems Removed at pretest / pilot stage Roberts et al (2000) IT73 We are trustworthy Removed at pretest / pilot stage Roberts et al (2000) IT74 We are an organisation of high integrity Removed at pretest / pilot stage Roberts et al (2000)
IT75 Our organisation is concerned about our clients' welfare Removed at expert panel stage Roberts et al (2000)
IT76 Our clients confide in our organisation Removed at expert panel stage Roberts et al (2000)
IT77 We always consider how our actions will affect our clients Removed at pretest / pilot stage Roberts et al (2000)
IT78 Our clients feel emotionally attached to our organisation Removed at expert panel stage Roberts et al (2000)
IT79 Our clients like being associated with our organisation Removed at pretest / pilot stage Roberts et al (2000)
IT80 Our clients continue to deal with us because they genuinely enjoy their relationship with us Removed at pretest / pilot stage Roberts et al (2000)
IT81 We keep promises made to clients Removed at pretest / pilot stage Iacobucci et al (1995)
IT82 We resolve problems our clients experience with our service Removed at pretest / pilot stage Sirdeskmukh et al (2002)
IT83 We are dependable and reliable Removed at pretest / pilot stage Boon and Holmes (1999)
IT84 Our clients would remain loyal to our brand if we let them down once or twice Removed at pretest / pilot stage Aaker et al (2004)
IT85 Our clients are comfortable sharing confidential data with us Removed at pretest / pilot stage Aaker et al (2004)
RE
LATIO
NS
HIP
MA
RK
ETIN
G
NG
RELA
TED
SC
ALE
ITEM
S
IT86 We understand our clients' needs Removed at pretest / pilot stage Aaker et al (2004)

377
IT87 Our clients are familiar with the range of services we provide Removed at expert panel stage Aaker et al (2004)
IT88 Our clients are knowledgeable about our organisation Removed at expert panel stage Aaker et al (2004)
IT89 Through ongoing dialogue, we work with clients to tailor our offering Removed at expert panel stage Sin et al (2005)
IT90 Our organisation provides customised services to our clients Removed at expert panel stage Sin et al (2005)
IT91 Our organisation makes an effort to discover our clients' needs Retained Sin et al (2005)
IT92 When our clients wish to modify the service received our organisation makes a coordinated effort to do so Removed at expert panel stage Sin et al (2005)
IT93
Our employee training programs are designed to develop skills required for acquiring and deepening client relationships Retained
Sin et al (2005)
IT94 Our organisation has established clear business goals related to client relationship management Removed at CFA Sin et al (2005)
IT95
Employee performance is measured and rewarded based on meeting clients needs and successfully serving the client Removed at expert panel stage
Sin et al (2005)
IT96 Our organisational structure is meticulously designed around our clients Removed at expert panel stage Sin et al (2005)
IT97 Our employees will help clients in a responsive manner Retained Sin et al (2005)
IT98 Our organisation fully understands the needs of our key clients by learning from them Removed at CFA Sin et al (2005)
IT99
Our organisation provides channels that enable ongoing, two-way communication between our clients and us Removed at EFA
Sin et al (2005)
IT100 Clients can expect prompt service from our employees Removed at expert panel stage Sin et al (2005)
IT101 Our organisation has the right IT software to serve our clients Removed at EFA Sin et al (2005)
IT102 Our organisation has the right IT hardware to serve our clients Removed at EFA Sin et al (2005)
IT103 Individual client information is available at every point of contact Removed at expert panel stage Sin et al (2005)
CLIE
NT R
ELATIO
NS
HIP
MA
NA
GE
MEN
T
IT104 Our organisation maintains a comprehensive client database Removed at expert panel stage Sin et al (2005)

378
IT105 Our organisation's media plan is a strategic balance between mass media and one-to-one media Removed at expert panel stage
Reid (2005) / Duncan and Moriarty (1997)
IT106
At our organisation the process of managing the brand's reputation is the responsibility of all departments and employees Removed at EFA
Reid (2005) / Duncan and Moriarty (1997)
IT107
The people managing the communications program for our organisation have a good understanding of the strengths and weaknesses of all major marketing communications tools Retained
Reid (2005) / Duncan and Moriarty (1997)
IT108
Our organisation does an excellent job of internal marketing e.g. informing all areas of the organisation about our brand objectives Removed at EFA
Reid (2005) / Duncan and Moriarty (1997)
IT109
Our major communication agencies (e.g. advertising) have (at least) monthly contact with each other regarding our brands communication strategy Removed at correlations matrix stage
Reid (2005) / Duncan and Moriarty (1997)
IT110
We regularly review our marketing plan to ensure relevance and consistency of brand messages / brand positioning Removed at EFA
Reid (2005) / Duncan and Moriarty (1997)
IT111
Our major promotional theme is conceptually broad enough to allow for different sub campaigns aimed at all key stakeholder groups Removed at expert panel stage
Reid (2005) / Duncan and Moriarty (1997)
IT112
Our organisation carefully coordinates the brand message being sent by all its operations to ensure brand positioning consistency Removed at EFA
Reid (2005) / Duncan and Moriarty (1997)
IT113
A SWOT analysis is used to determine the strengths and opportunities we can leverage and the weaknesses and threats we need to address our brand's marketing communication planning Removed at expert panel stage
Reid (2005) / Duncan and Moriarty (1997)
IT114 There is consultation between business units and the board of directors regarding our brand identity Removed at EFA van den Bosch et al. 2006
IT115 Different marketing communications tools for our service are planned by the same manager Removed at expert panel stage Low (2000)
IT116
The elements of the marketing communications programme for our service are strategically consistent Removed at expert panel stage
Low (2000)
IT117 Our marketing communications delivers a common brand message Removed at EFA Low (2000)
INTE
GR
ATED
MA
RK
ETIN
G C
OM
MU
NIC
ATION
S
IT118 Our organisation's advertising, PR and sales promotion all present the same clear consistent Retained
Ewing and de Bussy (2000)

379
message to our stakeholders
IT119 Our organisation has a common strategy that unifies our advertising, public relations and sales promotion Removed at EFA Ewing and de Bussy (2000)

380
Appendix 2: EXPERIENCE SURVEY FOR EXPERT PANEL This survey represents the first step in developing a valid and reliable service brand identity scale. In the context of this research, ‘service’ relates to brands operating in sectors such as advertising, air travel, financial services, consulting, tourism and teaching. Please consider these 'types' of brands when rating the below items. For each statement please indicate the extent you believe the following items represent the domain of service brand identity. This can be achieved by checking the box underneath each statement within MS Word. (For the final survey a seven point Likert Scale will be used). Additional comments or suggestions are welcome. These can be provided in the space to the right of each statement. Comments could relate to item clarity / conciseness or the need for alternative wording. Finally, at the end of the questionnaire please note any items you feel should be included or any other points you wish to make. All responses will be treated in confidence. Thank you for assisting with this research. If you have any questions please do not hesitate to contact me on [email protected] / +447773280770. Regards, Darren SECTION 1: SERVICE BRAND IDENTITY - ITEMS
(It is important) Our organisation specifically defines what exceptional service is Not representative Representative Clearly representative
IT 1
1 2 3
Comments
(It is important) Our top management are committed to providing quality service Not representative Representative Clearly representative
IT 2
1 2 3
Comments
(It is important) Our organisation regularly monitors employees' performance Not representative Representative Clearly representative
IT 3
1 2 3
Comments
(It is important) Our employees focus on clients' needs, desires and attitudes Not representative Representative Clearly representative
IT 4
1 2 3
Comments

381
(It is important) Our employees believe their behaviour reflects the brand's image Not representative Representative Clearly representative
IT 5
1 2 3
Comments
(It is important) Our employees meet our organisation's expectations of them Not representative Representative Clearly representative
IT 6
1 2 3
Comments
(It is important) Our organisation places an emphasis on employees' communication skills Not representative Representative Clearly representative
IT 7
1 2 3
Comments
(It is important) Our employees pay attention to detail in their work Not representative Representative Clearly representative
IT 8
1 2 3
Comments
(It is important) Our organisation is considerate of employees' feelings Not representative Representative Clearly representative
IT 9
1 2 3
Comments
(It is important) Our organisation treats each employee as an essential part of the organisation Not representative Representative Clearly representative
IT 10
1 2 3
Comments
(It is important) Our employees feel comfortable giving opinions to senior management Not representative Representative Clearly representative
IT 11
1 2 3
Comments
(It is important) Our managers have an 'open door' policy Not representative Representative Clearly representative
IT 12
1 2 3
Comments
(It is important) Our managers interact with front line employees Not representative Representative Clearly representative
IT 13
1 2 3
Comments
IT 14 (It is important) Our organisation places an emphasis on hiring the Comments

382
right people Not representative Representative Clearly representative
1 2 3 (It is important) Our organisation provides skill based training to front-line employees Not representative Representative Clearly representative
IT 15
1 2 3
Comments
(It is important) Our organisation encourages creative approaches to selling Not representative Representative Clearly representative
IT 16
1 2 3
Comments
(It is important) High achievers in selling are recognized at our organisation Not representative Representative Clearly representative
IT 17
1 2 3
Comments
(It is important) Our employees enjoy pursuing new clients / accounts Not representative Representative Clearly representative
IT 18
1 2 3
Comments
(It is important) Our organisation rewards employees better than our competitors with incentives to sell Not representative Representative Clearly representative
IT 19
1 2 3
Comments
(It is important) Our employees aggressively pursue new business Not representative Representative Clearly representative
IT 20
1 2 3
Comments
(It is important) Our employees are well organised Not representative Representative Clearly representative
IT 21
1 2 3
Comments
(It is important) Careful planning is characteristic of each employee's daily routine Not representative Representative Clearly representative
IT 22
1 2 3
Comments
IT 23 (It is important) Our employees priortise their work Comments

383
Not representative Representative Clearly representative 1 2 3
(It is important) Each employee's work area is well organised Not representative Representative Clearly representative
IT 24
1 2 3
Comments
(It is important) Each of our employees' manages his / her time well Not representative Representative Clearly representative
IT 25
1 2 3
Comments
(It is important) Our organisation has an approved set of policies / procedures which is made available to every employee Not representative Representative Clearly representative
IT 26
1 2 3
Comments
(It is important) Our organisations' supervisors clearly state their expectations of others Not representative Representative Clearly representative
IT 27
1 2 3
Comments
(It is important) Each employee understands the mission and general objectives of the organisation Not representative Representative Clearly representative
IT 28
1 2 3
Comments
(It is important) Our management share financial information with all employees Not representative Representative Clearly representative
IT 29
1 2 3
Comments
(It is important) Our organisation's management encourage front-line employees to become involved in standard setting Not representative Representative Clearly representative
IT 30
1 2 3
Comments
(It is important) Our organisation motivates employees Not representative Representative Clearly representative
IT 31
1 2 3
Comments
(It is important) All of our employees are receptive to ideas for change IT 32 Not representative Representative Clearly representative
Comments
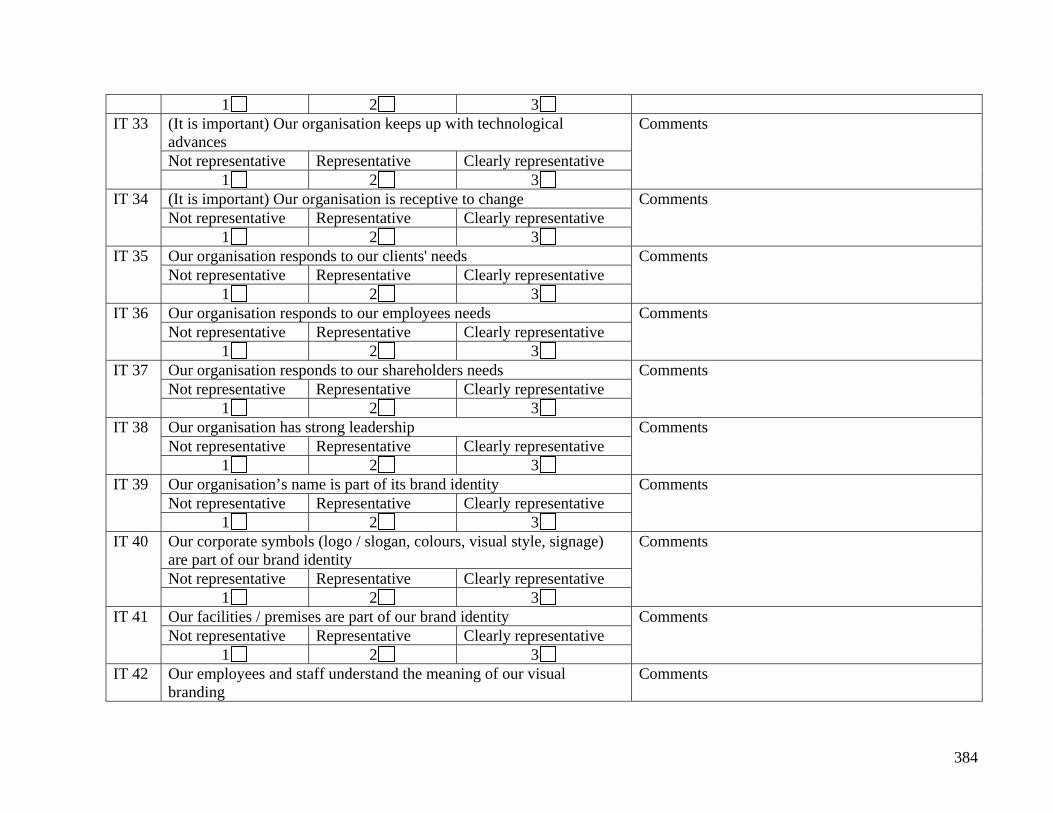
384
1 2 3 (It is important) Our organisation keeps up with technological advances Not representative Representative Clearly representative
IT 33
1 2 3
Comments
(It is important) Our organisation is receptive to change Not representative Representative Clearly representative
IT 34
1 2 3
Comments
Our organisation responds to our clients' needs Not representative Representative Clearly representative
IT 35
1 2 3
Comments
Our organisation responds to our employees needs Not representative Representative Clearly representative
IT 36
1 2 3
Comments
Our organisation responds to our shareholders needs Not representative Representative Clearly representative
IT 37
1 2 3
Comments
Our organisation has strong leadership Not representative Representative Clearly representative
IT 38
1 2 3
Comments
Our organisation’s name is part of its brand identity Not representative Representative Clearly representative
IT 39
1 2 3
Comments
Our corporate symbols (logo / slogan, colours, visual style, signage) are part of our brand identity Not representative Representative Clearly representative
IT 40
1 2 3
Comments
Our facilities / premises are part of our brand identity Not representative Representative Clearly representative
IT 41
1 2 3
Comments
IT 42 Our employees and staff understand the meaning of our visual branding
Comments

385
Not representative Representative Clearly representative 1 2 3
Our employees are dressed in a manner that helps project our brand identity Not representative Representative Clearly representative
IT 43
1 2 3
Comments
We have formal (visual) brand guidelines Not representative Representative Clearly representative
IT 44
1 2 3
Comments
Our brand is consistently presented through our facilities, equipment, personnel and communications material Not representative Representative Clearly representative
IT 45
1 2 3
Comments
Our visual identity creates the intended brand associations Not representative Representative Clearly representative
IT 46
1 2 3
Comments
Our logo is an important part of who we are Not representative Representative Clearly representative
IT 47
1 2 3
Comments
Our organisation can be summed up by our logo Not representative Representative Clearly representative
IT 48
1 2 3
Comments
Our stationary is part of our brand identity Not representative Representative Clearly representative
IT 49
1 2 3
Comments
Our vehicles are part of our brand identity Not representative Representative Clearly representative
IT 50
1 2 3
Comments
Our marketing collateral (brochures, letterheads, tenders, forms, documentation etc) is part of our brand identity Not representative Representative Clearly representative
IT 51
1 2 3
Comments

386
Everyone in our organisation complies with our visual identity guidelines / rules Not representative Representative Clearly representative
IT 52
1 2 3
Comments
The font we use is an important part of our visual identity Not representative Representative Clearly representative
IT 53
1 2 3
Comments
It is important to apply the corporate visual identity Not representative Representative Clearly representative
IT 54
1 2 3
Comments
The corporate visual identity is helpful in making our organisation recognisable Not representative Representative Clearly representative
IT 55
1 2 3
Comments
The guidelines for our corporate visual identity are up to date Not representative Representative Clearly representative
IT 56
1 2 3
Comments
Within our organisation it's easy to get information on the corporate visual identity Not representative Representative Clearly representative
IT 57
1 2 3
Comments
Our brand personality has strong associations Not representative Representative Clearly representative
IT 58
1 2 3
Comments
Our brand personality has favourable associations Not representative Representative Clearly representative
IT 59
1 2 3
Comments
Our brand personality has unique associations Not representative Representative Clearly representative
IT 60
1 2 3
Comments
Our clients feel very loyal to our organisation IT 61 Not representative Representative Clearly representative
Comments

387
1 2 3 Our clients stay with our organisation through good times and bad Not representative Representative Clearly representative
IT 62
1 2 3
Comments
Our clients know we appreciate them Not representative Representative Clearly representative
IT 63
1 2 3
Comments
Our clients know we respect them Not representative Representative Clearly representative
IT 64
1 2 3
Comments
Our clients know we regard them as being valuable to our organisation Not representative Representative Clearly representative
IT 65
1 2 3
Comments
Our organisation shows a continuing interest in our clients Not representative Representative Clearly representative
IT 66
1 2 3
Comments
Our clients know a lot about our organisation Not representative Representative Clearly representative
IT 67
1 2 3
Comments
Our clients understand our organisation Not representative Representative Clearly representative
IT 68
1 2 3
Comments
Our organisation is honest about problems Not representative Representative Clearly representative
IT 69
1 2 3
Comments
Our organisation is trustworthy Not representative Representative Clearly representative
IT 70
1 2 3
Comments
Our organisation has high integrity Not representative Representative Clearly representative
IT 71
1 2 3
Comments
IT 72 Our organisation is concerned about our clients' welfare Comments

388
Not representative Representative Clearly representative 1 2 3
Our clients confide in our organisation Not representative Representative Clearly representative
IT 73
1 2 3
Comments
We always consider how our actions will affect our clients Not representative Representative Clearly representative
IT 74
1 2 3
Comments
Our clients feel emotionally attached to our organisation Not representative Representative Clearly representative
IT 75
1 2 3
Comments
Our clients like being associated with our organisation Not representative Representative Clearly representative
IT 76
1 2 3
Comments
Our clients continue to deal with our organisation because they genuinely enjoy their relationship with us Not representative Representative Clearly representative
IT 77
1 2 3
Comments
Our organisation keeps promises made to clients Not representative Representative Clearly representative
IT 78
1 2 3
Comments
Our organisation resolves problems our clients experience with our service Not representative Representative Clearly representative
IT 79
1 2 3
Comments
Our organisation is dependable and reliable Not representative Representative Clearly representative
IT 80
1 2 3
Comments
Our clients would remain loyal to our brand if we let them down once or twice Not representative Representative Clearly representative
IT 81
1 2 3
Comments

389
Our clients are comfortable sharing confidential data with us Not representative Representative Clearly representative
IT 82
1 2 3
Comments
Our organisation understands our clients' needs Not representative Representative Clearly representative
IT 83
1 2 3
Comments
Our clients are familiar with the range of services we provide Not representative Representative Clearly representative
IT 84
1 2 3
Comments
Our clients are knowledgeable about our organisation Not representative Representative Clearly representative
IT 85
1 2 3
Comments
Through ongoing dialogue, we work with clients to tailor our offering Not representative Representative Clearly representative
IT 86
1 2 3
Comments
Our organisation provides customised services to our clients Not representative Representative Clearly representative
IT 87
1 2 3
Comments
Our organisation makes an effort to discover our clients ‘ needs Not representative Representative Clearly representative
IT 88
1 2 3
Comments
When our clients wish to modify the service received our organisation makes a coordinated effort to do so Not representative Representative Clearly representative
IT 89
1 2 3
Comments
Our employee training programs are designed to develop skills required for acquiring and deepening client relationships Not representative Representative Clearly representative
IT 90
1 2 3
Comments
Our organisation has established clear business goals related to client relationship management
IT 91
Not representative Representative Clearly representative
Comments

390
1 2 3 Employee performance is measured and rewarded based on meeting client needs and successfully serving the client Not representative Representative Clearly representative
IT 92
1 2 3
Comments
Our organisational structure is meticulously designed around our client Not representative Representative Clearly representative
IT 93
1 2 3
Comments
Our employees help clients in a responsive manner Not representative Representative Clearly representative
IT 94
1 2 3
Comments
Our organisation fully understands the needs of our key clients by learning from them Not representative Representative Clearly representative
IT 95
1 2 3
Comments
Our organisation provides channels that enable ongoing, two-way communication between our clients and us Not representative Representative Clearly representative
IT 96
1 2 3
Comments
Clients can expect prompt service from our employees Not representative Representative Clearly representative
IT 97
1 2 3
Comments
Our organisation has the right software to serve our clients Not representative Representative Clearly representative
IT 98
1 2 3
Comments
Our organisation has the right hardware to serve our clients Not representative Representative Clearly representative
IT 99
1 2 3
Comments
Individual client information is available at every point of contact Not representative Representative Clearly representative
IT 100
1 2 3
Comments
IT Our organisation maintains a comprehensive client database Comments

391
Not representative Representative Clearly representative 101 1 2 3
Our organisation's media plan is a strategic balance between mass media and one-to-one media Not representative Representative Clearly representative
IT 102
1 2 3
Comments
At our organisation the process of managing the brand's reputation is the responsibility of all departments and employees Not representative Representative Clearly representative
IT 103
1 2 3
Comments
The people managing the communications program for our organisation have a good understanding of the strengths and weaknesses of all major marketing communications tools e.g. direct mail, PR, sales promotion and advertising. Not representative Representative Clearly representative
IT 104
1 2 3
Comments
Our organisation does an excellent job of internal marketing e.g. informing all areas of the organisation about our brand's objectives and marketing programs Not representative Representative Clearly representative
IT 105
1 2 3
Comments
Our major communication agencies (e.g. advertising) have (at least) monthly contact with each other regarding our brands communication strategy Not representative Representative Clearly representative
IT 106
1 2 3
Comments
We regularly review our marketing plan to ensure relevance and consistency of brand messages and strategic brand positioning Not representative Representative Clearly representative
IT 107
1 2 3
Comments
Our major promotional theme is conceptually broad enough to allow for different sub campaigns aimed at all key stakeholder groups
IT 108
Not representative Representative Clearly representative
Comments

392
1 2 3 Our organisation carefully coordinates the message being sent by all of its operations to ensure consistency of brand positioning Not representative Representative Clearly representative
IT 109
1 2 3
Comments
A SWOT analysis is used to determine the strengths and opportunities we can leverage and the weaknesses and threats we need to address our brand's marketing communication planning Not representative Representative Clearly representative
IT 110
1 2 3
Comments
There is consultation between business units and the board of directors regarding our brand identity Not representative Representative Clearly representative
IT 111
1 2 3
Comments
Different marketing communications tools for our service are planned by the same manager Not representative Representative Clearly representative
IT 112
1 2 3
Comments
The elements of the marketing communications programme for our service are strategically consistent Not representative Representative Clearly representative
IT 113
1 2 3
Comments
Our organisation's marketing communications used for our service focuses on a common message Not representative Representative Clearly representative
IT 114
1 2 3
Comments
Our organisation's advertising, PR and sales promotion all present the same clear consistent message to our target audience(s) Not representative Representative Clearly representative
IT 115
1 2 3
Comments
Our organisation has a common strategy that unifies our advertising, public relations and sale promotion
IT 116
Not representative Representative Clearly representative
Comments
393
1 2 3 Please note additional items or comments you feel are important when measuring service brand identity (use as much space as required): Thank you for your time, Darren

394
Appendix 3 – Covering Letter and Final Survey
<<Date>> «Prefix» «Firstname» «Surname» «Executive_Title» «Company_Name» «Address_Line_1» «Address_Line_2» «Address_Line_3» «City» «Postal_Code» Reference: «Reference» Dear «Prefix» «Firstname»,
Re: Branding Activities and Brand Performance In the IT Services Sector - PhD Research.
I am writing to ask for your help with my PhD research by completing the enclosed survey. The topic relates to strategic branding in the IT Services sector. The answers you provide will help me identify which brand marketing activities have the most significant effect on brand performance in the IT Services sector. Given the senior position you hold at «Company_Name» you were identified as a particularly suitable respondent. Your contact details were obtained from the ONESOURCE database hosted at the British Library. By collecting data from senior executives the research ultimately aims to identify where brand marketing resources can be best allocated to maximise brand performance. As a token of my appreciation, I would like to offer you executive summary findings. Please provide your email at the end of the survey. If you do not have time to complete the survey but would like to receive summary findings please return the uncompleted survey with your email address (at the end) in the enclosed stamp addressed envelope. The survey should take approximately 10 minutes to complete. Your responses will be treated in confidence and analysed at an aggregate, not individual level. I would be grateful if the completed survey could be returned in the stamp addressed envelope provided by <<15 days>>. If you have any questions please contact me at
Thank you for your help. I look forward to receiving your completed survey. Yours sincerely, Darren Coleman

395
SURVEY

396
SURVEY

397
SURVEY

398
APPENDIX 4 CORRELATION MATRIX FOR BRAND PERFORMANCE MEASURES USING SPEARMAN’S RANK CORRELATION COEFFICIENT
(FULL SAMPLE, N=421).
Spearman's Correlation Coefficient
Mar
ket S
hare
Net
Pro
fit
Cus
tom
er L
oyal
ty
Cus
tom
er S
atis
fact
ion
Org
anis
atio
n R
eput
atio
n
Bra
nd A
war
enes
s
Em
ploy
ee L
oyal
ty
Em
ploy
ee S
atis
fact
ion
Market Share 1 Net Profit 0.88** 1 Customer Loyalty 0.43** 0.41** 1 Customer Satisfaction 0.37** 0.34** 0.68** 1 Org. Reputation 0.37** 0.32** 0.55** 0.62** 1 Brand Awareness 0.50** 0.46** 0.35** 0.31** 0.30** 1 Employee Loyalty 0.20** 0.20** 0.35** 0.38** 0.39** 0.30** 1 Employee Satisfaction 0.29** 0.26** 0.46** 0.53** 0.45** 0.33** 0.77** 1 ** p<0.01 (two tailed)

399
APPENDIX 5 – MISSING VALUES (FREQUENCY DISTRIBUTION)
Item N Missing Values Count Missing Values % IT1 421 0 0 IT2 421 0 0 IT3 414 7 1.7 IT4 419 2 0.5 IT5 420 1 0.2 IT7 417 4 1 IT10 419 2 0.5 IT13 413 8 1.9 IT14 421 0 0 IT15 416 5 1.2 IT28 417 4 1 IT34 421 0 0 IT35 420 1 0.2 IT39 421 0 0 IT40 421 0 0 IT41 421 0 0 IT42 418 3 0.7 IT44 416 5 1.2 IT45 421 0 0 IT46 417 4 1 IT47 421 0 0 IT49 421 0 0 IT51 421 0 0 IT53 414 7 1.7 IT55 418 3 0.7 IT57 418 3 0.7 IT58 420 1 0.2 IT59 418 3 0.7 IT60 419 2 0.5 IT61 418 3 0.7 IT62 419 2 0.5 IT63 421 0 0 IT94 414 7 1.7 IT97 417 4 1 IT91 421 0 0 IT93 413 8 1.9 IT98 421 0 0 IT99 419 2 0.5
IT101 421 0 0 IT102 421 0 0 IT106 419 2 0.5 IT107 421 0 0

400
IT108 414 7 1.7 IT109 398 23 5.5 IT110 419 2 0.5 IT112 419 2 0.5 IT114 410 11 2.6 IT117 419 2 0.5 IT118 412 9 2.1 IT119 419 2 0.5
Brand Awareness 418 3 0.7 Customer Loyalty 418 3 0.7
Customer Satisfaction 418 3 0.7 Employee loyalty 415 6 1.4
Employee Satisfaction 415 6 1.4 Market Share 416 5 1.2
Organisation Reputation 417 4 1 Organisation Market 420 1 0.2
Organisation Age 401 20 4.8 Employee Numbers 383 38 9
Position 421 0 0 Marketing Experience 329 92 21.9
Educational Level 406 15 3.6 Birth Year 399 22 5.2 Gender 408 13 3.1
Age 399 22 5.2

401
APPENDIX 6 - ESTIMATED STANDARD DEVIATIONS AND MEANS BEFORE AND AFTER EXPECTATION MAXIMISATION ALGORITHM WAS USED.
Summary of Estimated Standard Deviations Summary of Estimated Means
Items All Values EM Based Values Items All Values EM Based
Values Item 1 1.536 1.536 Item 1 3.08 3.08 Item 2 1.053 1.053 Item 2 1.63 1.63 Item 3 1.414 1.414 Item 3 2.6 2.61 Item 4 1.04 1.043 Item 4 2.04 2.03 Item 5 1.321 1.321 Item 5 2.48 2.49 Item 7 1.181 1.18 Item 7 2.57 2.57 Item 10 1.129 1.128 Item 10 2.04 2.03 Item 13 1.187 1.185 Item 13 1.91 1.9 Item 14 1.15 1.15 Item 14 1.91 1.91 Item 15 1.466 1.462 Item 15 2.68 2.68 Item 28 1.205 1.204 Item 28 2.53 2.53 Item 34 1.183 1.183 Item 34 2.23 2.23 Item 35 1.044 1.046 Item 35 1.72 1.73 Item 39 0.805 0.805 Item 39 1.69 1.69 Item 40 1.288 1.288 Item 40 2.17 2.17 Item 41 1.683 1.683 Item 41 4.06 4.06 Item 42 1.359 1.357 Item 42 3.07 3.07 Item 44 1.624 1.62 Item 44 3.59 3.59 Item 45 1.248 1.248 Item 45 2.86 2.86 Item 46 1.261 1.274 Item 46 3.24 3.26 Item 47 1.428 1.428 Item 47 2.42 2.42 Item 49 1.34 1.34 Item 49 2.32 2.32 Item 51 1.285 1.285 Item 51 2.22 2.22 Item 53 1.52 1.532 Item 53 2.93 2.94 Item 55 1.305 1.302 Item 55 2.57 2.58 Item 57 1.338 1.337 Item 57 2.82 2.82 Item 58 1.222 1.221 Item 58 2.94 2.94 Item 59 1.124 1.122 Item 59 2.66 2.66 Item 60 1.201 1.203 Item 60 3.15 3.15 Item 61 1.16 1.162 Item 61 2.82 2.83 Item 62 1.177 1.176 Item 62 3.22 3.22 Item 63 1.336 1.336 Item 63 3.12 3.12 Item 91 0.99 0.99 Item 91 1.75 1.75 Item 93 1.282 1.286 Item 93 2.76 2.78

402
Items All Values EM Based Values Items All Values EM Based
Values Item 94 1.151 1.155 Item 94 2.51 2.52 Item 97 0.888 0.888 Item 97 1.85 1.85 Item 98 1.109 1.109 Item 98 2.15 2.15 Item 99 1.137 1.137 Item 99 2.26 2.26 Item 101 1.342 1.342 Item 101 2.31 2.31 Item 102 1.262 1.262 Item 102 2.06 2.06 Item 106 1.367 1.366 Item 106 2.67 2.66 Item 107 1.324 1.324 Item 107 2.72 2.72 Item 108 1.394 1.389 Item 108 3.42 3.42 Item 109 1.705 1.692 Item 109 4.04 4.04 Item 110 1.441 1.439 Item 110 3.31 3.31 Item 112 1.333 1.331 Item 112 3.04 3.04 Item 114 1.63 1.626 Item 114 3.05 3.06 Item 117 1.217 1.216 Item 117 2.74 2.73 Item 118 1.265 1.261 Item 118 2.82 2.83 Item 119 1.374 1.374 Item 119 2.96 2.97 MS 1.379 1.378 MS 3.58 3.57 NP 1.245 1.244 NP 3.44 3.43 CL 1.078 1.078 CL 2.28 2.28 CS 1.024 1.023 CS 2.22 2.22 OR 1.073 1.072 OR 2.35 2.35 BA 1.323 1.334 BA 3.4 3.41 EL 1.206 1.218 EL 2.29 2.3 ES 1.16 1.169 ES 2.53 2.54
MS=Market Share, NP= Net Profit, CL=Customer Loyalty, CS=Customer Satisfaction, OR=Organisation Reputation, BA=Brand Awareness, EL=Employee Loyalty & ES=Employee Satisfaction

403
Appendix 7 – R Matrix

404
TO BE INSERTED ON A3 SHEET

405
Appendix 8 - References Aaker, D. A. (1982). Positioning Your Product. Business Horizons, 25, 56-62. Aaker, D. A. (1991). Managing Brand Equity, New York, The Free Press. Aaker, D. A. (1996a). Building Strong Brands, New York, The Free Press / Simon and
Schuster. Aaker, D. A. (1996b). Measuring Brand Equity Across Products and Markets. California
Management Review, 38, 102. Aaker, D. A. & Joachimsthaler, E. (2000). Brand Leadership, New York, The Free
Press. Aaker, D. A., Kumar, V. & Day, G. (2004a). Marketing Research New York, Wiley. Aaker, J. L. (1995). Measuring The Human Characteristics of a Brand: A Personality
Hierarchy Advances in Consumer Research, 22, 391-395. Aaker, J. L. (1997). Dimensions of Brand Personality. Journal of Market Research,
34(August), 347-356. Aaker, J. L. (1999). The Malleable Self: The Role of Self-Expression in Persuasion.
Journal of Marketing Research 36, 45-57. Aaker, J. L., Fournier, S. & A.S., B. (2004b). When Good Brands Do Bad. Journal of
Consumer Research 31, 1-16. Abratt, R. (1989). A New Approach To The Corporate Image Management Process.
Journal of Marketing Management, 15, 63-76. Adams, G. B. & White, J. D. (1994). Dissertation Research in Public Administration and
Cognate Fields: An Assessment of Methods and Quality. Public Administration Review, 54, 565-576.
Agarwal, P. (2004). The Effects of Brand Relationship Norms on Consumer Attitudes and Behavior. Journal of Consumer Research, 31, 87-101.
Agarwal, P. & Roa, V. (1996). An Empirical Comparison of Consumer-Based Measures of Brand Equity. Marketing Letters, 7, 237-247.
Aitken, R., Ballantyne, D., Osborne, P. & Williams, J. (2006). Introduction to the special issue on the service-dominant logic of marketing: insights from The Otago Forum. Marketing Theory, 6, 275-280.
Albert, S. & Whetten, D. A. (1985). Organizational Identity. In Cummings, L. L. & Staw, B. M. (Eds.) Research in Organizational Behaviour.

406
Alessandri, S. W. (2001). Modelling Corporate Identity: A Concept Explication and Theoretical Explanation. Corporate Communications: An International Journal, 6, 173-182.
Allen, D. E. & Olsen, J. (1995). Conceptualising And Creating Brand Personality: A Narrative Theory Approach. Advances in Consumer Research, 22, 392-393.
Alreck, P. L. & Settle, R. B. (1995). The Survey Research Handbook Chicago Irwin. Alsem, K. J. & Kostelijik, E. (2008). Identity Based Marketing: A New Balanced
Marketing Paradigm European Journal of Marketing, 42, 907-914. Alvesson, M. (1990). Organization from Substance to Image. Organization Studies, 11,
373-394. AMA (2009). Definitions Database
(http://www.marketingpower.com/_layouts/Dictionary.aspx?dLetter=B). Ambler, T. (2000a). Marketing and The Bottom Line: The New Metrics of Corporate
Wealth, UK, Prentice Hall. Ambler, T. (2000b). Marketing Metrics. Business Strategy Review, 11, 59. Ambler, T. (2003). Marketing and the Bottom Line: Marketing Metrics to Pump Up
Cash Flow, Prentice Hall. Ambler, T., Bhattacharya, J. E., Keller, K. L., Lemon, K. N. & Mittal, V. (2002).
Relating Brand and Customer Perspectives on Marketing Management. Journal of Service Research, 5, 13-25.
Ambler, T. & Styles, C. (1996). Brand Development Versus New Product Development: Towards a Process Model of Extension Decisions. Marketing Intelligence and Planning, 14, 10-19.
Anderson, J. C. & Gerbing, D. W. (1984). The Effect of Sampling Error on Convergence, Improper Solutions, and Goodness-of-Fit Indices for Maximum Likelihood Confirmatory Factor Analysis. Psychometrika, 49, 155-173.
Anderson, J. C. & Gerbing, D. W. (1988). Structural Equation Modeling in Practice: A Review and Recommended Two Step Approach. Psychological Bulletin, 103, 411-423.
Anderson, J. C. & Narus, J. A. (1990). A Model of Distributor Firm and Manufacturer Firm Working Partnership. Journal of Marketing, 54.
Andrews, F. M. (1984). Construct Validity and Error Components of Survey Measures: A Structural Equation Modelling Approach. Public Opinion Quarterly, 48, 409-442.
Ang, L. & Buttle, F. (2006). CRM Software Applications and Business Performance. Database Marketing and Customer Strategy Management, 14, 4-16.
Appiah, A., K., Fyall, A. & Singh, S. (1999). Marketing Culture and Business Performance in the Airline Industry. Journal of Travel and Tourism Marketing, 8, 47-70.
Appiah, A. K., Fyall, A. & Singh, S. (2000). Marketing Culture and Customer Retention in the Tourism Industry. The Service Industries Journal, 20, 95-113.
Argenti, P. A. & Druckenmiller, B. (2004). Reputation and the Corporate Brand. Corporate Reputation Review, 6, 368-374.
Armstrong, J. S. & Overton, T. S. (1977). Estimating Non-Response Bias in Mail Surveys. Journal of Marketing Research, 14, 396-402.

407
Arthur, J. B. (1994). Effects of Human Resource Systems on Manufacturing Performance and Turnover. Academy of Management Journal, 31, 670-687.
Ashford, B. E. & Mael, F. (1996). Organizational Identity and Strategy as a Context for the Individual. In Baur, J. A. C. & Dutton, J. E. (Eds.) Advances in Strategic Management. Greenwich, Connecticut.
Ashforth, B. E. & Mael, F. (1989). Social Identity Theory and the Organization. Academy of Management Review, 14, 20.
Austin, J. R., Siguaw, J. A. & Mattila, A. S. (2003). A Re-Examination of the Generalizability of the Aaker Brand Personality Measurement Framework. Journal of Strategic Marketing, 11, 77-92.
Azoulay, A. & Kapferer, J.-N. (2003). Do Brand Personality Scales Really Measure Brand Personality? Journal of Brand Management, 11, 143-155.
Bagozzi, R. P. (1975). Marketing as Exchange. Journal of Marketing, 39, 32-39. Bagozzi, R. P. (1981). Evaluating Structural Equation Models with Unobservable
Variables and Measurement Error: A Comment. Journal of Marketing Research, 18, 375-381.
Bagozzi, R. P. & Yi, Y. (1988). On the Evaluation of Structural Equation Models. Academy of Marketing Science, 16, 74-94.
Baker, J. (2005). Marketing is Marketing - Everywhere! Vikalpa, 30, 1-9. Baker, M. J. (1999). Marketing-Philosophy or Function? In Baker, M. J. (Ed.) The IEBM
Encyclopedia of Marketing London, International Thomson Business Press Baker, M. J. (2001). Selecting a Research Methodology. The Marketing Review, 1, 373-
397. Baker, M. J. (2003). Data Collection - Questionnaire Design. The Marketing Review, 3,
343-370. Baker, M. J. & Balmer, J. M. T. (1997). Visual Identity: Trappings or Substance.
European Journal of Marketing, 31, 366-379. Baker, W. E. & Sinkula, J. M. (1999). The Synergistic Effect of Market Orientation and
Learning Orientation on Organizational Performance. Academy of Marketing Science, 27.
Baker, W. E. & Sinkula, J. M. (2005a). Environmental Marketing Strategy and Firm Performance: Effects on New Product Performance and Market Share. Journal of the Academy of Marketing Science, 33, 461-475.
Baker, W. E. & Sinkula, J. M. (2005b). Market Orientation and the New Product Mix. The Journal of Product Innovation Management, 22, 483-502.
Baker, W. J., Hutchinson, W., Moore, D. & Nedundadi, P. (1986). Brand Familiarity and Advertising: Effects on the Evoked Set and Brand Preferences. Advances in Consumer Research, 13, 637-642.
Ballantyne, S. & Varey, R. J. (2008). The Service-Dominant Logic and the Future of Marketing. Journal of the Academy of Marketing Science, 36, 11-14.
Balmer, J. M. T. (1995). Corporate Branding and Connoisseurship. Journal of General Management 21, 22-46.
Balmer, J. M. T. (1998). Corporate Identity and the Advent of Corporate Marketing. Journal of Marketing Management, 14, 993-996.

408
Balmer, J. M. T. (2001a). Corporate Identity, Corporate Branding and Corporate Marketing-Seeing Through The Fog. European Journal of Marketing, 35, 248-291.
Balmer, J. M. T. (2001b). The Three Virtues and Seven Deadly Sins of Corporate Brand Management. Journal of General Management, 27, 1-17.
Balmer, J. M. T. (2008). Identity Based Views of The Corporation: Insights from Corporate Identity, Organisational Identity, Social Identity, Visual Identity, Corporate Brand Identity and Corporate Image. European Journal of Marketing, 42, 879-906.
Balmer, J. M. T., Fukukawa, K. & Gray, E. R. (2007). The Nature and Management of Ethical Corporate Identity: A Commentary on Corporate Identity, Corporate Social Responsibility and Ethics. Journal of Business Ethics, 76, 7-15.
Balmer, J. M. T. & Gray, E. R. (2003). Corporate Brands: What Are They? What of Them? European Journal of Marketing, 37, 972-997.
Balmer, J. M. T. & Greyser, S. (2003). Revealing the Corporation. Perspectives on Identity, Image, Reputation, Corporate Branding and Corporate Level Marketing, London, Routledge.
Balmer, J. M. T. & Greyser, S. A. (2002). Managing the Multiple Identities of the Corporation. California Management Review, 44, 72-86.
Balmer, J. M. T. & Greyser, S. A. (2006). Corporate Marketing: Integrating Corporate Identity, Corporate Branding, Corporate Communications, Corporate Image and Corporate Reputation. European Journal of Marketing, 40, 730-741.
Balmer, J. M. T. & Stotvig, S. (1997). Corporate Identity and Private Banking: A Review and Case Study. Intentional Journal of Bank Marketing, 15, 169-183.
Balthazard, P. A., Cooke, R. A. & Potter, R. E. (2006). Dysfunctional Culture, Dysfunctional Organisation: Capturing the Behavioural Norms that Form Organizational Culture and Drive Performance. Journal of Managerial Psychology, 21, 709-732.
Barnes, J. (2001). Factor Analysis: Checking Assumptions of Normality Before Conducting Factor Analyses Journal of Consumer Psychology, 10, 79-81.
Barney, J. B. (1991). Firm Resources and the Theory of Competitive Advantage Journal of Management, 17, 99-120.
Baron, R. M. & Kenny, D. A. (1986). The Moderator-Mediator Variable Distinction in Social Psychological Research: Conceptual, Strategic and Statistical Considerations. Journal of Personality and Social Psychology, 51, 1173-1182.
Bartholme, R. H. & Melewar, T. C. (2009). A Qualitative Examination of Corporate Auditory Identity and Perceived Consequences of Auditory Identity Management - The Perspective of Practitioners. 5th Thought Leaders International Conference on Brand Management Athens, Greece.
Bartholomew, S. & Smith, A. D. (2006). Improving Survey Response Rates from Chief Executive Officers in Small Firms: The Importance of Social Networks. . Entrepreneurship Theory and Practice, January, 83-96.
Barwise, P., Higson, C., Likierman, A. & March, P. (1990). Brands as "Separable Assets". Business Strategy Review, Summer, 43-59.
Barwise, P. & Meehan, S. (2004). Simply Better, Boston, MA, Harvard Business School Press.

409
Bate, P. (1984). The Impact of Organizational Culture on Approaches to Organizational Problem-Solving Organization Studies, 5, 43-66.
Batra, R., Lehmann, D. R. & Dingh, D. (1993). The Brand Personality Component of Brand Goodwill: Some Antecedents and Consequences. In Aaker, D. A. & Biel, A. L. (Eds.) Brand Equity and Advertising. Hillsdale, NJ., Lawrence Erlbaum Associates.
Bauer, R. (1960). Consumer Behaviour as Risk Taking. In Hancock, R. S. (Ed.) Dynamic Marketing for a Changing World. Proceedings of the 43rd Conference of the American Marketing Association.
Baumgarter, H. & Steenkamp, J.-B., E.M. (2001). Response Styles in Marketing Research: A Cross National Investigation. Journal of Marketing Research, 38, 143-156.
Bearden, W. O., Hardesty, D. & Rose, R. (2001). Consumer Self-Confidence: Refinements in Conceptualization and Measurement. Journal of Consumer Research, 28, 121-134.
Bearden, W. O., Sharma, A. & Teel, J. E. (1982). Sample Size Effects on Chi-Square and other Statistics Used in Evaluating Causal Models. Journal of Marketing Research, 19, 425-430.
Becker, B. & Gerhart, B. (1996). The Impact of Human Resource Management on Organizational Performance: Progress and prospects. Academy of Management Journal, 39, 779.
Bednar, M. K. & Westphal, J. D. (2006). Surveying the Corporate Elite: Theoretical and Practical Guidance on Improving Response Rates and Response Quality in Top Management Survey Questionnaires. Research and Methodology In Strategy and Management, 3, 37-55.
Belk, R. (1988). Possessions and the Extended Self. Journal of Consumer Research, 15, 139-168.
Belt, J. A. & Paolillo, J. G. P. (1982). The Influence of Corporate Image and Specificity of Candidate Qualifications on Response to Recruitment Advertisements. Journal of Management, 8.
Bendixen, M., Bukasa, K. A. & Abratt, R. (2004). Brand Equity in the Business-to-Business Market. Industrial Marketing Management, 33, 371-380.
Bengtsson, A. (2003). Towards a Critique of Brand Relationships. Advances in Consumer Research, 30, 154-158.
Bennet, R., Hartel, C. E. J. & McColl-Kennedy, J. R. (2005). Experience as a Moderator of Involvement and Satisfaction on Brand Loyalty in a Business-to-Business Setting. Industrial Marketing Management, 34, 97-107.
Bentler, P. M. & Dudgeon, P. (1996). Covariance Structure Analysis: Statistical Practice, Theory and Directions. Annual Review of Psychology, 47, 563-592.
Bentler, P. M. & Yuan, K.-H. (1999). Structural Equation Modeling With Small Samples: Test Statistics. Multivariate Behavioural Research, 34, 181-197.
Bernstein, D. (1984). Company Image and Reality: A Critique of Corporate Communications, London, Cassell Education Limited
Bernstein, D. (1986). Company Image and Reality: A Critique of Corporate Communications, Eastbourne, UK., Holt, Rinchart and Winston.
Berry, L. L. (1980). Service Marketing Is Different. Business, 30, 24-29.

410
Berry, L. L. (1983). Relationship Marketing, Provo, Utah, American Marketing Association.
Berry, L. L. (1995). Relationship Marketing of Services. Journal of the Academy of Marketing Science, 23, 236-245.
Berry, L. L. (2000). Cultivating Service Brand Equity. Journal of the Academy of Marketing Science, 28, 128-137.
Berry, L. L., Lefkowith, E. & Clark., T. (1988). In Services, What's In A Name? Harvard Business Review, 66, 28-30.
Berry, L. L. & Parasuraman, A. (1991). Marketing Services: Competing Through Quality New York, Free Press.
Berry, L. L. & Seltman, K. D. (2007). Building a Strong Services Brand: Lessons From Mayo Clinic. Business Horizons, 50, 199-209.
Berson, Y. & Linton, J. D. (2005). An Examination of the Relationships Between Leadership Style, Quality and Employee Satisfaction in R&D versus Administrative Environments. R&D Management, 35, 51-60.
Beverland, M., Farrelly, F. & Woodhatch, Z. (2004). The Role of Value Change Management in Relationship Dissolution: Hygiene and Motivational Factors. Journal of Marketing Management, 20, 927-940.
Beverland, M., Napoli, J. & Lindgreen, A. (2007a). Industrial Global Brand Leadership: A Capabilities View. Industrial Marketing Management, 36, 1082-1093.
Beverland, M., Napoli, J. & Yakimova, R. (2007b). Branding the Business Marketing Offer: Exploring Brand Attributes in Business Markets. Journal of Business and Industrial Marketing, 22, 394-399.
Bharadwaj, S. G. & Menon, A. (1993). Determinants of Success in Service Industries. Journal of Services Marketing, 7, 19.
Bhattacharya, C. B. & Sen, S. (2003). Consumer-Company Identification: A Framework for Understanding Consumers' Relationships with Companies. Journal of Marketing, 67, 76-88.
Bick, G., Jacobson, M. C. & Abratt, R. (2003). The Corporate Identity Management Process Revisited. Journal of Marketing Management, 19, 835-855.
Biel, A. (1993a). The Brandscape: Converting Brand Image Into Equity. ADMAP, 26, 41-46.
Biel, A. L. (1992). How Brand Image Drives Brand Equity. Advertising Age, 30, 3. Biel, A. L. (1993b). Converting Image into Equity. In Aaker, D. A. & Biel, A. L. (Eds.)
Brand Equity and Advertising. Hillsdale, NJ, Lawrence Erlbaum Associates. Billet, J. B. & McClendon, M. J. (2000). Modeling Acquiescence In Measurement
Models for Two Balanced Set of Items. Structural Equation Modeling, 7, 608-628.
Birkigt, K. & Stadler, M. M. (1986). Corporate Identity, Grundlagen, Funktionen und Beispielen, Verlag, Moderne Industrie: Landsberg an Lech.
Bitner, M. J. (1990). Evaluating Service Encounters: The Effects of Physical Surroundings and Employee Responses. Journal of Marketing, 54, 69-82.
Bitner, M. J. (1995). Building Service Relationships: It's All About Promises. Journal of the Academy of Marketing Science, 23, 246-251.
Blackston, M. (1992). Observations:Building Brand Equity by Managing the Brand's Relationships. Journal of Advertising Research, 32, 79-83.

411
Blackston, M. (1993). Beyond Brand Personality: Building Brand Relationships. In Aaker, D. A. & Biel, A. L. (Eds.) Brand Equity and Advertising. Hillsdale, NJ, Lawrence Erlbaum Associates.
Blattberg, R. C. (2001). Customer Equity: Building and Managing Customer Relationships as Valuable Assets, Boston, MA, Harvard Business Press.
Blaxter, L., Hughes, C. & Tight, M. (1996). How to Research, Buckingham, Open University Press.
Blomback, A. & Axelsson, B. (2007). The Role of Corporate Brand Image in the Selection of New Subcontractors. Journal of Business and Industrial Marketing, 22, 418-430.
Bollen, K. A. (1989). Structural Equations with Latent Variables, New York, John Wiley and Sons.
Bollen, K. A. (1990). Overall Fit in Covariance Structure Models: Two Types of Sample Size Effects. Psychological Bulletin, 107, 256-259.
Bollen, K. A. & Stine, R. A. (1992). Bootstrapping Goodness-of-fit Measures in Structural Equation Models. Sociological Methods and Research, 21, 205-229.
Bollen, K. A. & Stine, R. A. (1993). Bootstrapping Goodness-of-Fit Measures in Structural Equation Modeling. In Bollen, K. A. & Long, J. S. (Eds.) Testing structural equation models. Newbury Park: , Sage. .
Bommer, W. H., Johnson, J. J., Rich, G. A., Podsakoff, P. M. & Mackenzie, S. B. (1995). On the Interchangeability of Objective and Subjective Measures of Employee Performance: A Meta Analysis. Personnel Psychology, 48, 587-605.
Boomsma, A. & Hoogland, J. J. (2001). The Robustness of LISREL Modeling Revisited. In Cudeck, R., du Toit, S. & Sorbom, D. (Eds.) Structural Equation Models: Present and Future. A Festchrift in Honor of Karl Joreskog. Chicago, Scientific Software International.
Boon, S. D. & Holmes, J. G. (1999). Interpersonal Risk and the Evaluation of Transgressions in Close Relationships. Personal Relationships
6, 151-168. Bostrom, G.-O. & Isberg, S. (2009). Creating a Repositioned Corporate Brand at the
Service Encounter - Brand Building in a Swedish Insurance Company. 5th Thought Leaders International Conference on Brand Management Athens, Greece.
Bowen, D., Chase, R. & Cummings, T. (1990). Service Management Effectiveness, San Francisco, Jossey Bass Publishers.
Boyle, E. (1996). An Experiment in Changing Corporate Image in the Financial Services Industry in the UK. Journal of Services Marketing, 10, 56.
Brace, I. (2006). Questionnaire Design; How to Plan, Structure and Write Survey Material for Effective Market Research, Glasgow, Kogan Page.
Brignall, S. & Ballantine, J. (1996). Performance Measurement in Service Businesses Revisited. International Journal of Service Industry Management, 7.
Brodie, R., Whittome, J., R.M. & Brush, G. J. (2009). Investigating the Service Brand: A Customer Value Perspective. Journal of Business Research, 62, 345-355.
Brodie, R. J., Glynn, M. S. & Little, V. (2006a). The Service Brand and the Service-Dominant Logic: Missing Fundamental Premise or the Need for Stronger Theory? Marketing Theory, 6, 363-379.

412
Brodie, R. J., Glynn, M. S. & Little, V. (2006b). The Service Brand and The Service Dominant Logic: Missing Fundamental Premise or the Need for Stronger Theory? Marketing Theory, 6, 363-379.
Bromley, D. (2001). Relationship Between Personal and Corporate Reputation. European Journal of Marketing, 35, 316-334.
Brown, R. L. (1994). The Efficacy of The Indirect Approach for Estimating Structural Equation Models with Missing Data: A Comparison of Five Methods. Structural Equation Modeling, 1, 353-367.
Brown, T., Dacin, P., Pratt, M. & Whetten, D. (2006). Identity, Intended Image, Construed Image, and Reputation: An Interdisciplinary Framework and Suggested Methodology. Journal of the Academy of Marketing Science, 34.
Browne, M. W. (1974). Generalized Least Squares Estimators in the Analysis of Covariance Structures. South African Statistical Journal, 8, 1-24.
Browne, M. W. (1984). Asymptotically Distribution-Free methods for the Analysis of Covariance Structures. British Journal of Mathematical and Statistical Psychology, 37.
Browne, M. W. & Cudeck, R. (1993). Alternative Ways of Assessing Model Fit. In Bollen, K. A. & Long, J. S. (Eds.) Testing Structural Equation Models
Newbury Park, CA, Sage. Brownlie, D. & Saren, M. (1992). The Four P's of the Marketing Concept: Prescriptive,
Polemical, Permanent and Problematical. European Journal of Marketing, 26, 34. Burmann, C. & Riley, N. (2008). Towards an Identity Based Understanding of Brand
Management - A Conceptual Approach. The Thought Leaders International Conference on Brand Management Birmingham (15th-16th April). University of Birmingham, England.
Burmann, C. & Zeplin, S. (2005). Building Brand Commitment: A Behavioural Approach to Internal Brand Management. Journal of Brand Management, 12, 279-300.
Burns, T. & Stalker, G. (1961). The Management of Innovation, London, Tavistock. Buttle, F. (1996). Where Do We Go Now in Relationship Marketing? In Buttle, F. (Ed.)
Relationship Marketing; Theory and Practice. London, Paul Chapman Publishing.
Buzzell, R. D., Gale, B. T. & Sultan, R. G. M. (1975). Market Share-A Key to Profitability. Harvard Business Review, 53, 97-106.
Buzzell, R. D. & Gale, T. (1987). The PIMS Principles: Linking Strategy to Performance., New York, Free Press.
Byrne, B. (2001). Structural Equation Modeling with AMOS, New Jersey, Lawrence Erlbaum Associates.
Cabrera, A., Cabrera, E. F. & Barajas, S. (2001). The Key Role of Organizational Culture in a Multi-System View of Technology-Driven Change International Journal of Information Management, 21, 245-261
Cameron, K. S. & Whetten, D. A. (1983). Organizational Effectiveness: One Model or Several? In Camerson, K. S. & Whetten, D. A. (Eds.) Organizational Effectiveness: A Comparison of Multiple Models. New York, Academic Press.
Campaign (2007). Marketing Advertising League (supplied by Nielsen Media Research).

413
Campbell, D. T. (1960). Recommendations for APA Test Standards Regarding Construct, Trait or Discriminant Validity. American Psychologist, 15, 546-553.
Cano, C. R., Carrillat, F. A. & Jaramillo, F. (2004). A Meta-Analysis of the Relationship Between Market Orientation and Business Performance: Evidence from Five Continents. International Journal of Research in Marketing, 21.
Caprara, G. V., Barbaranelli, C. & Guido, G. (2001). Brand personality: How to make the metaphor fit? Journal of Economic Psychology, 22, 377-395.
Carroll, P. (1991). The fallacy of customer retention. Journal of Retail Banking, 13, 15-20.
Carroll, P. (1992). …..and Peter Carroll Rejoins. Journal of Retail Banking, 13, 15-20. Carter, D. E. (1982). Designing Corporate Identity Programs for Small Corporations,
New York, Art Direction Company. cf: Leone, R. P. & Shultz, R. L. (1980). A Study of Marketing Generalizations. Journal
of Marketing, 44, 10-18. cf: Martineau, P. (1958). Sharper Focus For Corporate Image. Harvard Business Review,
36, 49-58. Chakravarthy, B. S. (1986). Measuring Strategic Performance. Strategic Management
Journal, 7. Chan, L., Shaffer, M. A. & Snape, E. (2004). In Search of Sustained Competitive
Advantage: The Impact of Organizational Culture, Competitive Strategy and Human Resource Management Practices on Firm Performance. International Journal of Human Resource Management, 15, 17-35.
Chandler, D. (2007). Semiotics: The Basics, London, Routledge. Chandon, J.-L., Leo, P.-Y. & Philippe, J. (1997). Service encounter dimensions-- a
dyadic perspective. International Journal of Service Industry Management, 8. Chaudhuri, A. (1999). The Relationship of Brand Attitudes and Brand Performance: The
Role of Brand Loyalty. Journal of Marketing Management 9, 1-9. Chaudhuri, A. & Holbrook, M. B. (2001). The Chain of Effects from Brand Trust and
Brand Affect to Brand Performance: The Role of Brand Loyalty. Journal of Marketing, 65, 81-93.
Chen, F., Curran, P. S., Bollen, K. A., Kirby, J. & Paxton, P. (2008). An Empirical Evaluation of the Use of Fixed Cutoff Points in RMSEA Test Statistical in Structural Models. Sociological Methods and Research, 36, 462-494.
Chen, I. J. & Popovich, K. (2003). Understanding Customer Relationship Management, People, Process and Technology. Business Process Management Journal 9, 592-602.
Cheney, G. & Christensen, L. T. (1999). Identity at Issue: Linkages Between internal and External Organisational Communication. In Jablin, F. M. & Putnam, L. L. (Eds.) New Handbook of Organisational Communication. Thousand Oaks, California., Sage.
Cheng, E. W. L. (2001). SEM Being More Effective Than Multiple Regression In Parsimonious Model Testing for Management Development Research Journal of Management Development 20, 650-667.
Chou, C.-P. & Bentler, P. M. (1995). Estimation and Tests in Structural Equation Modeling. In Hoyle, R. (Ed.) Structural Equation Modeling: Concepts, Issues and Applications. Thousand Oaks, California, Sage.

414
Chu, W., Chen, C.-N. & Wang, C.-H. (2008). The Market Share-Profitability Relationships In the Securities Industry. The Service Industries Journal, 28, 813 - 826
Church, A. H. (1993). Estimating the Effect of Incentives on Mail Survey Response Rates: A Meta Analysis. Public Opinion Quarterly, 57, 62-79.
Churchill, G. A. (1995). Marketing Research Chicago, Dryden. Churchill, G. A. & Peter, P. J. (1984). Research Design Effects on the Reliability of
Rating Scales: A Meta Analysis. Journal of Marketing Research, 21, 360-375. Churchill, G. A. J. (1979). A Paradigm for Developing Better Measures of Marketing
Constructs. Journal of Marketing Research, 16, 64-73. Clark, B. H. (1999). Marketing Performance Measures: History and Interrelationships.
Journal of Marketing Management, 15, 711-732. Clark, L. A. & Watson, D. (1995). Constructing Validity: Basic Issues in Scale
Development. Psychological Assessment, 7, 309. Clason, D. L. & Dormody, T. J. (1994). Analyzing Data Measured by Individual Likert-
Type Items Journal of Agricultural Education 35, 31-35. Claycomb, C., Porter, S. S. & Martin, C. L. (2000). Riding the Wave: Response Rates
and the Effects of Time Intervals between Successive Mail Survey Follow-Up Efforts. Journal of Business Research, 48.
Collins, A. M. & Loftus (1975). Spreading-Activation Theory of Semantic Processing. Psychological Review, 82, 407-428.
Collins, J. C. & Porras, J. I. (1994). Built to Last: Successful Habits of Visionary Companies, New York, Harper Business.
Coltman, T. (2007). Can Superior CRM Capabilities Improve Performance in Banking? Journal of Financial Services Marketing, 12, 102-114.
Connelly, J. (2004). Doctors and Managers: Conflicts, Professional Self Images and the Search for Legitimacy. In Learmonth, M. & Harding, N. (Eds.) Unmasking Health Management; A Critical Text. New York:, Nova Science.
Converse, J. M. & Presser, S. (1986). Survey Questions, Beverly Hills, Sage. Conway, J. M. & Huffcutt, A. I. (2003). A Review and Evaluation of Exploratory Factor
Analysis Practices in Organizational Research Organizational Research Methods, 6, 147-167.
Coombs, C., Yongmei, L., Hall, A. & Ketchen, D. (2006). How Much Do High-Performance Work Practices Matter? A Meta-Analysis of their Effects on Organizational Performance. Personnel Psychology: A Journal of Applied Research 59, 501-528.
Corneliss(REPLACE THIS WITH OTHER REFERNCE)en, J. P., Haslam, A. & Balmer, J. M. T. (2007). Social Identity, Organisational Identity and Corporate Identity: Towards an Integrated Understanding of Processes, Patternings and Products. British Journal of Management, 18, S1-S18.
Cornelissen, J. & Harris, P. (2001). The Corporate Identity Metaphor: Perspectives, Problems and Prospects. Journal of Marketing Management, 17, 49-71.
Cornelissen, J. P. (2000). Integrated Marketing Communications and the Language of Market Development. International Journal of Advertising, 20, 483-499.

415
Cornelissen, J. P., Haslam, A. & Balmer, J. M. T. (2007). Social Identity, Organizational Identity and Corporate Identity: Towards an Integrated Understanding of Processes, Patternings and Products. British Journal of Management, 18, S1-S16.
Costello, A. B. & Osborne, J. W. (2005). Best Practices in Exploratory Factor Analysis: Four Recommendations for Getting the Most From Your Analysis. Practical Assessment, Research and Evaluation, 10, 1-9.
Coulthard, L. J. M. (2004). Measuring Service Quality: A Review and Critique of Research Using SERVQUAL. International Journal of Market Research, 46, 479-497.
Coviello, N. E., Brodie, R. J., Danaher, P. J. & Johnston, W. (2002). How Firms Relate to their Markets: An Empirical Examination of Contemporary Marketing Practices. Journal of Marketing, 66, 33-46.
Cox, E. P. (1980). The Optimal Number of Response Alternatives for a Scale: A Review. Journal of Marketing Research, 17.
Crainer, S. (1995). The Real Power of Brands: Making Brands Work for Competitive Advantage, London, Pitman
Crask, M. R. & Laskey, H. A. (1990). A Positioning-Based Decision Model for Selecting Advertising Messages. Journal of Advertising Research, August / September, 32-38.
Creswell, J. W. (2003). Research Design: Qualitative, Quantitative and Mixed Methods Approaches, Thousand Oaks, CA, Sage.
Cretu, A., E. & Brodie, R. (2005). The Influence of Brand Image and Company Reputation Where Manufacturers Market to Small Firms: A Customer Value Perspective. Industrial Marketing Management, 36, 230-240.
Cretu, A., E. & Brodie, R. (2007). The Influence of Brand Image and Company Reputation Where Manufacturers Market to Small Firms: A Customer Value Perspective. Industrial Marketing Management, 36, 230-240.
Cronbach, L. J. (1951). Coefficient Alpha and the Internal Structure of Tests. Psychometrika, 16, 297-334.
Cronbach, L. J. & Meehl, P. E. (1955). Construct Validity in Psychological Tests. Psychological Bulletin, 52, 281-302.
Cronin, J. J. & Page, T. J. (1988). An Examination of the Relative Impact of Growth Strategies on Profit Performance. European Journal of Marketing, 22, 57-68.
Crowne, D. P. & Marlowe, D. (1960). A New Scale for Social Desirability Independent of Psychopathology. Journal of Consulting Psychology, 24, 349-354.
Cudeck, R. (2001). Factor Analysis: Checking Assumptions of Normality Before Conducting Factor Analyses Journal of Consumer Psychology, 10, 79-81.
Cudeck, R. & Browne, M. W. (1983). Cross Validation of Covariance Structures. Multivariate Behavioral Research, 18, 147-167.
Curran, P. S., West, S. G. & Finch, J. F. (1996). The Robustness of Test Statistics to Non Normality and Specification Error in Confirmatory Factor Analysis. Psychological Methods, 1, 16-29.
Cycyota, C. S. & Harrison, D. A. (2002). Enhancing Survey Response Rates at the Executive Level: Are Employee or Consumer Level Techniques Effective? Journal of Management, 28, 151-176.

416
Cycyota, C. S. & Harrison, D. A. (2006). What (Not) to Expect When Surveying Executives: A Meta Analysis of Top Manager Response Rates and Techniques over Time. Organizational Research Methods, 9, 133-160.
Daft, R. L. (2007). Organizational Theory and Design, Cincinnati, Ohio, South-Western. Dall'Olmo Riley, F. & de Chernatony, L. (2000). The Service Brand as Relationship
Builder. British Journal of Management, 11, 137-150. Datamonitor (2007). Global IT Consulting and Other Services. Davidson, H. (1998). Even More Offensive Marketing, London, Penguin. Davies, G. & Chun, R. (2006). The Influence of Corporate Character on Customers and
Employees: Exploring Similarities and Differences. Academy of Marketing Science, 34, 138-146.
Davies, G., Chun, R., da Silva, R. V. & Roper, S. (2004). A Corporate Character Scale to Assess Employee and Customer Views of Organizational Reputation. Corporate Reputation Review, 7, 125-146.
Davies, G., Chun, R. & Vinhas da Silva, R. (2001). The Personification Metaphor as a Measurement Approach to Corporate Reputation. Corporate Reputation Review, 4, 113-127.
Davies, G. & Miles, L. (1998). Reputation Management: Theory Versus Practice. Corporate Reputation Review, 2, 16-27.
Davies, G., R. , Chun, R. V., da Silva, R. V. & Roper, S. (2003). Corporate Reputation and Competitiveness, London, Routledge.
Davis, D. F., Golicic, S. L. & Marquardt, A. J. (2007). Branding a B2B Service: Does a Brand Differentiate a Logistics Service Provider? Industrial Marketing Management, 37, 218-227.
Dawes, J. (1999). The Relationship Between Subjective and Objective Company Performance Measures in Market Orientation Research: Further Empirical Evidence. Marketing Bulletin, 66-75.
Dawes, J. (2008). Do Data Characteristics Change According to the Number of Scale Points Used? International Journal of Market Research, 50, 61-77.
Day, G. (1992). Marketing's Contribution to the Strategy Dialogue. Journal of the Academy of Marketing Science, 20, 323-329.
Day, G. (1999). Misconceptions about Market Orientation. Journal of Market Focused Management, 4.
Day, G. & Nedungadi, P. (1994). Managerial Representations of Competitive Advantage. Journal of Marketing, 58, 31-44.
de Chernatony, L. (1999). Brand Management Through Narrowing the Gap Between Brand Identity and Brand Reputation. Journal of Marketing Management, 15, 157-179.
de Chernatony, L. (2001). From Brand Vision to Brand Evaluation, Oxford, Butterworth-Heinemann.
de Chernatony, L. (2006). From Brand Vision to Evaluation, Oxford, Butterworth-Heinemann.
de Chernatony, L. (2009). Towards the Holy Grail of Defining 'Brand'. Marketing Theory, 9, 101-105.
de Chernatony, L. & Cottam, S. (2008). Interactions Between Organisational Cultures and Corporate Brands. Journal of Product & Brand Management, 17, 13-24.

417
de Chernatony, L., Dall' Olmo Riley, F. & Harris, F. (1998). Criteria to Assess Brand Success. Journal of Marketing Management, 14, 765.
de Chernatony, L. & Dall'Olmo Riley, F. (1997). The Chasm Between Managers' and Consumers' Views of Brands: The Experts Perspectives. Journal of Strategic Marketing, 5, 89-104.
de Chernatony, L. & Dall'Olmo Riley, F. (1998). Defining a 'Brand': Beyond the Literature With Experts' Interpretations. Journal of Marketing Management, 14, 417-443.
de Chernatony, L. & Dall'Olmo Riley, F. (1999). Experts' Views About Defining Services Brands and the Principles of Services Branding. Journal of Business Research, 46, 181-92.
de Chernatony, L., Daniels, K. & Johnson, G. (1993). A Conative Perspective on Managers' Perceptions of Competition. Journal of Marketing Management, 9, 373-381.
de Chernatony, L., Drury, S. & Segal Horn, S. (2003). Building a Services Brand: Stages, People and Orientations. The Services Industries Journal, 23, 1-21.
de Chernatony, L., Harris, F. & Christodoulides, G. (2004). Developing Brand Performance Measure for Financial Service Brands. The Services Industries Journal, 24, 15-33.
de Chernatony, L. & McDonald, M. (1998). Creating Powerful Brands in Consumer, Service and Industrial Markets, Oxford, Butterworth-Heinemann.
de Chernatony, L. & McDonald, M. (2003). Creating Powerful Brands in Consumer, Service and Industrial Markets, Oxford, Butterworth Heinemann.
de Chernatony, L. & McEnally, M. (1999). The Evolving Nature of Branding: Consumer and Managerial Implications. Journal of Consumer and Market Research, 99.
de Chernatony, L. & Segal-Horn, S. (2004). Identifying and Sustaining Services Brands' Values. Journal of Marketing Communications, 10, 73-93.
de Chernatony, L. & Segal Horn, S. (2001). Building on Services' Characteristics to Develop Successful Services Brands. Journal of Marketing Management, 17, 645-669.
de Chernatony, L. & Segal Horn, S. (2003). The Criteria for Successful Services Brands. European Journal of Marketing, 37, 1095-1118.
De Geus, A. (1997). The Living Company: Habits for Survival in a Turbulent Business Environment, Boston, MA, Harvard Business School Press.
Deal, T. E. & Kennedy, A. A. (1982). Corporate Cultures, Reading, MA., Addison-Wesley.
Delaney, J. T. & Huselid, M. A. (1996). The impact of human resource management practices on perceptions of organizational performance. Academy of Management Journal, 39, 949.
Dempster, N., Laird, M. & Rubin, D. B. (1977). Maximum Likelihood From Incomplete Data Via the EM Algorithm. Journal of the Royal Statistical Society: Series B, 39, 1-38.
Demsetz, H. (1973). Industry Structure, Market Rivalry, and Public Policy. Journal of Law and Economics 16, 1-19.
Deng, S. & Dart, J. (1994). Measuring Market Orientation: A Multi-factor, Multi-item Approach. Journal of Marketing Management, 10, 725-742.

418
Denison, D. (1984). Corporate Culture and Organizational Culture and Effectiveness. Organizational Science, 6, 204-223.
Denison, D., Haaland, S. & Goelzer, P. (2004). Corporate Culture and Organizational Effectiveness: Is Asia Different From the Rest of the Word? Organizational Dynamics, 33, 98-109.
Denison, D. R. (1990). Corporate Culture and Organizational Effectiveness, New York, John Wiley.
Denison, D. R. & Mishra, A. K. (1995). Toward a Theory of Organizational Culture and Effectiveness. Organization Science, 6, 204-223.
Dennis, W. J. (2003). Raising Response Rates in Mail Surveys of Small Business Owners: Results of an Experiment. Journal of Small Business Management, 41, 278-295.
Deshpande, R. & Webster, F. (1989a). Organizational Culture and Marketing: Defining the Research Agenda. Journal of Marketing, 53, 3-15.
Deshpande, R. & Webster, F. (1989b). Organizational Culture and Marketing: Defining the Research Agenda. Journal of Marketing, 53, 3-15.
Desphande, D. R. & Farley, J. (1999). Executive Insights: Corporate Culture and Market Orientation: Comparing Indian and Japanese Firms. Journal of International Marketing, 7, 111-127.
Dess, G. G. & Robinson, R. B. J. (1984). Measuring Organizational Performance in the Absence of Objective Measures: The Case of the Privately Held Firm and Conglomerate Business Unit. Strategic Management Journal, 5, 265-273.
DeVellis, R. F. (1991). Scale Development; Theory and Applications, California, Sage. Dewhirst, T. & Davis, B. (2005). Brand Strategy and Integrated Marketing
Communications (IMC): A Case Study of Player's Cigarette Brand Marketing. Journal of Advertising, 34, 81-92.
Diamantopolous, A., Riefler, P. & Roth, K. P. (2008). Advancing Formative Measurement Models. Journal of Business Research.
Diamantopoulos, A. (1999). Export Performance Measurement: Reflective Versus Formative Indicators. International Marketing Review, 16, 444-457.
Dibb, S. & Simkin, L. (2000). Pre-Empting Implementation Barriers: Foundations, Processes and Actions-The Need for Internal Relationships. Journal of Marketing Management, 16, 483-503.
Dick, A. S. & Basu, K. (1994). Customer Loyalty: Toward an Integrated Conceptual Framework. Journal of the Academy of Marketing Science, 22, 99-113.
Dickenson, R., Herbst, A. & O'Shaughnessy, J. (1988). The Marketing Concept and Customer Orientation. European Journal of Marketing, 20, 18-23.
Diefenbach, J. (1987). The Corporate Identity as the Brand. In Murphy, J. M. (Ed.) Branding: A Key Marketing Tool. Basingstoke, Macmillan.
Dillman, D. A. (1978). Mail and Telephone Surveys: The Total Design Method, New York, Wiley-Interscience.
Dillman, D. A. (2000). Mail and Internet Surveys: The Total Design Method, New York, Wiley.
Ding, L., Velicer, W. F. & Harlow, L. L. (1995). Effects of Estimation Methods, Number of Indicators Per Factor and Improper Solutions of Structural Equation Modeling Fit Indices. Structural Equation Modeling, 2.

419
Donaldson, T. & Preston, L. E. (1995). The Stakeholder Theory of the Corporation: Concepts, Evidence and Implications. Academy of Management Review, 20, 65-91.
Dowling, G. R. (1986). Managing Your Corporate Images. Industrial Marketing Management, 15, 109-115.
Dowling, G. R. (1994). Corporate Reputations: Strategies for Developing the Corporate Brand, London, Kogan Page.
Doyle, P. (1989). Building Successful Brands: The Strategic Options. Journal of Marketing Management, 5, 77-95.
Doyle, P. (2000). Value Based Marketing, Chichester, Jon Wiley and Sons. Doyle, P. (2002). Marketing Management and Strategy, Harlow, Prentice Hall. Drucker, P. F. (1954). The Practice of Management, New York, Harper and Row
Publishers. Drucker, P. F. (1964). Managing for Results, New York, Harper Row. Duncan, T. & Moriarty, S. E. (1998). A Communication-Based Marketing Model for
Managing Relationships. Journal of Marketing, 62, 1-13. Duncan, T. R. & Moriarty, S. (1997). Driving Brand Value, New York, McGraw Hill. Dutton, J. E. & Dukerich, J. M. (1991). Keeping An Eye On The Mirror: The Role of
Image and Identity in Organizational Adaptation. Academy of Management Journal, 34, 517-554.
Dutton, J. E., Dukerich, J. M. & Harquail, C. (1994). Organizational Images and Member Identification. Administrative Science Quarterly, 39, 239-263.
Edwards, J. R. & Bagozzi, R. P. (2000). On The Nature and Direction of Relationships Between Constructs and Measures Psychological Methods, 5, 155-174.
Egan, C. & Guilding, C. (1994). Dimensions of Brand Performance: Challenges for Marketing Management and Managerial Accountancy. Journal of Marketing Management, 10, 449-472.
Ehrenberg, A. S. C., Barnard, N. R. & Sharp, B. (2000). Decision models or descriptive models? International Journal of Research in Marketing, 17, 147-158.
Ehrenberg, A. S. C., Uncles, M. D. & Goodhardt, G. (2004). Understanding Brand Performance Measures: Using Dirichlet Benchmarks. Journal of Business Research, 57, 1307-1325.
Einwiller, S. & Will, M. (2002). Towards an Integrated Approach to Corporate Branding-An Empirical Study. Corporate Communications, 7, 100-109.
Eisenbach, R. J. & Schriesheim, C. A. (1995). An Exploratory And Confirmatory Factor-Analytic Investigation of Item Wording Effects on the Obtained Factor Structures of Survey Questionnaire Measures. Journal of Management, 21, 1177-1193.
Elmuti, D., Jia, H. & Gray, D. (2009). Customer Relationship Management Strategic Application and Organizational Effectiveness: An Empirical Investigation. Journal of Strategic Marketing, 17, 75-96.
Emory, C. W. & Cooper, D. R. (1991). Business Research Methods, Homewood, Irwin. European-Commission (2005). The New SME Definition: User Guide and Model
Declaration. Enterprise and Industry Publications. Ewing, M. T. & de Bussy, N. M. (2000). Perceived Agency Politics of Interest as
Potential Barriers to IMC Orientation. Journal of Marketing Communications, 6, 107-119.

420
Fabrigar, L. R., Wegener, D. T., MacCallum, R. C. & Strahan, E. J. (1999). Evaluating the Use of Exploratory Factor Analysis in Psychological Research. Psychological Methods, 4, 272-299.
Falconer, D. J. & Hodgett, A. R. (1999). Why Executives Don't Respond to Your Survey. Proceedings of he 10th Australasian Conference on Information Systems. Wellington, New Zealand.
Fan, X. & Sivo, S. A. (2005). Sensitivity of Fit Indices to Misspecified Structural of Measurement Model Components: Rationale of Two-Index Strategy Revisited. Structural Equation Modeling, 12, 997-1003.
Farnfield, I. (1999). Driving For Effective Positioning and Competitive Differentiation. Journal of Brand Management, 6, 250-257.
Farquhar, P. H. (1989). Managing Brand Equity. Marketing Research 1, 24-33. Farquhar, P. H. (1990). Managing Brand Equity. Journal of Advertising Research, 30,
RC7-RC12. Farris, P. W., Bendle, N. T., Pfeifer, P. E. & Reibstein, D. J. (2008). Marketing
Metrics:50+ Metrics Every Executive Should Master, New Jersey, Pearson. Fichman, M. & Cummings, J. N. (2003). Multiple Imputation for Missing Data: Making
the Most of What You Know. Organizational Research Methods, 6, 282-308. Field, A. (2005). Discovering Statistics Using SPSS, UK, Sage. Fill, C. (2002). Marketing Communications; Contexts, Strategies and Applications,
Harlow, Pearson. Firth, M. (1997). Price Setting and the Value of a Strong Brand Name. International
Journal of Research in Marketing, 10, 381-386. Fishbein, M. & Ajzen, I. (1975). Belief, Attitude, Intention and Behaviour: A
Introduction to Theory and Research, Reading, MA, Addison-Wesley. Fisher, R. A. (1915). Frequency Distribution of the Values of the Correlation Coefficient
in Samples of an Indefinitely Large Population. Biometrika, 10, 507-521. Fitzgerald, L., Johnston, S. & Brignall, S. (1991). Performance Measurement in
Services, London, CIMA. Floyd, F. & Widaman, K. (1995). Factor Analysis in the Development and Refinement
of Clinical Assessment Instruments. Psychological Assessment, 7, 286-299. Fombrun, C. (1996). Reputation: Realizing Value From the Corporate Image, Boston,
Harvard Business School Press. Fombrun, C. & Shanley, M. (1990). What's In a Name? Reputation Building and
Corporate Strategy. Academy of Management Journal, 33, 233. Fombrun, C. & Van Riel, C. (1997). The Reputational Landscape. Corporate Reputation
Review, 1, 5-13. Fombrun, C. J., Gardberg, N. A. & Sever, J. M. (2000). The Reputation Quotient: A
Multi-Stakeholder Measure of Corporate Reputation. Journal of Brand Management, 7, 241-255.
Ford, D., Gadde, L.-E., Hakansson, H. & Snehota, I. (2003). Managing Business Relationships, Chichester, Wiley.
Ford, J. K., MacCallum, R. C. & Tait, M. (1986). The Application of Exploratory Factor Analysis in Applied Psychology: A Critical Review and Analysis. Personnel Psychology, 39, 291-314.

421
Fornell, C. & Larcker, D. F. (1981). Evaluating Structural Equation Models with Unobservable Variables and Measurement Error. Journal of Marketing Research, 18, 39-50.
Fornell, C., Mithas, S., Morgenson, I., F.V. & Krishnan, M. S. (2006). Customer Satisfaction and Stock Prices: High Returns, Low Risk. Journal of Marketing, 70, 3014.
Fornell, C. & Wernerfelt, B. (1987). Defensive Marketing Strategy by Customer Complaint Management: A Theoretical Analysis. Journal of Marketing Research 24, 337-346.
Fornell, C. & Wernerfelt, B. (1988). Model for Customer Complaint Management. Marketing Science, 7, 271-286.
Fournier, S. (1994). A Consumer-brand Relationship Framework for Strategic Brand Management (Unpublished PhD Thesis). University of Florida.
Fournier, S. (1995). Toward the Development of Relationship Theory at the Level of the Product and Brand. Advances in Consumer Research 22.
Fournier, S. (1998). Consumers and their Brands: Developing Relationship Theory in Consumer Research. Journal of Consumer Research, 24, 343.
Fournier, S. (2005). Contracting for Relationships. Advances in Consumer Research, 32, 342-346.
Fox, R. J., Crask, M. R. & Kim, J. (1988). Mail Survey Response Rates: A Meta Analysis of Selected Techniques for Inducing Responses. Public Opinion Quarterly, 52, 467-491.
Free, C. (1999). The Internal Brand. Journal of Brand Management,, 6, 231-236. Freling, T. H. & Forbes, L. P. (2005a). An Empirical Analysis of The Brand Personality
Effect. Journal of Product and Brand Management, 14, 404-413. Freling, T. H. & Forbes, L. P. (2005b). An Examination of Brand Personality Through
Triangulation. The Journal of Brand Management, 13, 148-162. Fricker, J., R.D. & Rand, M. S. (2002). Advantages and Disadvantages of Internet
Research Surveys: Evidence from the Literature. Field Methods, 14, 347-367. Friedman, M. (1982). Monetary Policy. Journal of Money, Credit & Banking. Ohio State
University Press. Galbraith, J. K. (1967). The New Industrial State, Boston, MA, Houghton Miffline. Gale, B. T. (1994). Managing Customer Value, New York, The Free Press. Gale, B. T. & Branch, B. (1982). Concentration Versus Market Share: What Determines
Performance and Why Does It Matter? Antitrust Bulletin,, 27, 83-106. Garland, R. (1991). The Mid-Point On A Rating Scale: Is It Desirable? . Marketing
Bulletin, May 66-70. Gendall, P. (1998). A Framework For Questionnaire Design: Lablaw Revisited.
Marketing Bulletin, 9, 28-39. Gerbing, D. W. & Anderson, E. W. (1984). Monte Carlo Evaluations of Goodness-of-Fit
Indices for Structural Equation Models. In Bollen, K. A. & Long, J. S. (Eds.) Testing Structural Equation Models. Newbury Park, CA, Sage.
Gerbing, D. W. & Anderson, J. C. (1988). An Updated Paradigm for Scale Development Incorporating Unidimensionality and Its Assessment. Journal of Marketing Research, 25, 186-192.

422
Ghodeswar, B. M. (2008). Building Brand Identity in Competitive Markets: A Conceptual Model. Journal of Product and Brand Management, 17, 4-12.
Ghosh, A. K., Chakraborty, G. & Ghosh, D. B. (1995). Improving brand performance by altering consumers' brand uncertainty. Journal of Product & Brand Management, 4, 14.
Gill, J. & Johnson, P. (2002). Research Methods for Managers Sage. Gilliland, D. I. & Johnston, W. J. (1997). Towards a Model of Business-to-Business
Marketing Communications Effects. Industrial Marketing Management, 26, 15-29.
Ginsburg, L. & Miller, N. (1992). Value-Driven Management. Business Horizons, 35, 23-28.
Gioia, D. A., Shultz, M. & Corley, K. G. (2000). Organizational Identity, Image and Adaptive Instability. Academy of Management Review, 25, 63-81.
Gioia, D. A. & Thomas, J. (1996). Image, Identity and Issue Interpretation: Sensemaking During Strategic Change in Academia. Administrative Science Quarterly, 41, 370-403.
Gioia, D. A., Thomas, J. B., Bouchikhi, H., Fiol, M., Golden-Biddle, K., Hatch, M. J., Rao, H., Rindova, V., Schultz, M. J., Fombrun, C., Kimberly, J. & Thomas, J. (1998). The Identity of Organizations. In Whetten, D. A. & Godfrey, P. (Eds.) Identity in Organizations: Developing Theory Through Conversations. Thousand Oaks, California, Sage.
Goddard, J., Tavakoli, M. & Wilson, J. O. S. (2005). Determinants of Profitability in European Manufacturing and Services: Evidence From a Dynamic Panel Model. Applied Financial Economics, 15, 1269-1282.
Golden, B. R. (1992). SBU Strategy and Performance: The Moderating Effects of The Corporte-SBU Relationship. Strategic Management Journal, 13, 145-158.
Golder, P. N. & Tellis, G. J. (1993). Pioneer Advantage: Marketing Logic or Marketing Legend. Journal of Marketing Research, 71, 87-98.
Goldkuhl, L. & Styven, M. (2007). Sensing the Scent of Service Success. European Journal of Marketing, 41, 1297 - 1305.
Goodyear, M. (1996). Divided by a common language. Journal of the Market Research Society, 38, 105-122.
Gordon, G., Calantone, R. J. & DiBenedetto, C. A. (1993). Brand Equity in the Business-to-Business Sector: An Exploratory Study. Journal of Product and Brand Management, 2, 4-16.
Gordon, G. G. & DiTomaso, N. (1992). Predicting Corporate Performance from Organizational Culture. Journal of Management Studies, 29, 783-799.
Gorsuch, R. L. (1983). Factor Analysis, New Jersey, Erlbaum. Gorsuch, R. L. (1997). Exploratory Factor Analysis and Its Role in Item Analysis.
Journal of Personality Assessment 68, 532-560. Govers, P. C. M. & Schoormans, J. P. L. (2005). Product Personality and its Influence on
Consumer Preference. Journal of Consumer Marketing,, 22, 189-197. Gray, E. (1995). Corporate Image as Strategic Concept. 13th Annual Conference of the
Association of Management Vancouver Gray, E. R. & Balmer, J. M. T. (1998). Managing Corporate Image and Corporate
Reputation. Long Range Planning, 31, 695-702.

423
Gray, E. R. & Smeltzer, L. R. (1985). Corporate Image - An Integral Part of Strategy? Sloan Management Review, 26, 73-78.
Gray, E. R. & Smeltzer, L. R. (1987). Planning a Face-lift: Implementing a Corporate Image Program. . Journal of Business Strategy, 8, 4-11.
Green, D. & Lovelock, V. (1983). Understanding the Corporate Symbol. Applied Cognitive Psychology, 8.
Green, P. E. & Rao, V. R. (1970). Rating Scales and Information Recovery. How Many Scales and Response Categories to Use? The Journal of Marketing 34, 33-39.
Greene, W. E., G.D., W. & Schrest, L. J. (1994). Internal Marketing: The Key to External Marketing Success. Journal of Services Marketing, 8, 5-13.
Greenley, G. E. (1995). Market Orientation and Company Performance: Empirical Evidence From UK Companies. British Journal of Management, 6, 1-13.
Greer, T. V., Chuchinprakarn, N. & Seshadri, S. (2000). Likelihood of Participating in Mail Survey Research. Industrial Marketing Management, 29, 97-109.
Gronroos, C. (1984). A Service Quality Model and Its Marketing Implications European Journal of Marketing, 18, 36-44.
Gronroos, C. (1990). Relationship Approach to Marketing in Service Contexts: The Marketing and Organizational Behavior Interface. Journal of Business Research, 20.
Gronroos, C. (1991). The Marketing Strategy Continuum: Towards a Marketing Concept. Services Marketing Management, 29.
Gronroos, C. (2000a). Christian Gronroos: Hanken Swedish School of Economics, Finland. In Fisk, R. P., Grove, S. F. & Joby, J. (Eds.) Services Marketing Self Portraits: Introspections, Reflections, and Glimpses from the Experts. Chicago, American Marketing Association.
Gronroos, C. (2000b). Service Management and Marketing: A Customer Relationship Management Approach, West Sussex, UK, John Wiley & Sons.
Grunig, J. (1993). Image and Substance: From Symbolic To Behavioural Relationships. Public Relations Review, 19, 121-139.
Guest, D. E., Conway, N. & Dewe, P. (2004). Using Sequential Tree Analysis to Search for "Bundles" of HR Practices. Human Resource Management Journal 14, 79-96.
Guiry, M., Magi, A. W. & Lutz, R. J. (2006). Defining and Measuring Recreational Shopper Identity. Journal of the Academy of Marketing Science, 34, 74-83.
Gummesson, E. (1994). Making Relationship Marketing Operational. International Journal of Service Industry Management, 5, 5-20.
Gummesson, E. (1995). Relationship Marketing: It's Role in the Service Economy. In Glynn, W. J. & Barnes, J. G. (Eds.) Understanding Services Management. New York, John Wiley & Sons.
Gummesson, E. (1998). Implementation Requires a Relationship Marketing Paradigm. Journal of the Academy of Marketing Science, 26, 242-249.
Gummesson, E. (2000). Evert Gummesson: Stockholm University, Chicago, American Marketing Association.
Gummesson, E. (2008). Extending the Service-Dominant Logic: From Customer Centricity to Balanced Centricity Journal of the Academy of Marketing Science, 26, 15-17.

424
Guthrie, J. P. (2001). High-Involvement Work Practices, Turnover and Productivity: Evidence from New Zealand. Academy of Management Journal, 44, 180-190.
Gwinner, K. P. & Eaton, J. (1999). Building Brand Image Through Event Sponsorship: The Role if Image Transfer. Journal of Advertising, 38, 47-57.
Haigood, T. L. (1999). The Brand Personality Effect: An Empirical Investigation. In Menon, A. & Sharma, A. (Eds.) American Marketing Association Winter Educators' Conference Proceedings: Marketing Theory and Applications. Chicago, American Marketing Association
Hair, J. F. J., Anderson, R. E., Tatham, R. L. & Black, W. C. (1998). Multivariate Data Analysis, Upper Saddle River, NJ, Prentice Hall.
Hair, J. F. J., Bush, R. & Ortinau, D. (2006). Marketing Research, Boston, McGraw-Hill. Hall, R. (1992). The Strategic Analysis of Intangible Resources. Strategic Management
Journal, 13, 135-142. Han, J. K., Namwoon, K. & Srivastava, R. K. (1998). Market Orientation and
Organizational Performance: Is Innovation the Missing Link? Journal of Marketing, 62, 30-45.
Han, S.-L. & Sung, H.-S. (2008). Industrial Brand Value and Relationship Performance in Business Markets - A General Structural Equation Model. Industrial Marketing Management, 37, 807-818.
Hansen, F. (1972). Consumer Choice Behavior: A Cognitive Theory New York, The Free Press.
Hardaker, S. & Fill, C. (2005). Corporate Services Brands: The Intellectual and Emotional Engagement of Employees. Corporate Reputation Review, 7, 365-376.
Hardesty, D. & Bearden, W. O. (2004). The Use of Expert Judges in Scale Development - Implications for Improving Face Validity of Unobservable Measures. Journal of Business Research, 57, 98-107.
Harris, E. G. & Fleming, D. E. (2005). Assessing the Human Element in Service Personality Formation: Personality Congruity and the Five Factor Model. Journal of Services Marketing, 19, 187-198.
Harris, F. & de Chernatony, L. (2001). Corporate Branding and Corporate Brand Performance. European Journal of Marketing, 35, 441-456.
Harris, L. C. & Ogbonna, E. (2001). Strategic human resource management, market orientation, and organizational performance. Journal of Business Research, 51, 157-166.
Harrison, R. (1972). Understanding your organization's character. Harvard Business Review, 50, 119-128.
Hart, S. (1987). The Use of Survey in Industrial Market Research. Journal of Marketing Management, 3, 25-38.
Hartigan, M. F. (1987). A Company Study Organising for Global Identity. Journal of Business and Industrial Marketing, 2, 65-73.
Haslam, S. A. (2001). Psychology in Organizations: The Social Identity Approach London, Sage.
Hatch, M. J. & Rubin, J. (2006). The Hermeneutics of Branding. Journal of Brand Management, 14, 40-59.
Hatch, M. J. & Schultz, M. (1997). Relations Between Organizational Culture, Identity and Image. European Journal of Marketing, 31, 356.

425
Hatch, M. J. & Schultz, M. (2000). Scaling The Tower of Babel. In Schultz, M., Hatch, M. J. & Holten Larsen, M. (Eds.) The Expressive Organization. New York, Oxford University Press.
Haynes, R., Richards, D. C. & Kubany, E. S. (1995). Content Validity in Psychological Assessment: A Functional Approach to Concepts and Methods. Psychological Assessment, 7.
He, H.-W. & Balmer, J. M. T. (2007a). Identity Studies: Multiple Perspectives and Implications for Corporate-Level Marketing. European Journal of Marketing, 41, 765-785.
He, H.-W. & Mukherjee, A. (2009a). Corporate Identity and Consumer Marketing: A Process Model and Research Agenda. Journal of Marketing Communications, 15.
He, H.-W. & Mukherjee, A. (2009b). Corporate Identity and Consumer Marketing: A Process Model and Research Agenda. Journal of Marketing Communications, 15, 1-16.
He, H. & Balmer, J. M. T. (2007b). Multiple Perspectives and Implications for Corporate-Level Marketing. European Journal of Marketing, 41, 765-785.
Helgeson, J. & Supphellen, M. (2004). A Conceptual Measurement Comparison of Self Congruity and Brand Personality. International Journal of Market Research, 46, 205-233.
Helgeson, J. G., Voss, K. E. & Terpening, W. D. (2002). Determinants of Mail-Survey Response: Survey Design Factors and Respondent Factors. Psychology and Marketing, 19, 303-328.
Henderson, P. & Cote, J. (1998). Guidelines for Selecting or Modifying Logos. Journal of Marketing, 62, 14-30.
Henderson, P., Cote, J., Leong, S. M. & Schmitt, B. (2003). Building Strong Brands in Asia: Selecting the Visual Components of Image to Maximise Brand Strength. International Journal of Research in Marketing, 20, 297-313.
Hendricks, K. B., Singhal, V. & Stratham, J. K. (2007). The Impact of Enterprise Systems on Corporate Performance: A Study of ERP, SCM and CRM Implementation. Journal of Operations Management, 25, 65-82.
Herche, J. & Engellend, B. (1996). Reversed Polarity Items and Scale Dimensionality. Journal of the Academy of Marketing Science, 24, 366-374.
Heskett, J. L. (1987). Lessons in The Service Sector. Harvard Business Review, 87, 118-126.
Heskett, J. L., Jones, T. O., Loveman, G. W., Sasser Jr, W. E. & Schlesinger, L. A. (1994). Putting the Service-Profit Chain to Work. Harvard Business Review, 72, 164-170.
Heskett, J. L., Sasser, W. E., Jnr & Schlesinger, L. A. (1997). The Service Profit Chain: How Leading Companies Link Profit and Growth to Loyalty, Satisfaction, and Value, New York, The Free Press.
Hinde, R. A. (1995). A Suggested Structure for a Science of Relationships Personal Relationships 2, 1-15.
Hinkle, S., Taylor Fox-Gardamone, D. L. & Crook, K. F. (1989). Intragroup Identification and Intergroup Differentiation: A Multicomponent Approach. British Journal of Social Psychology, 28, 305-317.
426
Hitt, M. A., Biermant, L., Shimizu, K. & Kochhar, R. (2001). Direct And Moderating Effects Of Human Capital On Strategy And Performance In Professional Service Firms: A Resource-Based Perspective Academy of Management Journal, 44, 13-28.
Hoeffler, S. & Keller, K. L. (2003a). Building Brand Equity Through Corporate Societal Marketing. Journal of Public Policy & Marketing;, 21, 78-89.
Hoeffler, S. & Keller, K. L. (2003b). The Marketing Advantages of Strong Brands. Journal of Brand Management, 10, 331-350.
Hoelter, J. W. (1983). The Analysis of Covariance Structures: Goodness-of-Fit Indices. Sociological Methods and Research, 11, 325-344.
Hofstede, G. (1998). Attitudes, Values and Organizational Culture: Dissentangling the Concepts. Organization Studies, 19, 477-492.
Holm, O. (2006). Integrated Marketing Communication: From Tactics to Strategy. Corporate Communications: An International Journal, 11, 23-33.
Holt, D. B. (2002). Why Do Brands Cause Trouble? A Dialectical Theory of Consumer Culture and Branding. Journal of Consumer Research, 29, 70-90.
Homans, G. C. (1958). Social Behavior as Exchange. The American Journal of Sociology, 63, 597-606.
Houston, F. S. & Gassenheimer, J. B. (1987). Marketing and Exchange. Journal of Marketing, 51.
Howell, D. C. (2008). The Analysis of Missing Data. In Outhwaite, W. & Turner, S. (Eds.) Handbook Of Social Science Methodology. London, Sage.
Hoyle, R. (1995). Structural Equation Modeling: Concepts, Issues and Applications, Thousand Oaks, CA., Sage Publications.
Hu, L. & Bentler, P. M. (1995). Evaluating Model Fit. In Hoyle, R. (Ed.) Structural Equation Modeling: Concepts, Issues and Applications. Thousand Oaks, CA, Sage.
Hu, L. & Bentler, P. M. (1998). Fit Indices in Covariance Structure Modeling: Sensitivity to Unparameterized Model Misspecification. Psychological Methods, 3, 424-453.
Hu, L. & Bentler, P. M. (1999). Cutoff Criteria for Fit Indexes in Covariance Structure Analysis: Conventional Criteria versus New Alternatives. Structural Equation Modeling, 6, 1-55.
Hu, L., Bentler, P. M. & Kano, Y. (1992). Can Test Statistics In Covariance Structure Analysis Be Trusted? Psychological Bulletin, 112.
Hudson, L. A. & Ozanne, J. L. (1998). Alternative Ways of Seeking Knowledge in Consumer Research Journal of Consumer Research, 14, 508-522.
Hulberg, J. (2006). Integrating corporate branding and sociological paradigms: A literature study. Journal of Brand Management, 14, 60-73.
Huselid, M. A. (1995). The Impact of Human Resource Management Practices on Turnover, Productivity, and Corporate Performance. Academy of Management Journal, 38, 635.
Huselid, M. A. & Becker, B. E. (2000). Comment on "Measurement Error in Research on Human Resources and Firm Performance: How Much Error is There and How Does it Influence Effect Size Estimates?" by Gerhart, Wright, McHahan and Snell. Personnel Psychology, 53, 835-854.

427
Hutcheson, G. & Sofroniou, N. (1999). The Multivariate Social Scientist, London, Sage. Hutton, J. G. (1996). Integrated Marketing Communications and the Evolution of
Marketing Thought. Journal of Business Research, 37, 155-163. Hutton, J. G. (1997). A Study of Brand Equity in an Organizational-Buying Context.
Journal of Product and Brand Management, 6, 428-439. Iacobucci, D., Ostrom, A. & Grayson, K. (1995). Distinguishing Service Quality and
Customer Satisfaction: The Voice of the Consumer. Journal of Consumer Psychology, 4, 277-303.
Iacobucci, D., Saldanha, N. & Deng, X. (2007). A Meditation on Mediation: Evidence That Structural Equations Models Perform Better Than Regressions. Journal of Consumer Psychology, 2007, 2.
Ilieva, J., Baron, S. & Healy, M. (2002). Online Surveys in Marketing Research: Pros and Cons. International Journal of Market Research, 44, 361-376.
Illia, L. & Lurati, F. (2006). Stakeholder Perspectives on Organizational Identity: Searching for a Relationship Approach. Corporate Reputation Review, 8, 293-304.
Ind, N. (1997). The Corporate Brand, Basingstoke, UK, Macmillan. Ittner, C. & Larcker, D. F. (2003). Coming Up Short on Nonfinancial Performance
Measurement. Harvard Business Review, November, 89-95. Izquierdo, C. C., Cillan, J. G. & Gutierrez, S. S. M. (2005). The Impact of Customer
Relationship Marketing on the Firm's Performance: A Spanish Case. Journal of Services Marketing, 19, 234-244.
Jackson, D. W. & Tax, S. S. (1995). Managing the Industrial Salesforce Culture. Journal of Business and Industrial Marketing, 10, 34-47.
James, M. (1990). Marketing Dossier: Positive Vibes. Marketing June 21, 29-30. Jarvis, C. B., Mackenzie, S. B. & Podsakoff, P. M. (2003). A Critical Review of
Construct Indicators and Measurement Model Misspecification in Marketing and Consumer Research. Journal of Consumer Research, 30, 199-218.
Jaworski, B. J. & Kohli, A. K. (1993). Market orientation: Antecedents and Consequences Journal of Marketing, 57, 53-70.
Jaworski, B. J. & Kohli, A. K. (1996). Market Orientation: Review, Refinement and Roadmap. Journal of Focused Marketing Management, 1, 119-135.
Jayachandran, S., Sharma, S., Kaufman, P. & Raman, P. (2005). The Role of Relational Information Processes and Technology Use In Customer Relationship Management. Journal of Marketing, 69, 177-192.
Jevons, C. & Gabbott, M. (2009). A Historical Review of the Development of Definitions of "Brand". 5th Thought Leaders International Conference on Brand Management Athens, Greece.
Jobber, D. (1986). Improving Response Rates in Industrial Marketing Surveys. Industrial Marketing Management, 15, 183-195.
Jobber, D. & O'Reilly, D. (1998). Industrial Mail Surveys: A Methodological Update. Industrial Marketing Management 27, 95-107.
Johar, G. V., Sengupta, J. & Aaker, J. (2005). Two Roads to Updating Brand Personality Impressions: Trait Versus Evaluative Inferencing. Journal of Marketing Research, 22, 458-469.

428
Johnson, J. M., Bristow, D. N. & Schneider, K. C. (2004). Did You Not Understand The Question or Not? An Investigation Of Negatively Worded Questions in Survey Research. Journal of Applied Business Research, 20, 75-85.
Jonassen, H. D. (1995). Operationalizatig Mental Models: Strategies for Assessing Mental Models to Support Meaningful Learning and Design-Supportive Learning Environments. Instructional Systems Pennsylvania State University.
Jones, J. P. & Blair, M. H. (1996). Examining 'Conventional Wisdoms' About Advertising Effects with Evidence From Independent Stores. Journal of Advertising Research, 36, 37-60.
Jones, R. (2000). The Big Idea, London, Harper Collins. Jones, T. M. (1995). Instrumental Stakeholder Theory: A Synthesis of Ethics and
Economics. Academy of Management Review, 20, 404-437. Joreskog, K. G. & Sorbom, D. (1988). LISREL: A Guide to Program and Applications,
Chicago, SPSS Inc. Judd, R. C. (1964). The Case for Redefining Services. Journal of Marketing, 28, 58-59. Jun, J.-W., Cho, C.-H. & Kwon, H. J. (2008). The Role of Affect and Cognition in
Consumer Evaluations of Corporate Visual Identity: Perspectives from United States and Korea. Brand Management, 15, 382-398.
Kaiser, H. F. (1960). The Application of Electronic Computers to Factor Analysis. Educational and Psychological Management, 41, 141-151.
Kalakota, R. & Robinson, M. (2000). E-Business: Roadmap To Success, New York, Prentice Hall.
Kapferer, J. N. (1997). Strategic Brand Management, London, Kogan Page. Kapferer, J. N. (2004). The New Strategic Brand Management: Creating and Sustaining
Brand Equity Long Term, London, Kogan Page. Kaplowitz, M. D., Hadlock, T. D. & Levine, R. (2004). A Comparison of Web and Mail
Survey Response Rates. Public Opinion Quarterly, 68, 94-101. Karatepe, O. M., Avci, T. & Tekinkus, M. (2005). Measuring Marketing Culture: A
Study of Frontline Employees In Turkish Hotels. Journal of Travel and Tourism Marketing, 18, 33-47.
Kass, R. A. & Tinsley, H. E. (1979). Factor Analysis. Journal of Leisure Research, 11, 120-138.
Kay, J. (1992). Foundations of Corporate Success, Oxford Oxford University Press. Keller, K. L. (1993). Measuring and Conceptualising Brand Equity. Journal of
Marketing, 57, 1-22. Keller, K. L. (1998). Strategic Brand Management: Building, Measuring and Managing
Brand Equity, Upper Saddle River, NJ, Prentice Hall. Keller, K. L. (2001). Mastering the Communications Mix: Micro and Macro
Perspectives on Integrated Marketing Communications. Journal of Marketing Management, 17, 819-847.
Keller, K. L. (2003). Strategic Brand Management: Building, Measuring and Managing Brand Equity, Upper Saddle River, New Jersey, Prentice Hall.
Keller, K. L. & Aaker, D. A. (1998). Corporate Level Marketing: The Impact of Credibility of Corporate Extensions. Corporate Reputation Review, 1, 236-378.
Keller, K. L., Aperia, T. & Georgson, M. (2008). Strategic Brand Management, Harlow, Pearson Education.

429
Keller, K. L. & Lehmann, D., R. (2006). Brands and Branding: Research Findings and Future Priorities. Marketing Science, 25, 740-759.
Keller, K. L. & Richey, K. (2006). The Importance of Corporate Brand Personality Traits to a Successful 21st Century Business. Brand Management, 14, 74-81.
Kelloway, K. E. (1998). Using LISREAL for Structural Equation Modelling: A Researcher's Guide, Thousand Oaks, California, Sage.
Kennedy, R., Riquier, C. & Sharp, B. (1996). Practical Applications of Correspondence Analysis to Categorical Data in Market Research. Journal of Targeting, Measurement and Analysis for Marketing, 5, 56-70.
Kennedy, S. H. (1977). Nurturing Corporate Image: Total Communication or Ego Trip. European Journal of Marketing, 31, 120-164.
Keon, J. W. (1991). Point of View: Understanding the Power of Expert Systems in Marketing - When and How to Build Them. Journal of Advertising Research, 31, 64-73.
Keynote (2008). B2B Marketing - Market Assessment. February. Kilmann, R. H., Saxton, M. J. & Serpar, R. (1985). Gaining Control of the Corporate
Culture, San Francisco, Jossey-Bass. Kim, H.-B., Kim, W. G. & An, J. A. (2003a). The Effect of Consumer-Based Brand
Equity on Firms' Financial Performance. The Journal of Consumer Marketing, 20, 335.
Kim, H.-B., Kim, W. G. & An, J. A. (2003b). The Effect of Consumer-Based Brand Equity on Firms' Financial Performance. The Journal of Consumer Marketing, 20, 335-351.
Kim, S., Lee, J. & Yu, K. (2004). Corporate Culture and Performance. Journal of Managerial Psychology, 19, 340-359.
King, B. G. & Whetten, D. (2008). Rethinking the Relationship Between Reputation and Legitimacy: A Social Actor Conceptualization. Corporate Reputation Review., 11, 192-207.
King, S. (1991). Brand Building in the 1990's. Journal of Marketing Management, 7, 3-13.
Kitchen, P., J., Brignall, J., Li, T. & Spicket, G. S. (2004). The Emergence of IMC: A Theoretical Perspective. Journal of Advertising Research, 44, 19-30.
Klassen, R. D. & Jacobs, J. (2001). Experimental Comparison of Web, Electronic and Mail Survey Technologies in Operations Management Journal of Operations Management, 19, 713-728.
Kliatchko, J. (2005). Towards a New Definition of Integrated Marketing Communications (IMC). International Journal of Advertising, 24, 7-34.
Kliatchko, J. (2008). Revisiting the IMC Construct: A Revised Definition and Four Pillars. International Journal of Advertising, 27, 133-160.
Klink, R. R. (2001). Creating Meaningful New Brand Names: A Study of Semantics and Sound Symbolism. Journal of Marketing Theory and Practice, Spring, 27-34.
Kocak, A., Abimbola, T. & Ozer, A. (2007). Consumer Brand Equity in a Cross-Cultural Replication: An Evaluation of a Scale Journal of Marketing Management, 23, 157-173.
Kohli, A. K. & Jaworski, B. J. (1990). Market Orientation: The Construct, Research Propositions, and Managerial Implications. Journal of Marketing, 54, 1-18.

430
Kotler, P. (1967). Managerial Marketing, Planning, Analysis and Control, Englewood Cliffs, NJ, Prentice Hall
Kotler, P. (1972). A Generic Concept of Marketing. Journal of Marketing, 37, 54-59. Kotler, P. (1977a). From Sales Obsession to Marketing Effectiveness. Harvard Business
Review, 55, 67-75. Kotler, P. (1977b). Marketing Management: Analysis, Planning, Implementation and
Control, Upper Saddle River, New Jersey, Prentice Hall. Kotler, P. (1991). Marketing Management: Analysis, Planning and Control, Englewood
Cliffs; New Jersey, Prentice Hall. Kotler, P. (1997). Marketing Management: Analysis, Planning, Implementation and
Control, Upper Saddle River, N.J., Prentice-Hall. Kotler, P. & Keller, K. L. (2006a). A Framework for Marketing Management, Prentice
Hall. Kotler, P. & Keller, K. L. (2006b). Marketing Management London Prentice Hall. Kotler, P. & Keller, K. L. (2008). Marketing Management Prentice Hall Kotler, P. & Pfoertsch, W. (2006a). B2B Brand Management Berlin, Springer. Kotler, P. & Pfoertsch, W. (2006b). B2B Brand Management, Berlin, Springer. Kotter, J. & Heskett, J. (1992). Corporate Culture and Performance, New York, The
Free Press. Krosnick, J. A. & Fabrigar, L. R. (1997). Designing Rating Scales for Effective
Management in Surveys. In Lyberg, P., Biemer, P., Collins, M., deLeeuw, E., Dippo, C., Schwarz, N. & Trewin, D. (Eds.) Survey Management And Process Quality. New York, Wiley.
Kuhn, T. (1996). The Structure of Scientific Revolutions Chicago, University of Chicago Press.
Kunde, J. (2000). Corporate Religion, London, Pearson Education. La Du, T. J. & Tanaka, J. S. (1989). Influence of Sample Size, Estimation Method, and
Structural Specification on Goodness-of-Fit Assessments in Structural Equation Models. Journal of Applied Psychology, 74, 625-635.
Lam, T. C. M. & Stevens, J. J. (1994). Effects of Content Polarization, Item Wording, and Rating Scale Width on Rating Response. Applied Measurement in Education, 7, 141-159.
Lamons, B. (2005). A Case for B2B Branding: Pulling Away From the Business-to-Business Pack
Ohio, Thomson. Landon, E. L. (1974). Self Concept, Ideal Self-Concept and Consumer Purchase
Intentions. Journal of Consumer Research, 1, 44-51. Lannon, J. (1992). Asking The Right Questions - What Do People Do With Advertising?
ADAMP, March, 11-16. Larson, P. D. & Chow, G. (2003). Total Cost / Response Rate Trade-Offs in Mail Survey
Research: Impact of Follow-Up Mailings and Monetary Incentives. Industrial Marketing Management, 32, 533-537.
Larson, P. D. & Poist, R. F. (2004). Improving Response Rates to Mail Surveys: A Research Note. Transportation Journal Fall, 67-74.

431
Laurent, G. (2000). Improving the external validity of marketing models:: A plea for more qualitative input. International Journal of Research in Marketing, 17, 177-182.
Law, K. S., Wong, C. S. & Mobley, W. H. (1998). Toward a Taxonomy of Multidimensional Constructs. Academy of Management Review, 23, 741-755.
Lee, D. H. & Park, C. W. (2007). Conceptualization and Measurement of Multidimensionality of Integrated Marketing Communications. Journal of Advertising Research, September, 223-236.
Lee, S. K. J. & Yu, K. (2004). Corporate Culture and Organizational Performance. Journal of Managerial Psychology, 19, 340-359.
Lee, T. W. (1999). Using Qualitative Methods in Organizational Research, Thousand Oaks, California, Sage
Leeflang, P. S. H. & Wittink, D. R. (2000). Building Models for Marketing Decisions: Past, Present and Future. International Journal of Research in Marketing, 17, 105-126.
Leeflang, P. S. H., Wittink, D. R., Wedel, M. & Naert, P. A. (2000). Building Models for Marketing Decisions, Boston, Kluwer Academic Publishers.
Legg, D. & Baker, J. (1987). Advertising Strategies for Service Firms. In Surprenant, C. (Ed.) Add Value to Your Service. Chicago, , American Marketing Association
Lehmann, D. R., Keller, K. L. & Farley, J. U. (2008). The Structure of Survey-Based Brand Metrics. Journal of International Marketing, 16, 29-56.
Lei, M. & Lomax, R. G. (2005). The Effect of Varying Degrees of Nonnormality in Structural Equation Modeling Structural Equation Modeling: A Multidisciplinary Journal, , 12, 1-27.
Lencastre, P. & Corte-Real, A. (2007). Names and Logos Memorisation: An Empirical Research. Thought Leaders International Conference on Brand Management. University of Birmingham, UK.
Leone, R. P. & Shultz, R. L. (1980). A Study of Marketing Generalizations. Journal of Marketing, 44, 10-18.
Lepak, D. P., Takeuchi, R., Erhardt, N. L. & Colakoglu, S. (2006). Emerging Perspectives on the Relationship Between HRM and Performance. In Burke, R. J. & Cooper, C. L. (Eds.) The Human Resources Evolution, Why Putting People First Matters. Amsterdam, Elsevier.
Levitt, T. (1960). Marketing Myopia. Harvard Business Review, 38, 45-56. Levitt, T. (1972). Production Line Approach to Service. Harvard Business Review, 50,
41-52. Levitt, T. (1981). Marketing Intangible Products and Product Intangibles. Harvard
Business Review, 59, 94-102. Levy, S. J. (1959). Symbols for Sales. Harvard Business Review, 37, 117-124. Levy, S. J. (2006). How New, How Dominant? In Lusch, R. F. & Vargo, S. L. (Eds.) The
Service Dominant Logic of Marketing - Dialog, Debate adn Directions. New Yori, M.E. Sharpe Inc.
Lilien, G. L., Kotler, P. & Moorthy, K. S. (1992). Marketing Models, Englewood Cliffs, NJ, Prentice Hall.
Lindstrom, M. (2005). Broad Sensory Branding. The Journal of Product and Brand Management., 2/3.

432
Lings, I. N. & Greenley, G. E. (2005a). The Impact of Internal and External Market Orientations of Firm Performance. ANZMAC 2005 Conference: Strategic Marketing and Marketing Orientation Budapest.
Lings, I. N. & Greenley, G. E. (2005b). Measuring Internal Market Orientation. Journal of Service Research 7, 290.
Lings, I. N. & Greenley, G. E. (2009). The Impact of Internal and External Market Orientations on Firm Performance. Journal of Strategic Marketing, 17, 41-53.
Little, J. D. C. (1970). Models and Managers: The Concept of a Decision Calculus. Management Science, 16, 466-485.
Little, J. D. C. (1975). BRANDAID: A Marketing Mix Model: Part 1; Structure. Operations Research, 23, 628-655.
Little, R. J. A. (1998). A Test of Missing Completely at Random for Multivariate Data With Missing Values. Journal of the American Statistical Association, 83, 1198-1202.
Little, R. J. A. & Rubin, D. B. (1987). Statistical Analysis with Missing Data, New York, Wiley.
Littlejohn, S. W. (1993). Theories of Human Communication, Belmont; California, Wadsworth.
Loevinger, J. (1954). The Attenuation Paradox in Test Theory. Psychological Bulletin, 51, 493-504.
Lok, P. & Crawford, J. (2004 ). The Effect of Organisational Culture and Leadership Style on Job Satisfaction and Organisational Commitment. The Journal of Management Development, 23 321-338.
Lovelock, C., Vandermerwe, S. & Lewis, B. (1999). Services Marketing: A European Perspective, London, Prentice-Hall,.
Lovelock, C. H. (1998). Managing Services: Marketing Operations and Human Resources, Englewood Cliffs, NJ., Prentice Hall.
Low, G. S. (2000). Correlates of Integrated Marketing Communications. Journal of Advertising Research, 40, 27-39.
Low, G. S. & Lamb, C. W. (2000). The Measurement and Dimensionality of Brand Associations. The Journal of Product and Brand Management, 9, 350-368.
Low, J. & Blois, K. (2002). The Evolution of Generic Brands in Industrial Markets: The Challenges to Owners of Brand Equity. Industrial Marketing Management, 31, 385-392.
Lunn, T. (1978). Consumer Modelling. In Worcester, R. & Dowhham, J. (Eds.) Consumer Market Research Handbook. New York, Van Nostrand Company.
Lusch, R. F. & Vargo, S. L. (2006). Service-dominant logic: reactions, reflections and refinements. Marketing Theory, 6, 281-288.
Lusch, R. F. & Vargo, S. L. (2008). The Service-Dominant Mindset. Service Science, Management and Engineering, 89-96.
Lusch, R. F., Vargo, S. L. & O'Brien, M. (2007). Competing through service: Insights from service-dominant logic. Journal of Retailing, 83, 5-18.
Lynch, J. & de Chernatony, L. (2004). The Power of Emotion: Brand Communication in Business-to-Business Markets. The Journal of Brand Management, 11, 403-411.

433
Lynch, J. & de Chernatony, L. (2007). Winning Hearts and Minds: Business-to-Business Branding and the Role of the Salesperson. Journal of Marketing Management, 23, 123-135.
Lytle, R. S., Hom, P. W. & Mokwa, M. P. (1998). SERV*OR: A Managerial Measure of Organizational Service-Orientation. Journal of Retailing, 4.
MacCallum, R. C. (1995). Model Specification. In Hoyle, R. (Ed.) Structural Equation Modelling: Concepts, Issues and Applications. Thousand Oaks, CA, Sage.
MacCallum, R. C., Roznowski, M. & Necowitz, L. B. (1992). Model Modifications In Covariance Structure Analysis: The Problem of Capitalization on Chance. Psychological Bulletin, 111, 490-504.
MacCallum, R. C., Widaman, K., Zhang, S. & Hong, S. (1999). Sample Size in Factor Analysis. Psychological Methods, 4, 84-99.
MacInnis, D. J. & Price, L. L. (1987). The Role of Imagery in Information Processing: Review and Extensions. Journal of Consumer Research, 13, 473-491.
Mackay, M. M. (2001). Evaluation of brand equity measures: further empirical results. The Journal of Product and Brand Management, 10, 38.
Mackenzie, S. B., Podsakoff, P. M. & Jarvis, C. B. (2005). The Problem of Measurement Model Misspecification in Behavioural and Organizational Research and Some Recommended Solutions. Journal of Applied Psychology, 90, 710-730.
Madhavaram, S., Badrinarayanan, V. & McDonald, R. E. (2005). Integrated Marketing Communications (IMC) and Brand Identity as Critical Components of Brand Equity Strategy: A Conceptual Framework and Research Propositions. Journal of Advertising 34, 69-80.
Mael, F. & Ashford, B. E. (1992). Alumini and Their Alma Mater: A Partial Test for the Reformulated Model of Organizational Identification. Journal of Organizational Behavior, 13, 103-123.
Magin, S., Algesheimer, R., Huber, F. & Herrman, A. (2003). The Impact of Brand Personality and Customer Satisfaction on Customer's Loyalty: Theoretical Approach and Findings of a Causal Analytical Study in the Sector of Internet Service Providers. Electronics Markets, 13, 294-308.
Maglio, P. P., Vargo, S. L., Caswell, N. & Spohrer, J. (2009). The Service System is the Basic Abstraction of the Service Science. Information Systems and E Business Management.
Malaval, P. (2002). Strategy and Management of Industrial Brands: Business to Business - Products & Services
Springer. Malhotra, N. (2005). Attitude and Affect: New Frontiers of Research in the 21st Century.
Journal of Business Research, 58, 477-482. Malhotra, N. & Birks, D. (2006). Marketing Research: An Applied Approach Financial
Times/ Prentice Hall. Malthouse, E. (2001). Factor Analysis: Checking Assumptions of Normality Before
Conducting Factor Analyses Journal of Consumer Psychology, 10, 79-81. Marchand, R. (1985). Advertising the American Dream: Making Way for Modernity,
1920-1940. , Berkeley, CA., University of California Press. Margulies, W. (1977). Make the Most of Your Corporate Identity. Harvard Business
Review, July-August, 66-72.

434
Marketer (2009). The Marketer Chartered Institute of Marketing Markland, D. (2007). The Golden Rule is that there are no Golden Rules: A Commentary
on Paul Barett's Recommendations for Reporting Model Fit in Structural Equation Modelling. Personality and Individual Differences, 42, 851-858.
Markwick, N. & Fill, C. (1997). Towards a Framework for Managing Corporate Identity. European Journal of Marketing, 31, 396.
Marsh, H. W., Balla, J. R. & McDonald, R. P. (1988a). Goodness-of-Fit Indexes in Confirmatory Factory Analysis: The Effect of Sample Size. Psychological Bulletin, 10, 391-410.
Marsh, H. W., Balla, J. R. & McDonald, R. P. (1988b). Goodness of Fit Indexes in Confirmatory Factor Analysis. Psychological Bulletin, 103, 391-410.
Marsh, H. W., Hau, K. T. & Wen, Z. (2004). In Search of Golden Rules: Comment on Hypothesis-Testing Approaches to Setting Cutoff Values for Fit Indexes and Dangers in Overgeneralizing Hu and Bentler's (1999) Findings. . Structural Equation Modeling, 11, 320-341.
Martin, S. (1988). Market Power and/or Efficiency. Review of Economics and Statistics, 70, 331-335.
Martins, E. C. & Terblanche, F. (2003). Building Organisational Culture that Stimulates Creativity and Innovation. 6, 64 - 74.
Marwick, N. & Fill, C. (1997). Towards a Framework for Managing Corporate Identity. European Journal of Marketing, 31, 396.
Matear, S., Gray, B. J. & Garrett, T. (2004). Market Orientation, Brand Investment, New Service Development, Market Position and Performance for Service Organisations. International Journal of Service Industry Management, 15, 284-301.
Matell, M. S. & Jacoby, J. (1972). Is There An Optimal Number of Alternatives for Likert Scale Items? Effects of Testing Time and Scale Properties. . Journal of Applied Psychology, 56, 506-509.
McCracken, G. (1988). Culture and Consumption: New Approaches to the Symbolic Character of Consumer Goods and Activities, Bloomington, US, Indiana University Press.
McDonald, H. B., de Chernatony, L. & Harris, F. (2001). Corporate Marketing and Service Brands; Moving Beyond The Fast-Moving Consumer Goods Model. European Journal of Marketing, 35, 335-353.
McDonald, R. P. & Ho, M.-H. R. (2002). Principles and Practice in Reporting Structural Equation Analyses. Psychological Methods, 7, 64-82.
McFarland, D. E. (1979). Management Foundations and Practices, New York, Macmillan.
McGivern, M. H. & Tvorik, S. J. (1997). Determinants of Organizational Performance Management Decision, 35, 417-429.
McKee, D. (1992). The Effect of Using a Questionnaire Identification Code and Message About Non-Response Follow-up Plans on Mail Survey Response Characteristics. Journal of the Market Research Society, 34, 179-191.
McKenna, R. (1991). Relationship Marketing: Successful Strategies for the Age of the Consumer, Reading, MA., Addison-Wesley.

435
Meenaghan, T. (1995). The Role of Advertising in Brand Image Development. Journal of Product and Brand Management, 4, 23-34.
Meglino, B. M. & Ravlin, E. C. (1998). Individual Values in Organizations: Concepts, Controversies and Research. Journal of Marketing Management, 24, 351-389.
Melewar, T. C. (2001). Measuring Visual Identity: A Multi Construct Study. Corporate Communications: An International Journal, 6, 36-41.
Melewar, T. C. (2003). Determinants of Corporate Identity Construct: A Review of the Literature Journal of Marketing Communications 9, 195-220.
Melewar, T. C., Bassett, K. & Simoes, C. (2006). The Role of Communication and Visual Identity in Modern Organisations. Corporate Communications: An International Journal, 11, 138-147.
Melewar, T. C., Hussey, G. & Srivoravilai, N. (2005a). Corporate Visual Identity: The Rebranding of France Telecom. Brand Management, 12, 379-394.
Melewar, T. C. & Jenkins, E. (2002). Defining the Corporate Identity Construct. Corporate Reputation Review, 5, 76-90.
Melewar, T. C. & Karaosmanoglu, E. (2006a). Corporate branding, identity and communications: A contemporary perspective. Journal of Brand Management, 14, 1-4.
Melewar, T. C. & Karaosmanoglu, E. (2006b). Seven Dimensions of Corporate Identity: A Categorisation from the Practitioners' Perspective. European Journal of Marketing, 40, 846-869.
Melewar, T. C., Karaosmanoglu, E. & Paterson, D. (2005b). Corporate Identity: Concept, Components and Contribution. Journal of General Management, 31, 59-81.
Melewar, T. C., Karaosmanoglu, E. & Peterson, D. (2005c). Corporate Identity: Concept, Components and Contribution. Journal of General Management, 31, 59-81.
Melewar, T. C. & Saunders, J. (1998). Global Corporate Visual Identity Systems: Standardisation, Control and Benefits. International Marketing Review, 15, 291-308.
Melewar, T. C. & Saunders, J. (2000). Global Corporate Visual Identity Systems: Using An Extended Marketing Mix. European Journal of Marketing, 34, 538.
Melewar, T. C., Saunders, J. & Balmer, J. M. T. (2001). Cause, Effect and Benefits of a Standardised Corporate Visual Identity System of UK Companies Operating in Malaysia. European Journal of Marketing, 35, 414-427.
Meyerson, D. & Martin, J. (1987). Culture Change: An Integration of Three Different Views. Journal of Management Studies, 24, 623-647.
Mick, D. G. (1996). Are Studies of Dark Side Variables Confounded by Socially Desirable Responding? The Case of Materialism. Journal of Consumer Research, 23, 106-119.
Miller, D. W., Foust, J. E. & Kilic, O. (2007). An Analysis of Financial Service Brand Marks. Journal of Financial Services Marketing, 11, 257-267.
Miller, G. A. (1956). The Magical Number Seven, Plus or Minus Two: Some Limits on Our Capacity for Processing Information
The Psychological Review, 63, 81-97. Mitchell, A. (2001). Right-Side Up, London, Harper Collins.

436
Mitchell, A. (2007). Brand Metrics Fail To Count True Cost To The Consumer. Marketing Week, 30, 26-27.
Mitchell, A. (2008a). Brand Metrics That Fail to Count True Cost to the Consumer. Marketing, 5th April,, 26-27.
Mitchell, A. (2008b). Why It's Time to Move on From All These Narcissistic Metrics. Marketing, 21st February, 22-23.
Mitchell, P., King, J. & Reast, J. (2001). Brand Values Related to Industrial Products. Industrial Marketing Management, 30, 415-425.
Moingeon, B. & Ramanantsoa, B. (1997). Understanding Corporate Identity: The French School of Thought. European Journal of Marketing, 3, 383-395.
Moors, G. (2007). Exploring the Effect of a Middle Response Category on Response Style in Attitude Measurement. Journal of Qualitative and Quantitative Research.
Morgan, R. M. & Hunt, S. D. (1994). The Commitment-Trust Theory of Relationship Marketing. Journal of Marketing 58.
Mudambi, S. (2002). Branding Importance in Business-to-Business Markets: Three Buyer Clusters. Industrial Marketing Management, 3, 525-533.
Mudambi, S., Doyle, P. & Wong, V. (1997). An Exploration of Branding in Industrial Markets. Industrial Marketing Management, 26, 433-446.
Mulaik, S. (2007). There is a Place for Approximate Fit in Structural Equation Modelling. Personality and Individual Differences, 42, 883-891.
Muller, R. O. (1996). Basic Principles of Structural Equation Modeling: An Introduction to LISREL and EQS, New York Springer.
Mulyanegara, R. C., Tsarenko, Y. & Anderson, A. (2009a). The Big Five and Brand Personality: Investigating the Impact of Consumer Personality on Preferences Towards Particular Brand Personality. Brand Management, 234-247.
Mulyanegara, R. C., Y., T. & Anderson, A. (2009b). The Big Five and Brand Personality: Investigating the Impact of Consumer Personality on Preferences Towards Particular Brand Personality. Brand Management, 16, 234-247.
Munoz, T. & Kumar, S. (2004). Brand metrics: Gauging and linking brands with business performance. Journal of Brand Management, 11, 381-387.
Murphy, L., Moscardo, G. & Benckendorff, P. (2007). Using Brand Personality to Differentiate Regional Tourism Destinations. Journal of Travel Research, 46, 5-14.
Muthen, L., K. & Muthen, B. O. (2002). How to Use Monte Carlo Study to Decide on Sample Size and Determine Power. Structural Equation Modeling, 4, 599-620.
Muzellec, L. (2006). What is in a Name Change? Re-Joycing Corporate Names to Create Corporate Brands. Corporate Reputation Review, 8, 305-316.
Naert, P. A. & Leeflang, P. S. H. (1978). Building Implementable Marketing Models, Leiden / Boston, Martinus Nijhoff Social Sciences Division.
Naik, P. A. & Raman, K. (2003). Understanding the Impact of Synergy in Multimedia Communications. journal of Marketing Research, 40, 375-388.
Napoles, V. (1988). Corporate Identity Design, New York, Van Nostrand Reinhold. Narver, J. C. & Slater, S. F. (1990). The Effect of a Market Orientation on Business
Profitability. Journal of Marketing, 54, 20. Nederhof, A. (1985). Methods of Coping with Social Desirability Bias: A Review.
European Journal of Social Psychology 15, 263-280.

437
Nedundadi, P. (1990). Recall and Consumer Consideration Sets: Influencing Choice Withouth Altering Brand Evalutations. Journal of Consumer Research, 17, 263-276.
Nemeth, C. J. (1997). Managing Innovation: When Less is More. California Management Review, 40, 59-74.
Netemeyer, R. G., Bearden, W. O. & Sharma, S. (2003). Scaling Procedures: Issues and Applications, Thousand Oaks, Sage Publications.
Netemeyer, R. G., Boles, J. S. & McMurrian, R. C. (1996). Development and Validation of Work-Family Conflict and Family-Work Conflict Scales. Journal of Applied Psychology, 81, 400-410.
Netemeyer, R. G., Krishnanb, B., Pulliga, C., Wangc, G., Yagcid, M., Deane, D., Ricksf, J. & Wirthg, F. (2004). Developing and Validating Measures of Facets of Customer-Based Brand Equity Journal of Business Research, 57, 209-224.
Ngo, H.-Y. & Loi, R. (2008). Human Resource Flexibility, Organizational Culture and Firm Performance: An Investigation of Multinational Firms in Hong Kong. The International Journal of Human Resource Management, 19, 1654-1666.
Nguyen, N. & Leblanc, G. (2001). Corporate image and corporate reputation in customers' retention decisions in services. Journal of Retailing and Consumer Services, 8, 227-236.
Norburn, D. & Birley, S. (1988). The Tope Management Team and Corporate Performance. Strategic Management Journal, 9, 225-237.
Noth, W. (1995). Handbook of Semiotics, Bloomington, IN. , Indiana University Press. Nunally, J. (1967). Psychometric Methods, New York, McGraw-Hill Nunally, J. (1978). Psychometric Theory, New York, McGraw Hill. Nunally, J. & Bernstein, I. H. (1994). Psychometric Theory, New York, McGraw-Hill. O'Cass, A. & Ngo, L. V. (2007a). Balancing external adaptation and internal
effectiveness: Achieving better brand performance. Journal of Business Research, 60, 11-20.
O'Cass, A. & Ngo, L. V. (2007b). Market Orientation Versus Innovative Culture: Two Routes to Superior Brand Performance. European Journal of Marketing, 41, 868-887.
O'Malley, L. & Tynan, C. (2000). Relationship marketing in consumer markets Rhetoric or reality? European Journal of Marketing, 34, 797.
O'Reilly, C. A. & Chatman, J. A. (1996). Culture as Social Control: Corporations, Culture and Commitment. In Staw, B. M. & Cummings, L. L. (Eds.) Research In Organizational Behaviour. Greenwich, CT, JAI Press.
Ogbonna, E. & Harris, L. C. (2000). Leadership Style, Organizational Culture and Performance: Empirical Evidence from UK Companies. International Journal of Human Resource Management, 11, 766-788.
Ohnemus, L. (2009). B2B Branding: A Financial Burden for Shareholders? Business Horizons, 52, 159-166.
Oktemgil, M. (2003). The Effect of Firm Size, Brand Strategy and Strategic Objectives on Brand Performance: Empirical and Comparative Evidence from Turkish and UK Firms. Working Paper Series - University of Birmingham, 26.
Olgivy, D. (1983). Olgivy on Advertising, New York, Random House.

438
Olins, W. (1978a). Corporate Identity: The Myth and the Reality. Journal of the Royal Society of Arts, 127, 209-218.
Olins, W. (1978b). The Corporate Personality: An Inquiry Into the Nature of Corporate Identity, London, Design Council.
Olins, W. (1979). Corporate Identity: The Myth and the Reality. Advertising Age, Summer, 16-25.
Olins, W. (1986). Corporate Identity: Making Business Strategy Visible Through Design London, Thames and Hudson
Olins, W. (1989). Corporate Identity: Making Business Strategy Visible Through Design, London, Thames and Hudson.
Olins, W. (1990). The Wolf Olins Guide to Corporate Identity, London The Design Council.
Olins, W. (1991). The Power of Corporate Identity. World Executive's Digest, 34-39. Olins, W. (1995). The New Guide to Identity, Aldershot, UK., Gower Publishing. Olsson, U. H., Foss, T., Troye, S. V. & Howell, R. D. (2000). The Performance of ML,
GLS, and WLS Estimation in Structural Equation Modeling Under Conditions of Misspecification and Nonnormality. Structural Equation Modeling, 7, 557 - 595
Olsson, U. H., Troye, S. V. & Howell, R. D. (1999). Theoretical Fit and Empirical Fit: The Performance of Maximum Likelihood versus Generalized Least Squares Estimation in Structural Equation Models. Multivariate Behavioural Research, 34, 31-58.
Olutayo, B. & Melewar, T. C. (2007). Understanding the Meaning of Corporate Identity: A Conceptual and Semiological Approach. Corporate Communications: An International Journal, 12, 414-432.
Onkvisit, S. & Shaw, J. J. (1989). Service Marketing: Image, Branding and Competition. Business Horizons, January-February, 13-17.
ONS (2008). Office for NationalStatistics: Quarterly National Accounts 4th Quarter. In HMSO (Ed.). Newport, Wales.
Orlando, R. C., McMillan-Capehart, A., Shahid, B. N. & Taylor, E. (2009). Antecedents and Consequences of Psychological Contracts: Does Organizational Culture Rally Matter? Journal of Business Research, 62, 818-825.
Paauwe, J. (2009). HRM and Performance: Achievements, Methodological Issues and Prospects. Journal of Management Studies 41, 129-142.
Paauwe, J. & Richardson, R. (1997). Introduction to Special Issue on HRM and Performance. International Journal of Human Resource Management, 8.
Palmer, R. A., Winklhofer, H. & Brodie, R. J. (2006). Researching the Service Dominant Logic - Normative Perspective Versus Practice. BIGMAC 3: 2006 EMAC / ANZMAC Research Symposium. Brisbane, Australia.
Pappu, R., Quester, P. G. & Cooksey, R. W. (2005). Consumer-Based Brand Equity: Improving the Measurement - Empirical Evidence. Journal of Product & Brand Management, 14, 143-154.
Park, C., Jaworski, B. & MacInnis, D. (1986). Strategic Brand Concept-Image Management. Journal of Marketing, 50, 135-145.
Park, C. S. & Srinivasan, V. (1994). A Survey-Based Method for Measuring and Understanding Brand Equity and Its Extendibility. Journal of Marketing Research (JMR), 31, 271.

439
Parvatiyar, A. & Sheth, J. (2001). Conceptual Framework of Customer Relationship Management. In Sheth, J., Parvatiyar, A. & Shainesh, G. (Eds.) Customer Relationship Management: Emerging Concepts, Tools and Applications. New Delhi, Tata McGraw-Hill.
Pascale, R. (1984). Fitting New Employees into the Company Culture. Fortune, May, 28-41.
Patten, M. (1998). Questionnaire Research, Los Angeles: CA, Pyrczak Publishing. Payne, S. L. (1980). The Art of Asking Questions, Princeton: NJ, Princeton University
Press. Pearce, J. A., Robbins, D. K. & Robinson, R. B. (1987). The Impact of Grand Strategy
and Planning Formality on Performance. Strategic Management Journal, 8, 125-134.
Pelham, A. M. & Wilson, D. T. A. (1996). Longitudinal Study of the Impact of Market Structure, Firm Structure, Strategy and Market Orientation Culture on Dimensions of Small Firm Performance. Journal of the Academy of Marketing Science, 24, 27-44.
Peppers, D. & Rogers, M. (1993). The One to One Future: Building Relationships one Customer at a Time, New York, Double Day.
Peppers, D. & Rogers, M. (1994). Is One-to-One Marketing Customer Interaction Vital? Business Marketing, 79, 9.
Peter, J. (1989). Designing Logos. Folio, 18, 139-141. Peter, P. J. (1979). Reliability: A Review of Psychometric Basics and Recent Marketing
Practices. Journal of Marketing Research, 16, 6-17. Peter, P. J. (1981). Construct Validity: A Review of the Basic Issues and Marketing
Practices. Journal of Marketing Research, 18, 133-145. Peters, T. & Waterman, R. (1982). In Search Of Excellence, New York, Harper and
Row. Pfeffer, J. (1994). Competitive Advantage Through People, Boston, Harvard Business
School Press. Phau, I. & Cheen Lau, K. (2000). Brand Personality and Consumer Self Expression:
Single or Dual Carriageway? Brand Management, 8, 428-444. Piercy, N. & Morgan, N. (1990). Internal Marketing: Making Marketing Happen.
Marketing Intelligence And Planning, 8, 4-6. Piercy, N. & Morgan, N. (1991). Internal marketing: The Missing Half of the Marketing
Programme. Long Range Planning, 24, 82-93. Piercy, N. J. (1995). Customer Satisfaction and the Internal Labour Market: Marketing
our Customers to Our Employees. Journal of Marketing Practical Marketing Science, 1, 22-44.
Pilditch, J. (1970). Communication By Design, London, McGraw-Hill. Pina, J. M., Martinez, E., de Chernatony, L. & Drury, S. (2006). The Effect of Service
Brand Extensions on Corporate Image. European Journal of Marketing, 40, 174-197.
Ping, R. A. J. (2004). On Valid Measures for Theoretical Models Using Survey Data. Journal of Business Research, 57, 125-141.
Plummer, J. T. (1985). How Personality Makes a Difference. Journal of Advertising Research, 24, 27-31.

440
Porter, M. (1980). Competitive Strategy, New York, Free Press. Prahalad, C. K. & Hamel, G. (1990). The Core Competence of the Corporation. Harvard
Business Review, 68, 79-91. Quiston, D. H. (2004). Successful Branding of a Commodity Product: The Case of
RAEX Laser Steel. Industrial Marketing Management, 33, 345-354. Ramaseshan, B. & Tsao, H.-Y. (2007). Moderating Effects of the Brand Concept on the
Relationship Between Personality and Perceived Quality. Brand Management, 14, 458-466.
Ranaweera, C. (2007). Are Satisfied Long-Term Customers More Profitable? Evidence from the Telecommunications Sector. Journal of Targeting, Measurement and Analysis for Marketing 15, 113-120.
Rashid, Z. A., Sambasivan, M. & Johari, J. (2003). The Influence of Corporate Culture and Organisational Commitment on Performance. Journal of Management Development, 22, 208-728.
Rathmell, J. (1966). What Is Meant By Services? Journal of Marketing, 30, 32-36. Rathmell, J. M. (1974). Marketing in the Service Sector, Cambridge Mass, Winthrop
Publishers. Ray, G., W.A., M. & Barney, J. B. (2005). Information Technology and the Performance
on the Customer Service Process: A Resource-Based Analysis. Management Information Systems Quarterly, 29, 625-653.
Reichheld, F. (1996). The Loyalty Affect, Boston, Harvard Business School Reichheld, F. & Sasser, W. E., Jnr (1990). Zero Defections: Quality Comes to Services.
Harvard Business Review, 68, 105-111. Reid, M. (2003). IMC-Performance Relationship: Further Insight and Evidence from the
Australian Marketplace. International Journal of Advertising, 22, 227-248. Reid, M. (2005). Performance Auditing of Integrated Marketing Communications (IMC)
Actions and Outcomesq. The Journal of Advertising, 34, 41-54. Reid, M., Johnson, T., Ratcliffe, M., Skrip, K. & Wilson, J. (2001). Linking Integrated
Marketing Communications to Performance: Comparing the Performance of High Vs. Low Integration Brands in the Australian and New Zealand Wine Industry. International Journal of Advertising, 20, 1-24.
Reinartz, W., Krafft, M. & Hoyer, W. (2004). The Customer Relationship Management Process: Its Measurement and Impact on Performance. Journal of Marketing Research, 41, 293-305.
Reinartz, W. & Kumar, V. (2000). On The Profitability of Long-Term Customers in a Non-Contract Setting: An Empirical Investigation and Implications for Marketing. Journal of Marketing, 64, 17-35.
Reinartz, W. & Kumar, V. (2003). The Impact of Customer Relationship Characteristics on Profitable Lifetime Duration.
. Journal of Marketing, 67, 77-99. Richards, T. (1998). Buying Loyalty Versus Building Commitment. Developing the
Optimum Retention Strategy. Marketing and Research Today, February, 43-51. Richman, W. L., Kiesler, S., Weisband, S. & Drasgow, F. (1999). A Meta-Analytic
Study of Social Desirability Distortion in Computer-Administered Questionnaires, Traditional Questionnaires and Interviews. Journal of Applied Psychology, 84, 754-775.

441
Ries, A. & Trout, J. (1972). The Positioning Era Cometh. Advertising Age, 181-191. Roberts, J. & Merrilees, B. (2007). Multiple Roles of Brands in Business-to-Business
Services. Journal of Business and Industrial Marketing, 22, 410-417. Roberts, K., Varki, S. & Brodie, R. (2003). Measuring the Quality of Relationships in
Consumer Services: An Empirical Study. European Journal of Marketing, 37, 169-197.
Robinson, J. P., Shaver, P. R. & Wrightsman, L. S. (1991). Criteria for Scale Selection and Evaluation. In Robinson, J. P., Shaver, P. R. & Wrightsman, L. S. (Eds.) Measures of Personality and Psychological Attitudes. San Diego, Academic Press.
Robinson, R. B. & Pearce, J. A. (1988). Planned Patterns of Strategic Behaviour and the Relationship to Business Unit Performance. Strategic Management Journal.
Rokeach, M. (1973). The Nature of Human Values, New York, The Free Press. Rosenberg, M. (1979). Conceiving the Self,, New York, Basic. Roth, M. S. (1995a). The Effects of Culture and Socioeconomics on the Performance of
Global Brand Image Strategies. Journal of Marketing Research (JMR), 32, 163. Roth, M. S. (1995b). Effects of Global Market Conditions On Brand Image. Journal of
Advertising, 24, 55. Roth, P. L. & BeVier, C. A. (1998). Response Rates in HRM / OB Survey Research:
Norms and Correlates. Journal of Management, 24, 97-117. Roth, P. L. & Switzer, F. S. (1995). A Monte Carlo Analysis of Missing Data
Techniques in a HRM Setting. Journal of Management, 21, 1003-1023. Roy, D. & Banerjee, S. (2007). CARE-ing Strategy for Integration of Brand Identity
with Brand Image. International Journal of Commerce and Management, 17, 140-148.
Rubinson, J. & Pfeiffer, M. (2005). Brand Key Performance Indicators as a Force for Brand Equity Measurement. Journal of Advertising Research, June, 187-197.
Rundle-Thiele, S. & Bennett, R. (2001). A brand for all seasons? A discussion of brand loyalty approaches and their applicability for different markets. The Journal of Product and Brand Management, 10, 25.
Russell, J. S., Terborg, J. R. & Powers, M. L. (1985). Organizational Performance and Organizational Level of Training and Support. Personnel Psychology, 38, 849-863.
Rust, R. T., Ambler, T., Carpenter, G. S., Kumar, V. & Srivastava, R. K. (2004a). Measuring Marketing Productivity: Current Knowledge and Future Directions. Journal of Marketing, 68, 76-89.
Rust, R. T. & Chung, T. S. (2006). Marketing Models of Service and Relationships. Marketing Science, 25, 560-580.
Rust, R. T., Lemon, K. N. & Zeithaml, V. A. (2004b). Return on Marketing: Using Customer Equity to Focus Marketing Strategy. Journal of Marketing, 68, 109-127.
Rust, R. T., Zeithaml, V. & Lemon, K. M. (2000). Driving Customer Equity: How Lifetime Value Is Reshaping Corporate Strategy, New York, The Free Press.
Ryals, L. & Knox, S. (2001). Cross-Functional Issues in the Implementation of Relationship Marketing Through Customer Relationship Management. European Management Journal 19, 534-542.

442
Ryals, L. & Payne, A. (2001). Customer Relationship Management in Financial Services: Towards Information-Enabled Relationship Marketing. Journal of Strategic Marketing, 9, 3-27.
Sajeev, V. & Rust, R. T. (1997). Satisfaction is relative. Marketing Research, 9, 14-20. Saunders, J., Jobber, D. & Mitchell, V. (2006). The Optimum Prepaid Monetary
Incentive for Mail Surveys. Journal of the Operational Research Society, 57, 1224-1230.
Saunders, M., Lewis, P. & Thornhill, A. (2007). Research Methods for Business Students, Harlow, UK, Pearson.
Schaefer, R. & Dillman, D. A. (1998). Development of a Standard E-mail Methodology: Results of an Experiment. Public Opinion Quarterly, 62, 378-397.
Schechter, A. H. (1993). Measuring the Value of Corporate and Brand Logos. Design Management Journal, Winter 1993.
Schein, E. (1984). Coming to a New Awareness of Organizational Culture. Sloan Management Review, 3-16.
Schenk, C. T. & Holman, R. H. (1980). A Sociological Approach to Brand Choice: The Concept of Situational Self-Image. Advances in Consumer Research, 7, 610-614.
Schermelleh-Engel, K., Moosbrugger, H. & Muller, H. (2003). Evaluating the Fit of Structural Equation Models: Tests of Significance and Descriptive Goodness-of-Fit Measures. Methods of Psychological Assessment Online, 8, 23-74.
Schmitt, B. & Simonson, A. (1997). Marketing Aesthetics: The Strategic Management of Brands, Identity and Image, New York, Free Press.
Schmitt, J. & Stults, D. M. (1985). Factors Defined By Negatively Keyed Items: The Result of Careless Respondents? Applied Psychological Measurement, 9.
Schneider, B. & Rentsch, J. (1988). Managing Climates and Cultures: A Futures Perspective. In Hage, J. (Ed.) Futures of Organisations. MA, Lexington.
Schneider, K. C. & Johnson, J. C. (1995). Stimulating Response to Market Surveys of Business Professionals. Industrial Marketing Management, 34, 265-276.
Schroeter, J. R. (1988). Estimating the Degree of Market Power in the Beef Packing Industry. Review of Economics and Statistics, 70 158-162.
Schultz, D., Tannenbaum, S. J. & Lauterborn, R. F. (1994). Integrated Marketing Communications :Pulling It Together and Making It Work, Chicago, IL, NTC Business Books.
Schultz, D. E. (2005). Measuring Unmeasurables. Marketing Management, 14, 12-13. Schultz, D. E. (2006). Measuring Up. Marketing Management, 15, 10-11. Schultz, D. E. & Schultz, H. (1998). Transitioning Marketing Communications Into the
21st Century. Journal of Marketing Communications, 4, 9-26. Schultz, D. E. & Schultz, H. F. (2004). Brand Babble: Sense and Nonsense About
Branding, London, Thomson Schultz, M., Hatch, M. J. & Larsen, M. H. (2000). The Expressive Organisation: Linking
Identity, Reputation and the Corporate Brand, Oxford, Oxford University Press. see Bolton, R. N., Day, G. S., Deighton, J., Narayandas, D., Gummesson, E., Hunt, S. D.,
Prahalad, C. K., Rust, R. T. & Shugan, S. M. (2004). Invited Commentaries on "Evolving to a New Dominant Logic for Marketing". Journal of Marketing, 68, 18-27.

443
Segars, A. H. & Grover, V. (1993). Re-examining Perceived Ease of Use and Usefulness: A Confirmatory Factor Analysis. Marketing Information Systems Quarterly, 17, 517-525.
Senior, R. (2008). Can Adland Change Its Unhealthy Competitive Pitching? Yes It Can! The Independent, p.11, Media Supplement.
Sharma, A., Tzokas, N., Saren, M. & Kyziridis, P. (1999). Antecedents and Consequences of Relationship Marketing. Industrial Marketing Management, 28.
Sharma, S. (1999). Trespass or Symbiosis? Dissolving the Boundaries Between Strategic Marketing and Strategic Management. Journal of Strategic Marketing, 7, 73-88.
Sharp, B. (1995). Brand Equity and Market-Based Assets of Professional Services Firms. Journal of Professional Services Marketing, 13, 3-13.
Sherrington, M. (2003). Added Value: The Alchemy of Brand-Led Growth, Basingstoke, Palgrave Macmillan
Sheth, J. & Sharma, A. (2006). The Surpluses and Shortages in Business-to-Business Marketing Theory and Research. Journal of Business and Industrial Marketing, 21, 422-427.
Sheth, J. & Sisodia, R. S. (2001). High Performance Marketing: Marketing Must Become a Leader for Change Across the Corporation. Marketing Management, 10, 18-23.
Sheth, J. N. & Parvatiyar, A. (1995). Relationship Marketing in Consumer Markets, Antecedents and Consequences. Journal of the Academy of Marketing Science, 23, 255-271.
Shimp, T. A. & Sharma, S. (1987). Consumer Ethnocentrism: Construction and Validation of the CETSCALE. Journal of Marketing Research, 4, 280-289.
Shipley, D. & Howard, P. (1993). Brand Naming Industrial Products. Industrial Marketing Management, 22.
Shocker, A. D. & Weitz, B. (1988). In Leuthesser, L. (Ed.) Report Number 88-104. Cambridge, MA., Marketing Science Institute.
Shostack, G. L. (1977). Breaking Free From Product Marketing. Journal of Marketing, 41, 73-80.
Shrimp, T. A. (1993). Promotion Management & Marketing Communications, Forth Worth, Texas, The Dryden Press.
Siguaw, J. A., Mattila, A. & Austin, J. R. (1999). The Brand-Personality Scale. Cornell Hotel and Restaurant Administration Quarterly, 40, 48-55.
Sills, S. J. & Song, C. (2002). Innovations in Survey Research: An Application of Web Surveys. Social Science Computer Review, 20, 22-30.
Simoes, C., Dibb, S. & Fisk, R. P. (2005). Managing Corporate Identity: An Internal Perspective. Journal of the Academy of Marketing Science, 33, 153-168.
Sin, L., Tse, A., Yau, O., Lee, J. & Chow, R. (2002). The Effect of Relationship Marketing Orientation on Business Performance in a Service Orientated Economy. Journal of Services 16, 656-676.
Sin, L. Y. M., Tse, A. C. B., Yau, O. H. M., Chow, R. P. M., Lee, J. S. Y. & Lau, L. B. Y. (2005a). Relationship Marketing Orientation: Scale Development and Cross-Cultural Validation. Journal of Business Research, 58, 185-194
Sin, L. Y. M., Tse, A. C. B. & Yim, F. K. K. (2005b). CRM: Conceptualisation and Scale Development. European Journal of Marketing, 39, 1264-1290.

444
Sirdeshmukh, D., Singh, J. & Sabol, B. (2002). Consumer Trust, Value and Loyalty in Relational Exchanges. Journal of Marketing, 66, 15-37.
Sirgy, J. M. (1982). Self Concept in Consumer Behaviour: A Critical Review. Journal of Consumer Research, 9, 287-300.
Sirgy, M. J. (1986). Self Congruity: Towards a Theory of Personality and Cybernetics, New York, Praeger Publishers.
Sirgy, M. J., Grewal, D. & Manglebur, T. (2000). Retail Environment, Self-Congruity, and Retail Patronage: An Integrative Model and Reseach Agenda. Journal of the Academy of Marketing Science, 25, 127-138.
Sirgy, M. J., Grewal, D., Manglebur, T., Park, J.-O., Chon, K.-S., Claiborn, C. B., Johar, J. S. & Berkman, H. (1997). Assessing the Predictive Validity of Two Methods of Measuring Self Image Congruence. Journal of the Academy of Marketing Science, 25, 229-241.
Sirgy, M. J. & Su, C. (2000). Destination Image, Self Congruity and Travel Behaviour: Towards an Integrative Model. Journal of Travel Research, 38, 340-352.
Slater, C. M. (1999). Business Statistics of the United States, Lanham, Bernan Press. Slater, S. F. & Narver, J. C. (1994). Market Orientation, Customer Value, and Superior
Performance. Business Horizons, March-April, 22-28. Smallwood, D. & Conlisk, J. (1979). Product Quality in Markets Where Consumers Are
Imperfectly Informed. Quarterly Journal of Economics 93. Smit, E., Bronner, F. & Tolborn, M. (2007). Brand Relationship Quality and its Value
for Personal Contact. Journal of Business Research, 60, 627-633. Smith, A. M. (1993). Elderly Consumers' Evaluation of Service Quality Marketing
Intelligence and Planning, 11, 13-19. Smith, A. M. (1995). Measuring Quality Service: Is SERVQUAL Now Redundant?
Journal of Marketing Management, 11, 257-276. Smothers, N. (1993). Can Products and Brands Have Charisma? In Aaker, D. A. & Biel,
A. L. (Eds.) Advertising and Brand Equity. HIllsdale, NJ, Lawrence Erlbaum Associates.
Sorensen, J. B. (2002). The Strength of Corporate Culture and the Reliability of Firm Performance. Administrative Science Quarterly, 47, 70-91.
Sorrell, M. (1997). Building Corporate Brands. British Brands, 5, 4. Srivastava, R. K., Fahey, L. & Shervani, T. A. (2000). Linking Advertising to Brand and
Market-Based Assets. Admap, February Srivastava, R. K., Shervani, T. A. & Fahey, L. (1998). Market-Based Assets and
Shareholder Value: A Framework for Analysis. Journal of Marketing, 62, 2-18. Srivastava, R. K. & Shocker, A. D. (1991). Brand Equity: A Perspective on It's Meaning
and Measurement. Marketing Science Institute Working Paper Series, 91-124. Stapleton, C. D. (1997). Basic Concepts and Procedures of Confirmatory Factor
Analysis. South West Educational Research Association. Austin, Texas, USA. Staten, M., Umbeck, J. & Dunkelberg, W. (1988). Market Share/Market Power
Revisited. Journal of Health Economics, 7, 73-83. Steenkamp, J.-B., E.M. & Trijp, H. C. M. (1991). The Use of LISREL in Validating
Marketing Constructs. International Journal of Research in Marketing, 8, 283-299.

445
Steiger, J. H. (1990). Structural Model Evaluation and Modification: An Interval Estimation Approach. Multivariate Behavioural Research, 25, 173-180.
Stevens, J. (1996). Applied Multivariate Statistics for Social Sciences, New Jersey, Lawrence Erlbaum Associates.
Stevens, J. P. (1992). Applied Multivariate Statistics for the Social Sciences, HIllsdale, NJ, Erlbaum.
Strahan, R. & Gerbasi, K. (1972). Short, Homogenous Version of the Marlowe-Crowne Social Desirability Scale. Journal of Clinical Psychology, 28, 191-193.
Streiner, D. L. (1994). Figuring Out Factors: The Use and Misuse of Factor Analysis. Canadian Journal of Psychiatry, 39, 135-140.
Strizhakova, Y., Coulter, R. & Price, L. (2008). The Meaning of Branded Products: A Cross National Scale Development and Meaning Assessment. International Journal of Research in Marketing, 25, 82-93.
Stuart, H. (1998). Exploring Corporate Identity / Corporate Image Interface. Journal of Communications Management, 2, 357-373.
Stuart, H. (1999). Towards a Definitive Model of The Corporate Identity Management Process. Corporate Communications: An International Journal, 4, 200-207.
Stuart, H. (2003). Employee Identification with the Corporate Identity International Studies of Management and Organisations, 32, 28-44.
Sugawara, H. M. & MacCallum, R. C. (1993). Effect of Estimation Method of Incremental Fit Indexes for Covariance Structure Models. Applied Psychological Measurement, 17, 365-377.
Suvatjis, J. Y. & de Chernatony, L. (2005). Corporate Identity Modelling: A Review and Presentation of a New Multi-dimensional Model. Journal of Marketing Management, 21, 809-834.
Swain, S. D., Weathers, D. & Niedrich, R. W. (2008). Assessing Three Sources of Misresponse to Reversed Likert Scales. Journal of Marketing Research, 45, 116-131.
Swaminathan, V., Stilley, K. M. & Ahluwalia, R. (2008a). When Brand Personality Matters: The Moderating Role of Attachment Styles. Journal of Consumer Research, 35, 985-1002.
Swaminathan, V., Stilley, K. M. & Ahluwalia, R. (2008b). When Brand Personality Matters: The Moderating Role of Attachment Styles. Journal of Consumer Research, 35, 985-1002.
Sweeney, J. C. & Brandon, C. (2006). Brand Personality: Exploring the Potential to Move from Factor Analytical Circumplex Models. Psychology and Marketing, 23, 639-663.
Szymanski, D. M., Bharadwaj, S. G. & Varadarajan, P. R. (1993). An Analysis of the Market Share-Profitability Relationship. Journal of Marketing, 57, 1.
Tabachnick, B. G. & Fidell, L. S. (2001). Using Multivariate Statistics, Boston, Allyn and Bacon.
Tajfel, H. & Turner, J. C. (1986). The Social Identity Theory of Inter-Group Behavior. . In Worchel, S. & Austin, L. W. (Eds.) Psychology of Intergroup Relations. Chicago, Nelson-Hall.

446
Tanaka, J. S. & Huba, G. J. (1984). Confirmatory Hierarchical Factor Analyses of Psychological Distress Measures. Journal of Personality and Social Psychology, 46, 621-635.
Taveira de Barros, T. & Martins, F. V. (2007). Using An Integrative Approach to Assess Brand Identity. Thought Leaders International Conference on Brand Management University of Birmingham, UK.
Terpstra, D. E. & Rozell, E. J. (1993). The Relationship of Staffing Practices To Organizational Measures of Performance Personnel Psychology, 46, 27-46.
Tomaskovic-Devey, D., Leiter, J. & Thompson, S. (1994). Organizational Survey Non Response. Administrative Science Quarterly, 39, 439-457.
Topalian, A. (1984). Corporate Identity: Beyond the Visual Statements. International Journal of Advertising, 3.
Upshaw, L. (1995). Building Brand Identity; A Strategy for Success in a Hostile Market Place, New York, John Wiley.
Vallaster, C. & de Chernatony, L. (2006). Internal Brand Building and Structuration: The Role of Leadership . European Journal of Marketing, 40, 761-784.
Van de Post, W. Z., de Coning, T. J. & Smit, E. v. (1998). The Relationship Between Organisational Culture and Financial Performance: Some South African Evidence. South African Journal of Business Managment, 29, 30-41.
Van den Bosch, A. L. M., de Jong, M. D. T. & Elving, W. J. L. (2004). Managing Corporate Visual Identity: Use and Effects of Organiztional Measures to Support a Consistent Self-Presentation. Public Relations Review, 30, 225-234.
Van den Bosch, A. L. M., de Jong, M. D. T. & Elving, W. J. L. (2005). How Corporate Visual Identity Supports Reputation. Corporate Communications: An International Journal, 10, 108-116.
Van den Bosch, A. L. M., de Jong, M. D. T. & Elving, W. J. L. (2006a). Managing Visual Corporate Identity: Exploring Differences Between Manufacturing and Service, and Profit-Making and Non-Profit Organizations. Journal of Business Communications, 43, 138-157.
Van den Bosch, A. L. M., Elving, W. J. L. & de Jong, M. D. T. (2006b). The Impact of Organisational Characteristics on Corporate Visual Identity. European Journal of Marketing, 40, 870-885.
Van der Post, W. Z., de Coning, T. J. & Smit, E. v. (1998). The Relationship Between Organisational Culture and Financial Performance: Some South African Evidence. South African Journal of Business Management, 29, 30-41.
Van Rekom, J. (1997). Deriving an Operational Measure of Corporate Identity. European Journal of Marketing, 31, 410-422.
Van Rekom, J. & Jacobs, G. (2006). Measuring and Managing the Essence of Brand Personality. Marketing Letters, 17, 181-192.
van Riel, A., C.R. , de Mortanges, C. P. & Streukens, S. (2005). Marketing Antecedents of Industrial Brand Equity: An Empirical Investigation in Speciality Chemicals. Industrial Marketing Management, 34, 841-847.
Van Riel, C. (1995). Principles of Corporate Communication, Hemel Hempstead, UK, Prentice Hall.
Van Riel, C. B. M. (1997). Research in Corporate Communication: An Overview of an Emerging Field. Management Communication Quarterly, 11, 288-309.

447
Van Riel, C. B. M. & Balmer, J. M. T. (1997). Corporate identity: The concept, its measurement and management. European Journal of Marketing, 31, 340.
Van Riel, C. B. M. & van den Ban, A. (2001). The Added Value of Corporate Logos - An Empirical Study. European Journal of Marketing, 35, 428-439.
Van Riel, C. B. M. & Van den Bosch, A. L. M. (2001). The Added Value of Corporate Logos: An Empirical Study. European Journal of Marketing, 35, 428-440.
Varadarajan, R. P. (1996). From the Editor: Reflections on Research and Publishing. Journal of Marketing, 60, 3-6.
Vargo, S. L. & Lusch, R. F. (2004a). Evolving to a New Dominant Logic for Marketing. Journal of Marketing, 68, 1-17.
Vargo, S. L. & Lusch, R. F. (2004b). The Four Service Marketing Myths: Remnants of a Goods-Based, Manufacturing Model. Journal of Service Research, 6, 324-335.
Vargo, S. L. & Lusch, R. F. (2006). Service-Dominant Logic: What It Is, What It Is Not, What is Might Be. In Lusch, R. F. & Vargo, S. L. (Eds.) The Service-Dominant Logic of Marketing: Dialog, Debate, and Directions. Armonk, M.E. Sharpe.
Vargo, S. L. & Lusch, R. F. (2008). Why "Service"? Journal of the Academy of Marketing Science, 36, 25-38.
Vargo, S. L., Maglio, P. P. & Akaka, M. A. (2008). On Value and Value Co-Creation: A Service Systems and Service Logic Perspective. European Management Journal 26.
Vasquez, R., del Rio, A. & Iglesias, V. (2002). Consumer-based Brand Equity: Development and Validation of a Measurement Instrument. Journal of Marketing Management, 18, 27-48.
Vavra, T. G. (1995). Aftermarketing:How to Keep Customers for Life Through Relationship Marketing, Maidenhead, McGraw-Hill.
Vavra, T. G. (1997). Improving Your Measurement of Customer Satisfaction, Milwaukee, ASO Quality Press.
Velliquette, A. & Rapert, M. I. (2001). A Profile of Organizational Culture: Implications for Services Marketing. Services Marketing Quarterly, 23, 69-86.
Veloustou, C. & Moutinho, L. (2008). Brand Relationships Through Brand Reputation and Brand Tribalism. Journal of Business Research, 62, 314-322.
Venable, B. T., Rose, G. M., Bush, V. D. & Gilbert, F. W. (2005). The Role of Brand Personality in Charitable Giving: An Assessment and Validation. Journal of the Academy of Marketing Science, 33, 295-312.
Venkatraman, N. & Ramanujam, V. (1986). Measuring Business Performance in Strategy Research: A Comparison Approach. Academy of Management Review, 11, 801-814.
Vorhies, D. W., Harker, M. & Rao, C. P. (1999). The Capabilities and Performance Advantages of Market-Driven Firms. European Journal of Marketing, 33, 1171-1202.
Wall, T. D., Michie, J., Patterson, M., Wood, S. J., Sheehan, M., Clegg, C. W. & West, M. (2004). On the Validity of Subjective Measures of Company Performance. Personnel Psychology, 57, 95-118.
Walley, K., Custance, P., Taylor, S., Lindgreen, A. & Hingley, M. (2007). The Importance of Brand in the Industrial Purchase Decision: A Case Study of the UK Tractor Market. Journal of Business and Industrial Marketing, 22, 383-393.

448
Walsh, G. & Beatty, S. E. (2007). Customer Based Corporate Reputation of a Service Firm: Scale Development and Validation. Academy of Marketing Science, 35, 127-143.
Webster, C. (1990). Toward The Measurement of the Marketing Culture Service Firm. Journal of Business Research, 6, 54-67.
Webster, C. (1993). Refinement of the Marketing Culture Scale and the Relationship Between Marketing Culture and Profitability of a Service Firm Journal of Business Research 26, 111-131.
Webster, C. (1995). Marketing Culture and Marketing Effectiveness in Service Firms. Journal of Services Marketing, 9, 6.
Webster, F. & Keller, K. L. (2004). A Roadmap for Branding In Industrial Markets. Brand Management, 11, 388-402.
Webster, J. F. E. (1992). The changing role of marketing in the corporation. Journal of Marketing, 56.
Weerawardena, J., O'Cass, A. & Julian, C. (2005). Does industry matter? Examining the role of industry structure and organizational learning in innovation and brand performance. Journal of Business Research, 59, 37-45.
Weerawardena, J., O'Cass, A. & Julian, C. (2006). Does industry matter? Examining the role of industry structure and organizational learning in innovation and brand performance. Journal of Business Research, 59, 37-45.
Weng, L.-J. (2004). Impact of the Number of Response Categories and Anchor Labels on Coefficient Alpha and Test-Test Reliability. Educational and Psychological Measurement, 64, 956-972.
Whetten, D. A. (1989). What Constitutes a Theoretical Contribution? Academy of Management Review, 14, 490-495.
Wilkins, A. L. & Ouchi, W. G. (1983). Efficient Cultures: Exploring the Relationship between Culture and Organizational Performance. Administrative Science Quarterly, 28, 468.
Wilson, A. M. (2001). Understanding Organizational Culture and the Implications For Corporate Marketing. European Journal of Marketing, 35, 353-367.
Wilson, D. T. (1995). An Integrated Model of Buyer-Seller Relationships. journal of the Academy of Marketing Science, 23, 335-345.
Wind, Y. & Webster, D. (1972). On the Study of Industrial Buying Behaviour: Current Practices and Future Trends. Industrial Marketing Management, 1, 411-416.
Wren, B. T. & Simpson, J. T. (1996). A Dyadic Model of Relationships in Organizational Buying: A Synthesis of Research Results. Journal of Business and Industrial Marketing, 11, 63-79.
Wyatt, R. C. & Meyers, L. S. (1987). Psychometric Properties of Four 5-Point Likert-Type Response Scales. Educational and Psychological Measurement, 47, 27-35.
Xenikou, A. & Simosi, M. (2006). Organizational Culture and Transformational Leadership as Predictors of Business Performance. Journal of Managerial Psychology, 21, 566-579.
Yammarino, F. J., Skinner, S. J. & Childers, T. L. (1991). Understanding Mail Survey Response Behaviour. Public Opinion Quarterly, 55, 613-629.

449
Yasin, N. M., Noor, M. N. & Mohamad, O. (2007). Does image of country-of-origin matter to brand equity? The Journal of Product and Brand Management, 16, 38-48.
Yoo, B. & Donthu, N. (2001). Developing and validating a multidimensional consumer-based brand equity scale. Journal of Business Research, 52, 1-14.
Yu, J. & Cooper, H. (1983). A Quantitative Review of Research Design Efforts on Response Rate Questionnaires. Journal of Marketing Research, 20, 36-44.
Yuan, K.-H. (2005). Fit Indices Versus Test Statistics. Multivariate Behavioural Research, 40, 115-148.
Yung, Y. F. & Bentler, P. M. (1994). Bootstrap Corrected ADF Test Statistics in Covariance Structure Analysis. British Journal of Mathematical and Statistical Psychology, 47, 63-84.
Zaichkowsky, J. L. (1985). Measuring the Involvement Construct. Journal of Consumer Research, 12, 341-352.
Zeithaml, V. (1981). How Consumer Evaluation Processes Differ Between Goods and Services. In Donnelly, J. H. & George, W. R. (Eds.) Marketing of Services. Chicago, American Marketing Association.
Zeithaml, V. & Bitner, M. J. (1996). Services Marketing, New York, McGraw-Hill. Zeithaml, V. A., Bitner, M. J. & Gremler, D. D. (2006). Services Marketing; Integrating
Customer Focus Across the Firm, London, McGraw-Hill. Zeithaml, V. A., Parasuraman, A. & Berry, L. L. (1985). Problems and Strategies in
Services Marketing. Journal of Marketing, 49, 33-46. Zentes, J., Morschett, D. & Schramm-Klein, H. (2008). Brand Personality of Retailers -
An Analysis of Its Applicability and Effect on Store Loyalty The International Review of Retail, Distribution and Consumer Research, 18, 167-184.
Zinkhan, G. M., Jaiskankur, A. J. & L., H. (Eds.) (2001) Corporate Image: A Conceptual Framework for Strategic Planning, Chicago, American Marketing.