Semiquantitative Risk Assessment Method for Groundwater ...
22
Vol.:(0123456789) https://doi.org/10.1007/s11269-021-02898-0 1 3 Semiquantitative Risk Assessment Method for Groundwater Source Protection Using a Process‑based Interdisciplinary Approach Robert Duda 1 · Robert Zdechlik 1 · Jarosław Kania 1 Received: 12 April 2021 / Accepted: 28 June 2021 © The Author(s) 2021 Abstract Potable groundwater resources are at risk as a result of industrial development and an increase in fertilizer use. Protection of the groundwater supply may require the establish‑ ment of groundwater source protection zones (GSPZs) to allow the implementation of pro‑ tective measures. The aim of this study was to develop a new approach to groundwater source risk assessment (GSRA). The risk was defined as the highest of the risks identified for individual potential sources of contamination (PSCs). The risk resulting from a given PSC is the combination of its adverse impact on groundwater, unwanted event probability, and adverse effect and annoyance to the population. A multicriteria assessment method was designed to estimate indices of the potential groundwater impact of industrial facilities and noninert waste landfills with the range and weight method. Application of the pro‑ posed approach was tested considering an idealized model and three scenarios involving various industrial PSCs and fertilization practices. The overall nitrogen load was compared to the maximum effective nitrogen load for the crops in question. Sensitivity analysis of this methodology revealed that the main factors influencing the risk to the water supply include the nonreactive contaminant mass load in PSC leachate and the ratio of the ground‑ water volume abstracted from wells to the amount of water flowing from PSCs into wells, which determines the dilution degree of the contaminant mass. This proposed interdiscipli‑ nary approach to GSRA provides a robust basis to reach decisions on GSPZ establishment and the development of a groundwater risk analysis methodology. Keywords Water supply · Risk analysis · Contaminant source · Groundwater pollution · Land use · Nitrate Abbreviations GSPZ Groundwater source protection zone GSRA Groundwater source risk assessment PSC Potential source of contamination PRA Probabilistic risk analysis * Robert Duda [email protected] 1 Faculty of Geology, Geophysics and Environmental Protection, AGH University of Science and Technology, Mickiewicza 30, 30‑059 Kraków, Poland / Published online: 20 July 2021 Water Resources Management (2021) 35:3373–3394
Transcript of Semiquantitative Risk Assessment Method for Groundwater ...
Vol.:(0123456789)
https://doi.org/10.1007/s11269-021-02898-0
1 3
Semiquantitative Risk Assessment Method for Groundwater Source Protection Using a Process‑based Interdisciplinary Approach
Robert Duda1 · Robert Zdechlik1 · Jarosław Kania1
Received: 12 April 2021 / Accepted: 28 June 2021 © The Author(s) 2021
AbstractPotable groundwater resources are at risk as a result of industrial development and an increase in fertilizer use. Protection of the groundwater supply may require the establish‑ment of groundwater source protection zones (GSPZs) to allow the implementation of pro‑tective measures. The aim of this study was to develop a new approach to groundwater source risk assessment (GSRA). The risk was defined as the highest of the risks identified for individual potential sources of contamination (PSCs). The risk resulting from a given PSC is the combination of its adverse impact on groundwater, unwanted event probability, and adverse effect and annoyance to the population. A multicriteria assessment method was designed to estimate indices of the potential groundwater impact of industrial facilities and noninert waste landfills with the range and weight method. Application of the pro‑posed approach was tested considering an idealized model and three scenarios involving various industrial PSCs and fertilization practices. The overall nitrogen load was compared to the maximum effective nitrogen load for the crops in question. Sensitivity analysis of this methodology revealed that the main factors influencing the risk to the water supply include the nonreactive contaminant mass load in PSC leachate and the ratio of the ground‑water volume abstracted from wells to the amount of water flowing from PSCs into wells, which determines the dilution degree of the contaminant mass. This proposed interdiscipli‑nary approach to GSRA provides a robust basis to reach decisions on GSPZ establishment and the development of a groundwater risk analysis methodology.
Keywords Water supply · Risk analysis · Contaminant source · Groundwater pollution · Land use · Nitrate
AbbreviationsGSPZ Groundwater source protection zoneGSRA Groundwater source risk assessmentPSC Potential source of contaminationPRA Probabilistic risk analysis
* Robert Duda [email protected]
1 Faculty of Geology, Geophysics and Environmental Protection, AGH University of Science and Technology, Mickiewicza 30, 30‑059 Kraków, Poland
/ Published online: 20 July 2021
Water Resources Management (2021) 35:3373–3394
1 3
WHPA Wellhead protection areaR Risk to the groundwater sourceLU Adverse impact of the PSC on the groundwater qualityPA Probability of occurrence of the unwanted eventAE Adverse effect of aquifer contaminationAAE Annoyance caused by the adverse effect to water users
1 Introduction
Groundwater contamination risk analysis is a basic part of the assessment process regard‑ing the necessity of implementing potential protective measures on a regional scale, mainly in regard to catchment areas. However, a particularly important type of analysis of the groundwater contamination risk combined with the human health risk encompasses water source evaluation. This analysis is performed to assess the need for groundwater source protection zone (GSPZ) establishment and pollution prevention measures. The World Health Organization has recommended that a drinking water safety plan and risk manage‑ment system should be developed to manage groundwater resources (WHO 2017a). This is necessary to prevent possible hazards within wellhead protection areas (WHPAs).
Groundwater source risk assessment (GSRA) is performed based on analysis of the impact of land use (Huan et al. 2018; Li et al. 2018). Land use forms potentially threatening the qual‑ity of abstracted groundwater mainly include agricultural and point sources of contamina‑tion (Lima et al. 2019; Li et al. 2020). In regard to the agricultural impact, risk analysis has been conducted targeting nitrate pollution (Su et al. 2013; Teng et al. 2019; Zambito Marsala et al. 2020). In addition to qualitative methods for groundwater risk estimation (Li et al. 2015; Zhang et al. 2016; Duda et al. 2020), advanced methods such as numerical modeling of mass transport through the vadose zone and saturated aquifer have been adopted (Troldborg et al. 2009; Enzenhoefer et al. 2012; Huan et al. 2015, 2020; Locatelli et al. 2018). Enzenhoefer et al. (2015) presented a more holistic and probabilistic approach, which additionally consid‑ered, inter alia, aggregation of the impacts stemming from different contaminants and spill locations into a cumulative impact on the risk and a method considering the stochastic nature of spill event accounting when converting the aggregated impact into risk estimates. Further‑more, Rodak and Silliman (2012) proposed an advanced approach combining probabilistic risk analysis (PRA) with fault trees of contamination sources, in addition to chemical trans‑port modeling and human health impact assessment to estimate the health effects on abstracted water users. The methods adopted in PRA of engineering system failure scenarios have been described by Ostrom and Wilhelmsen (2019) and Modarres and Kim (2020). Fuzzy fault tree analysis in risk assessment of water resource development plans was performed according to Abedzadeh et al. (2020).
Moreover, it remains a problem that most GSRA approaches usually adopt a specific concentration of the groundwater contaminant under analysis as an assessment basis (for example, nitrates), i.e., a situation that has already occurred as a result of the actual impact of pollution sources. However, these sources are usually not specified and characterized in detail. In the case of industrial facilities, overall facility characterization is lacking, which should consider not only technical aspects but also nontechnical aspects that may influence the failure probability. The approaches adopted to date typically still do not involve simul‑taneous estimation of the event probability and chemical compound mass emitted from a potential source of contamination (PSC).
3374 R. Duda et al.
1 3
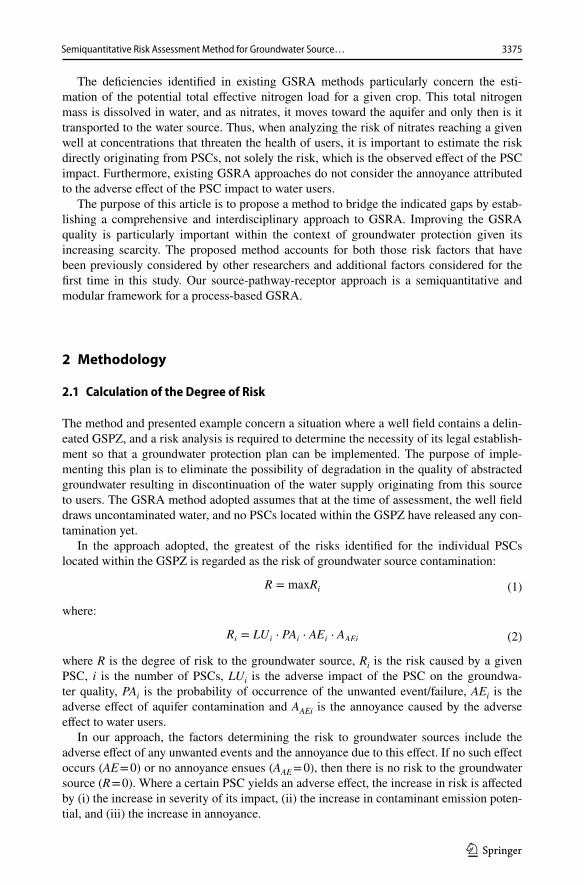
The deficiencies identified in existing GSRA methods particularly concern the esti‑mation of the potential total effective nitrogen load for a given crop. This total nitrogen mass is dissolved in water, and as nitrates, it moves toward the aquifer and only then is it transported to the water source. Thus, when analyzing the risk of nitrates reaching a given well at concentrations that threaten the health of users, it is important to estimate the risk directly originating from PSCs, not solely the risk, which is the observed effect of the PSC impact. Furthermore, existing GSRA approaches do not consider the annoyance attributed to the adverse effect of the PSC impact to water users.
The purpose of this article is to propose a method to bridge the indicated gaps by estab‑lishing a comprehensive and interdisciplinary approach to GSRA. Improving the GSRA quality is particularly important within the context of groundwater protection given its increasing scarcity. The proposed method accounts for both those risk factors that have been previously considered by other researchers and additional factors considered for the first time in this study. Our source‑pathway‑receptor approach is a semiquantitative and modular framework for a process‑based GSRA.
2 Methodology
2.1 Calculation of the Degree of Risk
The method and presented example concern a situation where a well field contains a delin‑eated GSPZ, and a risk analysis is required to determine the necessity of its legal establish‑ment so that a groundwater protection plan can be implemented. The purpose of imple‑menting this plan is to eliminate the possibility of degradation in the quality of abstracted groundwater resulting in discontinuation of the water supply originating from this source to users. The GSRA method adopted assumes that at the time of assessment, the well field draws uncontaminated water, and no PSCs located within the GSPZ have released any con‑tamination yet.
In the approach adopted, the greatest of the risks identified for the individual PSCs located within the GSPZ is regarded as the risk of groundwater source contamination:
where:
where R is the degree of risk to the groundwater source, Ri is the risk caused by a given PSC, i is the number of PSCs, LUi is the adverse impact of the PSC on the groundwa‑ter quality, PAi is the probability of occurrence of the unwanted event/failure, AEi is the adverse effect of aquifer contamination and AAEi is the annoyance caused by the adverse effect to water users.
In our approach, the factors determining the risk to groundwater sources include the adverse effect of any unwanted events and the annoyance due to this effect. If no such effect occurs (AE = 0) or no annoyance ensues (AAE = 0), then there is no risk to the groundwater source (R = 0). Where a certain PSC yields an adverse effect, the increase in risk is affected by (i) the increase in severity of its impact, (ii) the increase in contaminant emission poten‑tial, and (iii) the increase in annoyance.
(1)R = maxRi
(2)Ri = LUi ⋅ PAi ⋅ AEi ⋅ AAEi
3375Semiquantitative Risk Assessment Method for Groundwater Source…
1 3
The performed GSRA results in appropriate decisions concerning water source man‑agement. If risk occurs (R > 0), GSPZ establishment should be required to protect the water resources occurring within this zone.
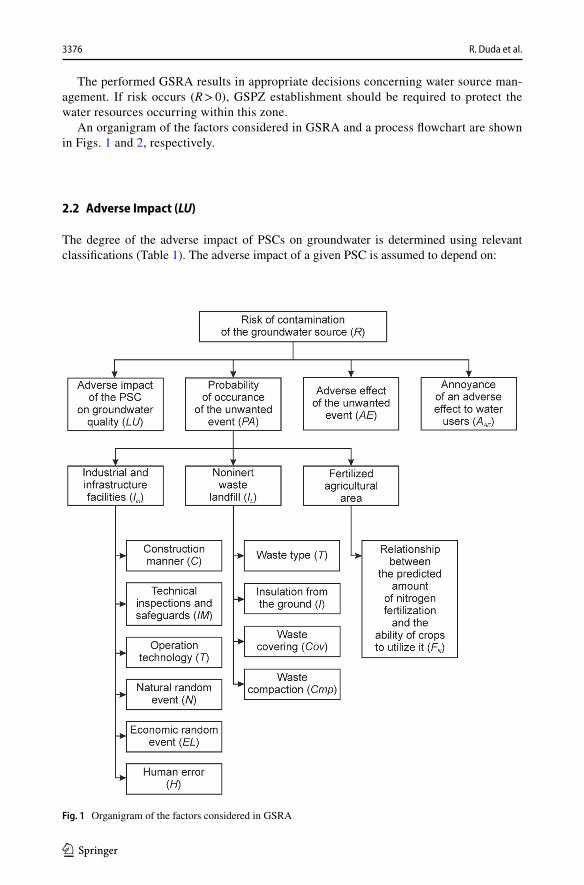
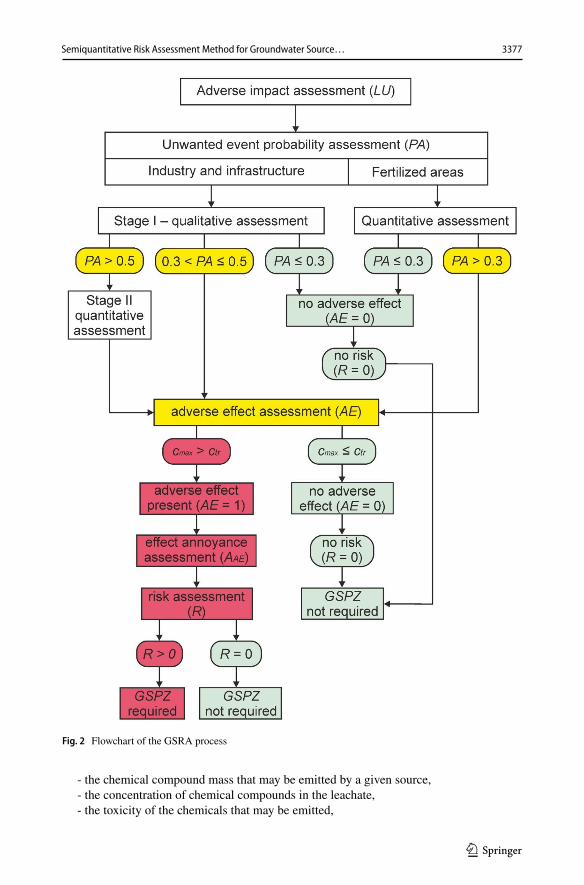
An organigram of the factors considered in GSRA and a process flowchart are shown in Figs. 1 and 2, respectively.
2.2 Adverse Impact (LU)
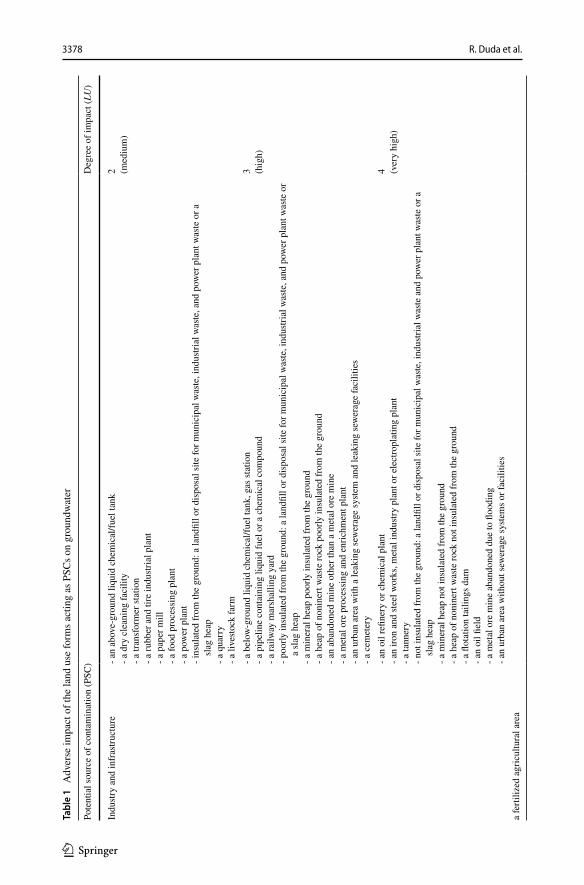
The degree of the adverse impact of PSCs on groundwater is determined using relevant classifications (Table 1). The adverse impact of a given PSC is assumed to depend on:
Fig. 1 Organigram of the factors considered in GSRA
3376 R. Duda et al.
1 3
‑ the chemical compound mass that may be emitted by a given source,‑ the concentration of chemical compounds in the leachate,‑ the toxicity of the chemicals that may be emitted,
Fig. 2 Flowchart of the GSRA process
3377Semiquantitative Risk Assessment Method for Groundwater Source…
1 3
Tabl
e 1
Adv
erse
impa
ct o
f the
land
use
form
s act
ing
as P
SCs o
n gr
ound
wat
er
Pote
ntia
l sou
rce
of c
onta
min
atio
n (P
SC)
Deg
ree
of im
pact
(LU
)
Indu
stry
and
infr
astru
ctur
e‑ a
n ab
ove‑
grou
nd li
quid
che
mic
al/fu
el ta
nk‑ a
dry
cle
anin
g fa
cilit
y‑ a
tran
sfor
mer
stat
ion
‑ a ru
bber
and
tire
indu
stria
l pla
nt‑ a
pap
er m
ill‑ a
food
pro
cess
ing
plan
t‑ a
pow
er p
lant
‑ ins
ulat
ed fr
om th
e gr
ound
: a la
ndfil
l or d
ispo
sal s
ite fo
r mun
icip
al w
aste
, ind
ustri
al w
aste
, and
pow
er p
lant
was
te o
r a
slag
hea
p‑ a
qua
rry
‑ a li
vesto
ck fa
rm
2 (med
ium
)
‑ a b
elow
‑ gro
und
liqui
d ch
emic
al/fu
el ta
nk, g
as st
atio
n‑ a
pip
elin
e co
ntai
ning
liqu
id fu
el o
r a c
hem
ical
com
poun
d‑ a
railw
ay m
arsh
allin
g ya
rd‑ p
oorly
insu
late
d fro
m th
e gr
ound
: a la
ndfil
l or d
ispo
sal s
ite fo
r mun
icip
al w
aste
, ind
ustri
al w
aste
, and
pow
er p
lant
was
te o
r a
slag
hea
p‑ a
min
eral
hea
p po
orly
insu
late
d fro
m th
e gr
ound
‑ a h
eap
of n
onin
ert w
aste
rock
poo
rly in
sula
ted
from
the
grou
nd‑ a
n ab
ando
ned
min
e ot
her t
han
a m
etal
ore
min
e‑ a
met
al o
re p
roce
ssin
g an
d en
richm
ent p
lant
‑ an
urba
n ar
ea w
ith a
leak
ing
sew
erag
e sy
stem
and
leak
ing
sew
erag
e fa
cilit
ies
‑ a c
emet
ery
3 (hig
h)
‑ an
oil r
efine
ry o
r che
mic
al p
lant
‑ an
iron
and
steel
wor
ks, m
etal
indu
stry
plan
t or e
lect
ropl
atin
g pl
ant
‑ a ta
nner
y‑ n
ot in
sula
ted
from
the
grou
nd: a
land
fill o
r dis
posa
l site
for m
unic
ipal
was
te, i
ndus
trial
was
te a
nd p
ower
pla
nt w
aste
or a
sl
ag h
eap
‑ a m
iner
al h
eap
not i
nsul
ated
from
the
grou
nd‑ a
hea
p of
non
iner
t was
te ro
ck n
ot in
sula
ted
from
the
grou
nd‑ a
flot
atio
n ta
iling
s dam
‑ an
oil fi
eld
‑ a m
etal
ore
min
e ab
ando
ned
due
to fl
oodi
ng‑ a
n ur
ban
area
with
out s
ewer
age
syste
ms o
r fac
ilitie
s
4 (ver
y hi
gh)
a fe
rtiliz
ed a
gric
ultu
ral a
rea
3378 R. Duda et al.
1 3
‑ the depth of the groundwater table, and‑ the degree of insulation of the PSC from the ground.
2.3 Probability of an Unwanted Event
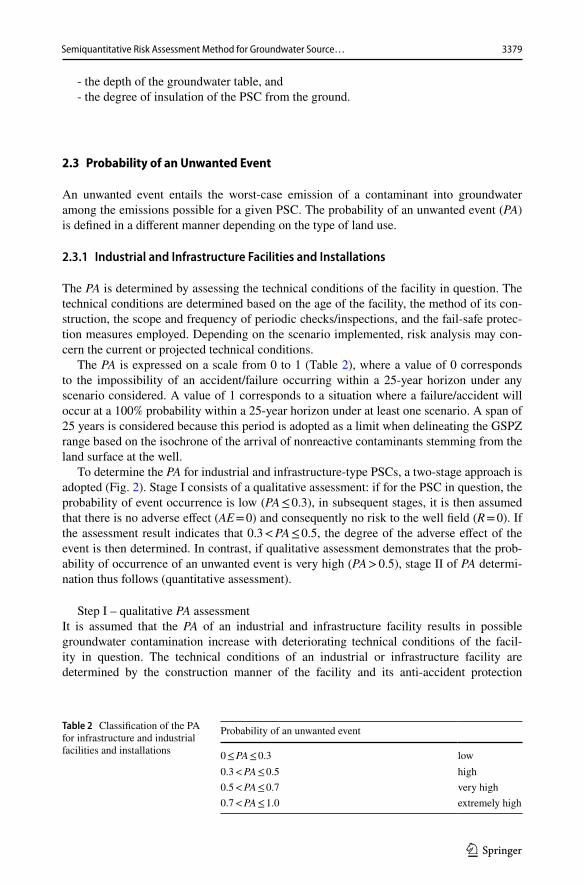
An unwanted event entails the worst‑case emission of a contaminant into groundwater among the emissions possible for a given PSC. The probability of an unwanted event (PA) is defined in a different manner depending on the type of land use.
2.3.1 Industrial and Infrastructure Facilities and Installations
The PA is determined by assessing the technical conditions of the facility in question. The technical conditions are determined based on the age of the facility, the method of its con‑struction, the scope and frequency of periodic checks/inspections, and the fail‑safe protec‑tion measures employed. Depending on the scenario implemented, risk analysis may con‑cern the current or projected technical conditions.
The PA is expressed on a scale from 0 to 1 (Table 2), where a value of 0 corresponds to the impossibility of an accident/failure occurring within a 25‑year horizon under any scenario considered. A value of 1 corresponds to a situation where a failure/accident will occur at a 100% probability within a 25‑year horizon under at least one scenario. A span of 25 years is considered because this period is adopted as a limit when delineating the GSPZ range based on the isochrone of the arrival of nonreactive contaminants stemming from the land surface at the well.
To determine the PA for industrial and infrastructure‑type PSCs, a two‑stage approach is adopted (Fig. 2). Stage I consists of a qualitative assessment: if for the PSC in question, the probability of event occurrence is low (PA ≤ 0.3), in subsequent stages, it is then assumed that there is no adverse effect (AE = 0) and consequently no risk to the well field (R = 0). If the assessment result indicates that 0.3 < PA ≤ 0.5, the degree of the adverse effect of the event is then determined. In contrast, if qualitative assessment demonstrates that the prob‑ability of occurrence of an unwanted event is very high (PA > 0.5), stage II of PA determi‑nation thus follows (quantitative assessment).
Step I – qualitative PA assessmentIt is assumed that the PA of an industrial and infrastructure facility results in possible groundwater contamination increase with deteriorating technical conditions of the facil‑ity in question. The technical conditions of an industrial or infrastructure facility are determined by the construction manner of the facility and its anti‑accident protection
Table 2 Classification of the PA for infrastructure and industrial facilities and installations
Probability of an unwanted event
0 ≤ PA ≤ 0.3 low0.3 < PA ≤ 0.5 high0.5 < PA ≤ 0.7 very high0.7 < PA ≤ 1.0 extremely high
3379Semiquantitative Risk Assessment Method for Groundwater Source…
1 3
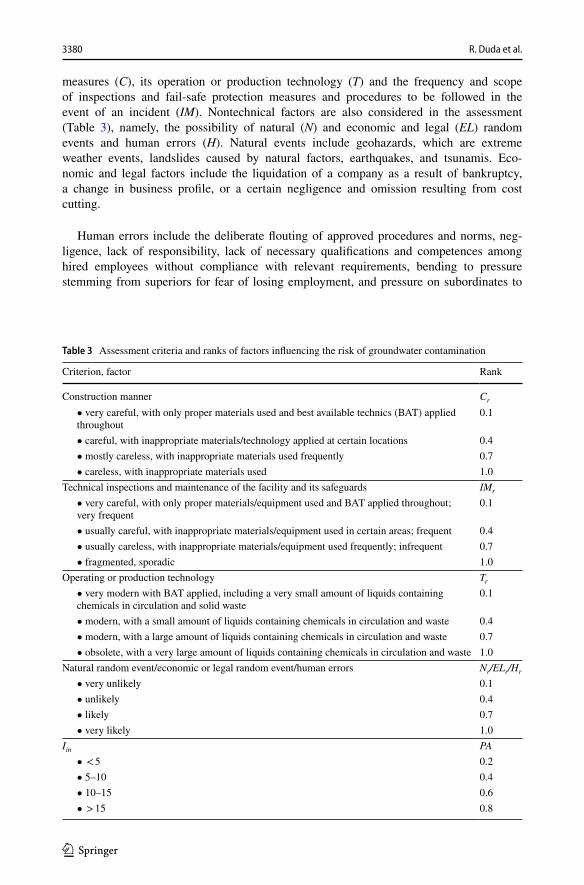
measures (C), its operation or production technology (T) and the frequency and scope of inspections and fail‑safe protection measures and procedures to be followed in the event of an incident (IM). Nontechnical factors are also considered in the assessment (Table 3), namely, the possibility of natural (N) and economic and legal (EL) random events and human errors (H). Natural events include geohazards, which are extreme weather events, landslides caused by natural factors, earthquakes, and tsunamis. Eco‑nomic and legal factors include the liquidation of a company as a result of bankruptcy, a change in business profile, or a certain negligence and omission resulting from cost cutting.
Human errors include the deliberate flouting of approved procedures and norms, neg‑ligence, lack of responsibility, lack of necessary qualifications and competences among hired employees without compliance with relevant requirements, bending to pressure stemming from superiors for fear of losing employment, and pressure on subordinates to
Table 3 Assessment criteria and ranks of factors influencing the risk of groundwater contamination
Criterion, factor Rank
Construction manner Cr
• very careful, with only proper materials used and best available technics (BAT) applied throughout
0.1
• careful, with inappropriate materials/technology applied at certain locations 0.4 • mostly careless, with inappropriate materials used frequently 0.7 • careless, with inappropriate materials used 1.0
Technical inspections and maintenance of the facility and its safeguards IMr
• very careful, with only proper materials/equipment used and BAT applied throughout; very frequent
0.1
• usually careful, with inappropriate materials/equipment used in certain areas; frequent 0.4 • usually careless, with inappropriate materials/equipment used frequently; infrequent 0.7 • fragmented, sporadic 1.0
Operating or production technology Tr
• very modern with BAT applied, including a very small amount of liquids containing chemicals in circulation and solid waste
0.1
• modern, with a small amount of liquids containing chemicals in circulation and waste 0.4 • modern, with a large amount of liquids containing chemicals in circulation and waste 0.7 • obsolete, with a very large amount of liquids containing chemicals in circulation and waste 1.0
Natural random event/economic or legal random event/human errors Nr/ELr/Hr
• very unlikely 0.1 • unlikely 0.4 • likely 0.7 • very likely 1.0
Iin PA • < 5 0.2 • 5–10 0.4 • 10–15 0.6 • > 15 0.8
3380 R. Duda et al.
1 3
force them to act improperly or to refrain from implementing certain actions, reporting irregularities, achieving group solidarity, etc.
It is assumed that the degree of impact of individual factors determining the technical con‑ditions of industrial and infrastructure facilities varies, which is expressed by their weights. The weights adopted for the individual factors are 5 (Cw and IMw), 4 (Tw), 3 (Nw), 2 (ELw) and 1 (Hw). Each factor can attain a value (rank) ranging from 0.1 to 1 (Table 3). We define the index of the potential impact of industrial and infrastructure sources on groundwater as:
Depending on the value of the Iin index, the PA is estimated for industrial and infrastructure facilities (Table 3).
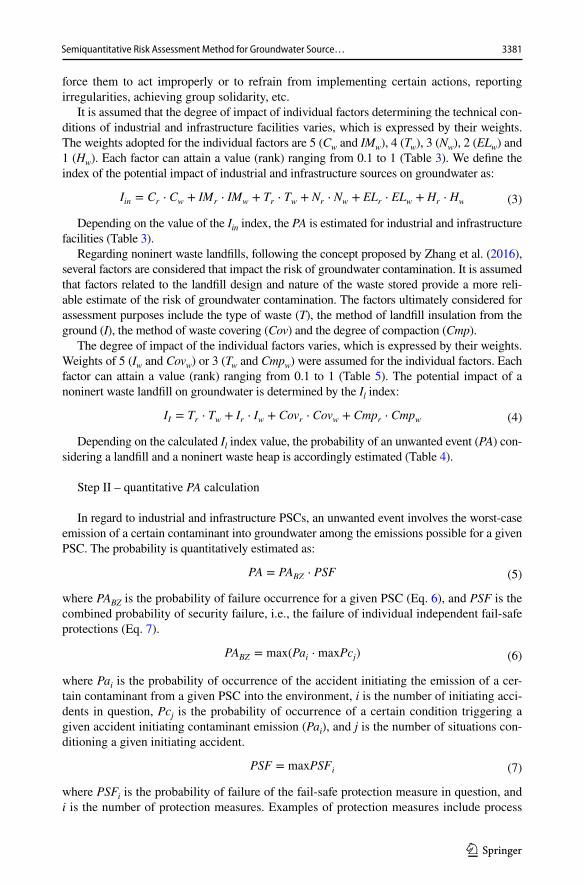
Regarding noninert waste landfills, following the concept proposed by Zhang et al. (2016), several factors are considered that impact the risk of groundwater contamination. It is assumed that factors related to the landfill design and nature of the waste stored provide a more reli‑able estimate of the risk of groundwater contamination. The factors ultimately considered for assessment purposes include the type of waste (T), the method of landfill insulation from the ground (I), the method of waste covering (Cov) and the degree of compaction (Cmp).
The degree of impact of the individual factors varies, which is expressed by their weights. Weights of 5 (Iw and Covw) or 3 (Tw and Cmpw) were assumed for the individual factors. Each factor can attain a value (rank) ranging from 0.1 to 1 (Table 5). The potential impact of a noninert waste landfill on groundwater is determined by the Il index:
Depending on the calculated Il index value, the probability of an unwanted event (PA) con‑sidering a landfill and a noninert waste heap is accordingly estimated (Table 4).
Step II – quantitative PA calculation
In regard to industrial and infrastructure PSCs, an unwanted event involves the worst‑case emission of a certain contaminant into groundwater among the emissions possible for a given PSC. The probability is quantitatively estimated as:
where PABZ is the probability of failure occurrence for a given PSC (Eq. 6), and PSF is the combined probability of security failure, i.e., the failure of individual independent fail‑safe protections (Eq. 7).
where Pai is the probability of occurrence of the accident initiating the emission of a cer‑tain contaminant from a given PSC into the environment, i is the number of initiating acci‑dents in question, Pcj is the probability of occurrence of a certain condition triggering a given accident initiating contaminant emission (Pai), and j is the number of situations con‑ditioning a given initiating accident.
where PSFi is the probability of failure of the fail‑safe protection measure in question, and i is the number of protection measures. Examples of protection measures include process
(3)Iin = Cr ⋅ Cw + IMr ⋅ IMw + Tr ⋅ Tw + Nr ⋅ Nw + ELr ⋅ ELw + Hr ⋅ Hw
(4)II = Tr ⋅ Tw + Ir ⋅ Iw + Covr ⋅ Covw + Cmpr ⋅ Cmpw
(5)PA = PABZ ⋅ PSF
(6)PABZ = max(Pai ⋅maxPcj)
(7)PSF = maxPSFi
3381Semiquantitative Risk Assessment Method for Groundwater Source…
1 3
automation, safety automation, operator or system action, isolation or protection systems, fail‑safe protection procedures, etc.
2.3.2 Fertilized Agricultural Areas
The probability of nitrate emissions into groundwater originating from diffuse pollution sources (fertilized areas) was calculated in an approximate manner. Atmospheric nitrogen
Table 4 Criteria to assess and rank the factors impacting the risk of groundwater contamination as a result of the potential impact of a landfill and the relationship between PA and Il
k is the hydraulic conductivity
Criterion, factor Rank
Waste type Tr
• municipal 0.5 • hazardous/toxic 1.0
Manner of insulation from the ground Ir
• double insulation: alternately 2 combined layers − synthetic material (PVC or HDPE) and compacted clay (thickness ≥ 1 m, k* ≤ 1·10–9 m/s), and drainage
0.1
• synthetic material (PVC or HDPE) and compacted clay (thickness ≥ 1 m, k ≤ 1·10–9 m/s), and drainage
0.4
• compacted clay (thickness ≥ 1 m, k ≤ 1·10–9 m/s) and drainage 0.7 • no insulation 1.0
Waste covering Covr
• synthetic material (PVC or HDPE), compacted clay (thickness ≥ 0.5 m, k > 1·10–9 m/s), soil and drainage
0.1
• clay (thickness ≥ 0.5 m, k > 1·10–9 m/s), soil and drainage 0.4 • loam (thickness ≥ 0.5 m, k > 1·10–7 m/s), soil and drainage 0.7 • soil only or no cover 1.0
Waste compaction Cmpr
• compacted, multiple compactor passes or permanent waste solidification 0.5 • poorly compacted, a few compactor passes or partial waste solidification 0.8 • noncompacted or nonsolidified 1.0
Il PA • < 5 0.2 • 5–10 0.4 • 10–15 0.6 • >15 1.0
Table 5 Classification of the unwanted event probability in fertilized areas
FN[kg⋅ha−1⋅y−1]
PA
value characteristics
FN ≤ ‑25 0.1 very low‑25 < FN ≤ 0 0.3 low0 < FN ≤ 25 0.5 high25 < FN ≤ 50 0.7 very highFN > 50 0.9 extremely high
3382 R. Duda et al.
1 3
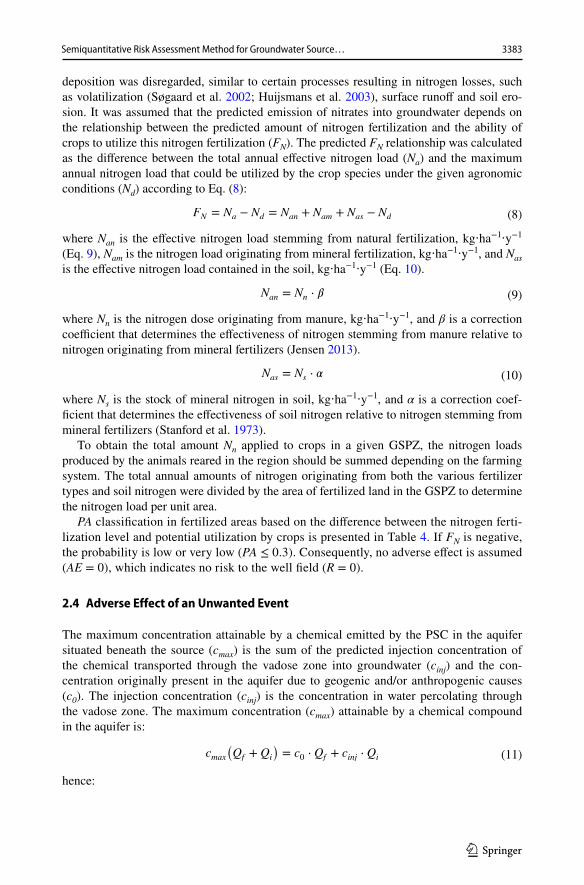
deposition was disregarded, similar to certain processes resulting in nitrogen losses, such as volatilization (Søgaard et al. 2002; Huijsmans et al. 2003), surface runoff and soil ero‑sion. It was assumed that the predicted emission of nitrates into groundwater depends on the relationship between the predicted amount of nitrogen fertilization and the ability of crops to utilize this nitrogen fertilization (FN). The predicted FN relationship was calculated as the difference between the total annual effective nitrogen load (Na) and the maximum annual nitrogen load that could be utilized by the crop species under the given agronomic conditions (Nd) according to Eq. (8):
where Nan is the effective nitrogen load stemming from natural fertilization, kg⋅ha−1⋅y−1 (Eq. 9), Nam is the nitrogen load originating from mineral fertilization, kg⋅ha−1⋅y−1, and Nas is the effective nitrogen load contained in the soil, kg⋅ha−1⋅y−1 (Eq. 10).
where Nn is the nitrogen dose originating from manure, kg⋅ha−1⋅y−1, and β is a correction coefficient that determines the effectiveness of nitrogen stemming from manure relative to nitrogen originating from mineral fertilizers (Jensen 2013).
where Ns is the stock of mineral nitrogen in soil, kg⋅ha−1⋅y−1, and α is a correction coef‑ficient that determines the effectiveness of soil nitrogen relative to nitrogen stemming from mineral fertilizers (Stanford et al. 1973).
To obtain the total amount Nn applied to crops in a given GSPZ, the nitrogen loads produced by the animals reared in the region should be summed depending on the farming system. The total annual amounts of nitrogen originating from both the various fertilizer types and soil nitrogen were divided by the area of fertilized land in the GSPZ to determine the nitrogen load per unit area.
PA classification in fertilized areas based on the difference between the nitrogen ferti‑lization level and potential utilization by crops is presented in Table 4. If FN is negative, the probability is low or very low (PA ≤ 0.3). Consequently, no adverse effect is assumed (AE = 0), which indicates no risk to the well field (R = 0).
2.4 Adverse Effect of an Unwanted Event
The maximum concentration attainable by a chemical emitted by the PSC in the aquifer situated beneath the source (cmax) is the sum of the predicted injection concentration of the chemical transported through the vadose zone into groundwater (cinj) and the con‑centration originally present in the aquifer due to geogenic and/or anthropogenic causes (c0). The injection concentration (cinj) is the concentration in water percolating through the vadose zone. The maximum concentration (cmax) attainable by a chemical compound in the aquifer is:
hence:
(8)FN = Na − Nd = Nan + Nam + Nas − Nd
(9)Nan = Nn ⋅ �
(10)Nas = Ns ⋅ �
(11)cmax(
Qf + Qi
)
= c0⋅ Qf + cinj ⋅ Qi
3383Semiquantitative Risk Assessment Method for Groundwater Source…
1 3
where Qf is the groundwater flux into the aquifer and Qi is the groundwater flux through the vadose zone beneath the PSC.
The adverse effect of an unwanted event (AE) reflects the potential contamination of groundwater flowing into the well field. This effect is determined as the ratio of the predicted concentration attainable by a given chemical released by the PSC in water abstracted from the well (cw) to its permissible concentration in drinking water (ctr):
The permissible concentration limit of a chemical compound in drinking water (ctr) corresponds to the concentration stipulated in relevant legal acts for water directed to the water supply network after disinfection.
The concentration attainable by a chemical compound emitted by a PSC in water abstracted from the well (cw) depends on the maximum concentration in groundwater beneath the PSC (cmax) and the concentration originally present in the aquifer (c0):
where Qw is the well pumping rate.The predicted maximum concentration reached by the contaminant (cmax) was deter‑
mined with an analytical method at the time upon reaching the groundwater table, con‑sidering the processes associated with mass migration. Details of the analytical method used to predict mass migration through the vadose zone can be found in the Supplementary Materials – Sect. 1.
In a given fertilized area, AE was determined if the PA was at least high (Fig. 2, Table 5). To calculate the predicted nitrate injection concentration (mg⋅L−1) migrated from the topsoil through the unsaturated zone into groundwater (cNO3), the following equation was used:
where FN is the predicted nitrogen load greater than the fertilization needs (kg⋅ha−1⋅y−1) and 0.443 is the conversion factor employed with respect to the units of the parameters occurring in this equation, considering the ratio of the equivalent weights of nitrogen and nitrates.
The nitrate injection concentration (cNO3) is equal to the nitrate concentration in the topsoil leachate due to the assumed absence of denitrification and volatilization during transport through the vadose zone.
(12)cmax =c0⋅ Qf + cinj ⋅ Qi
Qf + Qi
(13)cw ≤ ctr → AE = 0 (no adverse effect)
(14)cw > ctr → AE = 1 (adverse effect present)
(15)cw =cmax ⋅
(
Qi + Qf
)
+ c0⋅
(
Qw − Qi − Qf
)
Qw
(16)cinj = cNO3=
FN
Ie⋅ 0.443
3384 R. Duda et al.
1 3
2.5 Annoyance Related to the Adverse Effect
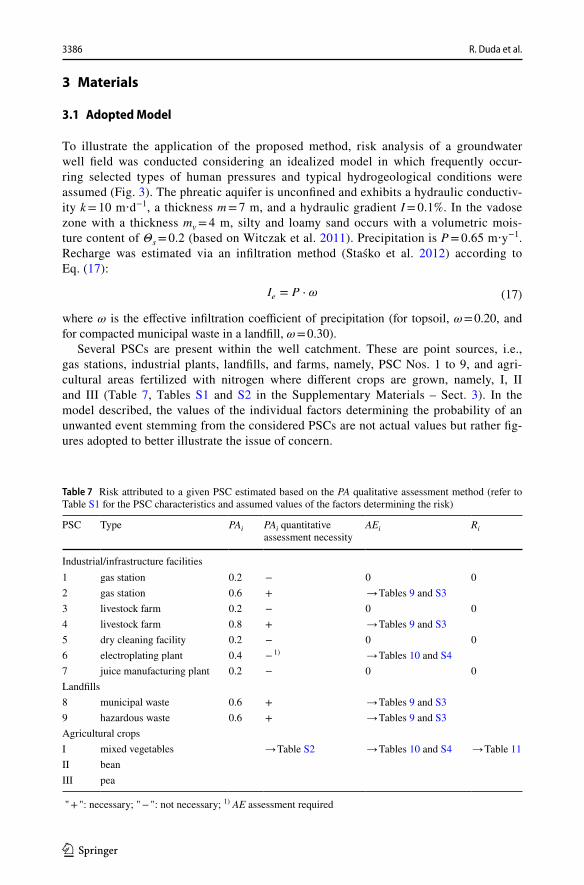
The annoyance related to the adverse effect to users of abstracted water (AAE) is deter‑mined on the basis of its duration. The duration of annoyance, or supply nonfunctioning (tnf), is assumed to encompass the number of days during which groundwater drawn from a well would be unfit for drinking and users would have to temporarily rely on another supply source, e.g., water tankers. The annoyance related to the adverse effect increases with the period during which the water supply is interrupted (Table 6).
The contaminant concentration upon reaching the well field (cw) can be determined analytically, considering the processes associated with mass migration in groundwater, but hydrodynamic dispersion may be disregarded. Details of the analytical method used to predict mass transport in groundwater can be found in the Supplementary Materials – Sect. 2.
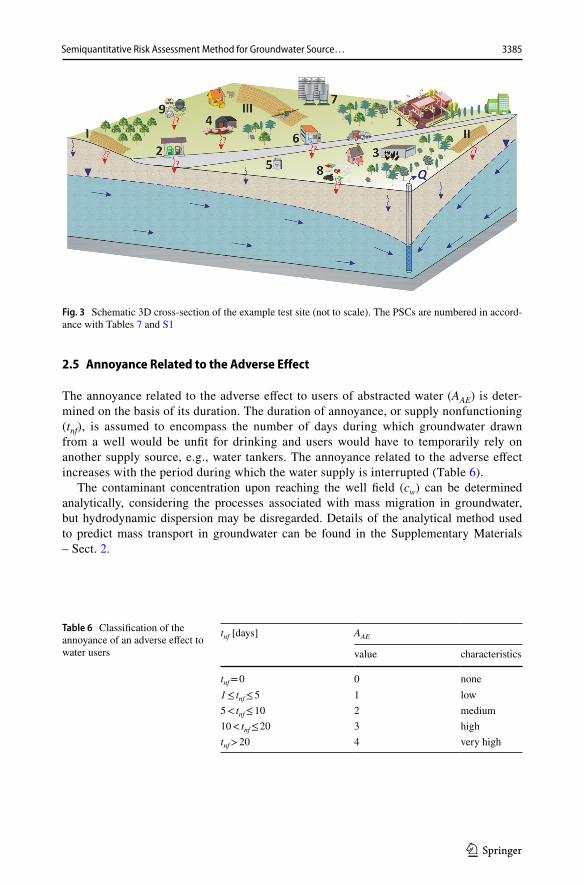
Fig. 3 Schematic 3D cross‑section of the example test site (not to scale). The PSCs are numbered in accord‑ance with Tables 7 and S1
Table 6 Classification of the annoyance of an adverse effect to water users
tnf [days] AAE
value characteristics
tnf = 0 0 none1 ≤ tnf ≤ 5 1 low5 < tnf ≤ 10 2 medium10 < tnf ≤ 20 3 hightnf > 20 4 very high
3385Semiquantitative Risk Assessment Method for Groundwater Source…
1 3
3 Materials
3.1 Adopted Model
To illustrate the application of the proposed method, risk analysis of a groundwater well field was conducted considering an idealized model in which frequently occur‑ring selected types of human pressures and typical hydrogeological conditions were assumed (Fig. 3). The phreatic aquifer is unconfined and exhibits a hydraulic conductiv‑ity k = 10 m⋅d−1, a thickness m = 7 m, and a hydraulic gradient I = 0.1%. In the vadose zone with a thickness mv = 4 m, silty and loamy sand occurs with a volumetric mois‑ture content of Θs = 0.2 (based on Witczak et al. 2011). Precipitation is P = 0.65 m⋅y−1. Recharge was estimated via an infiltration method (Staśko et al. 2012) according to Eq. (17):
where ω is the effective infiltration coefficient of precipitation (for topsoil, ω = 0.20, and for compacted municipal waste in a landfill, ω = 0.30).
Several PSCs are present within the well catchment. These are point sources, i.e., gas stations, industrial plants, landfills, and farms, namely, PSC Nos. 1 to 9, and agri‑cultural areas fertilized with nitrogen where different crops are grown, namely, I, II and III (Table 7, Tables S1 and S2 in the Supplementary Materials – Sect. 3). In the model described, the values of the individual factors determining the probability of an unwanted event stemming from the considered PSCs are not actual values but rather fig‑ures adopted to better illustrate the issue of concern.
(17)Ie = P ⋅ �
Table 7 Risk attributed to a given PSC estimated based on the PA qualitative assessment method (refer to Table S1 for the PSC characteristics and assumed values of the factors determining the risk)
" + ": necessary; " − ": not necessary; 1) AE assessment required
PSC Type PAi PAi quantitative assessment necessity
AEi Ri
Industrial/infrastructure facilities1 gas station 0.2 − 0 02 gas station 0.6 + → Tables 9 and S33 livestock farm 0.2 − 0 04 livestock farm 0.8 + → Tables 9 and S35 dry cleaning facility 0.2 − 0 06 electroplating plant 0.4 − 1) → Tables 10 and S47 juice manufacturing plant 0.2 − 0 0Landfills8 municipal waste 0.6 + → Tables 9 and S39 hazardous waste 0.6 + → Tables 9 and S3Agricultural cropsI mixed vegetables → Table S2 → Tables 10 and S4 → Table 11II beanIII pea
3386 R. Duda et al.
1 3
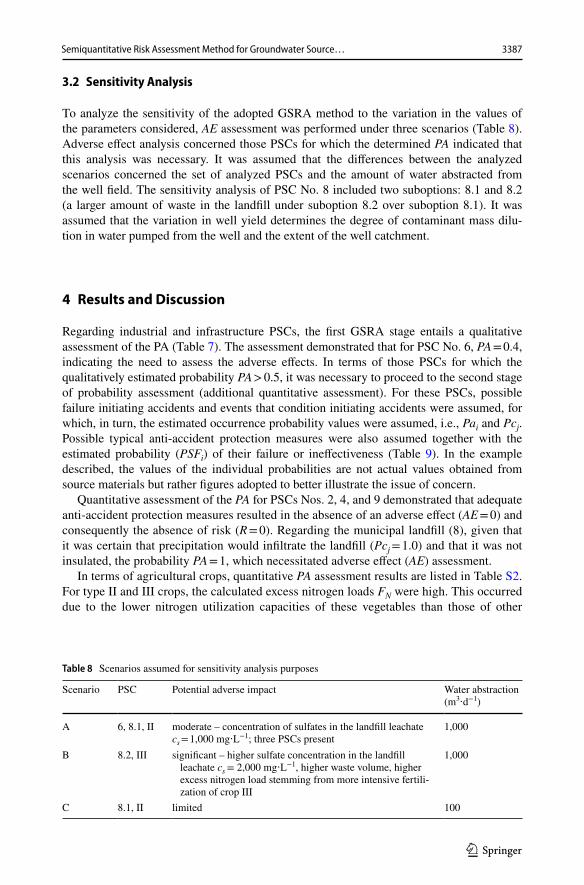
3.2 Sensitivity Analysis
To analyze the sensitivity of the adopted GSRA method to the variation in the values of the parameters considered, AE assessment was performed under three scenarios (Table 8). Adverse effect analysis concerned those PSCs for which the determined PA indicated that this analysis was necessary. It was assumed that the differences between the analyzed scenarios concerned the set of analyzed PSCs and the amount of water abstracted from the well field. The sensitivity analysis of PSC No. 8 included two suboptions: 8.1 and 8.2 (a larger amount of waste in the landfill under suboption 8.2 over suboption 8.1). It was assumed that the variation in well yield determines the degree of contaminant mass dilu‑tion in water pumped from the well and the extent of the well catchment.
4 Results and Discussion
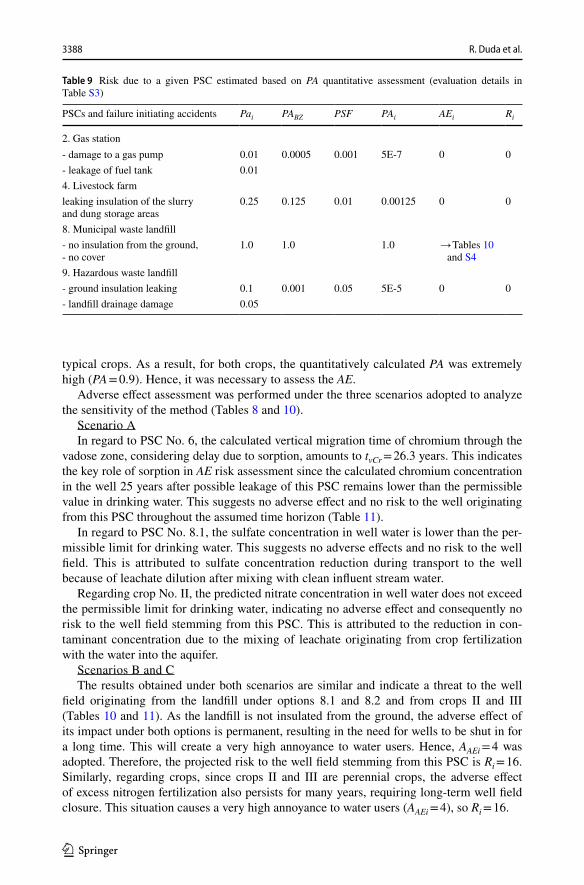
Regarding industrial and infrastructure PSCs, the first GSRA stage entails a qualitative assessment of the PA (Table 7). The assessment demonstrated that for PSC No. 6, PA = 0.4, indicating the need to assess the adverse effects. In terms of those PSCs for which the qualitatively estimated probability PA > 0.5, it was necessary to proceed to the second stage of probability assessment (additional quantitative assessment). For these PSCs, possible failure initiating accidents and events that condition initiating accidents were assumed, for which, in turn, the estimated occurrence probability values were assumed, i.e., Pai and Pcj. Possible typical anti‑accident protection measures were also assumed together with the estimated probability (PSFi) of their failure or ineffectiveness (Table 9). In the example described, the values of the individual probabilities are not actual values obtained from source materials but rather figures adopted to better illustrate the issue of concern.
Quantitative assessment of the PA for PSCs Nos. 2, 4, and 9 demonstrated that adequate anti‑accident protection measures resulted in the absence of an adverse effect (AE = 0) and consequently the absence of risk (R = 0). Regarding the municipal landfill (8), given that it was certain that precipitation would infiltrate the landfill (Pcj = 1.0) and that it was not insulated, the probability PA = 1, which necessitated adverse effect (AE) assessment.
In terms of agricultural crops, quantitative PA assessment results are listed in Table S2. For type II and III crops, the calculated excess nitrogen loads FN were high. This occurred due to the lower nitrogen utilization capacities of these vegetables than those of other
Table 8 Scenarios assumed for sensitivity analysis purposes
Scenario PSC Potential adverse impact Water abstraction(m3⋅d−1)
A 6, 8.1, II moderate – concentration of sulfates in the landfill leachate cs = 1,000 mg⋅L−1; three PSCs present
1,000
B 8.2, III significant – higher sulfate concentration in the landfill leachate cs = 2,000 mg⋅L−1, higher waste volume, higher excess nitrogen load stemming from more intensive fertili‑zation of crop III
1,000
C 8.1, II limited 100
3387Semiquantitative Risk Assessment Method for Groundwater Source…
1 3
typical crops. As a result, for both crops, the quantitatively calculated PA was extremely high (PA = 0.9). Hence, it was necessary to assess the AE.
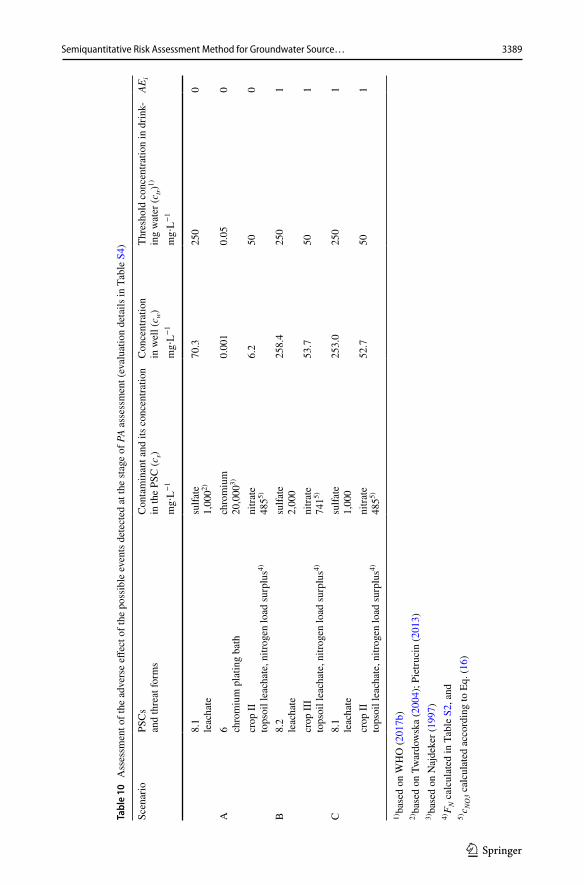
Adverse effect assessment was performed under the three scenarios adopted to analyze the sensitivity of the method (Tables 8 and 10).
Scenario AIn regard to PSC No. 6, the calculated vertical migration time of chromium through the
vadose zone, considering delay due to sorption, amounts to tvCr = 26.3 years. This indicates the key role of sorption in AE risk assessment since the calculated chromium concentration in the well 25 years after possible leakage of this PSC remains lower than the permissible value in drinking water. This suggests no adverse effect and no risk to the well originating from this PSC throughout the assumed time horizon (Table 11).
In regard to PSC No. 8.1, the sulfate concentration in well water is lower than the per‑missible limit for drinking water. This suggests no adverse effects and no risk to the well field. This is attributed to sulfate concentration reduction during transport to the well because of leachate dilution after mixing with clean influent stream water.
Regarding crop No. II, the predicted nitrate concentration in well water does not exceed the permissible limit for drinking water, indicating no adverse effect and consequently no risk to the well field stemming from this PSC. This is attributed to the reduction in con‑taminant concentration due to the mixing of leachate originating from crop fertilization with the water into the aquifer.
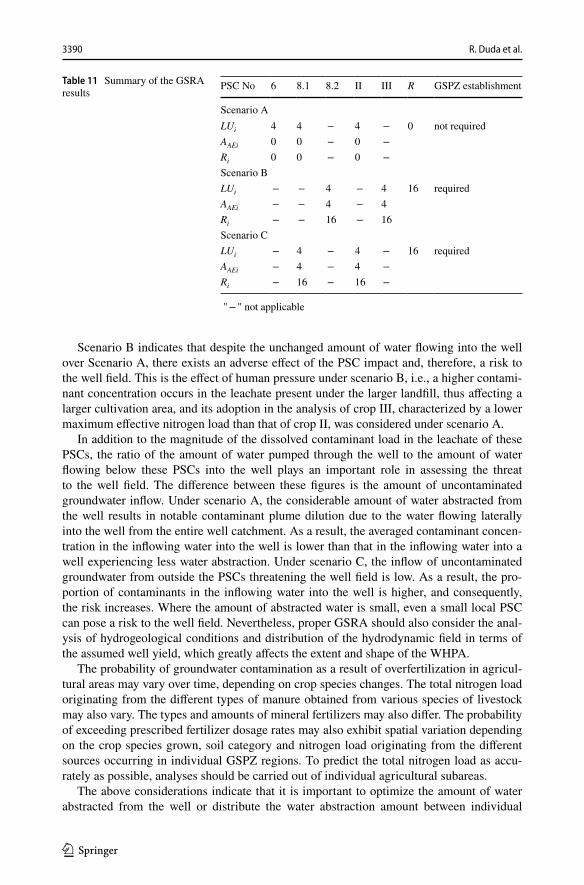
Scenarios B and CThe results obtained under both scenarios are similar and indicate a threat to the well
field originating from the landfill under options 8.1 and 8.2 and from crops II and III (Tables 10 and 11). As the landfill is not insulated from the ground, the adverse effect of its impact under both options is permanent, resulting in the need for wells to be shut in for a long time. This will create a very high annoyance to water users. Hence, AAEi = 4 was adopted. Therefore, the projected risk to the well field stemming from this PSC is Ri = 16. Similarly, regarding crops, since crops II and III are perennial crops, the adverse effect of excess nitrogen fertilization also persists for many years, requiring long‑term well field closure. This situation causes a very high annoyance to water users (AAEi = 4), so Ri = 16.
Table 9 Risk due to a given PSC estimated based on PA quantitative assessment (evaluation details in Table S3)
PSCs and failure initiating accidents Pai PABZ PSF PAi AEi Ri
2. Gas station‑ damage to a gas pump 0.01 0.0005 0.001 5E‑7 0 0‑ leakage of fuel tank 0.014. Livestock farmleaking insulation of the slurryand dung storage areas
0.25 0.125 0.01 0.00125 0 0
8. Municipal waste landfill‑ no insulation from the ground,‑ no cover
1.0 1.0 1.0 → Tables 10 and S4
9. Hazardous waste landfill‑ ground insulation leaking 0.1 0.001 0.05 5E‑5 0 0‑ landfill drainage damage 0.05
3388 R. Duda et al.
1 3
Tabl
e 10
A
sses
smen
t of t
he a
dver
se e
ffect
of t
he p
ossi
ble
even
ts d
etec
ted
at th
e st
age
of P
A as
sess
men
t (ev
alua
tion
deta
ils in
Tab
le S
4)
1) ba
sed
on W
HO
(201
7b)
2) ba
sed
on T
war
dow
ska
(200
4); P
ietru
cin
(201
3)3)
base
d on
Naj
deke
r (19
97)
4) F N
cal
cula
ted
in T
able
S2,
and
5) c N
O3 c
alcu
late
d ac
cord
ing
to E
q. (1
6)
Scen
ario
PSC
san
d th
reat
form
sC
onta
min
ant a
nd it
s con
cent
ratio
n in
the
PSC
(cs)
Con
cent
ratio
nin
wel
l (c w
)Th
resh
old
conc
entra
tion
in d
rink‑
ing
wat
er (c
tr)1)
AEi
mg⋅
L−1
mg⋅
L−1
mg⋅
L−1
8.1
leac
hate
sulfa
te1,
0002)
70.3
250
0
A6 ch
rom
ium
pla
ting
bath
chro
miu
m20
,000
3)0.
001
0.05
0
crop
IIto
psoi
l lea
chat
e, n
itrog
en lo
ad su
rplu
s4)ni
trate
4855)
6.2
500
B8.
2le
acha
tesu
lfate
2,00
025
8.4
250
1
crop
III
tops
oil l
each
ate,
nitr
ogen
load
surp
lus4)
nitra
te74
15)53
.750
1
C8.
1le
acha
tesu
lfate
1,00
025
3.0
250
1
crop
IIto
psoi
l lea
chat
e, n
itrog
en lo
ad su
rplu
s4)ni
trate
4855)
52.7
501
3389Semiquantitative Risk Assessment Method for Groundwater Source…
1 3
Scenario B indicates that despite the unchanged amount of water flowing into the well over Scenario A, there exists an adverse effect of the PSC impact and, therefore, a risk to the well field. This is the effect of human pressure under scenario B, i.e., a higher contami‑nant concentration occurs in the leachate present under the larger landfill, thus affecting a larger cultivation area, and its adoption in the analysis of crop III, characterized by a lower maximum effective nitrogen load than that of crop II, was considered under scenario A.
In addition to the magnitude of the dissolved contaminant load in the leachate of these PSCs, the ratio of the amount of water pumped through the well to the amount of water flowing below these PSCs into the well plays an important role in assessing the threat to the well field. The difference between these figures is the amount of uncontaminated groundwater inflow. Under scenario A, the considerable amount of water abstracted from the well results in notable contaminant plume dilution due to the water flowing laterally into the well from the entire well catchment. As a result, the averaged contaminant concen‑tration in the inflowing water into the well is lower than that in the inflowing water into a well experiencing less water abstraction. Under scenario C, the inflow of uncontaminated groundwater from outside the PSCs threatening the well field is low. As a result, the pro‑portion of contaminants in the inflowing water into the well is higher, and consequently, the risk increases. Where the amount of abstracted water is small, even a small local PSC can pose a risk to the well field. Nevertheless, proper GSRA should also consider the anal‑ysis of hydrogeological conditions and distribution of the hydrodynamic field in terms of the assumed well yield, which greatly affects the extent and shape of the WHPA.
The probability of groundwater contamination as a result of overfertilization in agricul‑tural areas may vary over time, depending on crop species changes. The total nitrogen load originating from the different types of manure obtained from various species of livestock may also vary. The types and amounts of mineral fertilizers may also differ. The probability of exceeding prescribed fertilizer dosage rates may also exhibit spatial variation depending on the crop species grown, soil category and nitrogen load originating from the different sources occurring in individual GSPZ regions. To predict the total nitrogen load as accu‑rately as possible, analyses should be carried out of individual agricultural subareas.
The above considerations indicate that it is important to optimize the amount of water abstracted from the well or distribute the water abstraction amount between individual
Table 11 Summary of the GSRA results
" − " not applicable
PSC No 6 8.1 8.2 II III R GSPZ establishment
Scenario ALUi 4 4 − 4 − 0 not requiredAAEi 0 0 − 0 − Ri 0 0 − 0 − Scenario BLUi − − 4 − 4 16 requiredAAEi − − 4 − 4Ri − − 16 − 16Scenario CLUi − 4 − 4 − 16 requiredAAEi − 4 − 4 − Ri − 16 − 16 −
3390 R. Duda et al.
1 3
wells in a multiwell field under nitrogen fertilization optimization to protect well fields against a high risk resulting in their closure (Salcedo‑Sanchez et al. 2013; Zdechlik and Kałuża 2019). Ghandi and Roozbahani (2020) presented how the risk to the drinking water supply can be managed under critical conditions if it is impossible to avoid these conditions.
Where a contaminant is continuously emitted into groundwater, the annoyance to water users plays a key role in the assessment of the resulting risk. The outcome of risk analysis also depends on the adverse impact of PSCs and the effect of unwanted events. Comparable results of regional groundwater risk analysis were obtained by Huan et al. (2018) and Li et al. (2020), who applied a similar approach accounting for the groundwater intrinsic vul‑nerability and contaminant potential quantity, representing the hazard originating from land use activities, as two of the three risk factors considered. Generally, similar results were also obtained by Huan et al. (2020) in a risk analysis of groundwater sources due to the presence of livestock farms and landfills. They applied a similar process‑based approach, considering mass transport through an unsaturated zone and an aquifer, via numerical sim‑ulations. Therefore, it seems feasible and effective to combine their method and tool with our approach.
5 Conclusions
Although the proposed method is extensive, the GSRA results obtained as a result of its application should provide a robust basis for policymakers when making decisions on GSPZ establishment.
As the performed GSRA concerns a specific period, another analysis is required after this period. This is attributed to possible changes in land use, technical conditions of the PSCs, agricultural production and related fertilization practices.
The reliable performance of GSRA requires the involvement of a multidisciplinary team and is a difficult task. The analysis complexity depends on the manner of land use assess‑ment and diversity of the PSCs occurring within the projected GSPZ.
It is also necessary to improve the methods for assessment adaptation of the probability of industrial accidents and adverse natural, economic, and legal events to environmental risk analysis. This issue, although very difficult, must be resolved because without consid‑ering these probabilities, these assessments will inevitably be burdened by uncertainty.
The proposed process‑based holistic GSRA method, which accounts for different types of PSCs, can also be applied, with minor modifications, to regional analysis of the ground‑water contamination risk. Assessing the need for groundwater protection on a regional scale is important in light of the progressing depletion of groundwater resources.
Supplementary Information The online version contains supplementary material available at https:// doi. org/ 10. 1007/ s11269‑ 021‑ 02898‑0.
Acknowledgements The authors thank the editor, the associate editor, and anonymous reviewers for their valuable comments that helped us to improve the manuscript.
Author Contributions Robert Duda and Robert Zdechlik designed the study. Robert Zdechlik prepared the data for analysis and conducted the research. Jarosław Kania participated in the research. Robert Duda wrote the first draft of the manuscript, which was edited and enhanced by Robert Zdechlik. All authors contributed to manuscript review.
3391Semiquantitative Risk Assessment Method for Groundwater Source…
1 3
Funding This research was supported by the Ministry of Education and Science, Poland, under Grant No. 16.16.140.315.
Data Availability Yes.
Declarations
Ethical Approval All work complies with ethical standards.
Consent to Participate All authors give their permission.
Consent to Publish All authors give their permission.
Competing Interests The authors declare no competing interests.
Open Access This article is licensed under a Creative Commons Attribution 4.0 International License, which permits use, sharing, adaptation, distribution and reproduction in any medium or format, as long as you give appropriate credit to the original author(s) and the source, provide a link to the Creative Com‑mons licence, and indicate if changes were made. The images or other third party material in this article are included in the article’s Creative Commons licence, unless indicated otherwise in a credit line to the material. If material is not included in the article’s Creative Commons licence and your intended use is not permitted by statutory regulation or exceeds the permitted use, you will need to obtain permission directly from the copyright holder. To view a copy of this licence, visit http:// creat iveco mmons. org/ licen ses/ by/4. 0/.
References
Abedzadeh S, Roozbahani A, Heidari A (2020) Risk assessment of water resources development plans using fuzzy fault tree analysis. Water Resour Manage 34:2549–2569. https:// doi. org/ 10. 1007/ s11269‑ 020‑ 02578‑5
Duda R, Klebert I, Zdechlik R (2020) Groundwater pollution risk assessment based on vulnerability to pollution and potential impact of land use forms. Pol J Environ Stud 29(1):87−99. https:// doi. org/ 10. 15244/ pjoes/ 104362
Enzenhoefer R, Binning PJ, Nowak W (2015) STakeholder‑Objective Risk Model (STORM): Determining the aggregated risk of multiple contaminant hazards in groundwater well catchments. Adv Water Resour 83:160–175. https:// doi. org/ 10. 1016/j. advwa tres. 2015. 05. 015
Enzenhoefer R, Nowak W, Helmig R (2012) Probabilistic exposure risk assessment with advective–dispersive well vulnerability criteria. Adv Water Resour 36:121–132. https:// doi. org/ 10. 1016/j. advwa tres. 2011. 04. 018
Ghandi M, Roozbahani A (2020) Risk management of drinking water supply in critical conditions using fuzzy PROMETHEE V technique. Water Resour Manage 34:595–615. https:// doi. org/ 10. 1007/ s11269‑ 019‑ 02460‑z
Huan H, Hu L, Yang Y, Jia Y, Lian X, Ma X, Jiang Y, Xi B (2020) Groundwater nitrate pollution risk assess‑ment of the groundwater source field based on the integrated numerical simulations in the unsaturated zone and saturated aquifer. Environ Int 137:105532. https:// doi. org/ 10. 1016/j. envint. 2020. 105532
Huan H, Wang J, Lai D, Teng Y, Zhai Y (2015) Assessment of well vulnerability for groundwater source protection based on a solute transport model: a case study from Jilin City, northeast China. Hydrogeol J 23(3):581–596. https:// doi. org/ 10. 1007/ s10040‑ 014‑ 1211‑4
Huan H, Zhang BT, Kong H, Li M, Wang W, Xi B, Wang G (2018) Comprehensive assessment of groundwa‑ter pollution risk based on HVF model: A case study in Jilin City of northeast China. Sci Total Environ 628–629:1518–1530. https:// doi. org/ 10. 1016/j. scito tenv. 2018. 02. 130
Huijsmans JFM, Hol JMG, Vermeulen GD (2003) Effect of application method, manure characteristics, weather and field conditions on ammonia volatilization from manure applied to arable land. Atmos Environ 37:3669–3680. https:// doi. org/ 10. 1016/ S1352‑ 2310(03) 00450‑3
Jensen LS (2013) Animal manure fertiliser value, crop utilisation and soil quality impacts. In: Animal Manure Recycling: Treatment and Management. Sommer SG, Christensen ML, Schmidt T, Jensen LS (eds), John Wiley & Sons. https:// doi. org/ 10. 1002/ 97811 18676 677. ch15
Li F, Zhao Y, Feng P, Zhang W, Qiao J (2015) Risk assessment of groundwater and its application. Part I: risk grading based on the functional zoning of groundwater. Water Resour Manag 29(8):2697–2714. https:// doi. org/ 10. 1007/ s11269‑ 015‑ 0964‑4
3392 R. Duda et al.
1 3
Li F, Zhu J, Deng X, Zhao Y, Li S (2018) Assessment and uncertainty analysis of groundwater risk. Environ Res 160:140–151. https:// doi. org/ 10. 1016/j. envres. 2017. 09. 030
Li X, Wu H, Qian H (2020) Groundwater contamination risk assessment using intrinsic vulnerability, pollution loading and groundwater value: a case study in Yinchuan plain, China. Environ Sci Pollut R 27:45591–45604. https:// doi. org/ 10. 1007/ s11356‑ 020‑ 10221‑4
Lima ML, Romanelli A, Calderon G, Massone H (2019) Multi‑criteria decision model for assessing ground‑water pollution risk in the urban‑rural interface of Mar del Plata City (Argentina). Environ Monit Assess 191(6):347. https:// doi. org/ 10. 1007/ s10661‑ 019‑ 7485‑1
Locatelli L, Binning PJ, Sanchez‑Vila X, Lemming Søndergaard G, Rosenberg L, Bjerg PL (2018) A simple contaminant fate and transport modelling tool for management and risk assessment of groundwater pollu‑tion from contaminated sites. J Contam Hydrol 221:35–49. https:// doi. org/ 10. 1016/j. jconh yd. 2018. 11. 002
Modarres M, Kim IS (2020) Probabilistic risk assessment. In: Reference module in Earth systems and environ‑mental sciences, Elsevier. https:// doi. org/ 10. 1016/ B978‑0‑ 12‑ 409548‑ 9. 12161‑X
Najdeker E (1997) Trivalent chromium plating baths, 1. Literature overview and primary investigations. Materi‑aly Elektroniczne, 25(2):26−34 (in Polish)
Ostrom L, Wilhelmsen C (2019) Probabilistic risk assessment. In: Risk assessment − tools, techniques, and their applications. 251–260, John Wiley & Sons. https:// doi. org/ 10. 1002/ 97811 19483 342. ch18
Pietrucin D (2013) Monitoring of the aquatic environment of an industrial area with multiple sources of pollu‑tion. Bull Geograph Phys Geograph Series 6:43–58. https:// doi. org/ 10. 2478/ bgeo‑ 2013‑ 0003
Rodak C, Silliman S (2012) Probabilistic risk analysis and fault trees: Initial discussion of application to iden‑tification of risk at a wellhead. Adv Water Resour 36:133–145. https:// doi. org/ 10. 1016/j. advwa tres. 2011. 02. 005
Salcedo‑Sanchez ER, Esteller MV, Garrido Hoyos SE, Martinez‑Morales M (2013) Groundwater optimization model for sustainable management of the Valley of Puebla aquifer, Mexico. Environ Earth Sci 70:337–351. https:// doi. org/ 10. 1007/ s12665‑ 012‑ 2131‑z
Søgaard HTS, Sommer SG, Hutchings NJ, Huijsmans JFM, Bussink DW, Nicholson F (2002) Ammonia vola‑tilization from field‑applied animal slurry – the ALFAM model. Atmos Environ 36:3309–3319. https:// doi. org/ 10. 1016/ S1352‑ 2310(02) 00300‑X
Stanford G, Legg JO, Smith SJ (1973) Soil nitrogen availability evaluations based on nitrogen mineralization potentials of soils and uptake of labeled and unlabeled nitrogen by plants. Plant Soil 39:113–124. https:// doi. org/ 10. 1007/ BF000 18050
Staśko S, Tarka R, Olichwer T (2012) Groundwater recharge evaluation based on the infiltration method. In: Maloszewski P, Witczak S, Malina G (eds), Groundwater Quality Sustainability. Intern Assoc Hydrogeol Selected Papers 17:189–197
Su X, Wang H, Zhang Y (2013) Health risk assessment of nitrate contamination in groundwater: a case study of an agricultural area in northeast China. Water Resour Manag 27:3025–3034. https:// doi. org/ 10. 1007/ s11269‑ 013‑ 0330‑3
Teng YG, Zuo R, Xiong Y, Wu J, Zhai YZ, Su J (2019) Risk assessment framework for nitrate contamination in groundwater for regional management. Sci Total Environ 697:134102. https:// doi. org/ 10. 1016/j. scito tenv. 2019. 134102
Troldborg M, Binning PJ, Nielsen S, Kjeldsen P, Christensen AG (2009) Unsaturated zone leaching models for assessing risk to groundwater of contaminated sites. J Contam Hydrol 105:28–37. https:// doi. org/ 10. 1016/j. jconh yd. 2008. 11. 002
Twardowska I (2004) Assessment of pollution potential from solid waste. In: Twardowska I, Allen HE, Kettrup AF, Lacy WJ (eds) Solid waste: assessment, monitoring and remediation. Waste Manag Series, 4, Else‑vier, Amsterdam
WHO (2017a) Global status report on water safety plans: A review of proactive risk assessment and risk man‑agement practices to ensure the safety of drinking‑water. World Health Organization, Geneva. https:// apps. who. int/ iris/ handle/ 10665/ 255649
WHO (2017b) Guidelines for drinking‑water quality: Fourth edition incorporating the first Addendum. World Health Organization, Geneva. https:// www. who. int/ publi catio ns/i/ item/ 97892 41549 950
Witczak S, Duda R, Żurek A, Górski J, Dragon K et al (2011) Groundwater vulnerability map of Poland, 1:500 000. Ministry of Environment, Publ. by AGH University of Science and Technology, Krakow, (in Polish with English translation)
Zambito Marsala R, Capri E, Russo E, Barazzoni L, Peroncini E et al (2020) Influence of nitrogen‑based ferti‑lization on nitrates occurrence in groundwater of hilly vineyards. Sci Total Environ 144512https:// doi. org/ 10. 1016/j. scito tenv. 2020. 144512
Zdechlik R, Kałuża A (2019) The FEM model of groundwater circulation in the vicinity of the Świniarsko intake, near Nowy Sącz (Poland). Geologos 25:255–262. https:// doi. org/ 10. 2478/ logos‑ 2019‑ 0028
3393Semiquantitative Risk Assessment Method for Groundwater Source…
1 3
Zhang B, Li G, Cheng P, Yeh T‑CJ, Hong M (2016) Landfill risk assessment on groundwater based on vulnerability and pollution index. Water Resour Manag 30:1465–1480. https:// doi. org/ 10. 1007/ s11269‑ 016‑ 1233‑x
Publisher’s Note Springer Nature remains neutral with regard to jurisdictional claims in published maps and institutional affiliations.
3394 R. Duda et al.