
Value of semiquantitative perfusion imaging in critical ...
18
Value of semiquantitative perfusion imaging in critical limb ischemia for perfusion guided revascularisation Peter Huppert Dpt. of Radiology, Neuroradiology and Nuclear Medicine Klinikum Darmstadt, Germany Certified Vascular Center
Transcript of Value of semiquantitative perfusion imaging in critical ...

Value of semiquantitative perfusion imagingin critical limb ischemia
for perfusion guided revascularisation
Peter Huppert
Dpt. of Radiology, Neuroradiology and Nuclear Medicine
Klinikum Darmstadt, Germany
Certified Vascular
Center

Disclosure
Speaker name:
Peter Huppert, M.D.
I have the following potential conflicts of interest to report:
Consulting
Employment in industr
Stockholder of a healthcare company
Owner of a healthcare company
Other(s)
x I do not have any potential conflict of interest
Tissue Perfusion Imagingduring FD-based DSA
• Dyna-CT
„C-arm-CT“, cone beam-CT“
• Dynamic tissue contrast
mapping during DSA
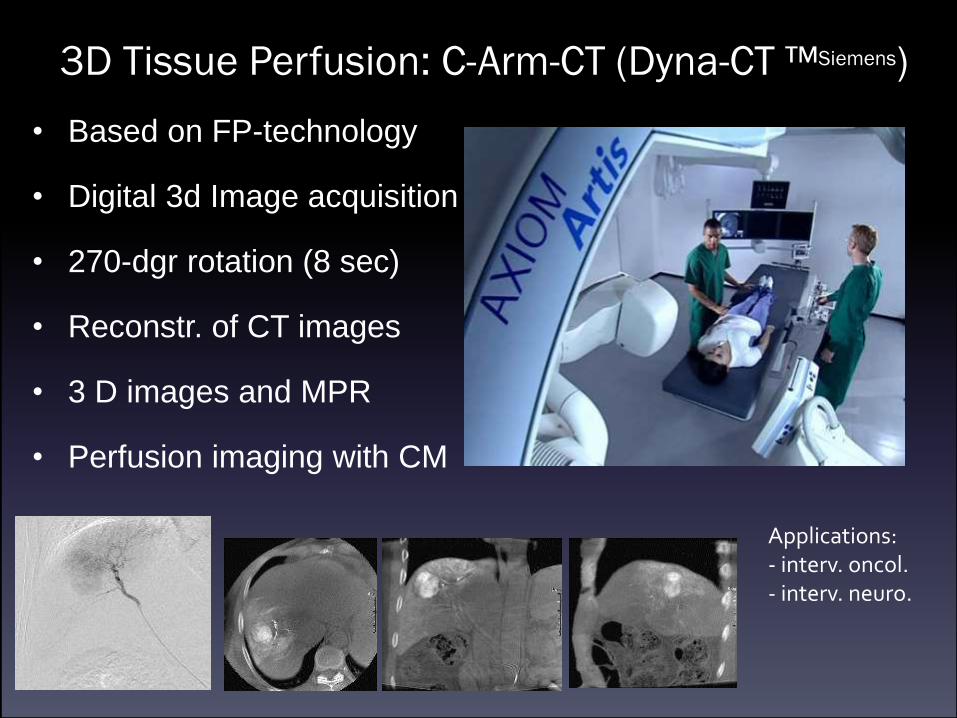
3D Tissue Perfusion: C-Arm-CT (Dyna-CT ™Siemens)
• Based on FP-technology
• Digital 3d Image acquisition
• 270-dgr rotation (8 sec)
• Reconstr. of CT images
• 3 D images and MPR
• Perfusion imaging with CM
Applications:- interv. oncol.- interv. neuro.
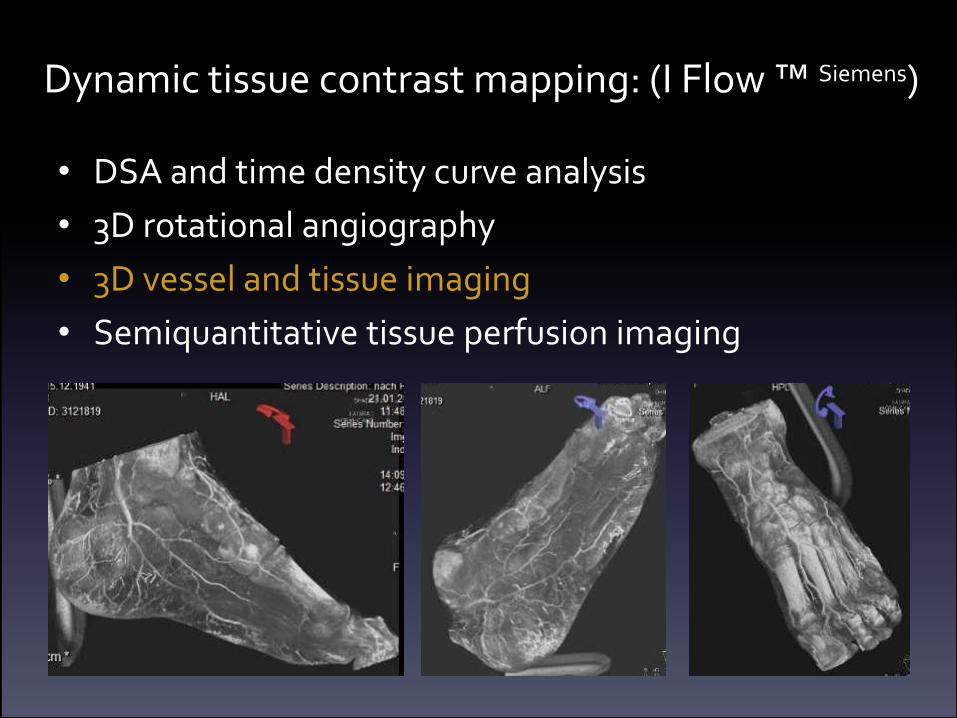
Dynamic tissue contrast mapping: (I Flow ™ Siemens)
• DSA and time density curve analysis
• 3D rotational angiography
• 3D vessel and tissue imaging
• Semiquantitative tissue perfusion imaging
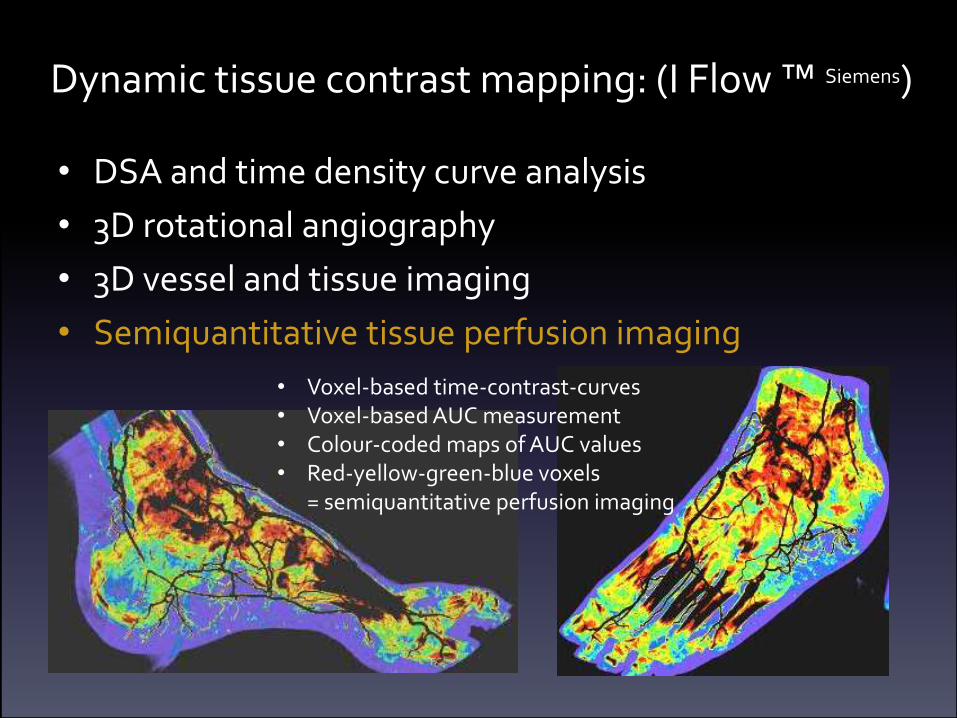
Dynamic tissue contrast mapping: (I Flow ™ Siemens)
• DSA and time density curve analysis
• 3D rotational angiography
• 3D vessel and tissue imaging
• Semiquantitative tissue perfusion imaging
• Voxel-based time-contrast-curves• Voxel-based AUC measurement• Colour-coded maps of AUC values• Red-yellow-green-blue voxels
= semiquantitative perfusion imaging
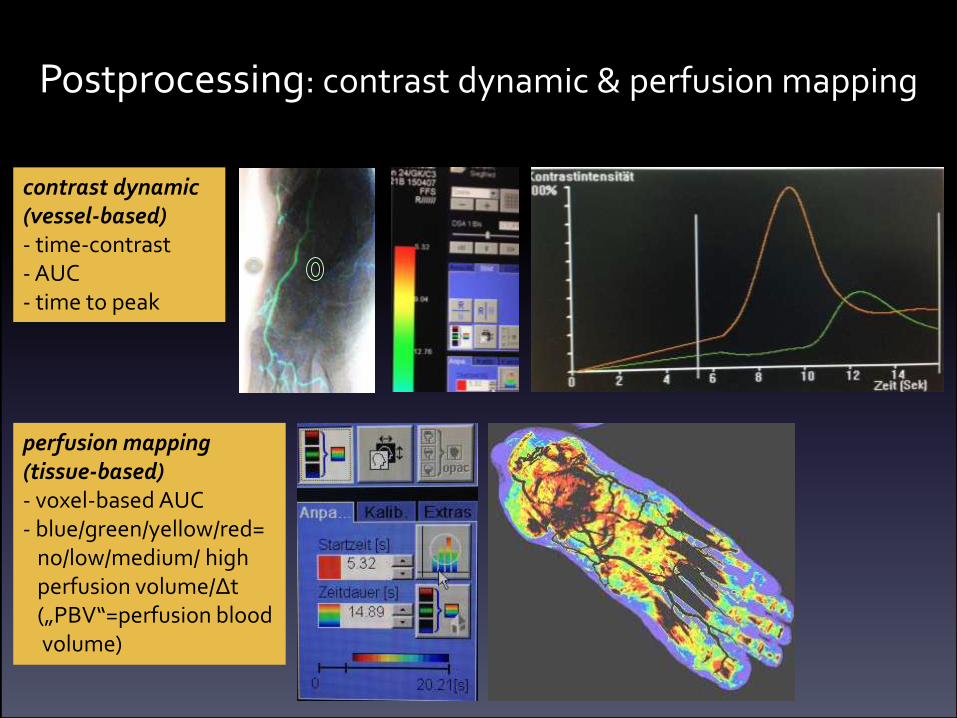
Postprocessing: contrast dynamic & perfusion mapping
contrast dynamic(vessel-based)- time-contrast- AUC- time to peak
perfusion mapping(tissue-based)- voxel-based AUC- blue/green/yellow/red=
no/low/medium/ highperfusion volume/Δt(„PBV“=perfusion bloodvolume)
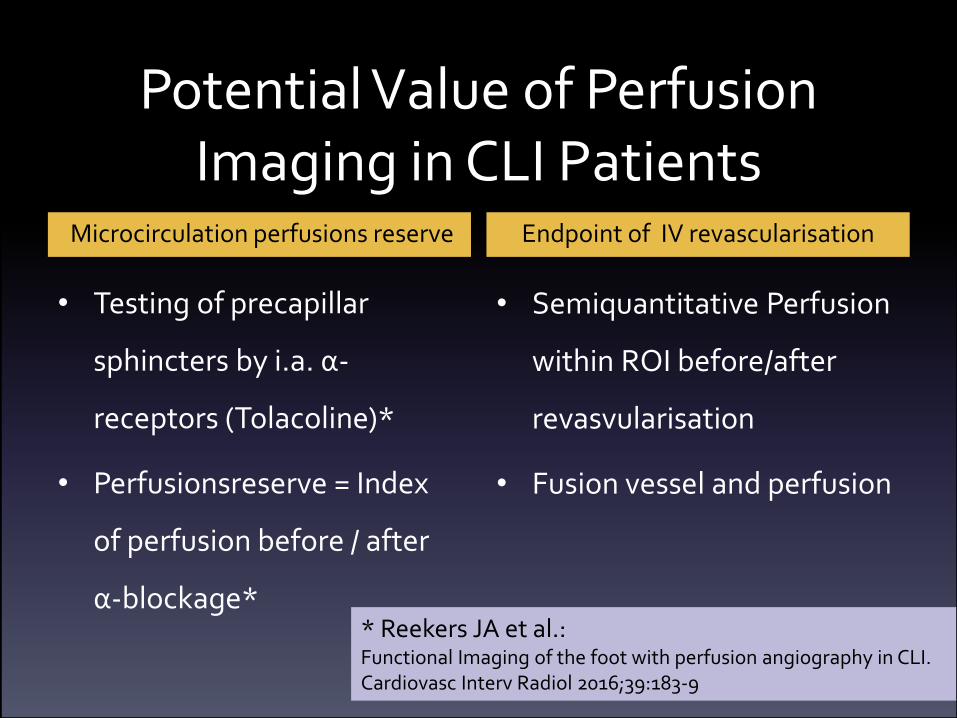
Potential Value of Perfusion Imaging in CLI Patients
Microcirculation perfusions reserve
• Testing of precapillar
sphincters by i.a. α-
receptors (Tolacoline)*
• Perfusionsreserve = Index
of perfusion before / after
α-blockage*
Endpoint of IV revascularisation
• Semiquantitative Perfusion
within ROI before/after
revasvularisation
• Fusion vessel and perfusion
* Reekers JA et al.:Functional Imaging of the foot with perfusion angiography in CLI.Cardiovasc Interv Radiol 2016;39:183-9
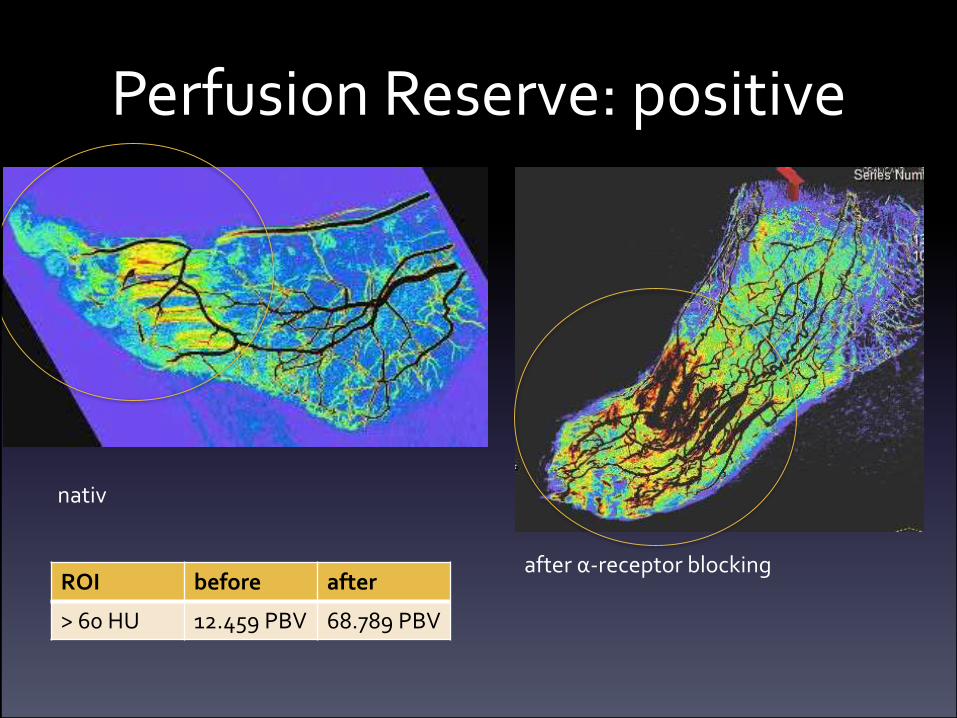
Perfusion Reserve: positive
nativ
after α-receptor blockingROI before after
> 60 HU 12.459 PBV 68.789 PBV
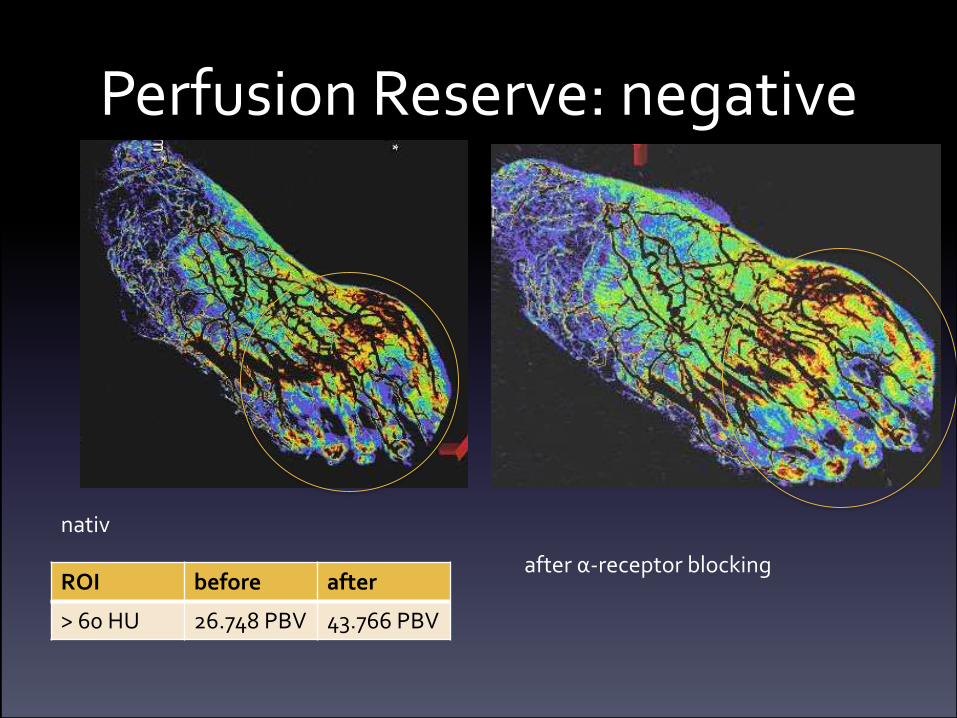
Perfusion Reserve: negative
nativ
after α-receptor blockingROI before after
> 60 HU 26.748 PBV 43.766 PBV
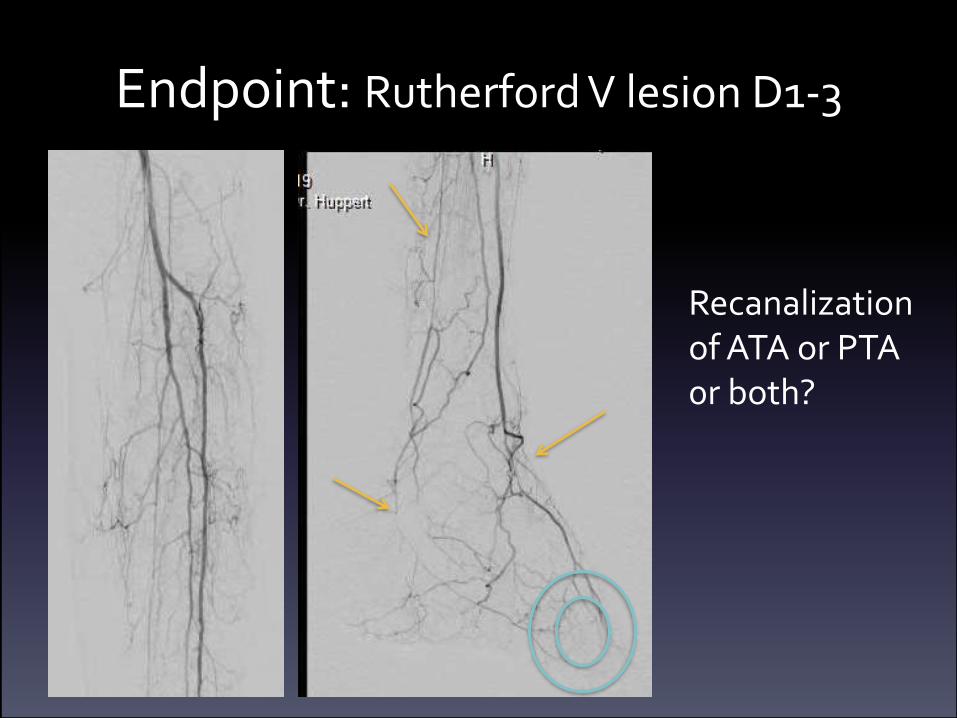
Endpoint: Rutherford V lesion D1-3
Recanalizationof ATA or PTA0r both?
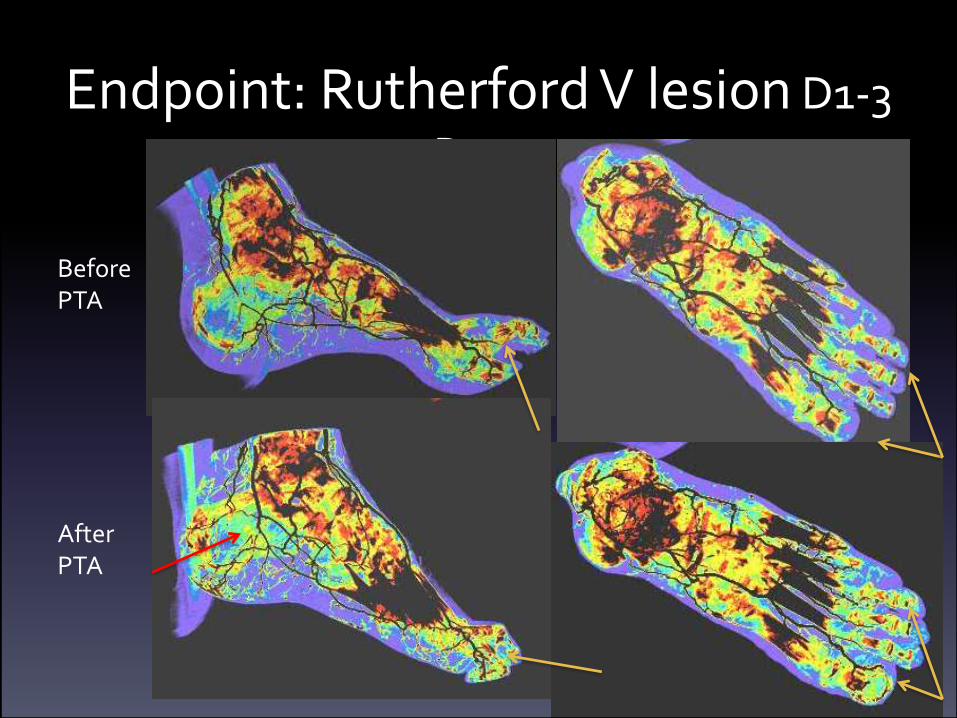
Endpoint: Rutherford V lesion D1-3
D1-3
BeforePTA
AfterPTA
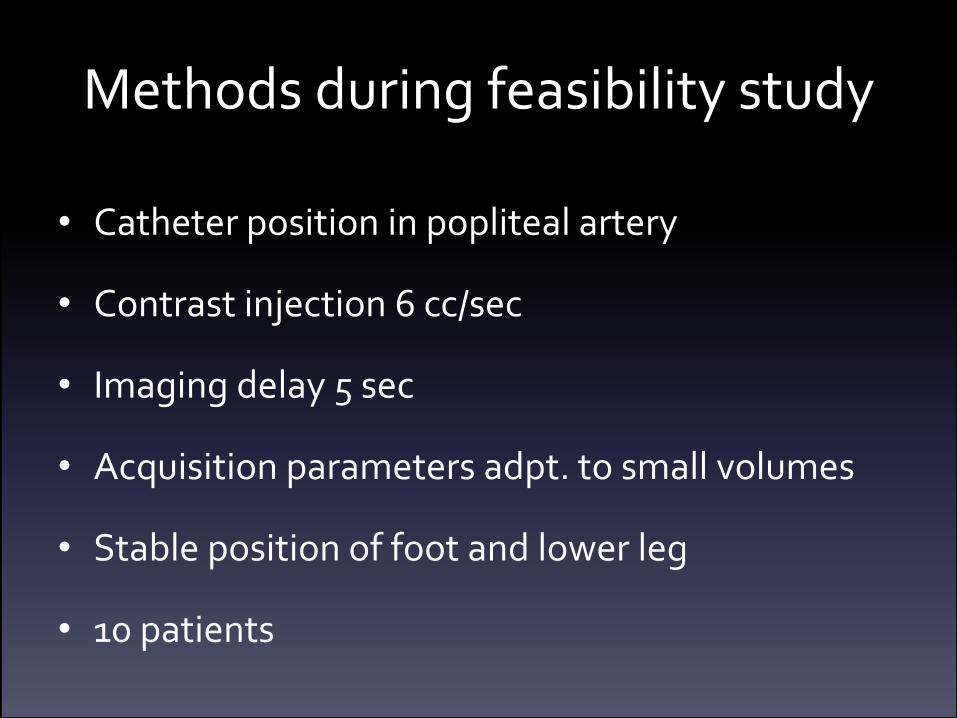
Methods during feasibility study
• Catheter position in popliteal artery
• Contrast injection 6 cc/sec
• Imaging delay 5 sec
• Acquisition parameters adpt. to small volumes
• Stable position of foot and lower leg
• 10 patients
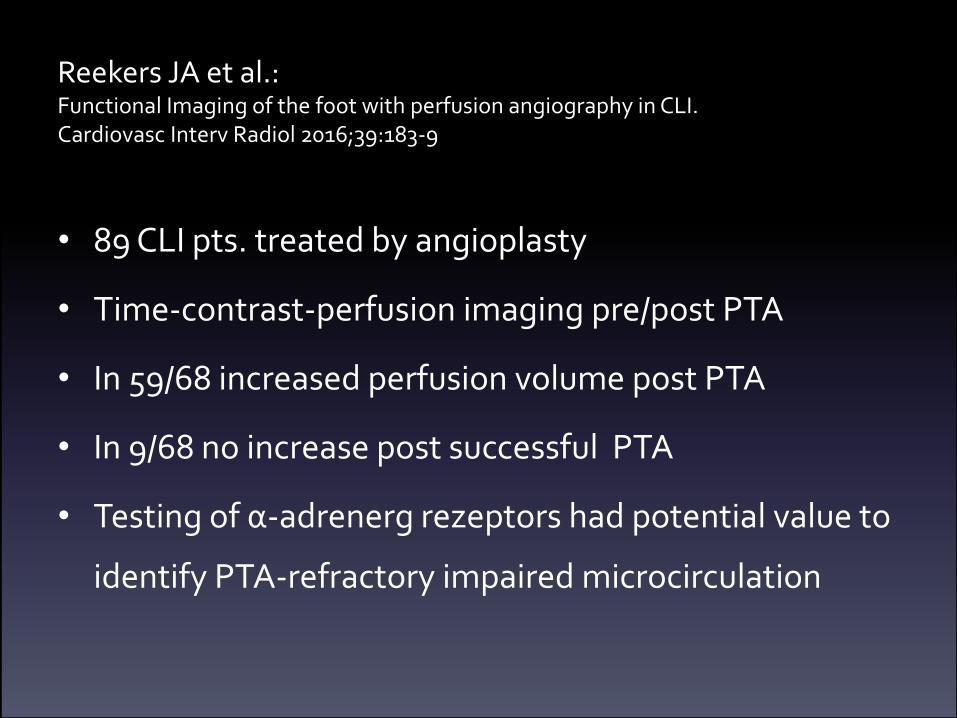
Reekers JA et al.:Functional Imaging of the foot with perfusion angiography in CLI.Cardiovasc Interv Radiol 2016;39:183-9
• 89 CLI pts. treated by angioplasty
• Time-contrast-perfusion imaging pre/post PTA
• In 59/68 increased perfusion volume post PTA
• In 9/68 no increase post successful PTA
• Testing of α-adrenerg rezeptors had potential value to
identify PTA-refractory impaired microcirculation
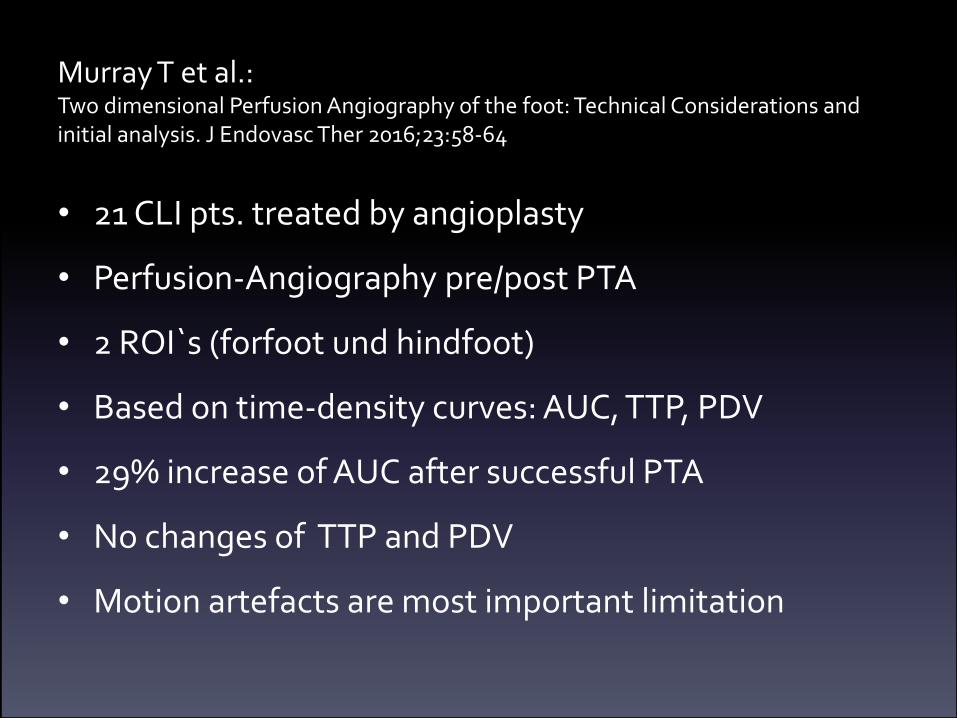
Murray T et al.:Two dimensional Perfusion Angiography of the foot: Technical Considerations andinitial analysis. J Endovasc Ther 2016;23:58-64
• 21 CLI pts. treated by angioplasty
• Perfusion-Angiography pre/post PTA
• 2 ROI`s (forfoot und hindfoot)
• Based on time-density curves: AUC, TTP, PDV
• 29% increase of AUC after successful PTA
• No changes of TTP and PDV
• Motion artefacts are most important limitation
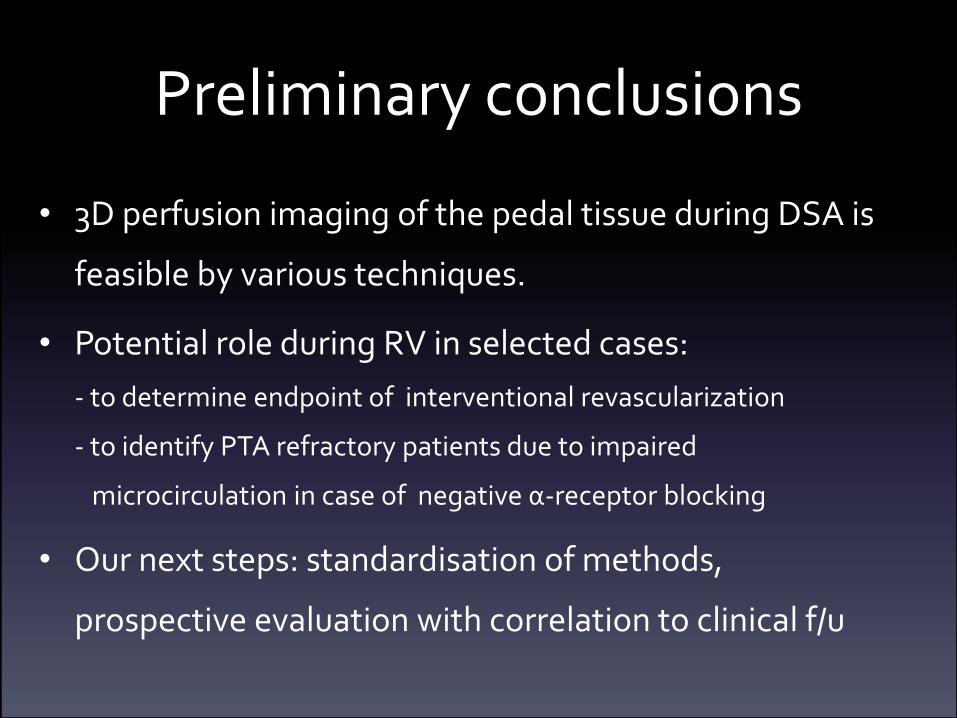
Preliminary conclusions
• 3D perfusion imaging of the pedal tissue during DSA is
feasible by various techniques.
• Potential role during RV in selected cases:
- to determine endpoint of interventional revascularization
- to identify PTA refractory patients due to impaired
microcirculation in case of negative α-receptor blocking
• Our next steps: standardisation of methods,
prospective evaluation with correlation to clinical f/u

Thank You for Attention !
Value of semiquantitative perfusion imagingin critical limb ischemia
for perfusion guided revascularisation
Peter Huppert
Dpt. of Radiology, Neuroradiology and Nuclear Medicine
Klinikum Darmstadt, Germany
Certified Vascular
Center


