
SELM2_wk3_Salmi
79
International Trends in Financing Reforms Jamil Salmi Tertiary Education Coordinator Marseille, 24 January 2011
-
Upload
cmi-marseille -
Category
Documents
-
view
212 -
download
0
description
http://cmimarseille.org/_src/SELM2_wk3/SELM2_wk3_Salmi.pdf
Transcript of SELM2_wk3_Salmi

International Trends
in Financing Reforms
Jamil Salmi
Tertiary Education Coordinator
Marseille, 24 January 2011

2
key financing questions
• sustainable expansion strategy
• resource mobilization
• impact of the crisis
• resource allocation
• resource utilization
• equity in distribution of public resources

3
comparing East Asian countries
19%
89%
29%29%
41%
0%
10%
20%
30%
40%
50%
60%
70%
80%
90%
100%
0 0.5 1 1.5 2 2.5 3
S. Korea
Thailand
Philippines
China
Malaysia
Public Spending as a % of GDP
Tert
iary
En
rollm
en
t R
ate

4
comparing Brazil and Chile
38%
24%
0%
5%
10%
15%
20%
25%
30%
35%
40%
0 0.1 0.2 0.3 0.4 0.5 0.6 0.7 0.8 0.9
En
roll
me
nt
ra
te
public spending as % of GDP
Chile
Brazil

5
expansion strategy
• not only money
• shape and configuration of the system
– degree of institutional differentiation

6
tertiary enrollment ratei = f [SGi, TFi, (∑Eij), PSi , SAi]
– high school graduation rate (SGi)
– funding for tertiary education (TFi)
– distribution of enrollment among various types
j of tertiary education institutions (Eij)
– proportion of private sector enrollment (PSi)
– student aid availability (SAi)

7
secondary school completion rate
33.7Brazil
59.0Chile
45.80LAC avg
0.0
10.0
20.0
30.0
40.0
50.0
60.0
0.0 10.0 20.0 30.0 40.0 50.0 60.0 70.0
en
rolm
en
t ra
te
secondary school completion rate (%)
secondary school completion rate vs. enrolment rate

1.0Brazil
1.7Chile
1.23LAC avg
0.0
10.0
20.0
30.0
40.0
50.0
60.0
0.0 0.5 1.0 1.5 2.0
en
rolm
en
t ra
te
public and private spending as percentage of GDP
public and private spending as % of GDP vs. enrolment rate

9
private enrolment
73.00Brazil
77.00Chile
33.00LAC avg
0.0
10.0
20.0
30.0
40.0
50.0
60.0
0.00 10.00 20.00 30.00 40.00 50.00 60.00 70.00 80.00 90.00
en
rolm
en
t ra
te
private enrolment share, tertiary (%)
private enrolment share vs. enrolment rate

10
student aid
1.7Brazil
22.8Chile
0.0
10.0
20.0
30.0
40.0
50.0
60.0
0.0 5.0 10.0 15.0 20.0 25.0
en
rolm
en
t ra
te
public spending on student aid (grants and loans)
public spend on student aid vs. enrolment rate

11
enrollment in non-university institutions
8.0Brazil
40.0Chile
27.00LAC avg
0.0
10.0
20.0
30.0
40.0
50.0
60.0
0.0 5.0 10.0 15.0 20.0 25.0 30.0 35.0 40.0 45.0
en
rolm
en
t ra
te
proportion of students studying at non-university institutions
proportion of students studying at non-university institutions vs. enrolment rate
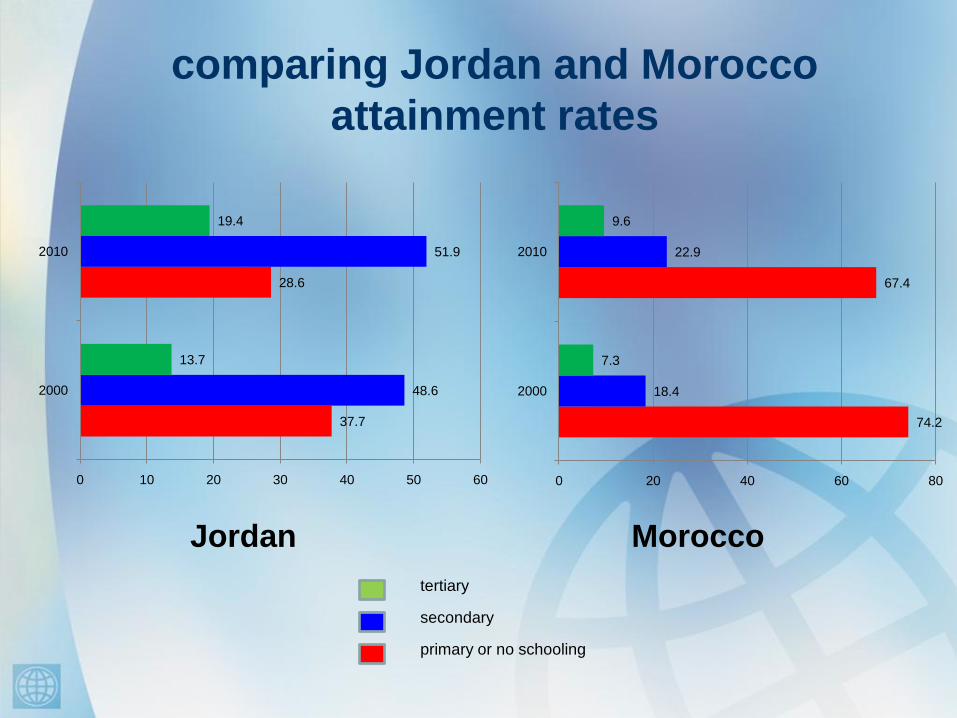
comparing Jordan and Morocco
attainment rates
tertiary
secondary
primary or no schooling
Jordan Morocco
37.7
28.6
48.6
51.9
13.7
19.4
0 10 20 30 40 50 60
2000
2010
74.2
67.4
18.4
22.9
7.3
9.6
0 20 40 60 80
2000
2010

13
secondary school completion rate
Jordan, 58.3
Morocco, 20.9
OECD AVG, 56.5
MENA AVG, 34.0
0.0
10.0
20.0
30.0
40.0
50.0
60.0
70.0
80.0
0.0 10.0 20.0 30.0 40.0 50.0 60.0 70.0
en
rolm
en
t ra
te
secondary school completion rate

total spending (public + private)
Jordan, 3.2
Morocco, 1.0
OECD AVG, 1.4
MENA AVG, 1.5
0.0
10.0
20.0
30.0
40.0
50.0
60.0
70.0
80.0
0.0 0.5 1.0 1.5 2.0 2.5 3.0 3.5
en
rolm
en
t ra
te
public and private spending, tertiary as % of GDP

15
public spending on student aid
Morocco, 8.0
OECD AVG, 23.0
Jordan, 8.5
0.0
10.0
20.0
30.0
40.0
50.0
60.0
70.0
80.0
0.0 5.0 10.0 15.0 20.0 25.0
en
rolm
en
t ra
te
proportion of public spending on student aid (loans and grants)

16
private enrolment share (%)
Jordan, 31.0
Morocco, 11.0
OECD AVG, 27.4
0.0
10.0
20.0
30.0
40.0
50.0
60.0
70.0
80.0
0.0 5.0 10.0 15.0 20.0 25.0 30.0 35.0
en
rolm
en
t ra
te
private enrolment share (%)

17
students at non-university institutions
Jordan, 11.1
Morocco, 21.2
OECD AVG, 15.9
MENA AVG, 16.4
0.0
10.0
20.0
30.0
40.0
50.0
60.0
70.0
80.0
0.0 5.0 10.0 15.0 20.0 25.0
en
rolm
en
t ra
te
proportion of students studying at non-university institutions

18
key financing questions
• sustainable expansion strategy
• impact of the crisis


20

key features of this crisis
• deepest post-war recession
• most synchronized recession on record
• manufacturing has been particularly hard hit
• unemployment has risen
21
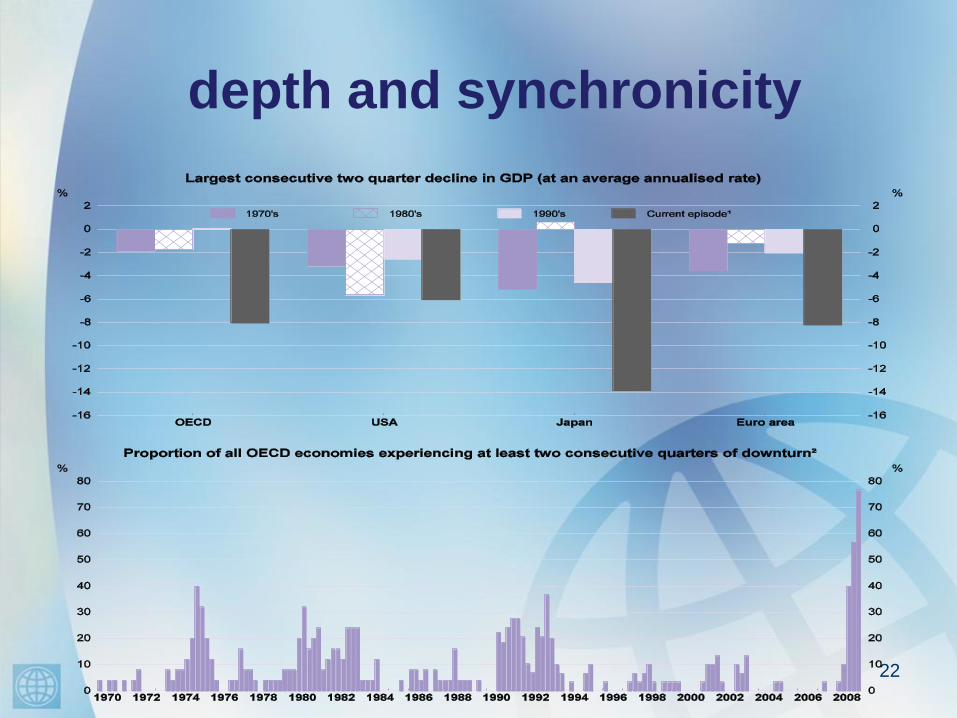
depth and synchronicity
22

23
resources flows
• reduced government funding for teaching,
research and student aid
• reduced resources for institutions as
demand falls (new domestic and foreign
students, dropouts)

24
resource flows (II)
• fewer resources from private sector
(donations, contracts)
• fall in stock market values reduces value
of endowments and pension funds

25
differential effects
• scope of crisis
– country and type of institution
• business model and financing strategy
– how endowment funds are invested
– how endowment resources are used
– balance among various sources of income

26
response of
tertiary education institutions
• budget cutting measures
• revenue generation

27
budget cutting measures
• employment-related
• programs and academic organization
• students (number, teacher/student ratio)
• efficiency measures

28
revenue generation strategies
• demand-linked measures
• financial measures

29
scenarios for the tertiary education
sector
• graduate unemployment
• shifting demand (from long to shorter
duration programs, private to public,
foreign to domestic)
• increased inequality
• deteriorating quality (with fewer resources)

30
opportunities
• efficiency gains and no-frill options
• innovations and startups
• attracting foreign students
• fund-raising
– philanthropy
– reaching out
• strategic renewal

31
implementing structural reforms
• strategic focus
– areas of priority
– new academic model
– new business model

32
strengthening financial planning
and management
• information and monitoring
• fund-raising strategy and team
• investment strategy
• contingency planning


35
the way forward
• differential effects depending on
– country context
– strategic positioning
• short term reactions vs. long term
realignment

36
key financing questions
• sustainable expansion strategy
• impact of the crisis
• resource allocation

37
allocation mechanisms
from untied funding
to
performance-based funding

38

39

40
Negotiated
Allocations
Competitive
Mechanisms
Performance-
Based Criteria
No
Performance
Criteria
Funding Formulas (output-based) (I)
Performance Contracts (I)
Performance Set Asides (I)
Need-based Grants and
Scholarships* (S)
Student Loans* (S)
Universal Tuition Fees (I)
Donations (I)
Bank Loans (I)
Merit-based Grants and
Scholarships (S)
Merit-based Student Loans (S)
Merit-based Vouchers (S)
Dual-Track Tuition Fees (I)
Competitive Funds (I)
Sale of Products and Services (I)
Entitlements (I)
Earmarked Funds (I)
Funding Formulas (input-based) (I)
Vouchers (S)
Tax Benefits (F & I)
Savings Accounts (F)
Resource Allocation and Capitation Matrix: Dimensions of Performance and Competitiveness
I=Institutions; S=Students; F=Families
Q1 Q2
Q3 Q4

41
innovative allocation
mechanisms
• funding formula - output measures are used to determine all or a portion of funding formula
• performance contracts - governments enter into agreements with institutions which set mutual performance-based objectives

42
innovative allocation
mechanisms (II)
• competitive funds - support peer-reviewed proposals designed to achieve institutional improvement or national policy objectives
• demand-side vouchers - finance the recurrent expenses of institutions indirectly through vouchers provided to students who enroll in the university of their choice

43
formula funding
• formula linking amount of financing and
some measures of outputs
- number of graduates
- research productivity (publications,
patents, licenses, spin-offs)
• unit costs per level of studies / discipline
(actual, average, normative costs)

44
The Netherlands
• problem: weak internal efficiency (7.5
years to graduate vs. 4 in theory
• formula based on graduation rates- 4,5 x cost of 1 student-year for graduate
- 1,5 x cost of 1 student-year for dropouts
• risk: too lenient on grading - mitigation: rigorous inspection system

45
performance contracts
• institutional agreement to achieve
certain objectives
• additional funding based on meeting
agreed objectives
• examples: Chile, France, Denmark,
Austria, Finland, US (Colorado &
Virginia)

46
competitive funds
• earmarked for specific objectives
• competition on the basis of projects
• transparent rules & criteria
• peer review and selection
• independent monitoring committee

47
allocation mechanisms
from
direct funding
to
indirect funding

48
indirect funding
• grants and scholarships
• student loans
• vouchers

49
grants
• needs-based or merit-based (or both)
• well-targeted
• eligibility of all accredited institutions

50

51
student aid options
from
mortgage loans for students
to
income-contingent loans for graduates

52
vouchers: the economists’
ultimate solution
– demand side
• power to the consumer
• transparency
– value of the voucher
– eligibility criteria
– supply side
• choice drives competition
– contains costs
– drives up quality
– ultimate form of accountability: the markets rules

53
recent experiences
• Colorado (US), Chile, Kazakhstan, Lithuania, Azerbaijan

54
Kazakhstan experience
• 20% best qualified secondary school graduates
• choose university
– $1,200 for public university
– up to $4,000 for private university
• must maintain top academic grades

55
Kazakhstan experience (II)
• increased competition generally
• some private institutions have been able
to attract a growing number of voucher
beneficiaries
• but insufficient resources to finance all
students

56
new voucher system in
Azerbaijan (2010)
• 45% of students receive voucher
• both public and private institutions
– share of top students choosing private institution from 1.9% in 2009 to 9% in 2010
• limitations
– rigid quota system by discipline
– insufficient amount of voucher

57
Brazil ProUni
• State purchases seats in private universities
• offered to top students from low-income families who don’t get a seat in a public university
• no actual payment to the university, but tax exemption

58
Colombia (Antioquia)
“access with equity”
• partnership among local government, private firms and private universities
• low-income students who don’t get a seat in a public university get financial aid to enter a private university
• 75% scholarship and 25% subsidized loan

59
other performance-based
schemes
• salary of VC/rector/president (rankings)
• salary of researchers (Mexico, Australia,
Norway)
• students (scholarships, tuition, loans,
vouchers, reward)

60
key financing questions
• sustainable expansion strategy
• impact of the crisis
• resource allocation
• equity in distribution of public resources

61
free is fair
• is it indeed?
• Canada: average undergraduate tuition
fees:
– in Quebec: $1,862
– in Ontario: $4,923

University Participation at Age 19
(2003)
62

63
free is fair
• Brazil: University of São Paulo
– no tuition fees
– 84% candidates from public high schools
– 30% of new students
– in medicine, only 3 out of 180 new entrants

64

65

66
tertiary coverage in Chile
16.3
38
0
10
20
30
40
50
60
70
80
1990 2006

67
enrollment rate by income quintiles
4
8
11.5
21
40
16.3
19.5
25.5
32.5
47
67.5
38
0
10
20
30
40
50
60
70
80
I II III IV V Total
1990 2006

68
benefits incidence analysis
• share of public resources received by each quintile
– if ≤ 20%, regressive instrument
– if ≥ 20%, progressive instrument

69
benefits incidence analysis:
the case of Chile
Q1 Q2 Q3 Q4 Q5
Share of
Public
Subsidies15.3% 17.2% 19.0% 22.8% 25.7%
Share of
Enrollment 8.2% 12.9% 18.5% 26.7% 33.8%

70
Benefits Incidence Analysis of Public Investment in Higher
Education
0.0%
10.0%
20.0%
30.0%
40.0%
50.0%
60.0%
Q1 Q2 Q3 Q4 Q5
Income-level
% o
f b
en
efi
cia
res
Institutional Funding
(AFD)
"Voucher scheme for the
best" (AFI)
Scholarships
Subsidized student loan
scheme (FSCU)
Guaranteed student loan
scheme (INGRESA)
Competitive Fund
(MECESUP/FDI)
Research funding
(CONICYT)

71

72Mourad Ezzine

73
principal challenge
quantitative
expansion
quality &
relevance
financial sustainability

74
protection from crisis
• national level: multiple sources of funding
• institutional level: contingency planning

75
which allocation mechanism
is more effective?

76
Alice in Wonderland
Lewis Carroll
Alice
Would you please tell me which way I
ought to go from here?
Cheshire Cat
That depends on where you want to get to.

77
policy objectives pursued
• improving access and equity
• improving quality and external efficiency
• improving internal efficiency and
sustainability

78
principles of an appropriate
allocation instrument
• linked to performance / policy objectives
• transparent (objective criteria, openness)
• significant amounts
• stability in time
• compatibility
79
political economy
dimensions
• financing reforms can be controversial
• dealing with the politics (winners and
losers)
• not an excuse to avoid reforms


